Cavitation Growth Phenomena in Pure-Sliding Grease EHD Contacts


Abstract
1. Introduction
2. Experimental
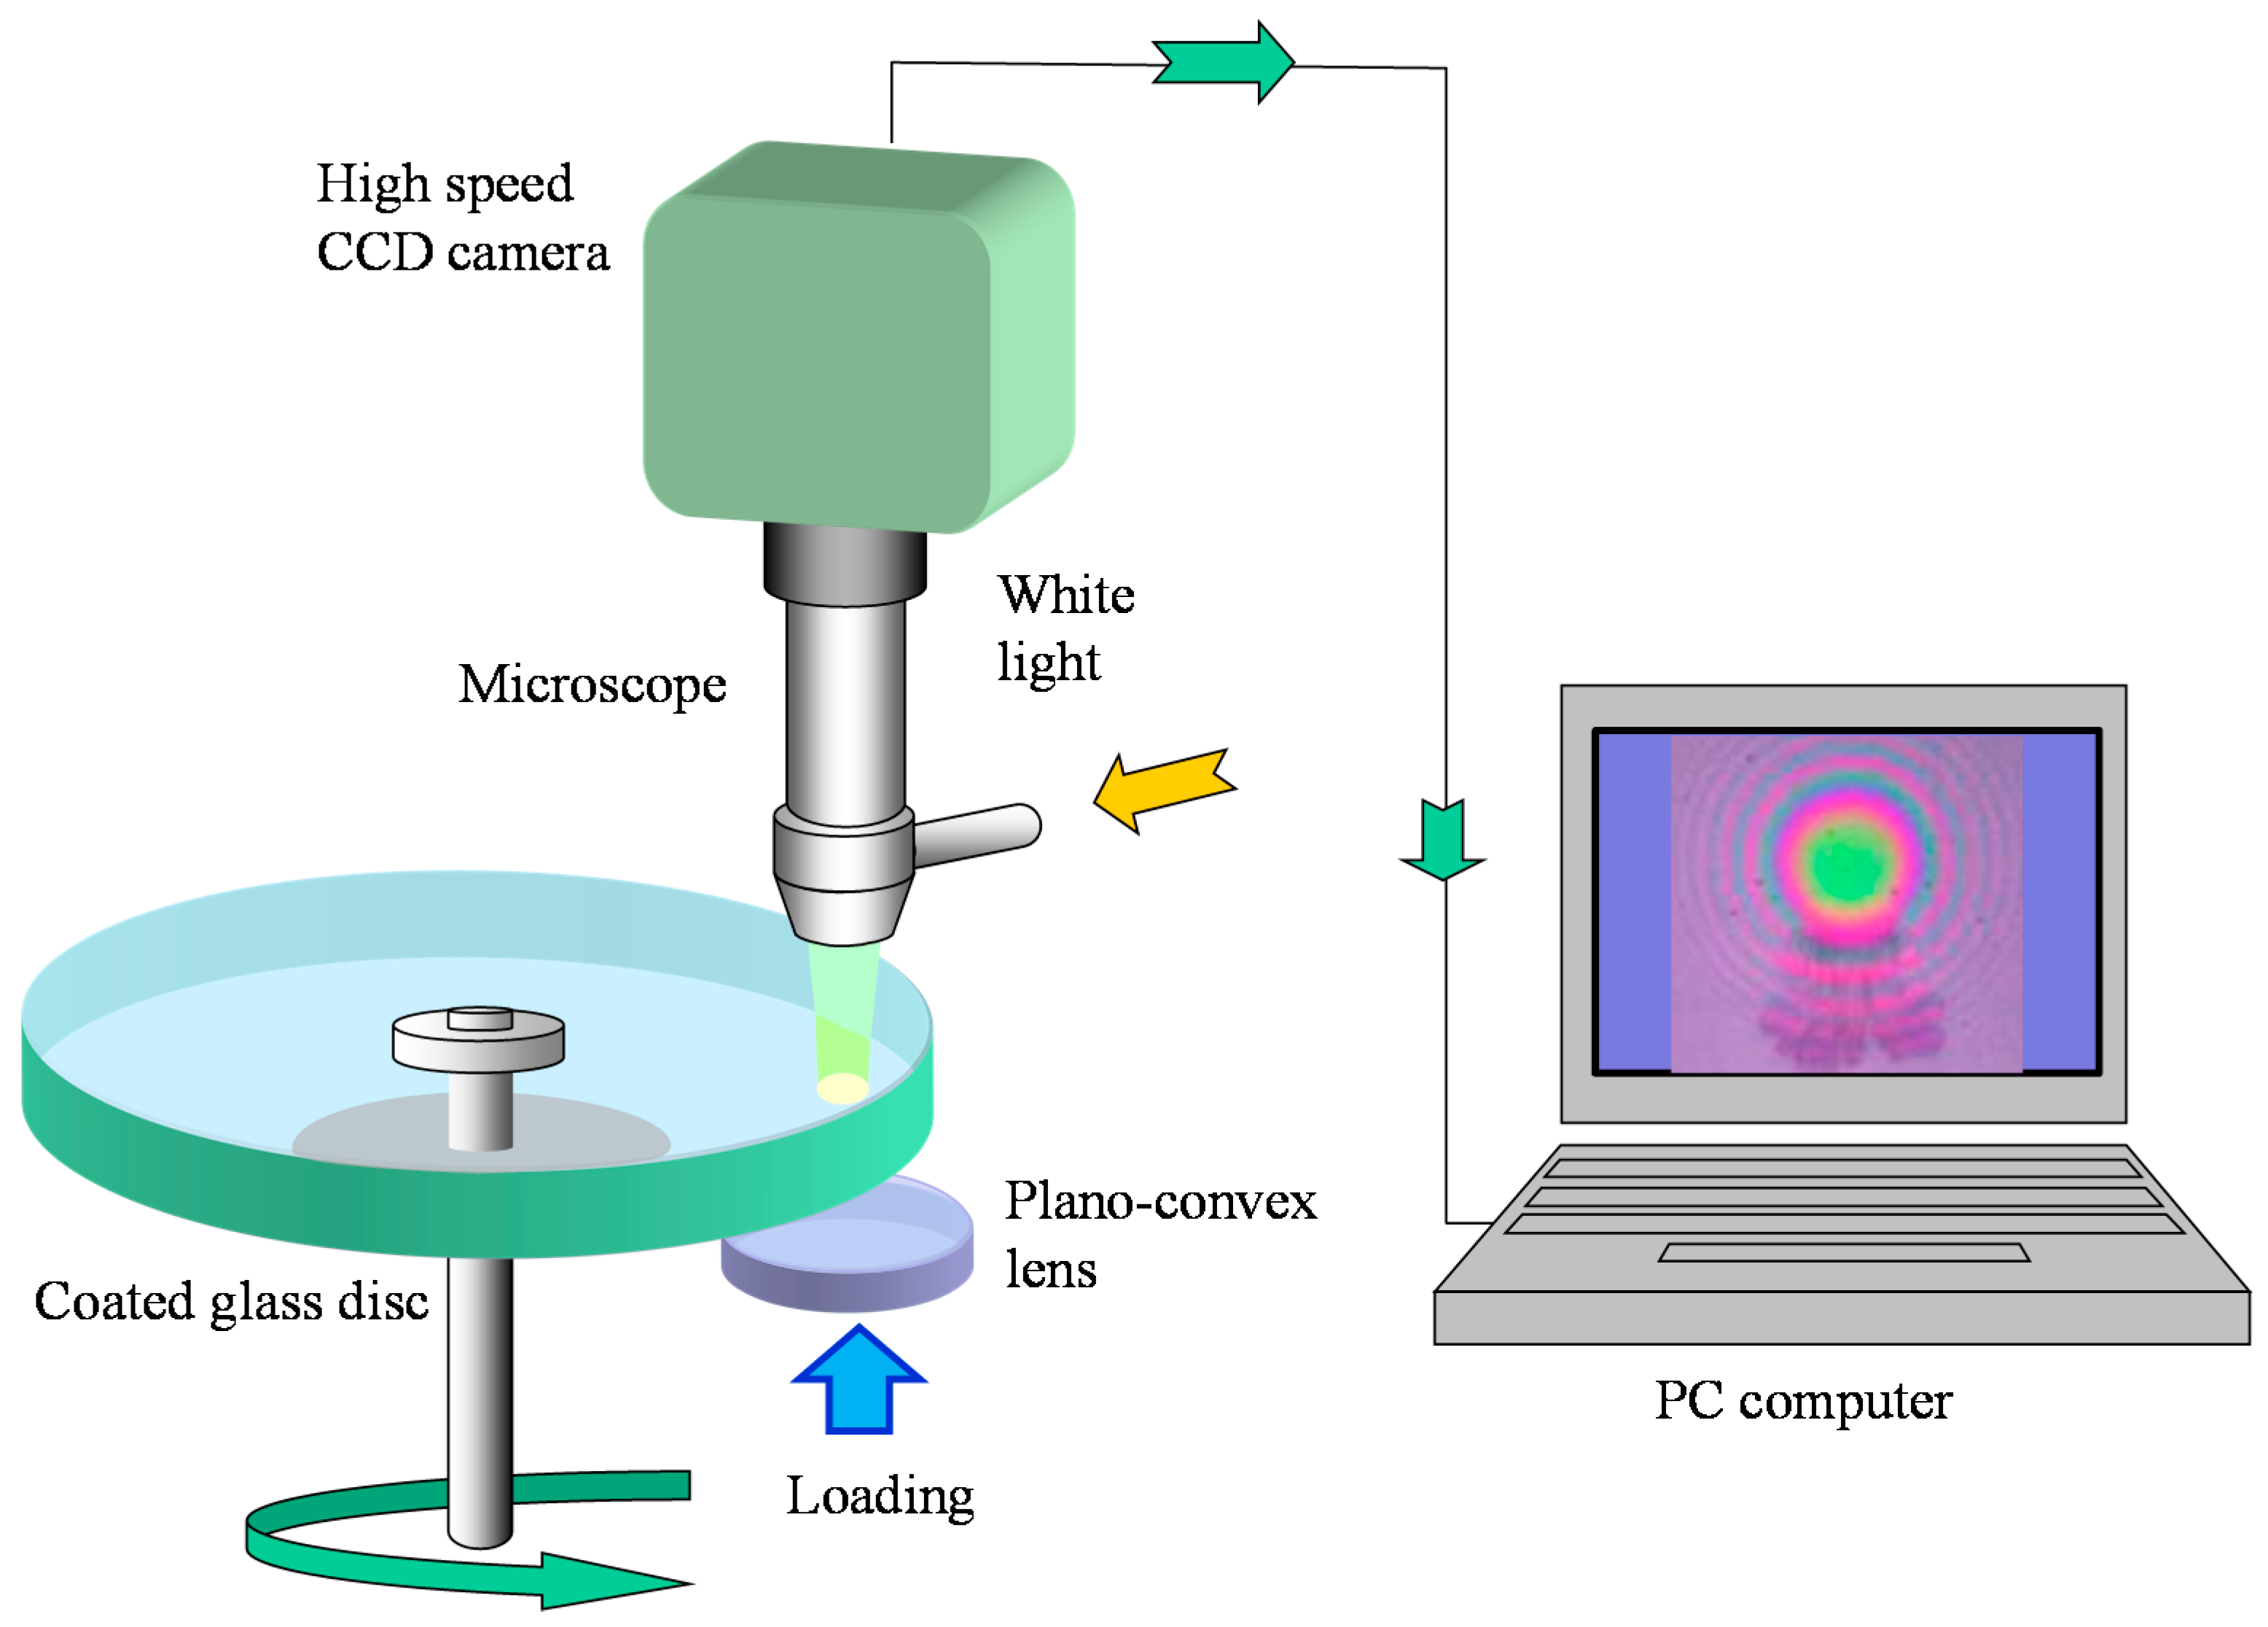
2.1. Test Apparatus
2.2. Greases
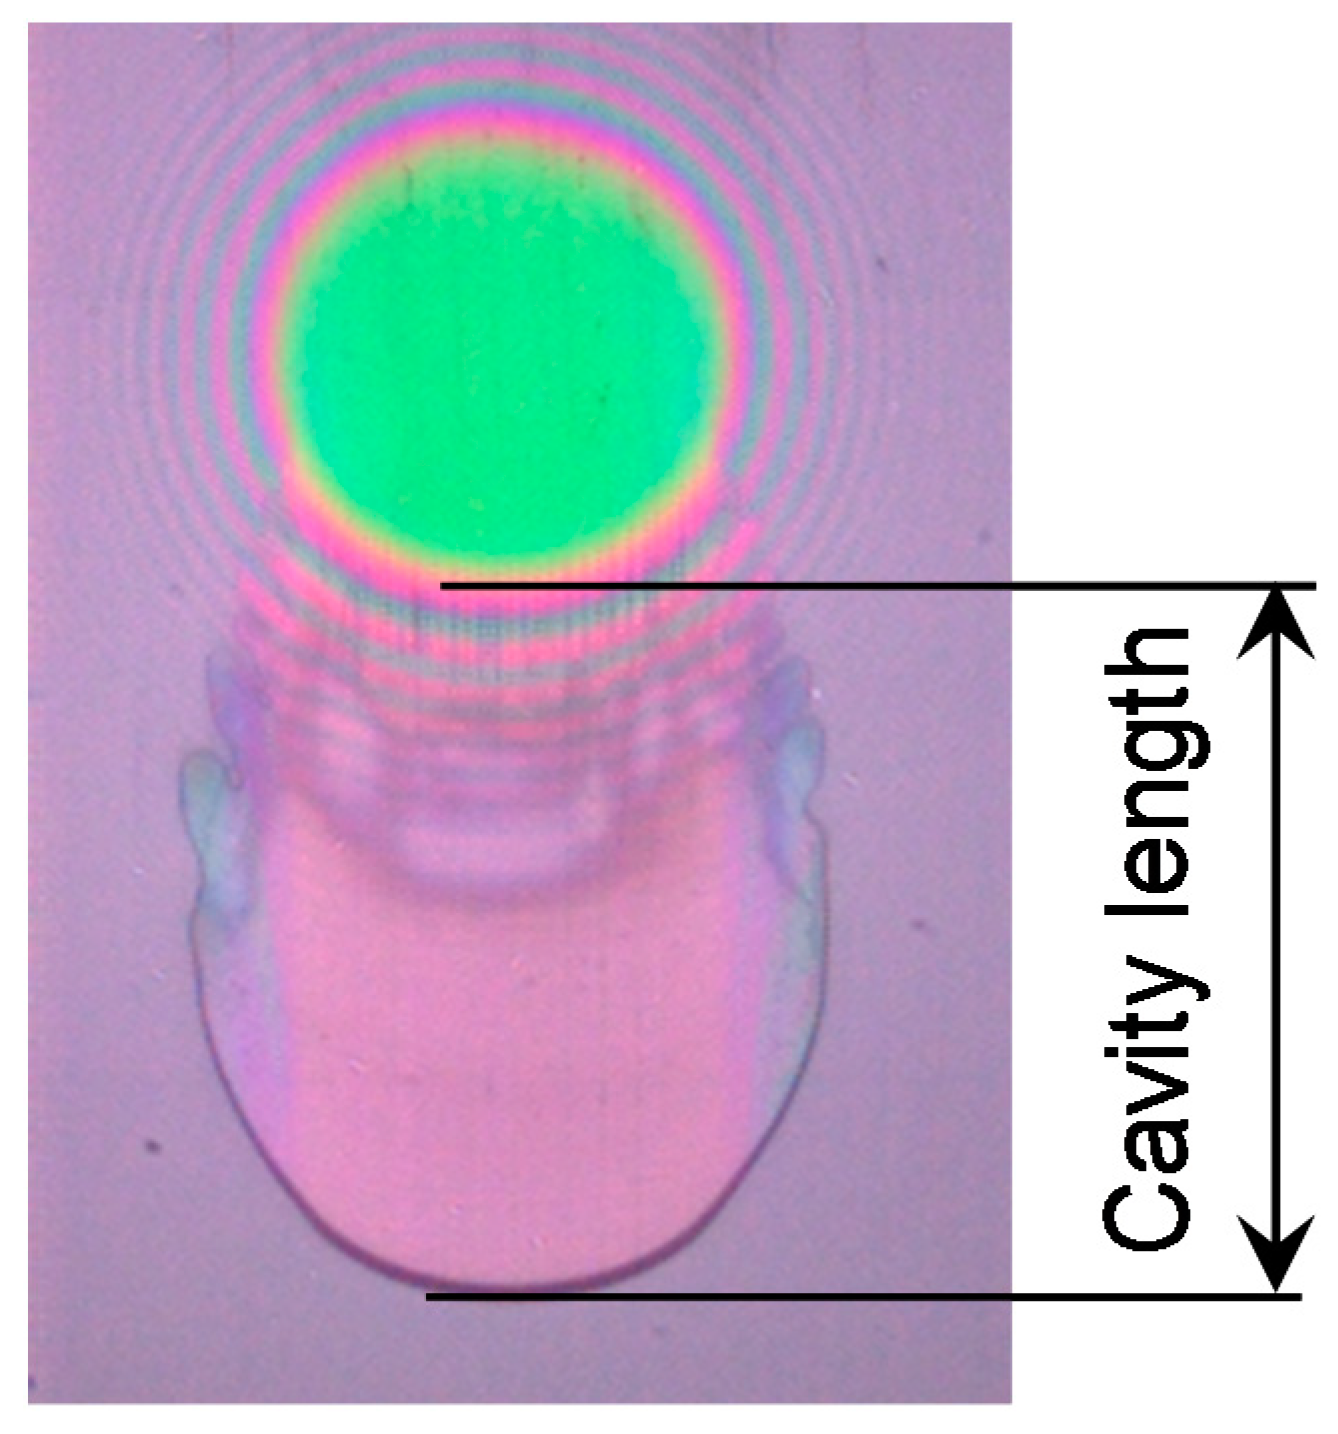
2.3. Definition of Cavity Length
3. Results and Discussion
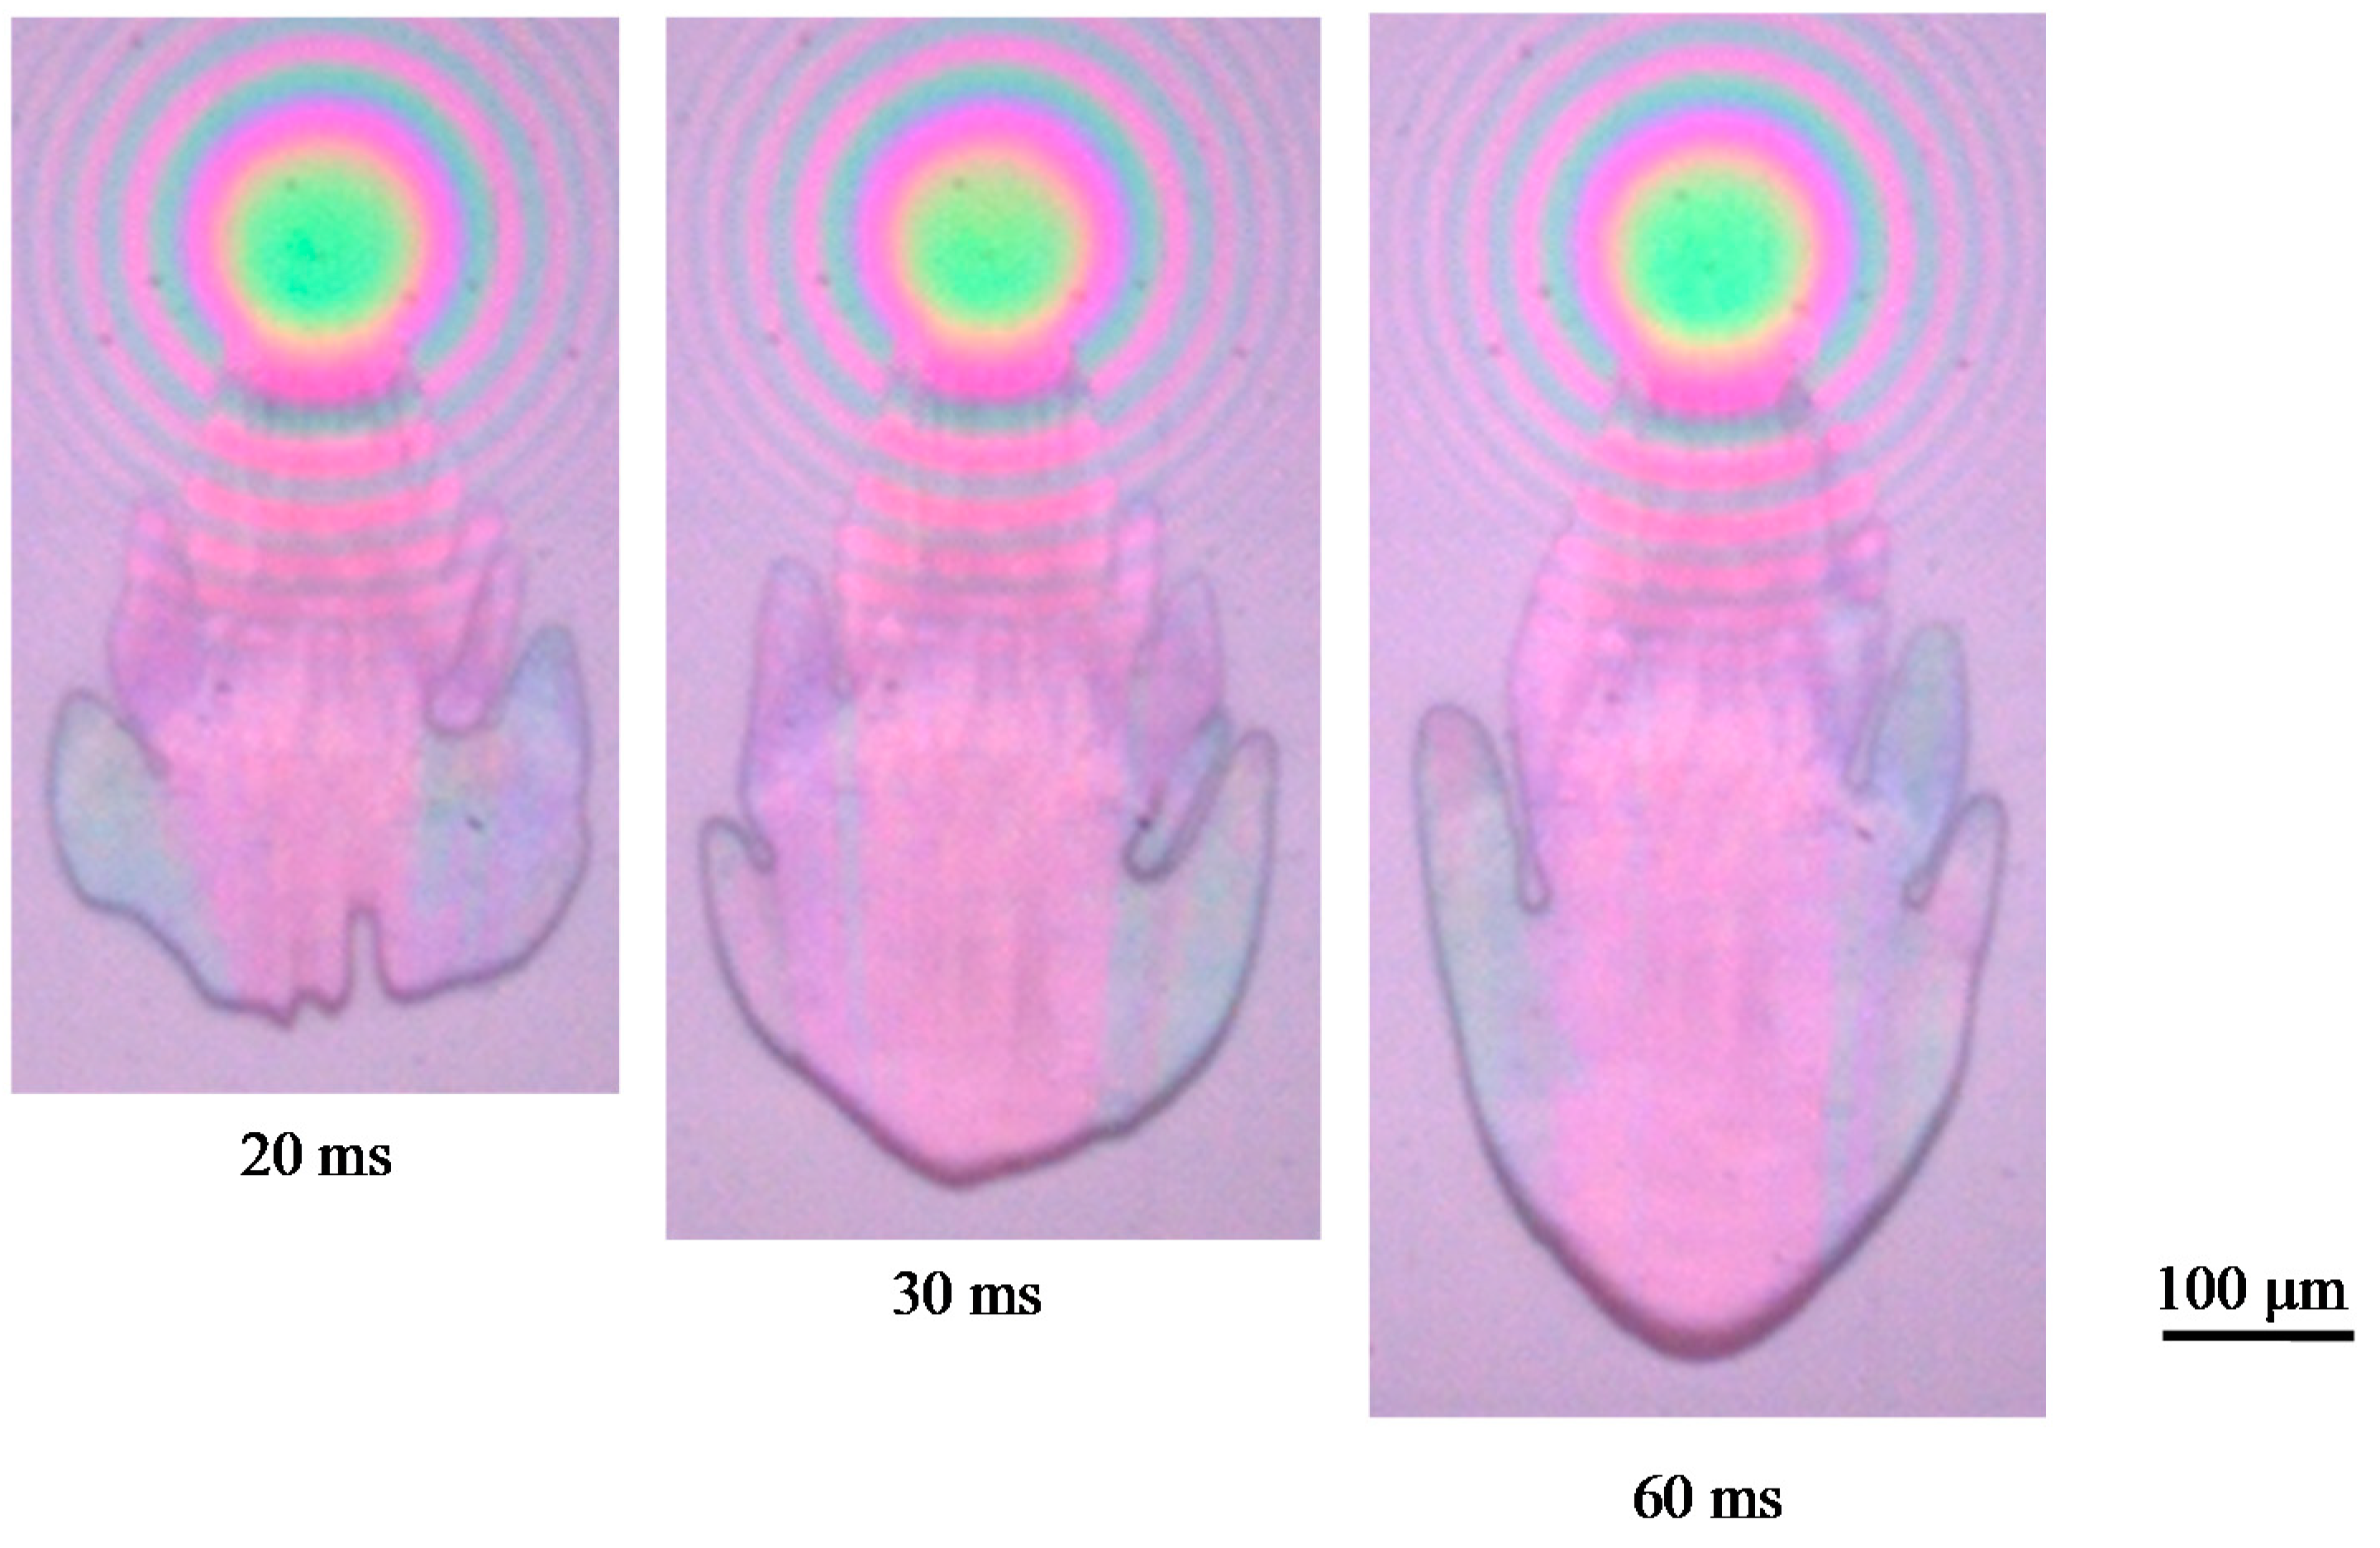
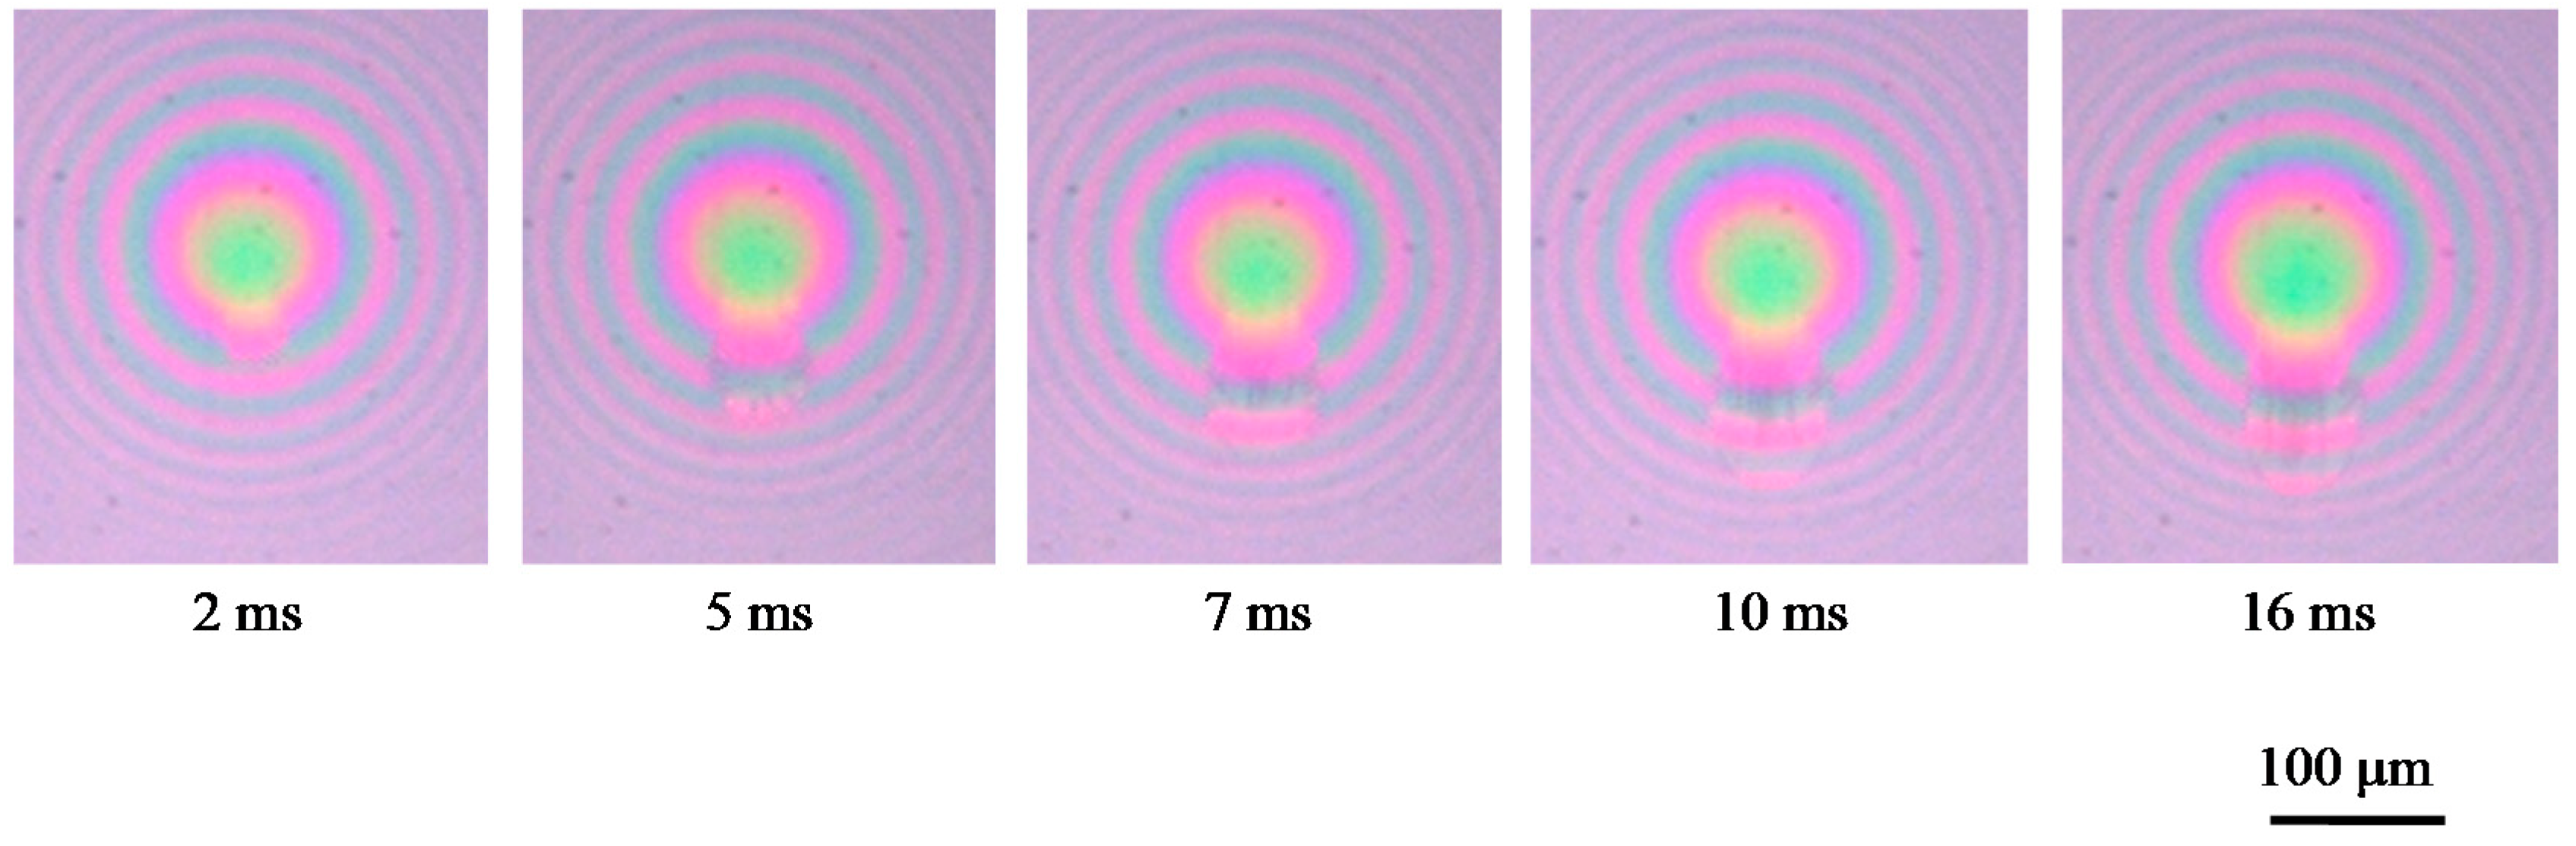
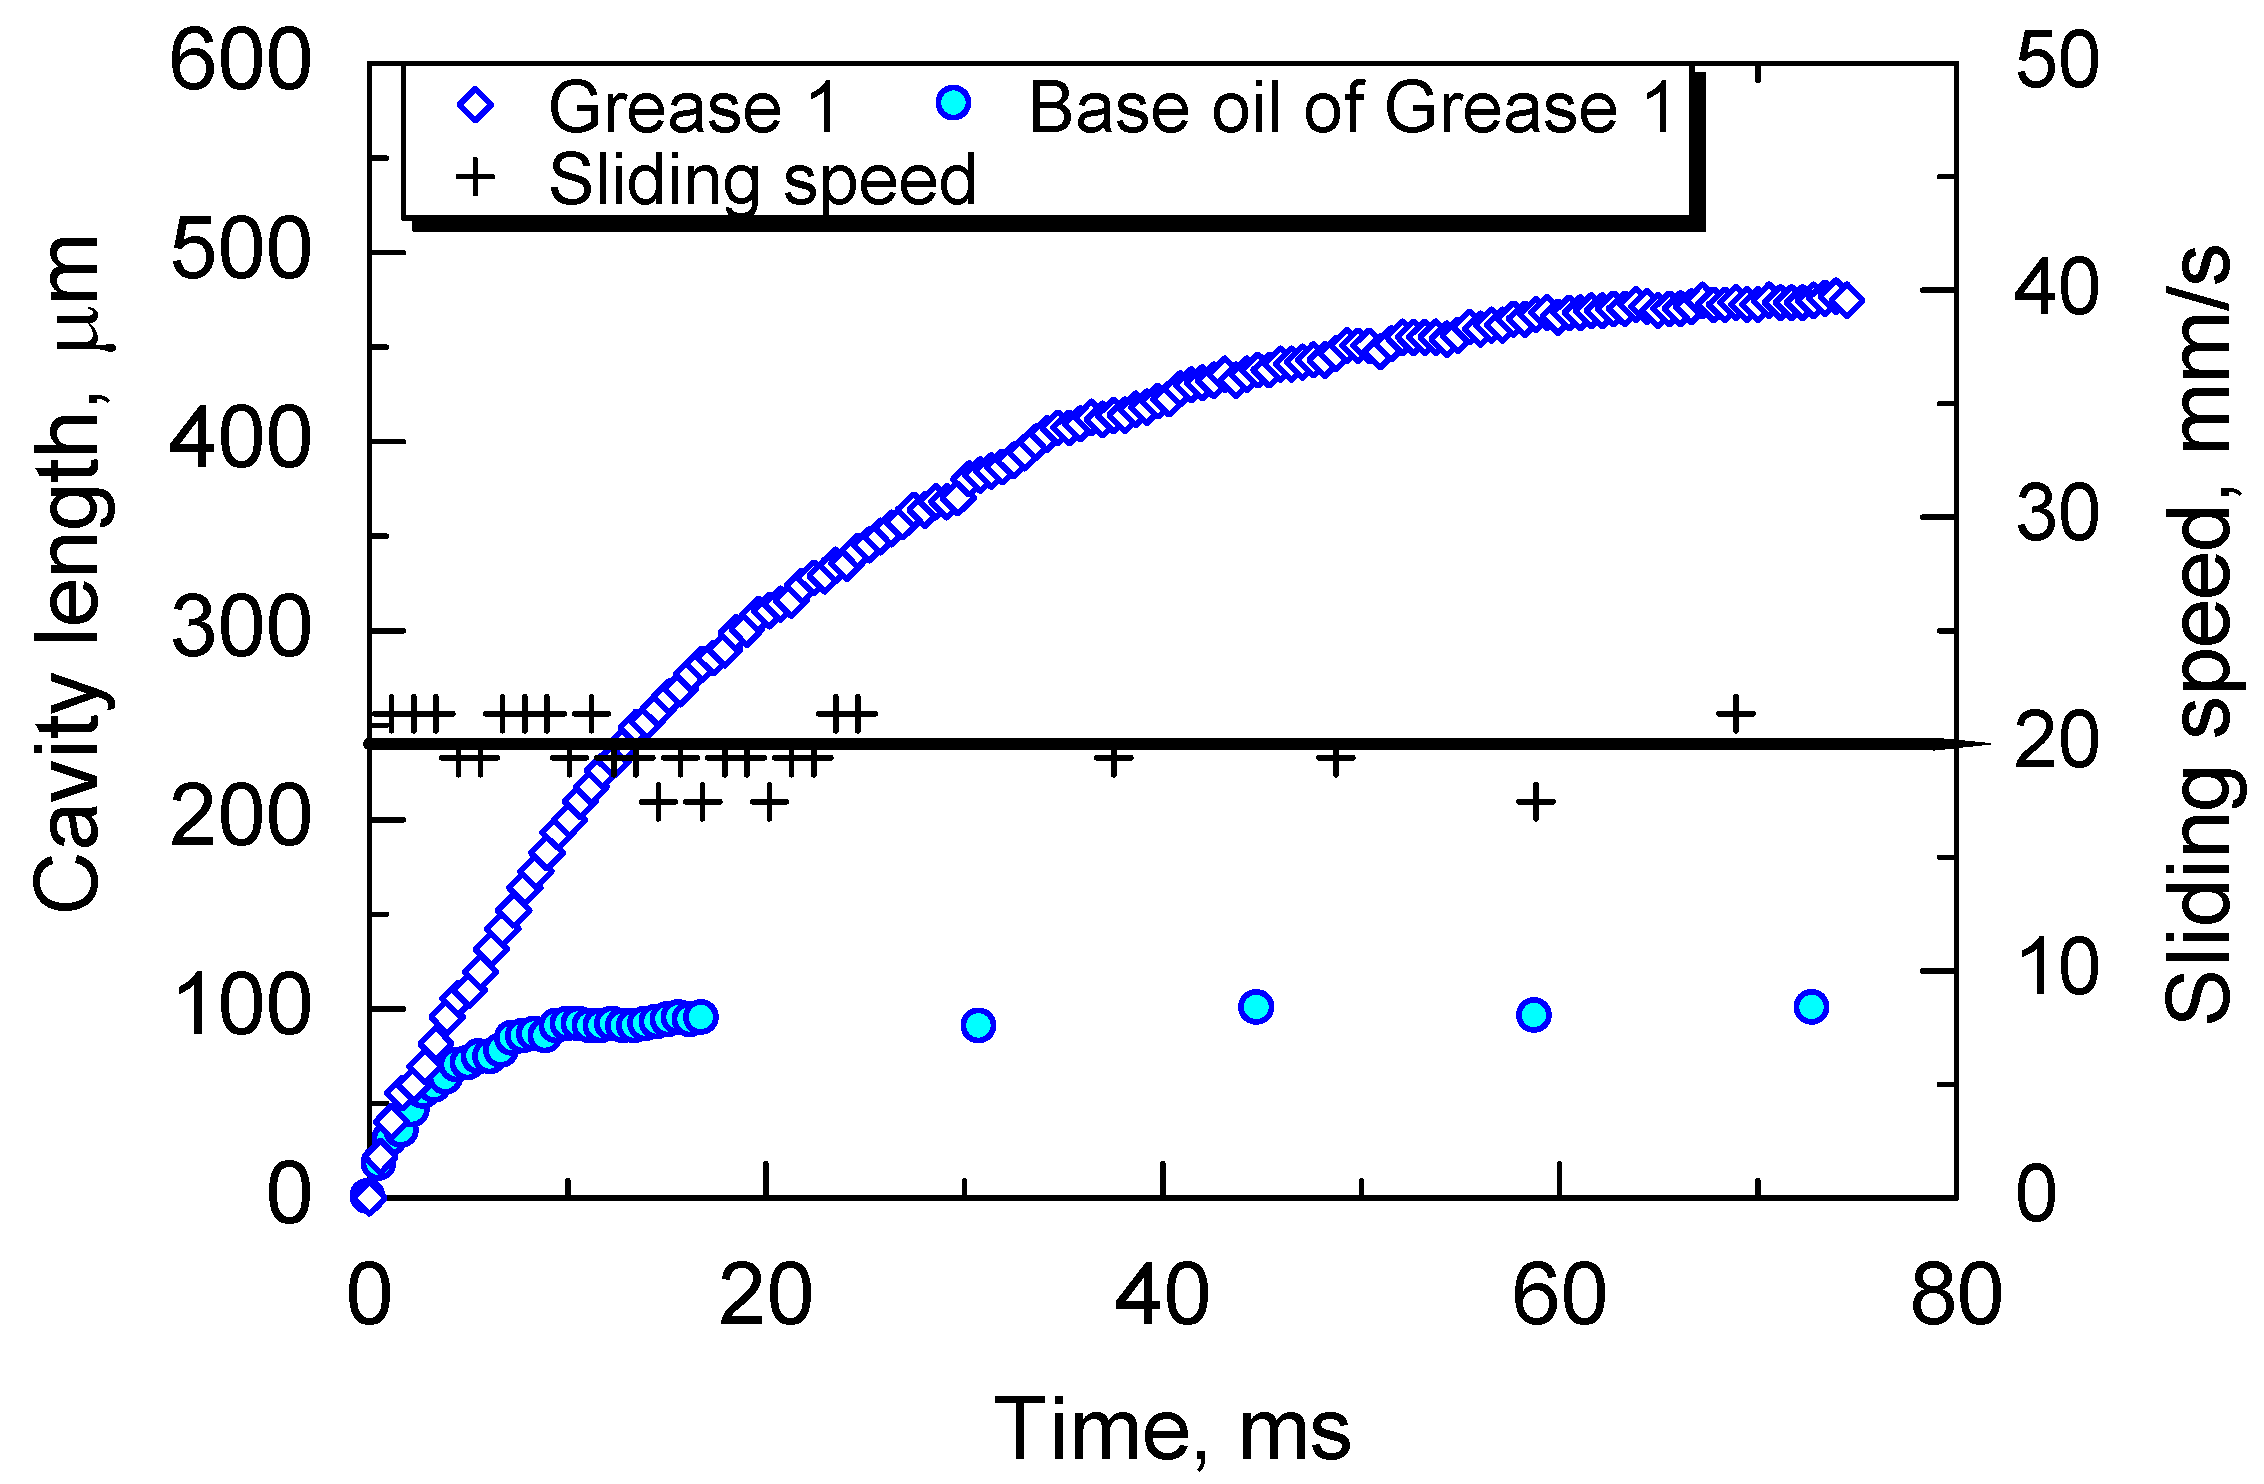
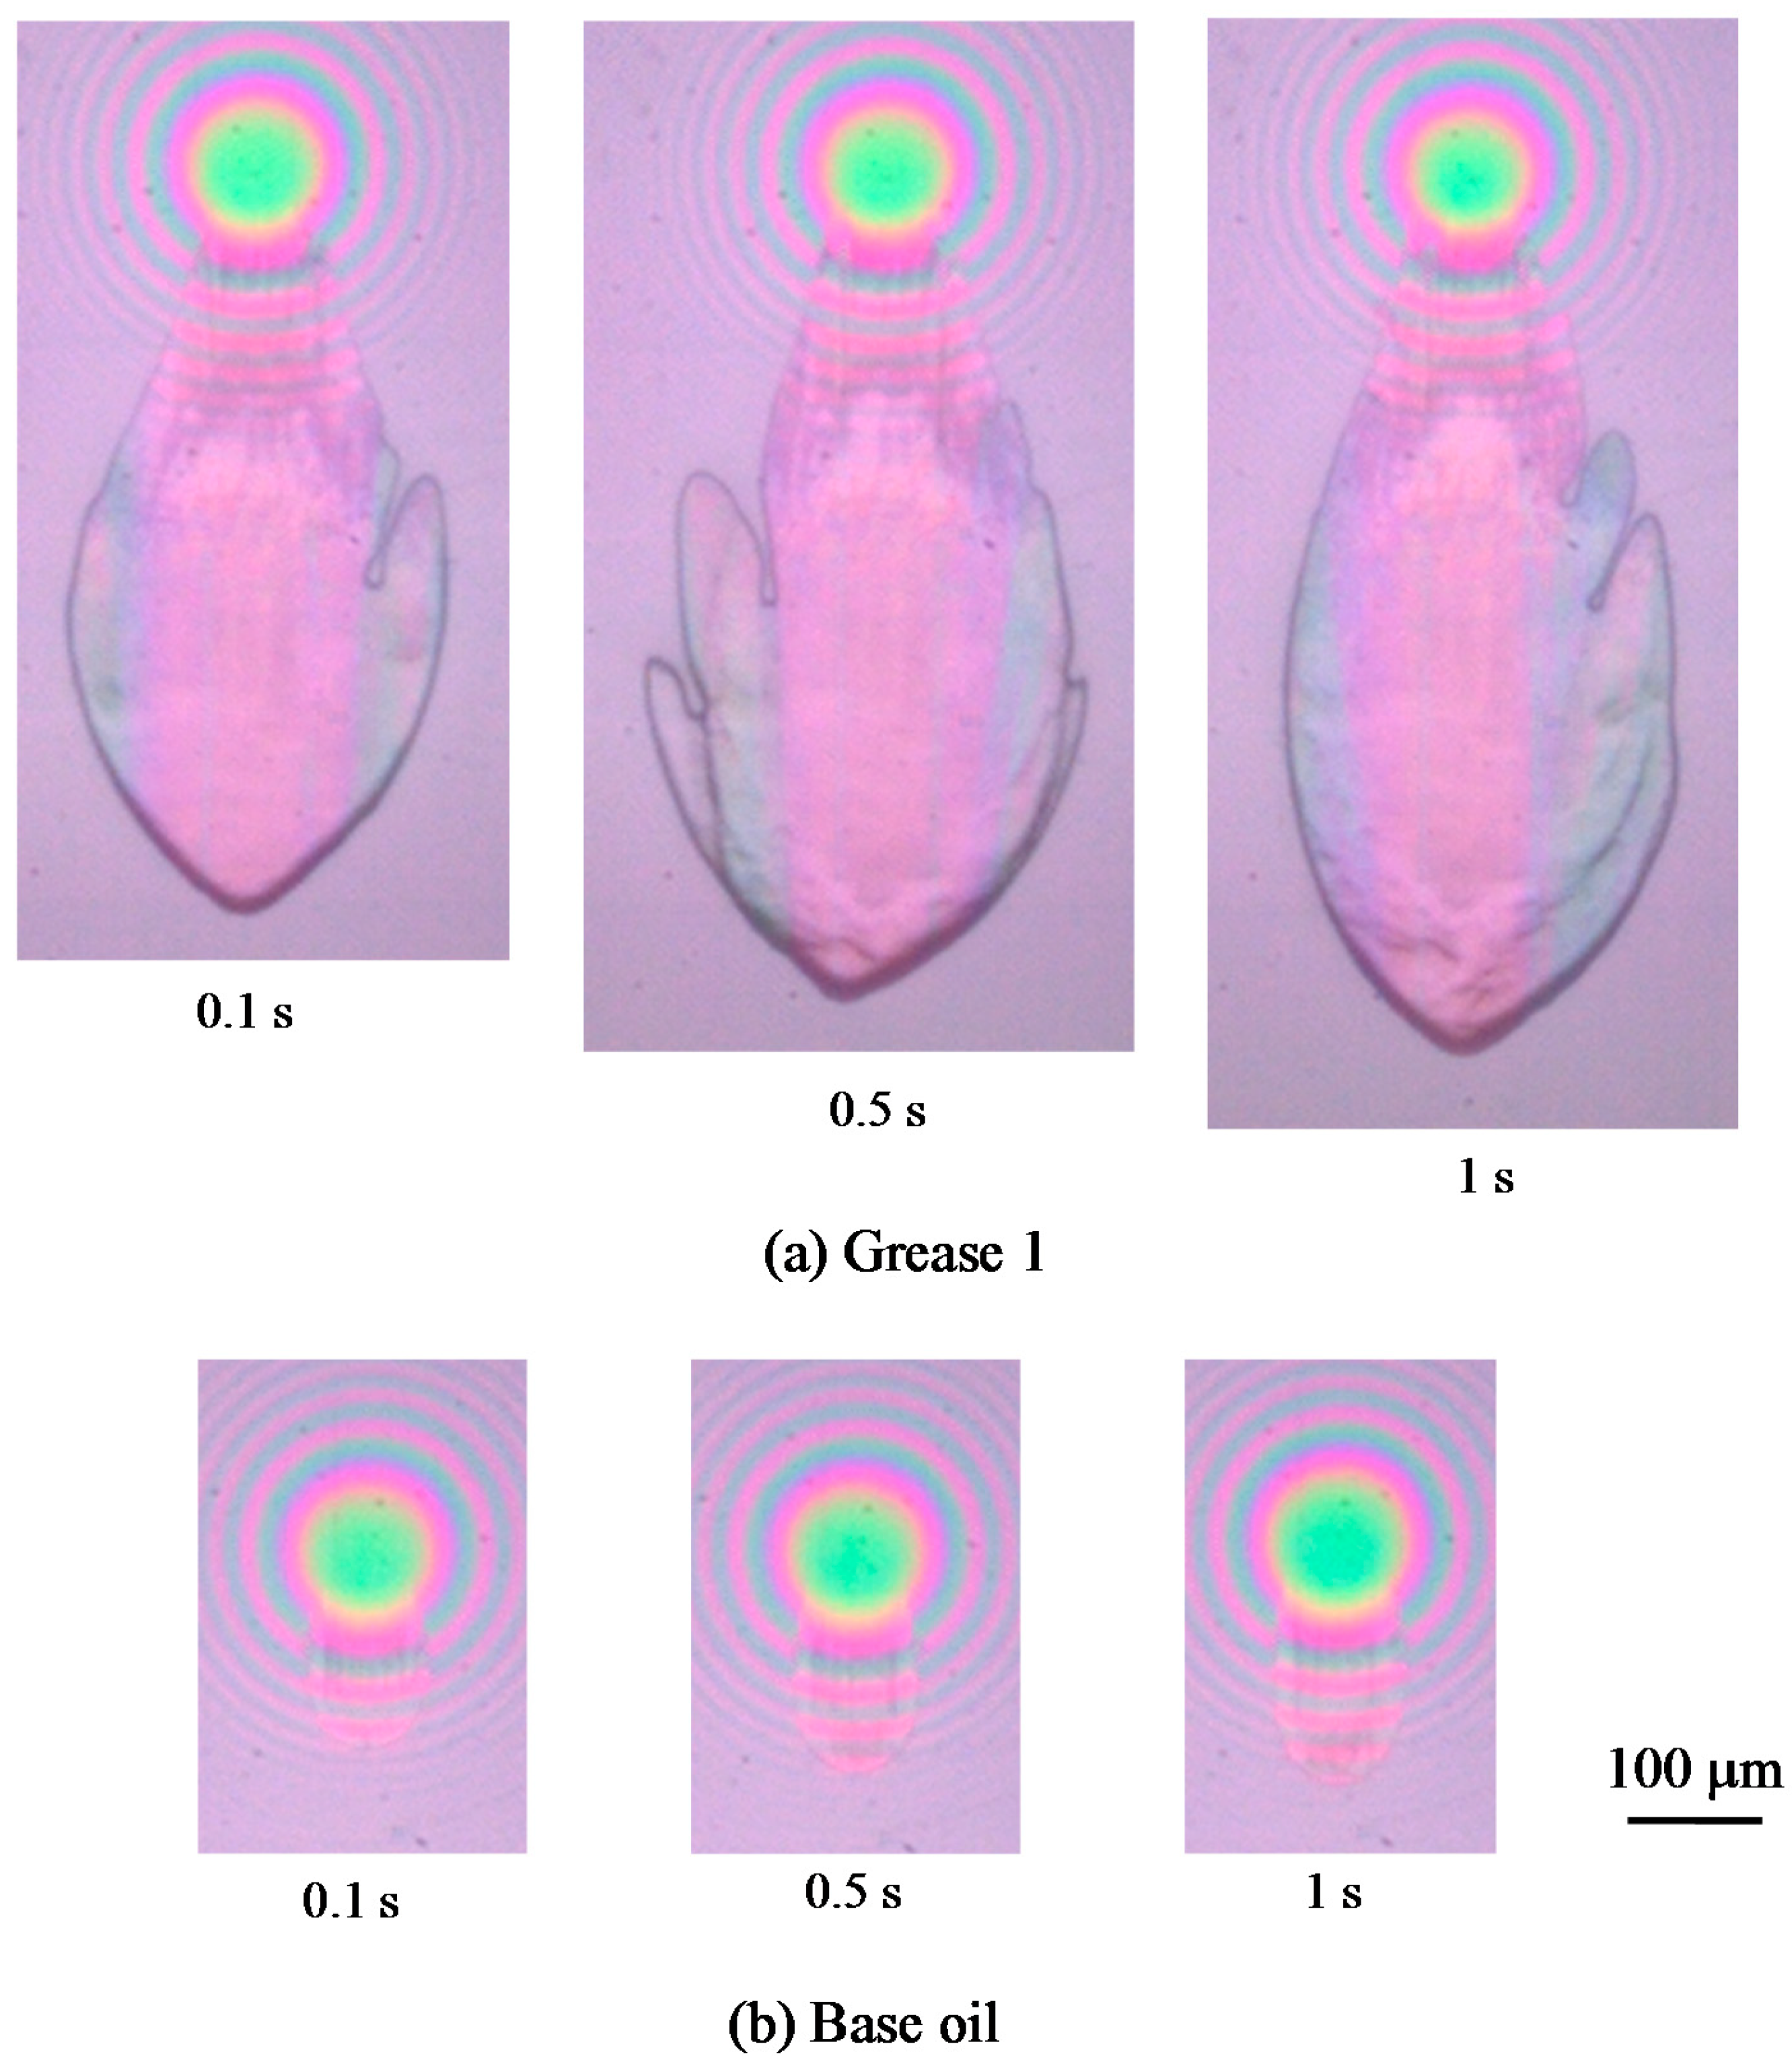
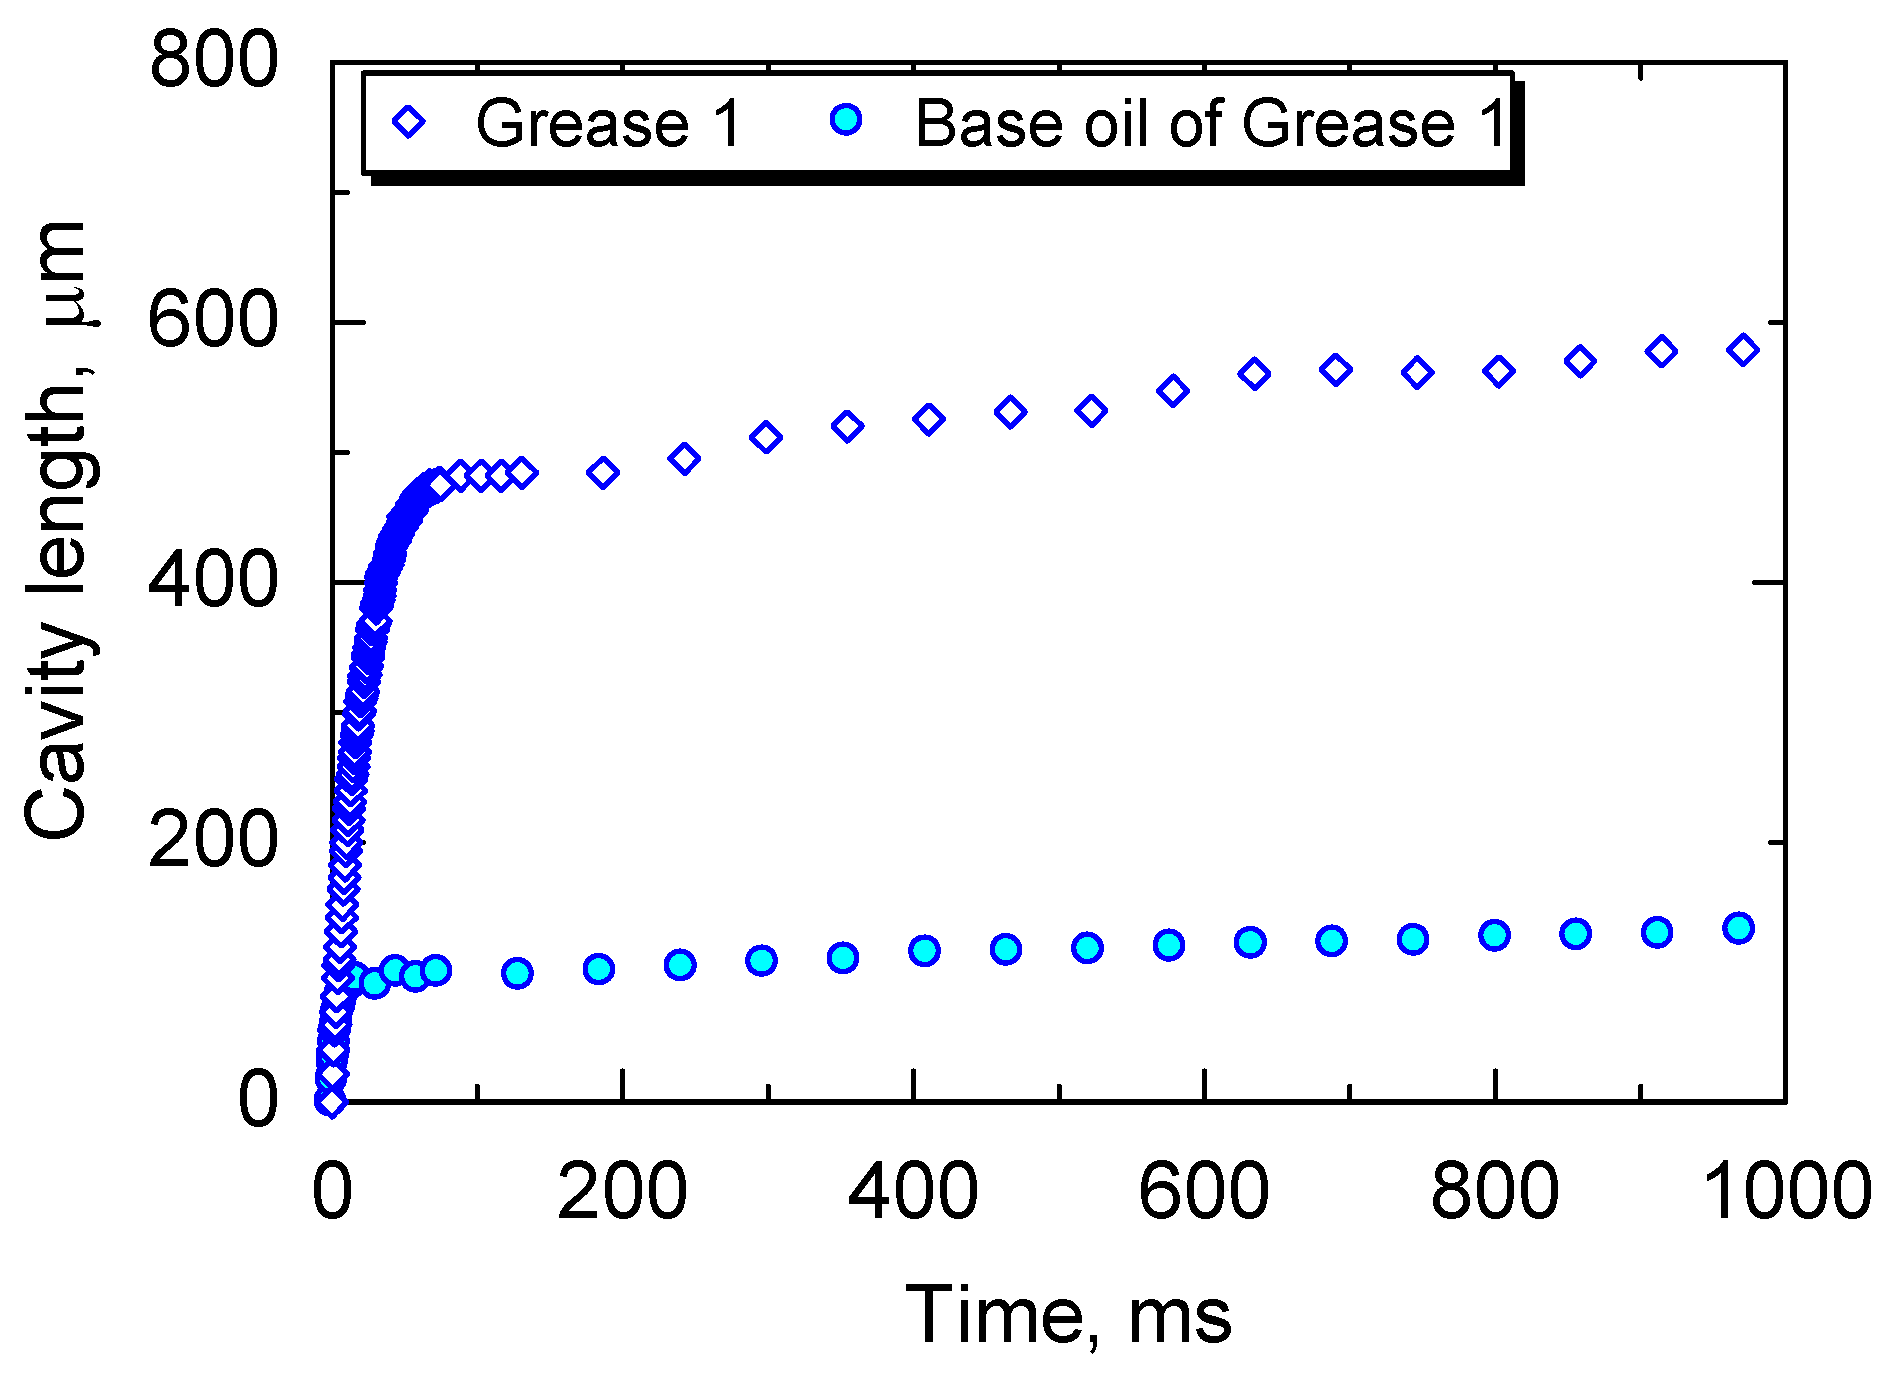
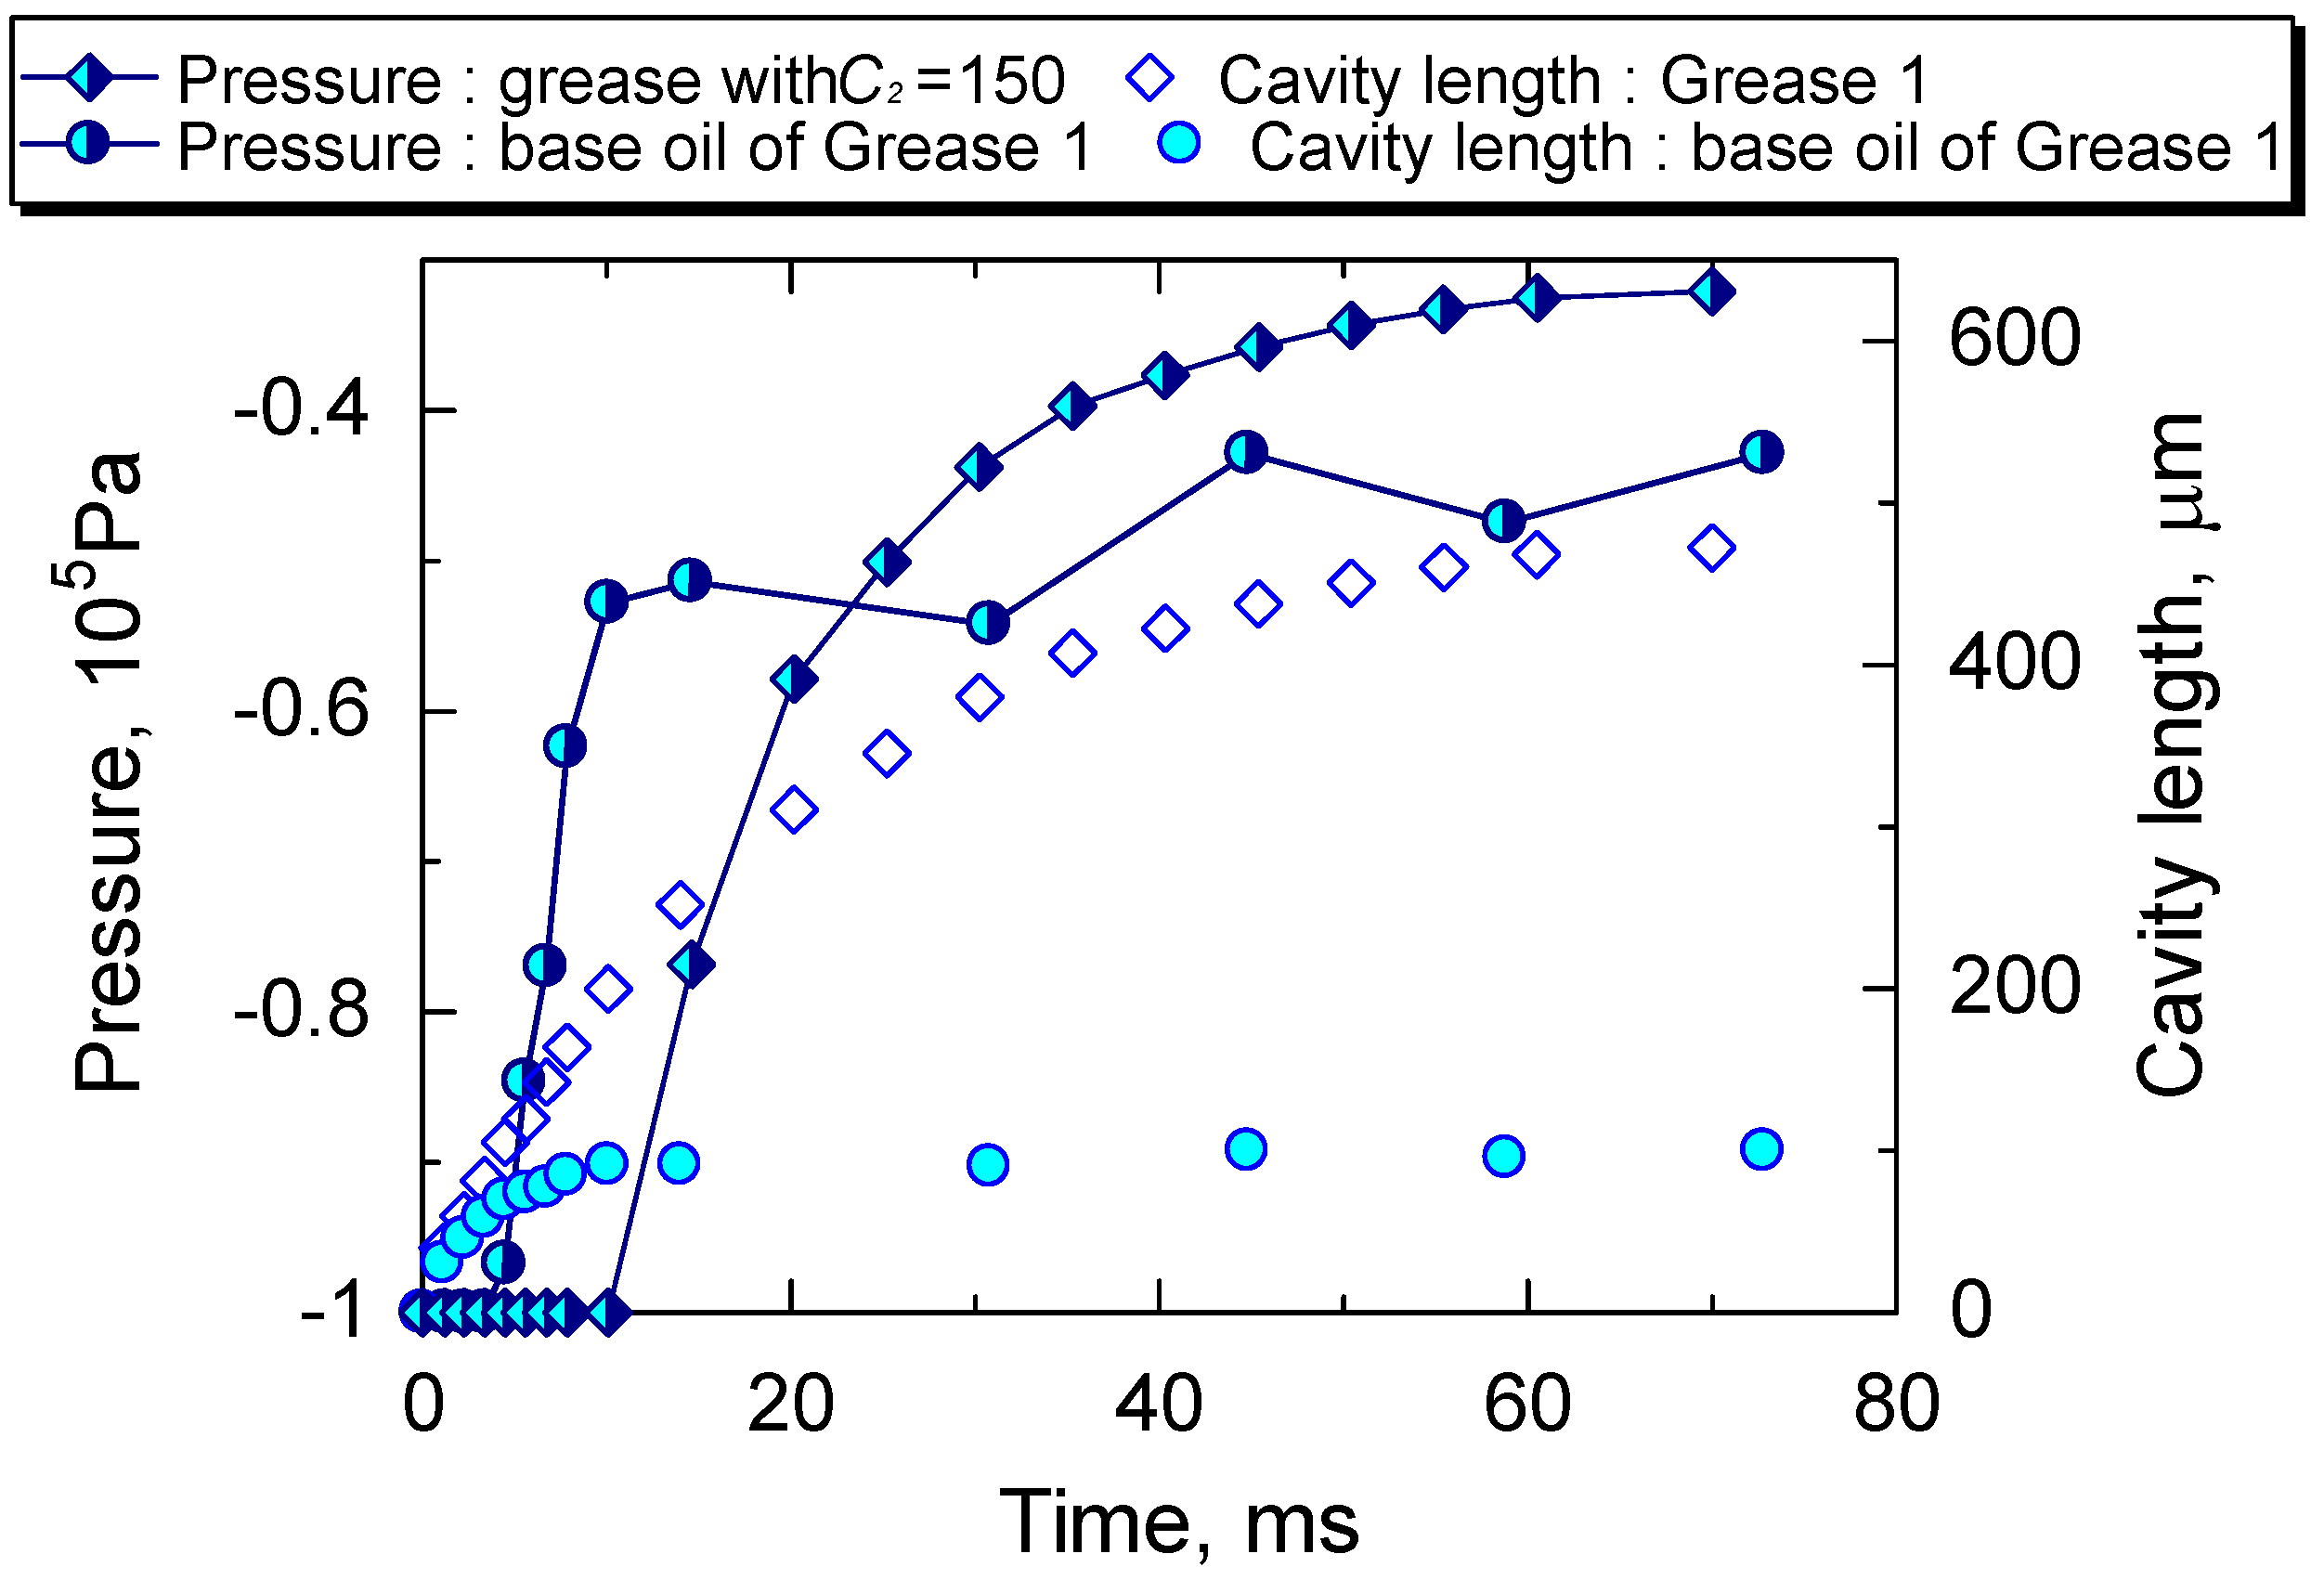
3.1. Cavity Growth: Grease vs. Base Oil
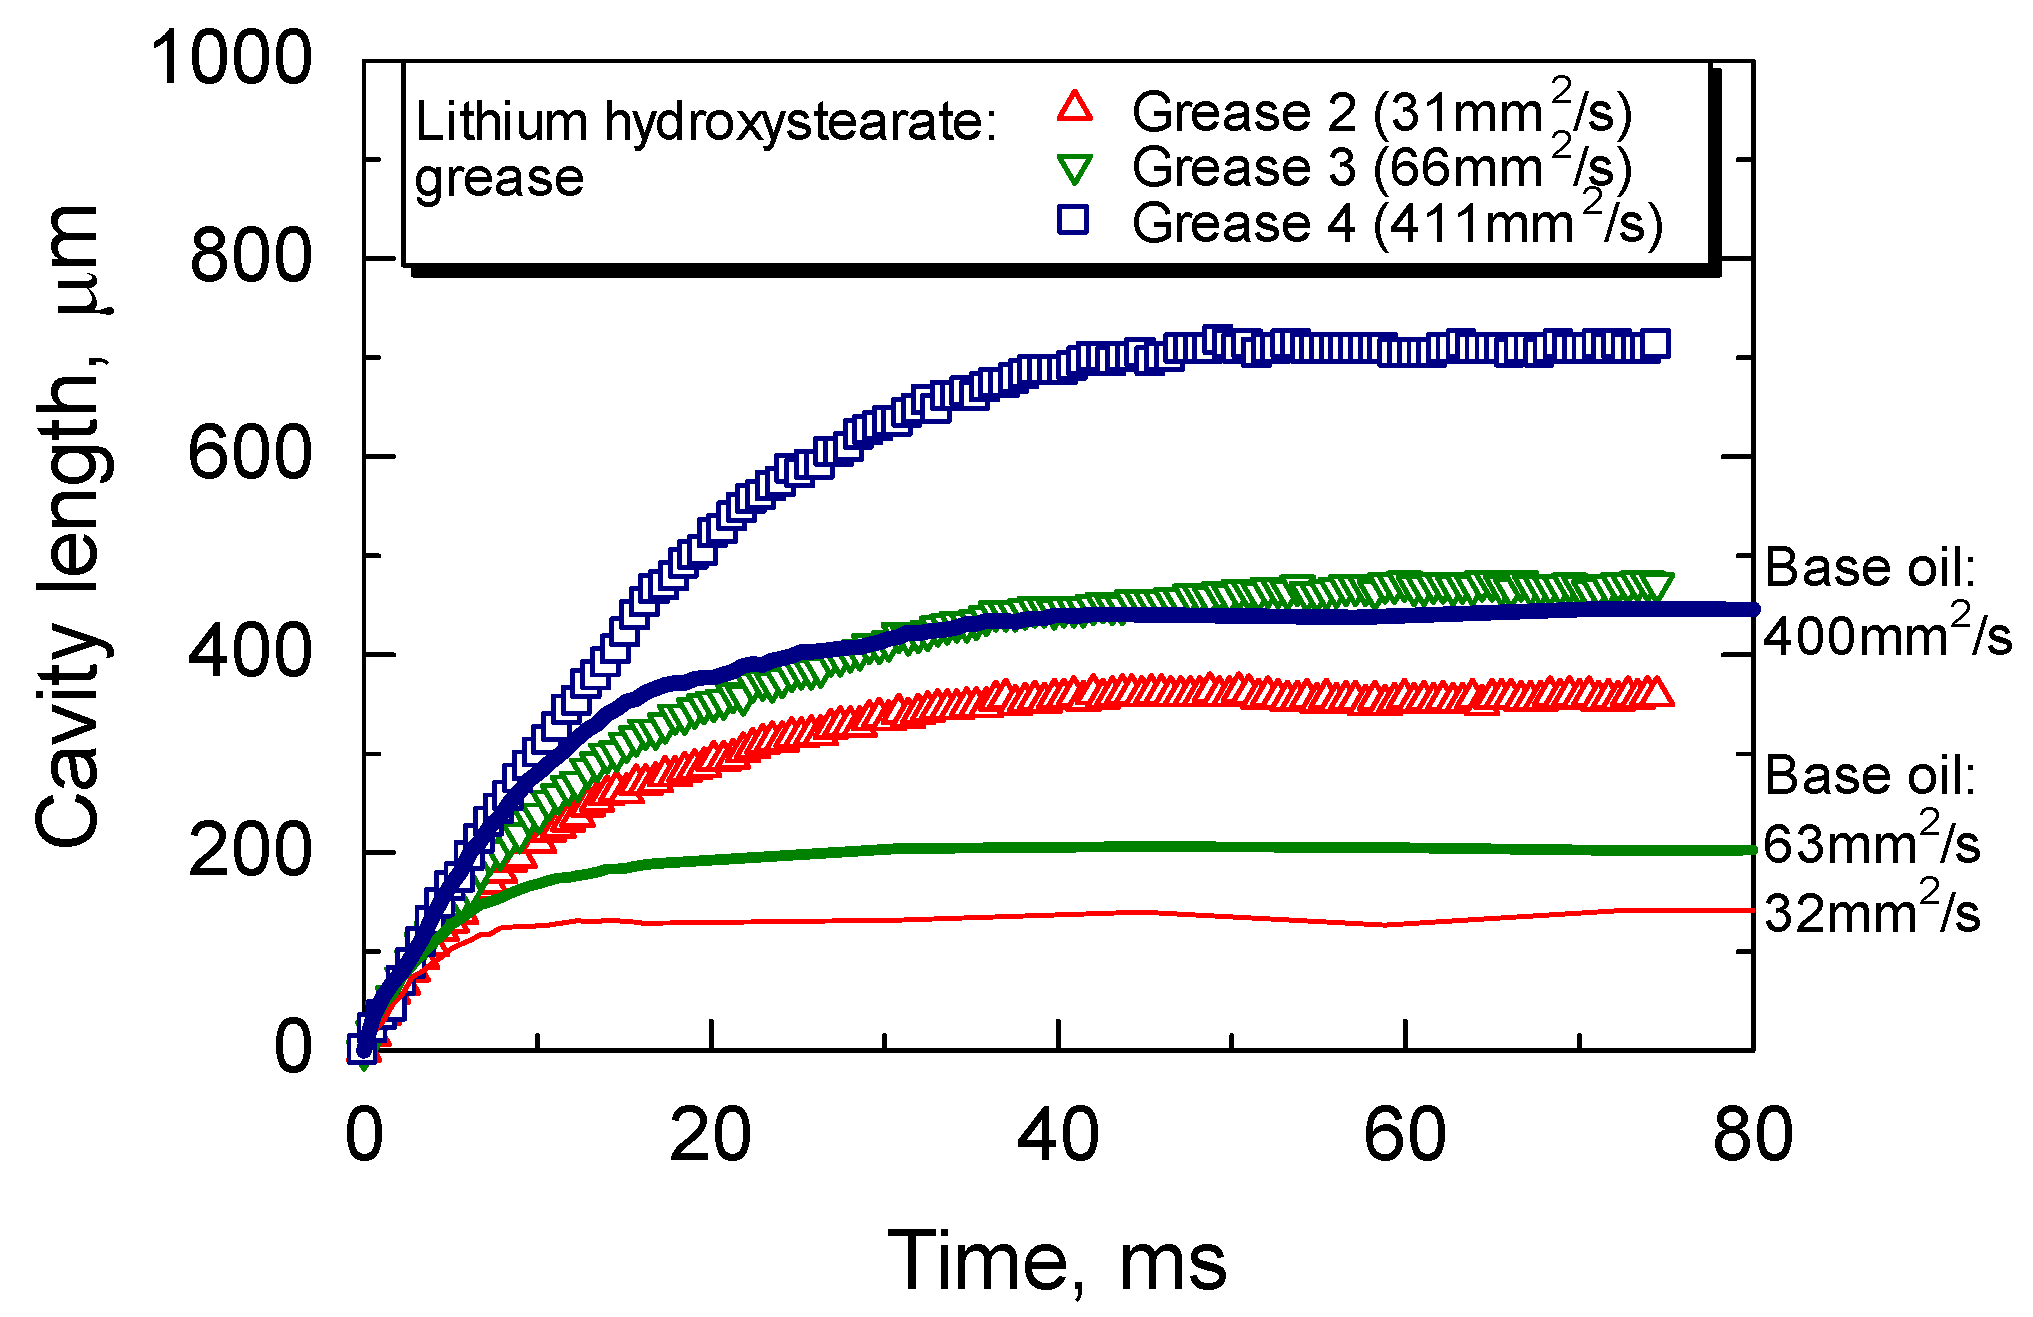
3.2. Effect of Base Oil Viscosity
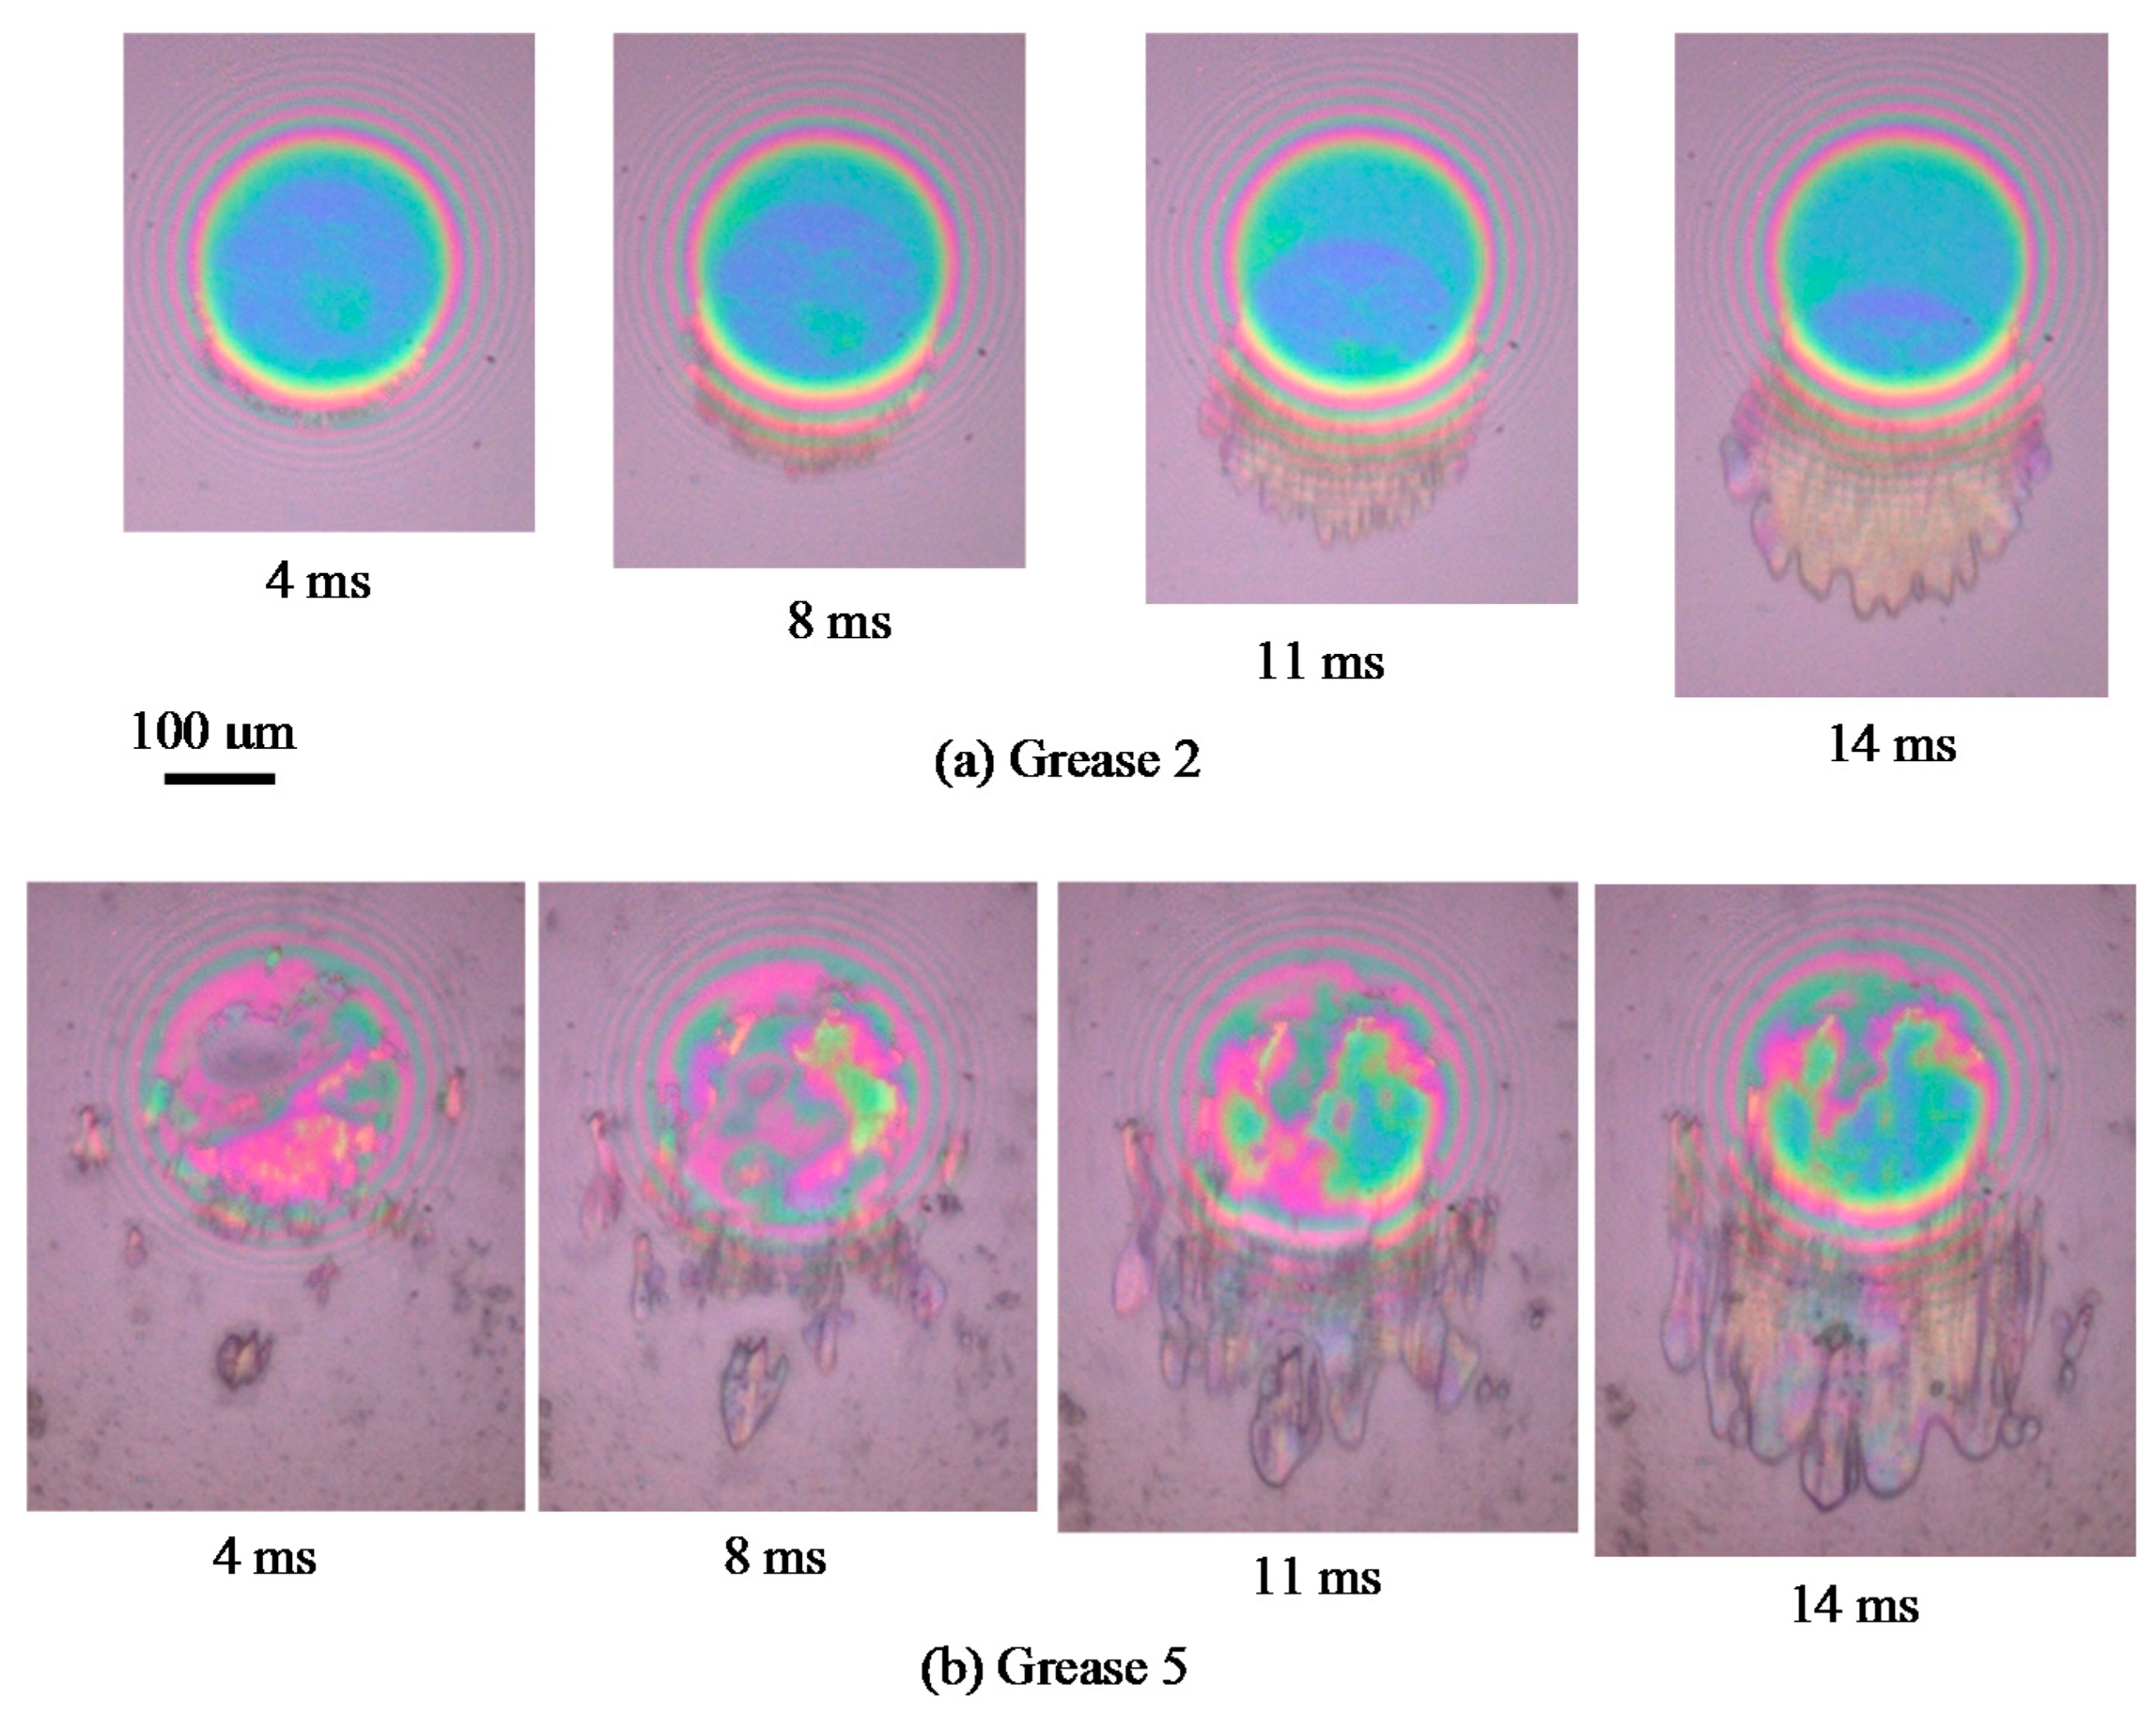
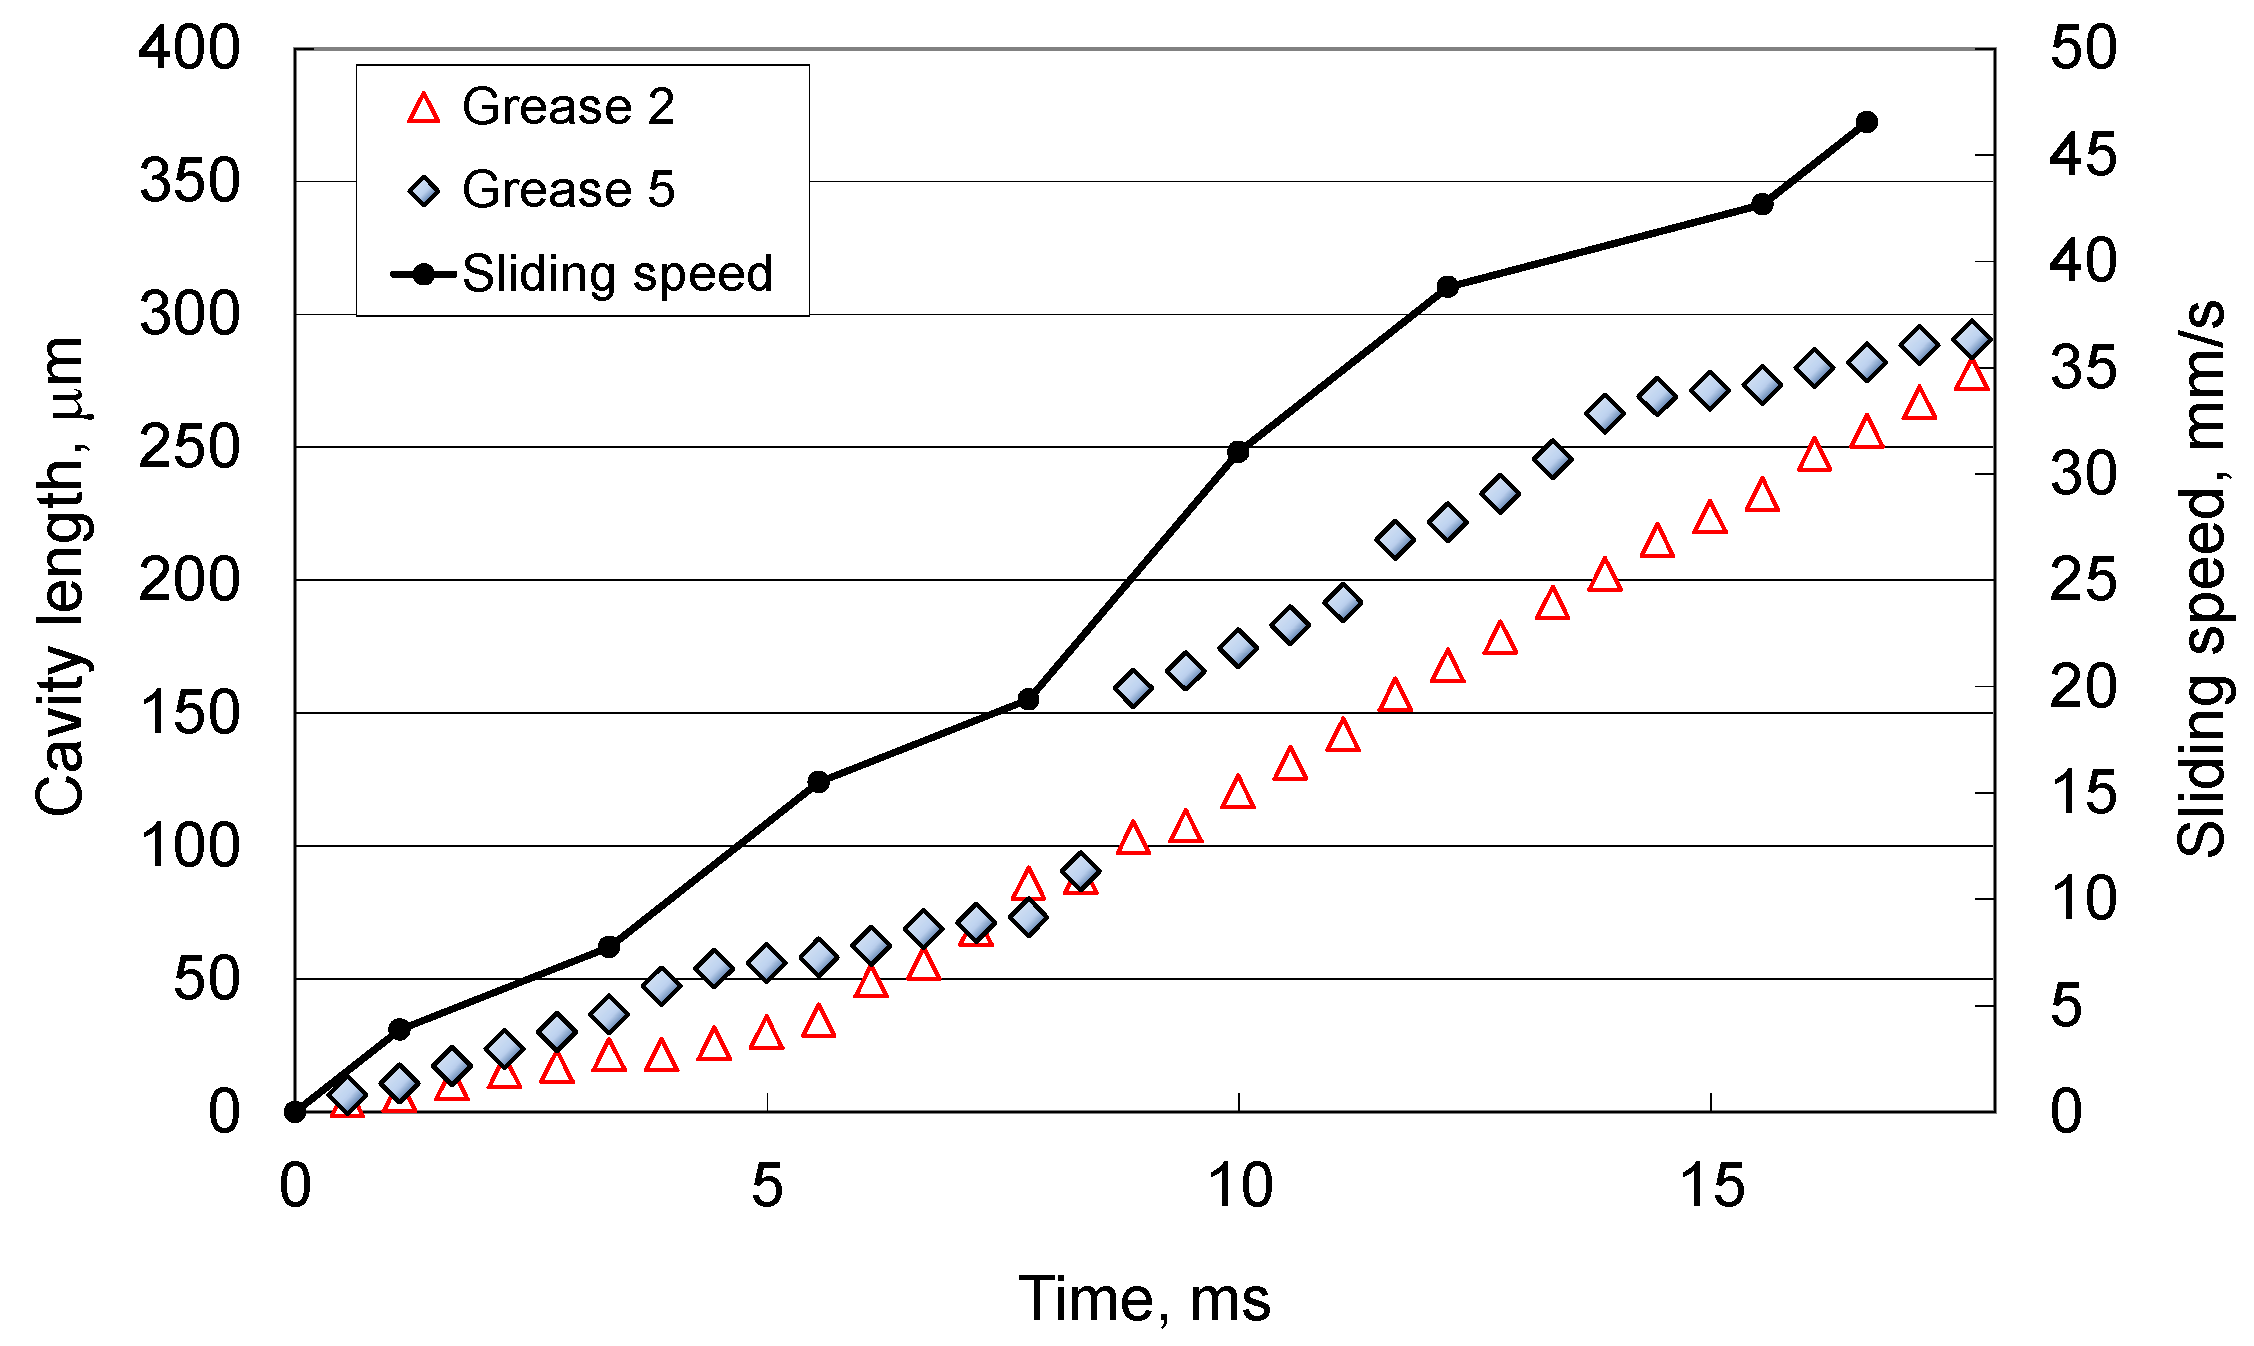
3.3. Effect of Thickener
4. Cavity Growth Model in Grease Lubricated Contact
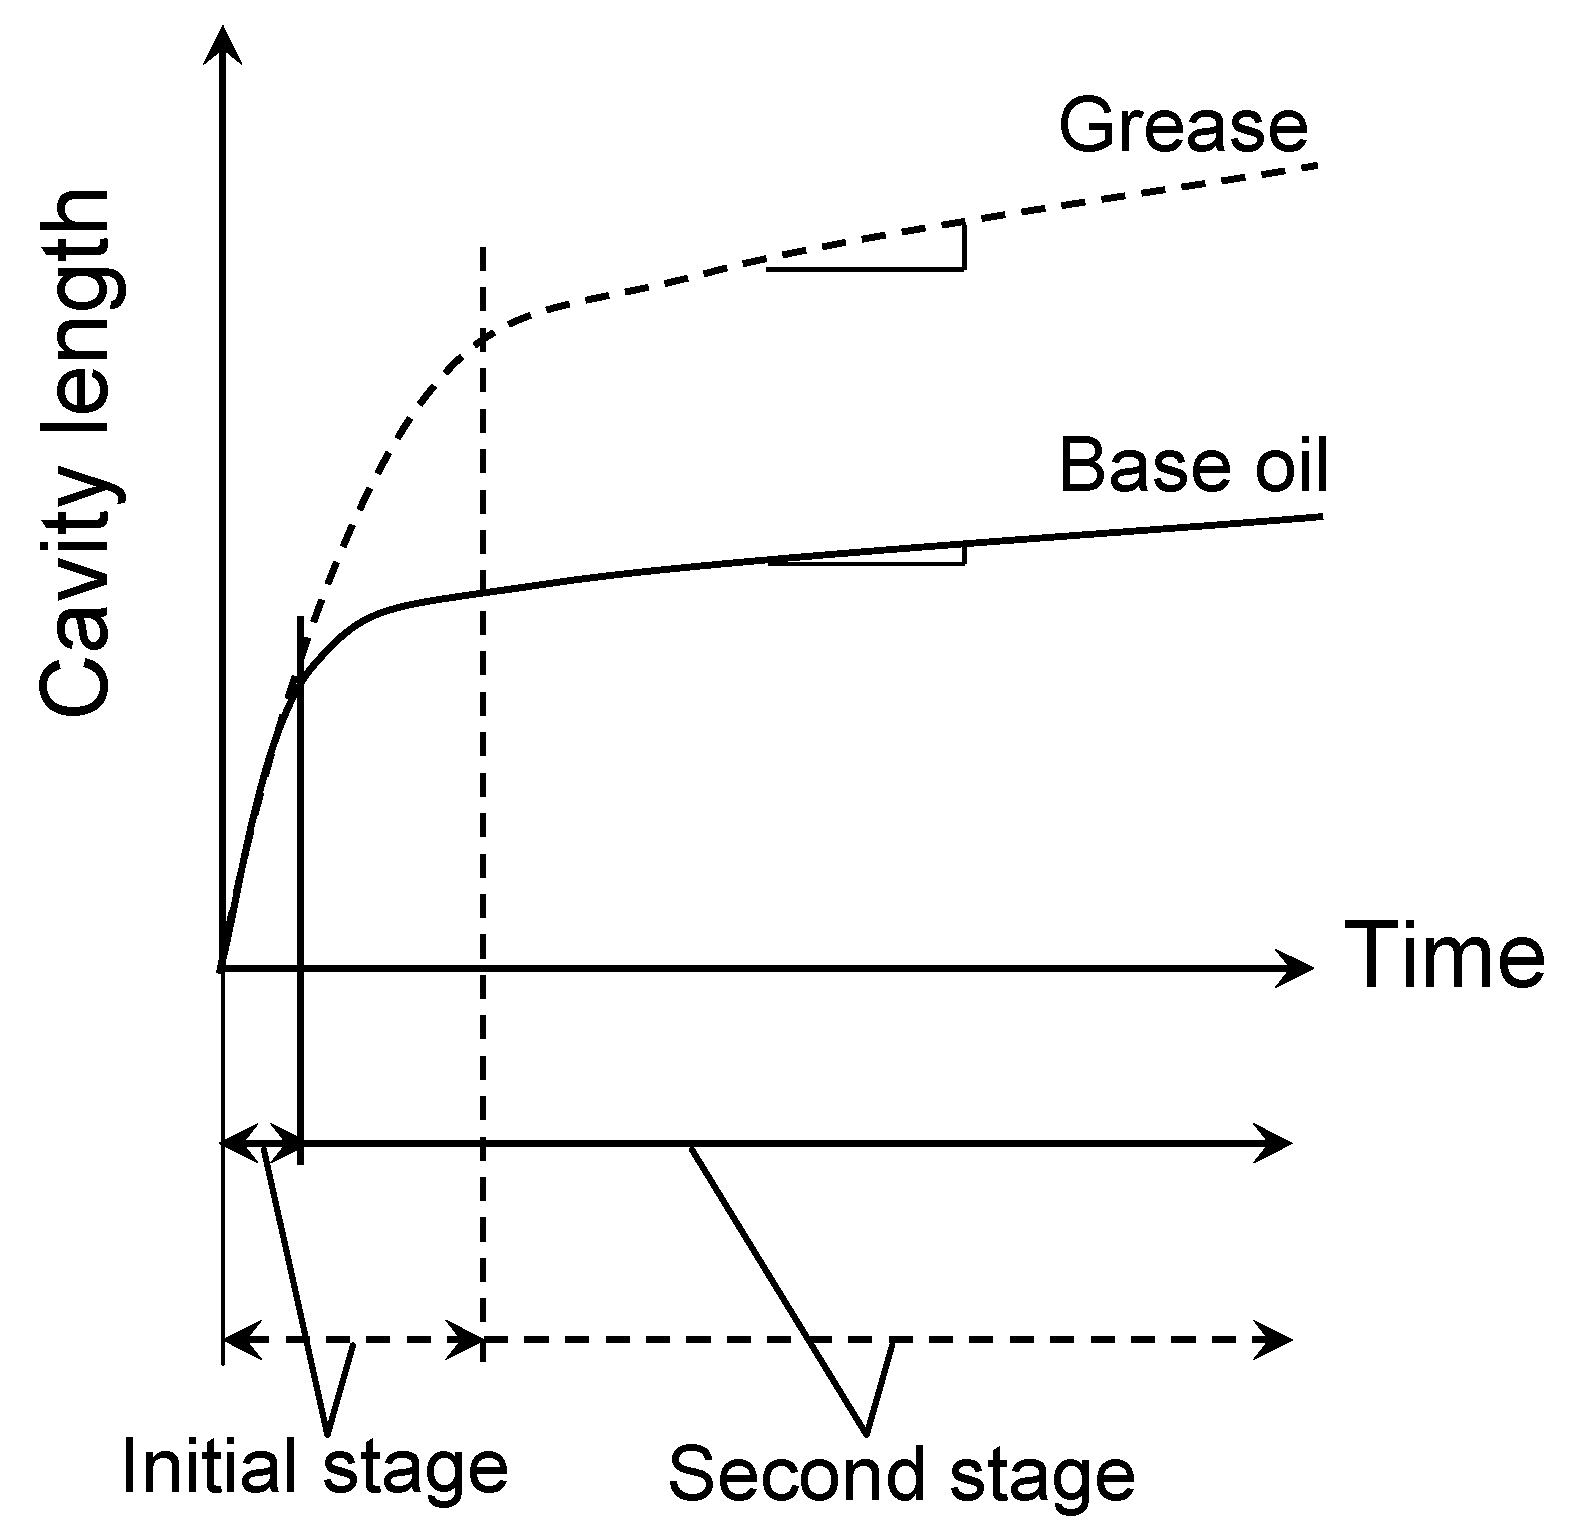
4.1. Two Stage of Cavity Growth
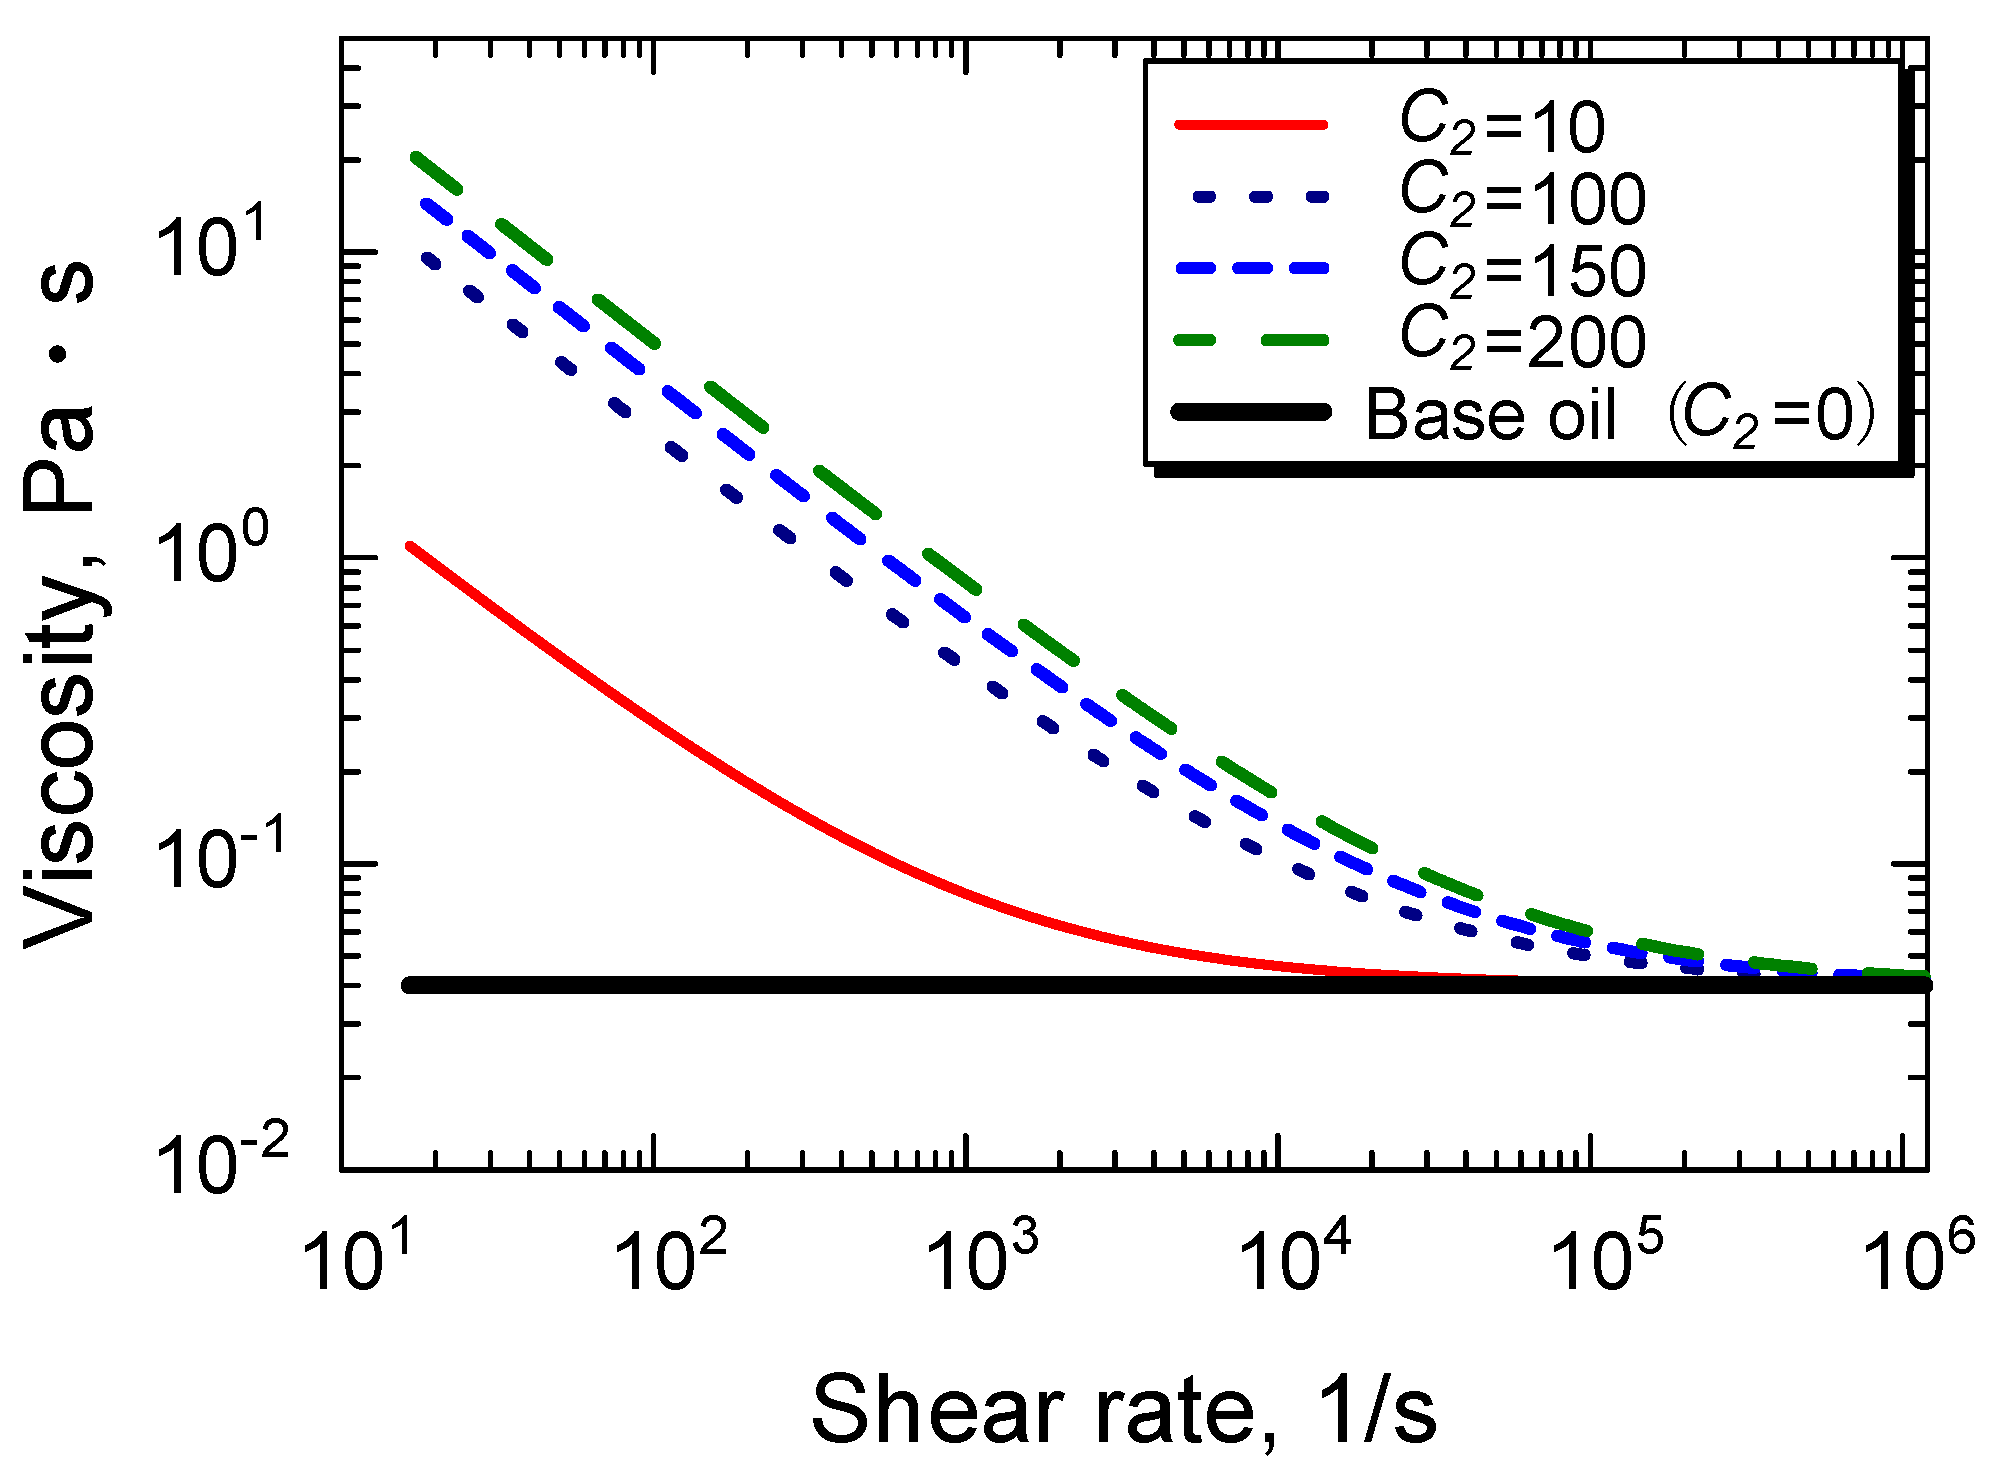
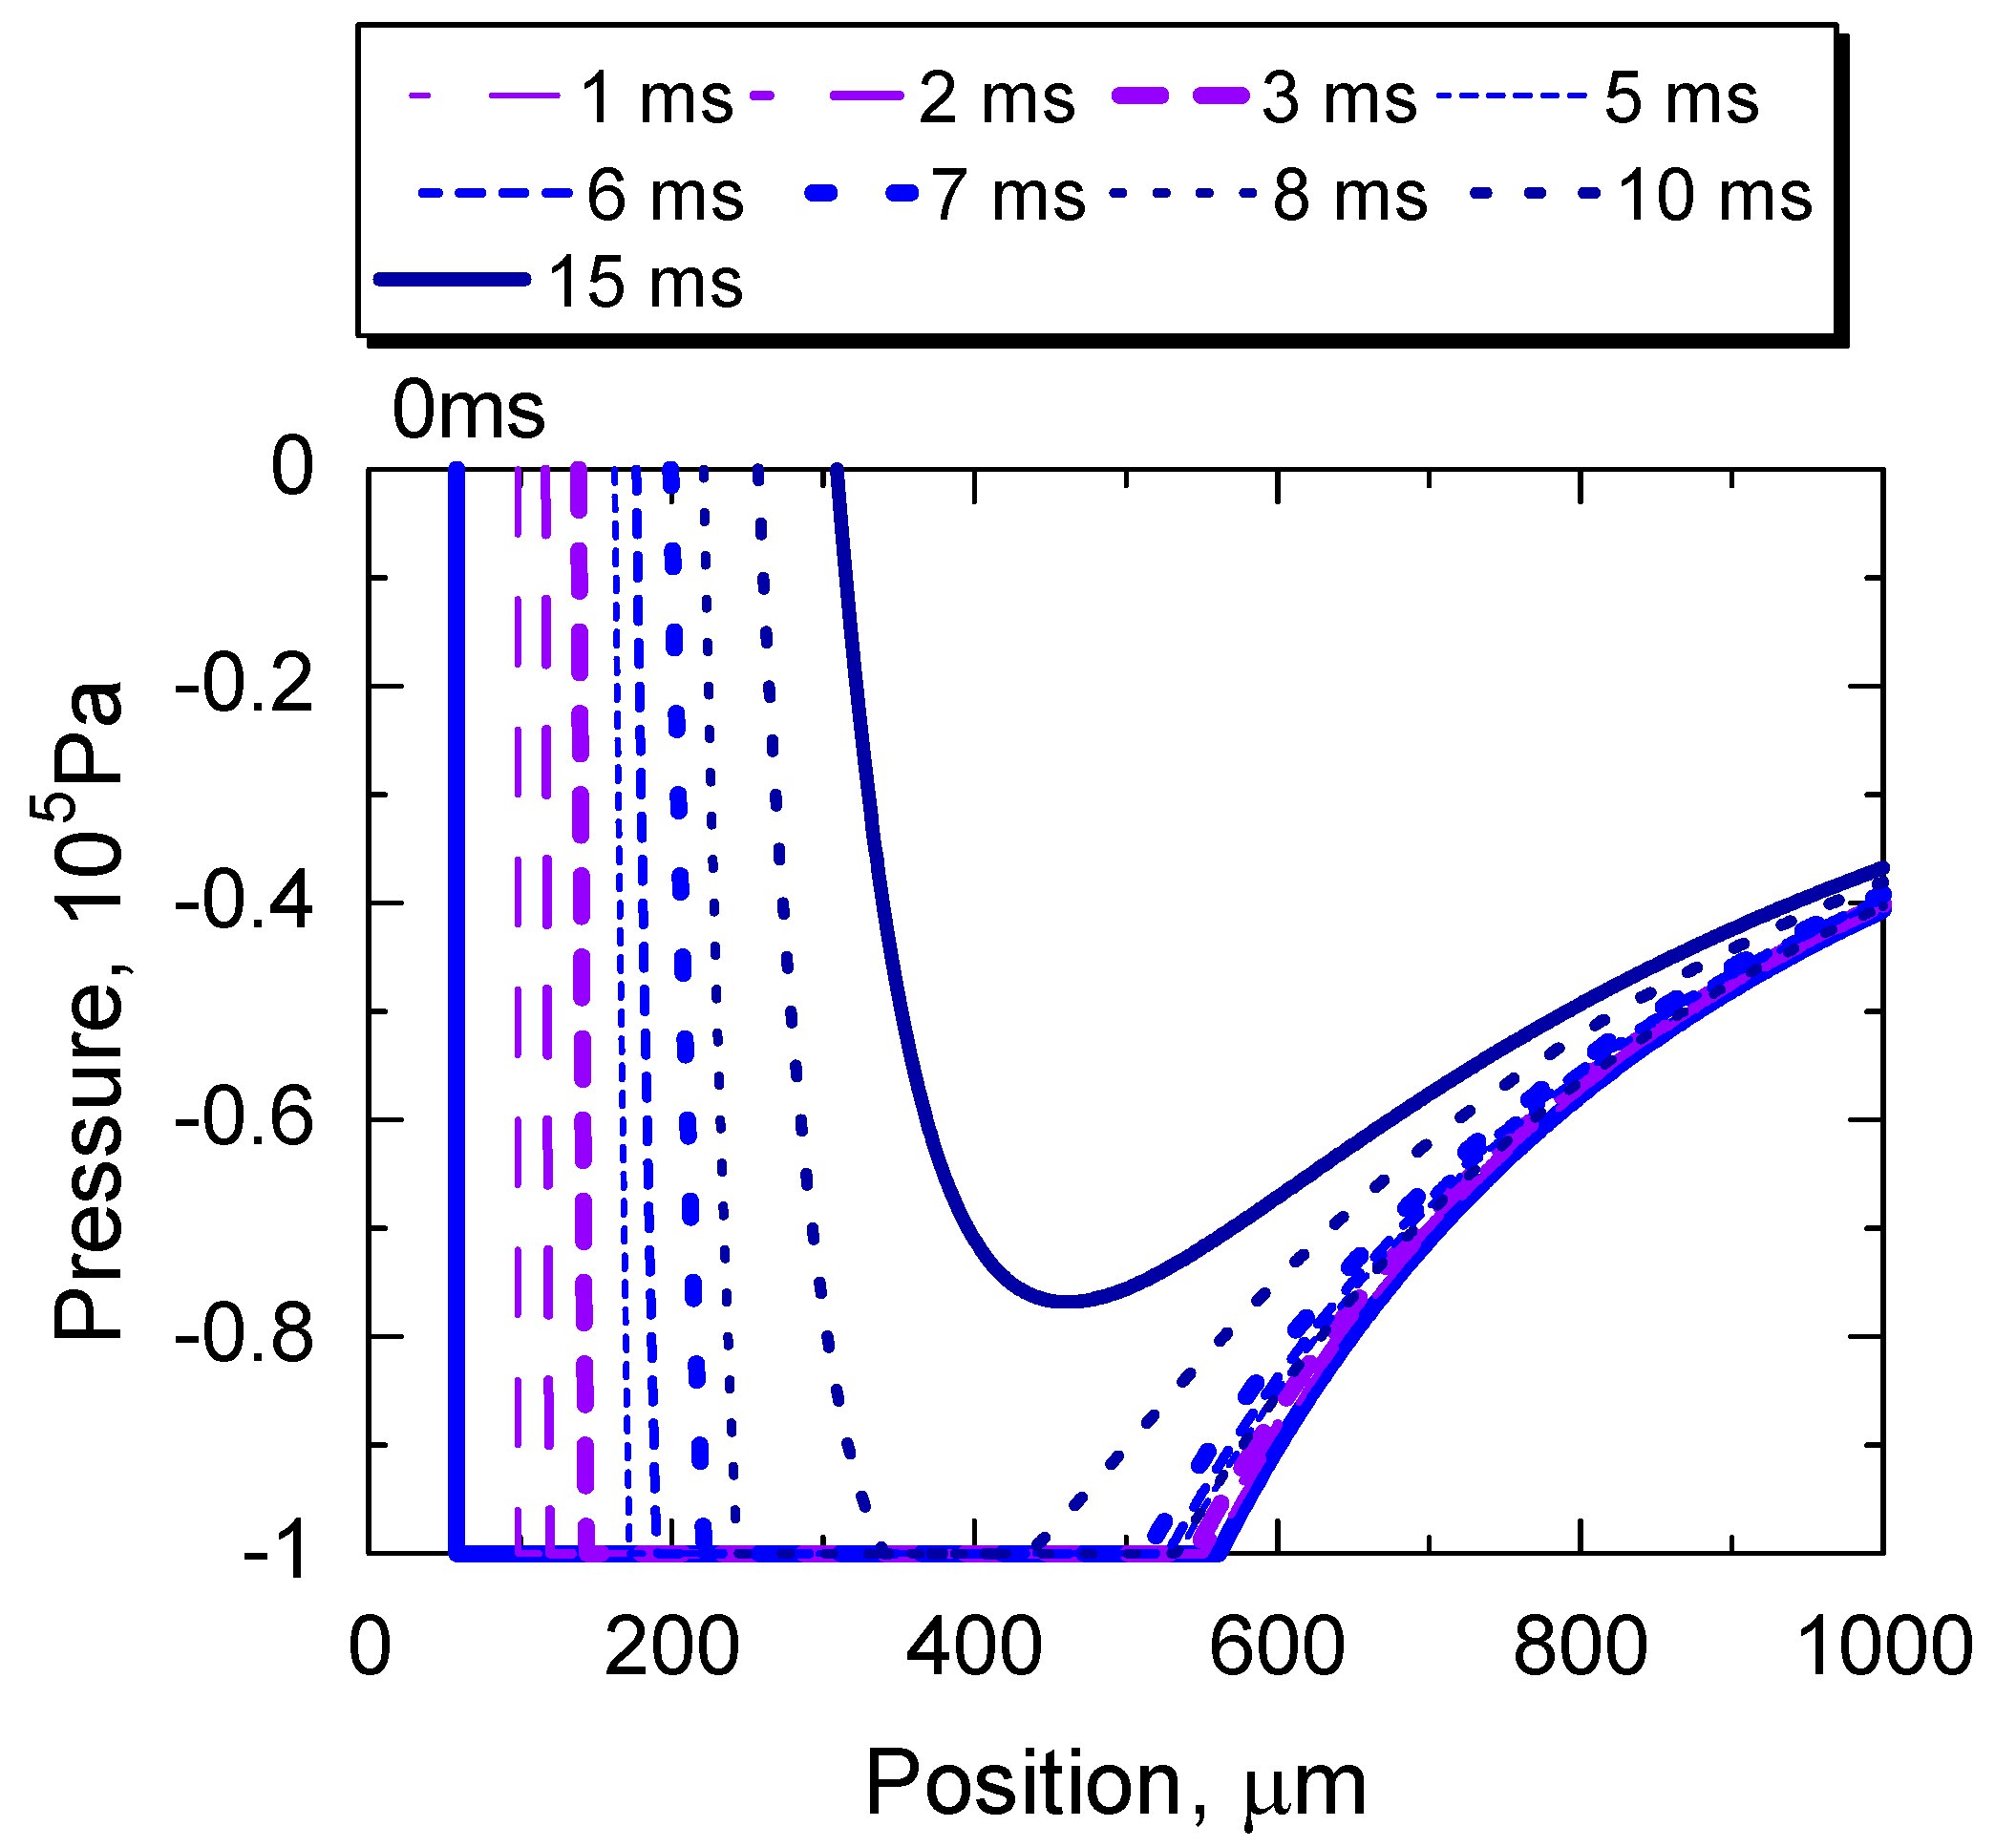
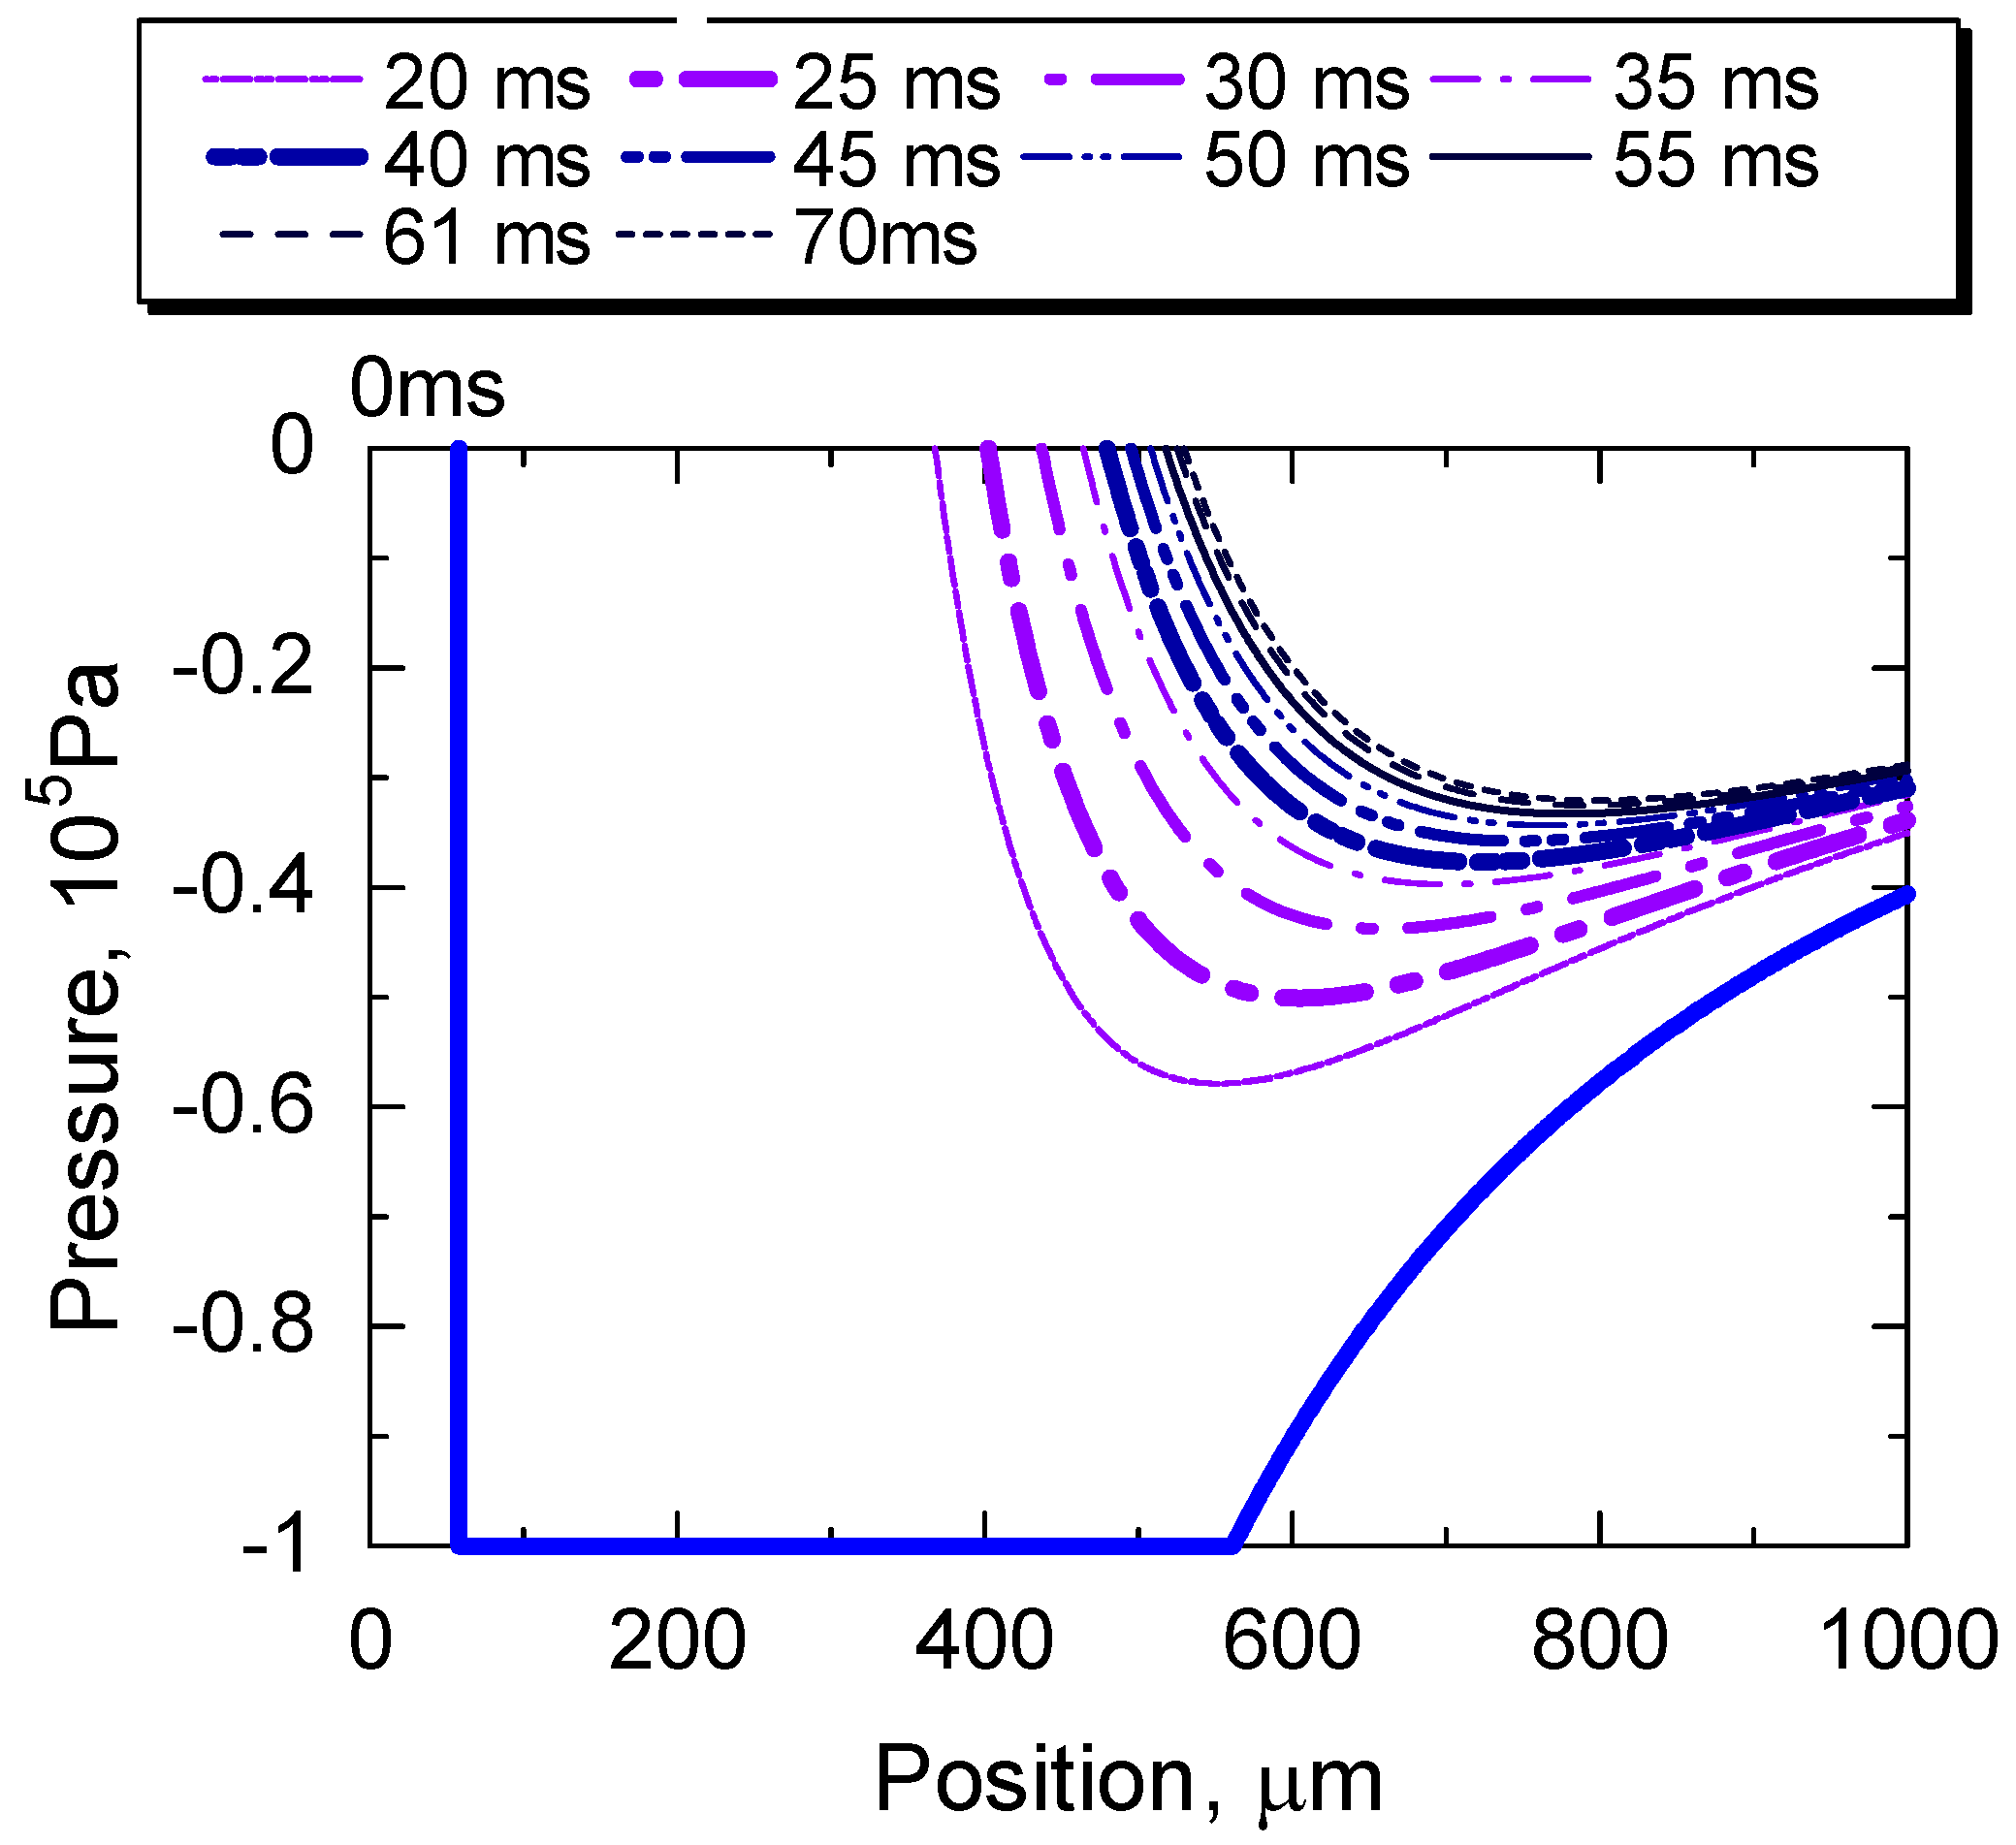
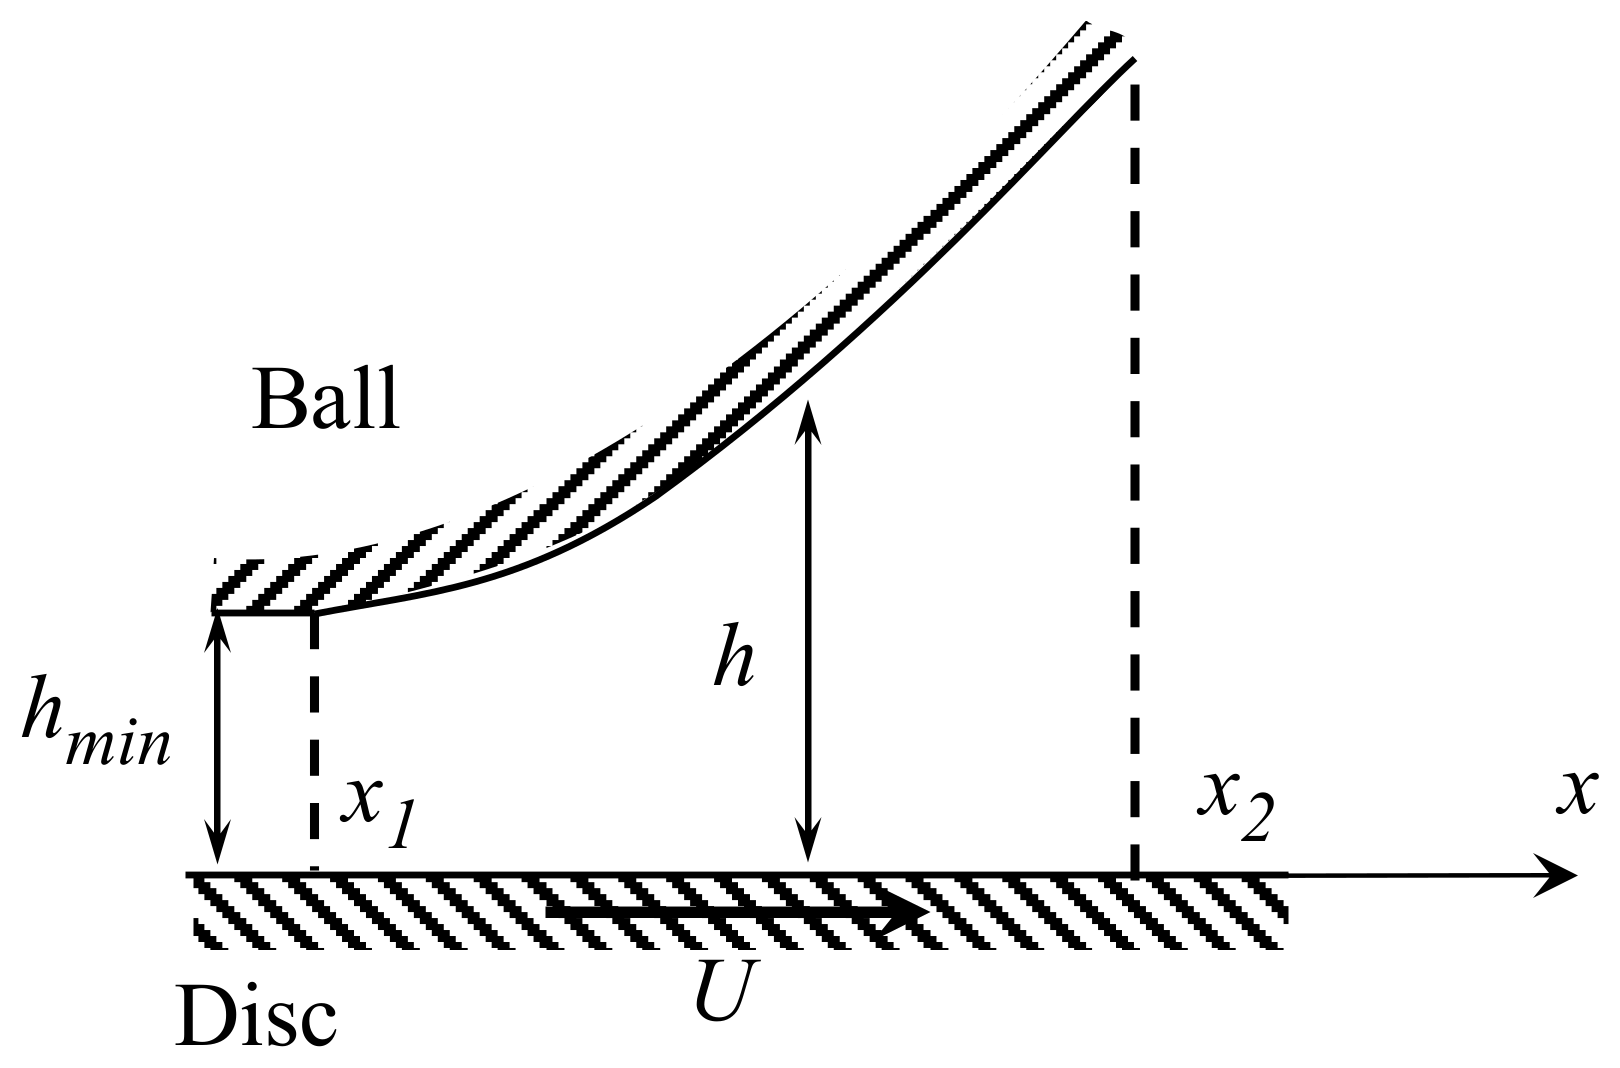
4.2. Simple Numerical Analysis for Initial Stage of Cavity Growth
5. Conclusions
Author Contributions
Funding
Acknowledgments
Conflicts of Interest
Appendix A

References
- Dowson, D.; Godet, M.; Tayler, C.M. Cavitation and Realated Phenomena in Lubrication; Mechanical Engineering Publications Ltd.: Bury St Edmunds, UK, 1975. [Google Scholar]
- Sakai, F.; Ochiai, M.; Hashimoto, H. CFD Analysis of Journal Bearing with Oil Supply Groove Considering Two-Phase Flow. In Proceedings of the 4th International Conference on Design Engineering and Science, ICDES 2017, Aachen, Germany, 17–19 September 2017; p. 131. [Google Scholar]
- Otsu, T.; Nishida, K. Growth of Cavitation in Journal Bearing and Effect of Cavitation on Behavior of Bearing. J. Jpn. Soc. Tribol. 2016, 61, 127–136. (In Japanese) [Google Scholar]
- Tokunaga, Y.; Sugimura, J.; Yamamoto, Y. Development and Performance Verification in Mechanical Seals with Friction Reduction and Sealing Mechanism-Experimental Study. J. Jpn. Soc. Tribol. 2015, 60, 332–341. (In Japanese) [Google Scholar]
- Vasilakos, I. Cavitation in the Cylider-Liner and Piston-Ring Interaction in Internal Combustion Engines. Ph.D. Thesis, University of London, London, UK, 2017. [Google Scholar]
- Tang, T.; Morris, N.; Coupland, J.; Arevalo, L. Cavitation Bubble Measurement in Tribological Contacts Using Digital Holographic Microscopy. Tribol. Lett. 2015, 58, 1–10. [Google Scholar] [CrossRef]
- Shen, C.; Khonsari, M.M. On the Magnitude of Cavitation Pressure of Steady-State Lubrication. Tribol. Lett. 2013, 51, 153–160. [Google Scholar] [CrossRef]
- Yagi, K.; Sato, H.; Sugimura, J. On the Magnitude of Load-Carrying Capacity of Textured Surfaces in Hydrodynamic Lubrication. Tribol. Online 2015, 10, 232–245. [Google Scholar] [CrossRef]
- Nishikawa, H.; Handa, K.; Kaneta, M. Behaviour of EHL Films in Reciprocated Motion. JSME Int. J. 1995, 38, 558–567. [Google Scholar]
- Pemberton, J.; Cameron, A.A. A Mechanism of Fluid Replenishment in Elstohydrodynamic Contacts. Wear 1976, 37, 185–190. [Google Scholar] [CrossRef]
- Jackson, A.; Cameron, A. An Interferometric Study of the EHL of Rough Surfaces. ASLE Trans. 1976, 19, 50–60. [Google Scholar] [CrossRef]
- Cann, P.M.E. Thin-film Grease Lubrication. Proc. Inst. Mech. Eng. 1999, 213, 405–416. [Google Scholar] [CrossRef]
- Leonard, B.; Sadeghi, F.; Cipra, R. Gaseous Cavitation and Wear in Lubricated Fretting Contacts. Tribol. Trans. 2008, 51, 351–360. [Google Scholar] [CrossRef]
- Etsion, I.; Halperin, G.; Brizmer, V.; Kligerman, Y. Experimental Investigation of Laser Surface Textured Parallel Thrust Bearings. Tribol. Lett. 2004, 17, 295–300. [Google Scholar] [CrossRef]
- Ryk, G.; Kligerman, Y.; Etsion, I.; Shinkarenko, A. Experimental Investigation of Partial Laser Surface Texturing for Piston-ring Friction Reduction. Tribol. Trans. 2005, 48, 583–588. [Google Scholar] [CrossRef]
- Yagi, K.; Takedomi, W.; Tanaka, H.; Sugimura, J. Improvement of Lubrication Performance by Micro Pit Surfaces. Tribol. Online 2008, 3, 285–288. [Google Scholar] [CrossRef]
- Sato, Y.; Seki, K.; Sugimura, J.; Yamamoto, Y. Experiments and Simple Modelling of Hydrodynamic Lubrication in Radial Shaft Seals. In Proceedings of the 17th International Conference of Fluid Sealing, York, UK, 8–10 April 2003; BHR Group: Cranfield, UK, 2003; pp. 139–156. [Google Scholar]
- Nau, B.S. Film Cavitation Observation in Face Seals. In Proceedings of the 4th International Conference on Fluid Sealing, Philadelphia, PA, USA, 5–8 May 1969; BHRA: Cranfield, UK, 1969; pp. 190–198. [Google Scholar]
- Anno, J.N.; Walowit, J.A. Microasperity Lubrication. J. Lubr. Technol. 1968, 90, 351–355. [Google Scholar] [CrossRef]
- Sisko, A.W. The flow of lubricating greases. Ind. Eng. Chem. 1958, 50, 1789–1792. [Google Scholar] [CrossRef]
- Dyson, A.; Wilson, A.R. Film Thickness in Elastohydrodynamic Lubrication of Rollers by Greases. Proc. Inst. Mech. Eng. 1970, 184, 1–11. [Google Scholar]
- Kaneta, M.; Ogata, T.; Takubo, Y.; Naka, M. Effects of a Thickener Structure on Grease Elastohydrodynamic Lubrication Films. Proc. Inst. Mech. Eng. 2000, 214, 327–336. [Google Scholar] [CrossRef]
- Couronné, I.; Mazuyer, D.; Vergne, P.; Truong-Dinh, N.; Girodin, D. Effects of Grease Composition and Structure on Film Thickness in Rolling Contact. Tribol. Trans. 2003, 46, 31–36. [Google Scholar] [CrossRef]
- Eriksson, P.; Wikstroèm, V.; Larsson, R. Grease Passing Through an Elastohydrodynamic Contact under Pure Rolling Conditions. Proc. Inst. Mech. Eng. 2000, 214, 309–316. [Google Scholar] [CrossRef]
- Kauzlarich, J.; Greenwood, J.A. Elastohydrodynamic Lubrication with Herschel-Bulckley Model Greases. ASLE Trans. 1972, 15, 269–277. [Google Scholar] [CrossRef]
- Yanggang, M.; Jie, Z. A Rheological Model for Lithium Lubricating Grease. Tribol. Int. 1998, 31, 619–625. [Google Scholar] [CrossRef]
- Cann, P.M.E. Starved Grease Lubrication of Rolling Contacts. Tribol. Trans. 1999, 42, 867–873. [Google Scholar] [CrossRef]
- Hurley, S.; Cann, P.M.; Spikes, H.A. Lubrication and Reflow Properties of Thermally Aged Greases. Tribol. Trans. 2000, 43, 221–228. [Google Scholar] [CrossRef]
- Dowson, D. Investigation of Cavitation in Lubricating Films Supporting Small Loads. In Proceedings of the Conference on Lubrication and Wear, London, UK, 1–3 October 1957; pp. 93–99. [Google Scholar]
- Archard, J.F.; Kirk, M.T. Influence of Elastic Modulus on the Lubrication of Point Contacts. Lubr. Wear Conv. 1963, 15, 181–189. [Google Scholar]
- Otsu, T.; Tanaka, H.; Izumi, N.; Sugimura, J. Effect of Surrounding Gas on Cavitation in EHL. Tribol. Online 2009, 4, 50–54. [Google Scholar] [CrossRef]
- Otsu, T.; Tanaka, H.; Sugimura, J. Initiation and Growth of Gaseous Cavity in Concentrated Contact in Various Surrounding Gas. Tribol. Int. 2012, 53, 68–75. [Google Scholar] [CrossRef]
- Otsu, T.; Tanaka, H.; Sugimura, J. Effect of Temperature on Growth of Gaseous Cavitation in Point Contact EHL. J. Jpn. Soc. Tribol. 2014, 59, 648–656. (In Japanese) [Google Scholar]
- Otsu, T.; Tanaka, H.; Sugimura, J. Effect of Surrounding Pressure on Cavity Growth in EHD contact. In Proceedings of the International Tribology Conference Hiroshima, Hiroshima, Japan, 30 October–3 November 2011; p. E4-07. [Google Scholar]
- Otsu, T. Study on Cavitation in Elastohydrodynamic Lubrication. Ph.D. Thesis, Kyushu University, Fukuoka, Japan, 2012. (In Japanese). [Google Scholar]
- Cann, P.M.; Hutchinson, J.; Spikes, H.A. The Development of a Spacer Layer Imaging Method (SLIM) for Mapping Elastohydrodynamic Contacts. Tribol. Trans. 1996, 39, 915–921. [Google Scholar] [CrossRef]
- Stadler, K.; Izumi, N.; Morita, T.; Sugimura, J.; Piccigallo, B. Estimation of Cavity Length in EHL Rolling Point Contact. ASME Trans. J. Tribol. 2008, 130. [Google Scholar] [CrossRef]
- Sakurai, T.; Hoshino, M.; Tokashiki, M.; Fujita, M. Grease for Lubrication and Synthetic Lubricant; Saiwai-Syobou: Tokyo, Japan, 1983; p. 80. (In Japanese) [Google Scholar]
- Wedeven, L.D.; Evens, D.; Cameron, A. Optical analysis of ball bearing starvation. Trans. ASME J. Lubr. Technol. 1971, 93, 349–363. [Google Scholar] [CrossRef]


| No. | Thickener | Base Oil Viscosity @313, 373 K | Worked Penetration (Consistency) |
|---|---|---|---|
| Grease 1 | Lithium stearate, 12 mass% | 19, 4.1 [mm2/s] | 336 |
| Grease 2 | Lithium hydroxystearate, 12 mass% | 31, 5.8 [mm2/s] | 236 |
| Grease 3 | Lithium hydroxystearate, 12 mass% | 66, 10 [mm2/s] | 291 |
| Grease 4 | Lithium hydroxystearate, 12 mass% | 411, 41 [mm2/s] | 386 |
| Grease 5 | Diurea, 13.4 mass% | 31, 5.8 [mm2/s] | 280 |
© 2018 by the authors. Licensee MDPI, Basel, Switzerland. This article is an open access article distributed under the terms and conditions of the Creative Commons Attribution (CC BY) license (http://creativecommons.org/licenses/by/4.0/).
Share and Cite
Otsu, T.; Glovnea, R.; Sugimura, J. Cavitation Growth Phenomena in Pure-Sliding Grease EHD Contacts. Lubricants 2018, 6, 75. https://doi.org/10.3390/lubricants6030075
Otsu T, Glovnea R, Sugimura J. Cavitation Growth Phenomena in Pure-Sliding Grease EHD Contacts. Lubricants. 2018; 6(3):75. https://doi.org/10.3390/lubricants6030075
Chicago/Turabian StyleOtsu, Takefumi, Romeo Glovnea, and Joichi Sugimura. 2018. "Cavitation Growth Phenomena in Pure-Sliding Grease EHD Contacts" Lubricants 6, no. 3: 75. https://doi.org/10.3390/lubricants6030075
APA StyleOtsu, T., Glovnea, R., & Sugimura, J. (2018). Cavitation Growth Phenomena in Pure-Sliding Grease EHD Contacts. Lubricants, 6(3), 75. https://doi.org/10.3390/lubricants6030075