Testing of WS2 Nanoparticles Functionalized by a Humin-Like Shell as Lubricant Additives


Abstract
:
1. Introduction
2. Materials and Methods
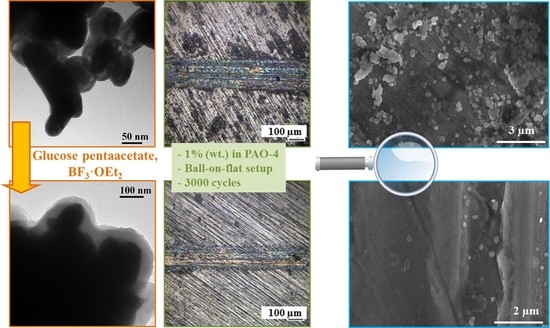
2.1. Preparation of Humin-Like Shell-Coated WS2 NPs
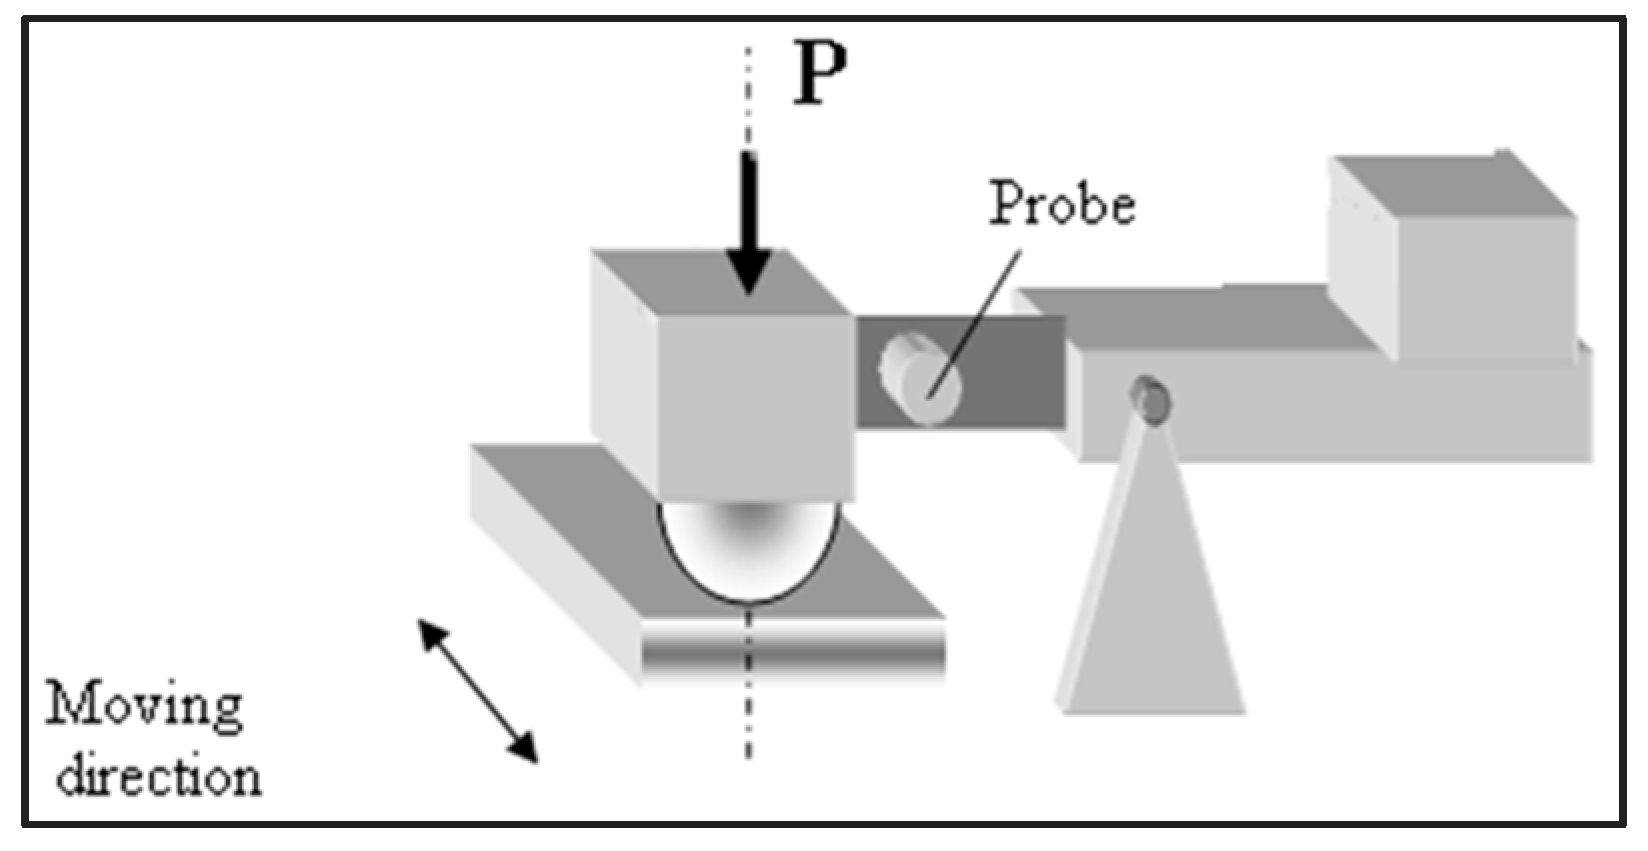
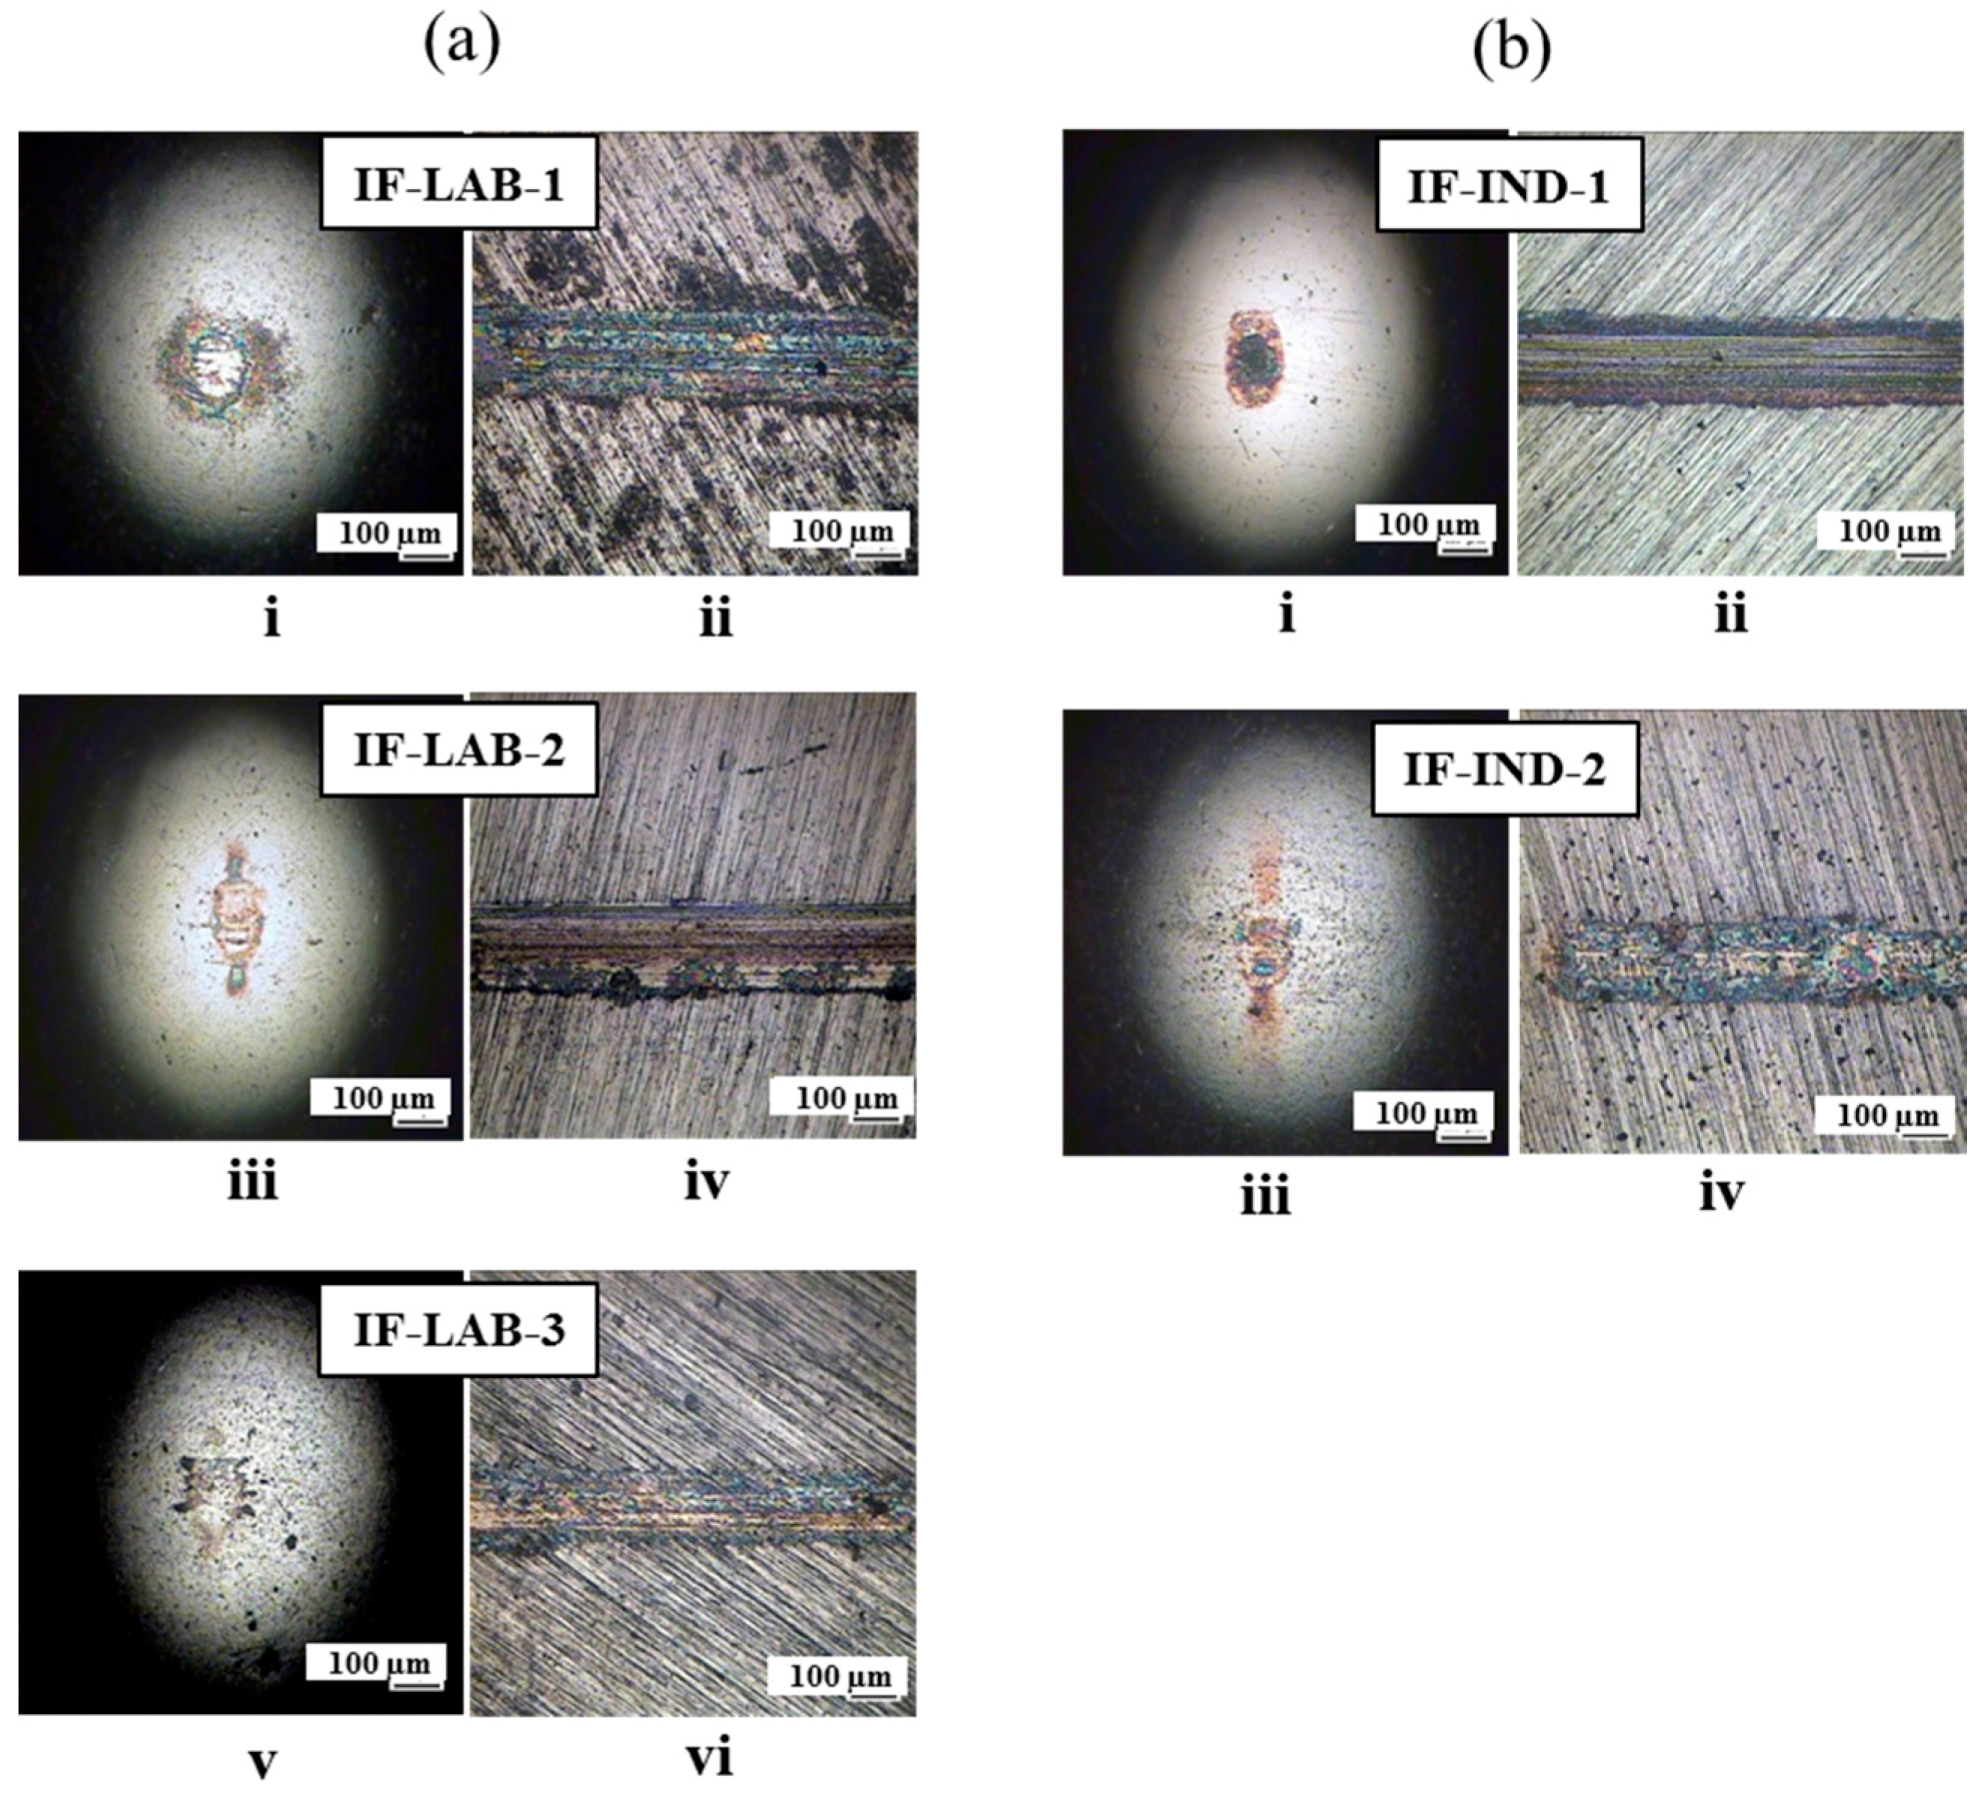
2.2. Tribological Tests
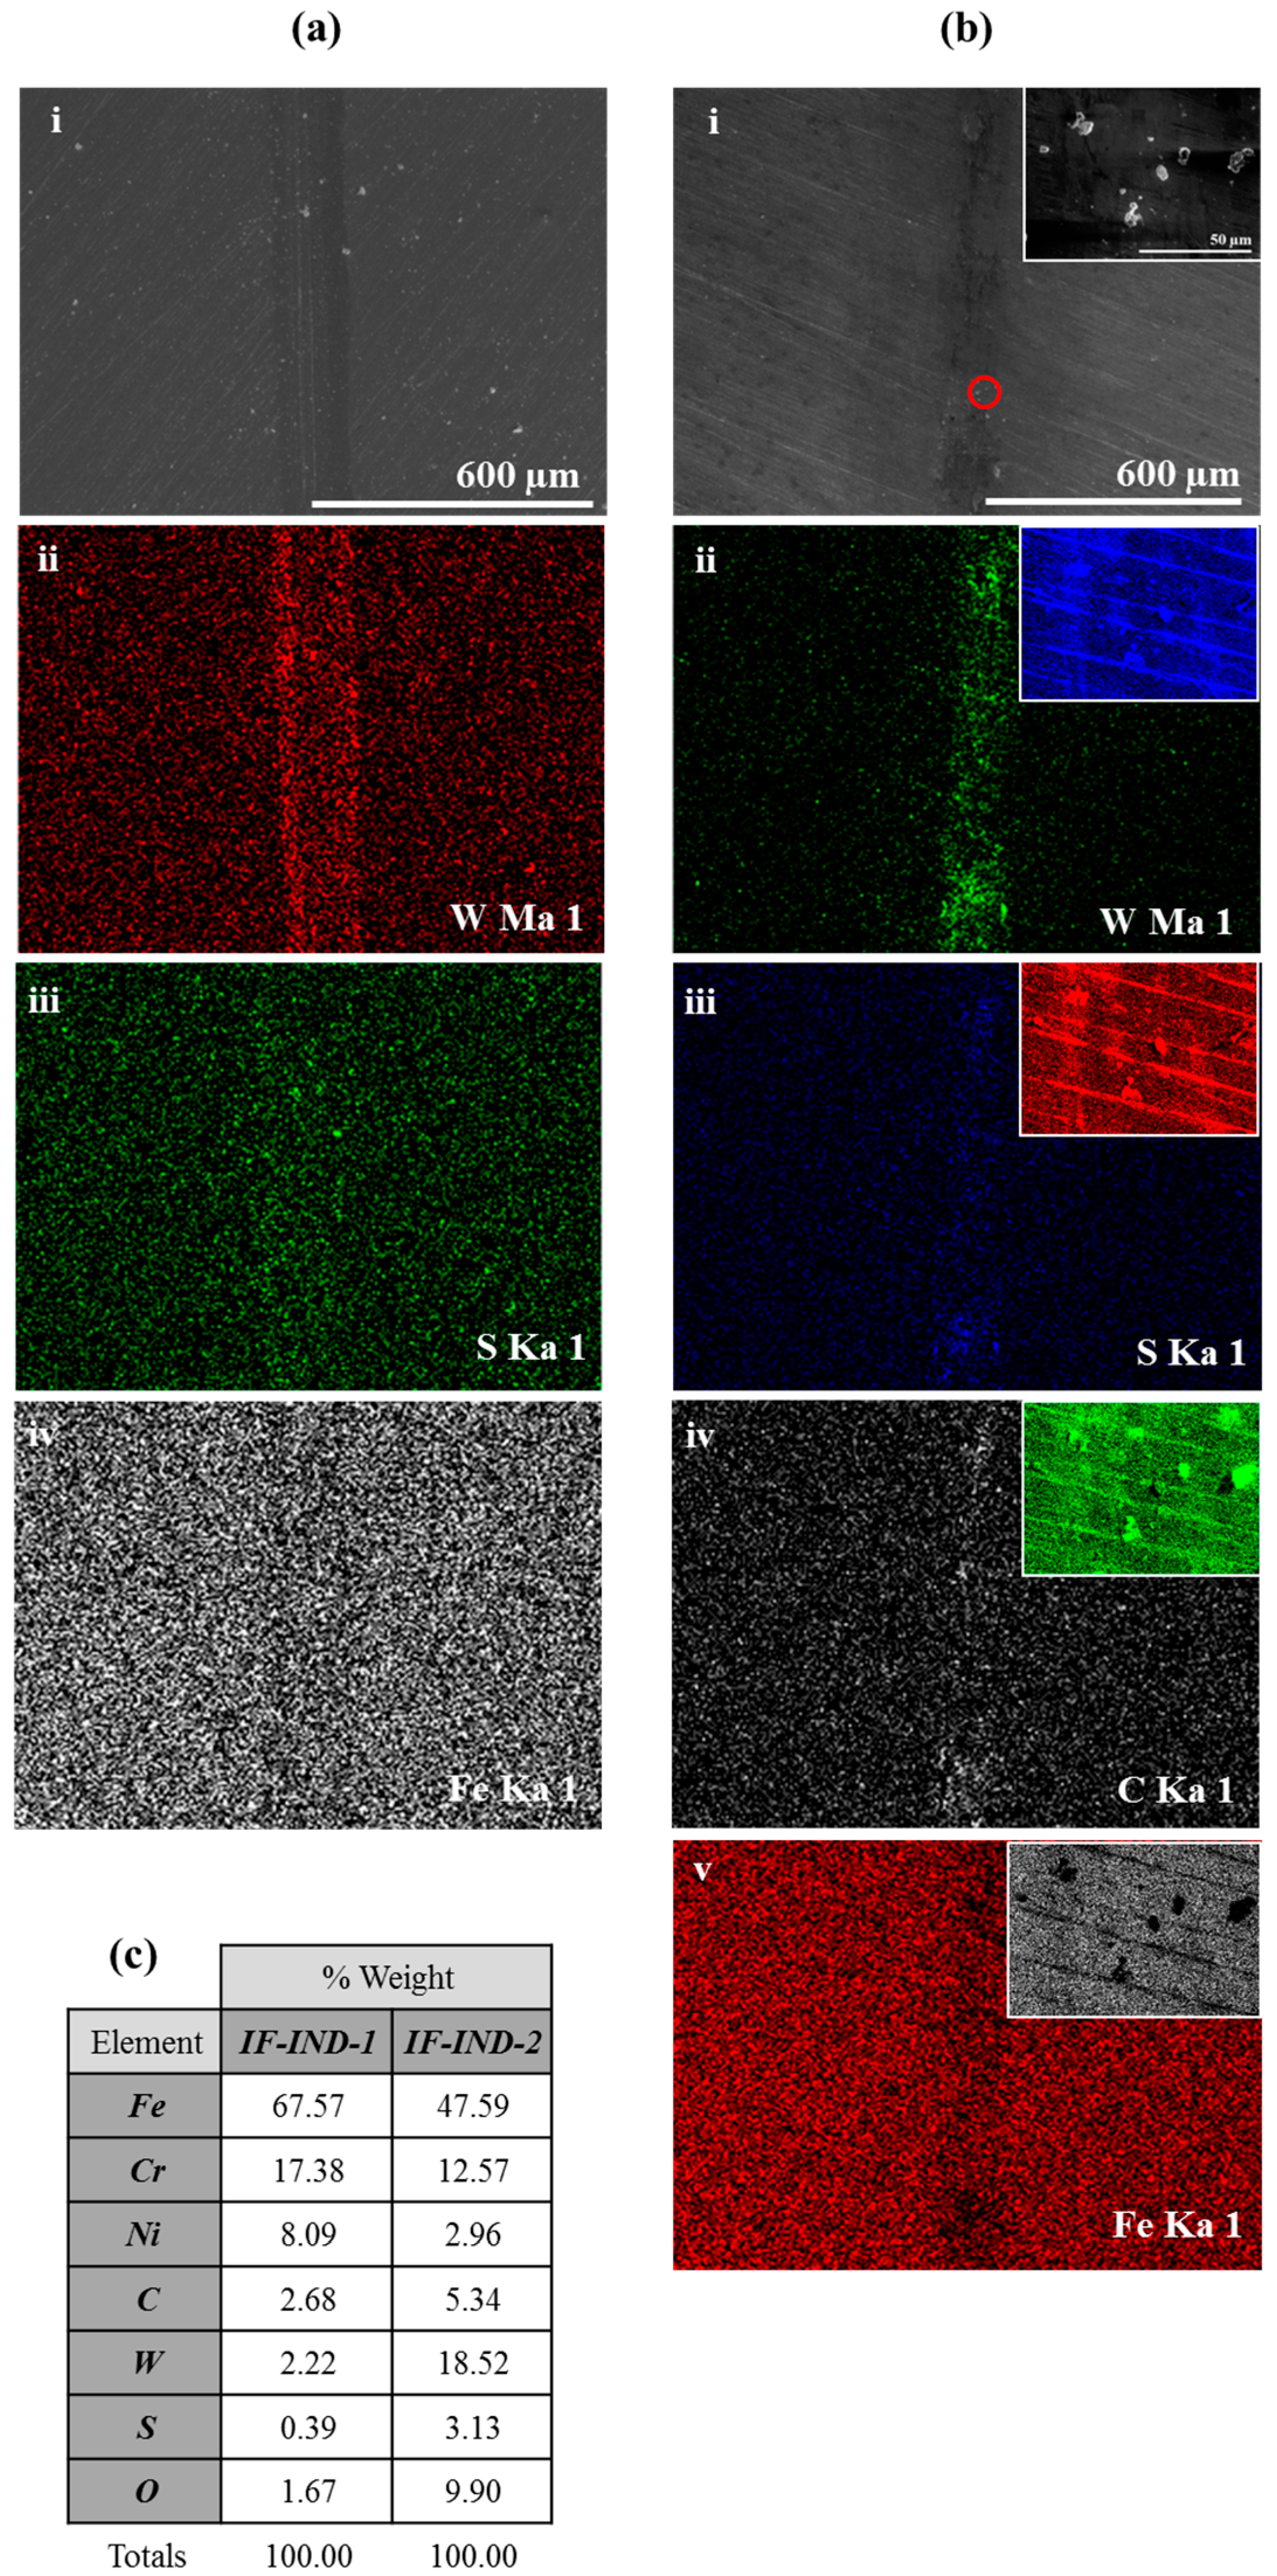
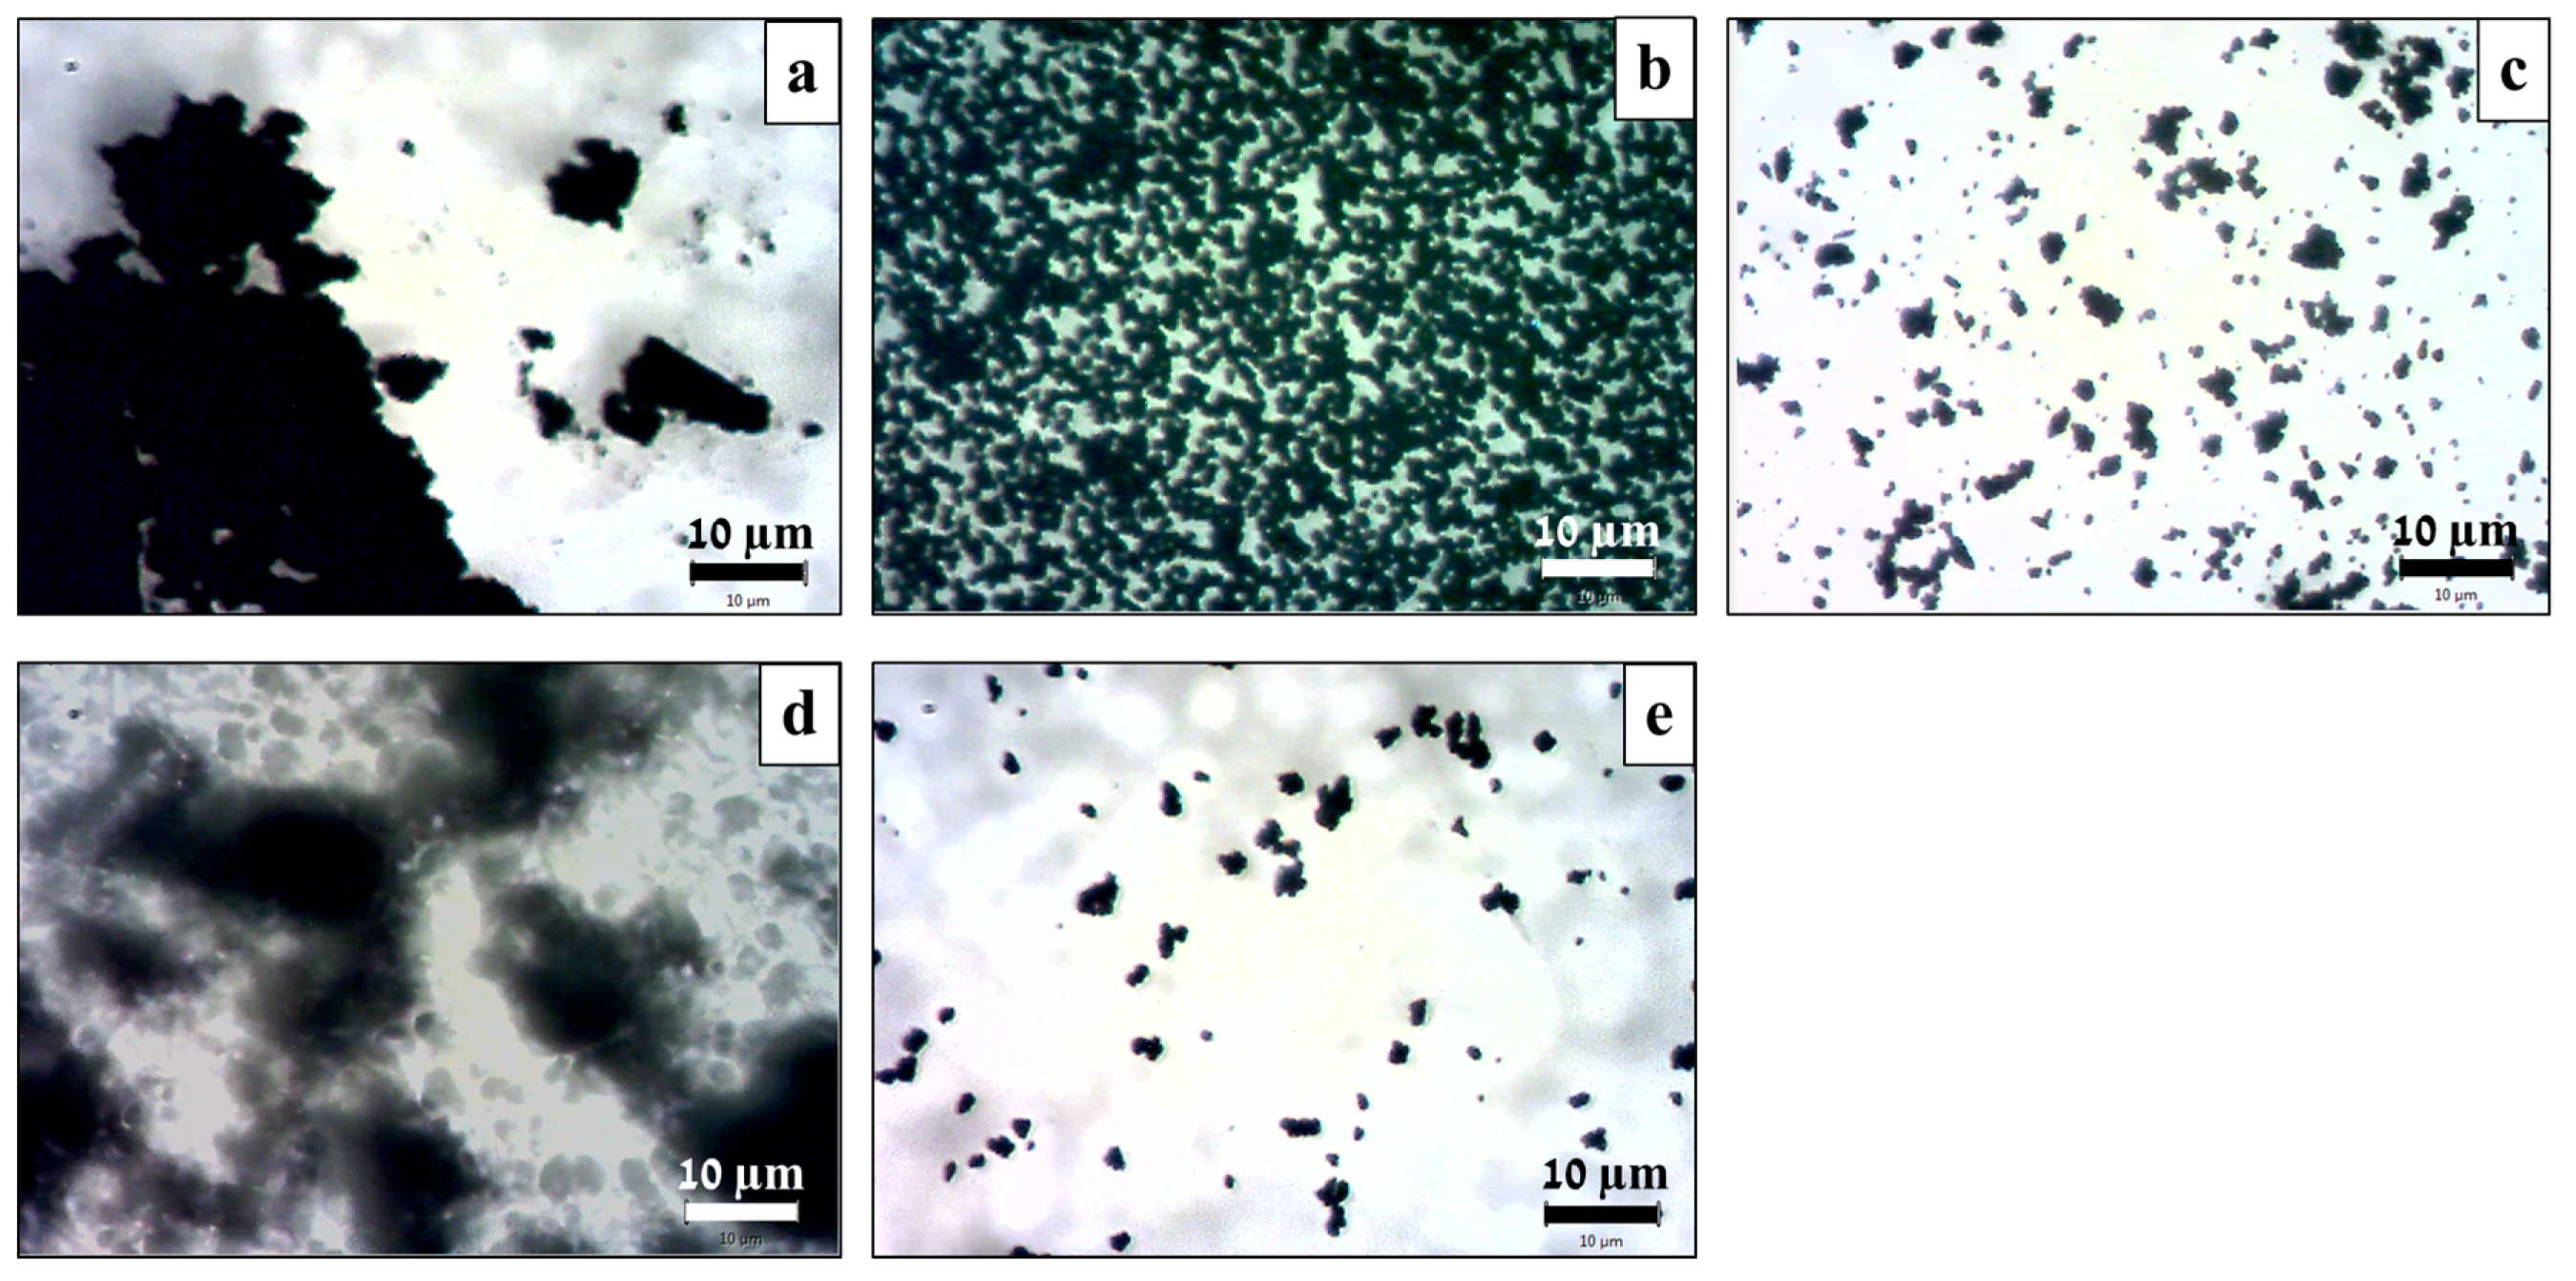
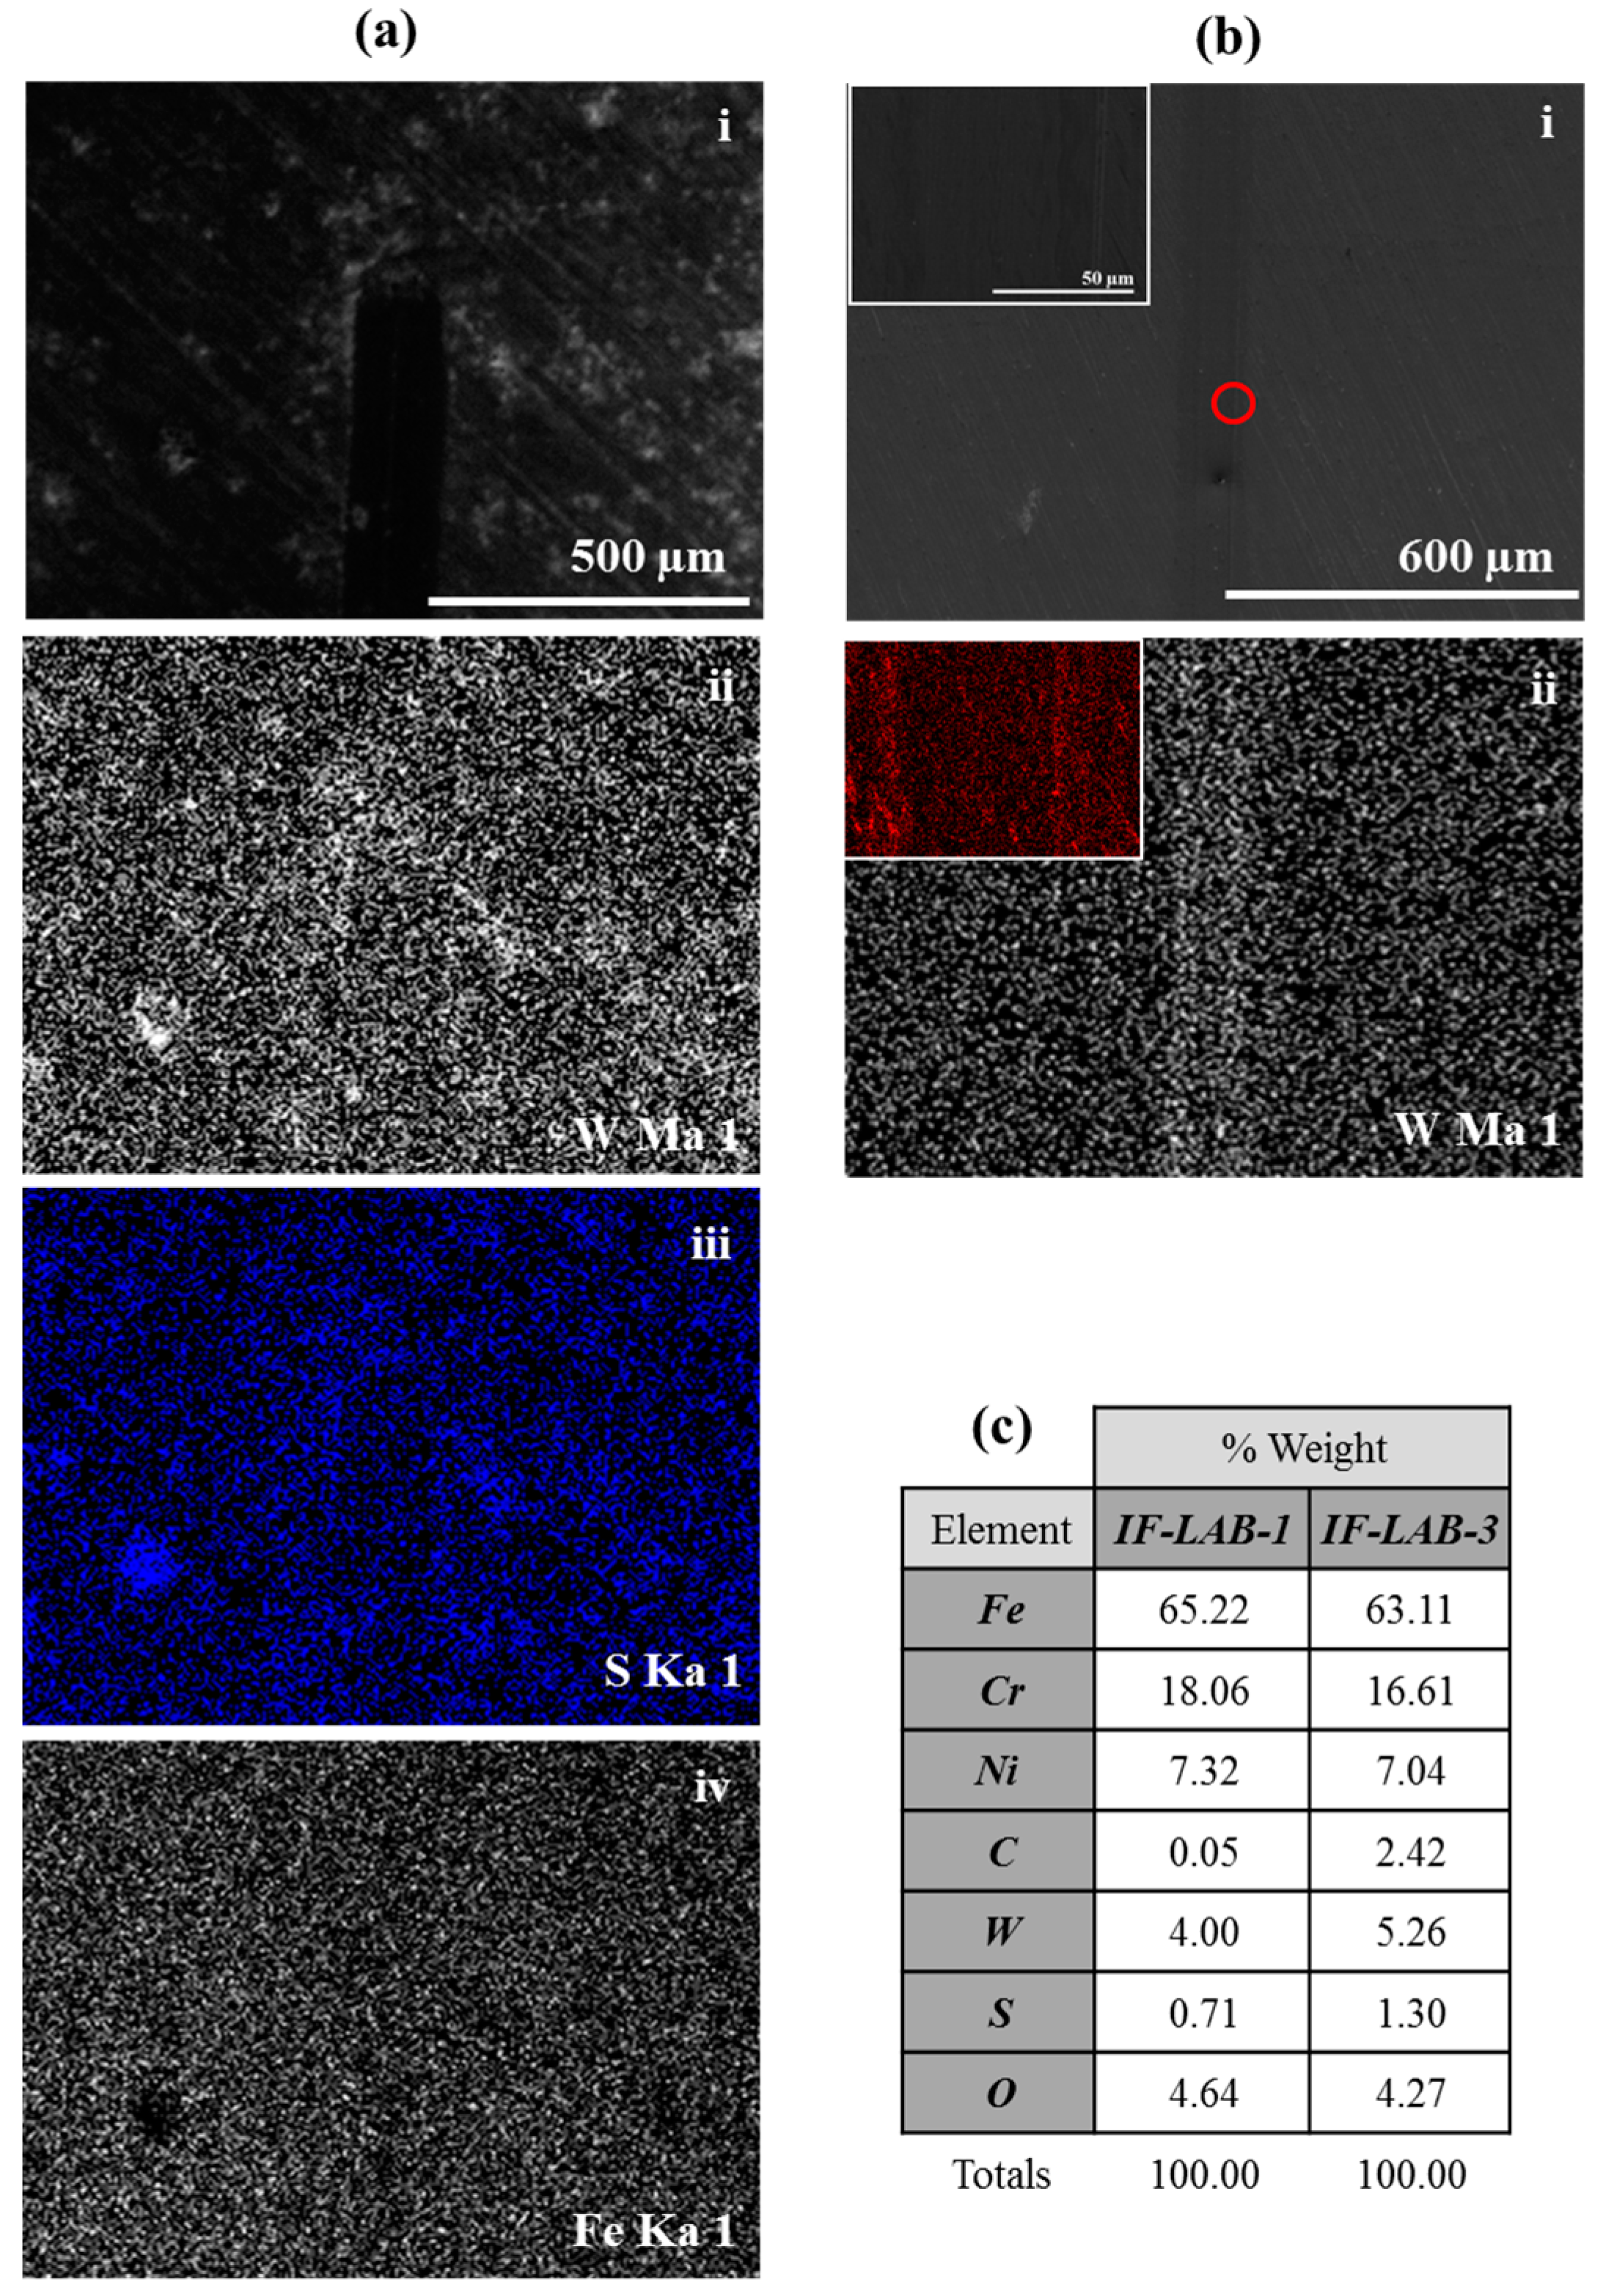
2.3. Electron Microscopy Characterizations
3. Results
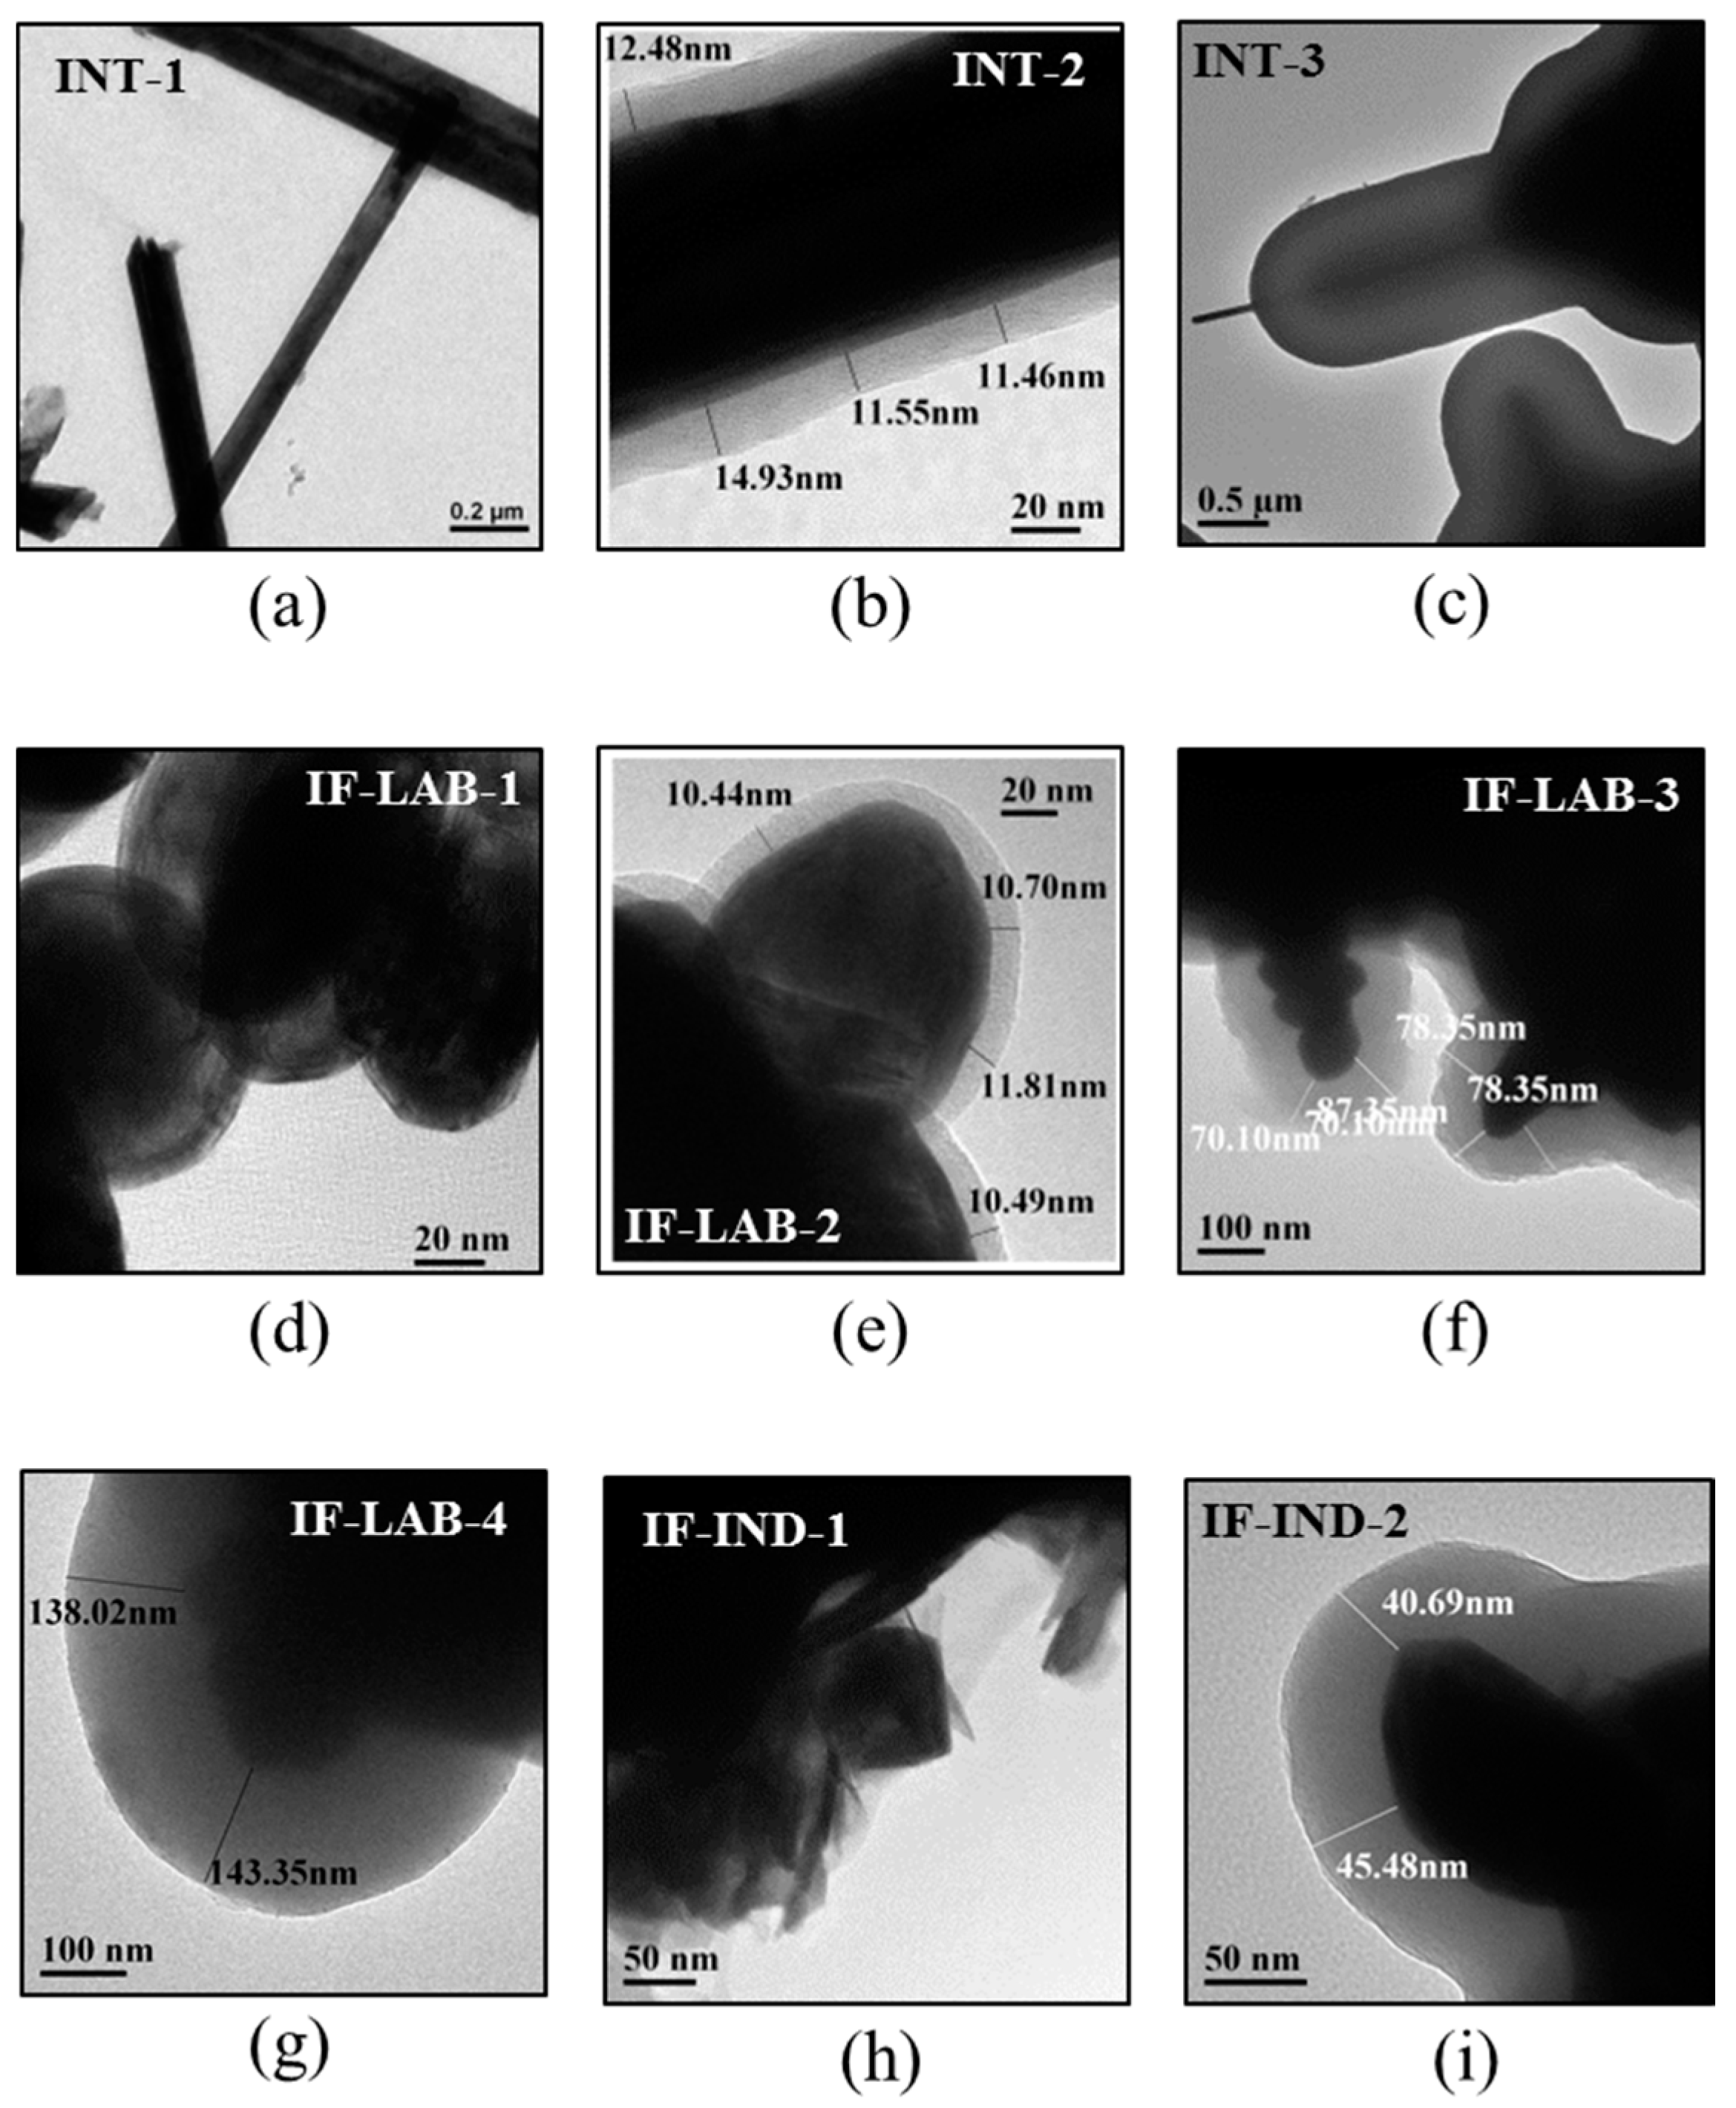
3.1. Preparation of Humin-Like Shell-Coated WS2 Nanostructures
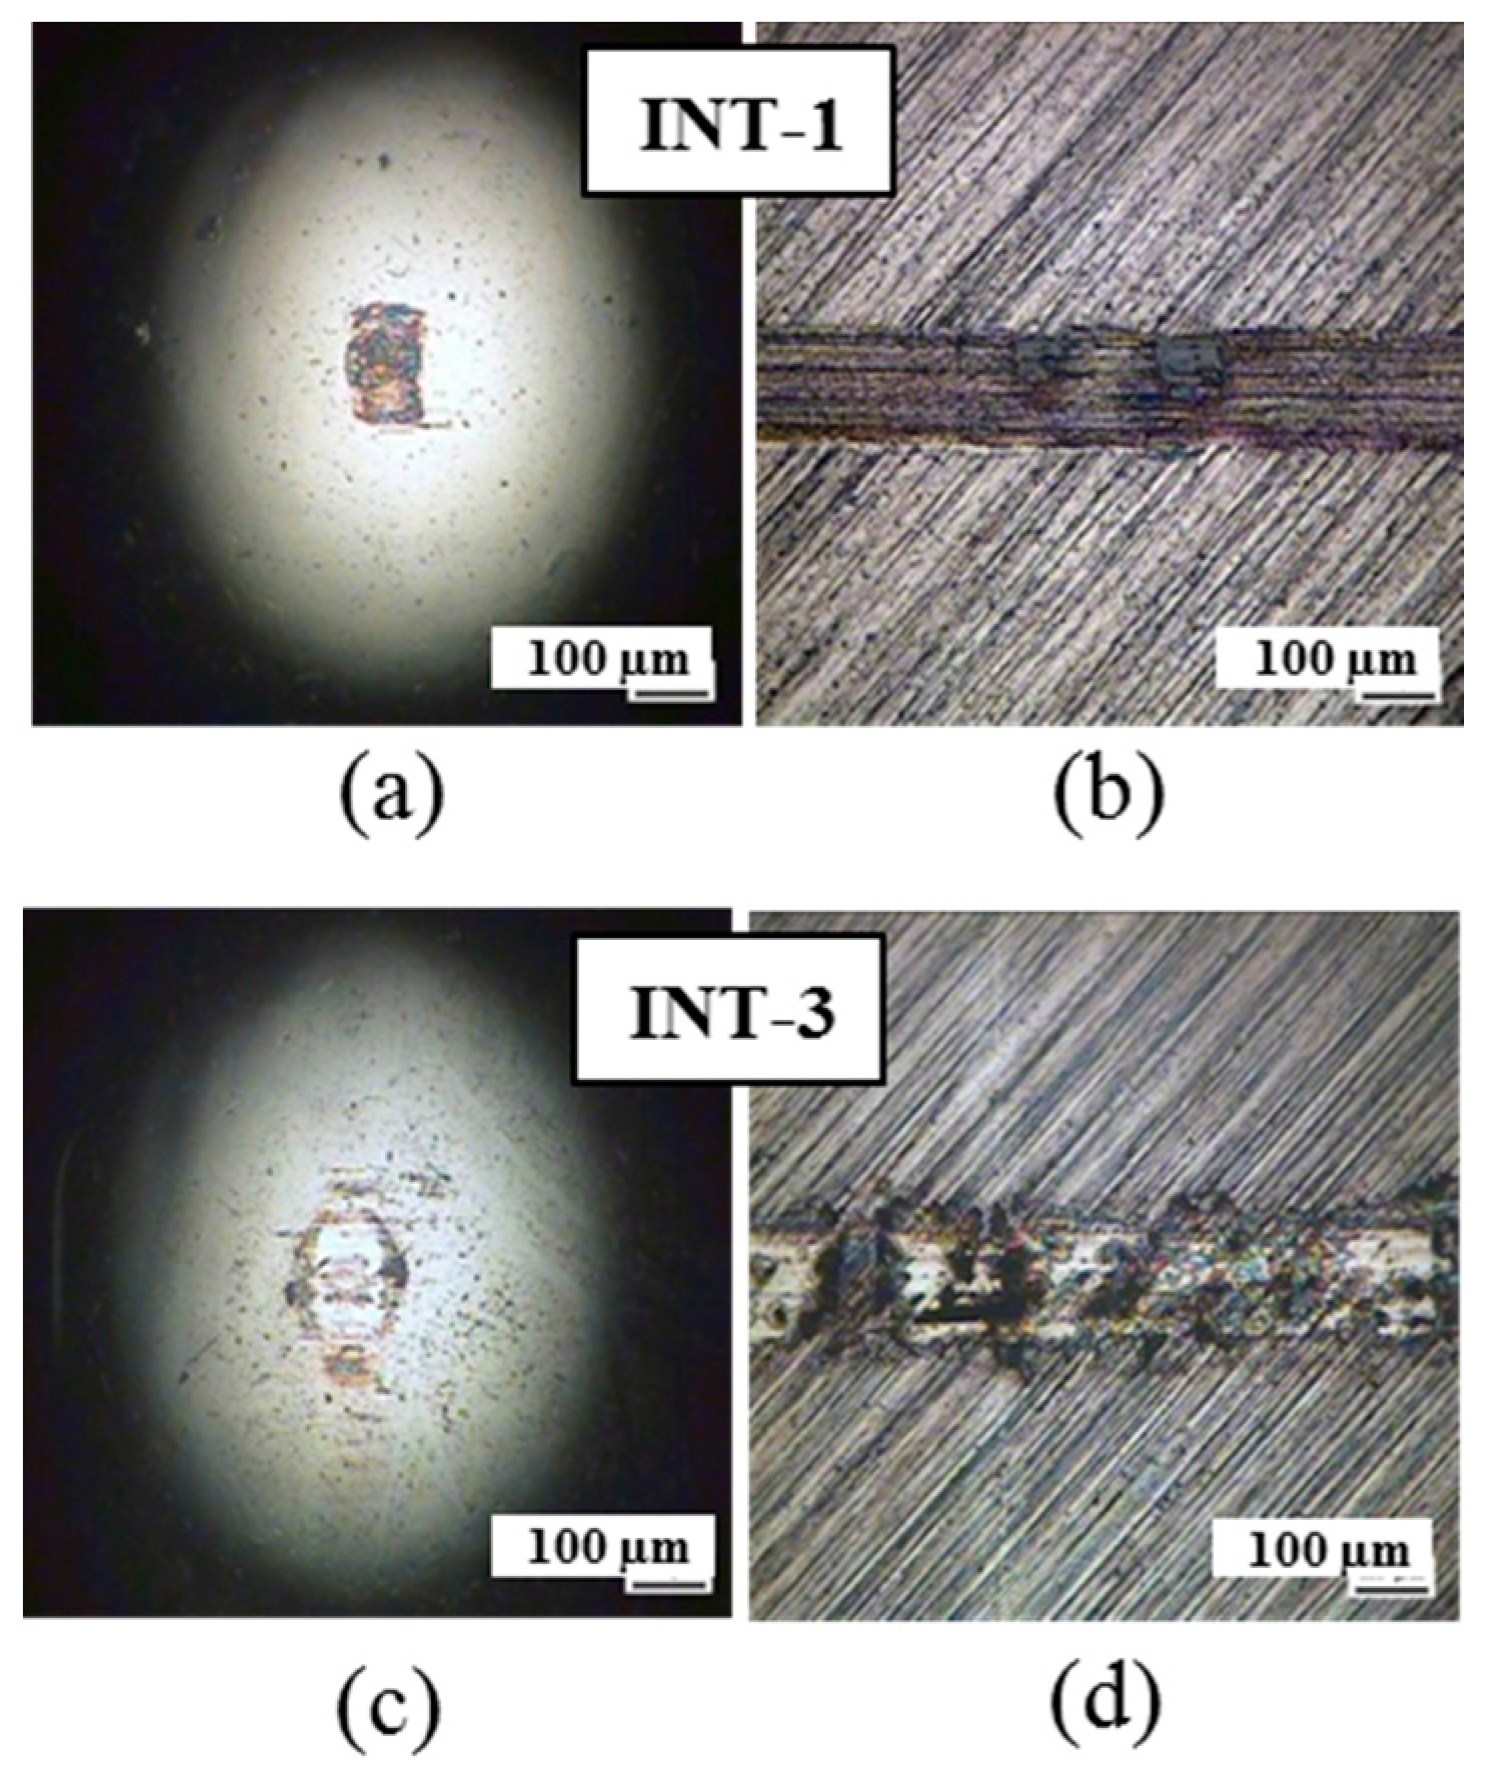
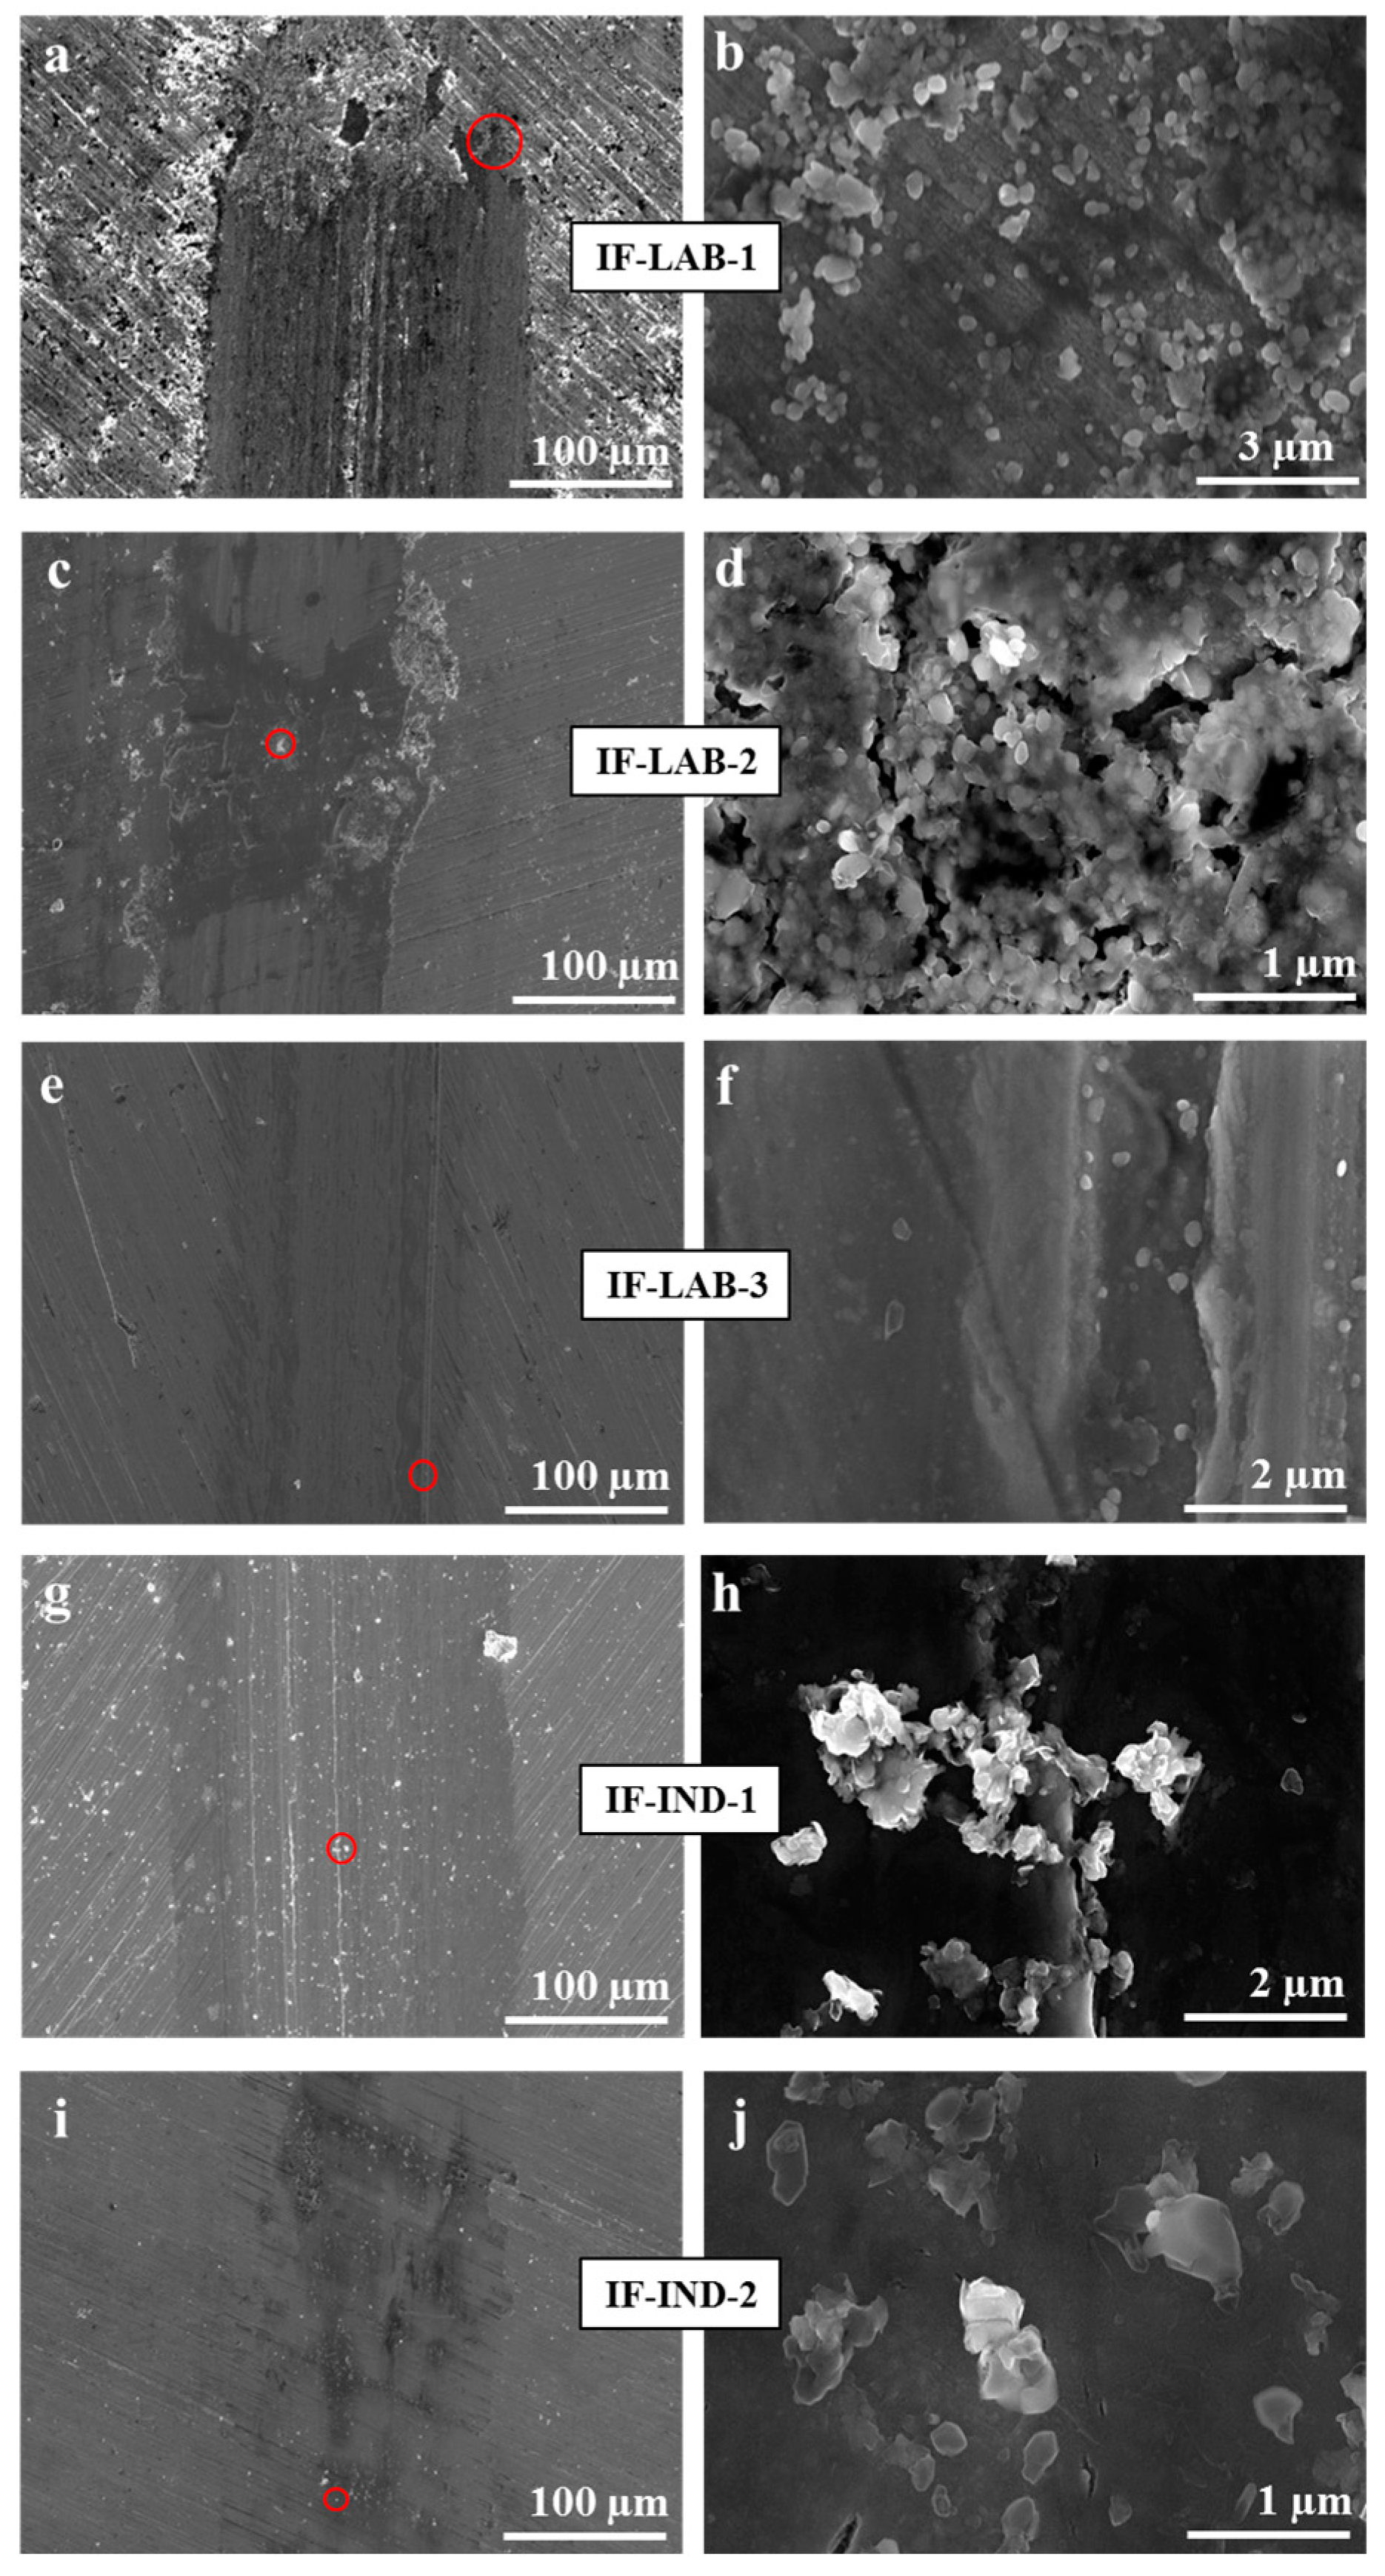
3.2. Friction and Wear Experiments
4. Discussion
5. Conclusions
- Coated WS2 INTs did not show any improved friction and wear properties compared to the non-coated ones. The reason is that the formation of a tribofilm is the dominant mechanism in friction reduction for INTs. This mechanism is assisted by exfoliation and accumulation, which are both interrupted by the presence of the coating.
- In contrast, coated WS2 IFs showed an improved ability to reduce friction and wear compared to the non-coated ones. The improved tribological properties of the coated IFs are explained by the reduced aggregation the coating provides, allowing better dispersion of the IFs in the oil phase. This leads to a better penetration of the IFs into the interface, providing easy shearing at thin surface layers. As the coating thickness increases, so too does the friction reduction provided by the NPs, because the aggregation decreases.
- Coated industrial-quality WS2 IFs, used as a PAO-4 additive, gave the best friction reduction results. This is associated with a combination of two mechanisms: the presence of pre-exfoliated walls facilitates tribofilm formation, and the disaggregating effect of the coating makes it easier for the NPs to penetrate the interface.
Acknowledgments
Author Contributions
Conflicts of Interest
References
- Tenne, R.; Margulis, L.; Genut, M.; Hodes, G. Polyhedral and cylindrical structures of tungsten disulphide. Nature 1992, 360, 444–446. [Google Scholar] [CrossRef]
- Rapoport, L.; Bilik, Y.; Feldman, Y.; Homyonfer, M.; Cohen, S.R.; Tenne, R. Hollow nanoparticles of WS2 as potential solid-state lubricants. Nature 1997, 387, 791–793. [Google Scholar] [CrossRef]
- Golan, Y.; Drummond, C.; Homyonfer, M.; Feldman, Y.; Tenne, R.; Israelachvili, J. Microtribology and Direct Force Measurement of WS2 Nested Fullerene-Like Nanostructures. Adv. Mater. 1999, 11, 934–937. [Google Scholar] [CrossRef]
- Cizaire, L.; Vacher, B.; Mogne, T.L.; Martin, J.M.; Rapoport, L.; Margolin, A.; Tenne, R. Mechanisms of ultra-low friction by hollow inorganic fullerene-like MoS2 nanoparticles. Surf. Coat. Technol. 2002, 160, 282–287. [Google Scholar] [CrossRef]
- Rapoport, L.; Leshchinsky, V.; Lapsker, I.; Volovik, Y.; Nepomnyashchy, O.; Lvovsky, M.; Popovitz-Biro, R.; Feldman, Y.; Tenne, R. Tribological properties of WS2 nanoparticles under mixed lubrication. Wear 2003, 255, 785–793. [Google Scholar] [CrossRef]
- Rapoport, L.; Leshchinsky, V.; Volovik, Y.; Lvovsky, M.; Nepomnyashchy, O.; Feldman, Y.; Popovitz-Biro, R.; Tenne, R. Modification of contact surfaces by fullerene-like solid lubricant nanoparticles. Surf. Coat. Technol. 2003, 163–164, 405–412. [Google Scholar] [CrossRef]
- Greenberg, R.; Halperin, G.; Etsion, I.; Tenne, R. The Effect of WS2 Nanoparticles on Friction Reduction in Various Lubrication Regimes. Tribol. Lett. 2004, 17, 179–186. [Google Scholar] [CrossRef]
- Joly-Pottuz, L.; Dassenoy, F.; Belin, M.; Vacher, B.; Martin, J.M.; Fleischer, N. Ultralow-friction and wear properties of IF-WS2 under boundary lubrication. Tribol. Lett. 2005, 18, 477–485. [Google Scholar] [CrossRef]
- Rapoport, L.; Leshchinsky, V.; Lvovsky, M.; Lapsker, I.; Volovik, Y.; Feldman, Y.; Popovitz-Biro, R.; Tenne, R. Superior tribological properties of powder materials with solid lubricant nanoparticles. Wear 2003, 255, 794–800. [Google Scholar] [CrossRef]
- Rapoport, L.; Nepomnyashchy, O.; Lapsker, I.; Verdyan, A.; Moshkovich, A.; Feldman, Y.; Tenne, R. Behavior of fullerene-like WS2 nanoparticles under severe contact conditions. Wear 2005, 259, 703–707. [Google Scholar] [CrossRef]
- Rosentsveig, R.; Margolin, A.; Gorodnev, A.; Popovitz-Biro, R.; Feldman, Y.; Rapoport, L.; Novema, Y.; Naveh, G.; Tenne, R. Synthesis of fullerene-like MoS2 nanoparticles and their tribological behavior. J. Mater. Chem. 2009, 19, 4368–4374. [Google Scholar] [CrossRef]
- Simić, D.; Stojanović, D.B.; Kojović, A.; Dimić, M.; Totovski, L.; Uskoković, P.S.; Aleksić, R. Inorganic fullerene-like IF-WS2/PVB nanocomposites of improved thermo-mechanical and tribological properties. Mater. Chem. Phys. 2016, 184, 335–344. [Google Scholar] [CrossRef]
- Renevier, N.; Hamphire, J.; Fox, V.C.; Witts, J.; Allen, T.; Teer, D.G. Advantages of using self-lubricating, hard, wear-resistant MoS2-based coatings. Surf. Coat. Technol. 2001, 142, 67–77. [Google Scholar] [CrossRef]
- Katz, A.; Redlich, M.; Rapoport, L.; Wagner, H.D.; Tenne, R. Self-lubricating coatings containing fullerene-like WS2 nanoparticles for orthodontic wires and other possible medical applications. Tribol. Lett. 2006, 21, 135–139. [Google Scholar] [CrossRef]
- Alberdi, A.; Hatto, P.; Díaz, B.; Csillag, S. Tribological behavior of nanocomposite coatings based on fullerene-like structures. Vacuum 2011, 85, 1087–1092. [Google Scholar] [CrossRef]
- André, B.; Gustavsson, F.; Svahn, F.; Jacobson, S. Performance and tribofilm formation of a low-friction coating incorporating inorganic fullerene like nano-particles. Surf. Coat. Technol. 2012, 206, 2325–2329. [Google Scholar] [CrossRef]
- Gustavsson, F.; Svahn, F.; Bexell, U.; Jacobson, S. Nanoparticle based and sputtered WS2 low-friction coatings—Differences and similarities with respect to friction mechanisms and tribofilm formation. Surf. Coat. Technol. 2013, 232, 616–626. [Google Scholar] [CrossRef]
- Moshkovith, A.; Perfiliev, V.; Lapsker, I.; Fleischer, N.; Tenne, R.; Rapoport, L. Friction of fullerene-like WS2 nanoparticles: Effect of agglomeration. Tribol. Lett. 2006, 24, 225–228. [Google Scholar] [CrossRef]
- Kogovšek, J.; Kalin, M. Various MoS2-, WS2- and C-Based Micro- and Nanoparticles in Boundary Lubrication. Tribol. Lett. 2014, 53, 585–597. [Google Scholar] [CrossRef]
- Rapoport, L.; Nepomnyashchy, O.; Lapsker, I.; Verdyan, A.; Soifer, Y.; Popovitz-Biro, R.; Tenne, R. Friction and wear of fullerene-like WS2 under severe contact conditions: Friction of ceramic materials. Tribol. Lett. 2005, 19, 143–149. [Google Scholar] [CrossRef]
- Stefanov, M.; Enyashin, A.N.; Heine, T.; Seifert, G. Nanolubrication: How do MoS2-based nanostructures lubricate? J. Phys. Chem. C 2008, 112, 17764–17767. [Google Scholar] [CrossRef]
- Lahouij, I.; Dassenoy, F.; de Knoop, L.; Martin, J.; Vacher, B. In Situ TEM Observation of the Behavior of an Individual Fullerene-Like MoS2 Nanoparticle in a Dynamic Contact. Tribol. Lett. 2011, 42, 133–140. [Google Scholar] [CrossRef]
- Tannous, J.; Dassenoy, F.; Lahouij, I.; Le Mogne, T.; Vacher, B.; Bruhács, A.; Tremel, W. Understanding the tribochemical mechanisms of IF-MoS 2 nanoparticles under boundary lubrication. Tribol. Lett. 2011, 41, 55–64. [Google Scholar] [CrossRef]
- Dai, W.; Kheireddin, B.; Gao, H.; Liang, H. Roles of nanoparticles in oil lubrication. Tribol. Int. 2016, 102, 88–98. [Google Scholar] [CrossRef]
- Rabaso, P.; Ville, F.; Dassenoy, F.; Diaby, M.; Afanasiev, P.; Cavoret, J.; Vacher, B.; Le-Mogne, T. Boundary lubrication: Influence of the size and structure of inorganic fullerene-like MoS2 nanoparticles on friction and wear reduction. Wear 2014, 320, 161–178. [Google Scholar] [CrossRef]
- Lahouij, I.; Bucholz, E.W.; Vacher, B.; Sinnott, S.B.; Martin, J.M.; Dassenoy, F. Lubrication mechanisms of hollow-core inorganic fullerene-like nanoparticles: Coupling experimental and computational works. Nanotechnology 2012, 23, 375701. [Google Scholar] [CrossRef] [PubMed]
- Tevet, O.; Von-Huth, P.; Popovitz-Biro, R.; Rosentsveig, R.; Wagner, H.D.; Tenne, R. Friction mechanism of individual multilayered nanoparticles. Proc. Natl. Acad. Sci. USA 2011, 108, 19901–19906. [Google Scholar] [CrossRef] [PubMed]
- Schwarz, U.S.; Komura, S.; Safran, S.A. Deformation and tribology of multi-walled hollow nanoparticles. EPL Europhys. Lett. 2000, 50, 762. [Google Scholar] [CrossRef]
- Hsu, W.K.; Zhu, Y.Q.; Boothroyd, C.B.; Kinloch, I.; Trasobares, S.; Terrones, H.; Grobert, N.; Terrones, M.; Escudero, R.; Chen, G.Z.; et al. Mixed-Phase WxMoyCzS2 Nanotubes. Chem. Mater. 2000, 12, 3541–3546. [Google Scholar] [CrossRef]
- Hsu, W.K.; Zhu, Y.Q.; Yao, N.; Firth, S.; Clark, R.J.H.; Kroto, H.W.; Walton, D.R.M. Titanium-Doped Molybdenum Disulfide Nanostructures. Adv. Funct. Mater. 2001, 11, 69–74. [Google Scholar] [CrossRef]
- Zhu, Y.Q.; Hsu, W.K.; Firth, S.; Terrones, M.; Clark, R.J.H.; Kroto, H.W.; Walton, D.R.M. Nb-doped WS2 nanotubes. Chem. Phys. Lett. 2001, 342, 15–21. [Google Scholar] [CrossRef]
- Deepak, F.L.; Popovitz-Biro, R.; Feldman, Y.; Cohen, H.; Enyashin, A.; Seifert, G.; Tenne, R. Fullerene-like Mo(W)1−xRexS2 Nanoparticles. Chem. Asian J. 2008, 3, 1568–1574. [Google Scholar] [CrossRef] [PubMed]
- Tannous, J.; Dassenoy, F.; Bruhács, A.; Tremel, W. Synthesis and Tribological Performance of Novel Mox W1−x S2 (0 ≤ x ≤ 1) Inorganic Fullerenes. Tribol. Lett. 2010, 37, 83–92. [Google Scholar] [CrossRef]
- Rapoport, L.; Moshkovich, A.; Perfilyev, V.; Laikhtman, A.; Lapsker, I.; Yadgarov, L.; Rosentsveig, R.; Tenne, R. High Lubricity of Re-Doped Fullerene-Like MoS2 Nanoparticles. Tribol. Lett. 2012, 45, 257–264. [Google Scholar] [CrossRef]
- Cammarata, A.; Polcar, T. Tailoring Nanoscale Friction in MX2 Transition Metal Dichalcogenides. Inorg. Chem. 2015, 54, 5739–5744. [Google Scholar] [CrossRef] [PubMed]
- Shahar, C.; Zbaida, D.; Rapoport, L.; Cohen, H.; Bendikov, T.; Tannous, J.; Dassenoy, F.; Tenne, R. Surface Functionalization of WS2 Fullerene-like Nanoparticles. Langmuir 2009, 26, 4409–4414. [Google Scholar] [CrossRef] [PubMed]
- Yegin, C.; Lu, W.; Kheireddin, B.; Zhang, M.; Li, P.; Min, Y.; Sue, H.-J.; Sari, M.; Akbulut, M. The Effect of Nanoparticle Functionalization on Lubrication Performance of Nanofluids Dispersing Silica Nanoparticles in an Ionic Liquid. J. Tribol. 2016, 139, 041802. [Google Scholar] [CrossRef]
- Sade, H.; Lellouche, J.-P. Functionalization of Tungsten Disulfide Nanotubes with a Conformal Humin-Like Shell. Adv. Mater. Interfaces 2016, 3. [Google Scholar] [CrossRef]
- Moshkovith, A.; Perfiliev, V.; Verdyan, A.; Lapsker, I.; Popovitz-Biro, R.; Tenne, R.; Rapoport, L. Sedimentation of IF-WS2 aggregates and a reproducibility of the tribological data. Tribol. Int. 2007, 40, 117–124. [Google Scholar] [CrossRef]
- Kalin, M.; Kogovšek, J.; Remškar, M. Mechanisms and improvements in the friction and wear behavior using MoS2 nanotubes as potential oil additives. Wear 2012, 280, 36–45. [Google Scholar] [CrossRef]
- Martin, J.M.; Ohmae, N. Nanolubricants; Wiley: New York, NY, USA, 2008. [Google Scholar]
- Lahouij, I.; Vacher, B.; Martin, J.-M.; Dassenoy, F. IF-MoS2 based lubricants: Influence of size, shape and crystal structure. Wear 2012, 296, 558–567. [Google Scholar] [CrossRef]


| Sample Name | WS2 INTs/IFs | Glucose Pentaacetate | BF3·Et2O | ||||
|---|---|---|---|---|---|---|---|
| g | mole | Batch | g | mole | mL | mole | |
| INT-1 | TWPO-MA018 | Non-coated | |||||
| INT-2 | 1.00 | 4.03 | TWPO-MA018 | 4.71 | 0.012 | 3.0 | 0.032 |
| INT-3 | 1.00 | 4.03 | TWPO-MA018 | 9.42 | 0.024 | 6.0 | 0.064 |
| IF-LAB-1 | FWPO-HC019 | Non-coated | |||||
| IF-LAB-2 | 1.00 | 4.03 | FWPO-HC019 | 4.71 | 0.012 | 3.0 | 0.032 |
| IF-LAB-3 | 1.00 | 4.03 | FWPO-HC019 | 6.30 | 0.016 | 4.0 | 0.043 |
| IF-LAB-4 | 1.00 | 4.03 | FWPO-HC019 | 9.42 | 0.024 | 6.0 | 0.064 |
| IF-IND-1 | 3A01-00043 | Non-coated | |||||
| IF-IND-2 | 1.00 | 4.03 | 3A01-00043 | 6.30 | 0.016 | 4.0 | 0.064 |
| Sample Name | CoF | Track Width, µm |
|---|---|---|
| PAO-4 | 0.170 ± 0.020 | 235 ± 15 |
| INT-1 | 0.085 ± 0.005 | 122 ± 10 |
| INT-2 | 0.090 ± 0.005 | 170 ± 2 |
| INT-3 | 0.11 ± 0.01 | 131 ± 4 |
| IF-LAB-1 | 0.085 ± 0.010 | 150 ± 11 |
| IF-LAB-2 | 0.090 ± 0.005 | 133 ± 7 |
| IF-LAB-3 | 0.090 ± 0.005 | 112 ± 12 |
| IF-LAB-4 | 0.085 ± 0.005 | 104 ± 7 |
| IF-IND-1 | 0.09 ± 0.01 | 134 ± 30 |
| IF-IND-2 | 0.075 ± 0.005 | 70 ± 5 |
© 2018 by the authors. Licensee MDPI, Basel, Switzerland. This article is an open access article distributed under the terms and conditions of the Creative Commons Attribution (CC BY) license (http://creativecommons.org/licenses/by/4.0/).
Share and Cite
Sade, H.; Moshkovich, A.; Lellouche, J.-P.; Rapoport, L. Testing of WS2 Nanoparticles Functionalized by a Humin-Like Shell as Lubricant Additives. Lubricants 2018, 6, 3. https://doi.org/10.3390/lubricants6010003
Sade H, Moshkovich A, Lellouche J-P, Rapoport L. Testing of WS2 Nanoparticles Functionalized by a Humin-Like Shell as Lubricant Additives. Lubricants. 2018; 6(1):3. https://doi.org/10.3390/lubricants6010003
Chicago/Turabian StyleSade, Hagit, Alexey Moshkovich, Jean-Paul Lellouche, and Lev Rapoport. 2018. "Testing of WS2 Nanoparticles Functionalized by a Humin-Like Shell as Lubricant Additives" Lubricants 6, no. 1: 3. https://doi.org/10.3390/lubricants6010003
APA StyleSade, H., Moshkovich, A., Lellouche, J.-P., & Rapoport, L. (2018). Testing of WS2 Nanoparticles Functionalized by a Humin-Like Shell as Lubricant Additives. Lubricants, 6(1), 3. https://doi.org/10.3390/lubricants6010003