Abstract
With the increasing pressure to reduce emissions, friction reduction is always an up-to-date topic in the automotive industry. Among the various possibilities to reduce mechanical friction, the usage of a low-viscosity lubricant in the engine is one of the most effective and most economic options. Therefore, lubricants of continuously lower viscosity are being developed and offered on the market that promise to reduce engine friction while avoiding deleterious mixed lubrication and wear. In this work, a 1.6 L downsized Diesel engine is used on a highly accurate engine friction test-rig to determine the potential for friction reduction using low viscosity lubricants under realistic operating conditions including high engine loads. In particular, two hydrocarbon-based lubricants, 0W30 and 0W20, are investigated as well as a novel experimental lubricant, which is based on a polyalkylene glycol base stock. Total engine friction is measured for all three lubricants, which show a general 5% advantage for the 0W20 in comparison to the 0W30 lubricant. The polyalkylene glycol-based lubricant, however, shows strongly reduced friction losses, which are about 25% smaller than for the 0W20 lubricant. As the 0W20 and the polyalkylene glycol-based lubricant have the same HTHS-viscosity , the findings contradict the common understanding that the HTHS-viscosity is the dominant driver related to the friction losses.
1. Introduction
With increasingly strict worldwide emission legislation, the automotive industry is always on the quest to optimize the efficiency of the powertrain. Friction reduction is one of the most efficient ways to reduce fuel consumption and emissions [1,2]. Therefore, continuously lower viscosity lubricants are being developed and offered on the market that promise to reduce engine friction while avoiding deleterious mixed lubrication and wear. Common hydrocarbon-based lubricants have been used and investigated in the automotive sector for many decades [3,4,5,6,7,8]. However, it appears that the even lower viscosities targeted for the near future might bring hydrocarbon-based lubricants to their limits [9]. For example, besides the obvious increased risk of mixed lubrication due to the lower viscosity, the higher volatility of lower viscosity lubricants can lead to disadvantageous increased oil consumption of the engine. Several alternative lubricant chemistries are currently being developed specifically for low viscosity engine lubrication such as ionic liquids [10] and polyalkylene glycol based [11,12] lubricants. Despite the apparent large difference of 25% and more in the lubricant viscosities (see Table 1), the corresponding effect on engine friction is much smaller [13,14,15] and highly accurate test-rigs are required to measure the benefit of the individual lubricants experimentally.

Table 1.
Basic rheological properties of the tested lubricants.
In this study, two hydrocarbon-based multi grade lubricants (0W30, 0W20) are investigated related to their potential to reduce engine friction. In addition, one of the new experimental lubricants, namely a polyalkylene glycol-based oil, is tested for comparison. For a discussion of this uncommon lubricant class, the authors refer to [11,12,16,17]. These lubricants are tested on a highly accurate engine test-rig using a downsized Diesel engine under a large range of operating conditions including high load operation. The same polyalkylene glycol lubricant has been tested recently for use in an automotive engine [16]. In comparison to their work, the present work is the first to actually test this lubricant under an applied engine load, which generates considerably higher stresses in the lubricated contacts.
2. Testing
In the following, the engine friction test-rig, the investigated lubricants and the engine under test are discussed.
2.1. The Dynamometer
For the measurements, a pressurized motoring test-rig has been used. In contrast to fired engine operation, the pressurized motoring test-rig supplies air under pressure to the engine intake. In combination with the intrinsic compression of the engine, realistic peak cylinder pressures of up to 200 bar can be realized in the combustion chamber [18,19,20]. This method has the major advantage of much higher measurement accuracy compared to fired engine tests. The main reason for the improved accuracy is the strongly reduced (by a factor of about 4) indicated mean effective pressure (IMEP) in comparison to fired operation. Therefore, torque transducers with a much smaller measurement range and, consequently, much higher absolute accuracy can be used. In fired engine tests, not only cooled piezoelectric sensors and special cylinder heads are required, but also the variations between individual combustion cycles can be very large. In particular, this applies to Gasoline engines, where it is common to see more than 20% variation in peak cylinder pressure from cycle to cycle. The main drawback of pressurized motoring is the different thermal situation in the piston assembly. However, a direct comparison of friction measurements for the same Diesel engine in fired operation and pressurized motoring showed very similar results [19].
The pressurized motoring technique uses the well known IMEP-method to determine the friction mean effective pressure (FMEP) by subtracting the brake mean effective pressure (BMEP),
with the minor difference being that the signs of the IMEP and BMEP are negative in comparison to fired engine operation. When using the IMEP-Method to investigate the friction losses of an engine, it is essential to determine two quantities, the indicated power and the brake power of the engine with the highest possible accuracy. The reason for this is that IMEP and BMEP are two large and very similarly sized quantities, which are subtracted from each other to determine a rather small difference (FMEP). Therefore, any significant error in the determination of the BMEP and IMEP can easily lead to a measurement error of the same magnitude as the to-be-determined FMEP.
Practically, the IMEP is measured using piezoelectric sensors in the combustion chamber. However, the BMEP cannot be measured directly as pressure, but is commonly measured as brake torque. The following equation relates the mean effective pressure to the corresponding torque T,
where W refers to the work per cycle and to the volume displacement of the investigated 4-stroke engine.
At the friction dynamometer test-rig, a highly accurate torque measurement system (HBM T12) with a built-in engine speed sensor is used for the brake torque and engine speed measurement. For the IMEP determination, it is essential to determine the position of the (firing) top dead center (TDC) of the piston with great precision. For this task, a capacitive TDC-sensor (AVL OT428) is used to ensure a high accuracy TDC determination. Ideally, the TDC determination should be done for every operating condition as the engine load and even the oil temperature influences the exact position of the top dead center. A common compromise is to perform TDC determination for an important operating condition, so the TDC is determined for an engine speed of 2500 rpm.
Oil and coolant of the engine under test are provided externally. The temperature and pressure of the supplied oil and coolant are very well stabilized and vary considerably less than the nominal accuracy of the used sensors: for the temperature measurements, thermocouples of type K with an accuracy of about ±0.5 C are used. The employed pressure sensors have an accuracy of about ±0.05 bar. The cylinder pressure is measured in all cylinders using piezoelectric pressure sensors.
2.2. The Tested Lubricants
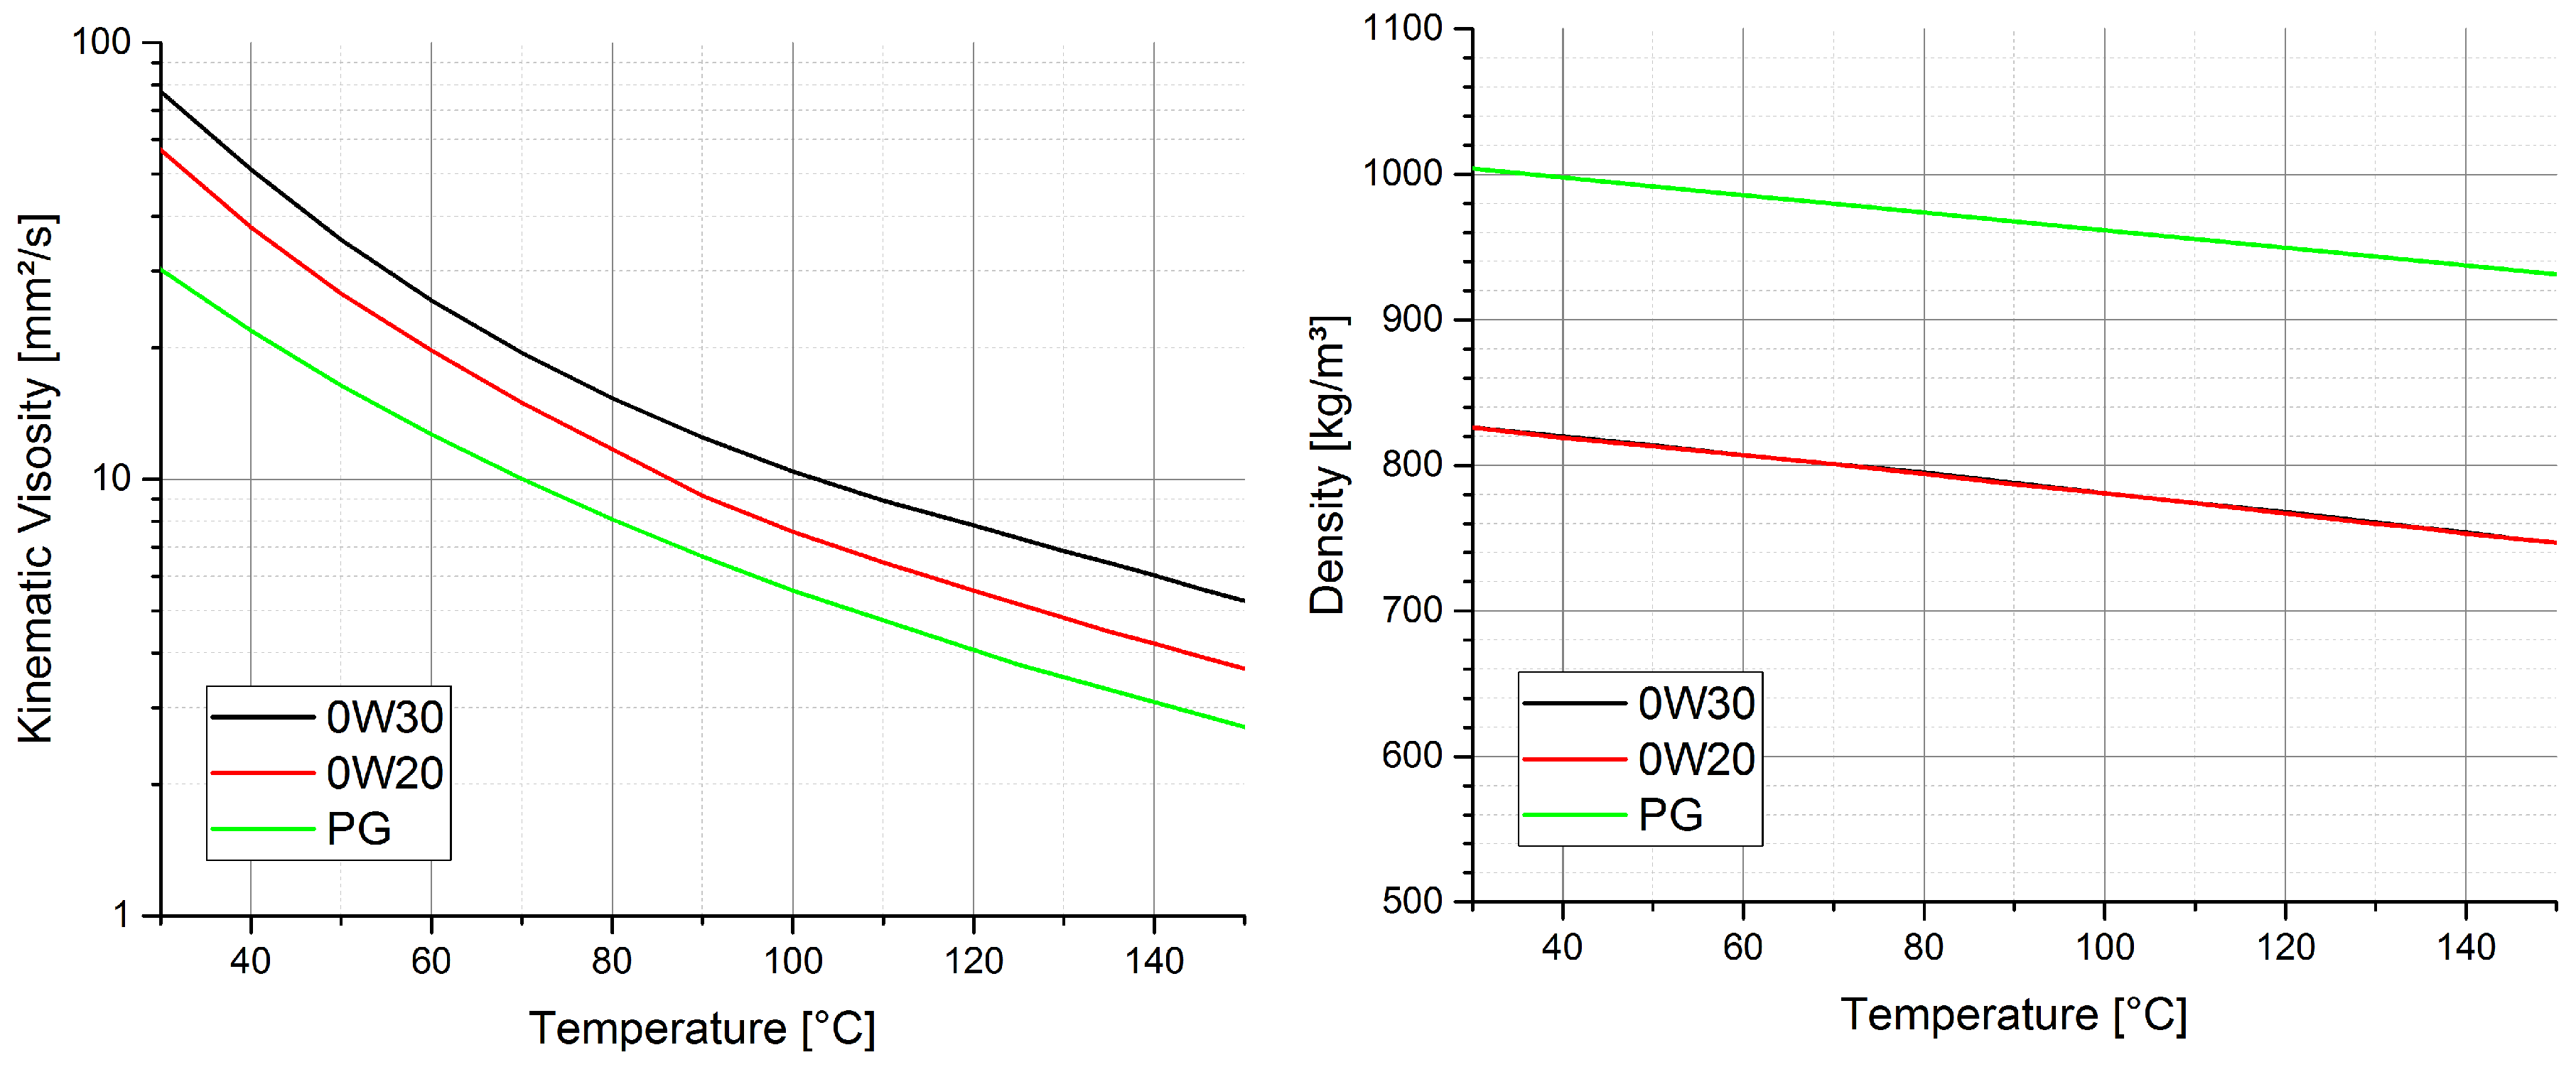
In this study, three different lubricants and their impacts on engine efficiency are analysed. The engine is originally specified to run with SAE 5W30/0W30 class engine oils. Therefore, a fully synthetic 0W30 engine oil (Shell PC2018) for Diesel engines is chosen as a reference for further comparison. The second oil, a lower-viscosity lubricant, is a fully synthetic 0W20 engine oil (Shell PC2016) with a similar additive package employed in the 0W30 engine oil. The third engine oil is fully formulated using a polyalkylene glycol (PG) base stock (Dow E72 XZ97011.01 [16]). It is made available specifically for use in combustion engines and features a very high viscosity index (VI) without the necessity to add VI-improving additives. VI-improvers can cause a significant non-Newtonian behaviour [21,22,23,24] of the lubricant. Therefore, a lubricant without these is expected to maintain its high viscosity also in the presence of locally high shear rates, which is an advantage for highly loaded contacts.
In this work, the terms 0W30, 0W20 and polyglycol are used for brevity only to refer to these lubricants instead of their full names.
One of the lubricant properties, namely the viscosity at high shear rate and high temperature (HTHS-viscosity defined at 150 C and a shear rate of s), is not only closely linked to fuel economy but even a linear relationship is proposed [25]. As expected, the 0W30 lubricant shows a higher HTHS-viscosity than the other two oils (3.2 mPa·s vs. 2.6 mPa·s). However, it is interesting to note that the HTHS-viscosity of the 0W20 and the polyalkylene glycol-based lubricant is identical; so from a pure HTHS-viscosity point of view, the same level of engine friction might presumably be expected from the 0W20 and PG lubricants.
The physical properties of all three tested engine oils are listed in Table 1.
Figure 1 shows the temperature behaviour for the viscosity and the density of the investigated lubricants. Notably, as can be seen from the figure, the density of PG is about 20% higher compared to the synthetic, hydrocarbon-based engine oils.
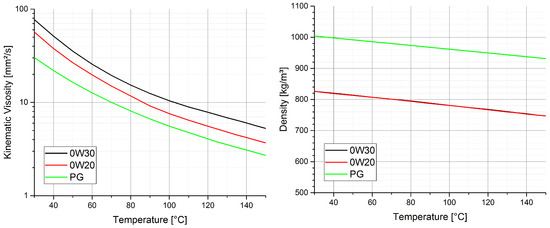
Figure 1.
Lubricant properties over temperature. (Left) Kinematic viscosity. (Right) Density (please note that the curves for the 0W30 and 0W20 densities coincide in the right plot).
In the experimental tests, great care is taken when the engine is supplied with a new (different) lubricant. Extensive flushing is performed to avoid that remaining left-overs from the previous lubricant intermix with the new one. It is commonly understood that about 10% to 15% of the previous lubricant stay in the engine and this is sufficient to influence the measurements of the new lubricant. Therefore, the engine is flushed and drained twice with the new lubricant before it receives the final oil filling of the new lubricant.
2.3. The Engine under Test
The passenger car engine put to test is an in-line four-cylinder, turbo charged, common rail Diesel engine with a nominal volume displacement of 1.6 litres and a nominal power range of 100–130 kW (Renault R9M [26]). With a corresponding power density range of 62.5–81.3 kW/L, it represents the well established downsizing trend to obtain increased power from a reduced volume displacement. Table 2 lists additional technical details of the engine. The engine is used in a wide range of passenger cars and light commercial vehicles and is mechanically efficient. Amongst others, it employs steel pistons that reduce the friction power losses of the piston assembly due to their reduced thermal expansion [27,28].
Table 2.
Technical data of the engine under test.
Engine preparation: To be able to measure the friction power losses only of the base engine, all auxiliary devices such as oil and water-pump, alternator etc., have been removed from the engine. Also, the common rail pump of the injection system is removed, which is originally driven by the valve train. Consequently, the removal of the auxiliary systems reduces the load on the timing drive.
To realize external temperature and pressure control of the media, several parts of the engine, e.g., the oil module and the oil pan, have been modified. The coolant and engine oil are supplied from external supply units, which also control supply temperatures and pressures. The supply temperatures and pressures are directly measured at the coolant circuit and oil gallery of the engine, respectively.
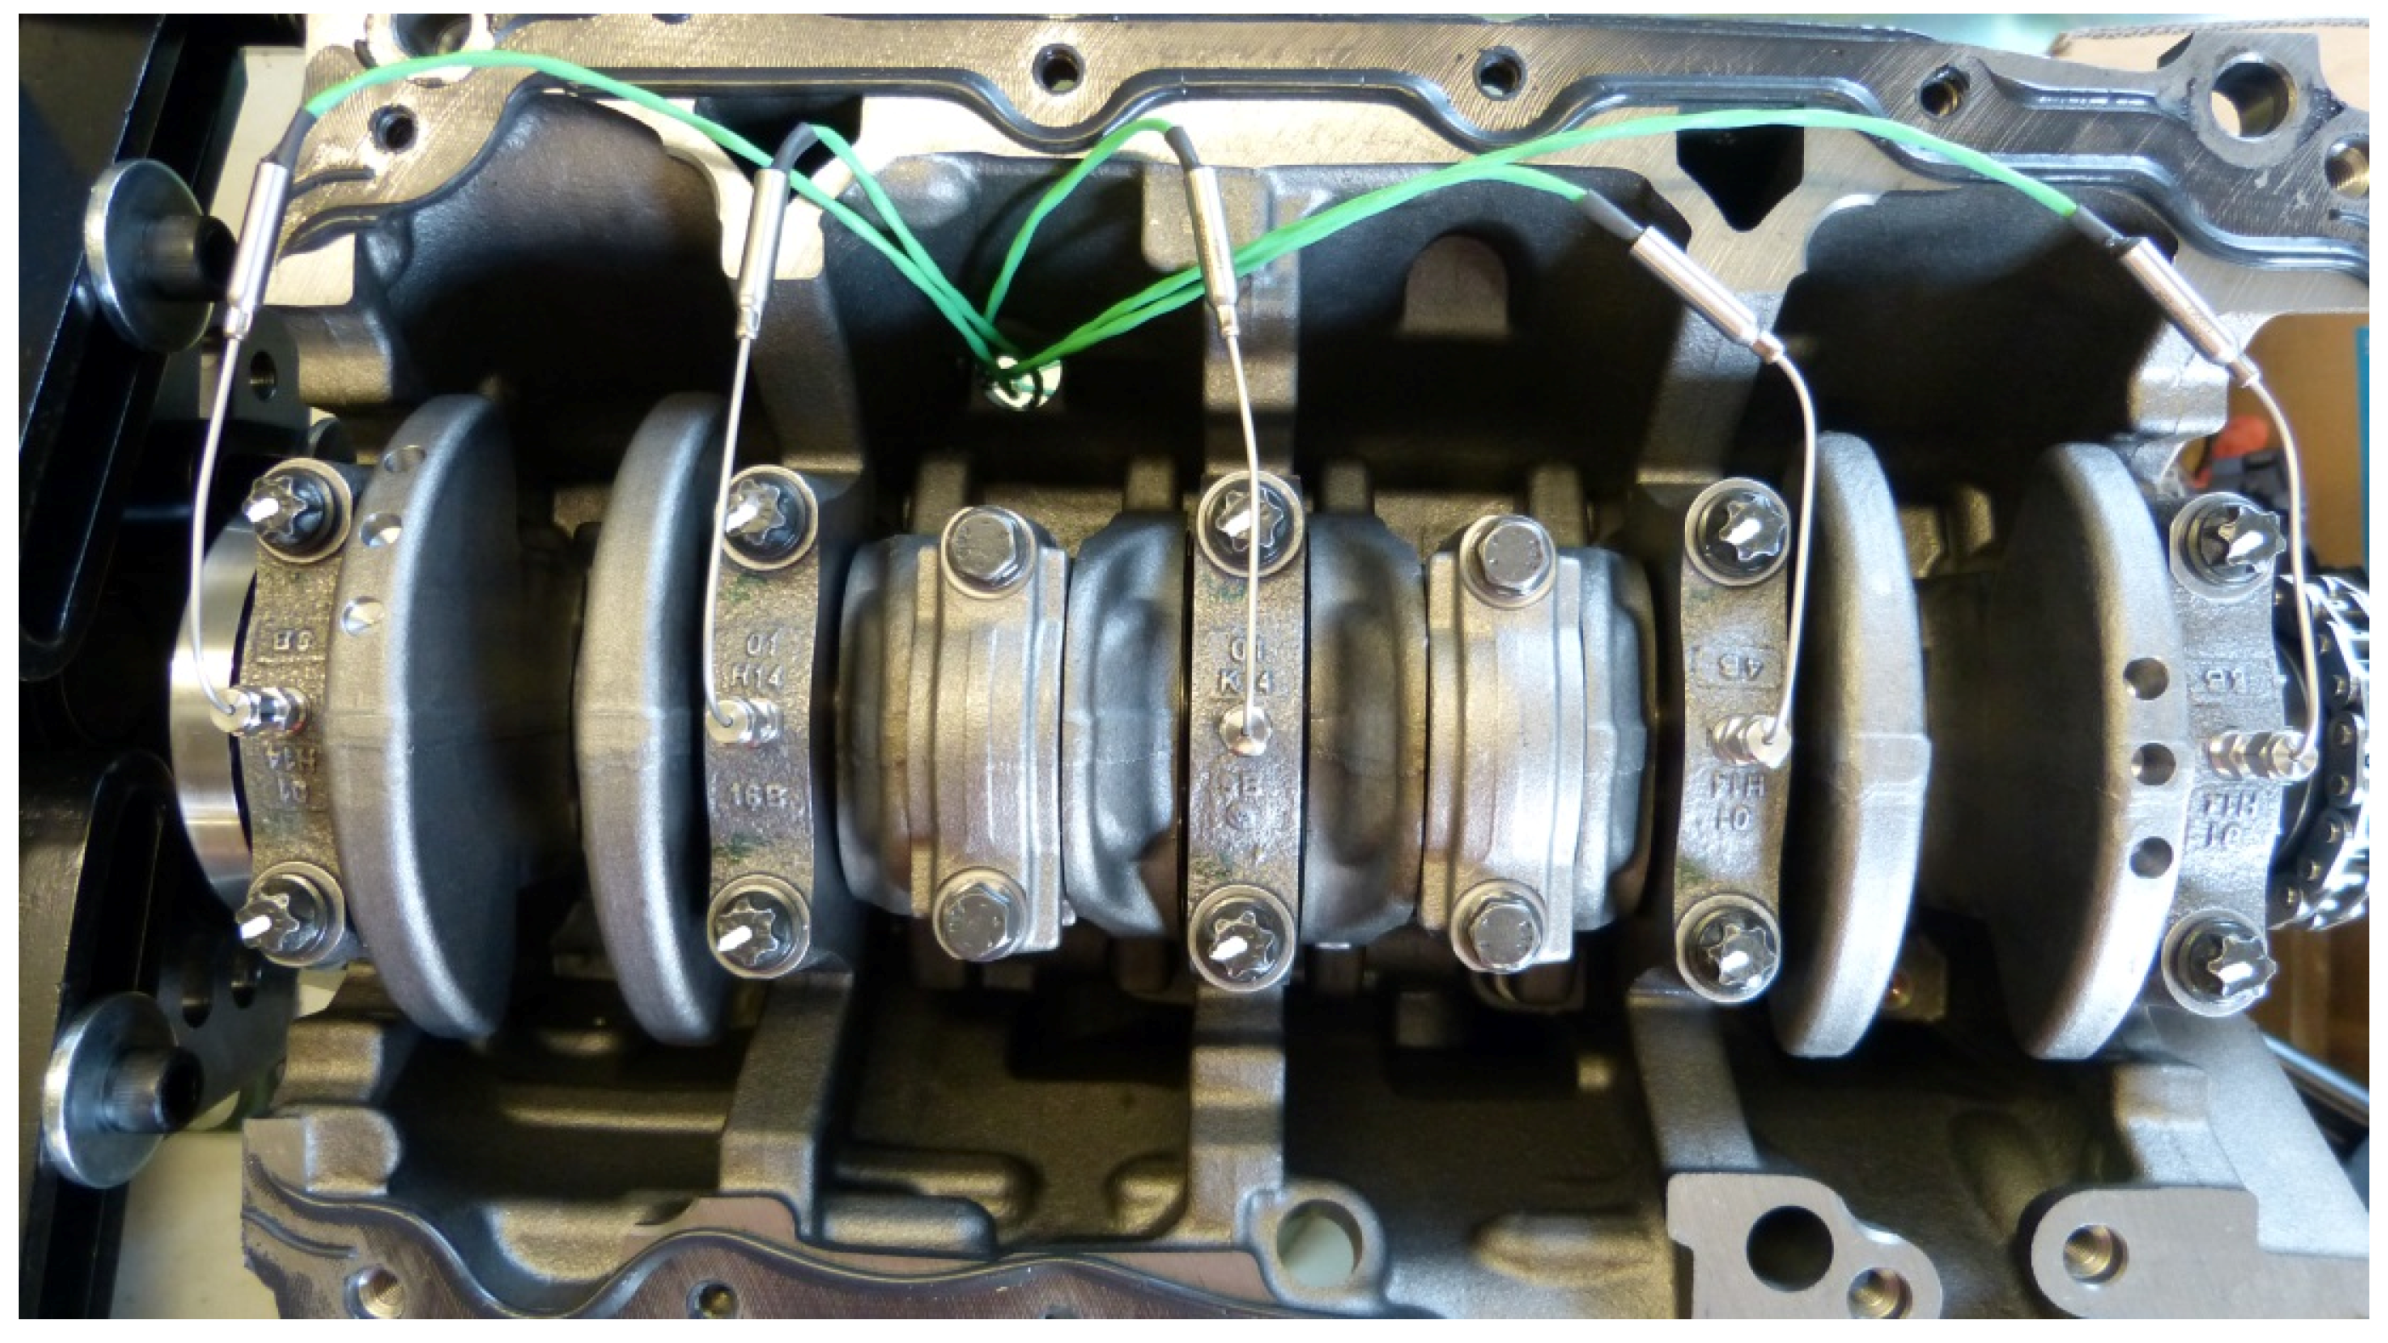
To be able to investigate the influence of the different lubricants on the temperature in the main bearings, the temperatures of each main bearing are measured using type K thermocouples. The temperature sensors measure the temperature at the back of the bearing shell as shown in Figure 2. The used numbering scheme of the main bearings starts with main bearing 1 located next to the timing drive.
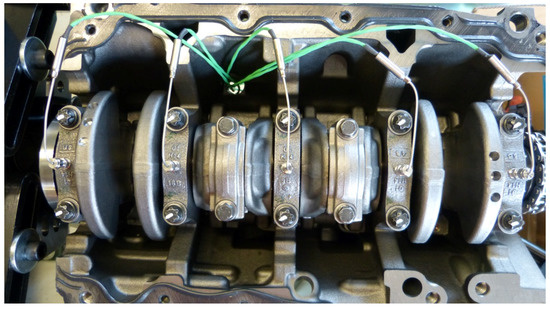
Figure 2.
Temperature sensors measure the temperature of each main bearing.
Operation conditions ranging from low to high engine speeds at low and high engine loads are performed for two different coolant/oil temperatures. For the tests, the oil and coolant supply temperatures are kept identical; therefore, the term media temperature will be used for brevity in the following.
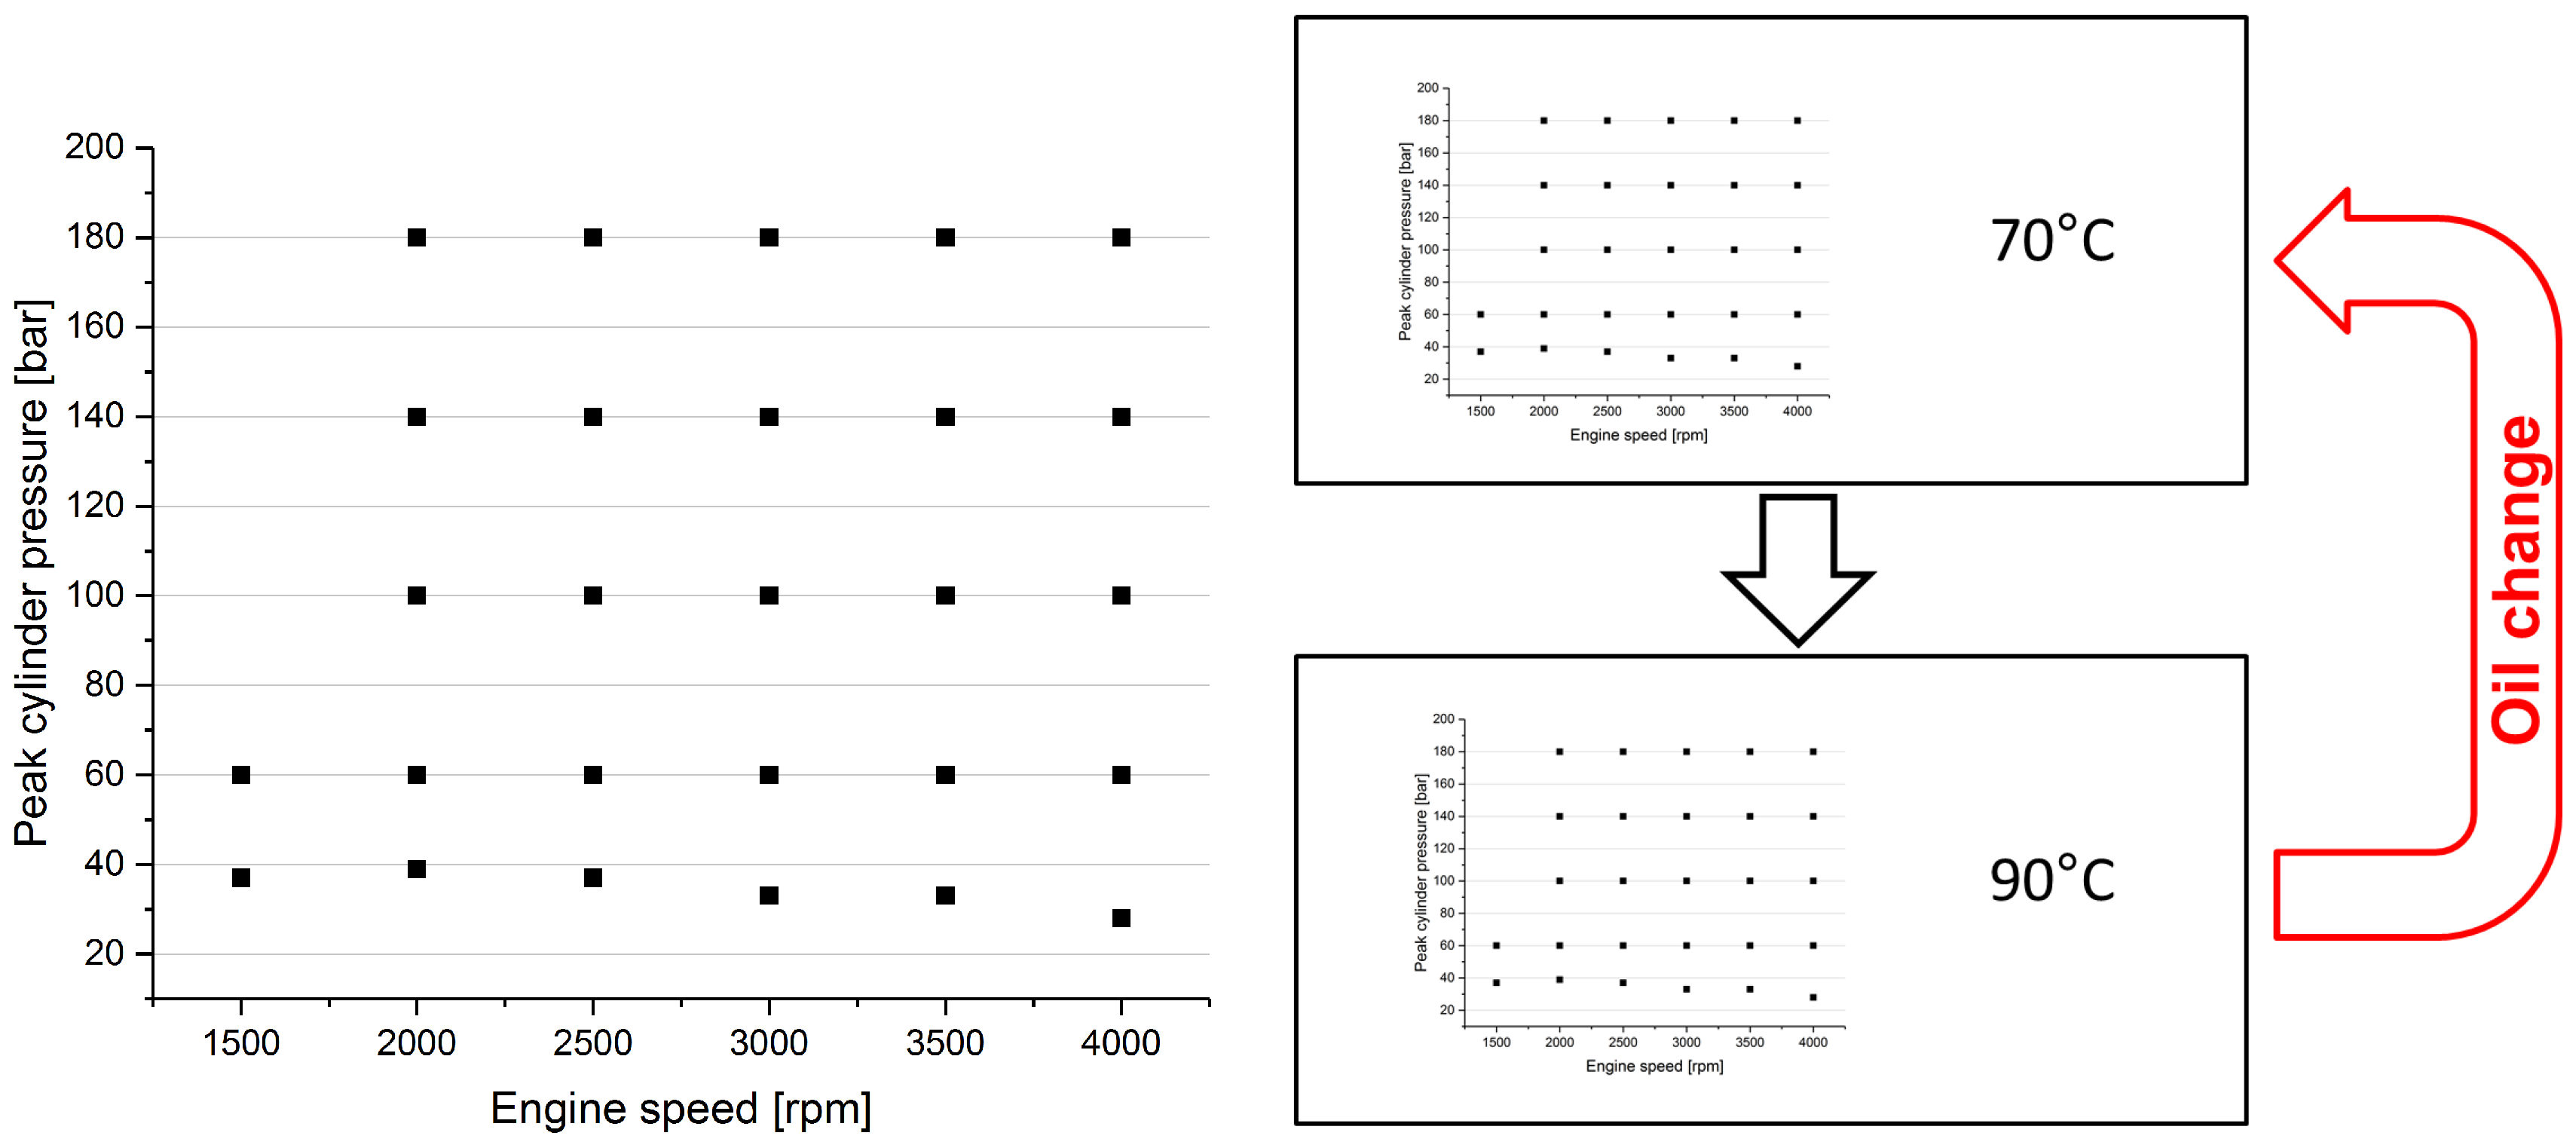
The operating conditions (speeds and loads) for which the engine is tested are shown in Figure 3. These engine operating conditions are performed for 70 and 90 C media temperature. Prior to the measurements, the engine is run following the standard procedure of the manufacturer. No significant change in engine friction could be detected during or after the subsequent tests.
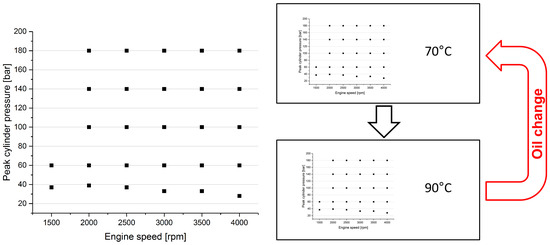
Figure 3.
Overview of test procedure. (Left) Tests covered the full range of operating conditions of the engine (in terms of speed and load). (Right) Flow chart of the tested engine operating conditions. Tests are performed for two different media temperatures (70 C, 90 C) and conducted for three different lubricants (0W30, 0W20 and PG, in this order).
3. Results
In this section, the friction losses of the test engine are presented for all three tested lubricants. The results discuss the friction torque for motored and loaded operating conditions. Additionally, the influence of the lubricant on the main bearing temperatures and on the oil outflow temperature are investigated.
3.1. Motored Engine Friction Tests
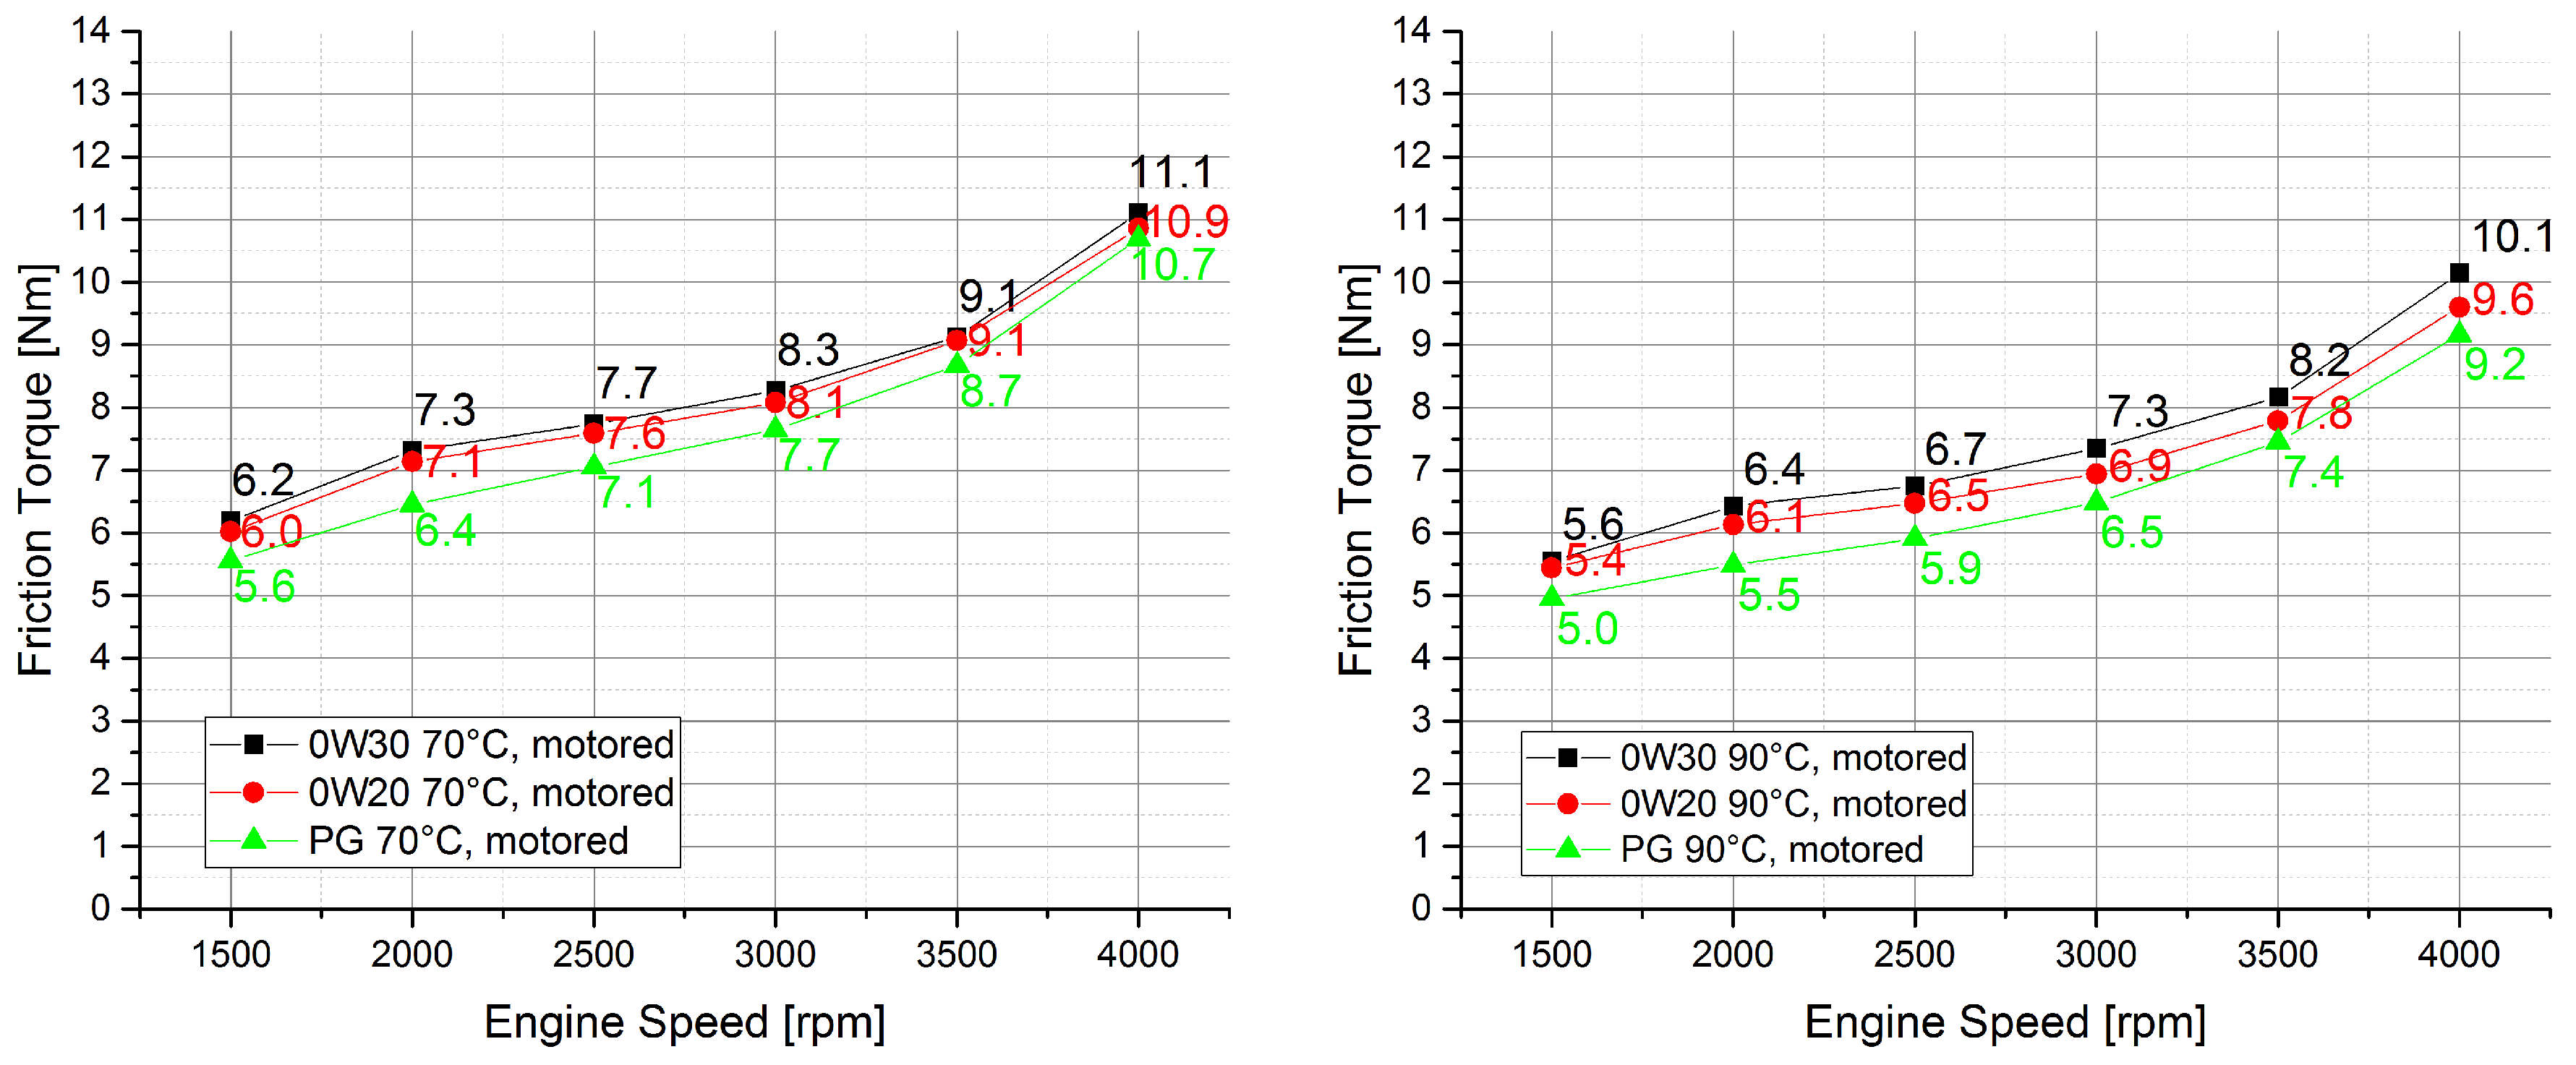
Starting with the results for motored condition, the obtained engine friction torques for the tested lubricants are shown in Figure 4. The figure shows the results for two different media temperatures, namely 70 and 90 C.
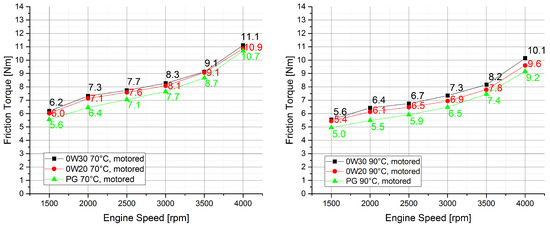
Figure 4.
Friction torque of the test engine at motored conditions for 0W30 (black), 0W20 (red) and PG (green). (Left) Media temperature is 70 C. (Right) Media temperature is 90 C.
For all three lubricants, the friction torque increases with engine speed. At high speed (at about 3500 rpm), the slope of the friction torque further increases. Although the viscosity of the lubricants decreases by roughly 40% when increasing the media temperature from 70 to 90 C (see Figure 1), the resulting difference of total engine friction for these two media temperatures is significantly smaller (only about 10%).
The highest friction torque is obtained with 0W30 for both media temperatures. At 90 C, the friction torque with 0W30 increases from 5.6 Nm at 1500 rpm to 10.1 Nm at 4000 rpm and nearly doubles its value. For the lower media temperature of 70 C, the corresponding friction torques range from 6.2 to 11.1 Nm.
A similar trend can be observed when lowering the viscosity by using a low-viscous lubricant such as 0W20. At both media temperatures, the friction torques obtained with 0W20 are below the corresponding friction torques of the reference lubricant (0W30). The reduction of friction torque ranges only between 0.1 and 0.5 Nm. A considerably lower friction torque is obtained with PG. Compared to 0W30, a friction torque reduction between 0.4 and 0.9 Nm can be observed. Figure 5 shows the friction reduction of the 0W20 and PG relative to the 0W30 lubricant.

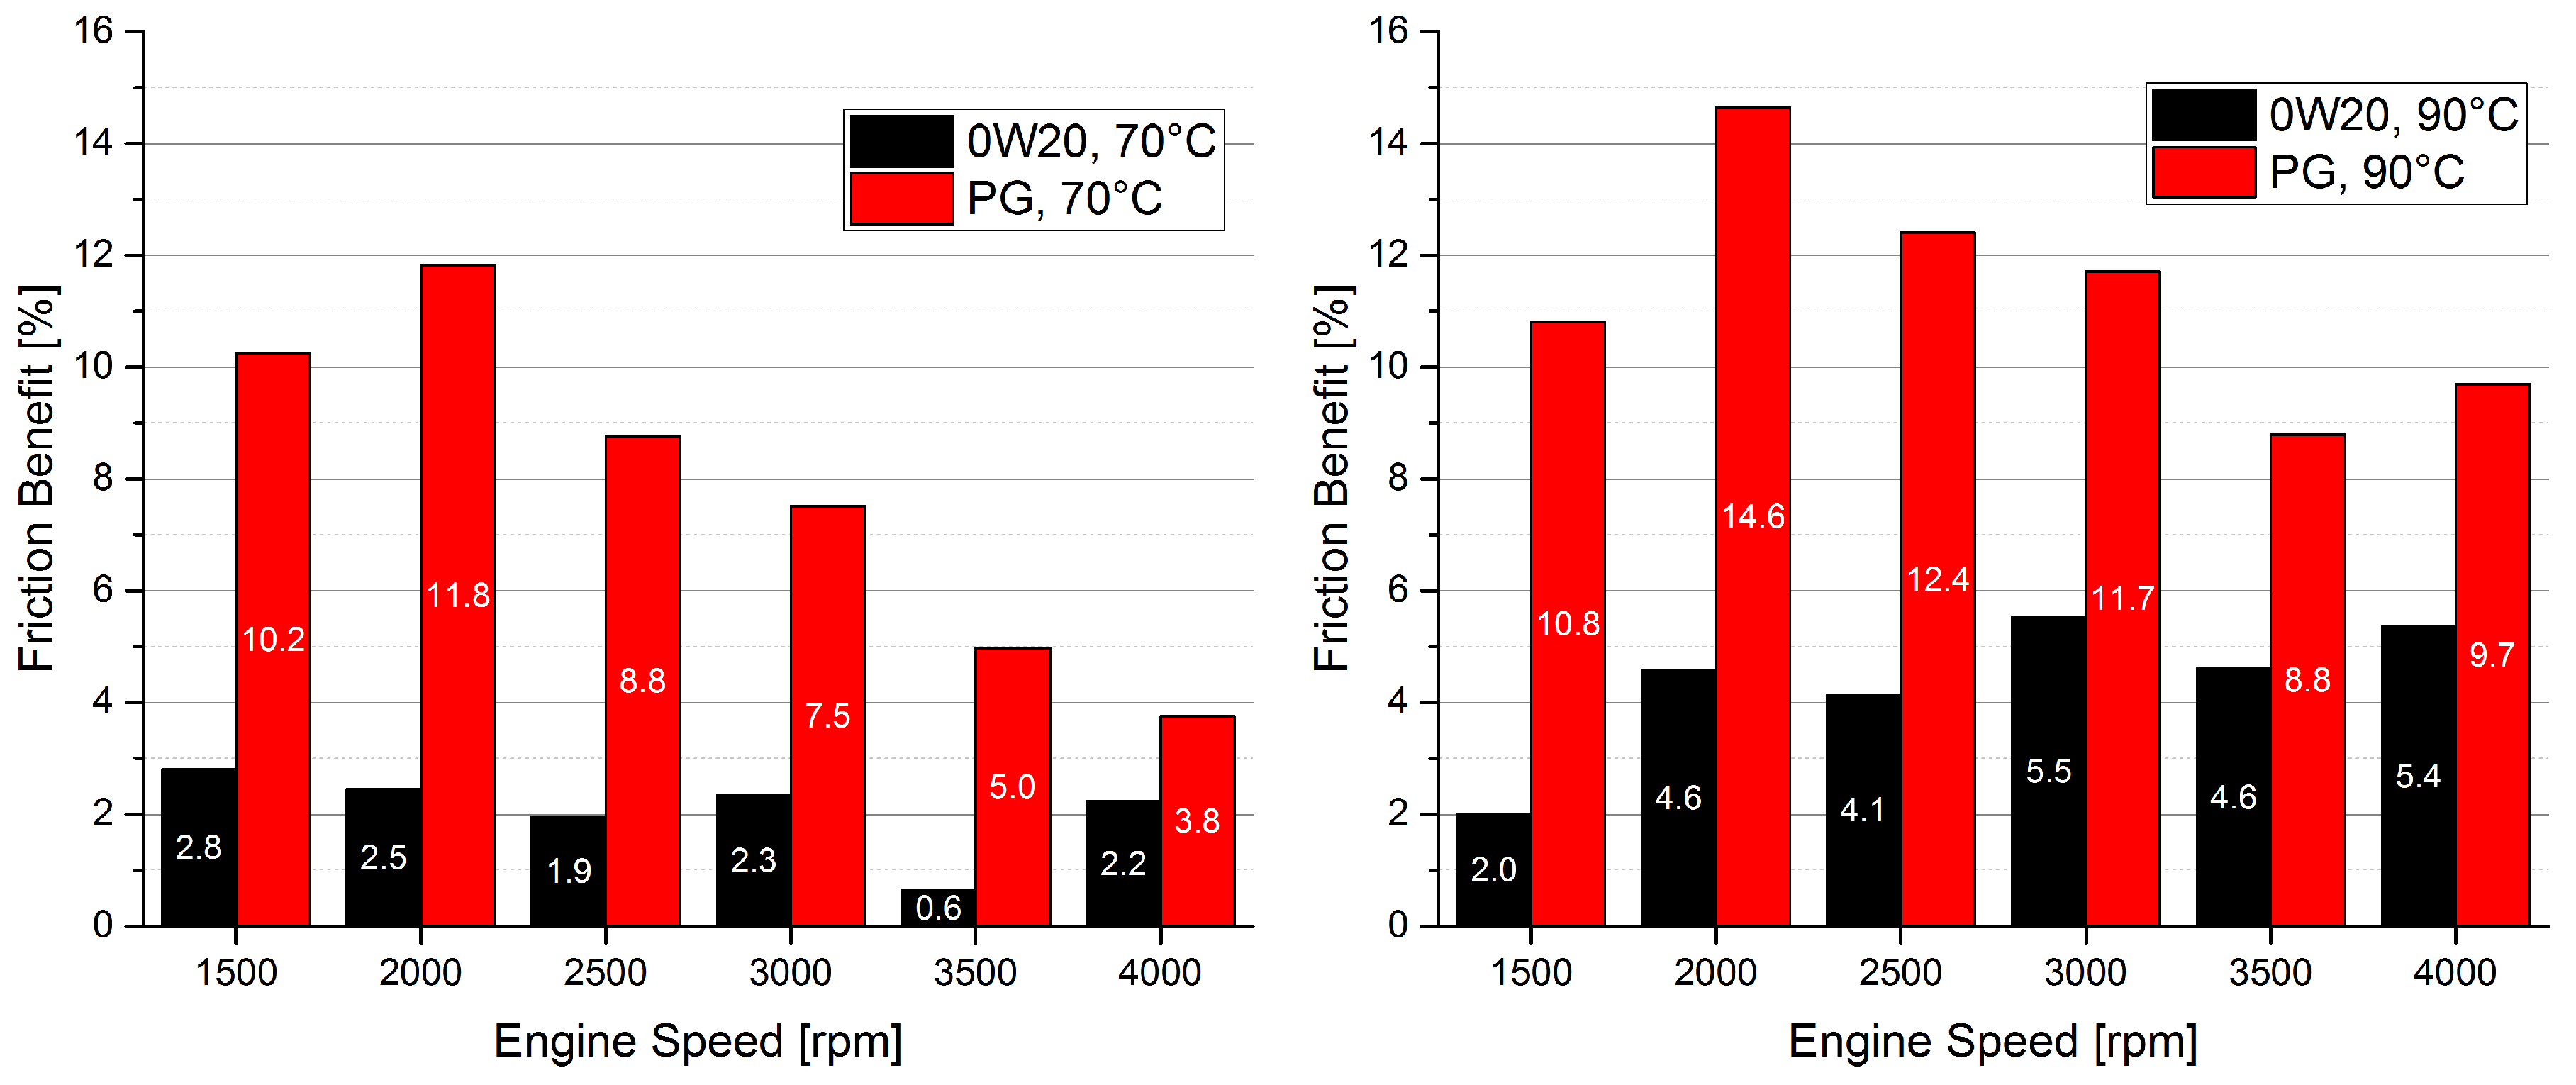
Figure 5.
Friction benefit at motored conditions for 0W20 (black) and PG (red) relative to the friction torque obtained with 0W30. (Left) Media temperature is 70 C. (Right) Media temperature is 90 C.
It is interesting to note that the measured differences in friction torque, which are as small as only 0.1 Nm represent only 0.03% of the nominal torque of the engine. This shows the high accuracy of the employed test-rig and that such a high accuracy is essential to be able to investigate different lubricants.
For a media temperature of 70 C, 0W20 shows a nearly consistent friction benefit of roughly 2%. PG shows a maximum friction benefit of 11.8% at 2000 rpm. With increasing engine speed, the friction benefit of PG reduces. At 4000 rpm, the friction benefit is 3.8%.
At 90 C media temperature, similar results are obtained. In comparison to PG, 0W20 shows again a more consistent friction benefit over the engine speed range. Increasing media temperature from 70 to 90 C, the friction benefit of 0W20 also increases from roughly 2.2% to 5%. A probable explanation for the greater benefit at higher media temperature could be the increasing viscosity difference between the two oils with increasing temperature (compare Figure 1). For PG, the friction benefit ranges from 8.8% to 14.6%. Again, it shows a decreasing trend with higher engine speed.
3.2. Engine Friction Tests under Load
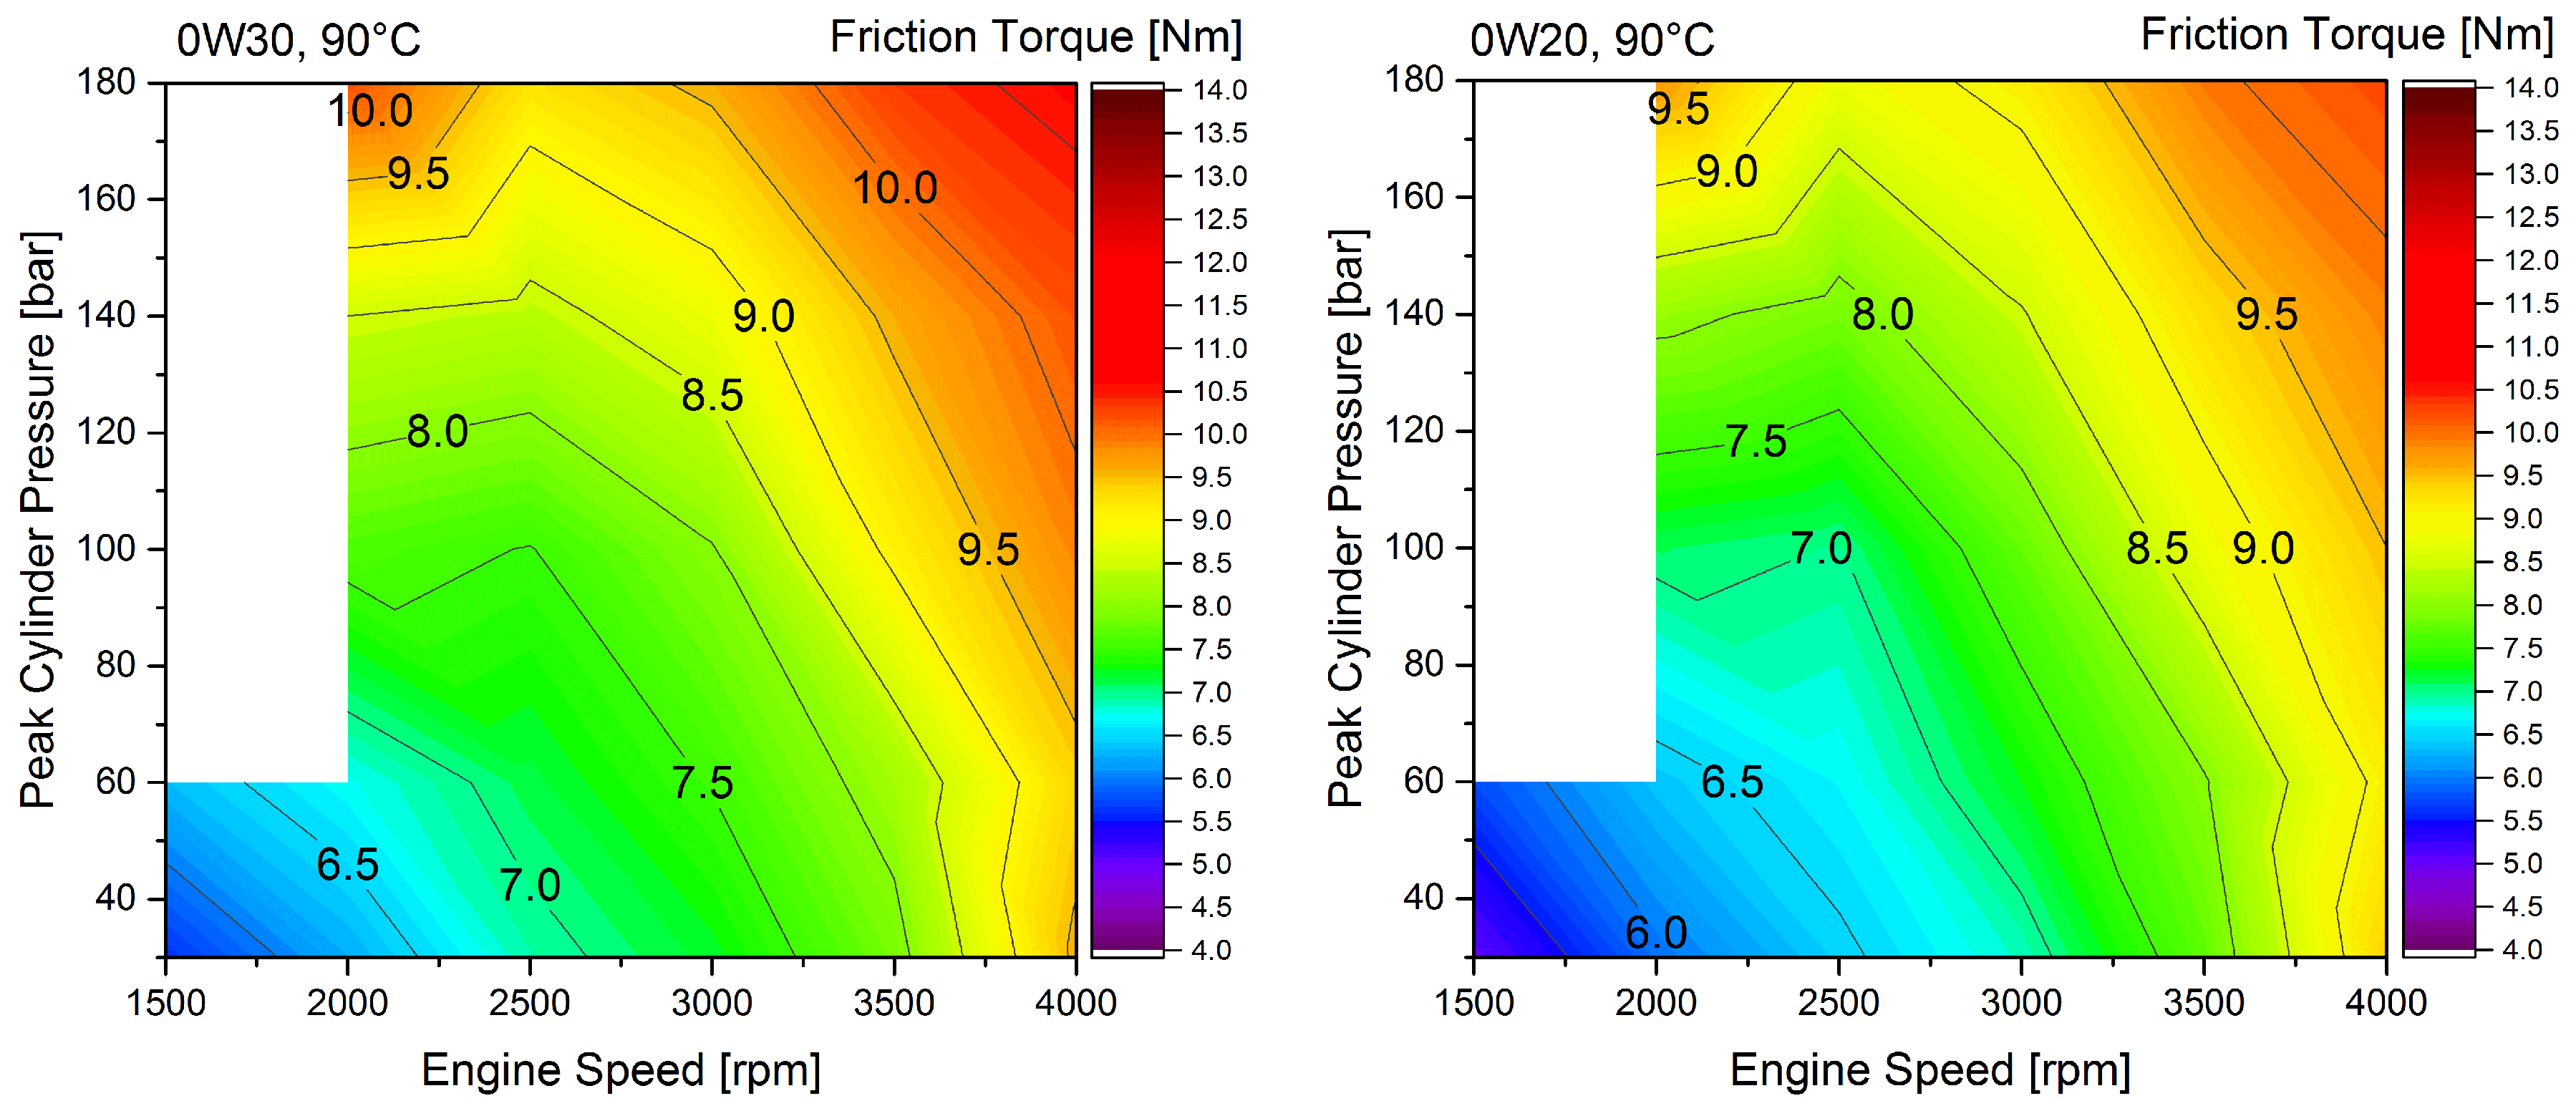
For 0W30 and 0W20, the entire test procedure at loaded condition is performed. Therefore, cylinder pressures up to 180 bar are achieved and the speed ranges between 1500 and 4000 rpm (see Figure 3). For brevity, the results shown in this section focus on 90 C media temperature. Figure 6 shows the friction torque obtained with 0W30 in the left diagram and the friction torque obtained with 0W20 in the right diagram.
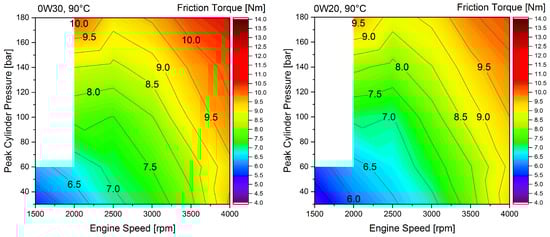
Figure 6.
Friction torque of the loaded test engine with a media temperature of 90 C. (Left) Lubricant: 0W30. (Right) Lubricant: 0W20.
In general, both lubricants show a similar friction behavior of the engine over the entire speed and load range. For both lubricants, the lowest friction torque occurs at low speed and at low load condition. With increasing engine speed, the friction torque increases, as was already seen in the motored results. Additionally, the friction torque increases with increasing load. Therefore, the maximum friction torque occurs at 4000 rpm and at a peak cylinder pressure of 180 bar. Both lubricants show a rather strong increase of friction torque with load especially at 2000 rpm. Hence, the friction torque at 2000 rpm and a peak cylinder pressure of 180 bar is higher compared to the same load at 2500 rpm and 3000 rpm. Over the entire speed and load range, 0W20 shows a lower friction torque compared to 0W30. The difference between the two lubricants ranges between 0.2 Nm and 0.5 Nm. The increase of friction torque with increasing peak cylinder pressure at 2000 rpm is furthermore presented in Figure 7 in the diagram on the left. This figure shows the friction torque obtained with the addition of PG.
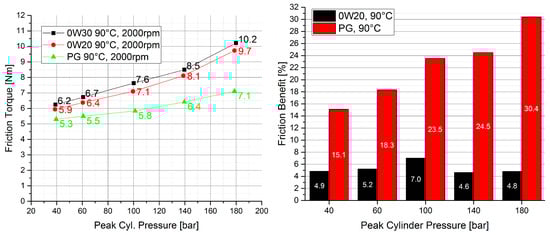
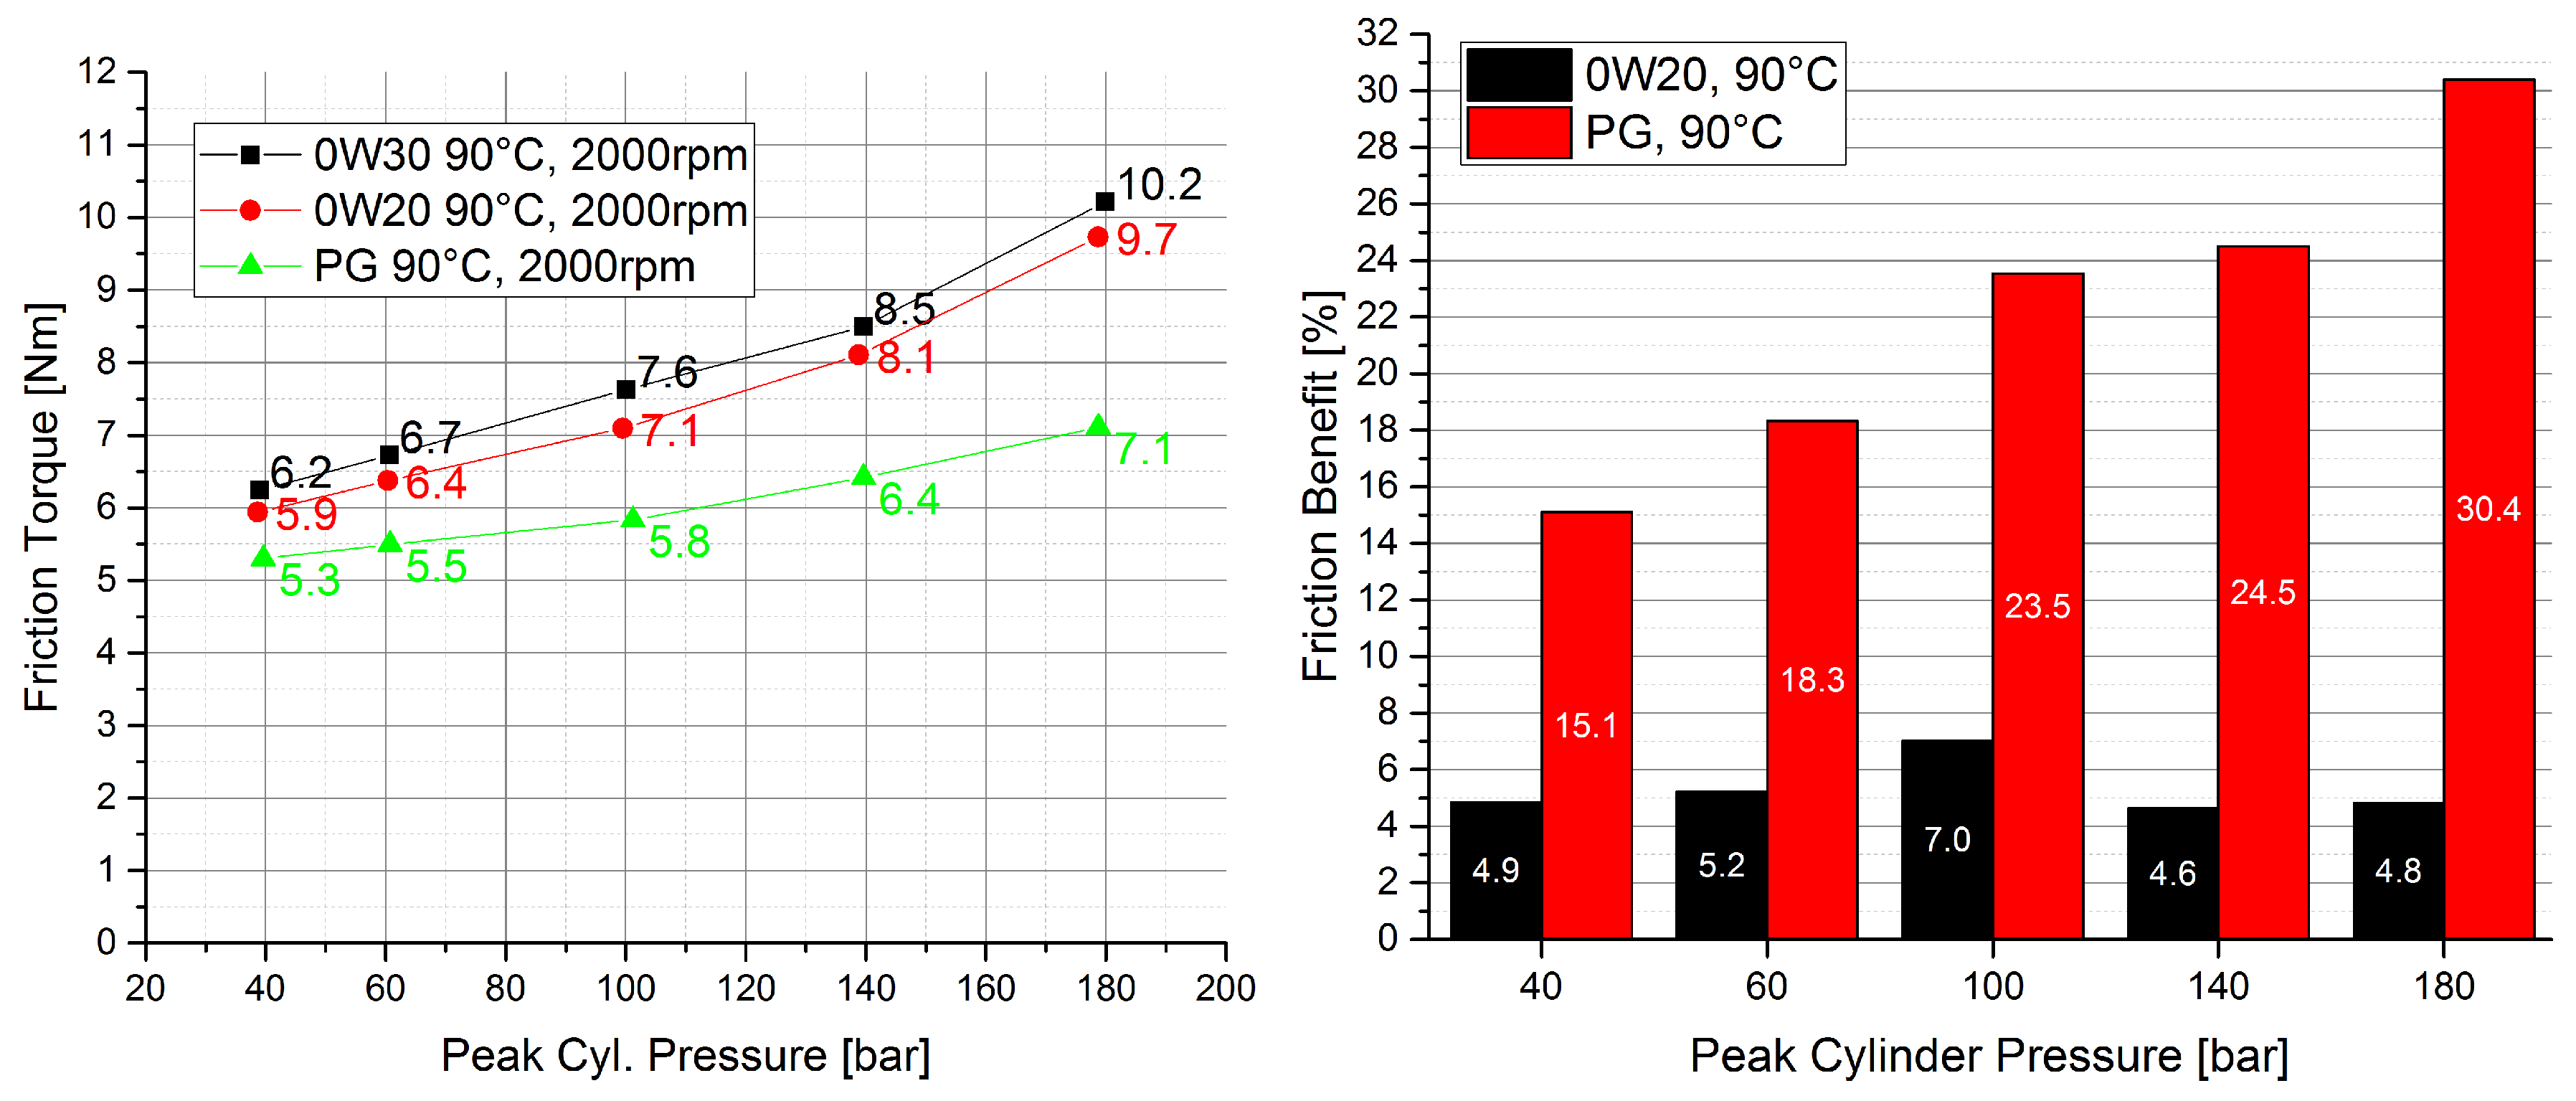
Figure 7.
Results for the test engine under load at 2000 rpm with a media temperature of 90 C. (Left) Friction torque of the test engine at loaded conditions for 0W30 (black), 0W20 (red) and PG (green). (Right) Friction benefit for the test engine at loaded conditions for 0W20 (black) and PG (red) related to the friction torque obtained with 0W30.
Comparing the effect of engine speed, Figure 4, to the effect of load for an engine speed of 2000 rpm, Figure 7, it is interesting to note that both speed and load have about the same influence and almost double the total engine friction torque (friction torque ranges from 6.2 to 11.1 Nm for 1500 to 4000 rpm engine speed for 0W30 in comparison to 6.2 to 10.2 Nm friction torque at 2000 rpm for 40 to 180 bar peak cylinder pressure). Notably, the effect of engine load on engine friction torque is strongest for 2000 rpm and is weaker for higher engine speeds, see Figure 6. However, even if the friction torques are of similar magnitude for these two operating points, the corresponding friction power losses (which impact the fuel consumption) are still only half at 2000 rpm in comparison to 4000 rpm engine speed.
The friction torque obtained with 0W30 increases from 6.2 Nm at roughly 40 bar peak cylinder pressure up to 10.2 Nm at 180 bar peak cylinder pressure. For 0W20, the trend of the friction torque is similar but its magnitude is reduced by roughly 0.4 Nm. However, PG shows a different behavior compared to 0W30 and 0W20. The effect of load on the friction torque is significantly lower; the friction torque increases from 5.3 Nm at 40 bar peak cylinder pressure up to 7.1 Nm at 180 bar peak cylinder pressure. Thus, at maximum load, a drastic reduction of 3.1 Nm is obtained compared to the friction torque with 0W30. The diagram on the right in Figure 7 shows the friction benefit for 0W20 and PG related to 0W30. While the friction benefit of roughly 5% for 0W20 remains rather stable over the peak cylinder pressure, the friction benefit for PG increases from 15% to 30%.
3.3. Main Bearing Temperatures
In addition to total engine friction, the main bearing temperatures are evaluated to discuss the influence of the lubricant on bearing performance. Two effects occur simultaneously when changing the lubricant with different physical properties. Firstly, the losses due to viscous friction vary, which affects the heat dissipation and furthermore the temperature of the bearing. Secondly, the viscosity affects the oil flow through the bearing and hence, the heat convection is changed, which again influences the main bearing temperature. Therefore, these two effects are not separated from each other in this study.
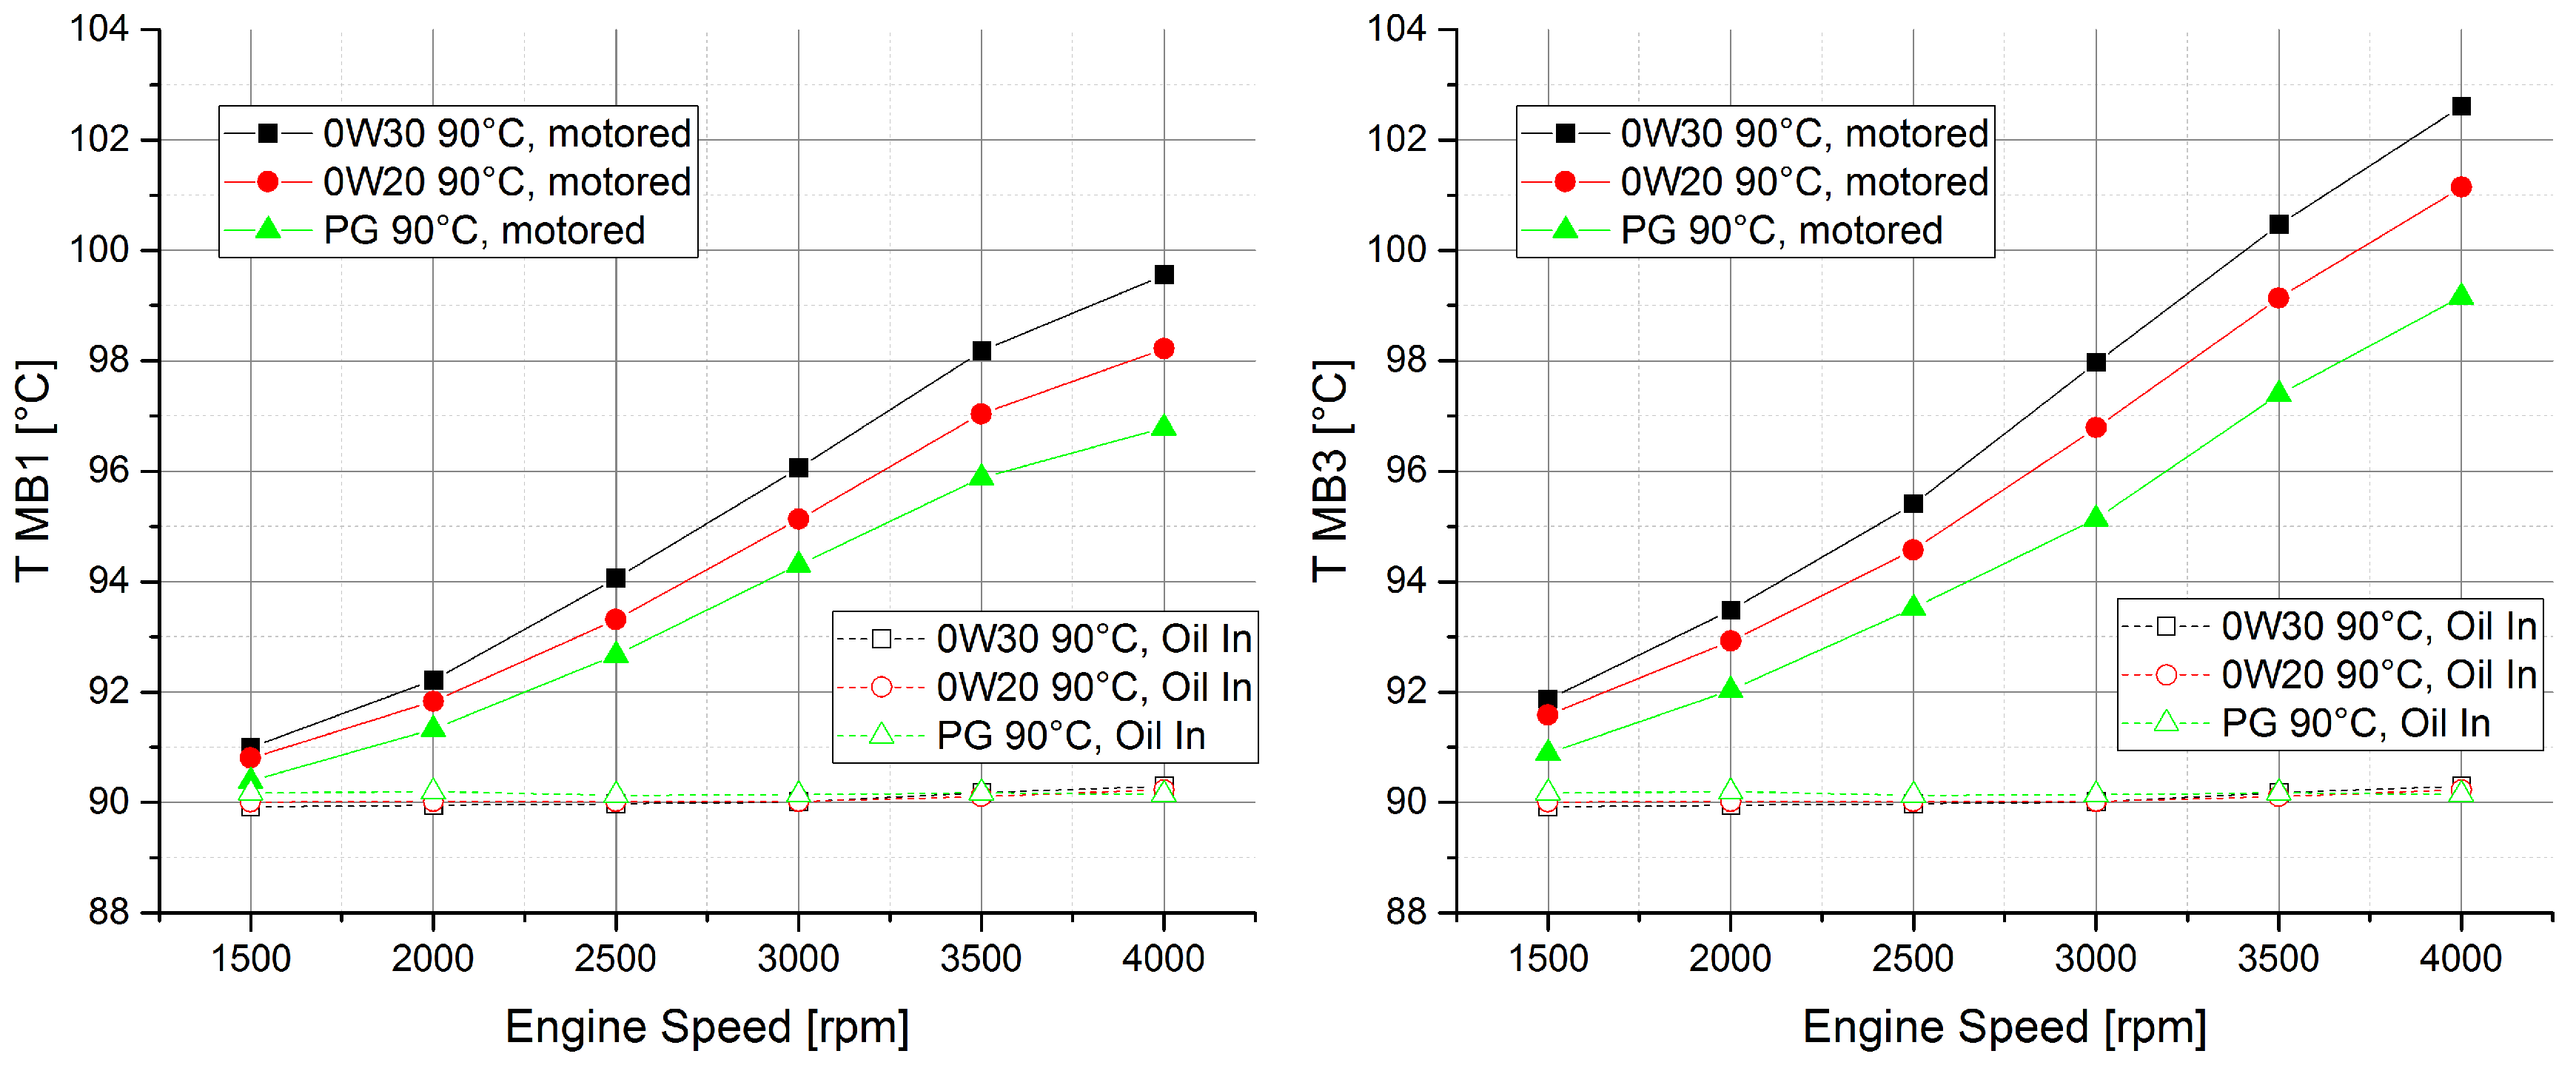
Figure 8 shows the measured temperatures at main bearing 1 (diagram on the left) and main bearing 3 (diagram on the right) for motoring the engine. Main bearing 1 is located at the timing drive and main bearing 3 is located at the center of the crankshaft. In addition to the measured bearing temperatures, the measured oil supply temperatures are shown, which are very stable during the entire test procedure.
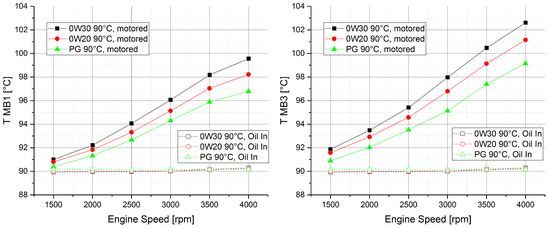
Figure 8.
Main bearing temperature and oil supply temperature of the test engine at motored conditions for 0W30 (black), 0W20 (red) and PG (green). Media temperature is 90 C. (Left) Main bearing 1, located at the timing drive. (Right) Main bearing 3, located in the center.
In general, the bearing temperature increases with engine speed. Due to the higher shear stresses in the lubricating film at high speed, higher friction and heat dissipation occurs. At 1500 rpm, the main bearing temperature is only slightly higher compared to the oil supply temperature. With the two hydrocarbon-based lubricants, 0W30 and 0W20, the temperature is 91 C at main bearing 1 and 92 C at main bearing 3. The bearing temperature obtained with PG is even lower than the temperatures obtained with 0W30 and 0W20. The temperature difference between the three lubricants increases with higher engine speed. The highest temperature and thus largest friction losses in the main bearings occur with 0W30 followed by 0W20 and PG. At 4000 rpm, the temperature difference is 1.5 C between 0W30 and 0W20 and 3–4 C between 0W30 and PG.
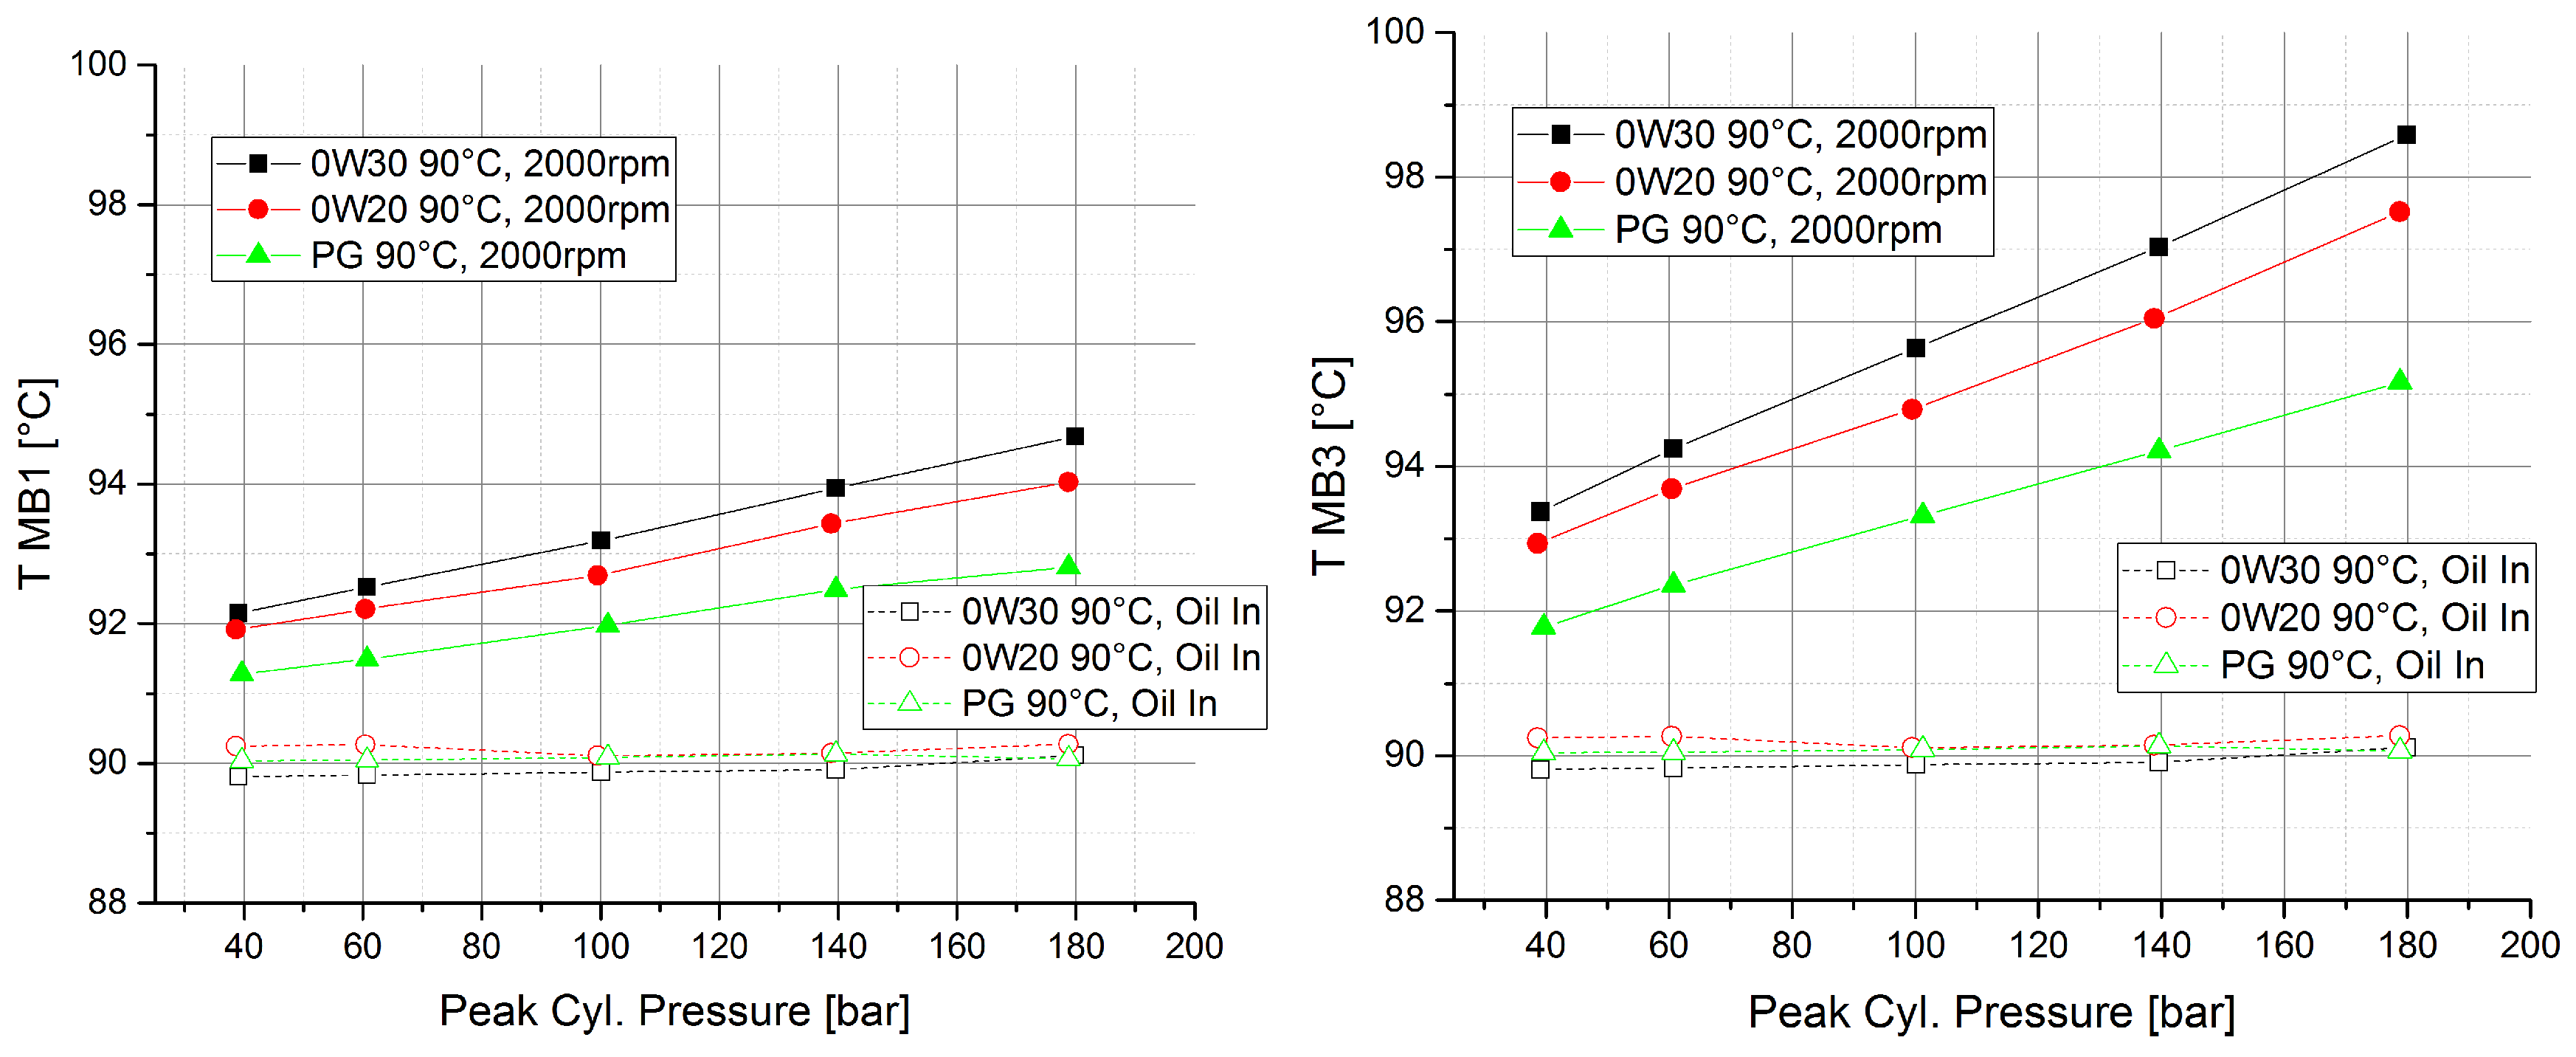
The temperature increase in the main bearings due to the engine load is shown in Figure 9. Again, main bearing 1 and main bearing 3 are shown in the two diagrams. Main bearing 3 shows a stronger increase of temperature and friction due to the fact that the bearing is stressed by the load of two adjacent cylinders while main bearing 1 has only one adjacent cylinder. The temperature increases linearly with the peak cylinder pressure. While the bearing temperature increases for 0W30 and 0W20 in a parallel fashion, the inclination for PG is slightly smaller. Therefore, a temperature and friction benefit in the main bearings occurs particularly for high engine loads.
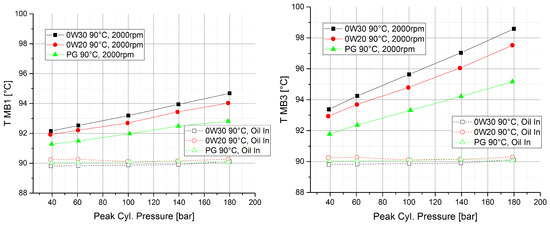
Figure 9.
Main bearing temperature and oil supply temperature of the test engine at loaded conditions for 0W30 (black), 0W20 (red) and PG (green). Media temperature is 90 C. (Left) Main bearing 1, located at the timing drive. (Right) Main bearing 3, located in the center.
3.4. Lubricant Outflow Temperature
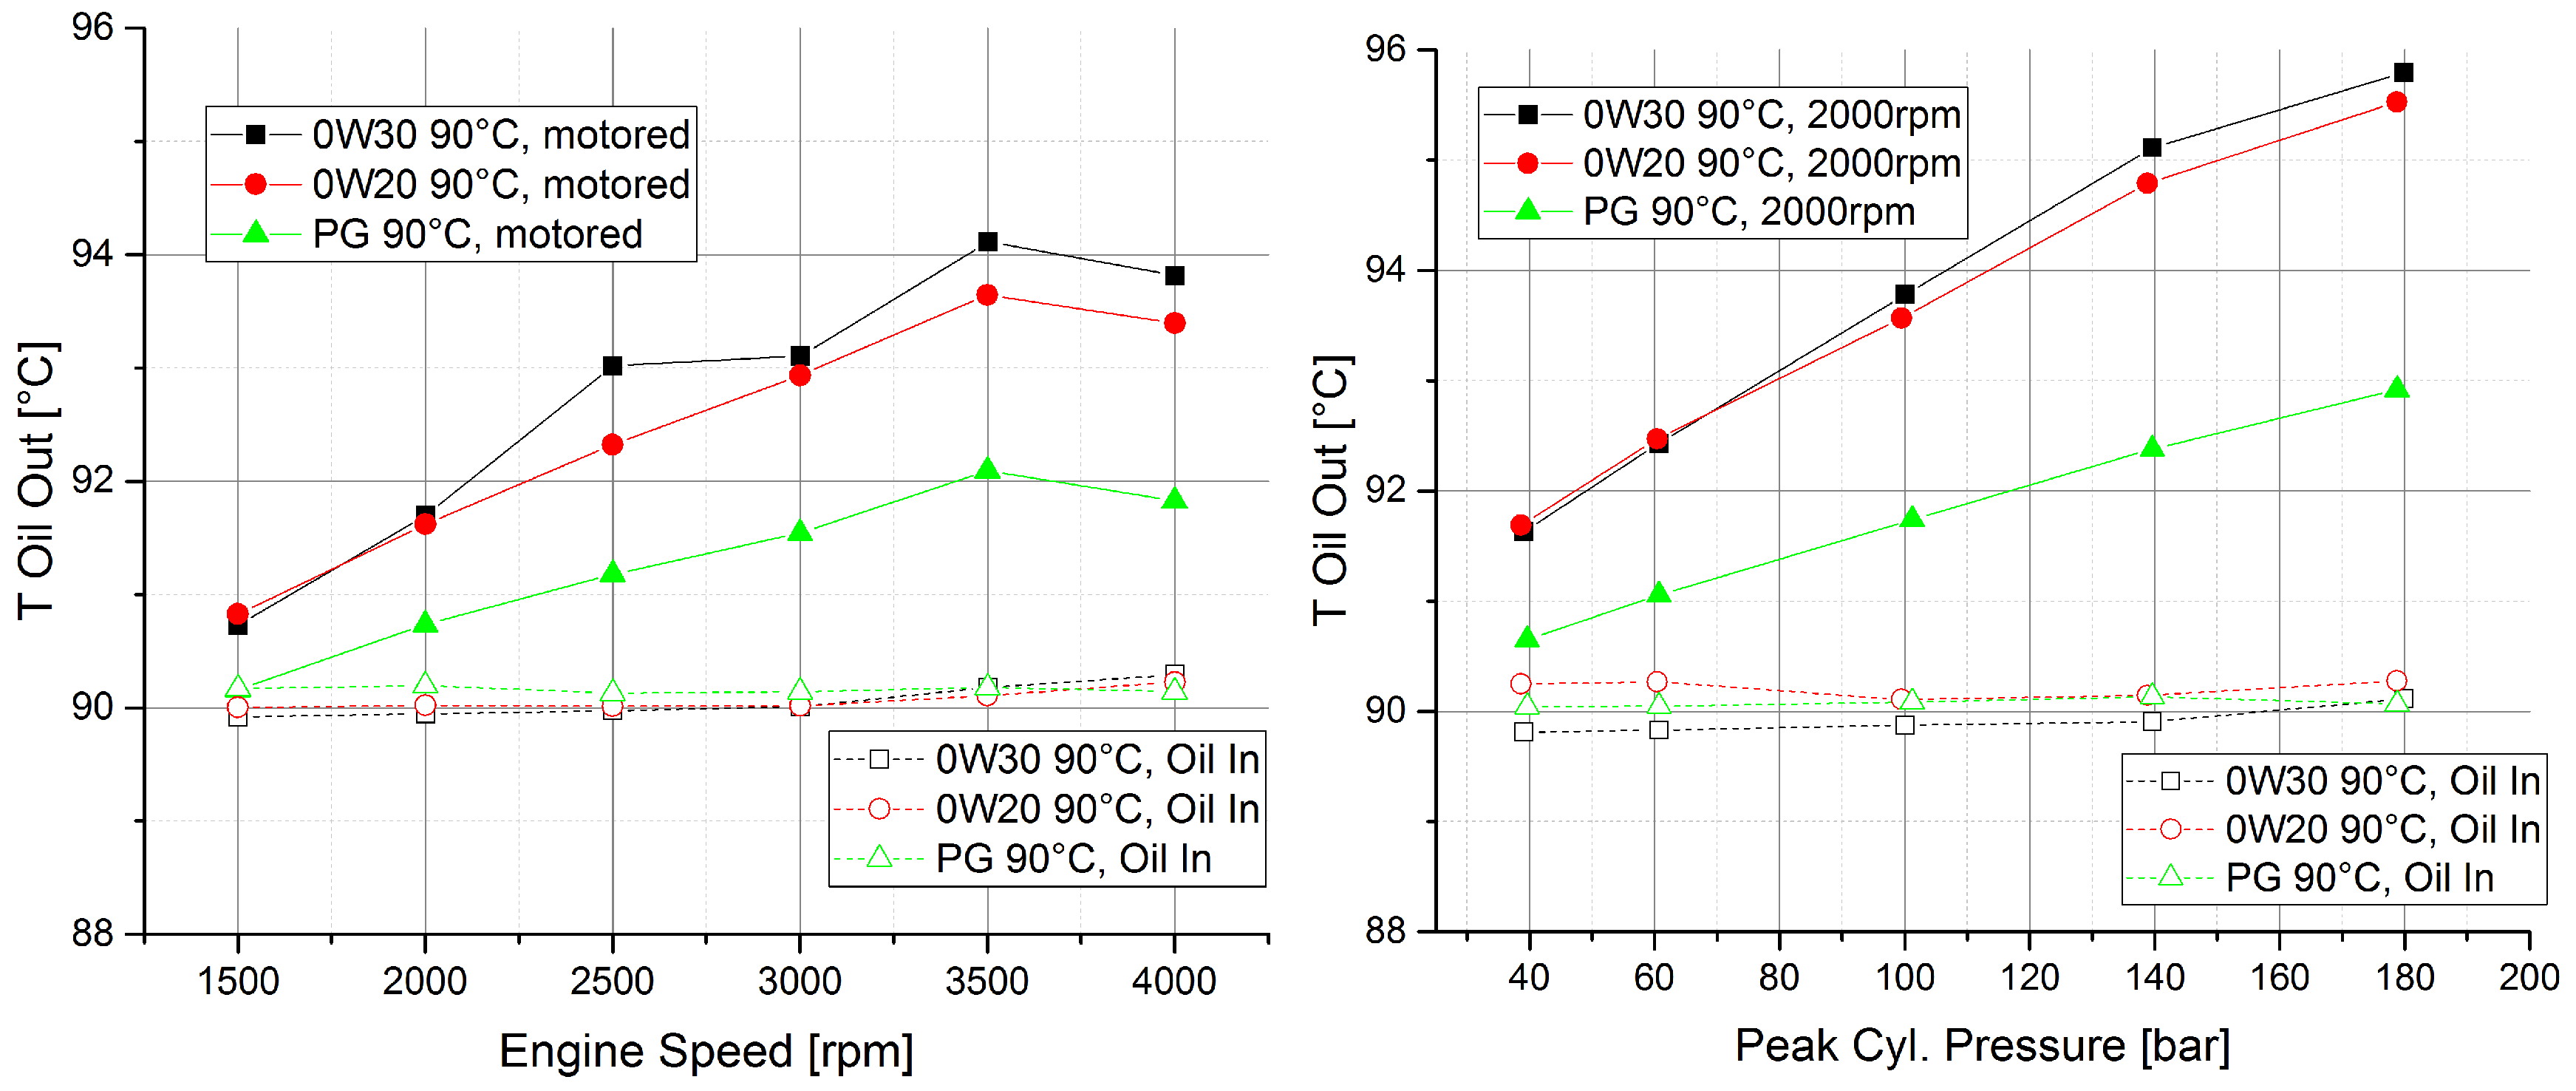
Most of the heat that is generated by friction in the engine is removed by the lubricant [29]. Hence, the lubricant outflow temperature represents the cooling capability of the lubricants. Figure 10 shows the measured lubricant outflow temperature at motored condition in the left diagram and at loaded condition in the right diagram.
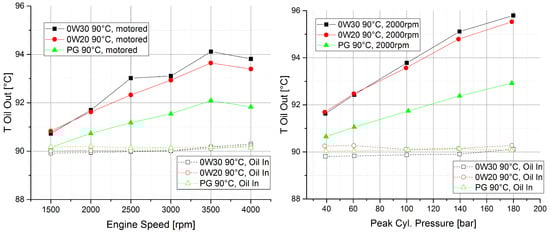
Figure 10.
Oil outflow temperature and oil supply temperature of the test engine for 0W30 (black), 0W20 (red) and PG (green). Media temperature is 90 C. (Left) Motored conditions. (Right) Loaded conditions at 2000 rpm.
The lubricant outflow temperature increases with load and speed except for the last speed step up to 4000 rpm. The reason for this is that at 4000 rpm, the oil supply pressure is increased by 2.2 bar. Hence, more lubricant flows through the bearings and transports more heat. The two hydrocarbon-based lubricants, 0W30 and 0W20, show similar outflow temperatures. Only at high speed and high peak cylinder pressures does 0W20 show a lower temperature, which corresponds to the overall friction losses in the engine (compare Figure 4 and Figure 7). The lubricant outflow temperature obtained with PG is clearly below the temperature, which occurred with the hydrocarbon-based lubricants. Beside the lower heat generation due to less friction in the engine, the higher volumetric heat capacity of PG has an additional benefit of improved cooling of the engine [11].
4. Discussion and Conclusions
The potential for friction reduction by employing low viscosity lubricants is investigated in this study using a downsized Diesel engine on a highly accurate test-rig. As the engine is designed to work with 0W30 lubricants, the 0W30 represents the reference for the other two tested lubricants, 0W20 and PG.
The measured friction torque shows a characteristic behavior; both engine speed and engine load increase the total engine friction in a similar magnitude. At motored condition, a clear benefit of roughly 10% is identified when the media temperature is raised from 70 to 90 C due to the lower lubricant viscosity at high temperatures.
4.1. Fully Synthetic Low-Viscosity Lubricant
The mechanical engine performance is also analyzed with a fully synthetic low-viscosity lubricant (0W20) and the results are compared to the results with the reference lubricant (0W30). The trends of the friction torque over speed and load are identical for both lubricants. Hence, the presence of metal–metal contact in the lubricated contacts appears unlikely as it would furthermore lead to a raised friction torque (see for instance [30]).
A reduction potential of the overall engine friction losses by using 0W20 is identified for the entire investigated engine speed and load range. At a media temperature of 90 C, the friction losses are cut down by roughly 5% at motored condition and under load at an engine speed of 2000 rpm. It is interesting to note that an almost 25% difference in HTHS-viscosity (3.2 mPa·s vs. 2.6 mPa·s) is needed to obtain this 5% friction reduction benefit for the 0W20.
The main bearing temperatures are also evaluated for both lubricants. Friction in the bearings causes heat and the bearing temperature increases as a consequence. Due to lower friction losses in the bearings when using 0W20 instead of 0W30, a lower temperature is observed. The bearing temperature would increase if metal–metal contact is present. Hence, it can be assumed that the main bearings operate in pure hydrodynamic lubrication regime.
4.2. Polyalkylene Glycol-Based Ultra-Low-Viscosity Lubricant
The third lubricant investigated in this study is a polyalkylene glycol-based ultra-low-viscosity lubricant (PG). The results indicate that PG presents a great potential of friction reduction of the entire engine. Although the PG lubricant has the same HTHS viscosity of 2.6 mPa·s as the tested 0W20 lubricant, drastic differences in the measured friction torque are obtained. This contradicts previous works that connect HTHS-viscosity directly to fuel consumption, which apparently is only valid for hydrocarbon-based lubricants.
In comparison to 0W30, the friction torque using PG is reduced by roughly 10% at motored condition and a notable efficiency advantage of up to 30% is observed under high load. The very low viscosity compared to 0W30 results in lower friction in the lubricated contacts, which operate in pure hydrodynamic lubrication regime. Therefore, the main bearings show a notably lower temperature due to less frictional heating in the bearing. An additional benefit may appear in contacts, which operate in mixed and boundary lubrication regime.
Along with the frictional benefit, the investigated PG has a higher heat capacity compared to the two hydrocarbon-based engine oils. Therefore, better cooling performance is identified for PG in this study. However, the eventual implementation of polyalkylene glycol-based lubricants in future engines depends on further properties; for instance, the chemical compatibility of PG with other materials, the wear characteristics, the performance with DLC coatings, and the ageing behavior in fired engine operation.
4.3. Outlook
As future work, a further break-down of the friction losses into the engine’s subsystems (piston assembly, crankshaft bearings, valve train and timing drive) is of interest because the different subsystems usually operate in different lubrication regimes, which would allow an even more detailed analysis of the tested lubricants.
Acknowledgments
David E. Sander, Christoph Knauder and Hannes Allmaier want to greatly acknowledge the generous permission of Renault to publish all data. Furthermore, we want to thank Jean-Pierre Le Lagadec and Geoffrey Pagnoux for their helpful review of this paper. Also, we would like to express our gratitude to Dow Europe GmbH for providing the polyalkylene glycol lubricant. This project has received funding from the European Union’s Horizon 2020 research and innovation programme under grant agreement No. 636380. Furthermore, the work in this project was partially funded by the COMET K2—Competence Centres for Excellent Technologies Programme of the Austrian Federal Ministry for Transport, Innovation and Technology (bmvit), the Austrian Federal Ministry of Science, Research and Economy (bmwfw), the Austrian Research Promotion Agency (FFG), the Province of Styria and the Styrian Business Promotion Agency (SFG).
Author Contributions
All authors conceived and designed the experiments and discussed the results; Christoph Knauder and David E. Sander performed the experiments; Slavitsa Damjanović-Le Baleur and Philippe Mallet contributed the test engine and provided test equipment; Hannes Allmaier and David E. Sander analyzed the data and wrote the paper.
Conflicts of Interest
The authors declare no conflict of interest.
Abbreviations
The following abbreviations are used in this manuscript:
| VI | Viscosity index |
| PG | Polyalkylene glycol |
| ICE | Internal combustion engine |
| HTHS | High temperature high shear (viscosity) |
| IMEP | Indicated mean effective pressure |
| BMEP | Brake mean effective pressure |
| FMEP | Friction mean effective pressure |
| TDC | Top dead center |
| DOHC | Double over head camshafts |
| DLC | Diamond-like carbon |
References
- Fontaras, G.; Samaras, Z. On the way to 130g CO2/km—Estimating the future characteristics of the average European passenger car. Energy Policy 2010, 38, 1826–1833. [Google Scholar] [CrossRef]
- Holmberg, K.; Andersson, P.; Erdemir, A. Global energy consumption due to friction in passenger cars. Tribol. Int. 2012, 47, 221–234. [Google Scholar] [CrossRef]
- Okrent, E.H. The Effect of Lubricant Viscosity and Composition on Engine Friction and Bearing Wear. ASLE Trans. 1961, 4, 97–108. [Google Scholar] [CrossRef]
- Davison, E.D.; Haviland, M.L. Lubricant Viscosity Effects on Passenger Car Fuel Economy; SAE Technical Paper 750675; SAE International: Warrendale, PA, USA, 1975. [Google Scholar]
- Gjerde, H.B.; Younghouse, E.C. A Diesel Engine Test to Evaluate Fuel Consumption Effects of Lubricants; SAE Technical Paper 841368; SAE International: Warrendale, PA, USA, 1984. [Google Scholar]
- Taylor, R.I.; Coy, R.C. Improved fuel efficiency by lubricant design: A review. Proc. Inst. Mech. Eng. J 2000, 214, 1–15. [Google Scholar] [CrossRef]
- Carden, P.; Pisani, C.; Andersson, J.; Field, I.; Lainé, E.; Bansal, J.; Devine, M. The effect of low viscosity oil on the wear, friction and fuel consumption of a heavy duty truck engine. SAE Int. J. Fuels Lubr. 2013, 6, 311–319. [Google Scholar] [CrossRef]
- Plumley, M.J.; Wong, V.W.; Martins, T.V. Demonstrating Improved Fuel Economy Using Subsystem Specific Lubricants on a Modified Diesel Engine. Tribol. Trans. 2016. [Google Scholar] [CrossRef]
- Young, A. Fuel economy drives change for passenger car oil formulations. Lube-Tech 2015, 99, 25–28. [Google Scholar]
- Qu, J.; Blau, P.J.; Dai, S.; Luo, H.; Meyer, H.M. Ionic liquids as novel lubricants and additives for Diesel engine applications. Tribol. Lett. 2009, 35, 181–189. [Google Scholar] [CrossRef]
- Woydt, M. Polyalkyleneglycols as next generation engine oils. J. ASTM Int. 2012, 8, 1–15. [Google Scholar]
- Igartua, A.; Fernández, X.; Areitioaurtena, O.; Luther, R.; Seyfert, C.; Rausch, J.; Illarramendi, I.; Berg, M.; Schultheiß, H.; Duffau, B.; et al. Biolubricants and triboreactive materials for automotive applications. Tribol. Int. 2009, 42, 561–568. [Google Scholar] [CrossRef]
- Tormos, B.; Ramírez, L.; Johansson, J.; Björling, M.; Larsson, R. Fuel consumption and friction benefits of low viscosity engine oils for heavy duty applications. Tribol. Int. 2017, 110, 23–34. [Google Scholar] [CrossRef]
- Knauder, C.; Allmaier, H.; Sander, D.E.; Salhofer, S.; Reich, F.M.; Sams, T. Analysis of the journal bearing friction losses in a heavy-duty Diesel engine. Lubricants 2015, 3, 142–154. [Google Scholar] [CrossRef]
- Skjoedt, M.; Butts, R.; Assanis, D.N.; Bohac, S.V. Effects of oil properties on spark-ignition gasoline engine friction. Tribol. Int. 2008, 41, 556–563. [Google Scholar] [CrossRef]
- Cuthbert, J.; Gangopadhyay, A.; Elie, L.; Liu, Z.; Mcwatt, D.; Hock, E.D.; Erdemir, A. Engine Friction and Wear Performances with Polyalkylene Glycol Engine Oils; SAE Technical Paper 2016-01-2271; SAE International: Warrendale, PA, USA, 2016. [Google Scholar]
- Merryweather, S.; Zweifel, D.; Woydt, M. Polyglycol-based engine oils—Has the industry to adapt to this lubricant class? In Proceedings of the 5th World Tribology Conference, Torino, Italy, 8–13 September 2013. [Google Scholar]
- Allmaier, H.; Knauder, C.; Sander, D.E.; Reich, F. Combination of Measurement and Simulation to Analyse Engine Friction. MTZ Worldw. 2016, 77, 66–71. [Google Scholar] [CrossRef]
- Allmaier, H.; Knauder, C.; Salhofer, S.; Reich, F.; Schalk, E.; Ofner, H.; Wagner, A. An experimental study of the load and heat influence from combustion on engine friction. Int. J. Engine Res. 2016, 17, 347–353. [Google Scholar] [CrossRef]
- Sander, D.E.; Allmaier, H.; Reich, F.M. Determination of friction losses in combustion engines—Combination of measurement and validated EHD journal bearing simulation. In Proceedings of the VDI-Berichte 2202, Schweinfurt, Germany, 23–24 April 2013; pp. 165–175. [Google Scholar]
- Allmaier, H.; Priestner, C.; Sander, D.E.; Reich, F.M. Friction in automotive engines. In Tribology in Engineering; Pihtili, H., Ed.; InTech: Rijeka, Croatia, 2013; pp. 149–184. [Google Scholar]
- Allmaier, H.; Sander, D.E.; Priebsch, H.; Witt, M.; Füllenbach, T.; Skiadas, A. Non-Newtonian and running-in wear effects in journal bearings operating under mixed lubrication. Proc. Inst. Mech. Eng. J. 2016, 230, 135–142. [Google Scholar] [CrossRef]
- Sander, D.E.; Allmaier, H.; Priebsch, H.; Reich, F.; Witt, M.; Füllenbach, T.; Skiadas, A.; Brouwer, L.; Schwarze, H. Impact of high pressure and shear thinning on journal bearing friction. Tribol. Int. 2015, 81, 29–37. [Google Scholar] [CrossRef]
- Sander, D.E.; Allmaier, H.; Priebsch, H. Friction and Wear in Automotive Journal Bearings Operating in Today’s Severe Conditions. In Advances in Tribology; Darji, P.P.H., Ed.; InTech: Rijeka, Croatia, 2016; pp. 143–172. [Google Scholar]
- De Carvalho, M.J.S.; Seidl, P.R.; Belchior, C.R.P.; Sodré, J.R. Lubricant viscosity and viscosity improver additive effects on Diesel fuel economy. Tribol. Int. 2010, 43, 2298–2302. [Google Scholar] [CrossRef]
- Blanchard, E.; Visconti, J.; Coblence, P.; Legrand, F.; Gautier, F.; Chevrot, M.; Clautet, M.; Trochu, F. The new Renault dCi 130 1.6 l Diesel engine. In Proceedings of the Aachener Kolloquium Fahrzeug-und Motortechnik 2010, Aachen, Germany, 4–6 October 2010. [Google Scholar]
- Schreer, K.; Roth, I.; Schneider, S.; Ehnis, H. Analysis of Aluminum and Steel Pistons—Comparison of Friction, Piston Temperature, and Combustion. J. Eng. Gas Turbines Power 2014, 136, 101506. [Google Scholar] [CrossRef]
- Schneider, S.; Schreer, K.; Ehnis, H.; Spangenberg, S. System Comparison of Aluminium and Steel Pistons for PC Diesel Engines. MTZ Worldw. 2013, 74, 32–37. [Google Scholar] [CrossRef]
- Allmaier, H.; Priestner, C.; Reich, F.; Priebsch, H.; Novotny-Farkas, F. Predicting friction reliably and accurately in journal bearings—Extending the EHD simulation model to TEHD. Tribol. Int. 2013, 58, 20–28. [Google Scholar] [CrossRef]
- Sander, D.E.; Allmaier, H.; Priebsch, H.; Witt, M.; Skiadas, A. Simulation of journal bearing friction in severe mixed lubrication—Validation and effect of surface smoothing due to running-in. Tribol. Int. 2016, 96, 173–183. [Google Scholar] [CrossRef]
© 2017 by the authors. Licensee MDPI, Basel, Switzerland. This article is an open access article distributed under the terms and conditions of the Creative Commons Attribution (CC BY) license (http://creativecommons.org/licenses/by/4.0/).