Article

A Novel Bearing Fault Diagnosis Framework with a Multi-Scale Feature Extraction Module and Efficient Content-Guided Attention Mechanism


1
School of Engineering, Jiangxi Agricultural University, Nanchang 330045, China
2
Jiangxi Engineering Research Center of Animal Husbandry Facility Technology Exploitation, Jiangxi Agricultural University, Nanchang 330045, China
3
School of Electronic and Electrical Engineering, Shanghai University of Engineering Science, Shanghai 201620, China
*
Author to whom correspondence should be addressed.
These authors contributed equally to this work.
Lubricants 2026, 14(3), 121; https://doi.org/10.3390/lubricants14030121
Submission received: 11 January 2026 / Revised: 4 March 2026 / Accepted: 10 March 2026 / Published: 12 March 2026

Abstract

Rolling bearing faults originate from complex tribodynamic interactions among rolling elements, raceways, and the cage, yielding nonlinear, non-stationary vibration signals that are highly susceptible to noise and operating-condition variations, which compromises the reliability of diagnosis. To address this issue, this paper proposes the RConvNeXt–ECGA framework. The main contributions are twofold: (1) RConvNeXt is a convolutional module based on ConvNeXt, which achieves efficient multi-scale feature extraction through grouped parallel convolutions with multiple receptive fields; (2) Efficient Content-Guided Attention (ECGA) is a novel pixel-level attention mechanism, which adaptively reweights feature maps to highlight informative regions and suppress irrelevant interference. The proposed method achieves an average accuracy of 99.8% on bearing datasets from Case Western Reserve University and Huazhong University of Science and Technology, and 94.33% under cross-operating-condition tests, demonstrating superior robustness and generalization over representative deep learning-based baseline models.

1. Introduction

Rolling bearings are indispensable components in modern rotating machinery and are extensively employed in transmission systems across the manufacturing industry. Previous studies indicate that 45–55% of rotating machinery failures are attributable to bearing defects, underscoring bearings’ critical role in system reliability and operational safety [1]. In industrial applications such as aero-engines, wind turbines, computer numerical control machine tools, and new energy vehicles, bearing malfunctions may lead to excessive vibration and noise, performance degradation, unexpected shutdowns, and even safety hazards. Consequently, the prompt detection and accurate diagnosis of bearing faults based on vibration measurements are essential for ensuring stable machine operation, reducing maintenance costs, and preventing severe secondary damage in rotating machinery systems [2,3].
From a physical-mechanism perspective, rolling bearing faults arise from intricate tribodynamic interactions among rolling elements, raceways, and cages during operation. As rolling elements periodically traverse the load zone, phenomena such as rolling–sliding contact, local surface fatigue damage, cage slip, and load-dependent contact deformation lead to cyclic variations in contact force and stiffness. These variations excite transient impulsive responses as well as amplitude and frequency modulation in vibration signals. Specifically, abrupt changes in the contact force induced by localized surface defects or contact irregularities typically manifest as periodic impulsive excitations, whereas periodic fluctuations in load distribution and contact stiffness modulate high-frequency vibration components. Consequently, fault-related vibration features are not randomly distributed but are predominantly concentrated around shaft rotational frequency and bearing characteristic frequencies. Owing to the non-sinusoidal nature of impulsive excitation, these frequency components are often accompanied by their harmonics, while low-frequency effects associated with load-zone variation and cage motion further generate sideband structures spaced at shaft rotational or cage frequencies. Lynagh et al. investigated bearing-induced vibration in high-speed precision spindles and demonstrated that surface waviness, off-sized rolling elements, and time-varying contact stiffness further give rise to distinct spectral components and modulation patterns [4]. Similarly, Vafaei et al. employed spectral analysis to examine vibration signals from high-speed spindles and revealed that specific frequency components and sideband structures can be directly linked to bearing defects, surface topography, and rotor unbalance [5]. Collectively, these studies identify a clear correlation between tribodynamic fault mechanisms and vibration signatures in the frequency domain.
To gain deeper insight into bearing vibration responses beyond spectral observations, tribodynamics-based dynamic models have been developed to explicitly couple rolling contact mechanics, friction, and lubrication with bearing dynamic and vibration behavior. For example, Mohammadpour et al. investigated the dynamics of roller bearings under a transient thermal mixed non-Newtonian elastohydrodynamic lubrication (EHL) regime, demonstrating that time-varying lubrication conditions and contact states can significantly influence the dynamic response and vibration characteristics of bearings [6]. Related studies have further coupled mixed-EHL contact formulations with multibody bearing dynamics to quantify how operating parameters (e.g., load, speed, and lubricant viscosity) affect contact forces and dynamic responses [7], and have incorporated frictional effects such as skidding to reveal their impact on vibration characteristics [8]. Moreover, EHL-based contact stiffness/damping models have also been integrated into rotor–bearing vibration analyses, highlighting the role of lubrication-dependent contact dynamics in the system response [9]. Collectively, these mechanistic studies provide a physics-grounded basis for vibration-based fault diagnosis and motivate robust feature learning under noise and time-varying operating conditions.
Despite their clear physical interpretability, translating such vibration features into reliable diagnostic indicators remains challenging in practical industrial scenarios. Environmental noise, structural resonances, and time-varying operational conditions often distort or mask impulse-related and modulation-related components, resulting in vibration responses characterized by distinct nonlinearity, non-stationarity, and strong coupling. Under these circumstances, bearing fault features may vary markedly with operating conditions, making it difficult to maintain robust and consistent performance in feature extraction and fault discrimination.
In the face of the aforementioned practical diagnostic challenges, the limitations of conventional bearing fault diagnosis methods have become increasingly apparent. These methods rely predominantly on handcrafted feature design and selection, requiring substantial prior knowledge and manual intervention. As a result, they typically exhibit limited diagnostic accuracy and poor generalization in complex and time-varying operating environments, and are becoming increasingly inadequate for practical industrial applications [10].
With the rapid advancement of information technology, intelligent fault diagnosis methods based on deep learning have become a research focus [11]. By exploiting multi-layer nonlinear transformation mechanisms, neural networks are capable of adaptively learning multi-scale and high-level representations directly from raw vibration signals [12]. This data-driven learning paradigm enables the construction of complex mappings between measured signals and bearing health states, thereby facilitating end-to-end bearing fault diagnosis without explicit feature engineering [13,14,15].
However, effectively learning discriminative fault features from raw vibration signals under strong noise and non-stationary conditions remains challenging, which has motivated the integration of time–frequency analysis with deep learning for bearing fault diagnosis [16]. This approach effectively improves the accuracy and the speed of mechanical fault diagnosis. For example, Gundewar et al. introduced a diagnostic model by combining time-frequency transform with a convolutional neural network (CNN) [17], and further optimized it through compression techniques, significantly improving the model’s diagnostic speed [18]. However, the time-frequency segmentation strategy with a fixed time window may lose some sequential continuity features. Peng et al. employed short-time Fourier transform (STFT) for data preprocessing, subsequently feeding the transformed results into a deep residual network to enhance fault classification accuracy notably [19]. However, the inherent mutual restriction between time and frequency resolution of STFT reduces its generalization performance under strong noise conditions. Verstrate et al. found that CNN models using continuous wavelet transform (CWT) images as inputs achieved superior diagnostic accuracy compared to conventional time-frequency domain approaches [20], such as the STFT and Hilbert-Huang transform (HHT) [21]. Xu et al. input 2D time-frequency images obtained by performing CWT on the initial data into the deep learning models to automatically learn fault features [22]. This method effectively enhances classification accuracy and robustness. The CWT-generated images not only provide high-precision frequency resolution but also capture local signal variations and accurately represent signal time-frequency distributions. Therefore, CWT-generated images have found widespread adoption in mechanical fault diagnosis [23].
In recent years, the ConvNeXt network [24] has received extensive attention, which achieves ImageNet Top-1 accuracy by reconstructing the architecture of traditional convolutional networks. Based on the ResNet framework [25], this network incorporates key designs from the Swin Transformer [26]. Specifically, ordinary convolutions are replaced with depth-wise separable convolutions, and an inverted residual structure is adopted. This design yields a more compact architecture by minimizing the parameter count in the convolutional process [27]. Therefore, it constructed a pure convolutional neural network model with stronger feature representation capabilities. Such design concepts and technical characteristics offer valuable insights for future neural network architecture designs and exhibit significant application potential in bearing fault diagnosis. A hierarchical feature fusion mechanism in this network enhances the representation ability for early weak faults by effectively integrating the time-frequency features of vibration signals. Meanwhile, the inverted residual structure effectively enhances the model’s feature robustness in strong noise backgrounds by dynamically adjusting feature channels.
Guo et al. developed a ConvNeXt model augmented with attention mechanisms, which integrates a parallel residual module featuring multi-scale dilated convolutions. Such a structural design notably enhances the model’s capacity for extracting and fusing multi-scale fault features. Nevertheless, the model’s intricate architecture may hinder its computational efficiency in lightweight and real-time diagnostic scenarios [28]. Zhao et al. developed a hybrid model combining ConvNeXt with multi-scale dilated attention, which efficiently fuses local features and global contextual dependencies to boost diagnostic robustness [29]. Despite the method’s high sensitivity to hyperparameter settings, further validation is needed to assess its generalization performance across different operational conditions. Furthermore, Yang et al. introduced the symmetric dot pattern technique to transform vibration signals into texture images, and then leveraged ConvNeXt for fault recognition [30]. This approach well preserves the topological characteristics of bearing faults. However, its performance is heavily contingent on high-quality image conversion. In high-noise environments, the feature discriminability of this method tends to degrade, and it also fails to fully account for the temporal dynamics inherent in the original signals. Zhang et al. built the wave-ConvNeXt model by integrating wavelet transform with the customized ConvNeXt to significantly reduce computational time complexity while ensuring improved prediction accuracy [31]. These advancements demonstrate that the extensibility of ConvNeXt provides a solid technical foundation for constructing intelligent diagnostic systems with high precision and strong robustness.
This paper focuses on two critical challenges in industrial rolling bearing fault diagnosis: environmental noise interference and feature distribution shifts caused by dynamic operational conditions. As documented in the literature, these factors have been widely studied as key obstacles to the advancement of diagnostic technology. Mechanistically, once a fault occurs in a bearing, the contact state between the rolling elements and the raceway, as well as the associated friction and lubrication conditions, changes accordingly and continues to evolve with fluctuations in operating conditions (e.g., load). This evolution further alters the local contact stiffness and frictional interactions, giving rise to diagnostic signatures in vibration signals, including impulsive responses, modulation effects, and multi-band components that can be exploited for fault diagnosis. However, under the combined influence of environmental noise and time-varying operating conditions, these fault signatures are readily masked and may exhibit feature drift, with significant discrepancies across time scales and frequency bands. Consequently, conventional single-scale feature extraction methods and fixed extraction strategies often fail to achieve stable and accurate bearing fault identification. A novel fault diagnosis model based on RConvNeXt-ECGA is proposed to overcome these limitations. The key innovations of this study are summarized as follows:
(1)
A novel convolutional module, RConvNeXt, is developed based on the ConvNeXt architecture. It applies differentiated convolution and fusion strategies for different feature groups and leverages multi-branch, multi-scale modeling to more effectively extract and characterize fault-relevant information.
(2)
A novel pixel-level attention mechanism, Efficient Content-Guided Attention (ECGA), is proposed. It uses input features as prior guidance to adaptively reweight feature maps in pixel-wise manner, thereby highlighting critical discriminative information and suppressing interference.
These two designs are complementary and work synergistically within the proposed framework to enhance the model’s adaptive feature extraction and learning capability against noise interference and time-varying operating conditions. As a result, critical discriminative information can be more accurately mined and preserved from deep representations, enabling reliable fault identification even under strong noise and varying load conditions. Comprehensive evaluations further demonstrate that the proposed model consistently outperforms representative deep-learning baselines across key metrics, validating its enhanced robustness and generalization.

2. Bearing Dataset

2.1. Signal Preprocessing

Wavelet analysis, with its strong time–frequency localization and multiscale representation capability, has been widely adopted in rolling bearing fault diagnosis, leading to the development of diverse methodological variants. From a framework perspective, prior studies can be largely categorized into two mainstream paradigms:
(i)
traditional pipelines centered on signal processing and feature engineering (feature extraction followed by classifier-based identification);
(ii)
end-to-end intelligent pipelines driven by data-based representation learning (feature learning and end-to-end classification).
Accordingly, the roles of wavelets differ across these two paradigms and can be summarized as follows:
(1)
Decomposition–reconstruction in traditional diagnostics. In traditional workflows, wavelets are mainly used for denoising, demodulation, and multiscale decomposition/reconstruction to enhance fault-relevant components and facilitate handcrafted feature extraction. These methods typically decompose vibration signals across multiple scales or frequency bands, select and reconstruct fault-informative components via windowing, and thereby isolate fault-related signatures (e.g., impacts and modulation) from complex vibration responses. Handcrafted features (e.g., energy, kurtosis, crest factor, and energy spectrum) are then extracted and fed into conventional classifiers (e.g., SVMs) for identification. A representative example is the IRR-WD method proposed by Vafaei and Rahnejat. It integrates repeatable runout extraction with wavelet decomposition to separate vibration components in different frequency bands and identify their sources, yielding clearer fault-related spectral components and improved physical interpretability [32].
(2)
Time–frequency representations in end-to-end intelligent diagnostics. In end-to-end workflows, wavelet-based methods—especially the continuous wavelet transform (CWT)—are more commonly used to construct time–frequency representations. These representations explicitly characterize nonstationary impulses, modulation sidebands, and resonance bands, providing structured inputs for deep learning models. The CWT enables multi-resolution time–frequency analysis, providing finer frequency resolution at low frequencies and superior time resolution for high-frequency transients [33]. This property makes it well suited to characterize the nonstationary bearing-fault signatures, where impact transients, modulation sidebands, and resonance bands coexist. This advantage stems directly from the CWT principle, defined as follows. For a given signal x(t), its local spectral information is obtained by performing a convolution of x(t) with a set of wavelet functions derived from the translation and scaling transformations of a mother wavelet. Due to this characteristic, the CWT can process time-varying non-stationary signals effectively [34]. The CWT is defined as:
CWT x ( s , τ ) = 1 s x ( t ) φ t τ s d t
where φ(t) defines the mother wavelet function, ∗ serves as the notation for convolution operation; s is the scaling factor that controls the stretching and shrinking of the wavelet; The translation factor τ determines the wavelet’s positional shift. By adjusting the scaling factor s and translation factor τ, signals can be analyzed at various scales and positions, thereby obtaining the signal’s local features in different time and frequency domains.
Under bearing fault conditions, tribodynamic interactions between rolling elements and raceways—including rolling–sliding contact, localized surface damage and abrupt variations in contact stiffness—generate transient impulsive responses accompanied by amplitude–frequency modulation effects. In the CWT time–frequency representation, these mechanisms manifest as localized energy concentration, enhanced high-frequency transient components, and temporally periodic variations in energy distribution. In particular, CWT time–frequency maps depict the temporal-frequency distribution of signal energy intensity and are effective in characterizing non-stationary fault transients and modulated components. Bright regions in the time–frequency map are generally associated with defect-induced impulsive excitations caused by rolling elements repeatedly passing over defect zones, whereas intensified high-frequency components indicate contact irregularities and time-varying contact dynamics [35]. By contrast, low-energy distributions and low-frequency components are primarily related to baseline system dynamics (e.g., steady rolling contact and kinematics), which are typically observed under healthy conditions [36]. Through multi-scale time–frequency analysis, the CWT can simultaneously characterize impulsive fault excitations, modulation phenomena, and background vibrations, thereby capturing time-varying fault features around bearing characteristic frequencies [37].
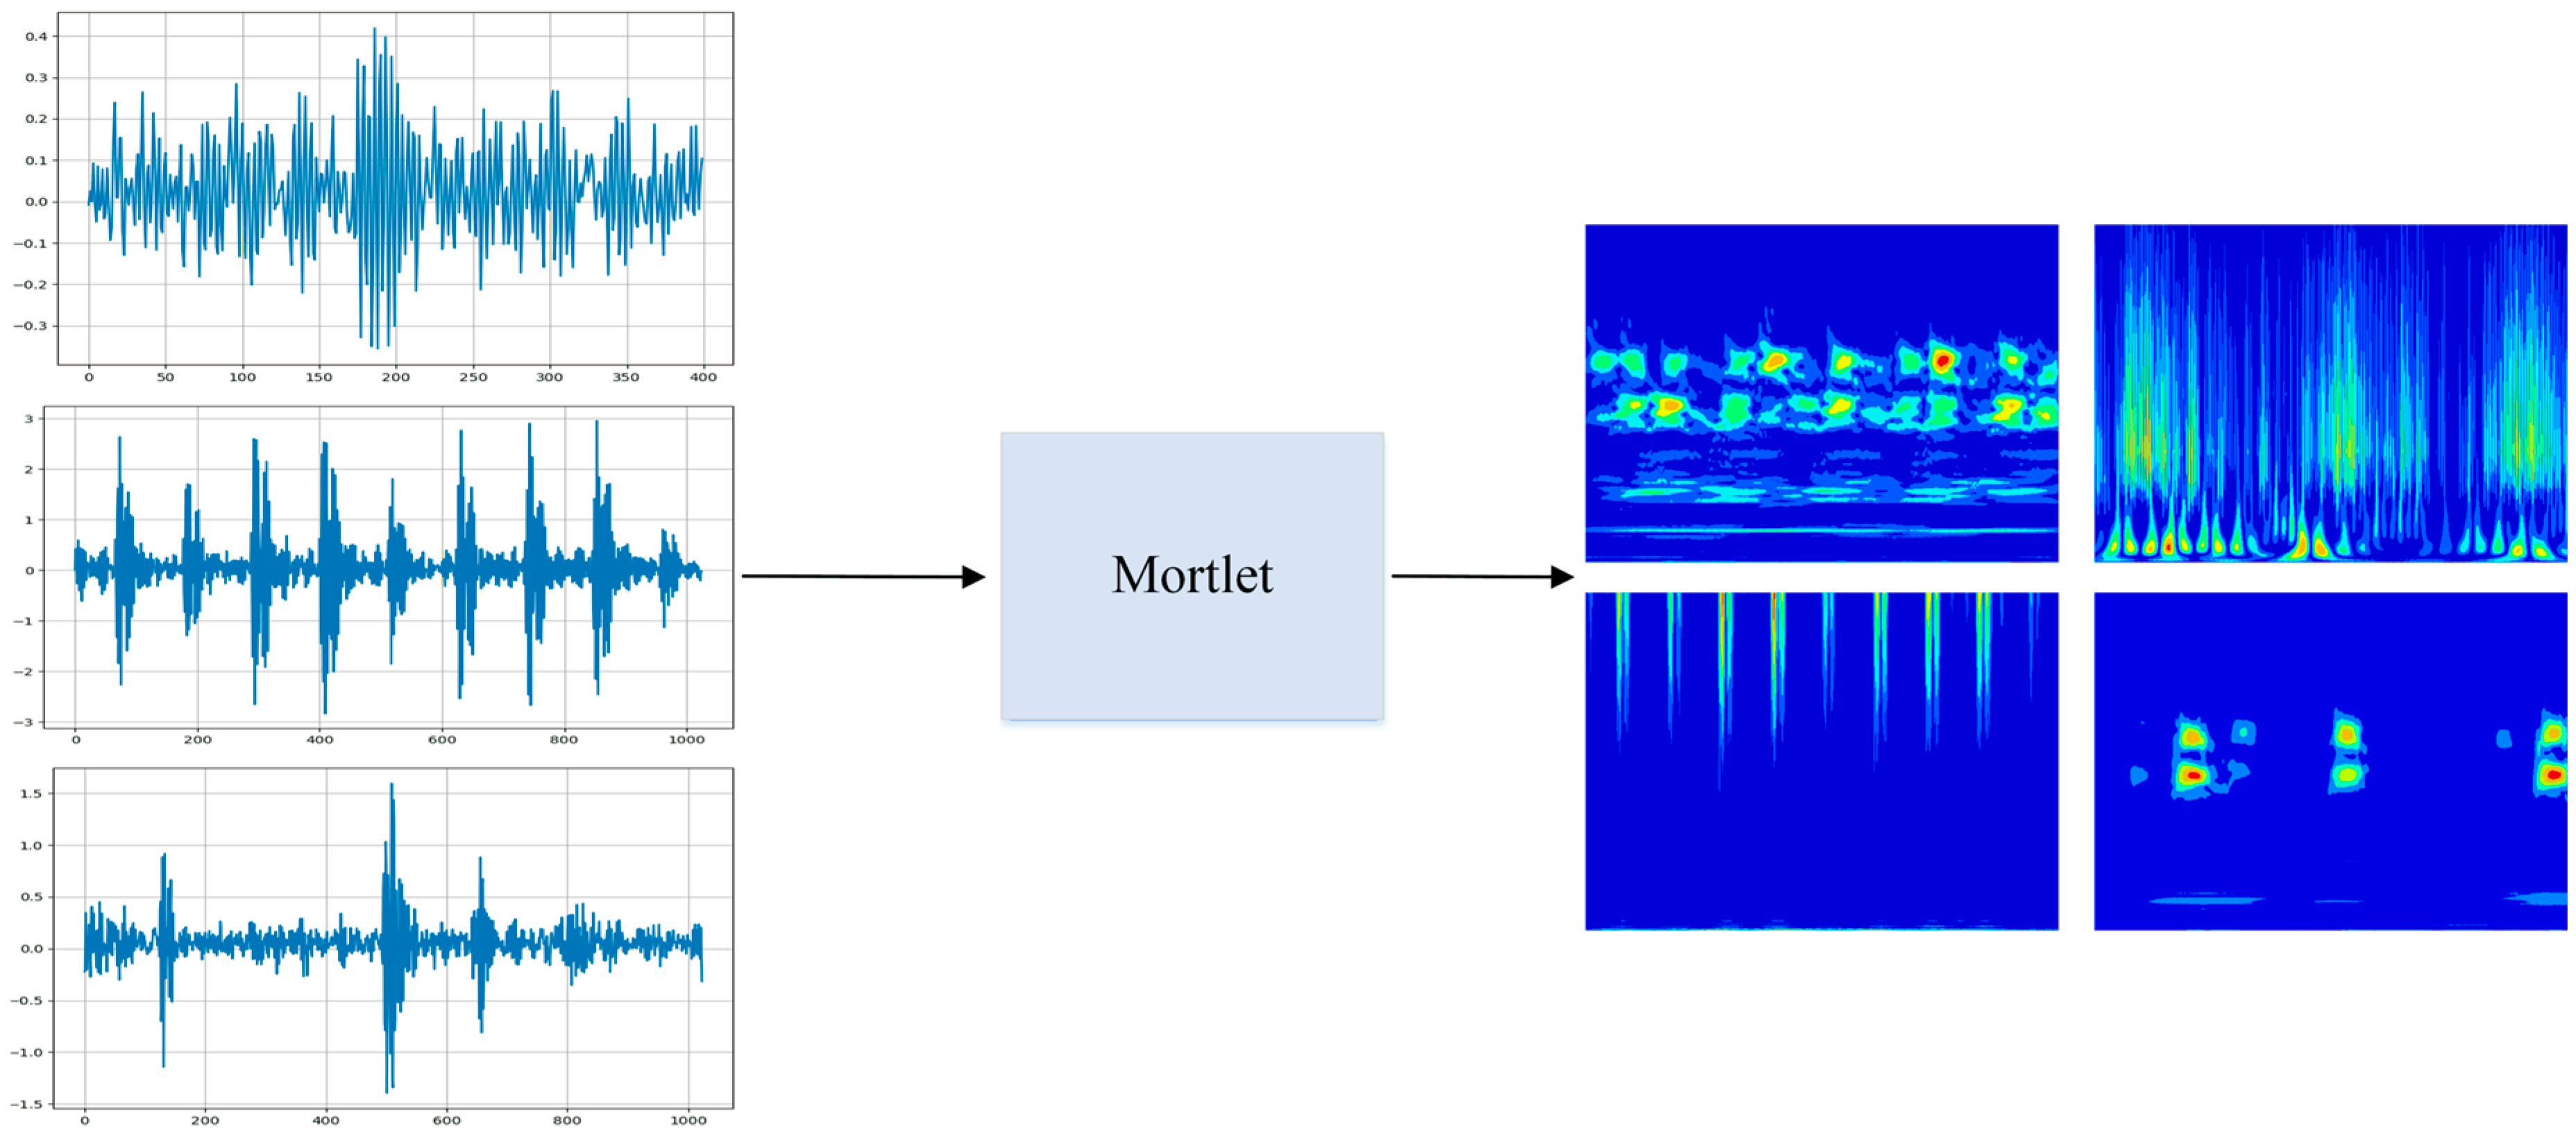
Accordingly, this study employs the Morlet wavelet to construct a two-dimensional time–frequency representation. The Morlet wavelet offers favorable joint time–frequency localization and a quasi-sinusoidal structure, which makes it particularly effective for highlighting resonance bands and modulation sidebands while preserving short-time impulsive transients. As a result, the generated CWT maps exhibit clearer energy ridges and more stable local texture patterns, providing informative and consistent inputs for the subsequent deep network. As illustrated in Figure 1, the ten fault classes are first segmented into sequences of 1024 sampling points to form time-series samples, which are then transformed into 2D feature maps via the Morlet-based CWT.
Moreover, coupling CWT-based time–frequency representations with deep networks is more engineering-friendly than the “decomposition–reconstruction + handcrafted features + classifier” paradigm. Conventional schemes are often sensitive to feature indices, band partitioning, and heuristic thresholds, and their separability tends to degrade under heavy noise and variable operating conditions. In contrast, deep models can automatically learn high-dimensional discriminative features directly from 2D time–frequency maps, reducing reliance on manual feature design and band selection. Meanwhile, the time–frequency representation fuses temporal and spectral information into a unified input, facilitating the capture of impact, modulation, and resonance signatures under noise and operating variations. Combined with the multi-scale modeling and attention mechanisms introduced later, the proposed framework further emphasizes discriminative response regions while suppressing irrelevant interference, thereby improving diagnostic robustness and generalization in complex conditions.

2.2. CWRU Bearing Dataset

The CWRU bearing dataset [38], a widely recognized resource for bearing fault diagnosis, is adopted to evaluate the performance of the proposed network model and conduct comparative experiments with existing typical fault diagnosis models. The experimental setup is composed of a torque sensor, a dynamometer, a control device, and a 2-horsepower induction motor. Here, SKF6205 deep-groove ball bearings manufactured by AB SKF (Gothenburg, Sweden) were selected for the experiments. The drive-end bearing data were sampled at 12 kHz under rotational speeds of 1730–1797 r/min.
To maintain the completeness of fault information in each signal sample, the sample length is set to 1024 sampling points. The data are randomly divided into 5000 samples by means of overlapping sampling. The samples are converted into 2D images by CWT. The dataset is then split in chronological order, with the initial 80% of the time series allocated to the training set and the remaining 20% to the test set. The specific division of the experimental datasets is shown in Table 1.
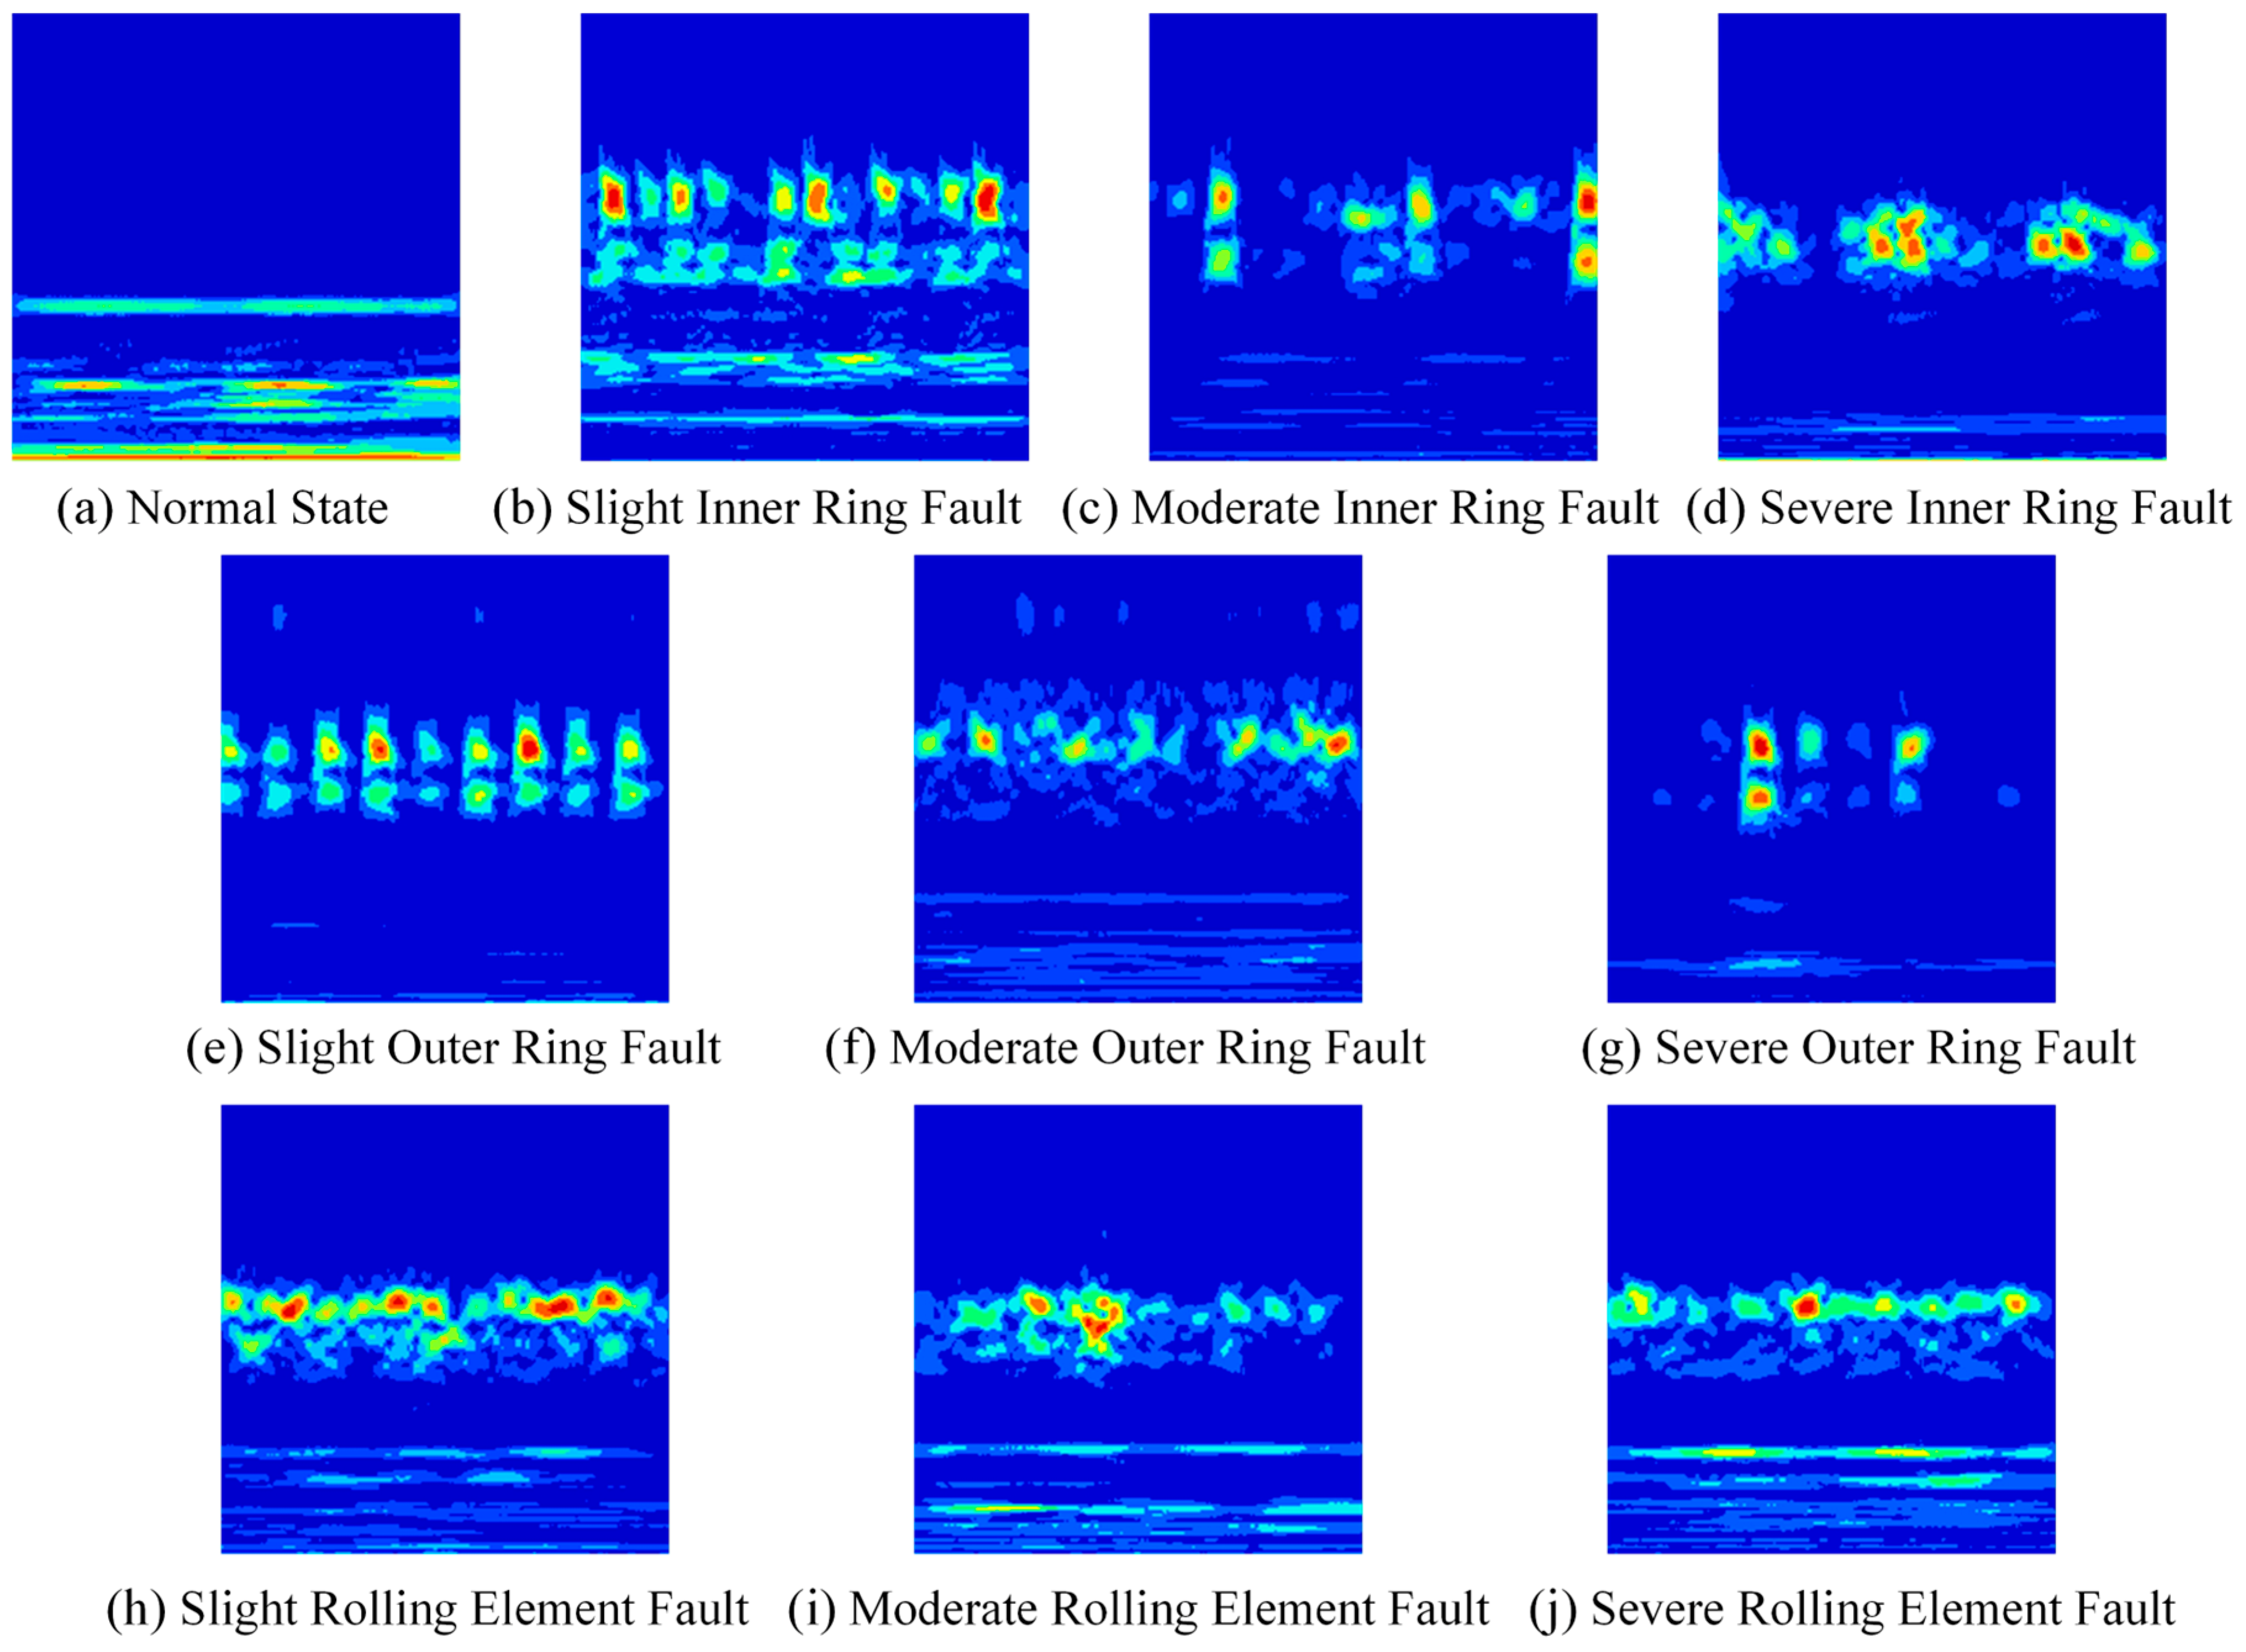
Figure 2 presents the CWT-generated bearing fault feature maps corresponding to different fault conditions, which are derived from the CWRU bearing dataset.

2.3. HUST Bearing Dataset

The HUST bearing dataset is an open-access benchmark [39]. This dataset contains vibration data from both normal bearings and several types of faulty bearings with varying severity levels. The dataset includes normal bearing data and eight distinct types of fault data at different severity levels, as presented in Table 2. Each fault type is labeled using one-hot encoding, with labels ranging from 0 to 8, resulting in nine categories. For model training, raw vibration signals are transformed into time-frequency spectrograms via the CWT, yielding a total of 2700 samples, each consisting of 1024 data points. These samples are split chronologically, with the first 80% of the time series used for training and the remaining 20% reserved for validation.
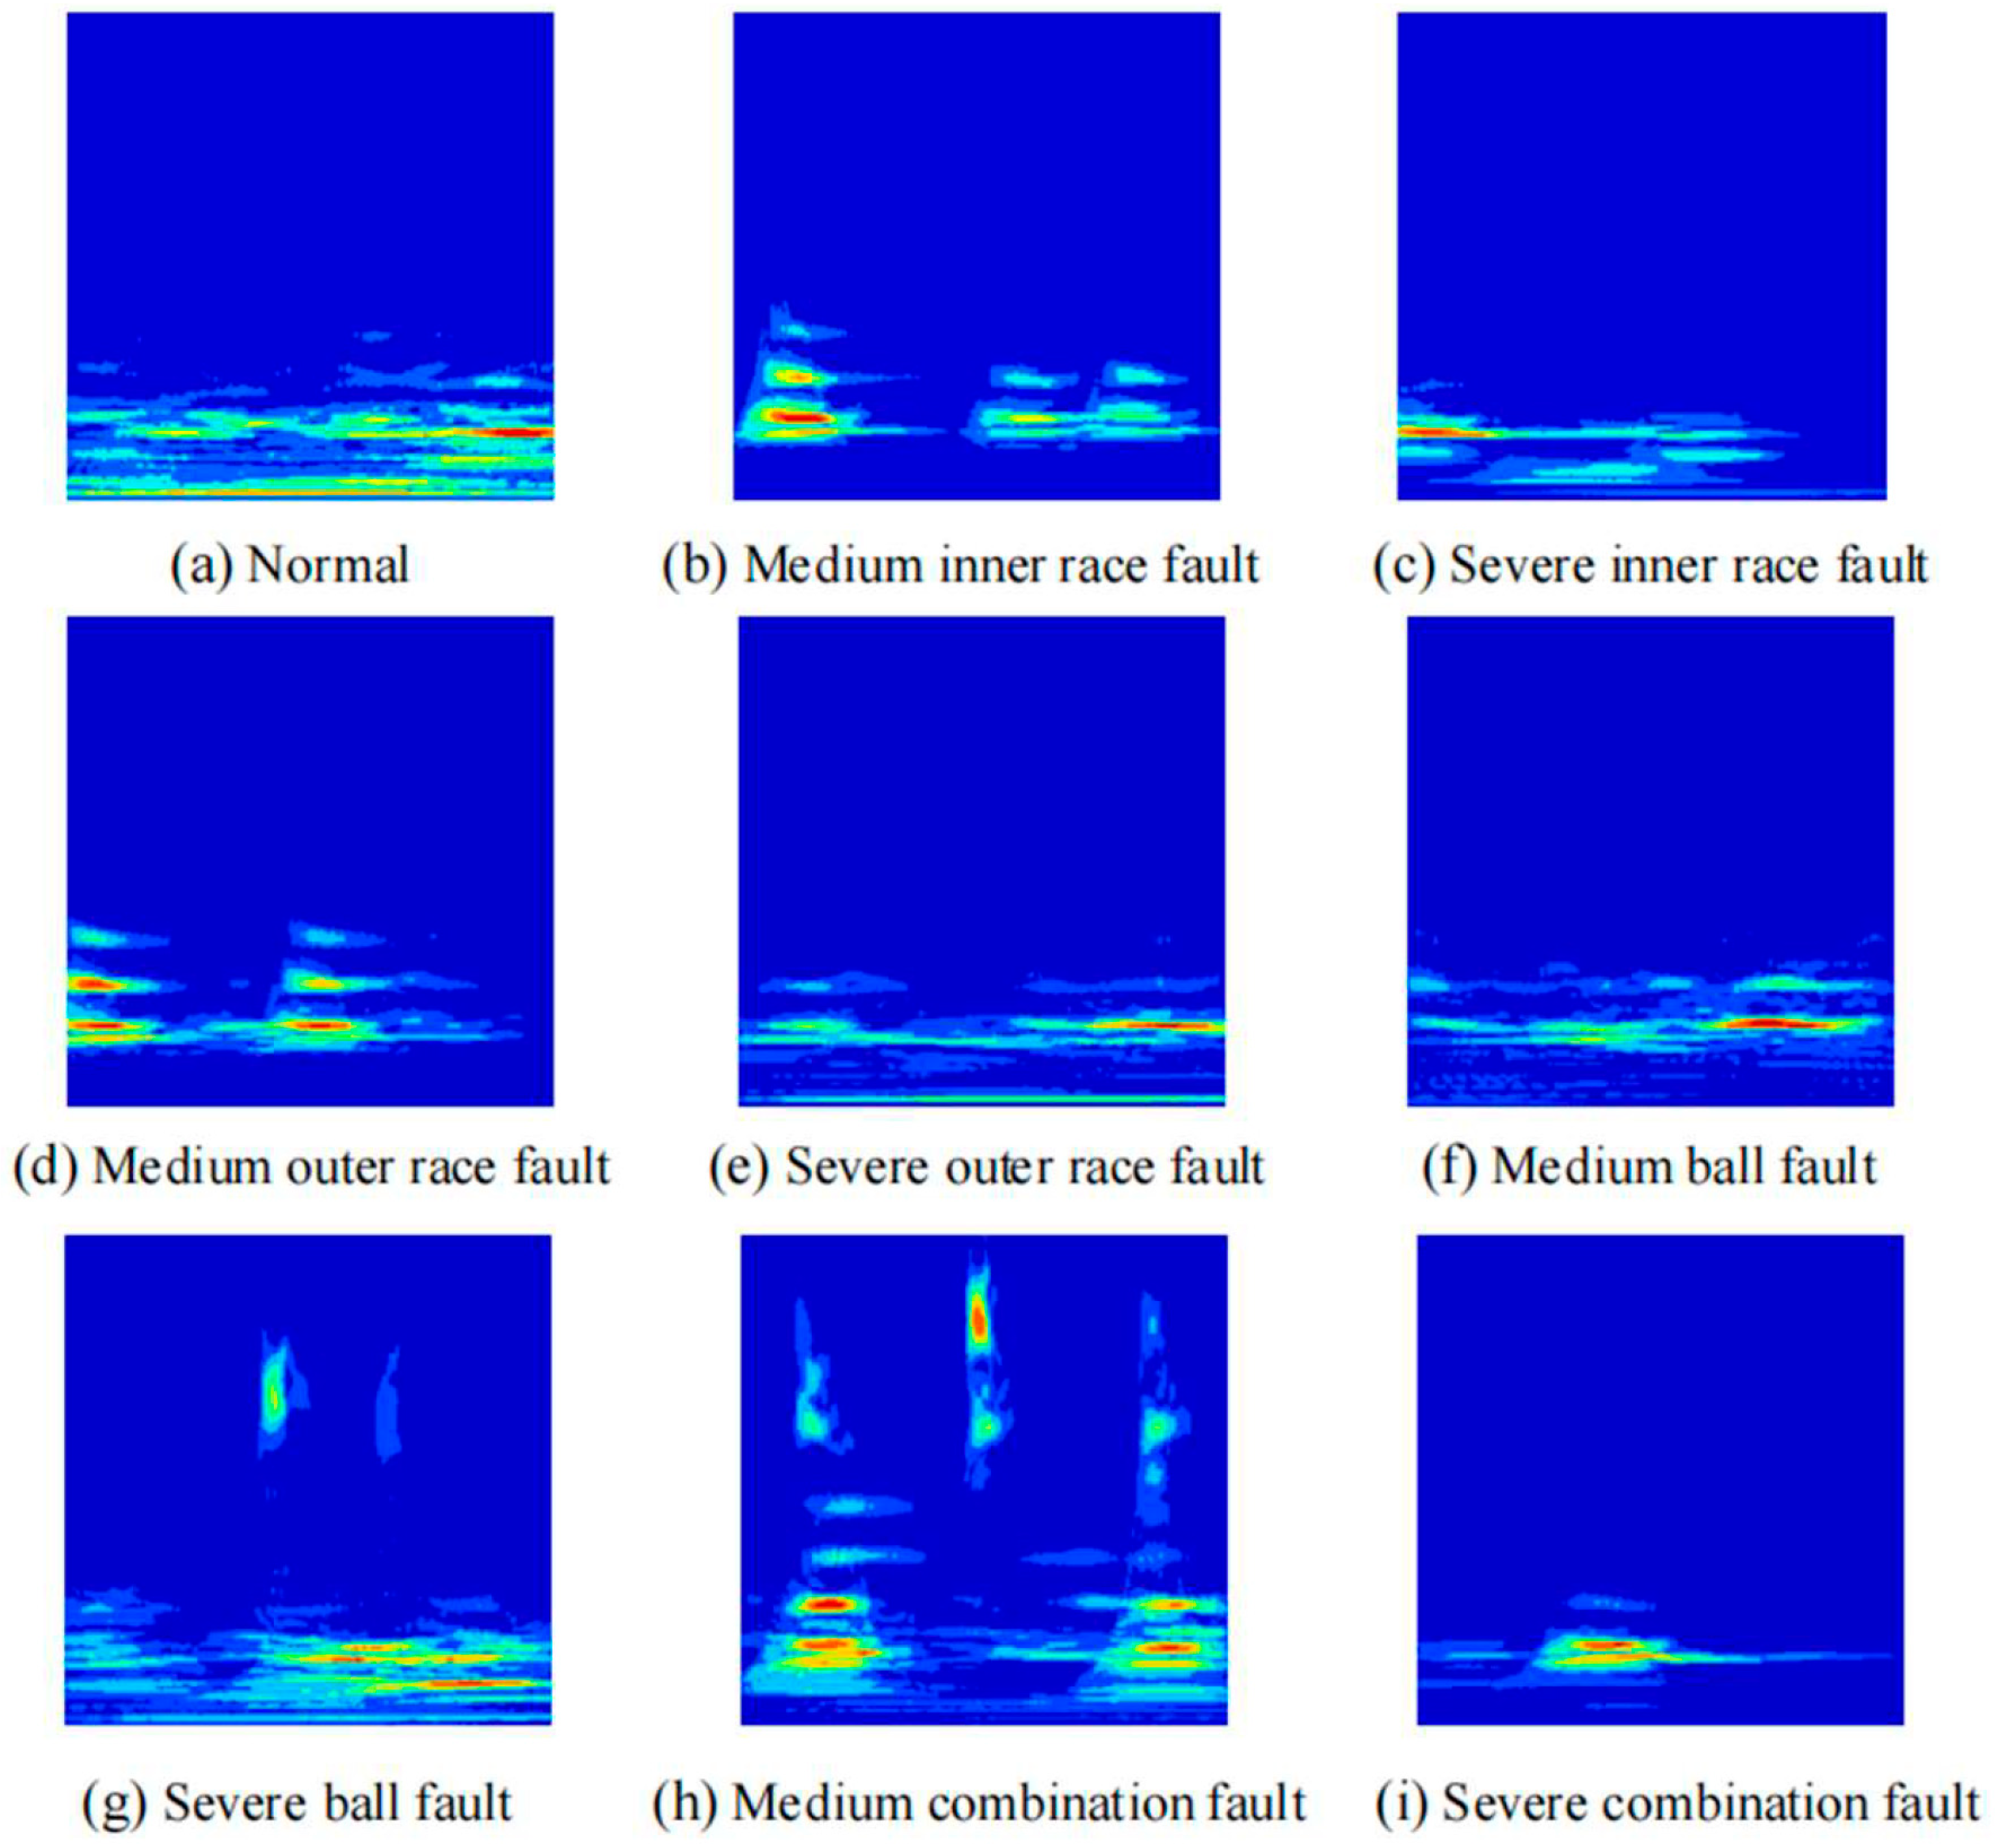
Figure 3 displays the counterpart feature maps generated via CWT for various fault conditions, with the HUST bearing dataset serving as the data source. As illustrated in Figure 2 and Figure 3, fault characteristics in the rolling bearing vibration signals are effectively captured in the distribution of pixel points with different colors and brightness levels on the time-frequency plane. The variation in brightness gradients shows a significant correlation with the distribution of signal energy in the time-frequency domain. High-energy regions are typically represented by bright colors, while low-energy regions appear as dark colors. During the time-frequency mapping process, the key information such as fault-related periodic impact and modulation features are converted into visual pixel patterns. This approach not only fully utilizes the multi-resolution analysis characteristics of wavelet transform but also presents signal features in both time and frequency domains, enabling a more accurate description of fault characteristics.
For the sake of improving feature expressiveness and the generalization performance of the model in handling time-frequency characteristics, a suite of data augmentation strategies is incorporated. Random horizontal flipping is applied through mirror symmetry, enabling the model to learn fault features from different orientations. This approach reduces dependence on specific vibration propagation directions, thereby improving recognition stability. Small-angle random rotation is employed to simulate tilting in time-frequency diagrams caused by rotational speed fluctuations under real operating conditions, which enhances the model’s adaptability to frequency variations. Additionally, the color distribution of time-frequency maps is randomly adjusted, which effectively expands the diversity of vibration energy representations under different acquisition conditions. Consequently, the model is guided to focus on the intrinsic energy distribution patterns of faults rather than superficial color differences.

3. Design and Implementation of the RConvNeXt-ECGA Model

The ConvNeXt network fuses the vision transformer (ViT) [40] and the residual network (ResNet). It not only retains the advantages of CNNs in local perception and spatial translation invariance, but also can model long-range dependencies similar to Transformers through optimization measures such as the inverted residuals structure, layer normalization (LN), and multi-layer perceptron (MLP). The ConvNeXt first surpassed the Swin transformer in both accuracy and inference speed.
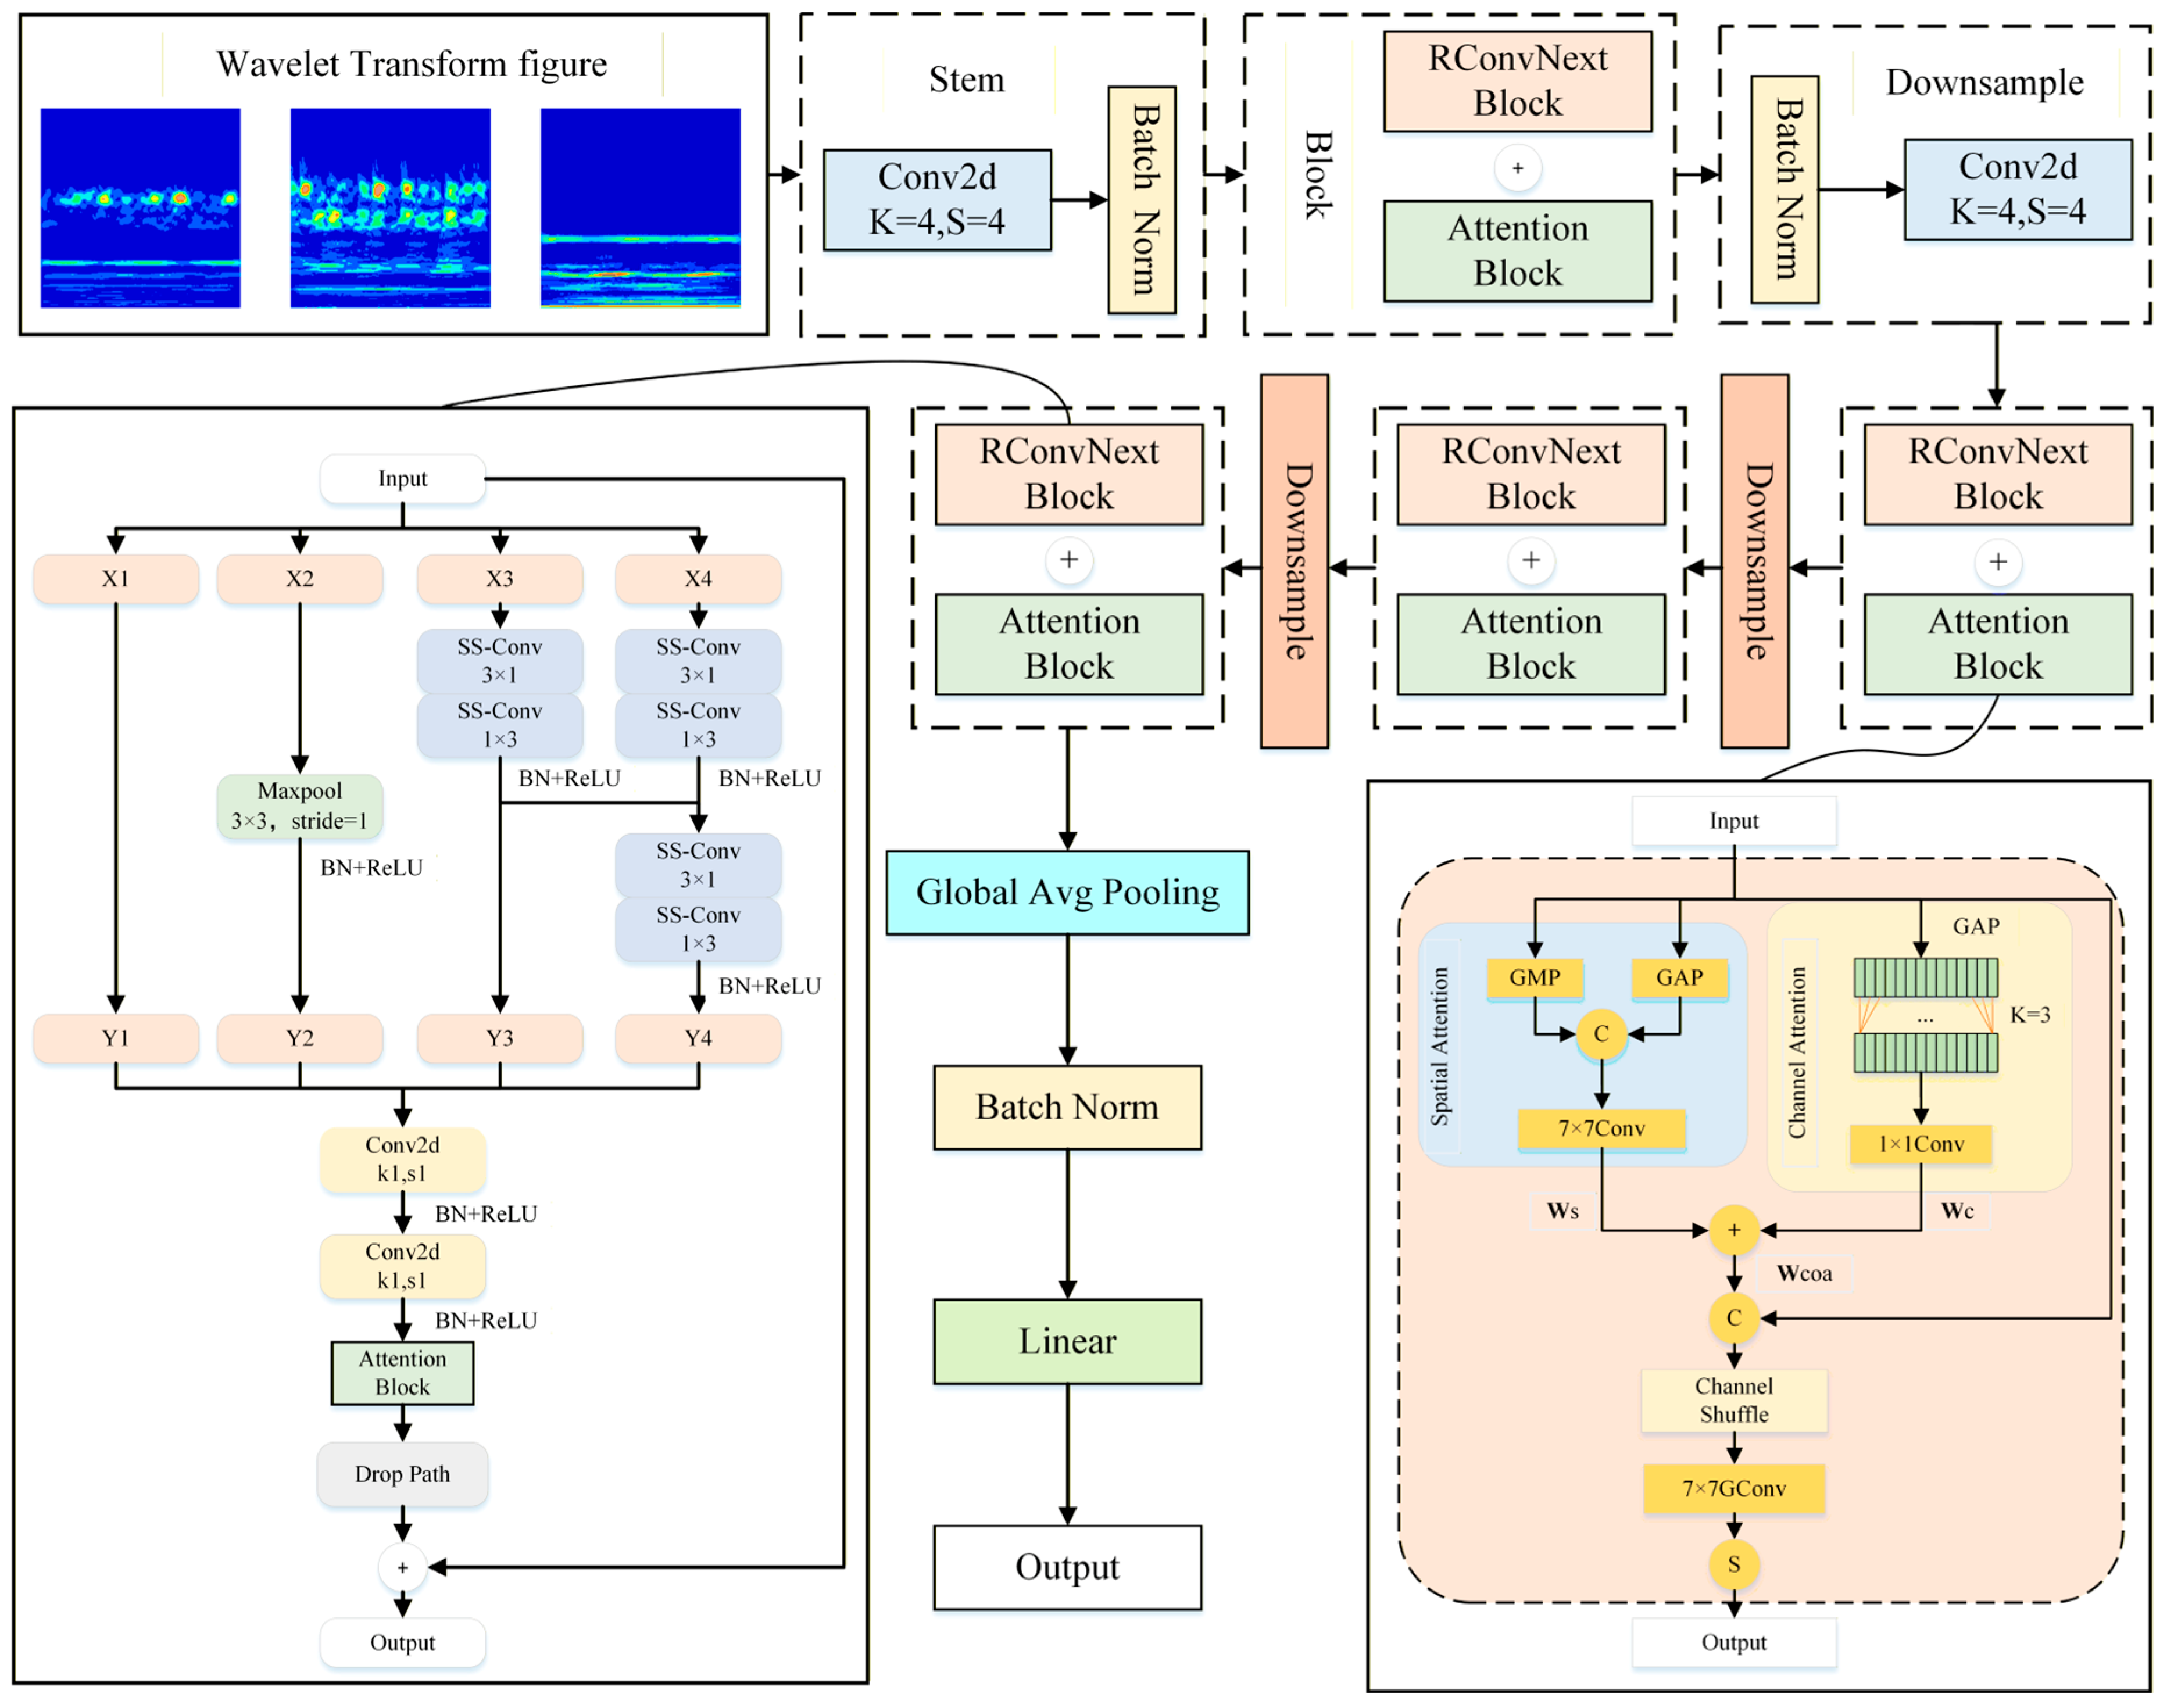
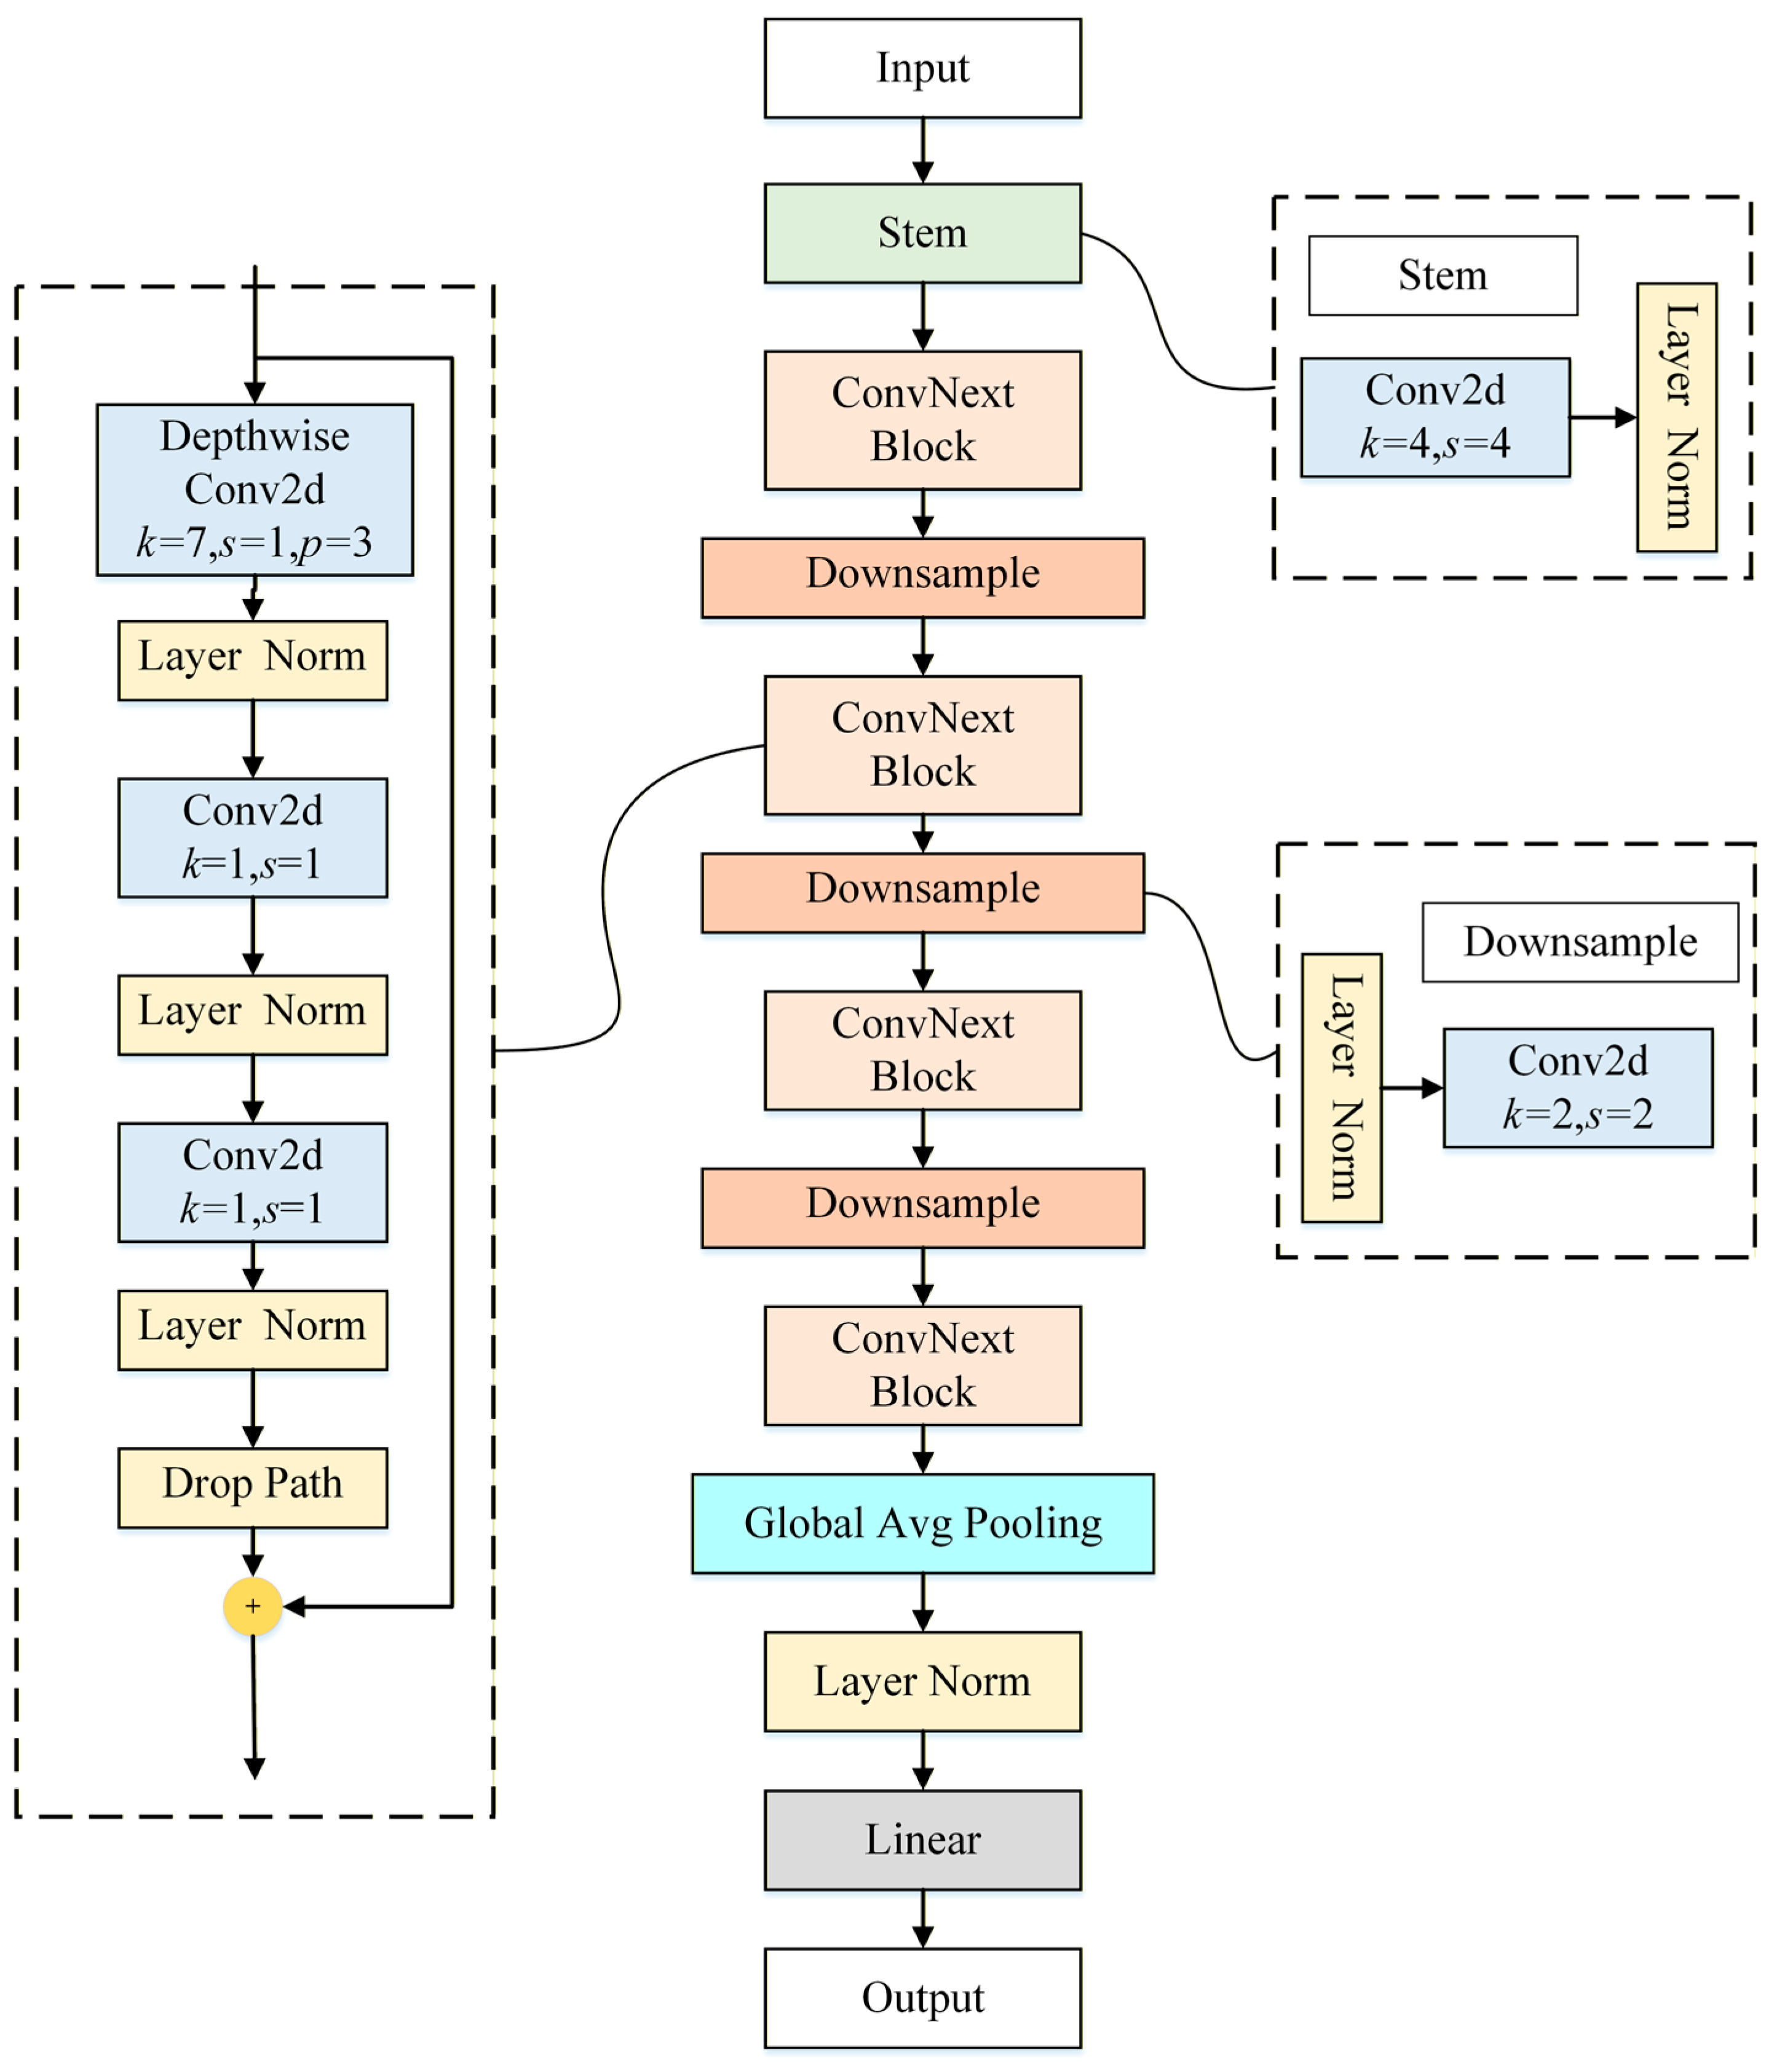
The ConvNeXt is shown in Figure 4, where k denotes kernel size, s denotes stride, and p denotes padding. The initial stem layer combines a 4 × 4 large convolution kernel with a LN layer. The input images are divided into multiple local image patches by 4 × 4 convolution, from which corresponding features are extracted. Global information interaction is achieved by subsequent network modules through cross-spatial correlation and integration of characteristic features from different regions. The LN layer stabilizes the feature distribution during deep network training and mitigates the problem of gradient vanishing. The network consists of four ConvNeXt blocks and three downsample layer modules. In each ConvNeXt block, depthwise separable convolutions are employed, which decompose standard convolutions into two phases: channel-wise depthwise convolutions and cross-channel pointwise convolutions. This approach drastically reduces the number of the model parameters and simultaneously boosts the model’s adaptability to shifts in the positional dynamics of bearing vibration signals. The terminal part is composed of a Global Average Pooling (GAP) layer, an LN layer, and a Linear layer, which collectively achieve global aggregation of features and generation of classification results.

3.1. Improved ConvNeXt

In practical applications, vibration signals acquired from rolling bearing are inevitably contaminated by environmental noise, which degrades the signal-to-noise ratio (SNR) of fault features. Meanwhile, variations in operating parameters (e.g., load and speed) induce distribution shifts and further complicate fault diagnosis. Furthermore, fault-induces vibrations are inherently multi-component and multi-scale. Rolling contact excitations generate short-duration impulsive transients, rotational frequency-related modulation sidebands, and resonance-dominated high-frequency components, with discriminative information dispersed across time scales and frequency bands and varying in salience under operating conditions. Under such circumstances, conventional single-branch CNNs with limited scale modeling capability often fail to capture key fault patterns or are easily overwhelmed by noise. Therefore, this paper introduces a multi-scale feature extraction mechanism to better capture cross-scale vibration characteristics, thereby enhancing feature learning capability and diagnostic robustness under strong noise and varying operating conditions.
As a key characteristic of the original ConvNeXt, standard convolutions are replaced by depthwise-separable convolutions [41]. Such a convolution consists of two successive operations: a depthwise convolution (DWConv) followed by a pointwise convolution (PWConv). This structure reduces model complexity while maintaining feature representation ability. During the DW convolution stage, each input channel is convolved with its own kernel, producing a feature map with the same number of channels as the input. Subsequently, the PW convolution performs channel-wise fusion via a 1 × 1 convolution, yielding a new feature representation. Although the depthwise convolution in the ConvNeXt network expands the receptive field, the utilization of 7 × 7 convolutional kernels substantially increased computational burden. To address this limitation, a grouped convolution operation combined with a multi-scale parallel strategy is proposed in this work, inspired by the architectural concepts of Res2Net [42] and Inception [43]. This approach not only reduces computational complexity but also enhances the representational capacity of the model.
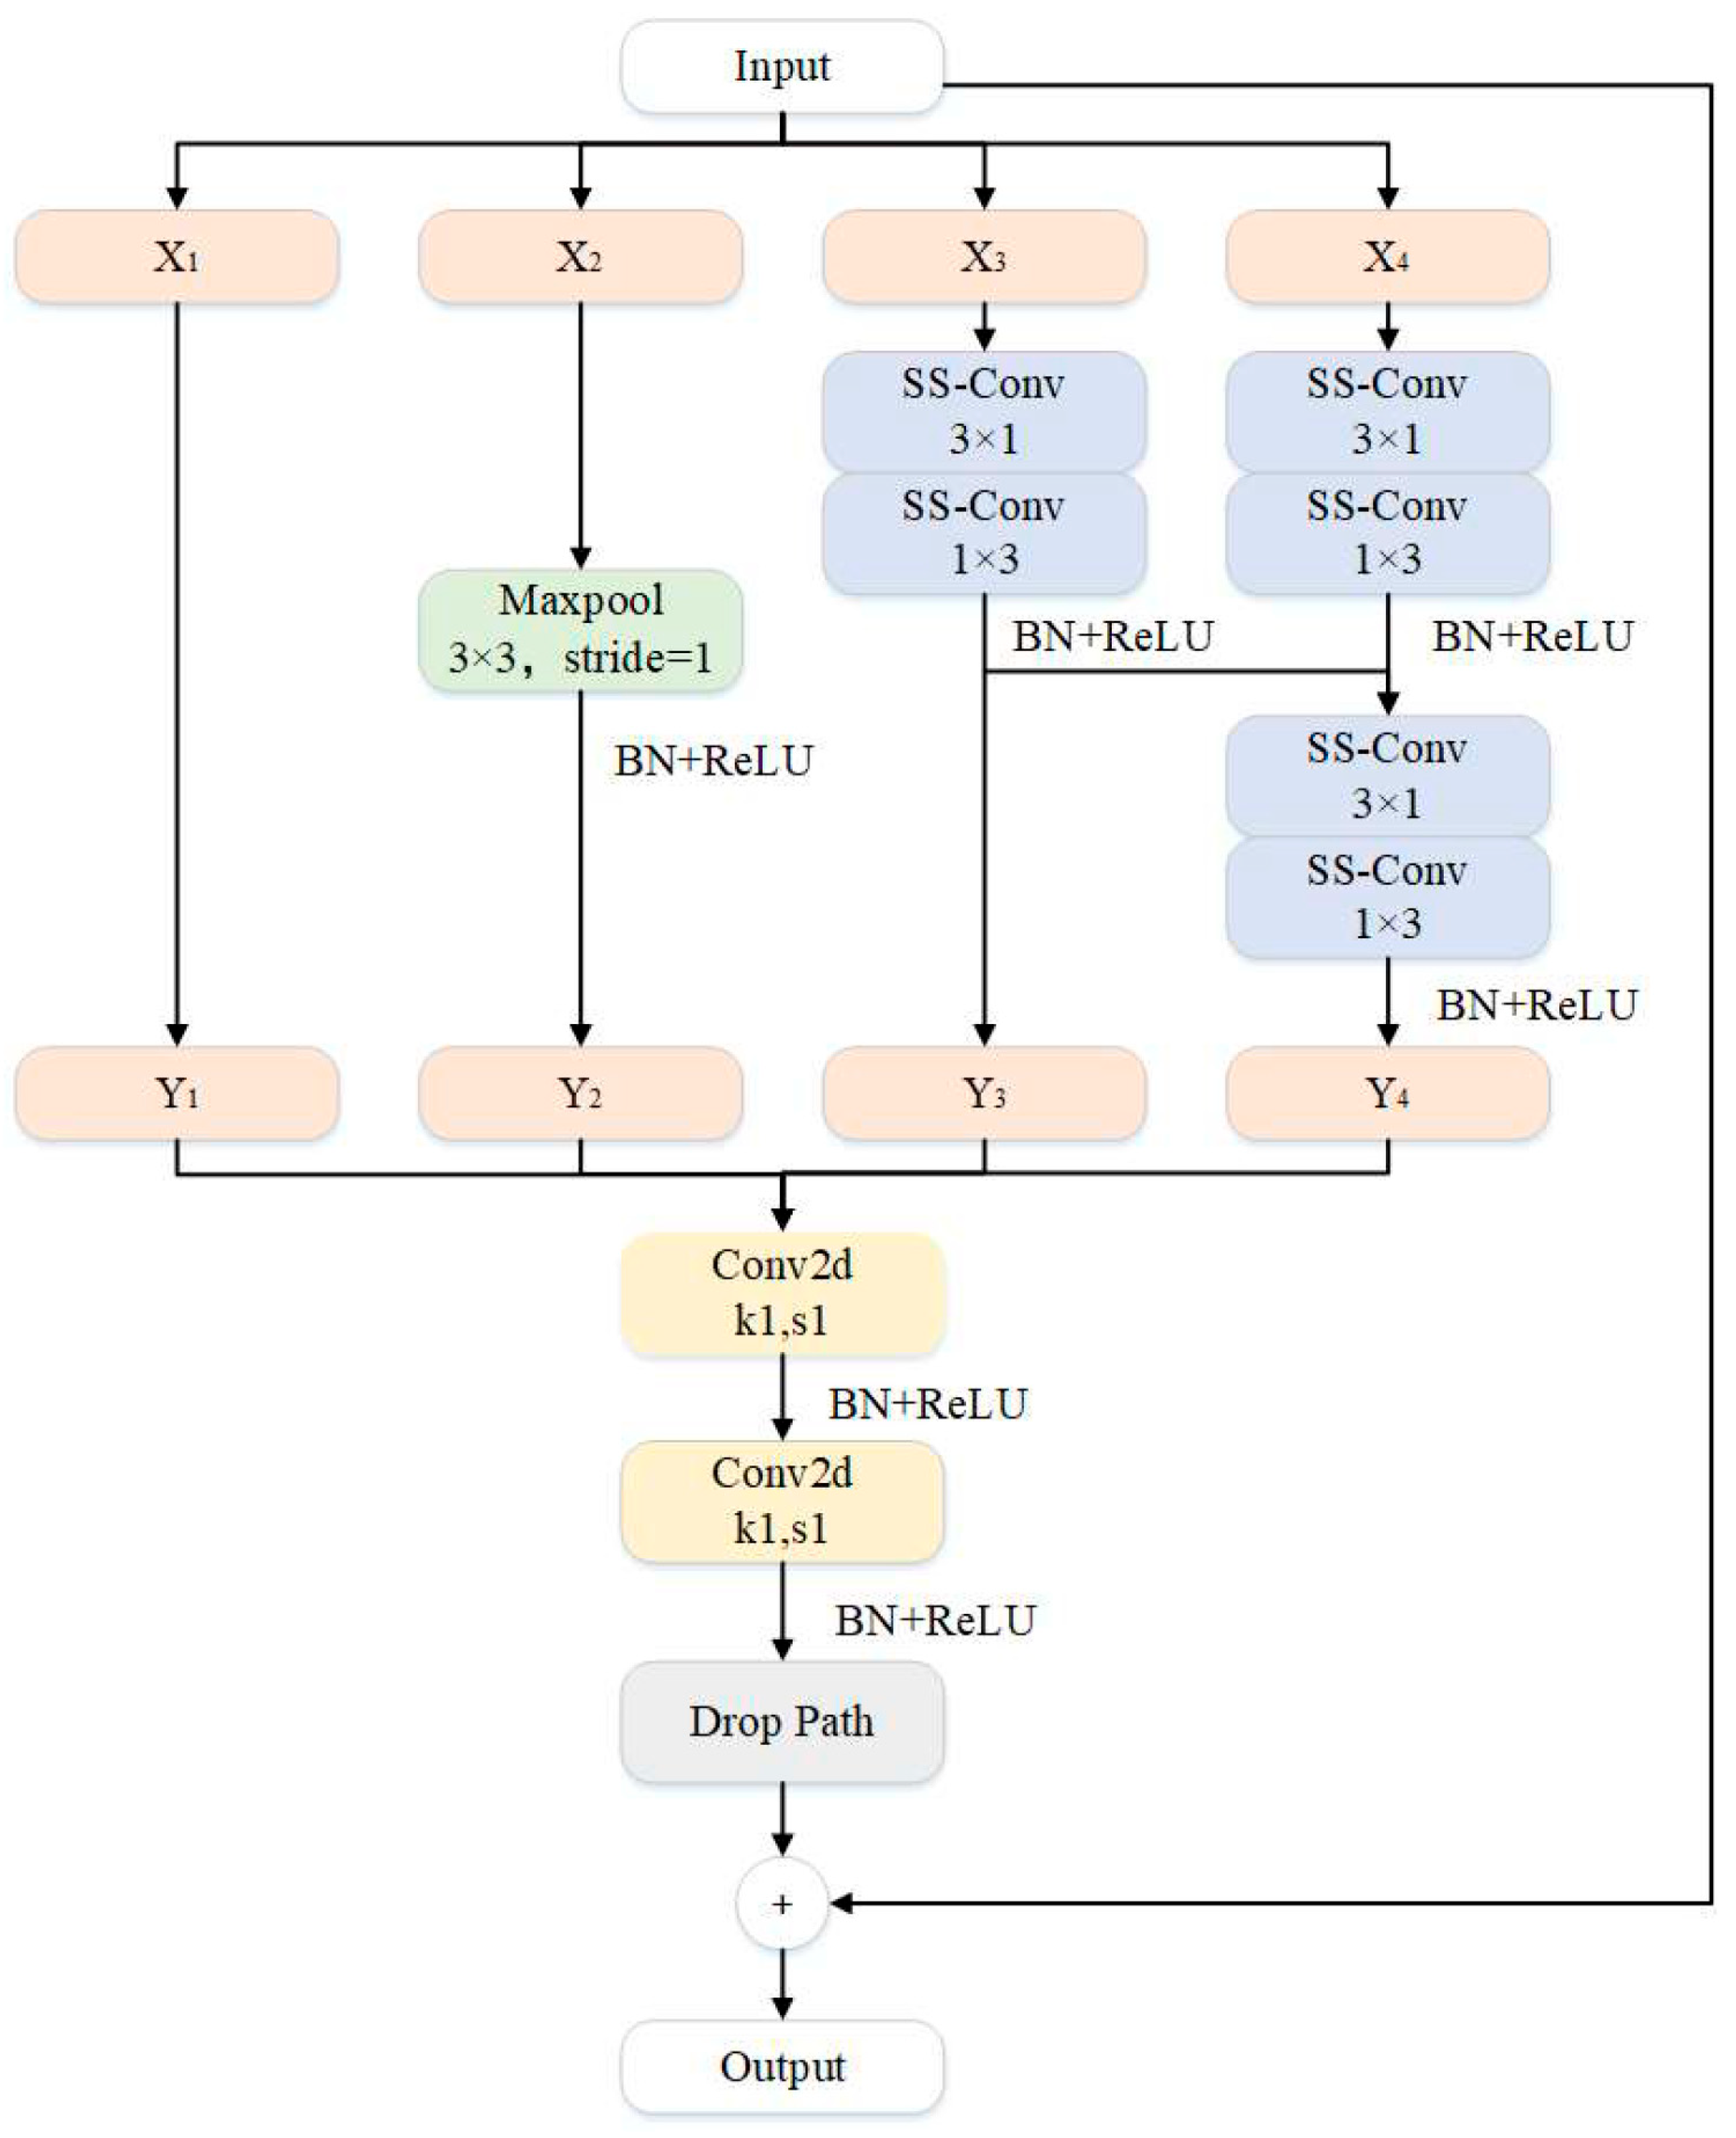
Specifically, a novel multi-branch and multi-scale convolutional module is designed to replace the original 7 × 7 depthwise convolution in ConvNeXt. As illustrated in Figure 5, the core design of this module comprises two key aspects. First, the input features are divided into groups, where max pooling is selectively applied in certain branches to reduce the spatial dimensions of the feature maps. By selecting the maximum values, the most prominent feature-responsive signals in the feature maps are retained, while minor fluctuations and noise are suppressed, thereby emphasizing critical features and achieving data compression simultaneously. Second, cascaded convolution and fusion operations are performed among the remaining groups. This lateral connectivity enables later groups to indirectly integrate feature information from all preceding groups. As a result, even with the utilization of small kernels such as 3 × 3, the following feature groups can achieve an effective receptive field equivalent to that of 5 × 5 kernel or larger. This design enhances feature representational capacity while maintaining computational efficiency.
Notably, the proposed multi-branch multi-scale design is physically interpretable in view of the multi-scale mechanisms inherent in bearing vibration. In particular, large-scale branches are more suitable for capturing low-frequency responses and modulation components related to shaft rotation, load-zone variation, and cage motion; mid-scale branches tend to characterize modulation and sideband structures induced by periodic changes in load distribution and contact stiffness; and small-scale branches are more sensitive to short-duration impulsive transients and the associated high-frequency resonances excited by localized defect contacts, thereby strengthening the identification of early damage and local anomalies. Accordingly, this phenomenon—namely, defect-induced impacts that excite structural resonances and generate modulation/sideband signatures—provides the mechanistic basis for the effectiveness of multiscale decomposition in fault detection. This phenomenon has been systematically elaborated and validated in tutorial works on bearing vibration diagnostics, as well as in research related to high-frequency resonance (envelope) analysis [44,45]. Moreover, the enhancement of modulation and sideband components under load-related factors (e.g., variations in load distribution, contact stiffness, and structural parameters) has also been supported by dynamic modeling and experimental investigations [46].
The multi-branch and multi-scale convolutional module bolsters robustness against noise and increases adaptability to feature distribution variations resulting from fluctuating operating conditions. The features extracted by different branch modules demonstrate complementary properties in terms of both semantic content and spatial scale. Consequently, this design not only reduces loss of high-frequency features caused by noise but also mitigates degradation of feature discriminability under fluctuating operating conditions. This architecture simultaneously captures comprehensive feature information and reduces computational cost. Consequently, the proposed approach effectively tackles challenges posed by noise and variations in operating conditions, thereby ensuring robust and efficient diagnostic performance in complex and variable environments.

3.2. ECGA

Efficient Channel Attention (ECA) [47] is an improved attention module derived from the squeeze-and-excitation (SE) mechanism [48]. This substitution of squeeze and excitation operations in SE with a 1D convolution effectively facilitates localized cross-channel interactions and captures inter-channel dependencies. Meanwhile, an adaptive convolution kernel is introduced into the ECA, which further enhances its representational capacity. This feature allows convolution kernel dimensions to be adaptively tailored according to the contextual information of input feature maps, thereby capturing inter-channel correlations with greater flexibility. The main steps are as follows:
(1)
The feature map X is defined, where H, W and C represent the height, width, and number of channel of X, respectively.
(2)
A GAP operation is applied to the feature map X to compress it from ( C , H , W ) to ( C , 1 , 1 ) . This step fuses global contextual information. The mathematical definition of GAP is
g ( X ) = 1 W H i = 1 , j = 1 W , H X i j
(3)
The size of the adaptive convolution kernel is computed as
k = ψ ( C ) = log 2 ( C ) γ + b γ o d d
where k denotes the convolution kernel size, C represents the number of input channels, b = 1, and γ = 2. |   | o d d ensures that k only takes odd values.
(4)
The weight for each channel is computed as
W c = σ C 1 D k g X
where C 1 D k denotes a 1D convolution with a kernel of size k, σ represents the Sigmoid function, and g(X) is the GAP output of X with size (C,1,1).
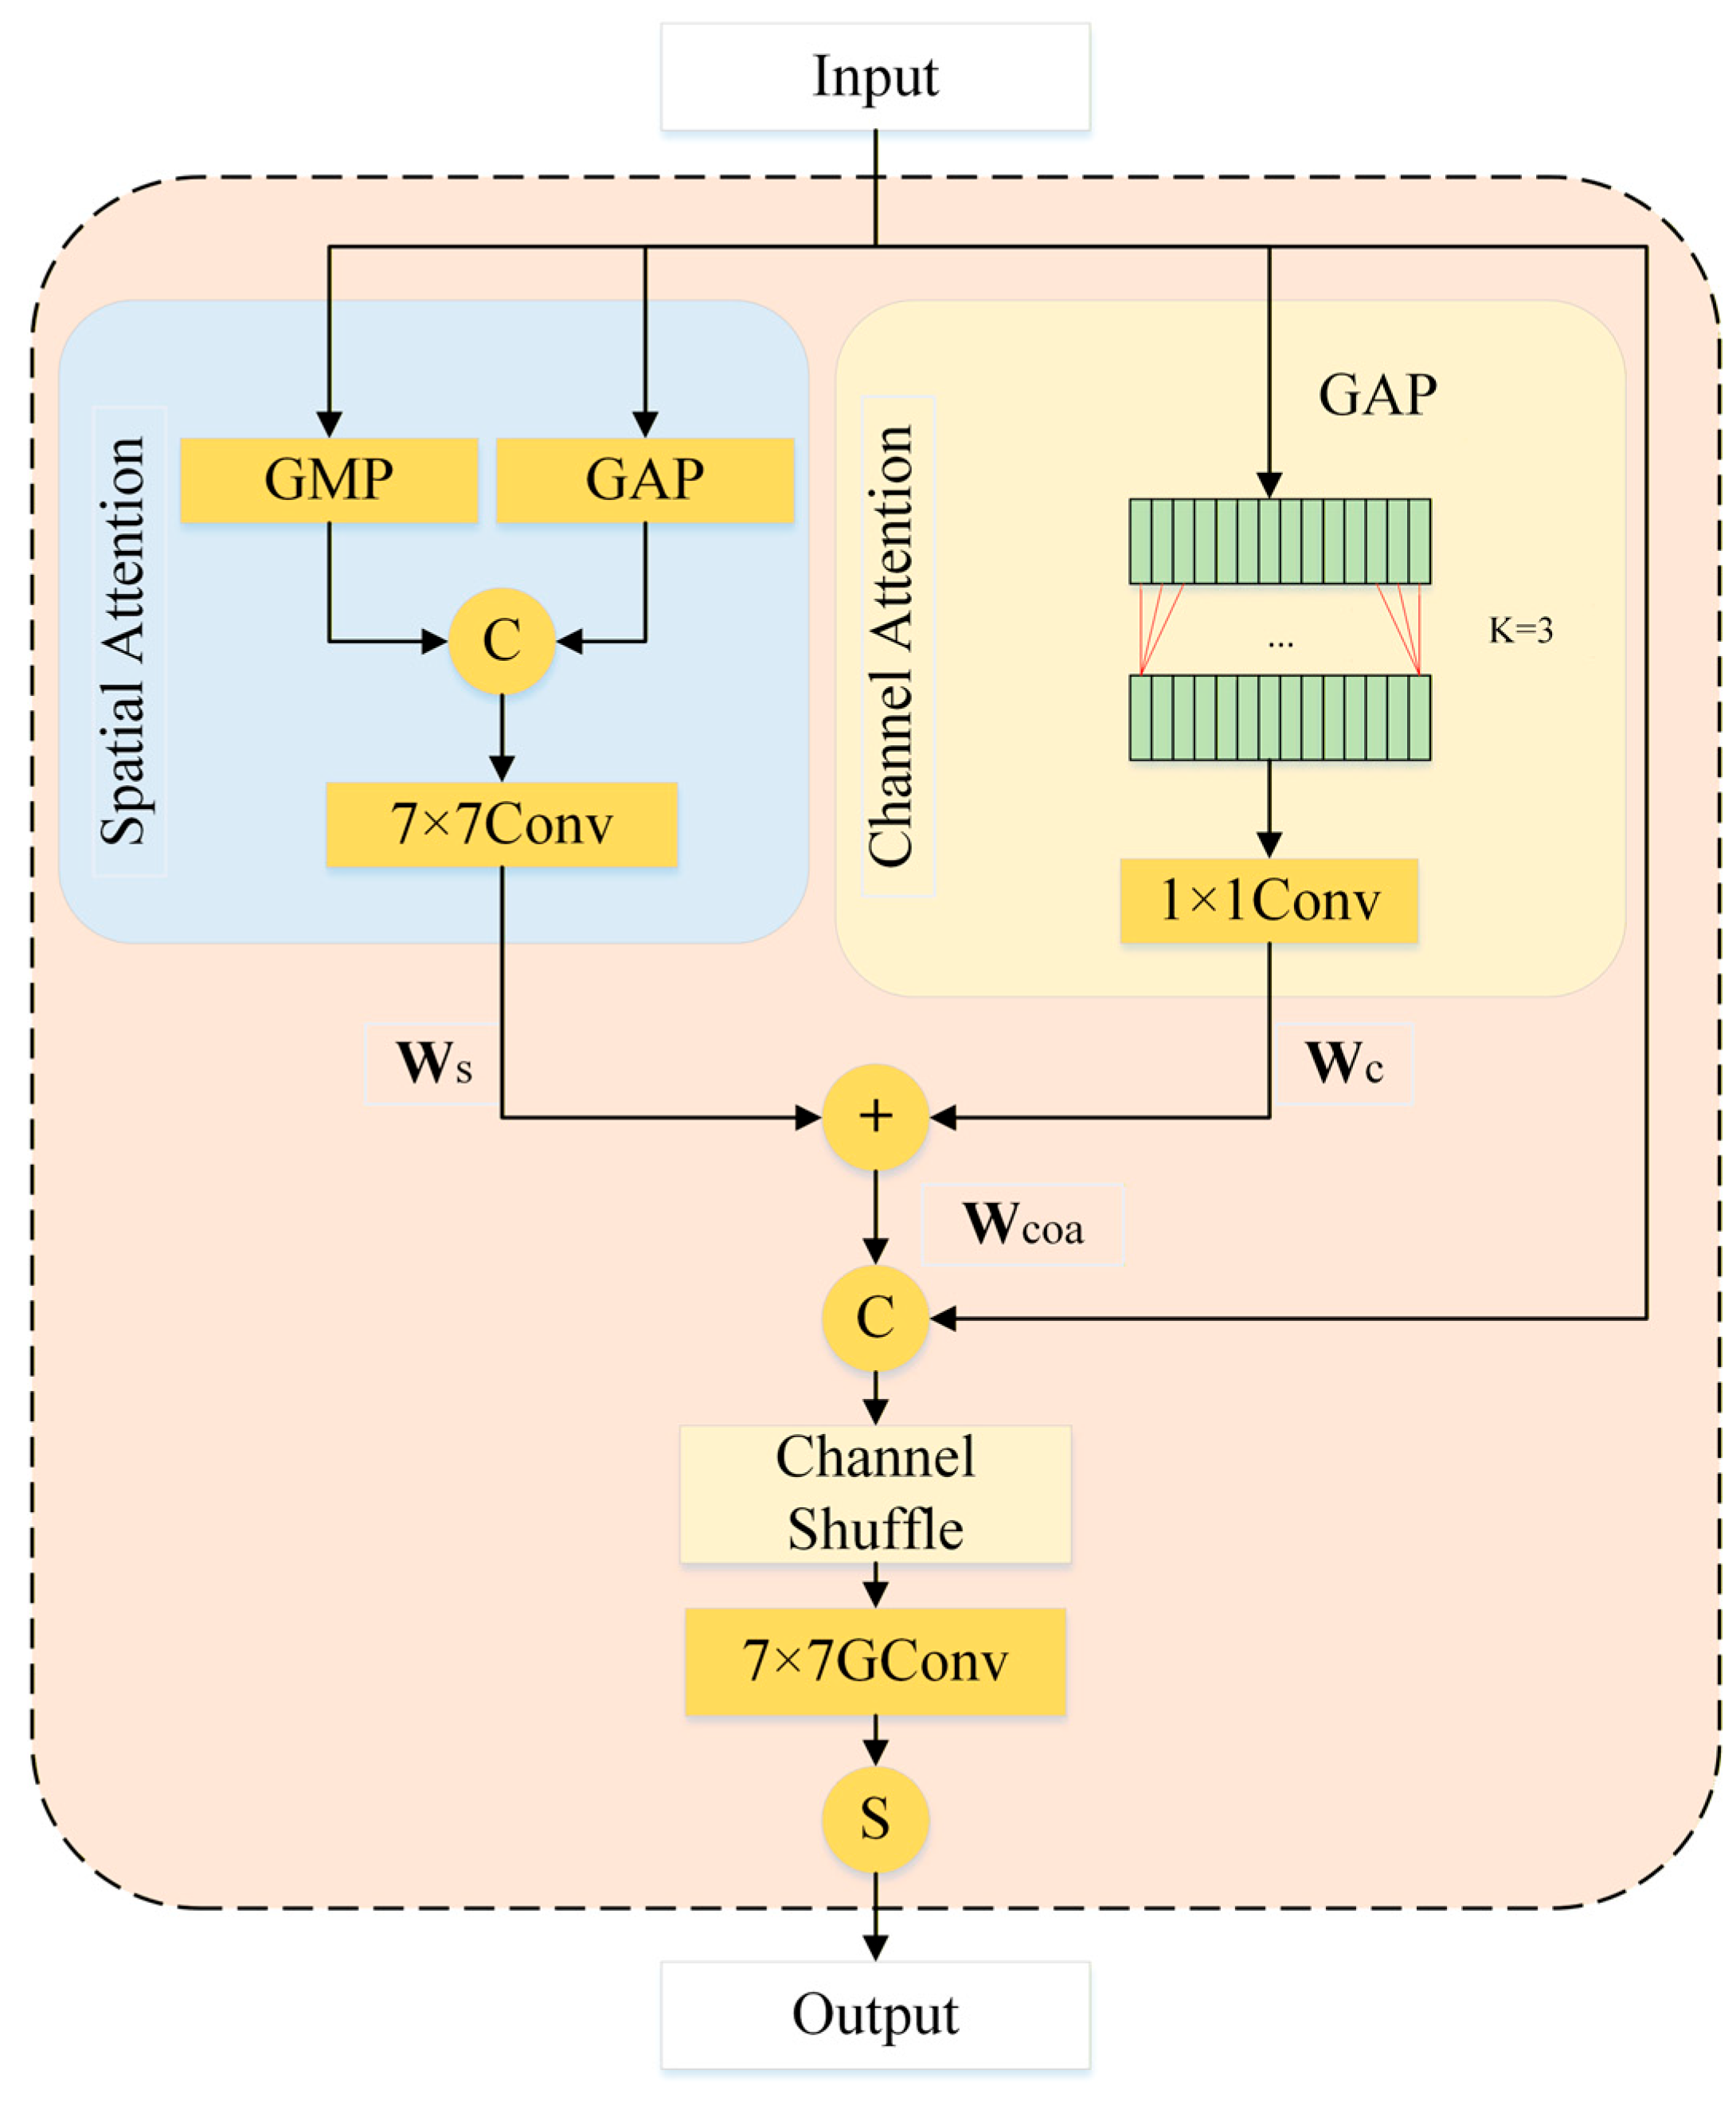
Building on the content-guided attention (CGA) framework [49], we incorporate the efficient channel attention (ECA) design to develop the ECGA module. By jointly optimizing channel attention and content guidance, ECGA alleviates feature extraction degradation in high-noise environments. Specifically, it adopts ECA-style 1D convolution for channel modeling to reduce information loss caused by the SE bottleneck (channel reduction) with low parameter overhead. Meanwhile, it leverages CGA to generate content-guided attention maps that emphasize discriminative channel responses and suppress interference. Under varying loads and speeds, rolling-contact dynamics (and potentially lubrication-related effects) can alter the manifestation of fault-related vibration signatures, including impulsive transients, modulation sidebands, and resonance bands. The content-guided pixel-wise reweighting in ECGA enables the network focus on these contact-abnormality-related patterns while suppressing irrelevant responses, thereby improving the stability of fault recognition under noise and time-varying operating conditions.
The ECGA generates channel-specific spatial importance maps (SIMs) by a coarse-to-fine strategy, thereby effectively focusing on critical regions within each channel and enhancing the model’s performance. First, the spatial attention weights and the channel attention ones are calculated by the ECGA, respectively. These two types of attention mechanisms are then fused to produce a preliminary spatial importance map. However, this fusion process only provides a coarse combination of spatial and channel dimensional information, failing to refine the importance of each channel at distinct spatial positions. To address this, the ECGA considers input features as prior knowledge to assign pixel-level weights, thereby emphasizing informative pixels and suppressing irrelevant ones. By leveraging input features to adjust the preliminary spatial importance map, the final SIMs are generated, enabling the model to concentrate on key pixel regions corresponding to the individual channels.
The flowchart of the ECGA is illustrated in Figure 6. The main steps are described as follows:
(1)
Let X R C × H × W denote the input feature. First, the spatial and the channel attention weights W s and W c of X are calculated, respectively.
W s = C 7 × 7 X G A P S , X G M P S
W c = σ ( C 1 D k ( X G A P C ) )
where C k × k is a convolutional layer with a kernel of size k × k; X G A P C signifies GAP across the spatial dimensions, X G A P S denotes GAP across the channel dimension, and X G M P S stands for global max pooling (GMP) across the channel dimension. The 1D convolution with a kernel of size k is denoted by C 1 D k .
(2)
W s and W c are fused and summed via broadcast rules to yield the coarse SIM W c o a R C × H × W .
W c o a = W s + W c
(3)
The content within the input feature X is utilized to guide W c o a , each channel in W c is adjusted according to its corresponding input features. Specifically, each channel of X and W c o a is alternately arranged through channel shuffle, followed by a 7 × 7 convolution operation, to yield the final SIM.
W = σ ( g C 7 × 7 ( C S ( [ X , W c o a ] ) ) )
where C S ( ) denotes the channel shuffle operation, and g C k × k is a group convolutional layer with a kernel of size k × k.

3.3. Establishment of the RConvNeXt-ECGA

The architecture of the RConvNeXt-ECGA model is shown in Figure 7. The Stem layer serves as a feature preprocessing module. The feature extraction part consists of multiple Blocks, each integrating an RConvNeXt block and an Attention block to achieve multi-scale feature extraction and feature enhancement. DownSample layers are designed between consecutive Blocks to progressively reduce spatial resolution and expand the receptive field. This design facilitates the progressive adjustment of feature map dimensions and the effective expansion of the receptive field. After the four-stage feature extraction, the GAP is applied to compress the high-level semantic features across the spatial dimensions. Subsequently, the compressed features are fed into a Linear layer to obtain the diagnostic results.
The proposed model is based on the ConvNeXt architecture, retaining its stem layer design to capture richer basic features from the input images. During the feature extraction stage, the RConvNeXt module simultaneously extracts multi-scale features through its multi-branch parallel convolution structure. Meanwhile, the ECGA attention mechanism applies content-adaptive weight adjustment to strengthen the representation of critical features. The integration of these two mechanisms enables the network to effectively capture time-frequency variations in bearing vibration signals under different operating conditions. Moreover, this integrated approach enhances the system’s resilience to noise interference and boosts the model’s adaptability to shifts in feature distribution caused by variations in load, rotational speed, and other operating conditions. Consequently, the model demonstrates superior fault recognition capability in complex operational environments.
The parameters of the network in this paper are shown in Table 3.

4. Experimental Configuration and Metrics

4.1. Parameter Setup for Experiments

For the experiments, the hardware configuration was specified as follows: the operating system was 64-bit Windows 10; the GPU was an NVIDIA RTX 3090.
The software environment was built on the PyTorch 2.2.2 framework, with Python 3.7 used as the programming language. During the model training process, Adam optimizer is selected to update the network training parameters. The ReLU activation function is applied, with a learning rate of 0.00002 and the batch size of 64. To prevent overfitting, the dropout rate is configured as 0.7. Training epochs are configured as 100.

4.2. Performance Evaluation Metrics

To comprehensively evaluate the diagnostic performance of the model, multiple evaluation metrics are employed, including accuracy, cross-entropy loss [50], macro-recall and macro-F1 [51].
In machine learning, accuracy is used to evaluate the model’s overall classification performance, referring to the fraction of samples correctly classified among all tested samples. During the evaluation phase of the trained model, the output of the model is first converted into a probabilistic distribution via the Softmax activation function. The class with the maximum probability value is then designated as the final classification result. The accuracy is calculated based on the ratio of correct predictions as:
Acc = TP + TN TP + TN + FP + FN
where TP denotes the number of true positive samples, TN represents true negative samples, FP signifies false positive samples, and FN stands for false negative samples. A value closer to 1 indicates a stronger overall discriminative ability of the model and fewer misclassifications.
Throughout the model training process, the cross-entropy loss function is adopted, and it is defined as follows:
L = 1 N i = 1 N m = 1 M y i , m log ( y ^ i , m )
where N denotes the total number of samples, M is the number of classes, y i , m indicates the ground-truth label of sample i for class m, and y ^ i , m refers to the predicted probability that sample i belongs to class m. A lower loss value (closer to 0) signifies better alignment between the model forecasts and the actual data distribution, reflecting improved optimization and calibration.
To address the class imbalance issue in the multi-class classification task, both the macro-recall and the macro-F1 score are introduced to evaluate model performance. The macro-recall is computed for each individual class as:
Macro-Recall = 1 M m = 1 M TP m TP m + FN m
A high macro-recall value (close to 1) indicates effective identification of samples across all classes, i.e., few missed positives, thereby contributing to high classification reliability.
The macro-F1 score refers to the arithmetic average of F1 scores over all classification categories, which is derived from its precision and recall values of those classes. The macro-F1 score is
Macro - F 1 = 1 M m = 1 M 2 × Precision m × Recall m Precision m + Recall m
Precision m = TP m TP m + FP m
Recall m = TP m TP m + FN m
A macro-F1 score near 1 represents an optimal precision-recall trade-off across all classes, indicating that the network not only correctly identifies most true faults but also minimizes false alarms. Notably, a critical limitation in bearing fault diagnosis is evaluation bias caused by class imbalance, where normal operating samples far outnumber fault samples. By integrating precision and recall metrics, the macro-averaged F1 metric effectively alleviates this limitation. It provides a reliable quantification of the model’s performance in identifying minority fault samples, thus aligning with the core objective of bearing fault diagnosis.

5. Experimental Results and Analyses

5.1. Model Generalization Experiment

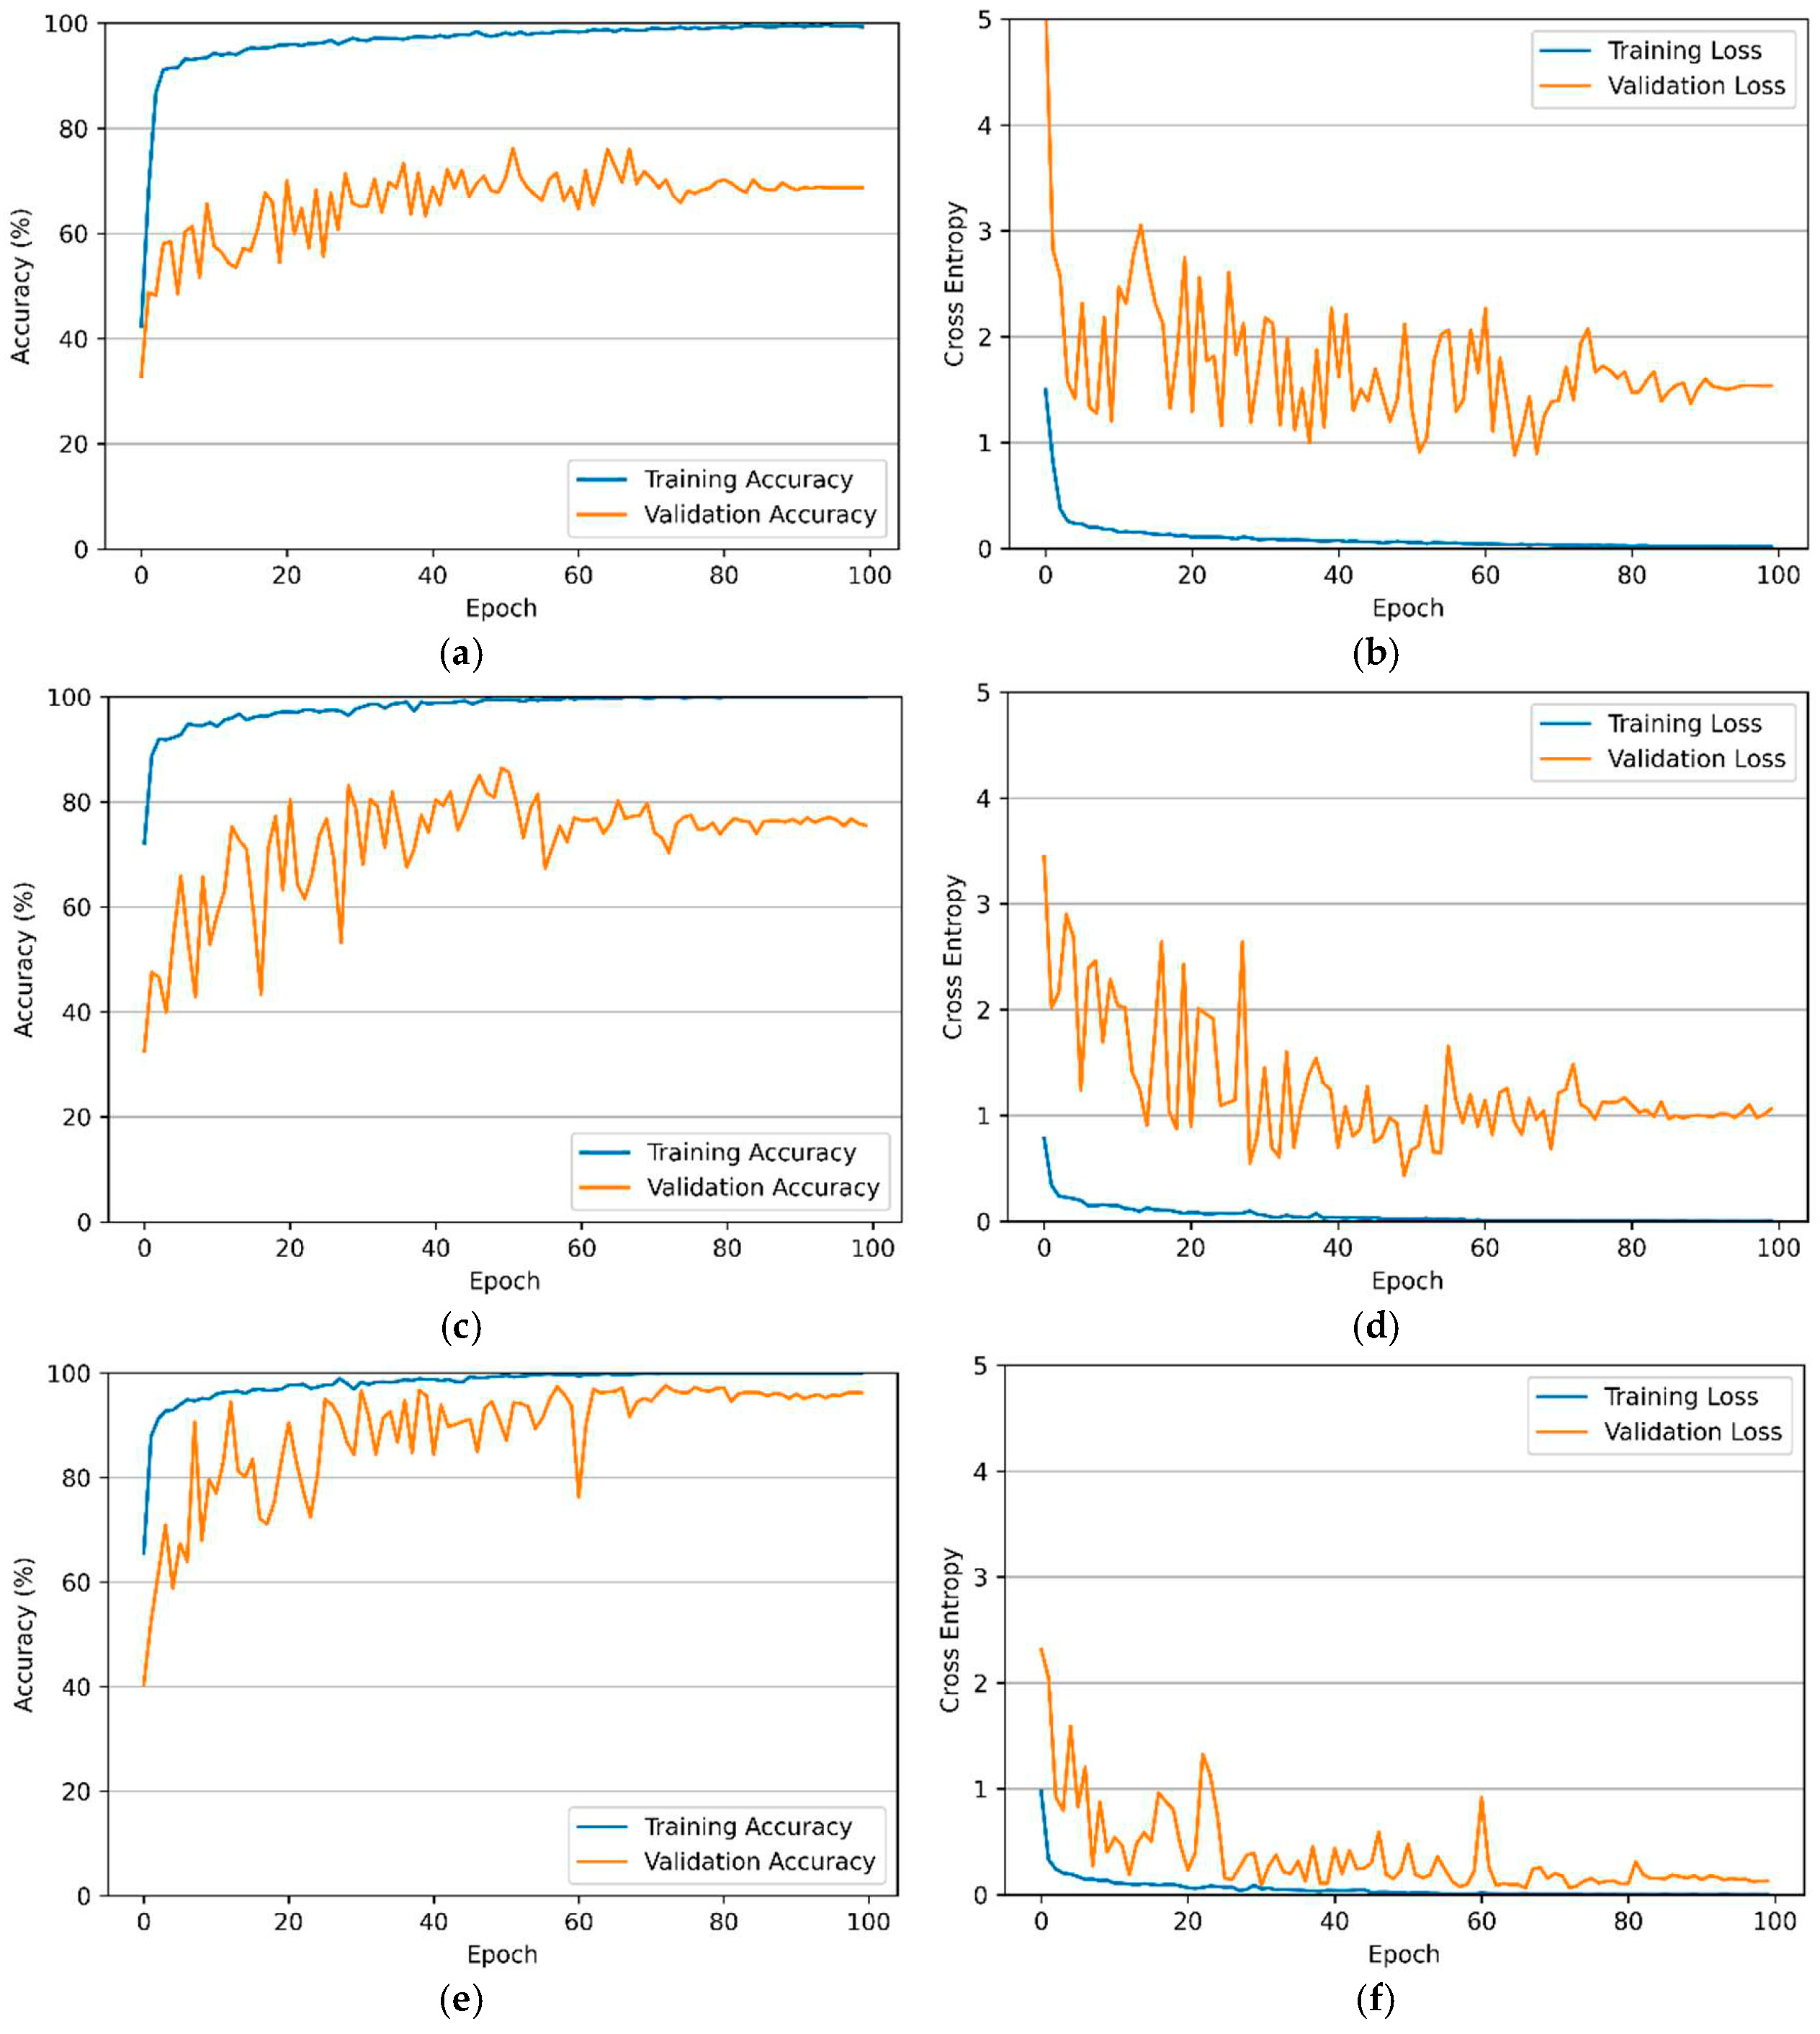
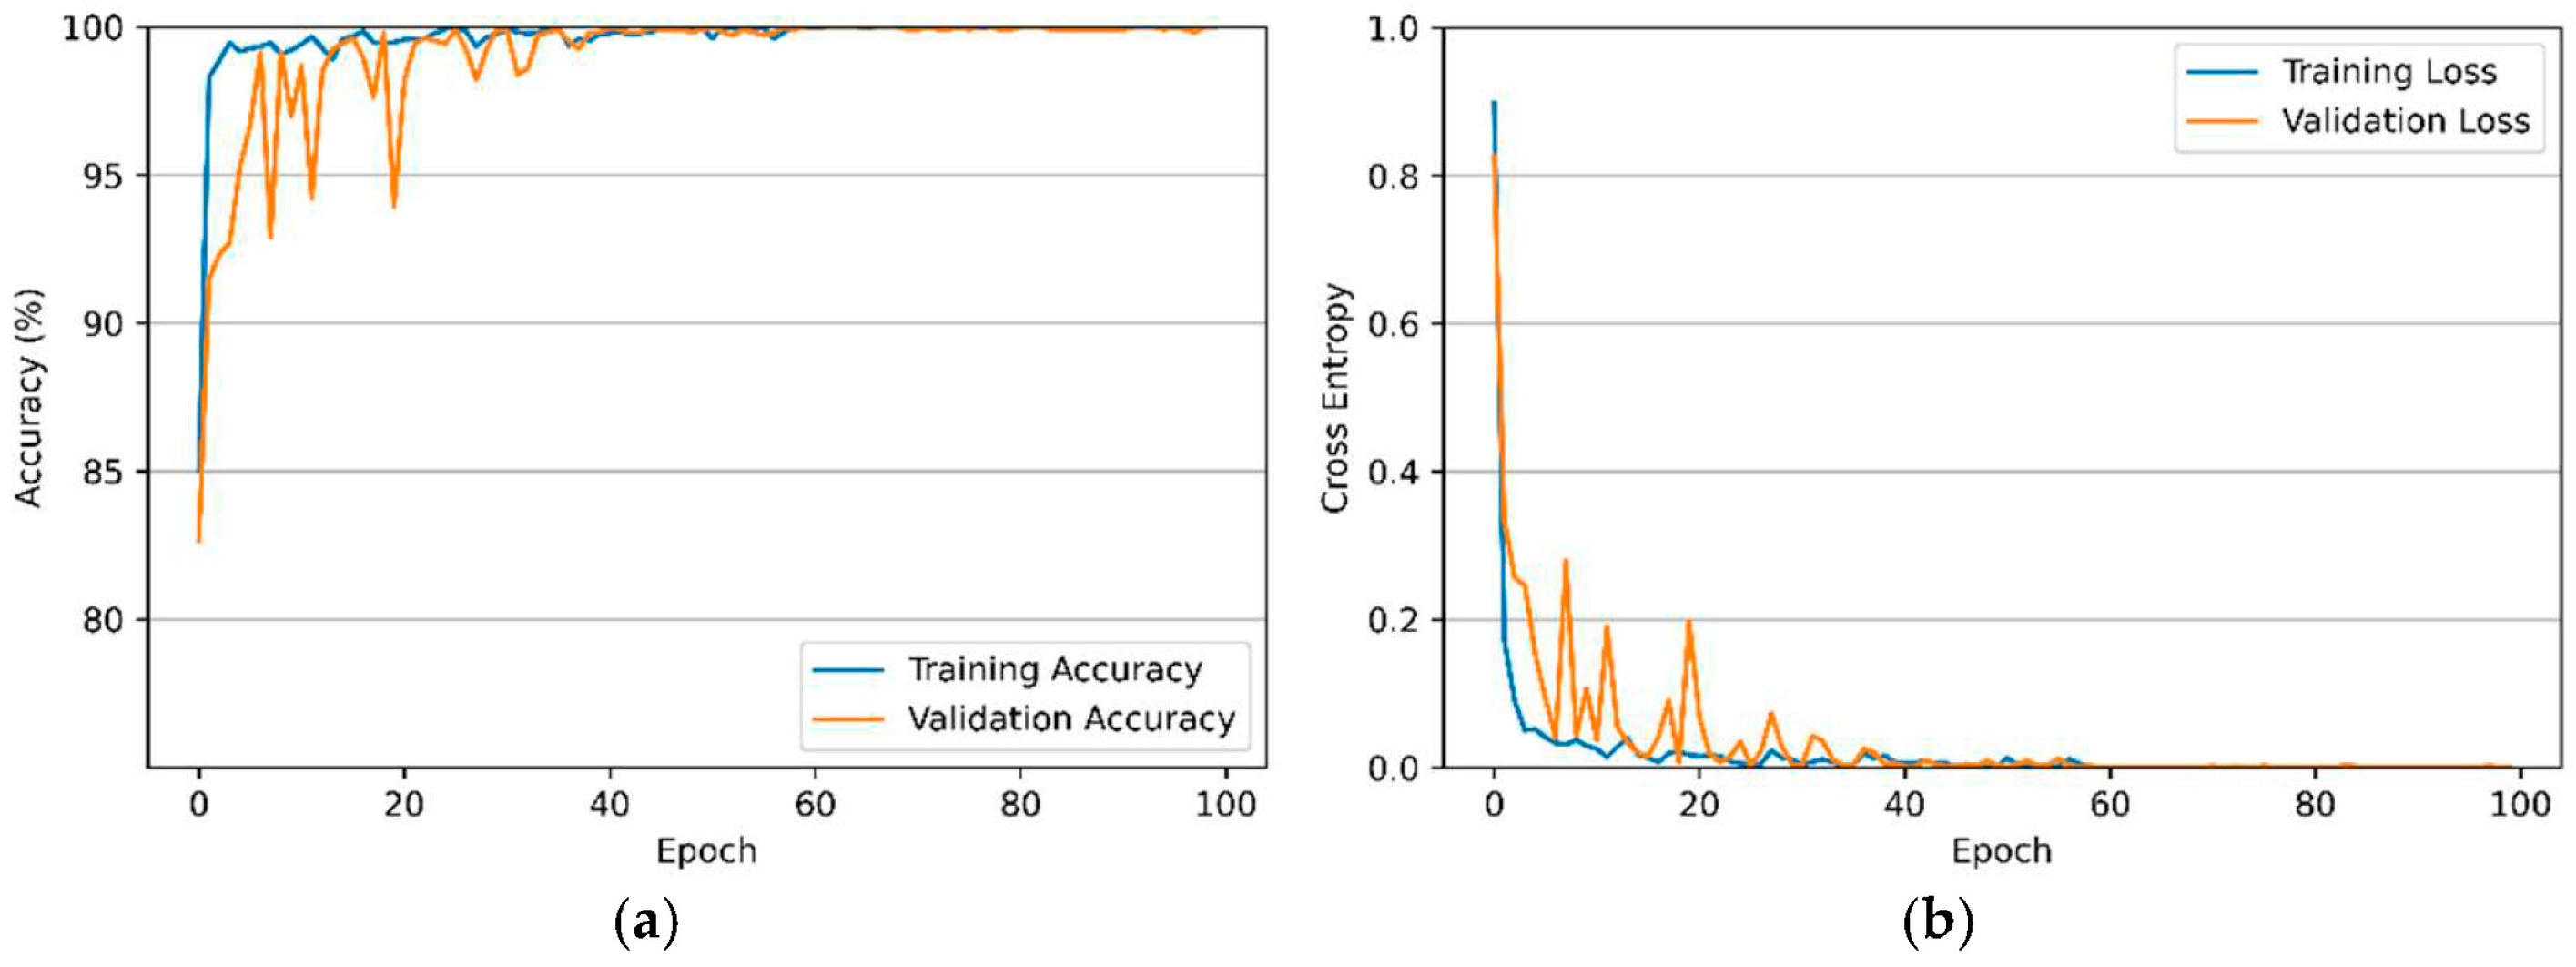
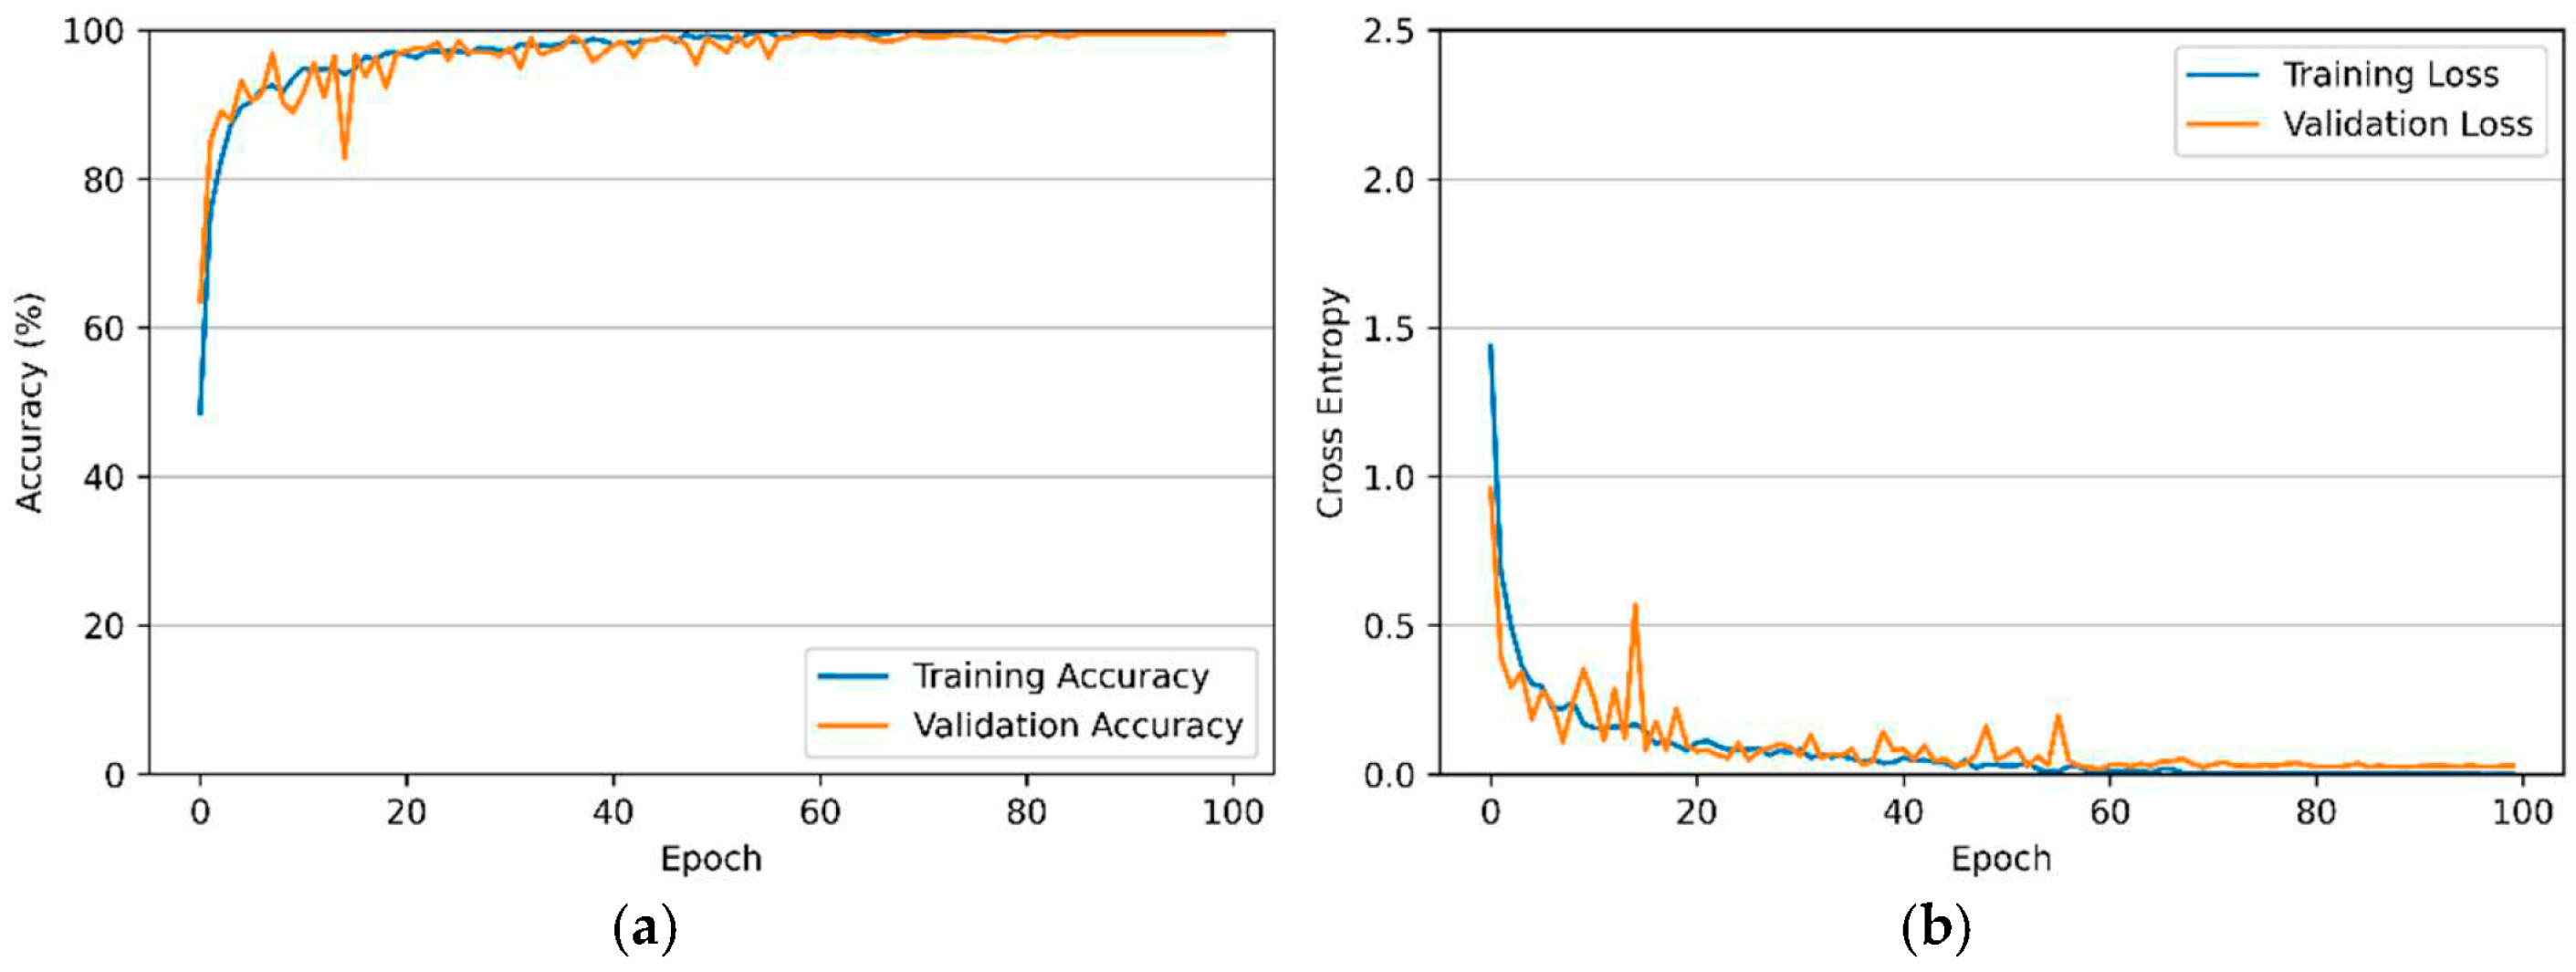
To evaluate the generalization performance of the developed model, experiments are conducted on both the CWRU and HUST datasets. As shown in Figure 8 and Figure 9, the training curves from both datasets indicate that the model achieves rapid convergence during the early training phase. After approximately 40 epochs, a validation accuracy of roughly 97.5% is reached. After the training process fully converges, validation accuracies of 100% and 99.6% are achieved by the developed model on the CWRU and HUST datasets, respectively. The model’s robustness and generalization capability are verified via dual-dataset tests. In addition, the loss curves from both datasets show a rapid decline in both training and validation losses during the initial stage. On the CWRU dataset, the validation loss approaches 0.01 after 60th epoch and stabilizes below 0.008. On the HUST dataset, the validation loss stabilizes around 0.02. These results suggest that the model not only effectively suppresses random disturbances during optimization but also attains a stable low-loss state. Results from experiments conducted on both datasets confirm that the proposed model exhibits strong robustness against noise interference under complex operating conditions. Furthermore, these results indicate that the improved RConvNeXt-ECGA achieves synchronized optimization of diagnostic accuracy and convergence speed through multi-scale feature extraction and dynamic attention weighting. Therefore, the model demonstrates high accuracy and stability in identifying fault states of rolling bearings with different diameters.
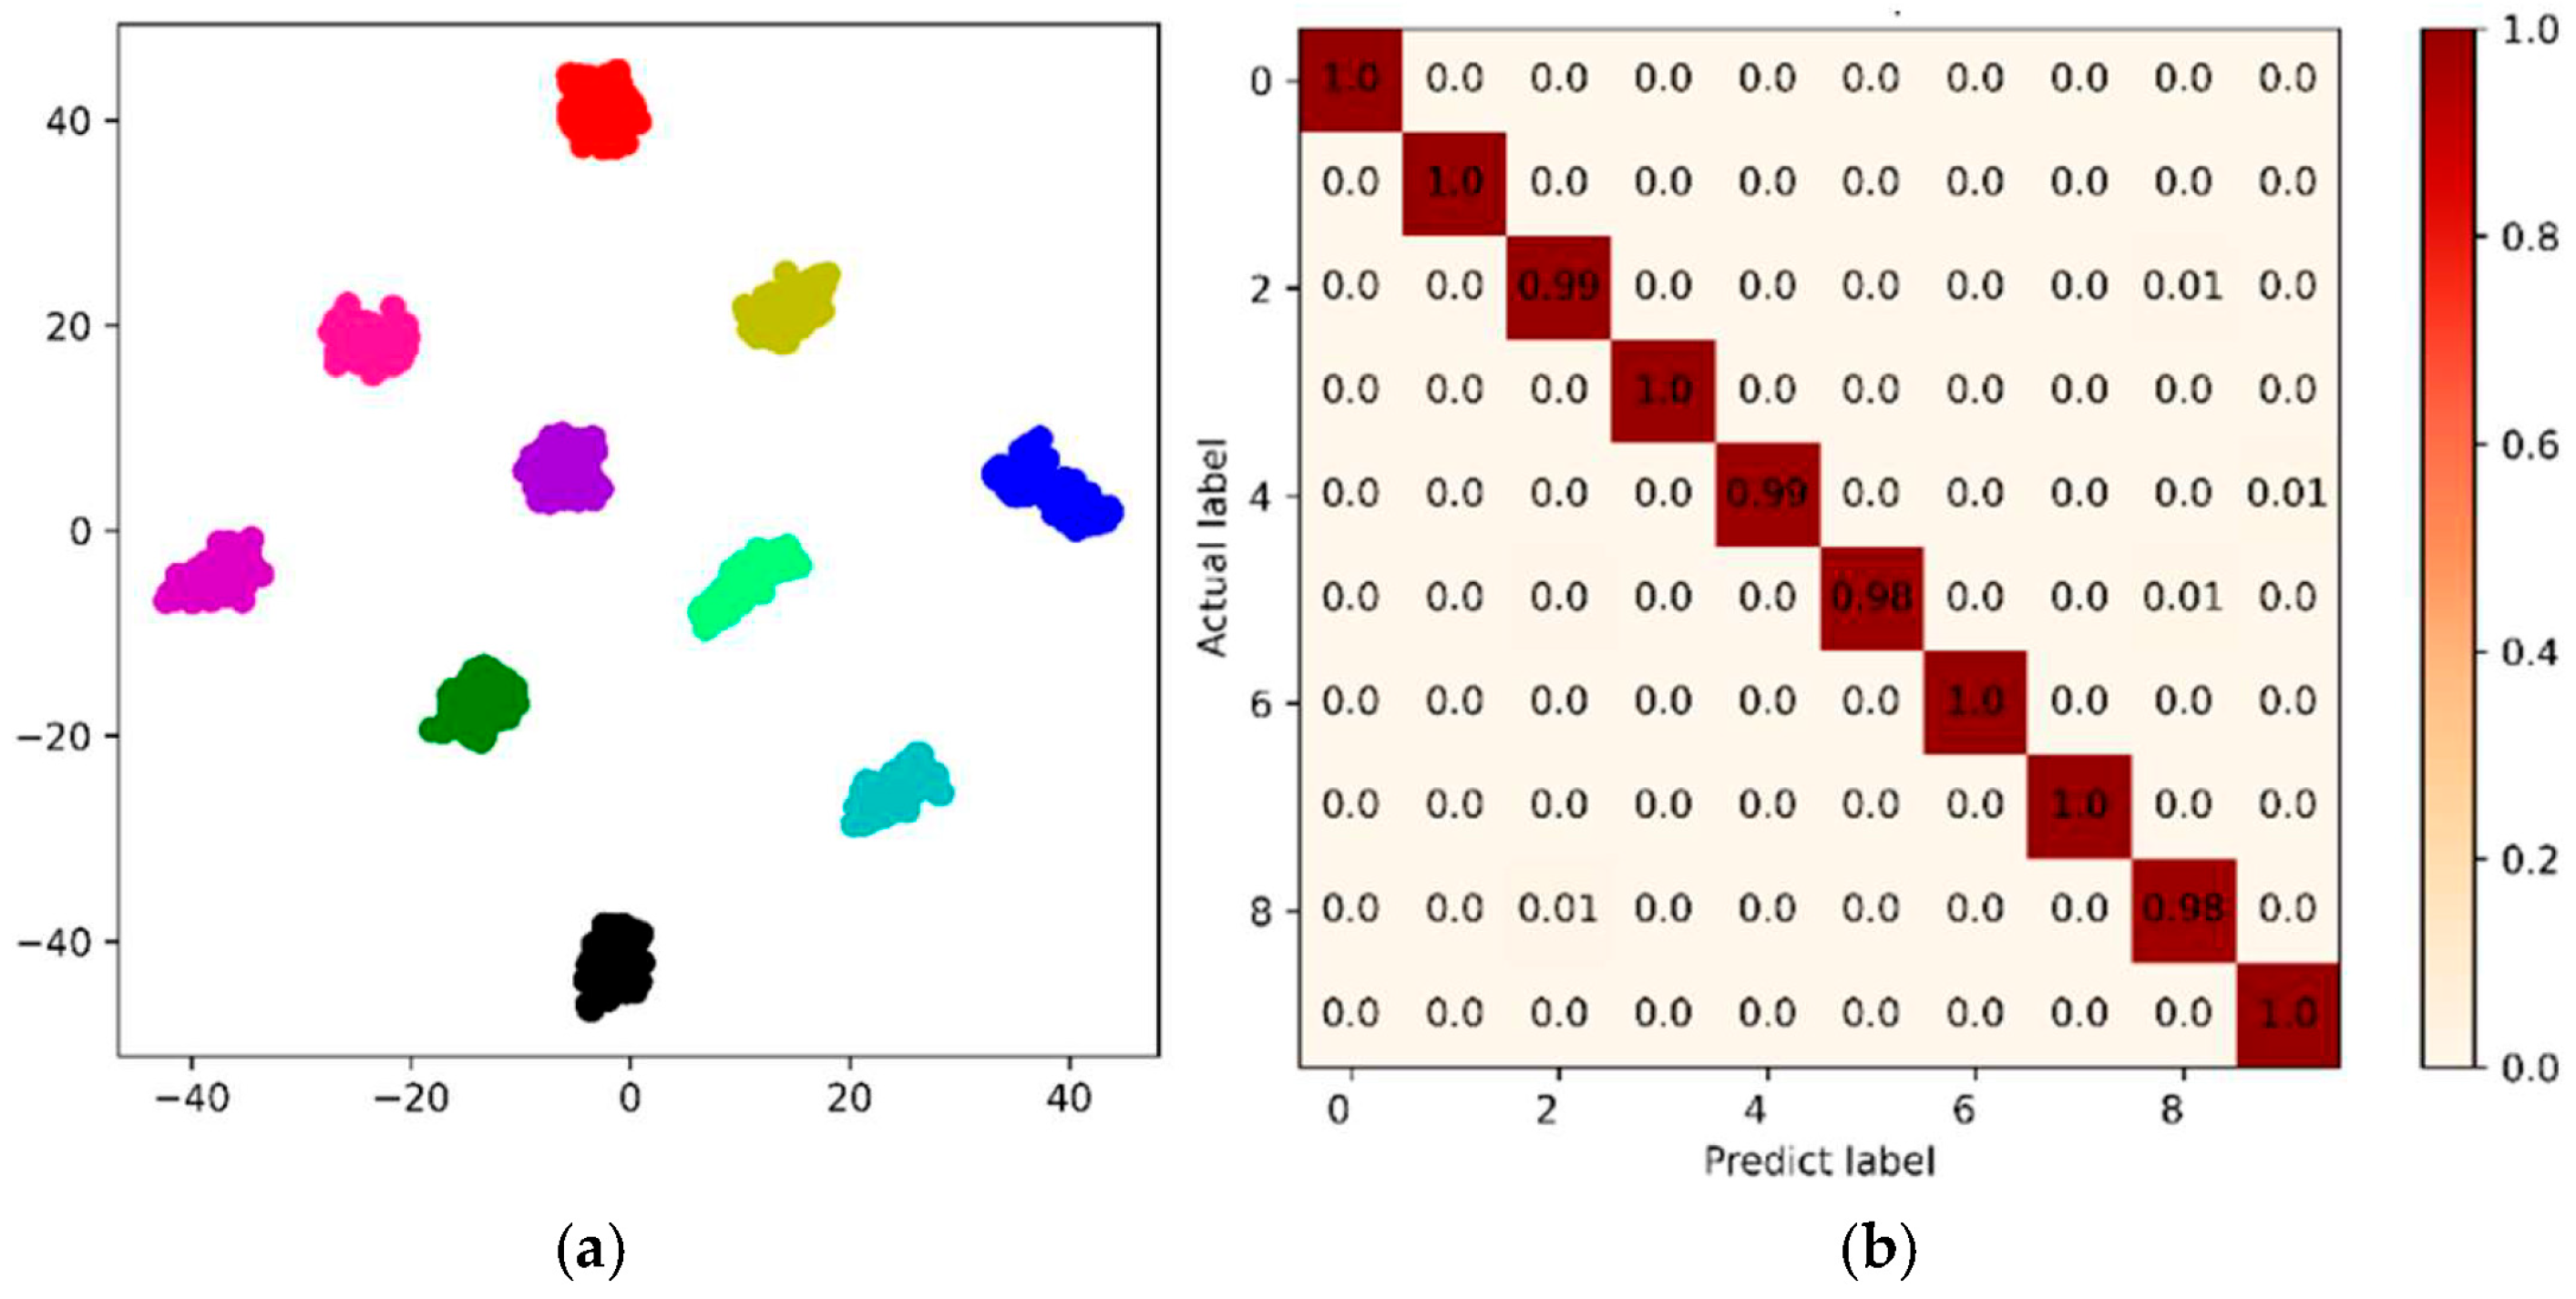
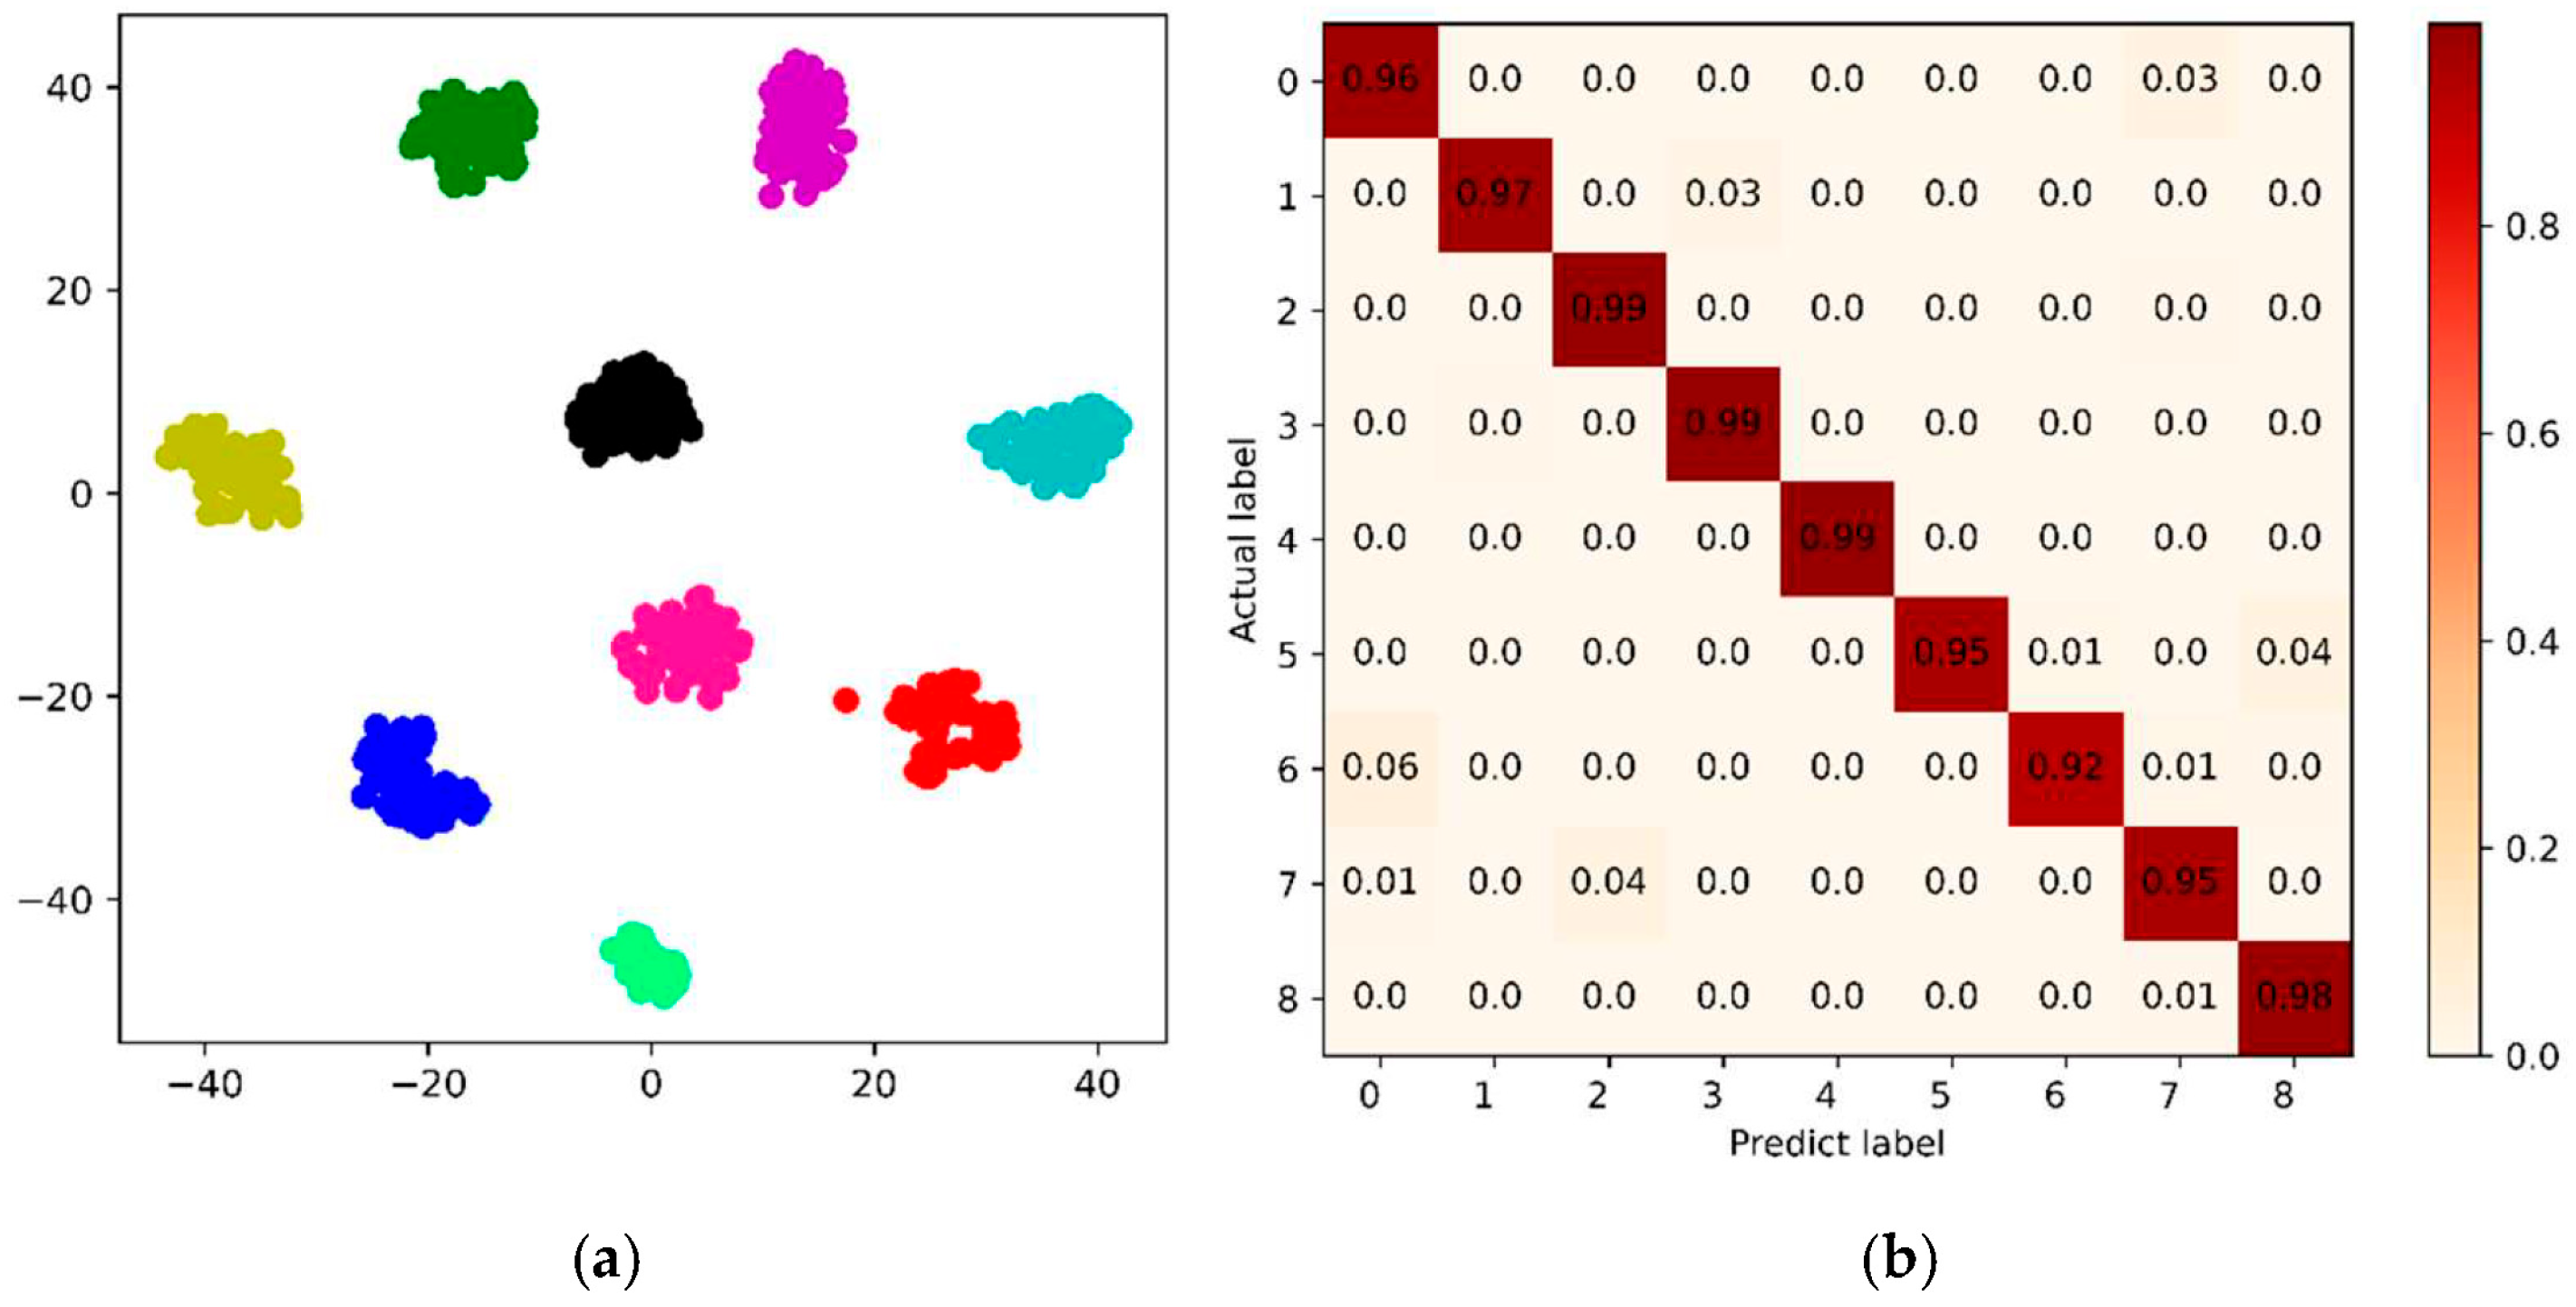
As shown in Figure 10a and Figure 11a, the data points of bearings in different fault states form distinct clusters in the t-SNE [52] visualization, with clear boundaries between clusters. Therefore, the model can effectively extract features of different fault states and achieve good separation in the low-dimensional space.
Figure 10b and Figure 11b display the classification confusion matrix [53]. As indicated by the confusion matrix, all diagonal entries are close to 1, implying that our proposed diagnostic network attains superior classification precision across most categories. Meanwhile, the values of non-diagonal elements are low, which indicates minimal confusion among different categories. That is, the model can correctly identify and classify samples for the state of rolling bearings with different fault diameters, which has an extremely low probability of misclassification. These results demonstrate that the proposed model exhibits high classification accuracy and robustness on bearing data with different fault states.
As shown in Figure 10 and Figure 11, the proposed RConvNeXt-ECGA model exhibits rapid convergence and high recognition accuracy, precisely identifying and classifying rolling bearing states for different fault diameters.

5.2. Robustness Analysis

In industrial operations, rolling bearings often work under variable conditions, leading to vibration signals captured by sensors being contaminated with ambient noise. Moreover, in the early stage of bearing faults, the vibration features are not obvious, and the interference of noise on vibration signals is significant. Therefore, fault diagnosis models for rolling bearings must possess stable and reliable anti-noise capability. In practical engineering applications, the SNR is widely adopted to quantify the power ratio between the target signal and background noise. The definition of SNR is:
SNR = 10 log 10 P signal P noise
where P signal and P noise indicate the powers of the original signal and the added noise signal, respectively.
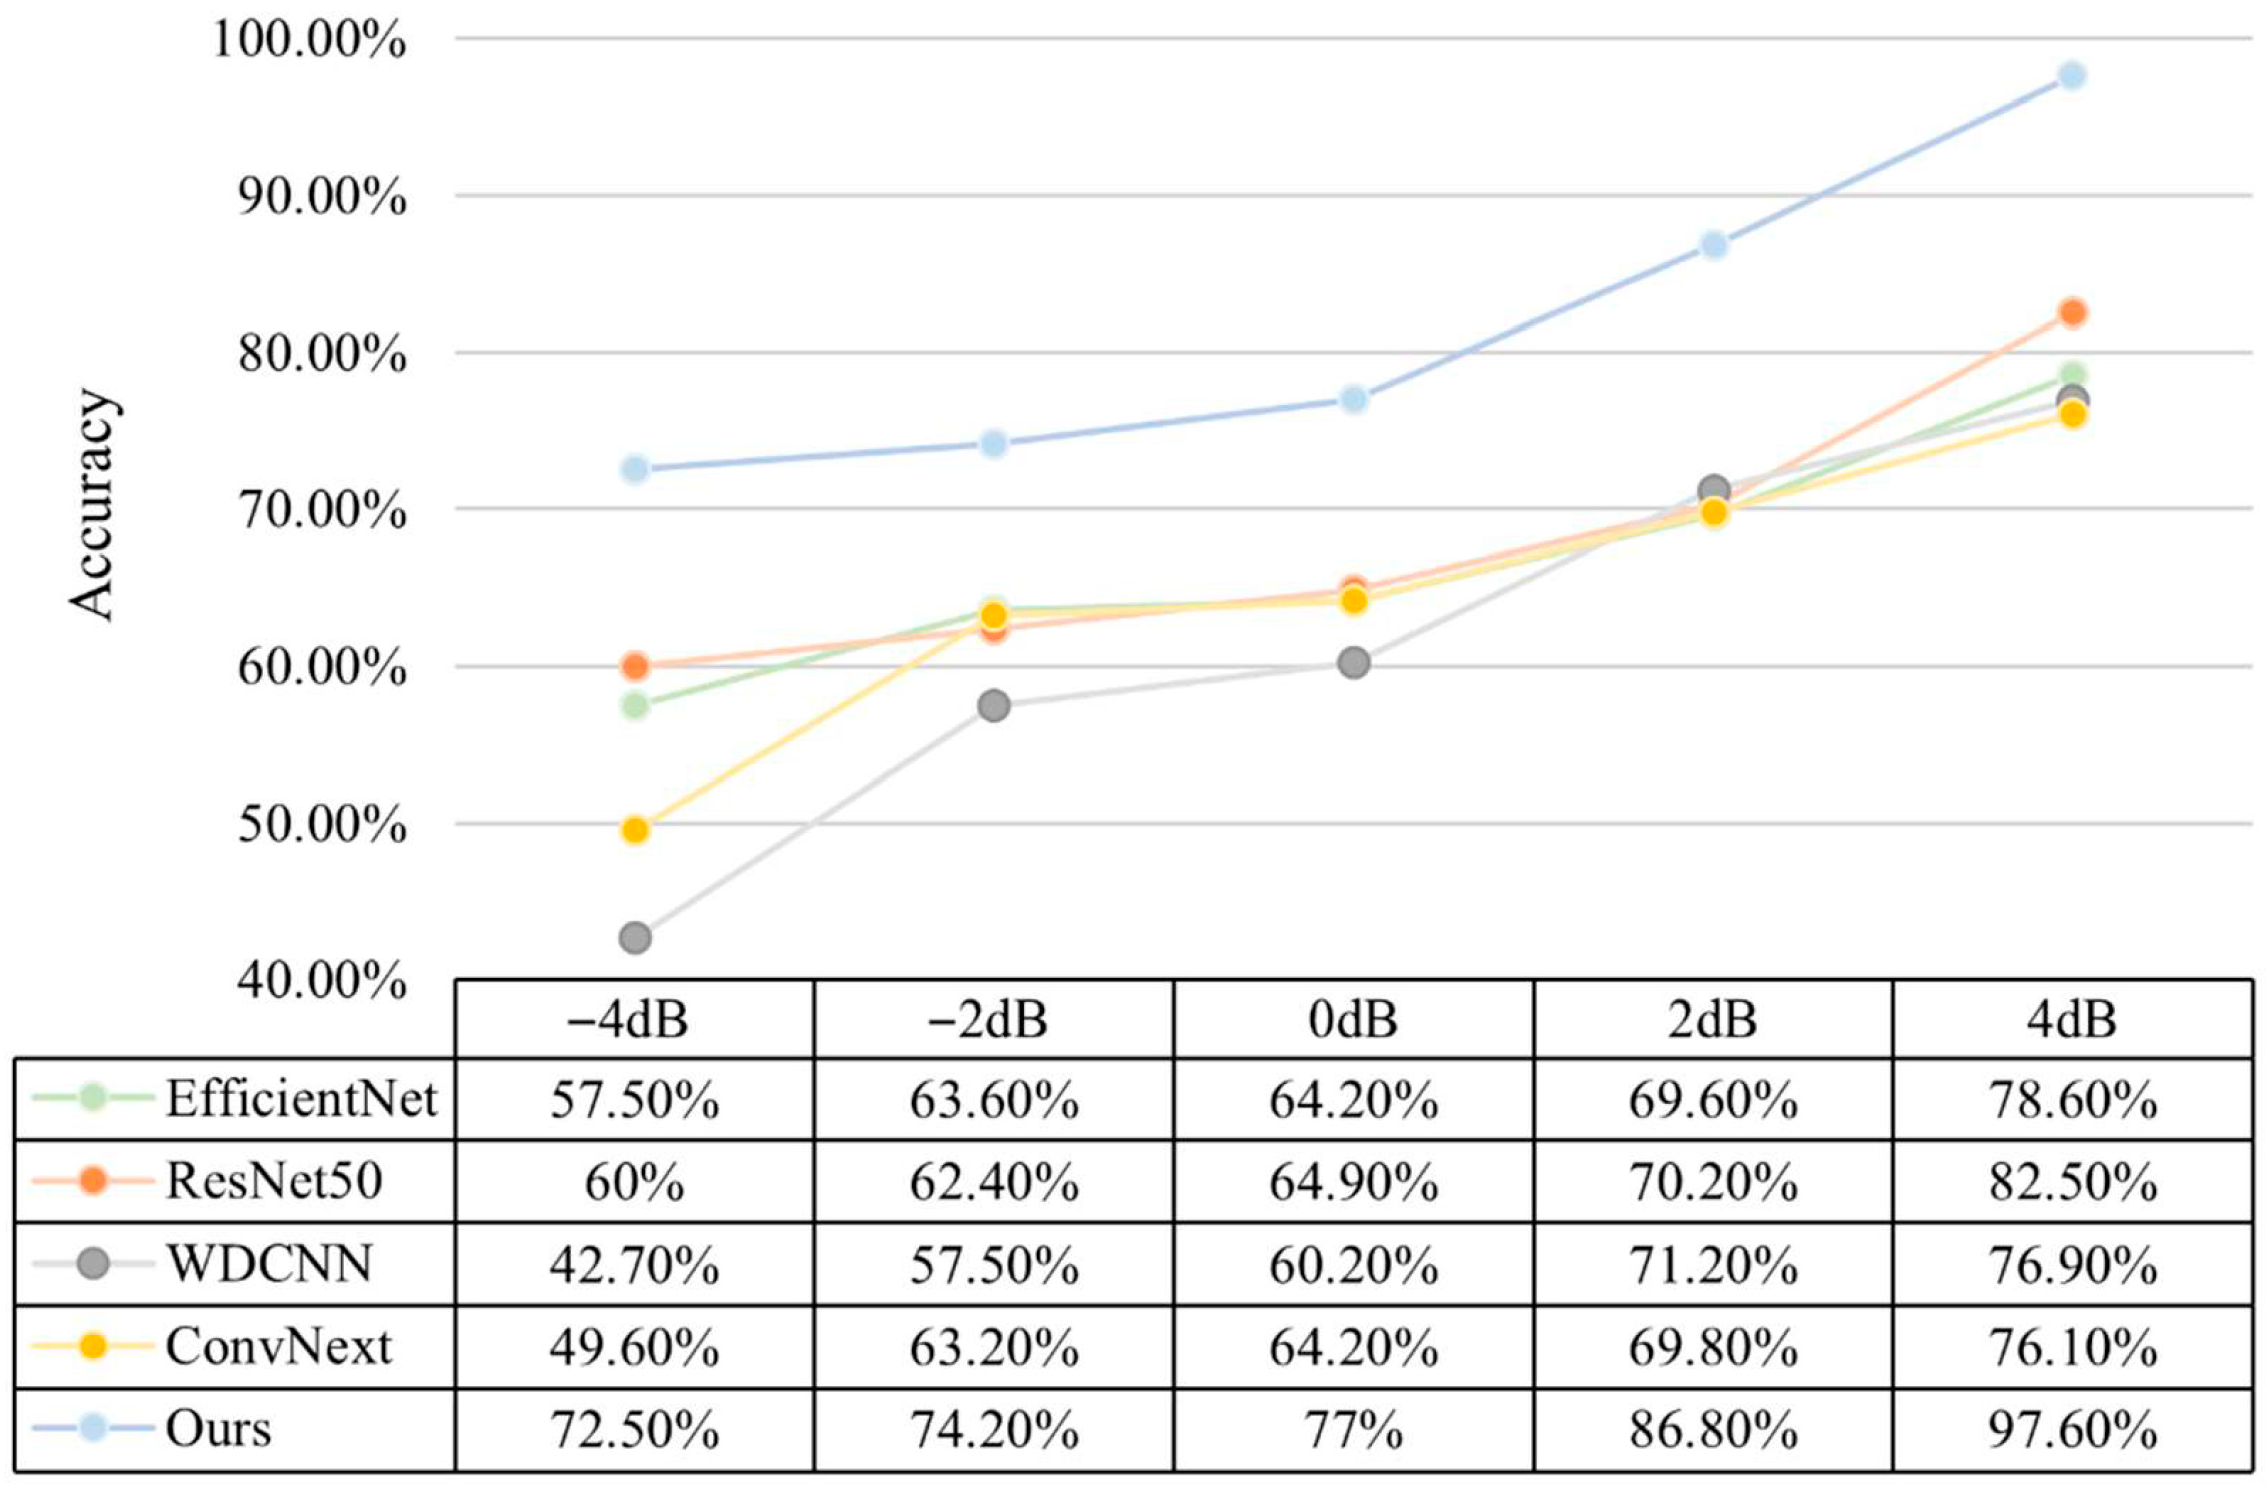
White Gaussian noise with SNR ranging from −4 dB to 4 dB is added to the CWRU dataset to simulate environmental noise interference. To validate the noise resistance capability of the proposed model, ResNet50 [25], WDCNN [54], ConvNeXt [24], and EfficientNet [55] are selected as the baselines. The averages of five repetitive experiments are adopted as the experimental results, as presented in Figure 12.
It can be seen from Figure 12 that the added noises degrade the diagnostic capability of the developed models. If the SNR is −4 dB, the accuracies of EfficientNet, ResNet50, WDCNN, and ConvNeXt degrade significantly, dropping to 57.5%, 60%, 55.7%, and 49.6%, respectively. It indicates a substantial impairment in their diagnostic capabilities. By contrast, the proposed method achieves an accuracy of 72.5% at the SNR of −4 dB, representing an accuracy improvement of 12.5% to 22.9% compared with other models. Thus, under strong noise interference, the proposed model can still effectively extract fault features and avoid key diagnostic information being submerged by noises. At the SNR of 4 dB, the fault diagnosis accuracy of the proposed approach is up to 97.6%, demonstrating a significant superiority over that of other models.
Overall, the presented fault diagnosis network delivers an average classification precision improvement of 14.7% within the SNR range of −4 dB to 4 dB by optimizing the feature extraction and noise suppression mechanisms. Especially under high-noise conditions at the SNR of −4 dB and −2 dB, it exhibits obvious advantages compared with other models. The proposed model has strong noise resistance and can maintain high fault diagnosis accuracy in complex noisy cases.
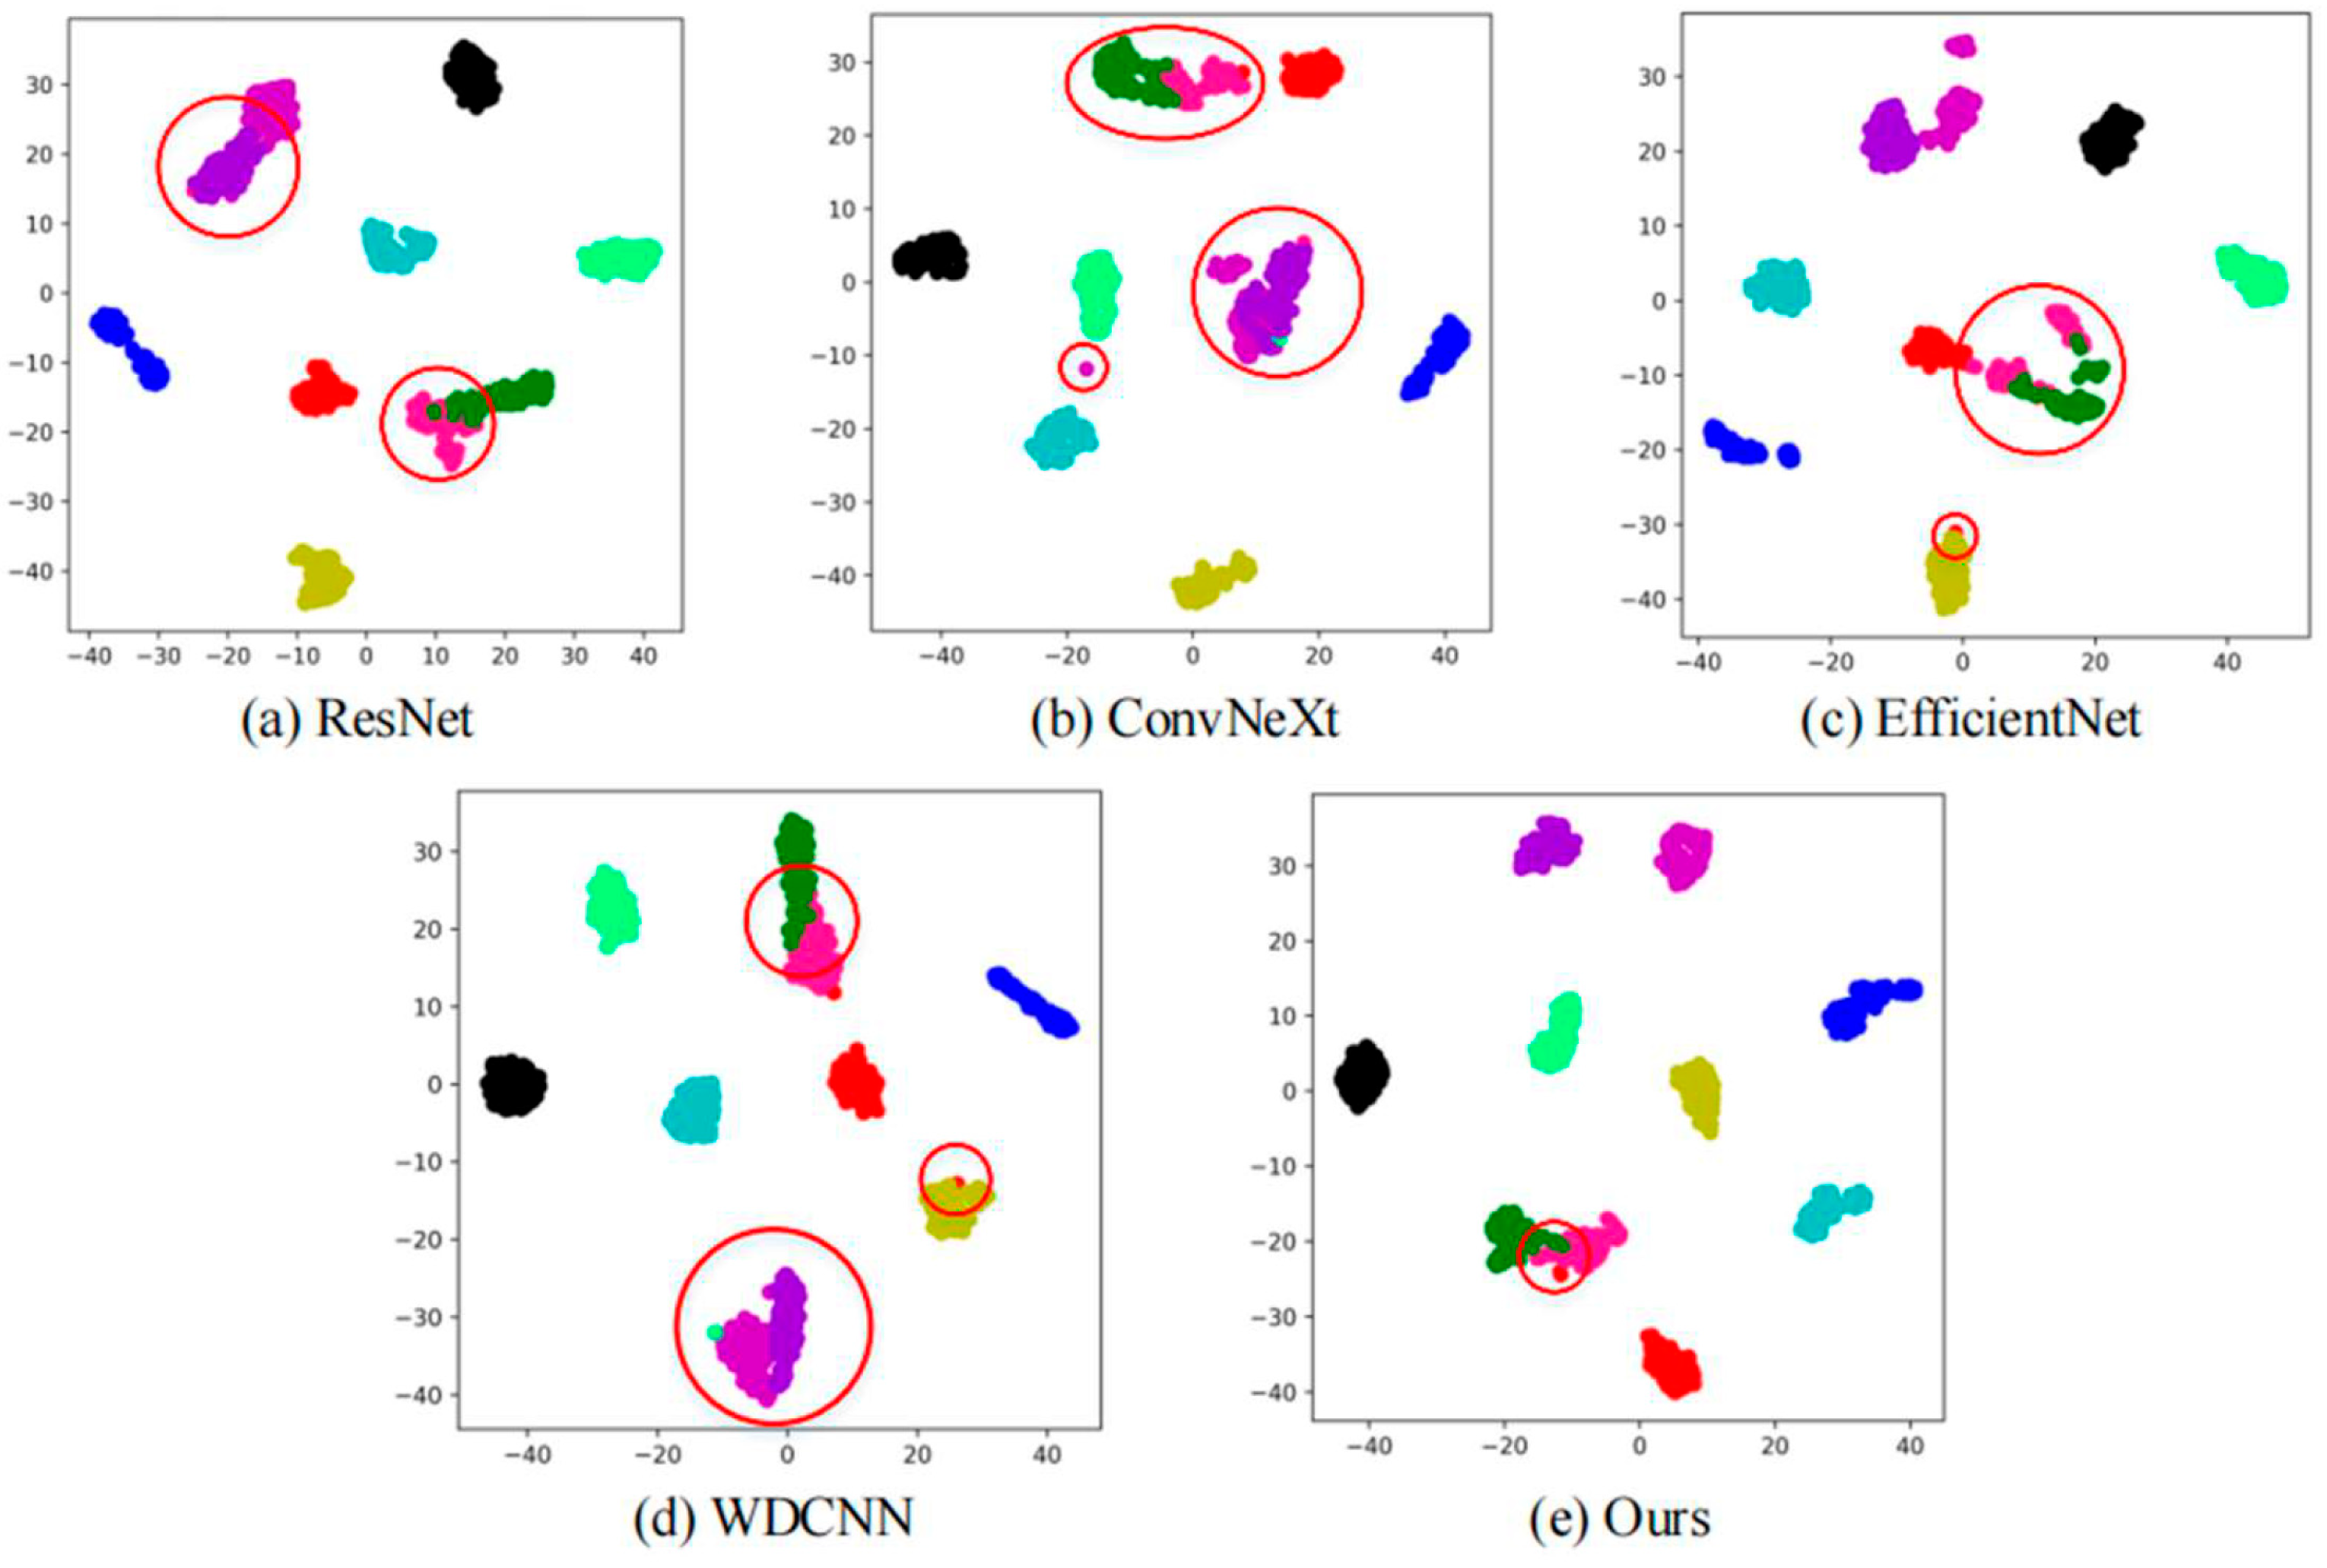
To verify the key feature extraction ability of the proposed method, the t-SNE algorithm is employed to conduct a 2D visualization analysis on the classification results. These results are compared against those from ResNet50, WDCNN, ConvNeXt, EfficientNet, and our proposed method with the SNR of the test dataset is set as 4 dB. As shown in Figure 13, the feature points of different categories in ConvNeXt and EfficientNet exhibit significant overlap with poor clustering effects, implying their suboptimal classification performance. Compared with the aforementioned two fault diagnosis models, ResNet and WDCNN exhibit marginal performances. The feature points of different categories in ResNet and WDCNN are partially separated, yet there is still adhesion among some categories. In contrast, the proposed method achieves sufficient feature extraction and distinct clustering. As can be seen from Figure 13, only a few points from two fault categories adhere slightly, while the distances among other fault categories are large and the boundaries are clear. Therefore, the proposed method has significant advantages in feature extraction, which can separate feature points of different categories more effectively and achieves better noise resistance.
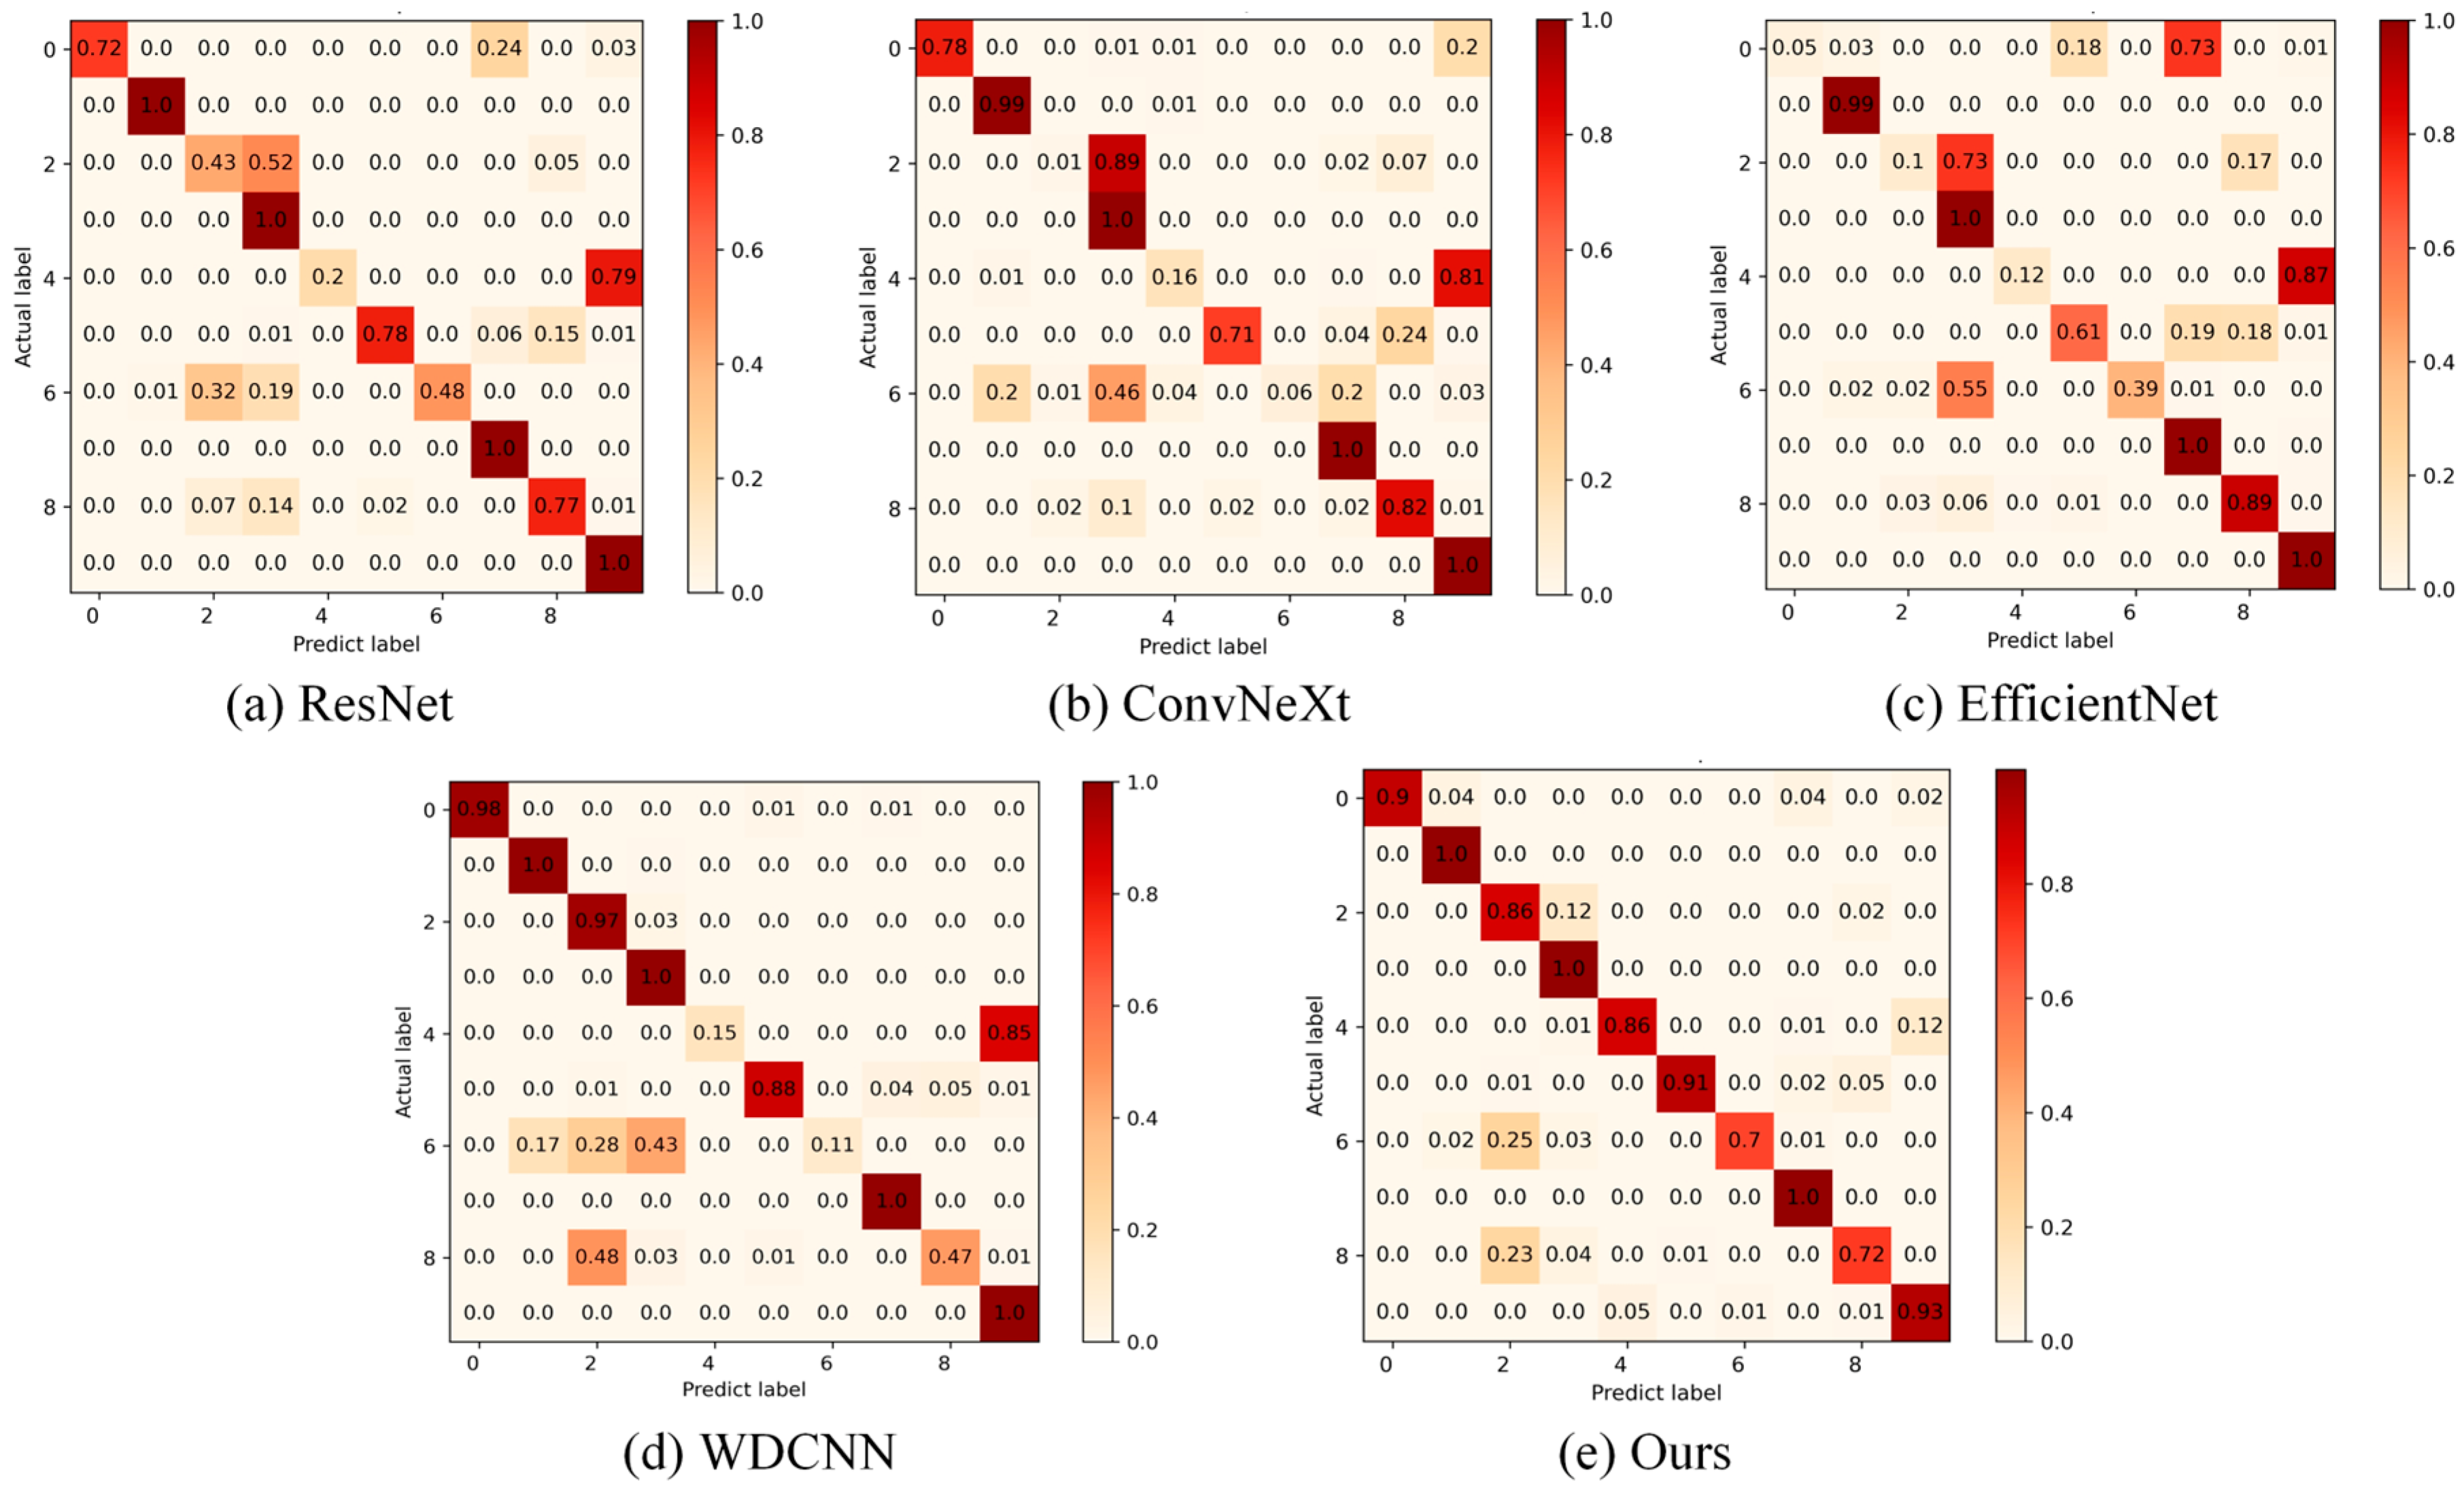
In order to assess the fault recognition performance of the developed diagnostic method, a quantitative analysis at the SNR of 4 dB is conducted. As presented in Figure 14, the confusion matrices for the ConvNeXt and EfficientNet methods exhibit obvious inter-class confusion, characterized by extensive non-zero elements in off-diagonal entries, indicating vague classification decision boundaries. Although the confusion levels of the ResNet and WDCNN models are reduced, misclassification probabilities exceeding 0.5 still occur between certain fault categories, indicating insufficient feature discriminability. In contrast, the proposed method demonstrates strong inter-class separability. As illustrated in Figure 14, the elements on the main diagonal are generally higher than 0.7. There is only a discriminant confusion of 0.2 for two types of faults, while the remaining categories all present strictly diagonal distribution characteristics. The obtained experimental findings demonstrate that our developed diagnostic approach exhibits robust classification capability under high-noise conditions.

5.3. Ablation Experiments

To verify the optimization effect of the model, three ablation experiments are designed with the controlled variable method under a 4 dB noise interference environment. The effectiveness of the multi-scale convolutional module and the ECGA attention mechanism is verified separately through ablation experiments. After conducting five repeated experiments, their average value was designated as the final result, with details provided in Table 4 and Figure 15. It can be seen from Table 4 that after introducing the multi-scale feature extraction module, the accuracy is significantly improved from 76.1% to 85.7%, and the loss value decreases to 0.396. However, the improvements in recall and F1 are not significant. Although the multi-scale mechanism can effectively enhance the feature representation ability, the increased number of extracted features may introduce redundancy, which impairs the network’s discriminative ability. After integrating the ECGA attention mechanism, the model’s accuracy is further improved to 97.6%, while the recall rate increased to 0.831 and the F1 score reached 0.825. The integration of the attention mechanism significantly enhances the recall rate and F1 score. This outcome demonstrates that the mechanism can focus on key fault features and capture the unique characteristics of each fault more efficiently, thus enabling more accurate classification performance.
An accuracy improvement of 21.5% is achieved by the proposed model over the original ConvNeXt. The improvements in the F1 score and the recall rate demonstrate that the proposed model exhibits stronger robustness to weak fault signals in complex noisy cases while maintaining high accuracy.

5.4. Comparative Analysis of the Attention Module

The RConvNeXt employs a parallel multi-scale convolutional residual structure, which captures detailed features at different scales while reducing computational complexity by parallel operations. However, ablation experiments show that redundant features increase as the amount of features increases in the multi-scale convolutional structure, thereby degrading the network’s discriminative ability. To mitigate this issue, the ECGA attention mechanism is designed. This mechanism reallocates weights in a content-oriented manner, thereby reducing the interference of redundant features on network discrimination. Consequently, it directs the model’s attention to salient pixel regions per channel, thereby enhancing its ability to identify and extract critical features.
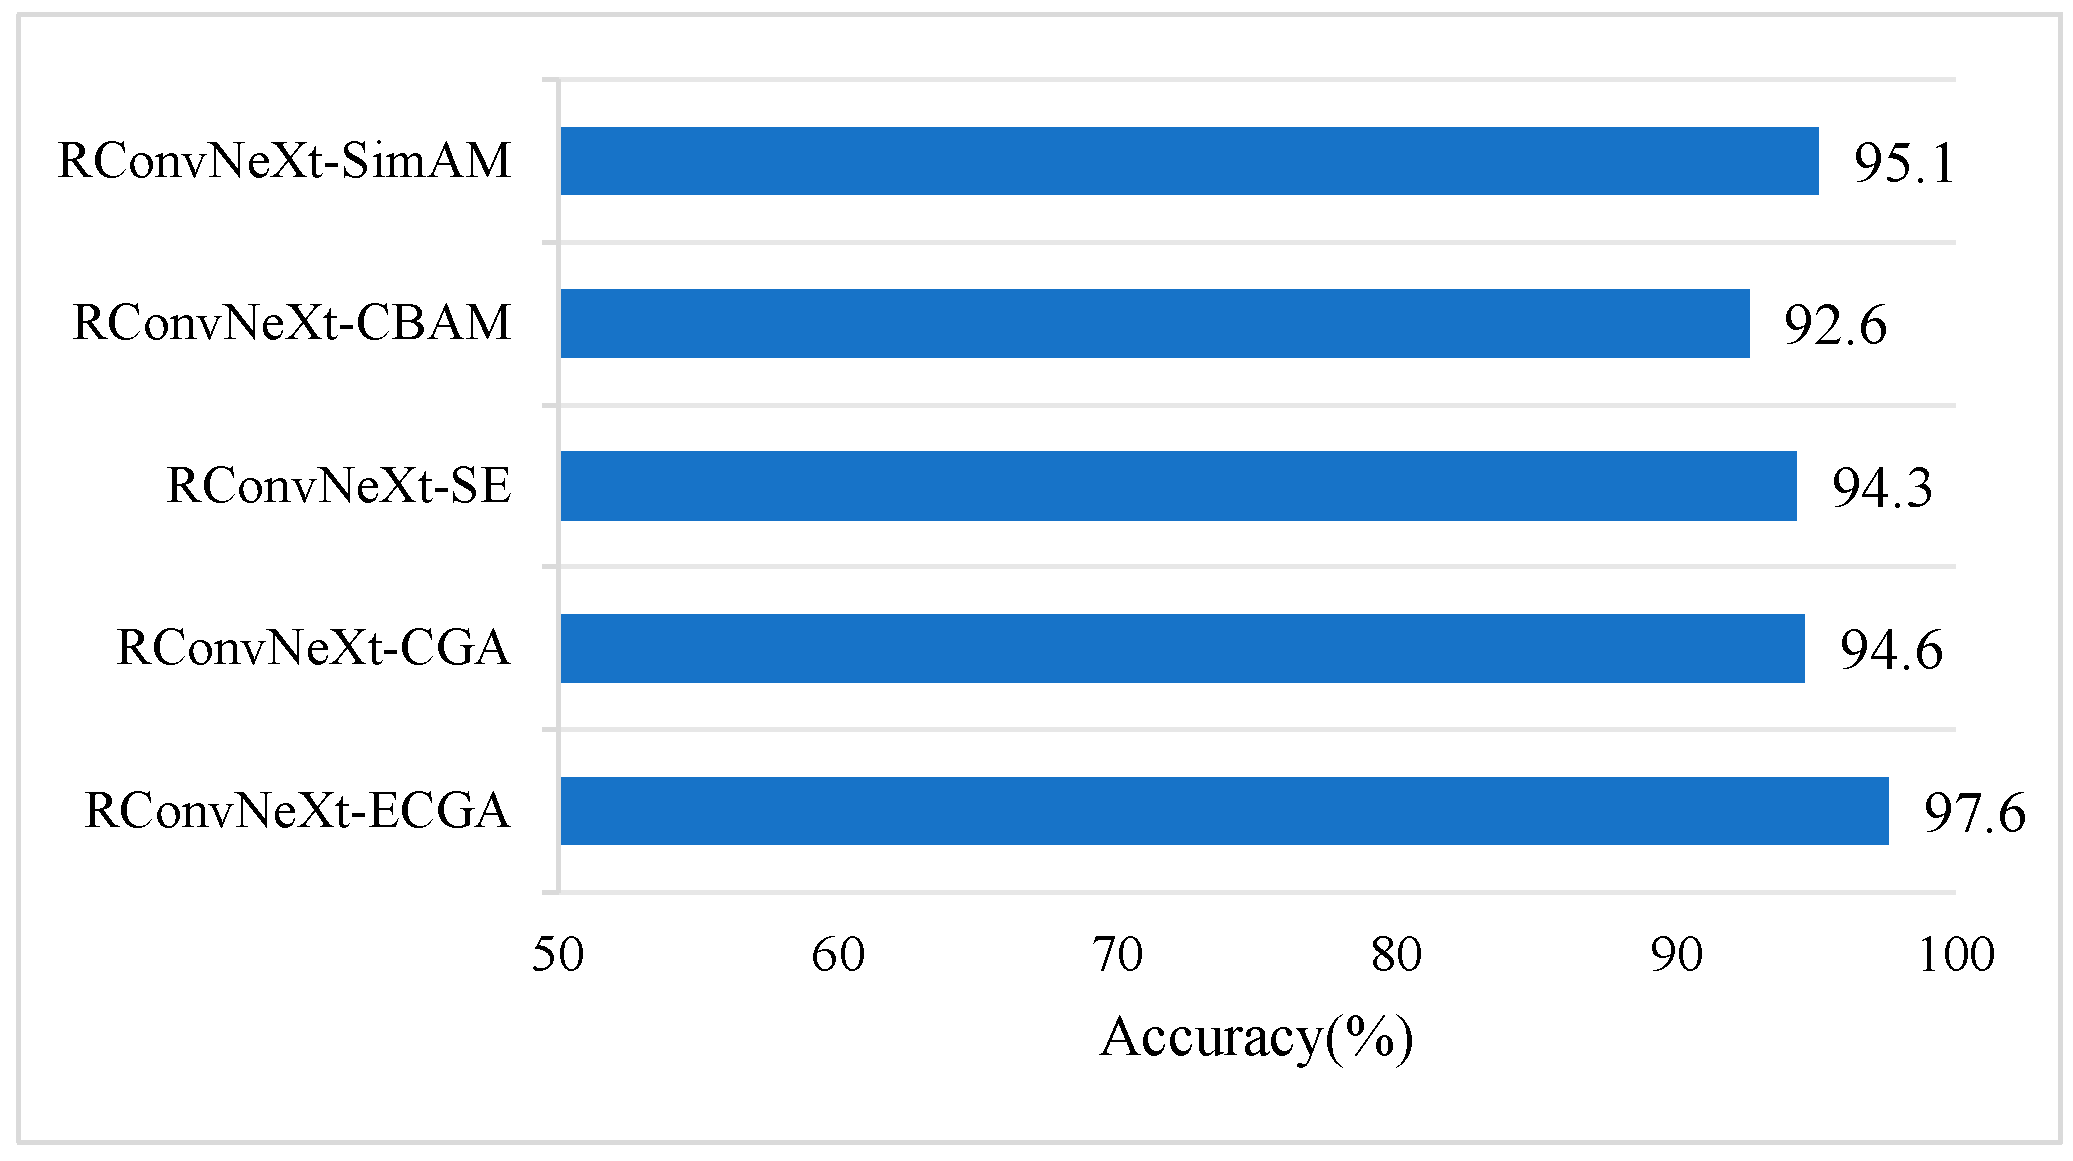
In order to assess the efficacy of the attention mechanism in enhancing network performance, comparative experiments are conducted in a 4 dB noise environment. The experiments involve integrating the RConvNeXt with various attention mechanisms, including ECGA, CGA, SE, CBAM [56], and SimAM [57]. The experimental accuracy is shown in Figure 16. When the proposed ECGA attention mechanism is combined with the RConvNeXt network, the model demonstrates the strongest diagnostic capability for rolling bearing faults, achieving an accuracy up to 97.6%. Compared with the RConvNeXt-CGA, RConvNeXt-SE, RConvNeXt-CBAM and RConvNeXt-SimAM, the accuracy rates are improved by 2.0%, 3.3%, 5.0%, and 2.5%, respectively. Therefore, the ECGA attention mechanism demonstrates superior capability for rolling bearing fault diagnosis, as it can more accurately capture subtle fault features in bearing vibration signals.

5.5. Model Cross-Operating-Condition Experiments

In practical engineering applications, bearings are generally operated under varying speeds and load conditions. As a result, it is difficult to acquire comprehensive data that cover all possible operating conditions [58]. Therefore, a model’s ability to accurately identify bearing states under unknown operating conditions is crucial for assessing its practical applicability [59]. In this context, the discrepancies between training and testing datasets can be regarded as a simulation of unknown operating conditions, providing an effective means to assess the model’s generalization and adaptability.
To simulate load variations, three sub-datasets (labeled A, B and C) from the CWRU dataset are selected. Each sub-dataset corresponds to different load and rotational speed conditions and contains one normal state of the bearing and nine types of fault states. Each sub-dataset contains 3000 images, with the first 80% of the time series used as the training set and the last 20% as the validation set. To evaluate the fault diagnosis performance of different methods under varying operating conditions, a cross-operating-condition experimental framework is established. Specifically, one operating condition is randomly selected as the training dataset, while the remaining conditions are assigned as the test dataset; multiple such cross-condition diagnosis tasks are constructed thereby. This experimental design is intended to simulate the influence of load fluctuations on diagnostic models in real-world industrial scenarios, as load variations are a primary factor leading to changes in operating conditions. Details of the construction of the three sub-datasets corresponding to these experimental tasks are presented in Table 5.
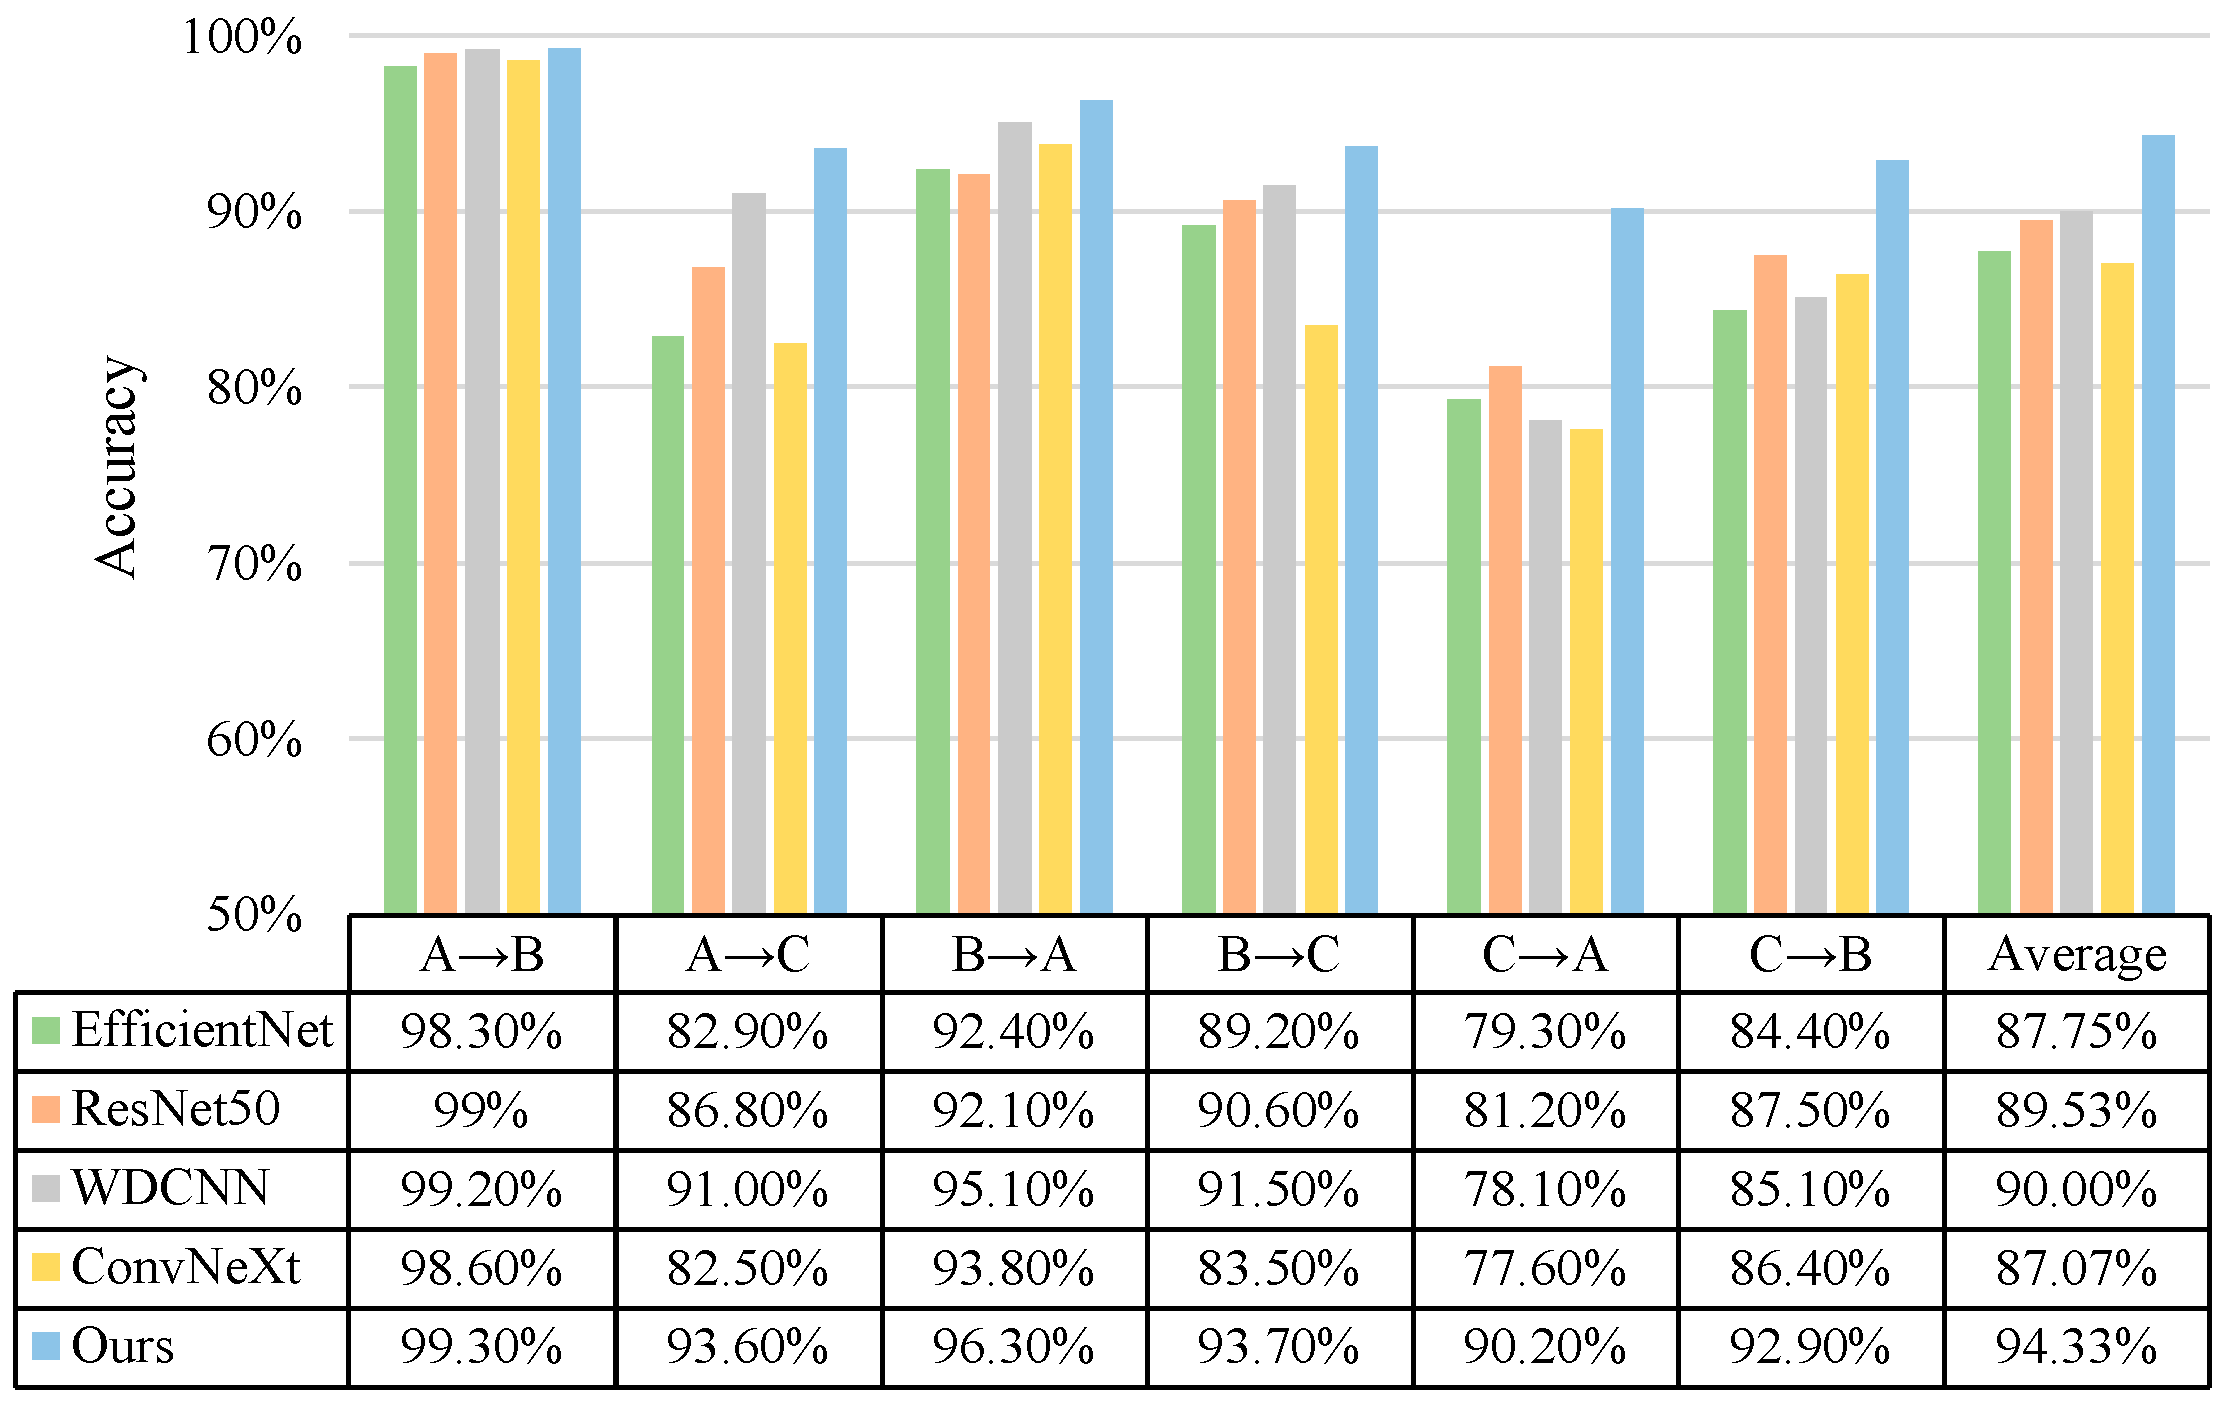
In this experiment, the aforementioned datasets are applied. To evaluate the fault diagnosis capability of the proposed model under variable operating conditions, ResNet50, WDCNN, ConvNeXt, and EfficientNet are selected as comparative models. Fault diagnosis outcomes for our developed model and the comparative models under different loads are presented in Figure 17. Here, “A→B” denotes a model trained on the dataset under 1 HP load and tested on the dataset under 2 HP load. “Average” represents the average recognition rate across all cross-operating-condition experiments.
The variable load experimental results are shown in Figure 17. The proposed method significantly outperforms the other four comparative models in diagnostic accuracy across all load transfer scenarios, demonstrating remarkably superior cross-condition adaptability. Specifically, in cases with significant load variation, such as “A→C” and “C→A,” the diagnostic accuracy of all models decreases. This suggests that larger load variations lead to greater signal differences, thereby rendering the extraction of fault information more difficult. However, the diagnostic accuracies of the proposed model reach 93.60% and 90.20% in these two challenging scenarios, outperforming all other methods and validating its feature generalization capability. Its diagnostic accuracy exceeds 90% accuracy in all six transfer tasks, with an average of 94.33%, demonstrating significant performance improvement over other models.
By contrast, WDCNN shows good performance in certain tasks. This model achieves 91.00% in “A→C”, yet only 78.10% in “C→A”. This noticeable performance gap indicates its sensitivity to the direction of load variation. ResNet50 shows relatively good average performance (89.53%) across similar tasks, but its recognition rate drops noticeably under large load differences, reaching only 81.20% in the “C→A” scenario. Both EfficientNet and ConvNeXt exhibit notable performance fluctuations in specific scenarios. For instance, ConvNeXt achieves only 83.50% in the “B→C” task, reflecting limitations in feature generalization.
In summary, by leveraging multi-scale parallel feature extraction and the content-guided attention mechanism, the proposed model not only effectively enhances robustness to load variations, but also demonstrates more stable fault recognition performance across various complex operating conditions.

6. Conclusions

To address the problems of low SNR, complex operating conditions, and redundant information in bearing data, this paper proposes a novel rolling bearing fault diagnosis method based on RConvNeXt-ECGA. The RConvNeXt employs a multi-branch architecture to effectively capture features across different scales. Subsequently, these features are fused via internal connections in a group-wise cumulative manner. This fusion enables the construction of a hierarchical feature representation with multiple receptive fields, allowing each output feature to capture richer information. In addition, a novel attention mechanism, ECGA, is introduced, which enhances the model’s focus on critical features while significantly reducing model complexity and the number of parameters. Compared with other attention modules, it achieves an average improvement of approximately 2% in classification performance.
In anti-noise and cross-operating-condition experiments, the proposed model demonstrated superior performance over all baselines, achieving 72.5% accuracy at −4 dB, 97.6% at 4 dB, and an average accuracy of 94.33% across six varying-speed conditions. These results demonstrate its robust generalization ability under noise and speed variations, as well as its capacity to reliably capture fault-related vibration signatures generated by defect-induced changes in rolling-contact tribodynamics. By employing multi-scale feature extraction and a novel attention mechanism, the proposed method achieves accurate fault identification by leveraging these signatures, enabling reliable bearing diagnosis under complex conditions.
Although validated on benchmark datasets, the scarcity of fault samples in industrial scenarios remains a critical bottleneck. Future work will develop a cross-domain diagnostic framework that integrates tribodynamics simulation with transfer learning. Physics-generated synthetic data will be used to augment training and characterize the state-to-vibration mapping, thereby enhancing robustness and generalization under real-world small-sample conditions.

Author Contributions

Conceptualization, Y.L. and J.C.; methodology, Y.L.; software, J.C.; validation, Y.L., J.C. and H.Z.; formal analysis, Y.L. and R.L.; investigation, Y.L. and J.C.; resources, R.L. and N.Z.; data curation, H.Z. and N.K.; writing—original draft preparation, J.C.; writing—review and editing, Y.L., H.Z. and N.K.; visualization, J.C.; supervision, Y.L. and R.L.; project administration, R.L.; funding acquisition, Y.L., J.C. and R.L. All authors have read and agreed to the published version of the manuscript.

Funding

This research was funded by the National Natural Science Foundation of China (Grant Nos. 62041106 and 32460441), in part by the Natural Science Foundation of Jiangxi Province (20202BABL20203), and in part by the Postgraduate Innovation Special Fund of Jiangxi Province, China (Grant No. YC2024-S356).

Data Availability Statement

The data are available from the corresponding author on reasonable request.

Conflicts of Interest

The authors declare no conflicts of interest.

Nomenclature

x t Input time-domain signal
tTime variable
φ t Mother wavelet function
sScale factor
τ Translation (shift) factor
XInput feature map
CNumber of channels (feature map)
H Feature-map height
W Feature-map width
i , j Spatial indices
kAdaptive 1D convolution kernel size
ψ C Mapping from channel number C to kernel size k
bHyperparameter in ψ C
γ Hyperparameter in ψ C
σ Sigmoid function
C 1 D k 1D convolution with kernel size k
W c Channel attention weights
X G A P c GAP across spatial dimensions (channel descriptor)
W s Spatial attention weights
X G A P s GAP across channel dimension (spatial descriptor)
X G M P s Global max pooling across channel dimension
W c o a Coarse SIM/coarse fused attention map
W Final SIM/final attention map
CS Channel shuffle operation
LCross-entropy loss
NTotal number of samples
MNumber of classes
iSample index
mClass index
CNNconvolutional neural network
STFTshort-time Fourier transform
CWTcontinuous wavelet transform
HHThilbert-huang transform
CWRUcase western reserve university
HUSThuazhong university of science and technology
ViTvision transformer
LNlayer normalization
MLPmulti-layer perceptron
GAPglobal average pooling 
SNRsignal-to-noise ratio
DWConvDepthwise convolution
PWConvPointwise convolution
ECAefficient channel attention
CGAcontent-guided attention
ECGAefficient content-guided attention
SEsqueeze-and-excitation
SIMsspatial importance maps
GMPglobal max pooling
t-SNE t-distributed Stochastic Neighbor Embedding
CBAMConvolutional Block Attention Module
SimAMSimple Attention Module

References

  1. Rai, A.; Upadhyay, S. A review on signal processing techniques utilized in the fault diagnosis of rolling element bearings. Tribol. Int. 2016, 96, 289–306. [Google Scholar] [CrossRef] [Scilit]
  2. Zheng, J.; Pan, H.; Tong, J.; Liu, Q. Generalized refined composite multiscale fuzzy entropy and multi-cluster feature selection based intelligent fault diagnosis of rolling bearing. ISA Trans. 2022, 123, 136–151. [Google Scholar] [CrossRef] [Scilit]
  3. He, B.; Wang, H.; Fan, S. Source-free cross-machine fault diagnosis method in a two-stage pseudo-supervised framework. Eng. Appl. Artif. Intell. 2026, 166, 113585. [Google Scholar] [CrossRef] [Scilit]
  4. Lynagh, N.; Rahnejat, H.; Ebrahimi, M.; Aini, R. Bearing induced vibration in precision high speed routing spindles. Int. J. Mach. Tools Manuf. 2000, 40, 561–577. [Google Scholar] [CrossRef] [Scilit]
  5. Vafaei, S.; Rahnejat, H.; Aini, R. Vibration monitoring of high speed spindles using spectral analysis techniques. Int. J. Mach. Tools Manuf. 2002, 42, 1223–1234. [Google Scholar] [CrossRef] [Scilit]
  6. Mohammadpour, M.; Johns-Rahnejat, P.M.; Rahnejat, H. Roller bearing dynamics under transient thermal-mixed non-Newtonian elastohydrodynamic regime of lubrication. Proc. Inst. Mech. Eng. K J. Multi-Body Dyn. 2015, 229, 407–423. [Google Scholar] [CrossRef] [Scilit]
  7. Fang, C.; Peng, Y.; Guan, Y.; Zhou, W.; Gao, G. A new numerical method for the tribo-dynamic analysis of cylindrical roller bearings. Nonlinear Dyn. 2023, 111, 11275–11295. [Google Scholar] [CrossRef] [Scilit]
  8. Tu, W.; Yu, W.; Shao, Y.; Yu, Y. A nonlinear dynamic vibration model of cylindrical roller bearing considering skidding. Nonlinear Dyn. 2021, 103, 2299–2313. [Google Scholar] [CrossRef] [Scilit]
  9. Tsuha, N.; Cavalca, K. Stiffness and damping of elastohydrodynamic line contact applied to cylindrical roller bearing dynamic model. J. Sound Vib. 2020, 481, 115444. [Google Scholar] [CrossRef] [Scilit]
  10. Cen, J.; Yang, Z.; Liu, X.; Xiong, J.; Chen, H. A review of data-driven machinery fault diagnosis using machine learning algorithms. J. Vib. Eng. Technol. 2022, 10, 2481–2507. [Google Scholar] [CrossRef] [Scilit]
  11. Bao, Z.; Liu, C.; Yang, H.; Zhang, J.; Li, Y. From theory to industry: A survey of deep learning-enabled bearing fault diagnosis in complex environments. Eng. Appl. Artif. Intell. 2026, 163, 113068. [Google Scholar] [CrossRef] [Scilit]
  12. Zhang, P.; Huang, M.; Sun, W. Fault Diagnosis for CNC Machine Tool Feed Systems Based on Enhanced Multi-Scale Feature Network. Lubricants 2025, 13, 350. [Google Scholar] [CrossRef] [Scilit]
  13. Ince, T.; Kiranyaz, S.; Eren, L.; Askar, M.; Gabbouj, M. Real-Time Motor Fault Detection by 1D Convolutional Neural Networks. IEEE Trans. Ind. Electron. 2016, 63, 7067–7075. [Google Scholar] [CrossRef] [Scilit]
  14. Jia, Y.; Yao, D.; Yang, J.; Jia, L.; Zhou, T.; Long, Q. A multi-scale wavelet and spectral kurtosis-guided framework for noise-resistant rolling bearing fault diagnosis. Mech. Syst. Signal Process. 2026, 242, 113662. [Google Scholar] [CrossRef] [Scilit]
  15. Xu, Y.; Feng, K.; Yan, X.; Yan, R.; Ni, Q.; Sun, B. CFCNN: A novel convolutional fusion framework for collaborative fault identification of rotating machinery. Inf. Fusion 2023, 95, 1–16. [Google Scholar] [CrossRef] [Scilit]
  16. Zhang, W.; Zhang, F.; Chen, W.; Jiang, Y.; Song, D. Fault state recognition of rolling bearing based fully convolutional network. Comput. Sci. Eng. 2018, 21, 55–63. [Google Scholar] [CrossRef] [Scilit]
  17. LeCun, Y.; Bottou, L.; Bengio, Y.; Haffner, P. Gradient-based learning applied to document recognition. Proc. IEEE 1998, 86, 2278–2324. [Google Scholar] [CrossRef] [Scilit]
  18. Gundewar, S.K.; Kane, P.V. Bearing fault diagnosis using time segmented Fourier synchrosqueezed transform images and convolution neural network. Measurement 2022, 203, 111855. [Google Scholar] [CrossRef] [Scilit]
  19. Peng, B.; Xia, H.; Lv, X.; Annor-Nyarko, M.; Zhu, S. An intelligent fault diagnosis method for rotating machinery based on data fusion and deep residual neural network. Appl. Intell. 2022, 52, 3051–3065. [Google Scholar] [CrossRef] [Scilit]
  20. Verstraete, D.; Ferrada, A.; Droguett, E.L.; Viviana, M. Deep learning enabled fault diagnosis using time-frequency image analysis of rolling element bearings. Shock Vib. 2017, 1, 5067651. [Google Scholar] [CrossRef] [Scilit]
  21. Du, Y.; Cao, Y.; Wang, H.; Li, G. A Rolling Bearing Fault Diagnosis Method Combining MSSSA-VMD with the Parallel Network of GASF-CNN and BiLSTM. Lubricants 2024, 12, 452. [Google Scholar] [CrossRef] [Scilit]
  22. Xu, Y.; Li, Z.; Wang, S.; Li, W.; Sarkodie-Gyan, T. A hybrid deep-learning model for fault diagnosis of rolling bearings. Measurement 2021, 169, 108502. [Google Scholar] [CrossRef] [Scilit]
  23. Gao, D.; Zhu, Y.; Ren, Z.; Yan, K.; Kang, W. A novel weak fault diagnosis method for rolling bearings based on LSTM considering quasi-periodicity. Knowl.-Based Syst. 2021, 231, 107413. [Google Scholar] [CrossRef] [Scilit]
  24. Liu, Z.; Mao, H.; Wu, C.Y.; Feichtenhofer, C.; Darrell, T. A convnet for the 2020s. In Proceedings of the 2022 IEEE/CVF Conference on Computer Vision and Pattern Recognition (CVPR), New Orleans, LA, USA, 18–24 June 2022; pp. 11976–11986. [Google Scholar] [CrossRef] [Scilit]
  25. He, K.; Zhang, X.; Ren, S.; Sun, J. Deep residual learning for image recognition. In Proceedings of the 2016 IEEE Conference on Computer Vision and Pattern Recognition (CVPR), Las Vegas, NV, USA, June 27–30 June 2016; pp. 770–778. [Google Scholar] [CrossRef] [Scilit]
  26. Liu, Z.; Lin, Y.; Cao, Y.; Hu, H.; Wei, Y.; Zhang, Z.; Lin, S.; Guo, B. Swin Transformer: Hierarchical Vision Transformer Using Shifted Windows. arXiv 2021, arXiv:2103.14030. [Google Scholar] [CrossRef] [Scilit]
  27. Ma, X.; Niu, T.; Liu, X.; Luan, H.; Zhao, S. Remaining useful lifetime prediction of rolling bearing based on ConvNext and multi-feature fusion. In Proceedings of the 2022 International Conference on Computer Engineering and Artificial Intelligence (ICCEAI), Shijiazhuang, China, 22–24 July 2022; pp. 299–304. [Google Scholar] [CrossRef] [Scilit]
  28. Guo, B.; Qiao, Z.; Zhang, N.; Wang, Y.; Wu, F. Attention-based ConvNeXt with a parallel multiscale dilated convolution residual module for fault diagnosis of rotating machinery. Expert Syst. Appl. 2024, 249, 123764. [Google Scholar] [CrossRef] [Scilit]
  29. Zhao, Y.; Liang, Q.; Tian, Z. ConvNeXt-BiGRU Rolling Bearing Fault Detection Based on Attention Mechanism. In Proceedings of the International Conference on Intelligent Computing, Tianjin, China, 5–8 August 2024; pp. 66–76. [Google Scholar] [CrossRef] [Scilit]
  30. Yang, S.; Xiang, Y.; Long, Z.; Ma, X.; Ding, Q. Fault diagnosis of harmonic drives based on an SDP-ConvNeXt joint methodology. IEEE Trans. Instrum. Meas. 2023, 72, 3519608. [Google Scholar] [CrossRef] [Scilit]
  31. Zhang, L.; Lin, J.; Yang, Z.; Shao, H.; Liu, B. Wave-ConvNeXt: An efficient and precise fault diagnosis method for IIoT leveraging tailored ConvNeXt and wavelet transform. IEEE Internet Things J. 2024, 11, 23096–23109. [Google Scholar] [CrossRef] [Scilit]
  32. Vafaei, S.; Rahnejat, H. Indicated repeatable runout with wavelet decomposition (IRR-WD) for effective determination of bearing-induced vibration. J. Sound Vib. 2003, 260, 67–82. [Google Scholar] [CrossRef] [Scilit]
  33. Kankar, P.K.; Sharma, S.C.; Harsha, S.P. Rolling element bearing fault diagnosis using wavelet transform. Neurocomputing 2011, 74, 1638–1645. [Google Scholar] [CrossRef] [Scilit]
  34. Gu, X.; Yang, S.; Liu, Y.; Deng, F. Compound faults detection of the rolling element bearing based on the optimal complex Morlet wavelet filter. Proc. Inst. Mech. Eng. C-J. Mech. 2018, 232, 1786–1801. [Google Scholar] [CrossRef] [Scilit]
  35. Zhang, X.; Liu, Z.; Wang, J. Time–frequency analysis for bearing fault diagnosis using multiple Q-factor Gabor wavelets. ISA Trans. 2019, 87, 225–234. [Google Scholar] [CrossRef] [Scilit] [PubMed]
  36. Randall, R.; Antoni, J. Rolling element bearing diagnostics—A tutorial. Mech. Syst. Signal Process. 2011, 25, 485–520. [Google Scholar] [CrossRef] [Scilit]
  37. Li, Y.; Fu, H.; Feng, K.; Li, Z.; Peng, Z.; Saboktakin, A.; Noman, K. Oscillatory time–frequency concentration for adaptive bearing fault diagnosis under nonstationary time-varying speed. Measurement 2023, 218, 113177. [Google Scholar] [CrossRef] [Scilit]
  38. Hendriks, J.; Dumond, P.; Knox, D.A. Towards better benchmarking using the CWRU bearing fault dataset. Mech. Syst. Signal Process. 2022, 169, 108732. [Google Scholar] [CrossRef] [Scilit]
  39. Zhao, C.; Zio, E.; Shen, W. Domain generalization for cross-domain fault diagnosis: An application-oriented perspective and a benchmark study. Reliab. Eng. Syst. Saf. 2024, 245, 109964. [Google Scholar] [CrossRef] [Scilit]
  40. Dosovitskiy, A.; Beyer, L.; Kolesnikov, A.; Weissenborn, D.; Houlsby, N. An image is worth 16x16 words: Transformers for image recognition at scale. arXiv 2020, arXiv:2010.11929. [Google Scholar] [CrossRef] [Scilit]
  41. Chollet, F. Xception: Deep learning with depthwise separable convolutions. In Proceedings of the 2017 IEEE Conference on Computer Vision and Pattern Recognition (CVPR), Honolulu, HI, USA, 21–26 July 2017; pp. 1251–1258. [Google Scholar] [CrossRef] [Scilit]
  42. Gao, S.H.; Cheng, M.M.; Zhao, K.; Zhang, X.Y.; Yang, M.N.; Torr, P. Res2net: A new multi-scale backbone architecture. IEEE Trans. Pattern Anal. Mach. Intell. 2019, 43, 652–662. [Google Scholar] [CrossRef] [Scilit]
  43. Szegedy, C.; Liu, W.; Jia, Y.; Sermanet, P.; Reed, S. Going deeper with convolutions. In Proceedings of the 2015 IEEE Conference on Computer Vision and Pattern Recognition (CVPR), Boston, MA, USA, 7–12 June 2015; pp. 1–9. [Google Scholar] [CrossRef] [Scilit]
  44. McFadden, P.; Smith, J. Vibration monitoring of rolling element bearings by the high-frequency resonance technique—A review. Tribol. Int. 1984, 17, 3–10. [Google Scholar] [CrossRef] [Scilit]
  45. Borghesani, P.; Smith, W.; Randall, R.; Antoni, J.; El Badaoui, M. Bearing signal models and their effect on bearing diagnostics. Mech. Syst. Signal Process. 2022, 174, 109077. [Google Scholar] [CrossRef] [Scilit]
  46. Luo, M.; Andre, H.; Guo, Y.; Peng, Y. Analysis of contact behaviours and vibrations in a defective deep groove ball bearing. J. Sound Vib. 2024, 570, 118104. [Google Scholar] [CrossRef] [Scilit]
  47. Wang, Q.; Wu, B.; Zhu, P.; Li, P.; Hu, Q. ECA-Net: Efficient channel attention for deep convolutional neural networks. In Proceedings of the 2020 IEEE/CVF Conference on Computer Vision and Pattern Recognition (CVPR), Seattle, WA, USA, 13–19 June 2020; pp. 11534–11542. [Google Scholar] [CrossRef] [Scilit]
  48. Hu, J.; Shen, L.; Sun, G. Squeeze-and-excitation networks. In IEEE Transactions on Pattern Analysis and Machine Intelligence; IEEE: New York, NY, USA, 2018; pp. 7132–7141. [Google Scholar] [CrossRef] [Scilit]
  49. Chen, Z.; He, Z.; Lu, Z.M. DEA-Net: Single image dehazing based on detail-enhanced convolution and content-guided attention. IEEE Trans. Image Process. 2024, 33, 1002–1015. [Google Scholar] [CrossRef] [Scilit]
  50. Hui, L.; Belkin, M. Evaluation of neural architectures trained with square loss vs cross-entropy in classification tasks. arXiv 2020, arXiv:2006.07322. [Google Scholar] [CrossRef] [Scilit]
  51. Powers, D.M.W. Evaluation: From precision, recall and F-measure to ROC, informedness, markedness and correlation. J. Mach. Learn. Technol. 2011, 2, 37–63. [Google Scholar] [CrossRef] [Scilit]
  52. Laurens, V.D.M.; Hinton, G. Visualizing Data using t-SNE. J. Mach. Learn. Res. 2008, 9, 2579–2605. [Google Scholar]
  53. Su, X.; Han, J.; Chen, C.; Lu, J.; Ma, W.; Dai, X. Intelligent Workshop Bearing Fault Diagnosis Method Based on Improved Convolutional Neural Network. Lubricants 2025, 13, 521. [Google Scholar] [CrossRef] [Scilit]
  54. Zhang, W.; Li, C.; Peng, G.; Chen, Y.; Zhang, Z. A deep convolutional neural network with new training methods for bearing fault diagnosis under noisy environment and different working load. Mech. Syst. Signal Process. 2018, 100, 439–453. [Google Scholar] [CrossRef] [Scilit]
  55. Tan, M.; Le, Q. Efficientnet: Rethinking model scaling for convolutional neural networks. arXiv 2019, arXiv:1905.11946. [Google Scholar] [CrossRef] [Scilit]
  56. Woo, S.; Park, J.; Lee, J.Y.; Kweon, I.S. Cbam: Convolutional block attention module. In Computer Vision—ECCV 2018; Springer: Cham, Switzerland, 2018; pp. 3–19. [Google Scholar] [CrossRef] [Scilit]
  57. Yang, L.; Zhang, R.Y.; Li, L.; Xie, X. Simam: A simple, parameter-free attention module for convolutional neural networks. arXiv 2021, arXiv:2106.00131. [Google Scholar] [CrossRef] [Scilit]
  58. Sanakkayala, D.C.; Varadarajan, V.; Kumar, N.; Karan; Soni, G.; Kamat, P.; Kumar, S.; Patil, S.; Kotecha, K. Explainable AI for Bearing Fault Prognosis Using Deep Learning Techniques. Micromachines 2022, 13, 1471. [Google Scholar] [CrossRef] [Scilit]
  59. Cao, W.; Meng, Z.; Li, J.; Guan, Y.; Fan, J. A bearing fault diagnosis method for unknown operating conditions based on differentiated feature extraction. ISA Trans. 2025, 156, 468–478. [Google Scholar] [CrossRef] [Scilit]
Figure 1. Time-frequency image generated by the CWT. Brighter regions indicate higher energy, whereas darker regions indicate lower energy in the time-frequency domain.
Lubricants 14 00121 g001
Figure 2. CWRU bearing fault feature map generated by the CWT.
Lubricants 14 00121 g002
Figure 3. HUST Bearing fault feature map generated by the CWT.
Lubricants 14 00121 g003
Figure 4. Schematic diagram of the ConvNeXt network model. The arrows indicate the direction of data flow, “+” denotes element-wise addition in the residual connection, and different colors represent different types of network modules.
Lubricants 14 00121 g004
Figure 5. Multi-scale feature extraction module. Arrows indicate the direction of data flow, “+” denotes element-wise addition, and different colors indicate different types of operations or modules.
Lubricants 14 00121 g005
Figure 6. The diagram of efficient content-guided attention (ECGA). Arrows indicate the direction of data flow, “+” denotes element-wise addition.
Lubricants 14 00121 g006
Figure 7. Architecture of the RConvNeXt-ECGA Model. Arrows indicate the direction of data flow, “+” denotes element-wise addition, and different colors indicate different types of operations or modules.
Lubricants 14 00121 g007
Figure 8. CWRU Dataset Generalization Experiment Results. (a) CWRU training accuracy curve; (b) CWRU loss function curve.
Lubricants 14 00121 g008
Figure 9. HUST Dataset Generalization Experiment Results. (a) HUST training accuracy curve; (b) HUST loss function curve.
Lubricants 14 00121 g009
Figure 10. CWRU Dataset Visualization Results. (a) t-SNE on the CWRU dataset. Different colors represent different classes. (b) Confusion matrix on the CWRU dataset.
Lubricants 14 00121 g010
Figure 11. HUST Dataset Visualization Results. (a) t-SNE on the HUST dataset. Different colors represent different classes. (b) Confusion matrix on the HUST dataset.
Lubricants 14 00121 g011
Figure 12. Fault diagnosis accuracy of different models under white Gaussian noises of different intensities.
Lubricants 14 00121 g012
Figure 13. Fault data features visualization. Different colors represent different classes.
Lubricants 14 00121 g013
Figure 14. Fault data features confusion matrix.
Lubricants 14 00121 g014
Figure 15. Results of ablation experiments. (a) ConvNeXt network Training Accuracy Curve; (b) ConvNeXt network Loss Function Curve; (c) RConvNeXt network Training Accuracy Curve; (d) RConvNeXt network Loss Function Curve; (e) RConvNeXt-ECGA network Training Accuracy Curve; (f) RConvNeXt-ECGA network Loss Function Curve.
Lubricants 14 00121 g015
Figure 16. Comparison experiment diagram of attention modules.
Lubricants 14 00121 g016
Figure 17. Comparative performance of different models under variable operating conditions.
Lubricants 14 00121 g017
Table 1. CWRU experimental dataset.
Bearing StatusFault Diameter (Inch)Data LengthNumber of SamplesLoad (hp)Rotational Speed (rpm)Classification Label
Normal state010245000~31730~17970
Slight inner ring fault0.00710245000~31730~17971
Moderate inner ring fault0.01410245000~31730~17972
Severe inner ring fault0.02110245000~31730~17973
Slight rolling element fault0.00710245000~31730~17974
Moderate rolling element fault0.01410245000~31730~17975
Severe rolling element fault0.02110245000~31730~17976
Slight outer ring fault0.00710245000~31730~17977
Moderate outer ring fault0.01410245000~31730~17978
Severe outer ring fault0.02110245000~31730~17979
Table 2. HUST experimental dataset.
Bearing StatusFault Diameter (mm)Data LengthSample SizeSampling Frequency (KHz)Operating Conditions (Hz)Classification Label
Normal0102430025.6200
Medium inner race fault0.15102430025.6201
Severe inner race fault0.3102430025.6202
Medium outer race fault0.15102430025.6203
Severe outer race fault0.3102430025.6204
Medium ball fault0.25102430025.6205
Severe ball fault0.5102430025.6206
Medium combination fault0.15102430025.6207
Severe combination fault0.3102430025.6208
Table 3. Model Parameters of the RConvNeXt-ECGA.
Serial NumberLayer TypeConvolutional Kernel SizeStrideOutput Size
0Input Layer//3 × 3 × 224 × 224
1Stem4 × 443 × 96 × 56 × 56
2RconvNeXt Block1 3 × 3 , 96 1 × 1 , 384 1 × 1 , 96 × 3 13 × 96 × 56 × 56
3Downsample2 × 223 × 192 × 28 × 28
4RconvNeXt Block2 3 × 3 , 192 1 × 1 , 768 1 × 1 , 192 × 3 13 × 192 × 28 × 28
5Downsample2 × 223 × 384 × 14 × 14
6RconvNeXt Block3 3 × 3 , 384 1 × 1 , 1536 1 × 1 , 384 × 9 13 × 384 × 14 × 14
7Downsample2 × 223 × 768 × 7 × 7
8RconvNeXt Block4 3 × 3 , 768 1 × 1 , 3072 1 × 1 , 768 × 3 13 × 768 × 7 × 7
9Global Avg Pooling//3 × 768
10Linear//3 × 10
Table 4. Results of ablation experiments.
Model NameAcc (%)LossRecallF1
ConvNeXt76.10.8990.6750.660
RConvNeXt85.70.3960.6740.692
RConvNeXt-ECGA97.60.0630.8310.825
Table 5. Three operating conditions based on the CWRU dataset.
Operating ConditionABC
Rotation speed177217501730
Load1 hp2 hp3 hp
Fault diameter (inch)0.007, 0.014, 0.0210.007, 0.014, 0.0210.007, 0.014, 0.021
Bearing statusNormal, Inner race
Outer race, Ball
Normal, Inner race
Outer race, Ball
Normal, Inner race
Outer race, Ball
Disclaimer/Publisher’s Note: The statements, opinions and data contained in all publications are solely those of the individual author(s) and contributor(s) and not of MDPI and/or the editor(s). MDPI and/or the editor(s) disclaim responsibility for any injury to people or property resulting from any ideas, methods, instructions or products referred to in the content.