Article

Effects of Lubricant Oil Properties on Efficiency and Gear Friction Loss in an Electric Transaxle

Lubricant Research Laboratory, Idemitsu Kosan Co., Ltd., 24-4 Anesakikaigan, Ichihara-shi 299-0107, Japan
*
Author to whom correspondence should be addressed.
Lubricants 2026, 14(10), 386; https://doi.org/10.3390/lubricants14100386
Submission received: 6 August 2026 / Revised: 28 September 2026 / Accepted: 6 October 2026 / Published: 9 October 2026

Abstract

Enhancing electric-transaxle (e-axle) efficiency is essential for extending the driving range of battery electric vehicles. This study investigated how base-oil properties and additive-controlled boundary friction affect e-axle efficiency and load-dependent gear friction loss. Four lubricants were evaluated using a production oil-cooled e-axle, and their gear-mesh friction characteristics were further investigated using a high-speed back-to back gear test rig. At a constant kinematic viscosity of 11.8 mm2/s at 40 °C, varying the base-oil type produced a 0.72-percentage-point difference in WLTC-weighted efficiency. The API Group IV-based lubricant exhibited higher thermal conductivity and a 60% lower traction coefficient than the Group I-based lubricant, consistent with improved motor cooling and reduced fluid-film shear losses. Compared with the Group II-based lubricant, it reduced gear friction loss by an average of 15% over the investigated speed range. Reducing the block-on-ring friction coefficient from 0.093 to 0.022 increased WLTC-weighted efficiency by approximately 0.07 percentage points; however, this difference was comparable to the observed repeat-to-repeat variation. Nevertheless, the low-friction formulation improved e-axle efficiency under low-speed, high-torque conditions and substantially reduced gear friction loss at pitch-line velocities below 5 m/s. Gear friction loss decreased rapidly up to approximately 10 m/s and then approached a plateau. The increasing difference between the additive formulations at λ ≤ 1 indicated a growing contribution of boundary lubrication. These results demonstrate that jointly optimizing thermal conductivity, fluid-film traction, and additive-derived boundary friction is essential for maximizing e-axle efficiency across practical operating conditions.

1. Introduction

The rapid adoption of hybrid electric vehicles (HEVs), plug-in hybrid electric vehicles (PHEVs), and battery electric vehicles (BEVs) has increased the need to reduce drivetrain energy losses and extend electric driving range [1,2,3]. An electric transaxle (e-axle), which integrates the motor, inverter, and reduction gearbox, provides a compact and highly efficient drivetrain architecture. Further improvements in e-axle efficiency, however, require the lubricant to fulfill several functions simultaneously, including the lubrication of gears and bearings, motor cooling, electrical insulation, and compatibility with system materials.
This multifunctionality is particularly important in compact, high-speed, oil-cooled e-axles. During urban driving, which involves frequent acceleration and deceleration, copper loss can account for approximately half of the motor power loss and is strongly influenced by coil temperature [4]. Direct oil cooling removes heat from the motor while the same fluid lubricates the reduction gears, thereby simplifying thermal management compared with indirect water-jacket cooling. Consequently, automatic transmission fluids (ATFs) have been used in some e-axles [5], although their formulations were originally developed for hydraulic control, clutch friction regulation, and conventional transmission lubrication rather than for the combined thermal, electrical, and tribological requirements of electric drivetrains.
Lubricant properties also influence heat transfer in electric-drive systems. Viscosity, thermal conductivity, specific heat capacity, and density govern heat transport from motors and other components to the circulating fluid. Previous studies have examined the base-fluid properties required for the oil-based cooling of EV motors and batteries [6,7,8,9]. Although these studies have established the importance of lubricant thermal properties, they have not directly quantified how these properties affect the cycle-averaged efficiency of a complete production e-axle.
Lubricant development for e-axles has therefore focused on reducing viscosity to lower churning and drag losses while maintaining cooling performance, durability, electrical insulation, and copper compatibility [10,11,12]. However, viscosity alone does not determine transmission loss. Under rolling–sliding contact, the molecular structure of the base oil governs fluid-film traction and thermal transport, whereas surface-active additives control friction as the oil film becomes thinner. The relative contributions of these mechanisms may vary across the broad speed–load range of an e-axle.
Previous investigations have quantified several lubricant-dependent loss mechanisms. Oil-churning losses in spur gear pairs have been correlated with oil level, rotational speed, face width, and lubricant viscosity, while fluid-dynamic and computational fluid dynamics (CFD) models have reproduced churning and oil-squeezing losses [13,14,15]. Although these studies have provided valuable insights into lubricant-related transmission losses, most have focused on bulk viscosity, total gearbox loss, or model-based optimization. Consequently, the respective contributions of base-oil-dependent fluid-film friction and additive-controlled boundary friction remain insufficiently quantified, particularly over the broad speed–load range encountered in practical e-axle operation. Moreover, few studies have systematically isolated these effects at matched viscosity and directly related them to the cycle-averaged efficiency of a production oil-cooled e-axle.
To address these research gaps, the present study establishes a systematic link between lubricant characteristics and e-axle efficiency across system, component, and interface scales. The test oils were formulated to separately examine two lubricant-design factors: (i) base-oil type, which was varied while maintaining the same kinematic viscosity and additive chemistry, and (ii) additive-controlled metal-to-metal friction, which was varied while maintaining the same base-oil system. At the system level, lubricant effects on efficiency were evaluated using a production oil-cooled e-axle at 34 operating points with WLTC-based weighting. At the component level, the observed efficiency differences were related to gear-mesh friction losses using a newly constructed high-speed back-to-back gear test rig capable of pitch-line velocities of up to 40 m/s. Finally, at the interface level, the underlying friction mechanisms were investigated by relating gear friction behavior to base-oil traction characteristics and additive-derived boundary films using MTM, block-on-ring, and EPMA analyses. This integrated system–component–interface framework provides a basis for understanding how lubricant formulation influences the efficiency of practical e-axle systems.

2. Experimental Methods

2.1. Test E-Axle and Experimental Setup

A production oil-cooled electric transaxle (e-axle) was used to investigate how lubricant oil properties affect overall e-axle efficiency. The specifications of the test unit are summarized in Table 1. The e-axle consisted of a permanent magnet synchronous motor (PMSM) integrated with a three-shaft reduction gearbox. The motor had a maximum power output of 150 kW, a maximum torque of 300 Nm, and a maximum rotational speed of 15,000 rpm.
Motor cooling was achieved through direct oil cooling: a lubricant was supplied by an electric oil pump and sprayed onto the upper part of the motor through a dedicated cooling pipe. To ensure consistent thermal conditions between tests, motor cooling was initiated only after the motor temperature reached a predetermined value. This procedure enabled evaluation of lubricant effects under identical initial thermal conditions.
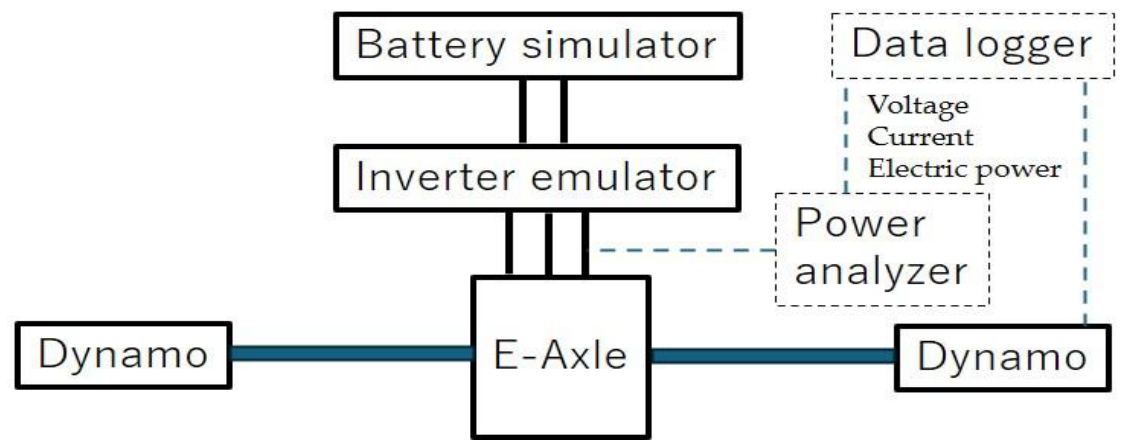
An e-axle dynamometer test bench was constructed to evaluate efficiency. The layout of the test bench is illustrated in Figure 1. Electrical input power and mechanical output power were continuously monitored during testing. Overall e-axle efficiency was calculated according to the following:
η = P o u t P i n   × 100
where η is the overall e-axle efficiency (%), Pin is the electrical input power (W), and Pout is the mechanical output power (W). Mechanical output power was calculated from the measured output torque and rotational speed at the dynamometers.

2.2. Transmission Efficiency Evaluation

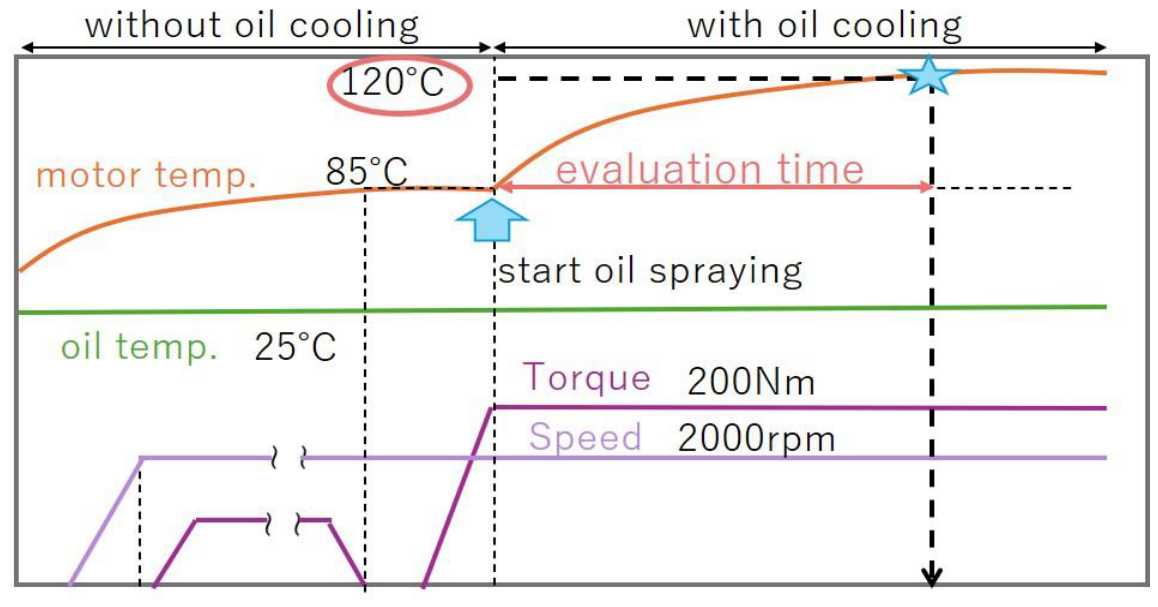
Efficiency measurements were conducted under the operating conditions listed in Table 2. Figure 2 shows the procedure for the e-axle efficiency test. The star symbol represents the maximum motor oil temperature in the test e-axle. Before each test, the e-axle was warmed up at a motor torque of 100 Nm and a motor speed of 2000 rpm until the motor temperature reached 85 °C. The motor torque and speed were then adjusted to the target operating point using the battery simulator and inverter emulator. The oil-cooling pump was activated when the motor temperature reached 85 °C, after which the steady-state efficiency was measured. Measurements were obtained at 34 operating points, ranging from high-torque, low-speed to low-torque, high-speed conditions. Lubricant temperatures of 40 and 60 °C were used to evaluate the effect of oil temperature on system efficiency.
The e-axle efficiency was calculated as η = ToutNout/Pin, where Tout and Nout are the output torque and rotational speed measured at the dynamometers, respectively, and Pin is the electrical power supplied to the motor. The mechanical output power was calculated from the measured torque and rotational speed rather than measured independently. The specified measurement accuracy was ±0.5% of full scale for the electrical power measured by the inverter emulator (full scale: 250 kW), the dynamometer torque (full scale: 3463 Nm), and the dynamometer rotational speed (full scale: 3000 rpm).
All lubricant formulations were evaluated using the same e-axle, instrumentation, measurement ranges, and test procedure. Each e-axle test was performed twice under identical conditions. For all lubricant formulations, the difference in WLTC-weighted efficiency between the duplicate measurements was within 0.05 percentage points. This experimentally observed repeat-to-repeat variation was considered when evaluating whether differences in relative efficiency among the lubricant formulations could be resolved reliably.
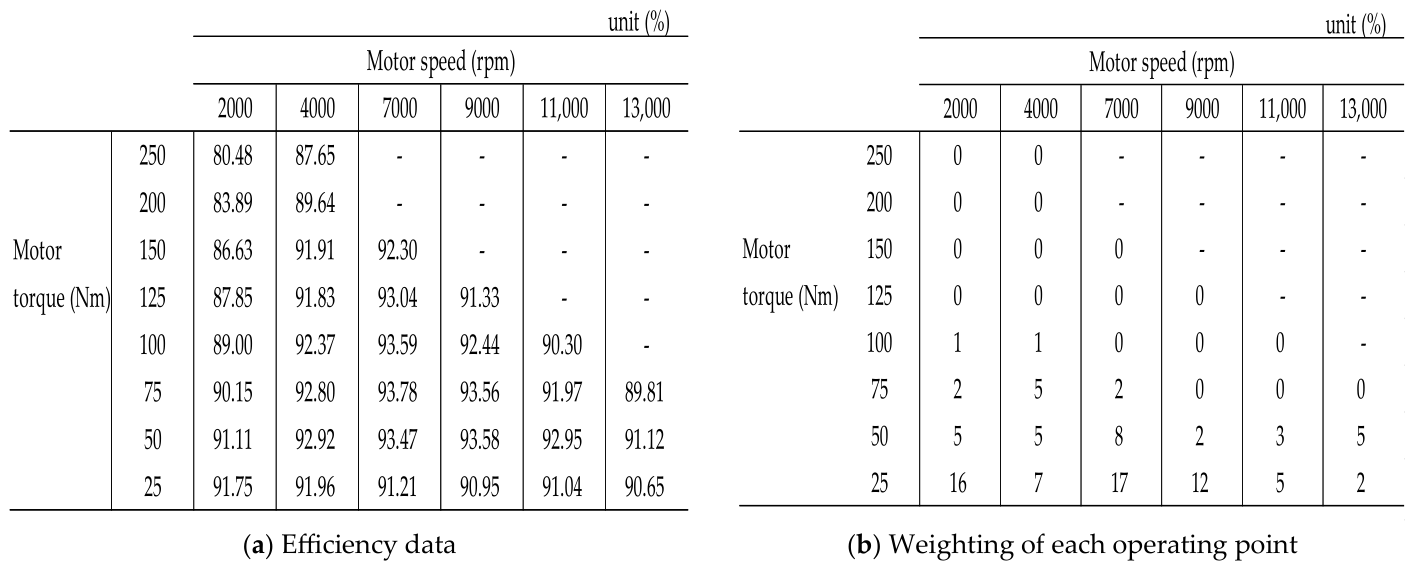
At each operating point, at least two measurements were obtained, and their mean was used for the analysis. The resulting data were used to construct efficiency maps for each lubricant and oil-temperature condition. Figure 3 presents a representative e-axle efficiency map. To facilitate comparison among the lubricants, a WLTC-weighted mean efficiency was calculated from these maps. The numerical values in Figure 3b are the weighting factors assigned to the corresponding operating points based on the Worldwide Harmonized Light Vehicles Test Cycle (WLTC). The weighted mean efficiency was determined by applying these factors to the efficiency measured at each operating point.

2.3. Gear Friction Loss Evaluation

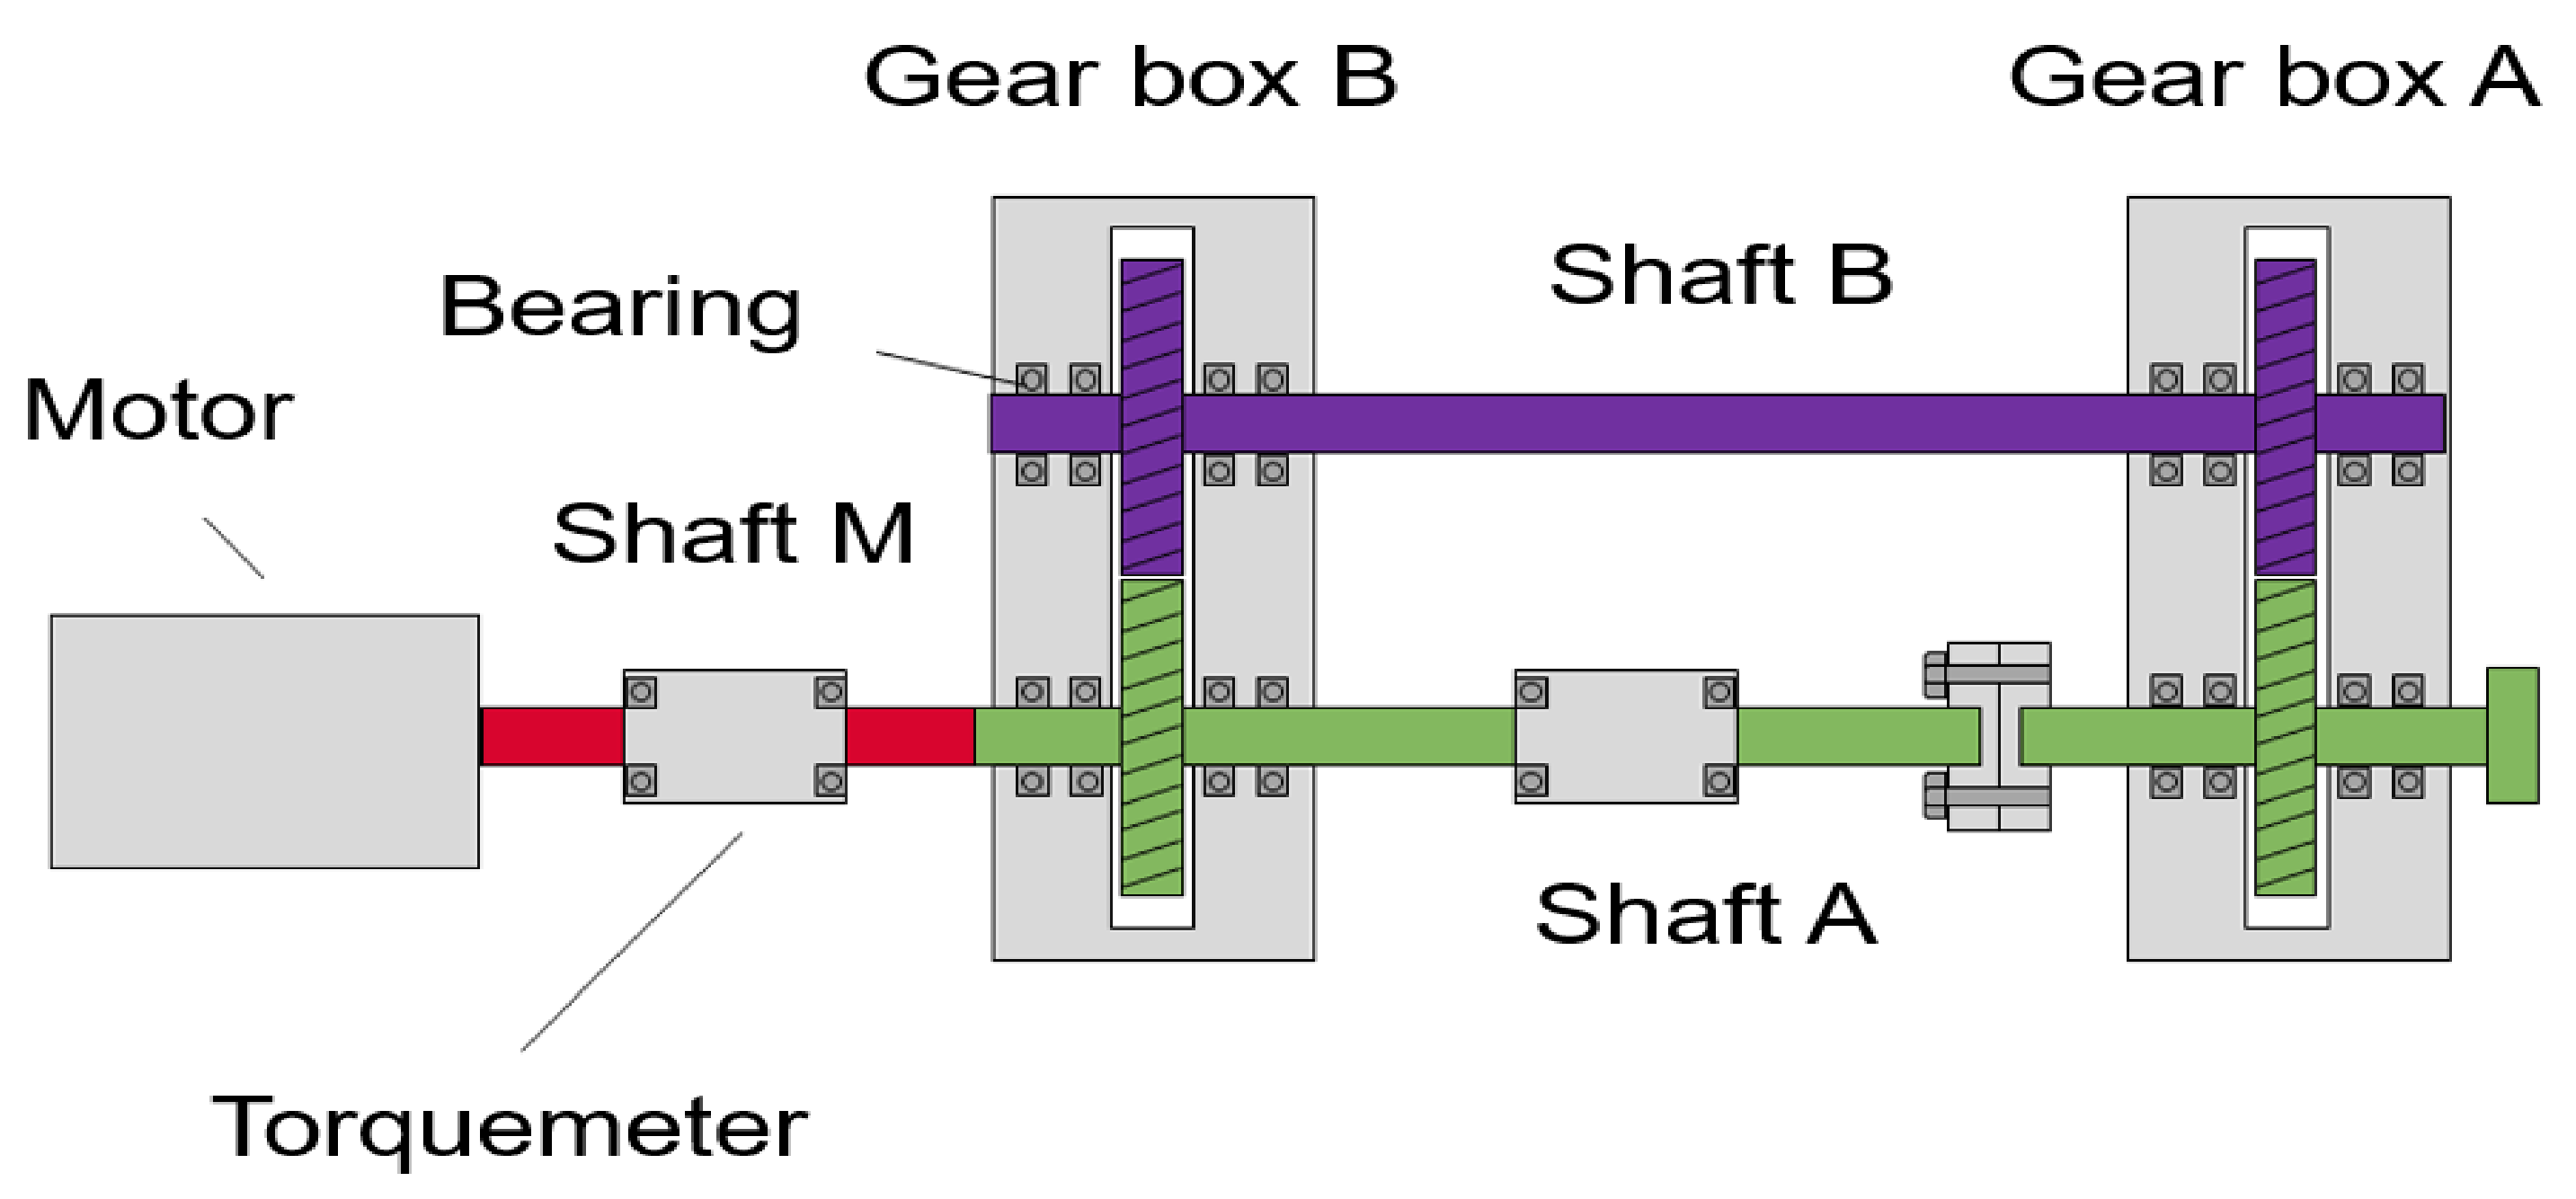
Gear lubricant performance governs durability-related failure modes, including wear, scuffing, micropitting, and pitting. Standardized back-to-back FZG (Forschungsstelle für Zahnräder und Getriebebau) gear tests are commonly used to assess lubricant performance under representative gear-contact conditions [16,17]. The FZG A10/16.6R test is conducted at a circumferential speed of 16.6 m/s at the pitch line under reverse rotation. For the e-axle used in this study, the pitch-line speed of the counter drive gear reached approximately 32 m/s at a maximum motor speed of 15,000 rpm. Therefore, accurately evaluating gear losses over the actual e-axle operating range requires measurements at substantially higher speeds. For this purpose, a high-speed back-to-back gear friction test rig capable of operating at pitch-line speeds up to 40 m/s was designed, as shown in Figure 4. The specifications of the test gears are listed in Table 3. The test gears were helical gears representative of automotive gear trains, although they were not identical to the gears used in e-axle production.
Torque losses were measured using the back-to-back gear test rig shown in Figure 4. After applying a prescribed torque to the gears in Gearbox A, the drive motor was operated at the target rotational speed, causing power to circulate through the closed-loop gearbox. The torque measured at shaft M included gear mesh losses, bearing losses, churning losses, and windage losses. The load-dependent gear torque loss, representing gear mesh friction loss, was defined as the difference between the M-axis torque measured under loaded and no-load conditions. The torque about the M-axis was measured with an accuracy of ±0.5% of full scale.
∆ T = T l o a d e d − T n o − l o a d
Here, ΔT is the load-dependent gear torque loss (Nm), Tloaded is the M-axis torque under load conditions, and Tno-load is the M-axis torque under no-load conditions.

2.4. Test Lubricant Oils

Tokozakura et al. [11,12] developed a new transaxle fluid that ensures durability while reducing the kinematic viscosity at 40 °C to 12.2 mm2/s. This low-viscosity fluid improved the fuel efficiency of hybrid electric vehicles (HEVs) by 1.0% or more compared with a conventional ATF under test-cycle driving conditions. It was also proven effective at improving motor cooling performance.
This study focused on two lubricant design factors: base-oil properties and additive-derived metal-to-metal friction characteristics. The properties of the test oils are shown in Table 4. The check mark indicates that the corresponding component is included in the formulation. To determine the influence of various base-oil types on e-axle performance in isolation, Samples A, B, and C were formulated with different base oils while maintaining the same kinematic viscosity of 11.8 mm2/s at 40 °C and the same additive chemistry. This lubricant formulation minimized contributions of additive effects and allowed the influence of lubricant physical properties to be examined. In addition, thermal conductivity was varied systematically by modifying the base-oil composition. Thermal conductivity of the test oils was measured according to ASTM D7896-14 [18] using the transient hot-wire liquid thermal conductivity meter (LAMBDA; Flucon Fluid Control GmbH, Barleben, Germany). Sample C, formulated with an API Group IV base oil, exhibited the highest thermal conductivity, whereas Sample A, formulated with an API Group I base oil, exhibited the lowest. Furthermore, the effect of additive chemistry on efficiency was examined using Samples B and D, which were designed to provide different metal-to-metal friction characteristics. All test oils contain a calcium-based detergent, extreme-pressure (EP) agents, and dispersants. Samples B and D differ in the type of EP agent used. Since EP agents can significantly affect the frictional characteristics of metal-to-metal contacts, the difference in EP agent type is considered to be one possible factor contributing to the observed difference in frictional behavior between Samples B and D.

3. Experimental Results

3.1. E-Axle Efficiency Test

3.1.1. Effect of Base-Oil Property on E-Axle Efficiency

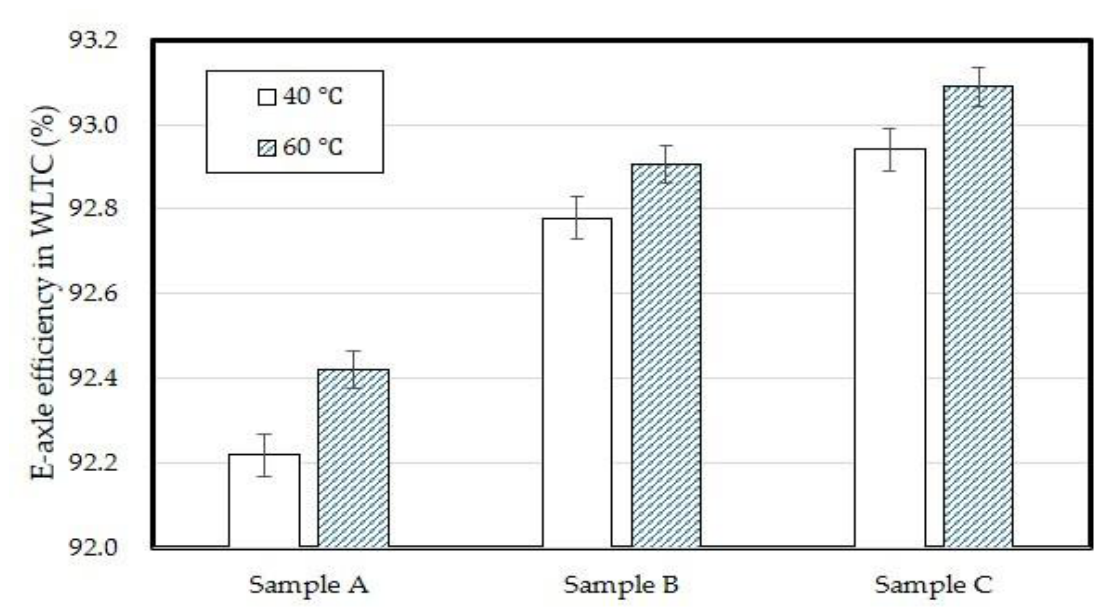
Figure 5 shows the effect of base-oil composition on e-axle efficiency, evaluated using Samples A, B, and C, which had comparable kinematic viscosities but different thermal conductivities. Measurements were performed twice for each sample. The deviation of the maximum and minimum values from the mean was within ±0.05%. Although the duplicate WLTC-weighted efficiency measurements showed good repeatability, differing by no more than 0.05 percentage points, the number of replicates was insufficient to establish robust 95% confidence intervals or conduct meaningful tests of statistical significance. Accordingly, the small differences reported here should be regarded as comparative experimental observations rather than statistically established effects.
As shown in Figure 5, WLTC efficiencies at an oil temperature of 40 °C were 92.22%, 92.78%, and 92.94% for Samples A, B, and C, respectively, corresponding to a maximum difference of 0.72%. A comparable trend was observed at 60 °C. Sample C exhibited higher thermal conductivity; its higher e-axle efficiency cannot be attributed to thermal conductivity alone. Differences in density, temperature-dependent viscosity, and traction characteristics may also affect heat transfer, fluid-film shear, and drag/churning losses. Therefore, the observed efficiency improvement is considered to result from the combined influence of these base-oil properties. The present dataset does not allow the individual contribution of each property to be quantitatively separated.
Efficient heat removal suppresses local temperature build-up and helps maintain operating conditions that reduce temperature-dependent losses, including motor copper loss. These findings indicate that thermal conductivity, alongside viscosity and tribological performance, should be treated as a key design parameter for next-generation e-fluids. Tormos et al. [19] presented thermal conductivity data for some base oils measured using the transient hot-wire technique and reported that API Group IV polyalphaolefin (PAO) showed approximately 5% higher thermal conductivity than an API Group III mineral base oil. Nakahara et al. [8,9] suggested that base-oil-dependent differences in thermal conductivity arise from molecular structure. Hydrocracked base oils contain more normal-chain saturated hydrocarbons than naphthenic base oils. Thermal vibrational energy can travel along the main molecular chain and reach the chain end through intermolecular heat transfer, thereby increasing thermal conductivity.
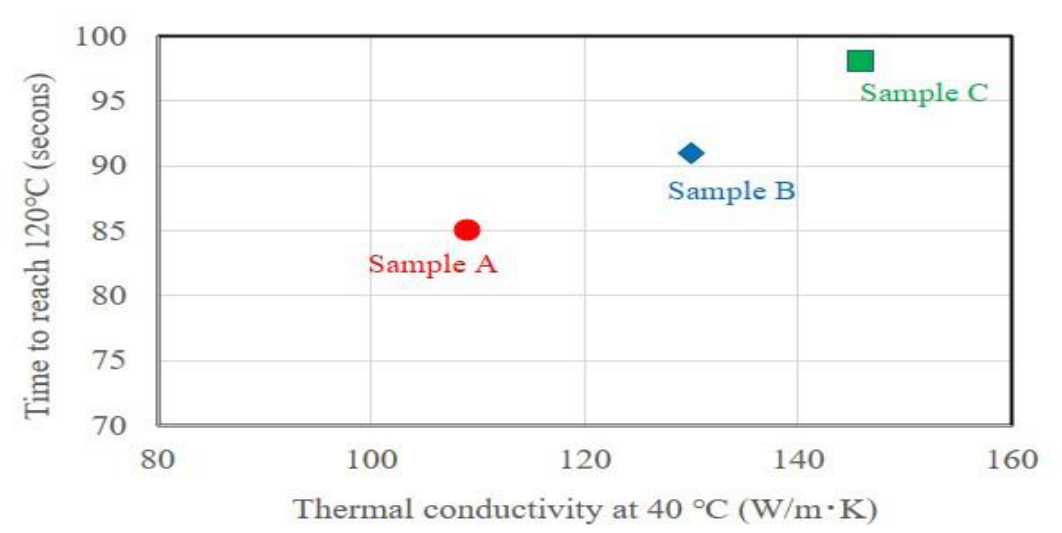
Figure 6 compares the motor-cooling performance of Samples A, B, and C. Oil at 25 °C was supplied to the motor, which was operated at a constant speed of 2000 rpm and a constant torque of 200 Nm. The motor-coil temperature was monitored, and the time required to reach 120 °C was compared among the samples. The times to reach 120 °C were 85 s. for Sample A, 91 s. for Sample B, and 98 s. for Sample C. Thus, Sample C, which had the highest thermal conductivity, delayed the temperature rise by 13 s compared with Sample A, which had the lowest thermal conductivity. These results indicate that higher lubricant thermal conductivity tended to improve motor-cooling performance under the present test conditions.
The efficiency differences among Samples A, B, and C cannot be attributed solely to thermal conductivity because their kinematic viscosities were not identical. Although the variation in kinematic viscosity was relatively small compared with that in thermal conductivity, viscosity may still have affected efficiency through churning and friction losses. Accordingly, the observed differences should be interpreted as arising from the combined effects of the base-oil properties rather than from thermal conductivity alone.
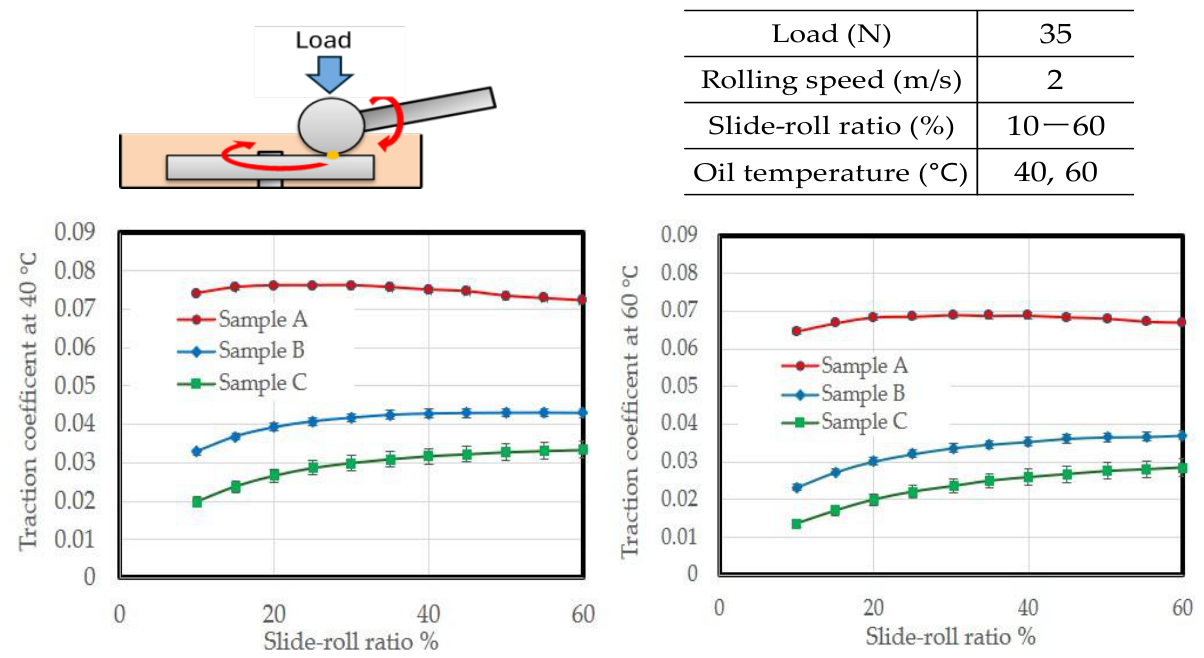
Gear and bearing losses are another source of efficiency variation associated with base-oil type. To evaluate rolling–sliding friction under elastohydrodynamic lubrication, traction coefficients were measured using a mini traction machine (MTM; PCS Instruments, London, UK), as shown in Figure 7. Because the slide-to-roll ratio (SRR) varies continuously during gear meshing, the traction coefficient was evaluated over a broad SRR range of 10–60% rather than at a single SRR of 55%. Each sample was measured in triplicate, and the relative standard deviation did not exceed 8%. The traction coefficients differed markedly among the test oils: Sample C, formulated with a Group IV base oil, exhibited a traction coefficient 60% lower than that of Sample A, formulated with a Group I base oil. Guo et al. [20] reported that PAO exhibited the lowest traction coefficient among the base oils evaluated using an MTM. The improved e-axle efficiency obtained with Sample C is therefore consistent with its lower traction coefficient.
As shown in Figure 5 and Figure 7, an approximately 60% lower traction coefficient was associated with a 0.72-percentage-point increase in WLTC-weighted e-axle efficiency. Although this association is based on an approximate experimental comparison and other loss mechanisms may also have contributed, the results indicate that lower fluid-film traction was an important factor in the observed efficiency improvement.

3.1.2. Effect of Additive Formulation on E-Axle Efficiency

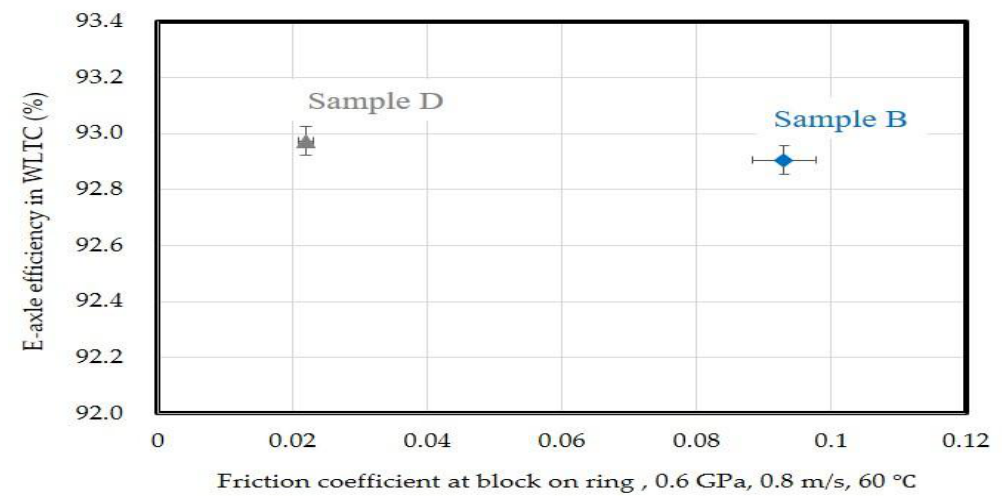
The effect of additive formulation on e-axle efficiency was evaluated using Samples B and D, which were prepared with the same base oils but different additive systems. Their metal-to-metal friction coefficients were measured using a block-on-ring tribometer (LFW-1; Falex Corporation, Sugar Grove, IL, USA) at a contact pressure of 0.6 GPa, a sliding speed of 0.8 m/s, and an oil temperature of 60 °C. Friction coefficient measurements were performed in triplicate for each sample, with relative standard deviations of no more than 5%. The boundary-friction coefficients of Samples B and D were 0.093 and 0.022, respectively. Figure 8 shows the relationship between WLTC-weighted e-axle efficiency and the metal-to-metal friction coefficient. Despite the substantial difference in boundary-friction coefficient, the difference in cycle-averaged WLTC efficiency was only approximately 0.07 percentage points. Given the limited number of replicate e-axle measurements (n = 2), this small difference should be interpreted with caution. Its magnitude was comparable to the maximum repeat-to-repeat variation of 0.05 percentage points; therefore, the present measurements do not establish a measurable effect of additive formulation on cycle-averaged efficiency. By contrast, the approximately 0.72-percentage-point difference among the base oils was more than an order of magnitude greater than the maximum repeat-to-repeat variation, indicating a substantially larger influence of base-oil selection under the present test conditions. Nevertheless, because only two replicate measurements were performed, no claim of statistical significance is made for either comparison.
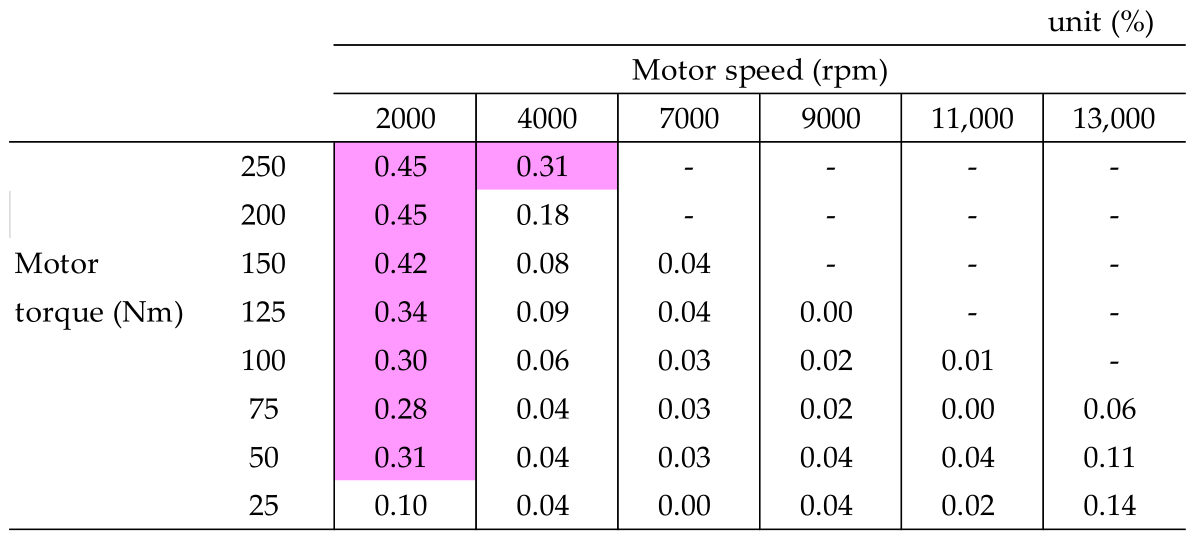
The difference in efficiency was then examined at each operating point. The values in Figure 9 are calculated by subtracting the efficiency of Sample B from that of Sample D. At a motor speed of 2000 rpm and torque of 100 Nm or higher, Sample D showed an efficiency improvement of at least 0.3%, as highlighted by pink color. In contrast, at motor speeds of 4000–11,000 rpm and torques of 100 Nm or lower, the efficiency difference was less than 0.1%. The improvement under low-speed/high-torque conditions is attributed to a thinner oil film at sliding contacts, which increases the relative contribution of boundary lubrication and promotes tribofilm-mediated friction reduction in Sample D. An efficiency difference was also observed at a motor speed of 13,000 rpm, suggesting that heat generation at high sliding speeds may activate additive-derived surface reactions.
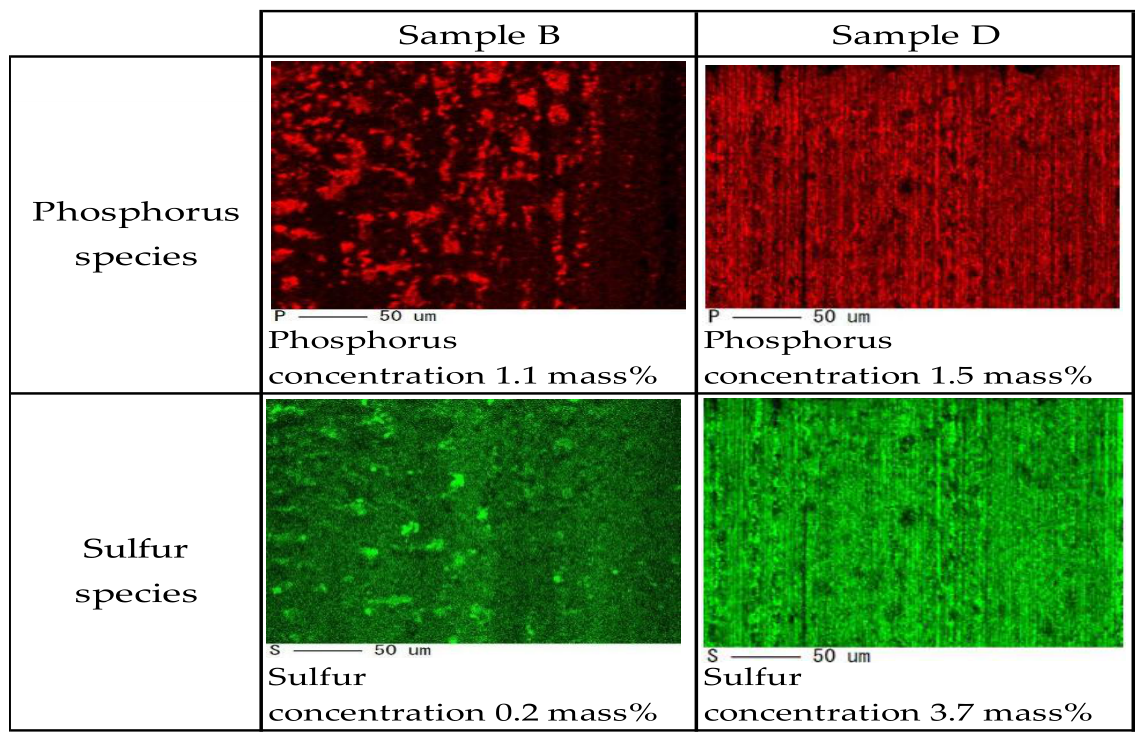
Figure 10 presents elemental maps of the block surfaces after testing with Samples B and D, obtained using electron probe microanalysis (EPMA; JOEL Ltd., Tokyo, Japan). EPMA determines the elemental composition and two-dimensional elemental distribution at the micrometer scale by detecting characteristic X-rays emitted when the specimen surface is irradiated with an electron beam. The elemental maps revealed additive-derived tribofilms on both tested surfaces. Semi-quantitative analysis showed that the surface tested with Sample B contained 1.1 mass% phosphorus and 0.2 mass% sulfur, whereas that tested with Sample D contained 1.5 mass% phosphorus and 3.7 mass% sulfur. Thus, the sulfur content of the tribofilm formed by Sample D was substantially higher. This compositional difference is consistent with the use of different extreme-pressure (EP) agents in Samples B and D. The results suggest that the EP agents produced tribofilms with different compositions and properties, which may have contributed to the observed difference in friction coefficient.

3.2. Gear Friction Test

3.2.1. Breakdown of Total Losses in the Back-to-Back Gear Test Rig

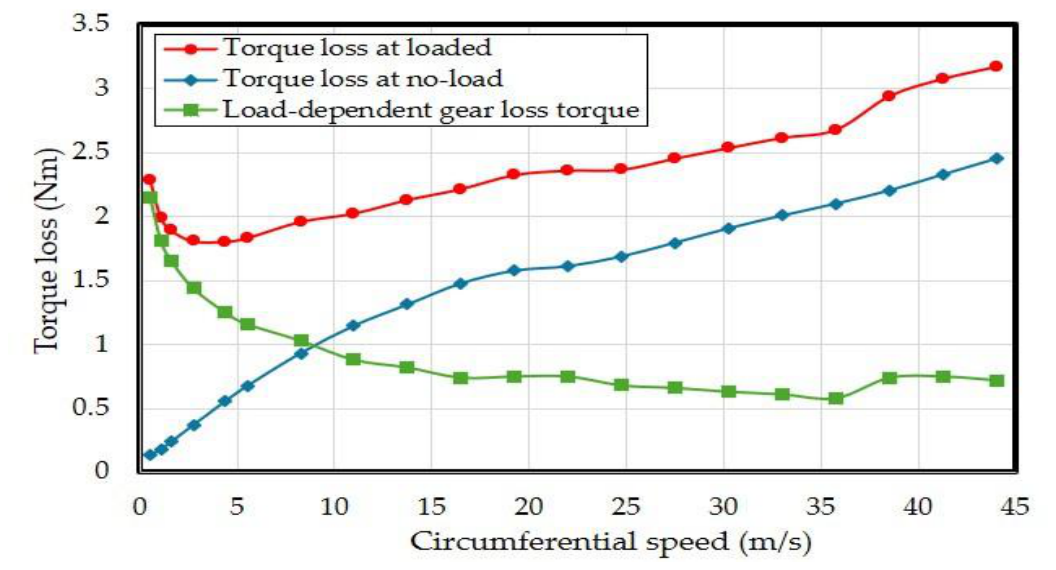
The torque loss measured using the back-to-back gear test rig comprises several components that cannot be completely separated. In this rig, lubricant is supplied directly to the gear-meshing zone and removed by a pump. Because the oil level is maintained below the gears, churning loss is considered negligible. Under no-load conditions, the measured torque loss therefore comprises bearing friction, lubricant acceleration, and windage losses. The load-dependent torque loss, which was used to estimate gear-mesh friction loss, was calculated using Equation (2). Figure 11 shows the breakdown of torque loss in the back-to-back gearbox at an applied torque of 100 Nm and an oil temperature of 40 °C. Under loaded conditions, the measured torque loss represents the total gearbox loss; it decreased with increasing speed up to 4.4 m/s and increased thereafter. Under no-load conditions, torque loss increased monotonically with speed. At speeds below 4.4 m/s, load-dependent gear loss accounted for most of the total loss. The load-dependent gear torque loss decreased sharply up to approximately 10 m/s, decreased more gradually thereafter, and approached a nearly constant value above 15 m/s. This speed dependence indicates a transition in the gear contact from boundary lubrication to mixed and elastohydrodynamic lubrication. Hongu et al. [21] investigated the relationship between gear rotational speed and the contributions of individual loss components using a gearbox capable of operating at up to 10,000 rpm. They reported that windage loss increased markedly at rotational speeds above 8000 rpm.

3.2.2. Effect of Base-Oil Property on Gear Friction Loss

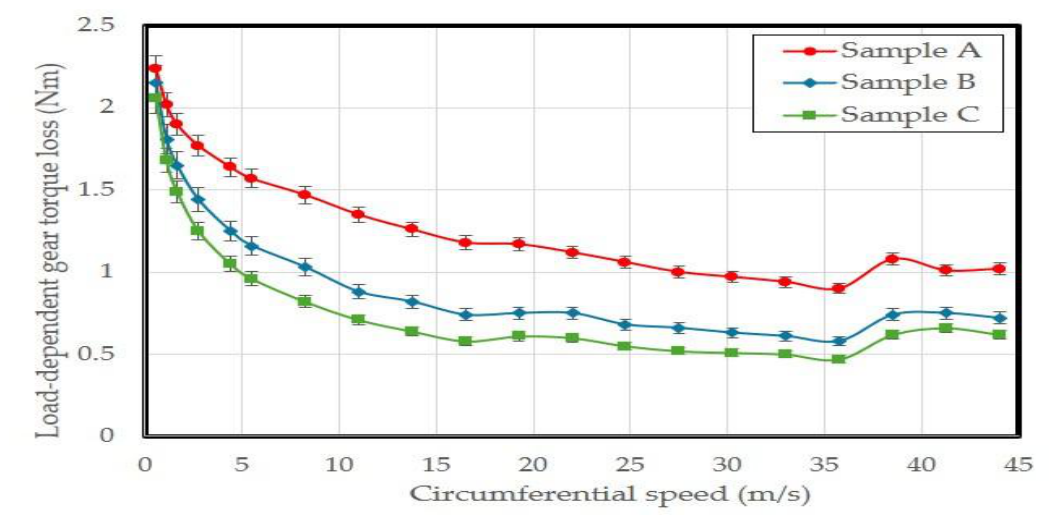
Figure 12 shows the gear friction losses of Samples A, B, and C at an applied torque of 100 Nm and an oil temperature of 40 °C. Torque measurements were performed in triplicate for each sample, with relative standard deviations of no more than 4%. Error bars are included in the figure but are not clearly visible at some data points because of the small standard deviations, indicating good measurement repeatability. Given the limited number of replicate measurements (n = 3), no formal statistical significance tests were performed; therefore, small differences in gear friction loss among the lubricants should be interpreted with caution. For all samples, gear friction loss decreased rapidly up to 10 m/s and then changed only slightly with further increases in speed.
Compared with Sample B, formulated with a Group II base oil, Sample C, formulated with a Group IV base oil, reduced gear friction loss by an average of 15% over the investigated speed range. In contrast, Sample A, formulated with a Group I base oil, showed 35% higher gear friction loss than Sample B. These differences are attributed primarily to base-oil-dependent oil-film shearing resistance at the gear sliding surfaces. In the e-axle efficiency test, Sample A decreased efficiency by 0.57%, whereas Sample C increased efficiency by 0.16% relative to Sample B. Thus, the gear friction loss measurements were consistent with the system-level efficiency results.

3.2.3. Effect of Additive Formulation on Gear Friction Loss

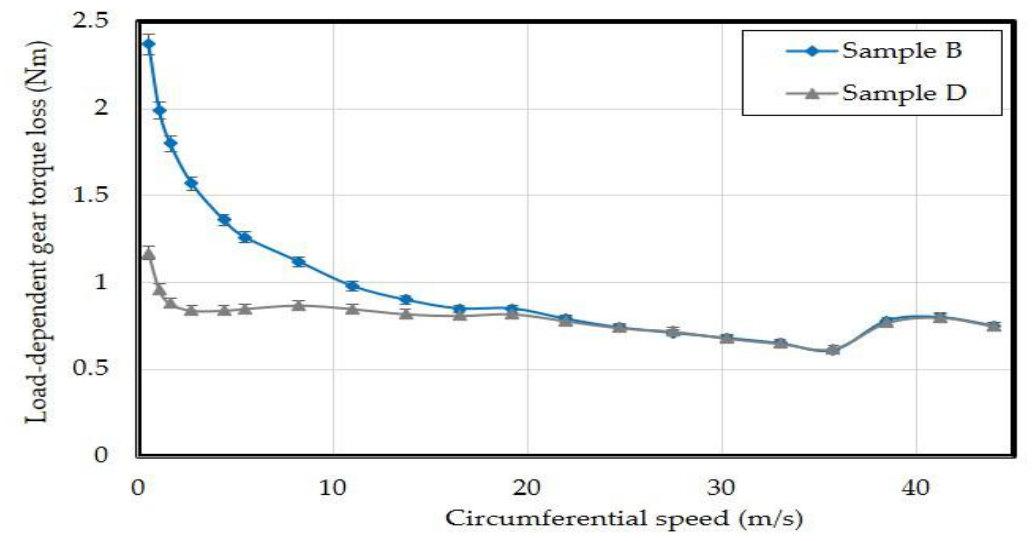
Figure 13 shows the gear friction losses of Samples B and D at a loaded torque of 100 Nm and an oil temperature of 60 °C. Torque measurements were performed three times for each sample, and the relative standard deviation was no greater than 3%.
The metal-to-metal friction coefficients measured using the block-on-ring test were 0.093 and 0.022 for Samples B and D, respectively. Sample D, with the lower boundary-friction coefficient, markedly reduced gear friction loss at pitch-line velocities below 5 m/s. At velocities above 20 m/s, Sample B and D losses were nearly identical. This result indicates that the contribution of additive-controlled boundary friction decreases as the lubrication regime shifts from boundary lubrication to mixed/elastohydrodynamic lubrication.
Matsumoto [22,23] proposed an equation for estimating the friction coefficient of gears and rollers operating under mixed-lubrication conditions. In this approach, the total friction coefficient at a rolling–sliding contact is determined by partitioning the load between the fluid-film and boundary-lubrication components, provided that the friction coefficient associated with each lubrication regime is known.

4. Discussion

The results indicate that e-axle efficiency is based on the combined effects of lubricant thermal properties, oil-film shearing resistance, and additive-controlled boundary friction. The base-oil comparison demonstrated that, even at an identical kinematic viscosity, differences in thermal conductivity and traction behavior produced measurable changes in WLTC efficiency. This finding suggests that lubricant design for electric drivetrains should not be based solely on viscosity reduction. Instead, the molecular structure of the base oil must be selected to provide both efficient heat transfer and low shear resistance under rolling–sliding contacts in gears and bearings.
The gear friction measurements support this interpretation. The marked reduction in gear torque loss for the Group IV-based lubricant is consistent with its lower traction coefficient, indicating that fluid-film shear loss remains an important contributor to e-axle efficiency over a wide speed range. In contrast, the influence of additive formulation became apparent mainly under low-speed and high-torque conditions, where the lubricant film becomes thinner and the asperity contact ratio increases. Under such conditions, boundary films formed by friction modifiers or surface-active additives can reduce metal-to-metal friction and thereby decrease gear mesh loss.
This speed- and load-dependent behavior explains why the low-friction additive formulation produced only a small difference in cycle-averaged WLTC efficiency, despite the large difference in the metal-to-metal friction coefficient measured using the block-on-ring test. The WLTC condition includes many operating points in which the gear contacts are expected to operate predominantly in mixed or elastohydrodynamic lubrication regimes. Therefore, the benefit of boundary-friction reduction is diluted in the cycle-averaged value. However, it becomes significant at specific operating points associated with start-up, acceleration, hill climbing, and other high-load conditions.
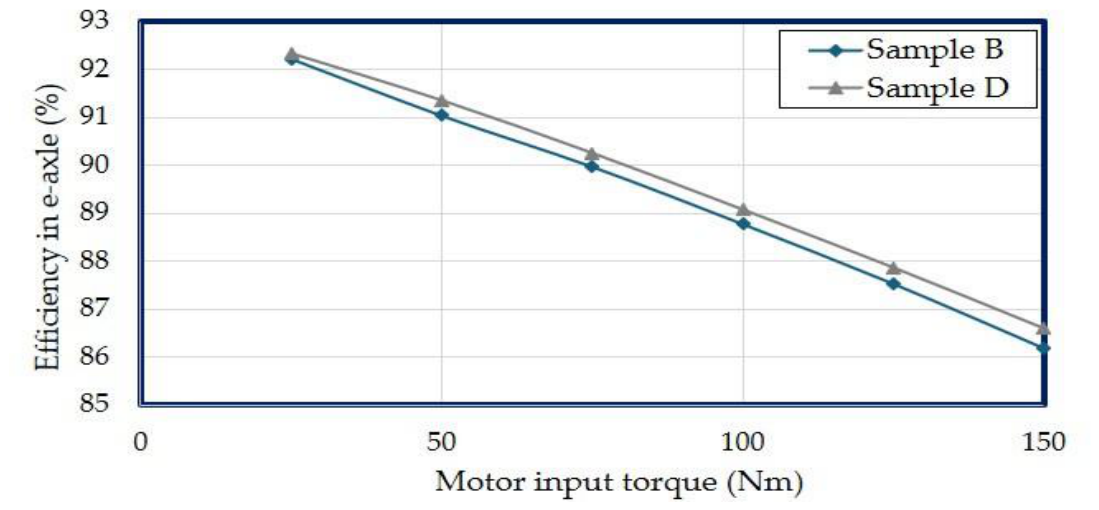
Overall, the metal-to-metal friction coefficient strongly influenced both e-axle efficiency and gear loss under low-speed operating conditions. Figure 14 shows the relationship between e-axle efficiency and motor input torque at a motor circumferential speed of 5 m/s. Each sample was tested twice, and the maximum and minimum values deviated from the mean by no more than ±0.05 percentage points. E-axle efficiency decreased with increasing motor input torque; however, Sample D consistently exhibited higher efficiency than Sample B.
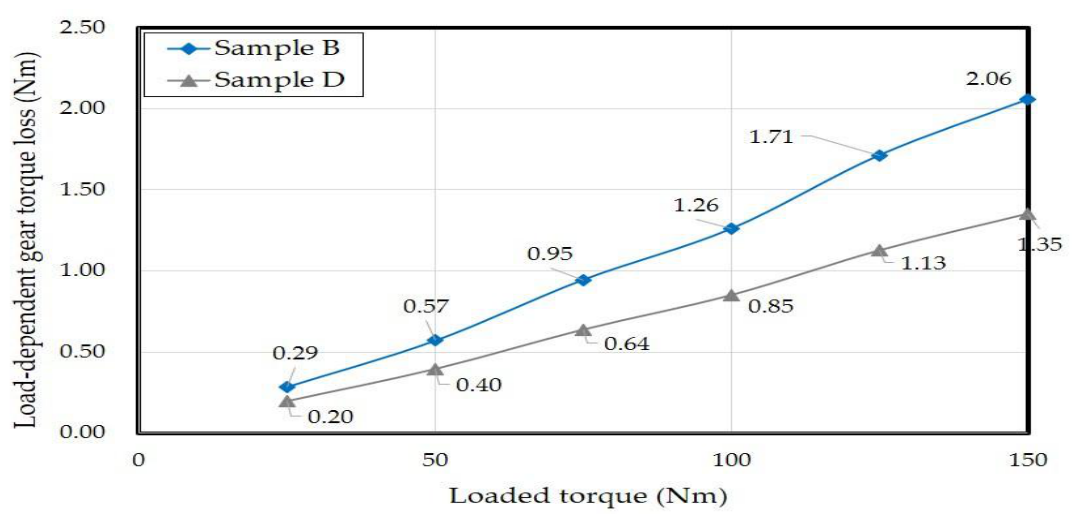
Figure 15 shows the relationship between load-dependent gear torque loss and applied torque in the back-to-back gear test rig at a gear circumferential speed of 5.5 m/s. Torque measurements were performed in triplicate for each sample, with relative standard deviations of no more than 3%. Load-dependent gear torque loss increased with applied torque; however, Sample D consistently exhibited lower losses than Sample B. The consistent trends observed in the e-axle and back-to-back gear tests indicate that the reduction in system-level loss was partly attributable to lower gear-mesh friction loss.
Figure 13 shows that the load-dependent gear torque loss is strongly influenced by rotational speed. To further investigate this behavior in relation to the lubrication regime, the gear torque loss was analyzed in terms of the film parameter, λ. The λ ratio is defined by Equation (3):
λ = h m i n ( R a 1 + R a 2 ) / 2
where hmin is the minimum oil-thickness between the contacting gear tooth surfaces. Ra1 and Ra2 were both set to 0.16 µm, based on the measured average surface roughness of the pinion and wheel, respectively, after the break-in period. The surface roughness of 0.3 μm corresponds to the value before the break-in period. For the EHL calculations, a surface roughness of 0.16 μm measured after the break-in period was used, as it more accurately represents the actual surface condition during the tests.
Assuming point-contact elastohydrodynamic lubrication (EHL) at the gear tooth contact point, the minimum oil film thickness, hmin, was calculated using the minimum film thickness equation proposed by Chittenden and Dowson [24].
h m i n   R x = 3.68   ( η 0 u ¯ E R x ) 0.68   ( α E ) 0.49 ( W E R x 2 ) − 0.073 [ 1 − exp { − 0.67 ( R y / R x ) 2 3 } ]
Although the load and sliding velocity at the tooth surfaces varied throughout the meshing cycle, the present analysis focused on the contact conditions near the pitch point to estimate the representative oil-film thickness. The load corresponding to an input torque of 100 Nm was assumed to act at the pitch point. At the pitch point, the slide-to-roll ratio is zero, corresponding to pure rolling conditions.
Here, Rx is the effective radius of curvature in the entrainment direction set to 0.0105 m, while Ry is the effective radius of curvature perpendicular to the entrainment direction, set to 2.13 m; the dynamic viscosity at ambient pressure, η0, was set to 5.5 mPa·s for Samples B and D, and the pressure–viscosity coefficient, α, was set to 1.31 × 10⁻⁸ Pa−1. The elastic modulus, E, was set to 230 GPa, and the normal load, W, was set to 2047 N, which corresponds to a maximum Hertzian contact pressure of 1 GPa.
u ¯ = 0.073 × U
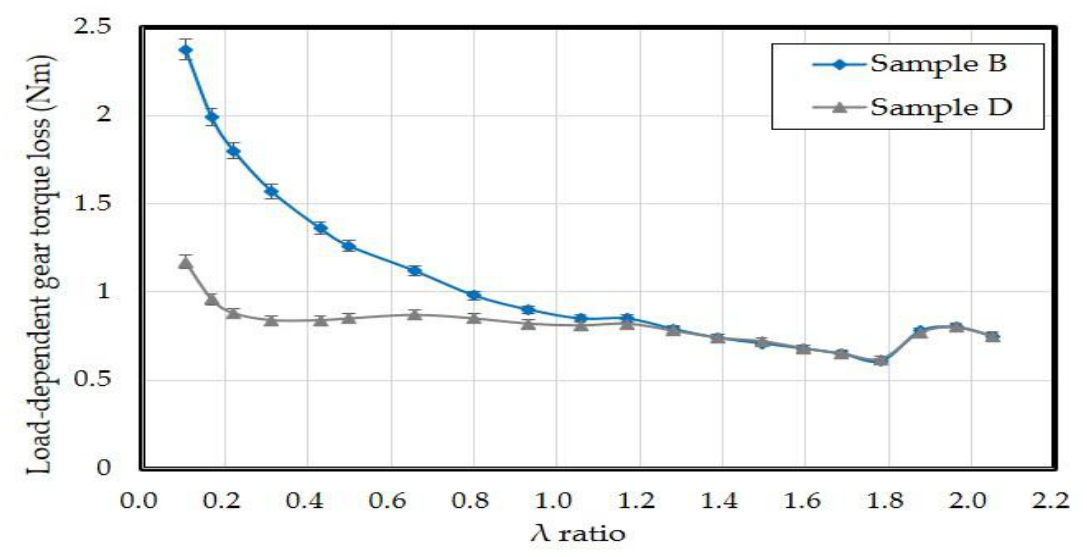
Here, u ¯ is the mean entrainment speed at the pitch point (m/s), and U is the circumferential speed (m/s). Over the circumferential-speed range investigated in this study, the minimum oil film thickness, hmin, was calculated to range from 0.017 to 0.33 µm. Figure 16 shows the relationship between the λ ratio and the load-dependent gear torque loss at an applied torque of 100 Nm and an oil temperature of 60 °C. The difference in gear torque loss between the oils becomes more pronounced as λ decreases below unity, indicating an increasing contribution of asperity contact. At a circumferential speed of approximately 15 m/s, λ was calculated to be approximately 1, indicating that the contact was in the mixed-lubrication regime. This result suggests that the lubrication regime progressively shifts from mixed lubrication toward boundary lubrication as the film thickness decreases.
From a lubricant formulation perspective, these results highlight the need to balance multiple, sometimes competing, requirements for e-drive fluids. Lower viscosity can reduce churning and drag losses, whereas low-traction base oils can suppress oil-film shearing loss under elastohydrodynamic lubrication. At the same time, lubricant additives must effectively reduce boundary friction. The present study therefore shows that simultaneous optimization of base-oil properties and additive-derived surface interactions is essential for maximizing e-axle efficiency under practical operating conditions.
Several limitations should be considered when interpreting these results. The back-to-back test rig employed gears that differed from those used in the production e-axle to ensure controlled and reproducible testing. Consequently, the component-level findings cannot be directly extrapolated to the efficiency, durability, or service life of production gears. In addition, the system-level tests did not independently resolve the individual sources of loss, and the film-thickness analysis represented conditions near the pitch point rather than those throughout the entire meshing cycle. The findings are therefore most applicable to contacts with comparable kinematics and lubrication regimes. Nevertheless, the controlled gear tests helped isolate the mechanisms underlying the observed formulation effects and provided a physically consistent explanation for the operating-point-dependent efficiency differences measured in the production e-axle. Future studies should validate these relationships using production gears under transient drive cycles and separately quantify the thermal, electrical, and mechanical loss components.
The present study focuses on experimentally linking lubricant properties to e-axle efficiency, gear-mesh friction, and tribological behavior, whereas lubricant-flow phenomena within the e-axle were not directly characterized. CFD–experiment approaches have demonstrated their potential for elucidating lubricant distribution and flow dynamics in geared systems. As e-axles operate at increasingly high rotational speeds, churning and other fluid-drag losses associated with lubricant agitation can become increasingly important, making their accurate prediction essential for further improving drivetrain efficiency. Seetharaman et al. demonstrated that oil churning losses in spur gear pairs depend strongly on oil level, rotational speed, and face width, and showed that their fluid-dynamics model could reproduce the experimentally measured losses [13,14]. More recently, Su et al. demonstrated that lubricants formulated with graphene oxide (GO) enhance wind turbine gearbox lubrication by improving oil film formation and self-healing behavior, using combined CFD and experimental approach [25].
In future work, combining the present experimental framework with CFD predictions of oil distribution, churning and splashing behavior, local lubrication conditions, and temperature fields could help distinguish the contributions of gear-mesh friction, fluid-drag losses, and thermal effects to overall e-axle efficiency.

5. Conclusions

This study clarified how base-oil properties and additive-controlled boundary friction affect electric-transaxle efficiency and load-dependent gear friction loss by combining experiments on a production oil-cooled e-axle with measurements using a high-speed back-to-back gear test rig. The principal conclusions are summarized below.
At a constant kinematic viscosity of 11.8 mm2/s at 40 °C, changing the base-oil type produced a 0.72-percentage-point difference in WLTC-weighted e-axle efficiency. The Group IV-based lubricant had higher thermal conductivity and a markedly lower traction coefficient, which were consistent with improved motor cooling and reduced fluid-film shear losses in gears and bearings. Relative to the Group II-based lubricant, it also reduced gear friction loss by an average of 15% over the investigated speed range.
The influence of additive-controlled boundary friction depended strongly on the lubrication regime. Reducing the block-on-ring friction coefficient from 0.093 to 0.022 increased the cycle-averaged WLTC efficiency by approximately 0.07 percentage points; however, this difference was comparable to the observed repeat-to-repeat variation of up to 0.05 percentage points. The present results therefore do not establish a measurable additive effect on cycle-averaged e-axle efficiency. Nevertheless, the low-friction formulation improved e-axle efficiency under low-speed, high-torque conditions and substantially reduced gear friction loss at pitch-line velocities below 5 m/s. Gear friction loss decreased rapidly with increasing speed up to approximately 10 m/s and then approached a plateau. Furthermore, the growing difference between the additive formulations at a film parameter of λ ≤ 1 indicated an increasing contribution of asperity contact as the gear contacts shifted toward mixed and boundary lubrication.
These findings demonstrate that viscosity reduction alone is insufficient to maximize e-axle efficiency. Instead, e-drive fluids should be designed by jointly optimizing thermal conductivity, fluid-film traction, and additive-derived boundary friction across the relevant speed and load ranges. Because the component-level tests used gears that differed from those in the production e-axle, quantitative extrapolation should be limited to systems with comparable contact kinematics and lubrication regimes.

Author Contributions

K.N. conceptualized the study, supervised the research, analyzed the data, and wrote the manuscript. T.Y. conducted the e-axle experiments. K.N., T.Y., D.T. and H.T. contributed to data processing, interpretation, testing, and discussion of the conclusions. All authors have read and agreed to the published version of the manuscript.

Funding

This research received no external funding.

Data Availability Statement

The original contributions presented in this study are included in the article. Further inquiries can be directed to the corresponding author.

Conflicts of Interest

Keiichi Narita, Takashi Yanagihara, Daisuke Takekawa and Hiroyuki Tatsumi are employees of Idemitsu Kosan Co., Ltd. The remaining authors declare that the research was conducted in the absence of any commercial or financial relationships that could be construed as a potential conflict of interest.

References

  1. Kurosawa, A.; Yano, M.; Matsuoka, Y.; Ando, K. Hybrid Vehicles, Electric Vehicles, Fuel Cell Vehicles and Traction Motors. J. Soc. Automot. Eng. Jpn. 2018, 72, 90–100. [Google Scholar]
  2. Opia, A.C.; Kadirgama, K.; Mamah, S.C.; Ghazali, M.F.; Harun, W.; Adeboye, O.J.; Agi, A.; Alibi, S. Electric Vehicles as a Promising Trend: A Review on Adaption, Lubrication Challenges, and Future Work. Lubricants 2025, 13, 474. [Google Scholar] [CrossRef] [Scilit]
  3. Gennaro, M.D.; Page, J.H.; Wellerdieck, T.; Lionetto, A.; Herber, S.; Abbenhaus, M.; Pescetto, P.; Pellegrino, G.; Primon, A.; Torres, P.A.; et al. Designing, prototyping, and testing an integrated e-axle for third-generation electric vehicles. Transp. Res. Procedia 2023, 72, 101–108. [Google Scholar] [CrossRef] [Scilit]
  4. Society of Automotive Engineers of Japan. Automotive Engineering Handbook, Volume 7, Design: EV and Hybrid Edition; Society of Automotive Engineers of Japan: Tokyo, Japan, 2016; Volume 7, pp. 154–196. [Google Scholar]
  5. Onimaru, S.; Matsui, H.; Taguchi, T.; Odaka, K.; Ichioka, E.; Mizutani, T. Heat Analysis of the Hybrid Electric Vehicles (HEV) Motor cooling Structure Using ATF. Denso Tech. Rev. 2008, 13, 19–25. [Google Scholar]
  6. Kalaf, O.; Solyali, D.; Asmael, M.B.A.; Zeeshan, Q.; Safaei, B.; Askir, A. Experimental and simulation study of liquid coolant battery thermal management systems for electric vehicles: A review. Int. J. Energy Res. 2021, 45, 6495–6517. [Google Scholar] [CrossRef] [Scilit]
  7. Roe, C.; Feng, X.; White, G.; Li, R.; Wang, H.; Rui, X.; Li, C.; Zhang, F.; Null, V.; Parkes, M.; et al. Immersion cooling for lithium-ion batteries—A review. J. Power Sources 2022, 525, 231094. [Google Scholar] [CrossRef] [Scilit]
  8. Narita, K.; Nakahara, Y.; Matsubara, K.; Tatsumi, H.; Takekawa, D. Cooling Performance of Lubricants Oils for Liquid-Cooled Motor and Battery Thermal Management System in EVs. In Proceedings of the 6th International Electric Vehicles Technology Conference, Yokohama, Japan, 22–24 May 2023. [Google Scholar]
  9. Nakahara, Y.; Tatsumi, H.; Narita, K. Thermal Management System for EVs/ Oil Cooling Technology for Motors and Batteries. J. Soc. Automot. Eng. Jpn. 2024, 78, 70–75. [Google Scholar]
  10. Farfan-Cabrera, L.I. Tribology of electric vehicles: A review of critical components, current state and future improvement trends. Tribol. Int. 2019, 138, 473–486. [Google Scholar] [CrossRef] [Scilit]
  11. Tokozakura, D.; Sano, T.; Nakamura, T.; Tada, A.; Susukida, Y.; Moritani, H.; Shinyoshi, T. Development of Transaxle Fluid for Electrification Vehicles: Design of Novel Additive Formulation. In SAE Powertrains, Fuels & Lubricants Conference & Exhibition 328512; SAE Paper 2022-01-1102; SAE Publications: Warrendale, PA, USA, 2022. [Google Scholar]
  12. Tokozakura, D.; Sano, T.; Nakamura, T.; Tada, A.; Susukida, Y.; Moritani, H.; Shinyoshi, T. Development of Transaxle Fluid for Electrification Vehicles: Validating Optimized Viscosity through Targeted Hardware Testing. In SAE Powertrains, Fuels & Lubricants Conference & Exhibition 328512; SAE Paper 2022-01-1103; SAE Publications: Warrendale, PA, USA, 2022. [Google Scholar]
  13. Seetharaman, S.; Kahraman, A. Load-Independent Spin Power Losses of a Spur Gear Pair: Model Formulation. J. Tribol. 2009, 131, 022201. [Google Scholar] [CrossRef] [Scilit]
  14. Seetharaman, S.; Kahraman, A.; Moorhead, M.D.; Petry-Johnson, T.T. Oil Churning Power Losses of a Gear Pair: Experiments and Model Validation. J. Tribol. 2009, 131, 022202. [Google Scholar] [CrossRef] [Scilit]
  15. Concli, F.; Gorla, C. Analysis of the Oil Squeezing Power Losses of a Spur Gera Pair by Mean of CFD Simulation. In Proceedings of the 11th Biennial Conference on Engineering Systems Design and Analysis, Nantes, France, 2–4 July 2012. [Google Scholar]
  16. Hoehn, B.R.; Oster, P.; Tobie, T.; Michaelis, K. Test method for gear lubricants. Goriva Maz. 2008, 47, 129–152. [Google Scholar]
  17. Hoehn, B.R.; Michaelis, K. Influence of oil temperature on the gear failures. Tribol. Int. 2004, 37, 103–109. [Google Scholar] [CrossRef] [Scilit]
  18. ASTM D7896-14; Standard Test Method for Thermal Conductivity, Thermal Diffusivity and Volumetric Heat Capacity of Engine Coolants and Related Fluids by Transient Hot Wire Liquid Thermal Conductivity Method. ASTM International: West Conshohocken, PA, USA, 2012.
  19. Tormos, B.; Bermudez, V.; Ruiz, S.; Alvis-Sachez, J. Degradation Effects of Base Oils after Thermal and Electrical Aging for EV Thermal Fluid Applications. Lubricants 2023, 11, 241. [Google Scholar] [CrossRef] [Scilit]
  20. Guo, X.; Zhao, Y.; Lou, W.; Zhang, B.; Wang, X.; Guo, F.; Liu, H. Quantitative Study on the Friction of Different Types of Base Oils Based on Stribeck Curve and Traction Curve Characterization. Lubricants 2025, 13, 485. [Google Scholar] [CrossRef] [Scilit]
  21. Hongu, J.; Horita, R.; Koide, T. Estimation of Gear Friction Coefficient Using Directional Parameter of Tooth Surface. J. Tribol. 2022, 144, 011603. [Google Scholar] [CrossRef] [Scilit]
  22. Matsumoto, S. Estimation Formula of Friction Coefficient of Rolling-Sliding Contact under Mixed Lubrication Conditions. J. Jpn. Soc. Tribol. 2011, 56, 632–638. [Google Scholar]
  23. Matsumoto, S.; Toyota, N. Estimation Formula of Friction Coefficient of Rolling-Sliding Contact Surface under Mixed Lubrication Condition (Part 2). J. Jpn. Soc. Tribol. 2013, 58, 676–684. [Google Scholar]
  24. Chittenden, R.J.; Dowson, D.; Dunn, J.F.; Taylor, C.M. A theoretical analysis of the isothermal elastohydrodynamic lubrication of concentrated contacts. I. Direction of lubricant entrainment coincident with the major axis of the Hertzian contact ellipse. Proc. R. Soc. Lond. A 1985, 397, 245–269. [Google Scholar] [CrossRef] [Scilit]
  25. Su, J.; Ouyang, Y.; Yin, L.; Shi, Z.; Zhou, C.; Wang, H.; Hu, B. Advancing wind turbine gearbox durability with eco-friendly GO nanolubricants: CFD simulation–experiment synergy for understanding flow dynamics, wear suppression and surface restoration mechanisms. Tribol. Int. 2026, 213, 111034. [Google Scholar] [CrossRef] [Scilit]
Figure 1. Layout of the e-axle bench test.
Lubricants 14 00386 g001
Figure 2. Procedure for the e-axle efficiency test.
Lubricants 14 00386 g002
Figure 3. Representative e-axle transmission efficiency map.
Lubricants 14 00386 g003
Figure 4. Schematic of the back-to-back gear friction test rig.
Lubricants 14 00386 g004
Figure 5. WLTC e-axle efficiency for test oils.
Lubricants 14 00386 g005
Figure 6. E-axle cooling test: time when the motor temperature reaches 120 °C; motor speed: 2000 rpm; motor torque: 200 Nm.
Lubricants 14 00386 g006
Figure 7. Traction coefficients measured using the mini traction machine.
Lubricants 14 00386 g007
Figure 8. Relationship between WLTC e-axle efficiency and metal-to-metal friction coefficient measured using the block-on-ring test for Samples B and D.
Lubricants 14 00386 g008
Figure 9. Difference in e-axle efficiency between Samples D and B.
Lubricants 14 00386 g009
Figure 10. EPMA elemental mapping on the post-test block Samples B and D.
Lubricants 14 00386 g010
Figure 11. Breakdown of torque loss in the back-to-back gearbox. Loaded torque: 100 Nm; oil temperature: 40 °C; test oil: Sample B.
Lubricants 14 00386 g011
Figure 12. Load-dependent gear torque losses of Samples A, B, and C. Loaded torque: 100 Nm; oil temperature: 40 °C.
Lubricants 14 00386 g012
Figure 13. Load-dependent gear torque losses of Samples B and D. Loaded torque: 100 Nm; oil temperature: 60 °C.
Lubricants 14 00386 g013
Figure 14. Relationship between e-axle efficiency and motor input torque in the e-axle bench test. Motor circumferential speed: 5 m/s; oil temperature: 60 °C.
Lubricants 14 00386 g014
Figure 15. Relationship between load-dependent gear torque loss and loaded torque in the back-to-back gear test. Gear circumferential speed: 5.5 m/s; oil temperature: 60 °C.
Lubricants 14 00386 g015
Figure 16. Relationship between λ ratio and load-dependent gear torque loss of Samples B and D. Loaded torque: 100 Nm; oil temperature: 60 °C.
Lubricants 14 00386 g016
Table 1. E-axle specifications for this study.
Motor TypePermanent Magnet Synchronous Motor
Motor cooling methodOil cooling
Maximum motor power (kW)150
Maximum motor torque (Nm)300
Maximum motor speed (rpm)15,000
Reduction gear type 3 parallel axes
Table 2. Test conditions for e-axle efficiency.
Motor temperature (°C)85
Lubricant temperature (°C)40/60
Lubricant flow rate (ℓ/min)3
Motor torque (Nm)25~250
Motor speed (rpm)2000~13,000
Table 3. Specifications of test gears.
Centre distance (mm)108.5
Number of pinion teeth29
Number of wheel teeth 30
Module (mm)3.5
Effective pressure angle (°)22.79
Helix angle (°)15
Face width18
Reference diameter pinion (mm)105.08
Reference diameter wheel (mm)108.70
Base diameter pinion (mm)98.33
Base diameter wheel (mm)101.72
Surface roughness of teeth (μm)0.3 (initial)
0.16 (after break-in)
MaterialChromium-
molybdenum steel
Table 4. Properties of test lubricant oils.
Sample ASample BSample CSample D
API Group I Base stocks✓
API Group II Base stocks ✓ ✓
API Group IV Base stocks ✓
Additives A✓✓✓
Additives B ✓
Density (kg/m3) at 40 °C892820800823
Density (kg/m3) at 60 °C880808788810
Kinematic viscosity (mm2/s) at 40 °C11.8 11.8 12.0 11.9
Kinematic viscosity (mm2/s) at 60 °C6.4 6.8 6.9 6.8
Viscosity Index46 120 122 120
Thermal conductivity (W/m·K) at 40 °C109 130 146 130
Thermal conductivity (W/m·K) at 60 °C108128144128
Specific heat capacity (kJ/kg/K) at 40 °C1.511.921.941.92
Specific heat capacity (kJ/kg/K) at 60 °C1.572.012.012.01
Disclaimer/Publisher’s Note: The statements, opinions and data contained in all publications are solely those of the individual author(s) and contributor(s) and not of MDPI and/or the editor(s). MDPI and/or the editor(s) disclaim responsibility for any injury to people or property resulting from any ideas, methods, instructions or products referred to in the content.