1. Introduction
Solid lubricants play a crucial role in reducing friction and wear of components. Graphite or graphene, as a widely used solid lubricant, is commonly employed to add to the friction contact surface to reduce friction coefficient. For example, graphite as dry lubricant was used in rail wheels, which reduced friction and wear of the rail wheels and extended their lifespan [
1]; graphene platelets as dry lubricants applied on the surfaces of angular contact ball bearings demonstrated superior friction and wear performance [
2]; However, with the improvement of component accuracy matching and operating speed, it is difficult to add external lubricants to effectively lubricate. Therefore, graphite was introduced into metal to fabricate self-lubricant metal matrix composites to reduce friction coefficient [
3]. Al-graphite composites fabricated by 3D printing exhibit a rather low friction coefficient (0.2 ± 0.02) and wear rate (6.64 × 10
−4 mm
3/N·m) due to the formation of graphite lubricating film on the contact surface [
4]. It is worth noting that the content and morphology of graphite are crucial for wear resistant performances of metal-graphite composites. Li et al. [
5] investigated the tribological properties of graphite/Cu composites with varying graphite content, revealing that the friction coefficient and wear rate exhibited an initial increase followed by a decrease as the graphite content increased. Wu et al. [
4] researched the tribological performance of graphite/aluminum composites with graphite in various morphologies into skeletons with various orientations, which indicated that fiber graphite exhibited the worst wear performance while spherical graphite obtained optimal friction and wear performance.
The spheroidal graphite in ductile iron was formed by spheroidization and incubation treatment for Fe molten during solidification [
6,
7]. Ductile iron containing spheroidal graphite not only exhibits comprehensive strength-plasticity matching, but also has potential in wear resistance due to the self-lubricating effect by graphite [
8]. Notably, the count, size and distribution of spheroidal graphite are critical factors affecting the physical and mechanical properties of ductile iron. It is accepted that fine spheroidal graphite with high count and uniform distribution in ductile iron was favorable to enhance physical and mechanical properties [
9,
10,
11]. Especially for friction and wear performance, ductile iron with high graphite nodule count could effectively reduce the friction coefficient, which is beneficial for improving friction and wear performance. For example, Abedi et al. [
12] investigated tribological behavior of ductile cast iron with different graphite nodule count. The result indicated that the ductile iron with a higher density of graphite nodules exhibited a lower wear rate. Unfortunately, the spheroidal graphite from solidification process usually exhibits a large size (10~30 μm), low count (100~500 nod/mm
2) and large spacing (20~50 μm) [
13,
14,
15], which is not conducive to effectively reducing the friction coefficient.
In the past decades, some interesting studies have involved introducing small-sized graphite (3~10 μm) into free cutting steels by graphite annealing treatment to increase their wear resistance [
16,
17]. The formation of graphite in steels by graphite annealing usually required the addition of some graphitizing elements (Al and Si) [
18,
19]. Besides, it was found that the initial matrix structure of medium carbon steel had a significant impact on the formation of small-sized graphite [
20]. The martensitic structure containing supersaturated carbon atom solid solution and more grain boundaries, which provided very favorable conditions for the formation of the small-sized and high-density graphite nodules during the annealing process [
21].
Refer to the graphitization annealing conditions of medium carbon steel, the chemical composition of ductile iron typically contains high levels of C and Si elements [
22]. Meanwhile, the C elements content in matrix of ductile iron can be tailored by austenization treatment [
23]. These factors can provide the basic compositional conditions for precipitation of high count and small-sized graphite in matrix of ductile iron by solid phase transformation. Hence, it is inferred that the formation high density and small-sized graphite nodules can also be achieved in ductile iron. In the work, an initial martensitic structure was obtained in ductile iron, followed by annealing treatment to precipitate the small-sized graphite in matrix and reveal the formation mechanism of small-sized graphite nodules in ductile iron with a martensitic matrix, with the aim of obtaining high density graphite nodules to its reduce friction coefficient and improve wear performance.
2. Experimental Procedures
The chemical composition of as-cast ductile iron with a dimension of Ø 70 mm × 300 mm was measured by a spark optical emission spectrometer in the present study and the result is shown in
Table 1. Two cylindrical specimens were cut from the cast profiles.
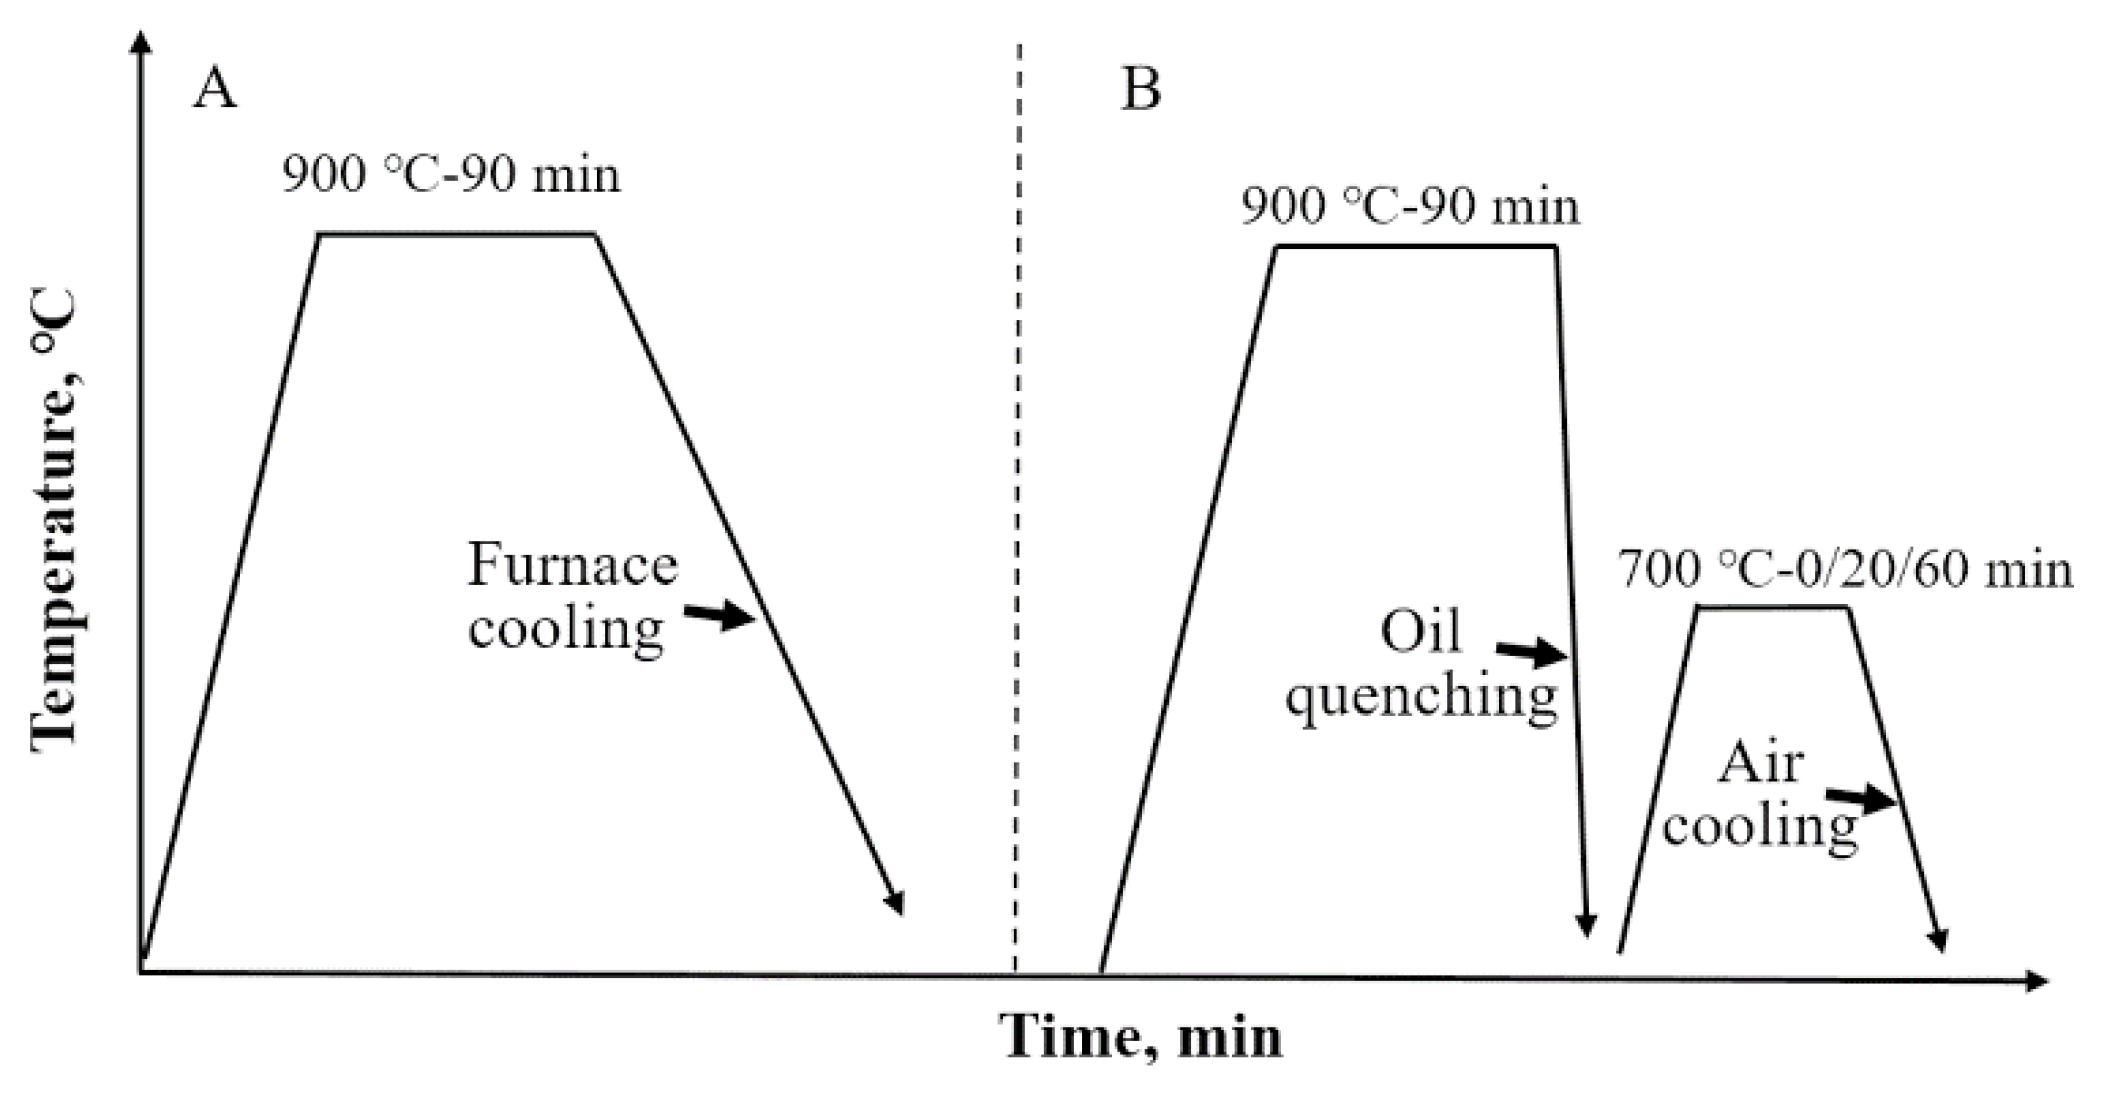
Figure 1 shows the two annealing treatment process. Austenitizing a cylindrical specimen at 900 °C and maintaining it for 90 min, then cooling the specimen in a furnace, resulted in ferrite ductile iron without ultrafine graphite nodules as the comparison group (
Figure 1A). Another cylindrical specimen was austenitized at 900 °C and maintained for 90 min. Afterwards, the specimen was quenched into oil to achieve a martensitic matrix (
Figure 1B). The specimens with the dimensions of 10 mm × 10 mm × 10 mm was machined from the directly oil quenched samples and annealed at 700 °C from 0, 20 and 60 min, respectively to observe the formation of ultrafine graphite nodules in ductile iron (
Figure 1B). The ferrite ductile iron without ultrafine graphite nodules (FDI) and ferrite ductile iron with ultrafine graphite nodules (FDI-UG) were named FDI and FDI-UG, respectively in the following text.
Standard metallographic specimens were etched with 4% nital solution. The microstructure was observed by an optical microscope (OLYMPUS GX71, Olympus, Tokyo, Japan) and scanning electron microscopy (JSM-6700F, JEOL, Tokyo, Japan). The micro-hardness of FDI and FDI-UG was tested by the microhardness tester (HVS-1000A, Shandong Shancai Testing Instrument Co., Ltd., Yantai, China) with a load of 25 g and holding time of 15 s. Each sample was tested with five indentations, and the average was taken as the final test result to maintain accuracy.
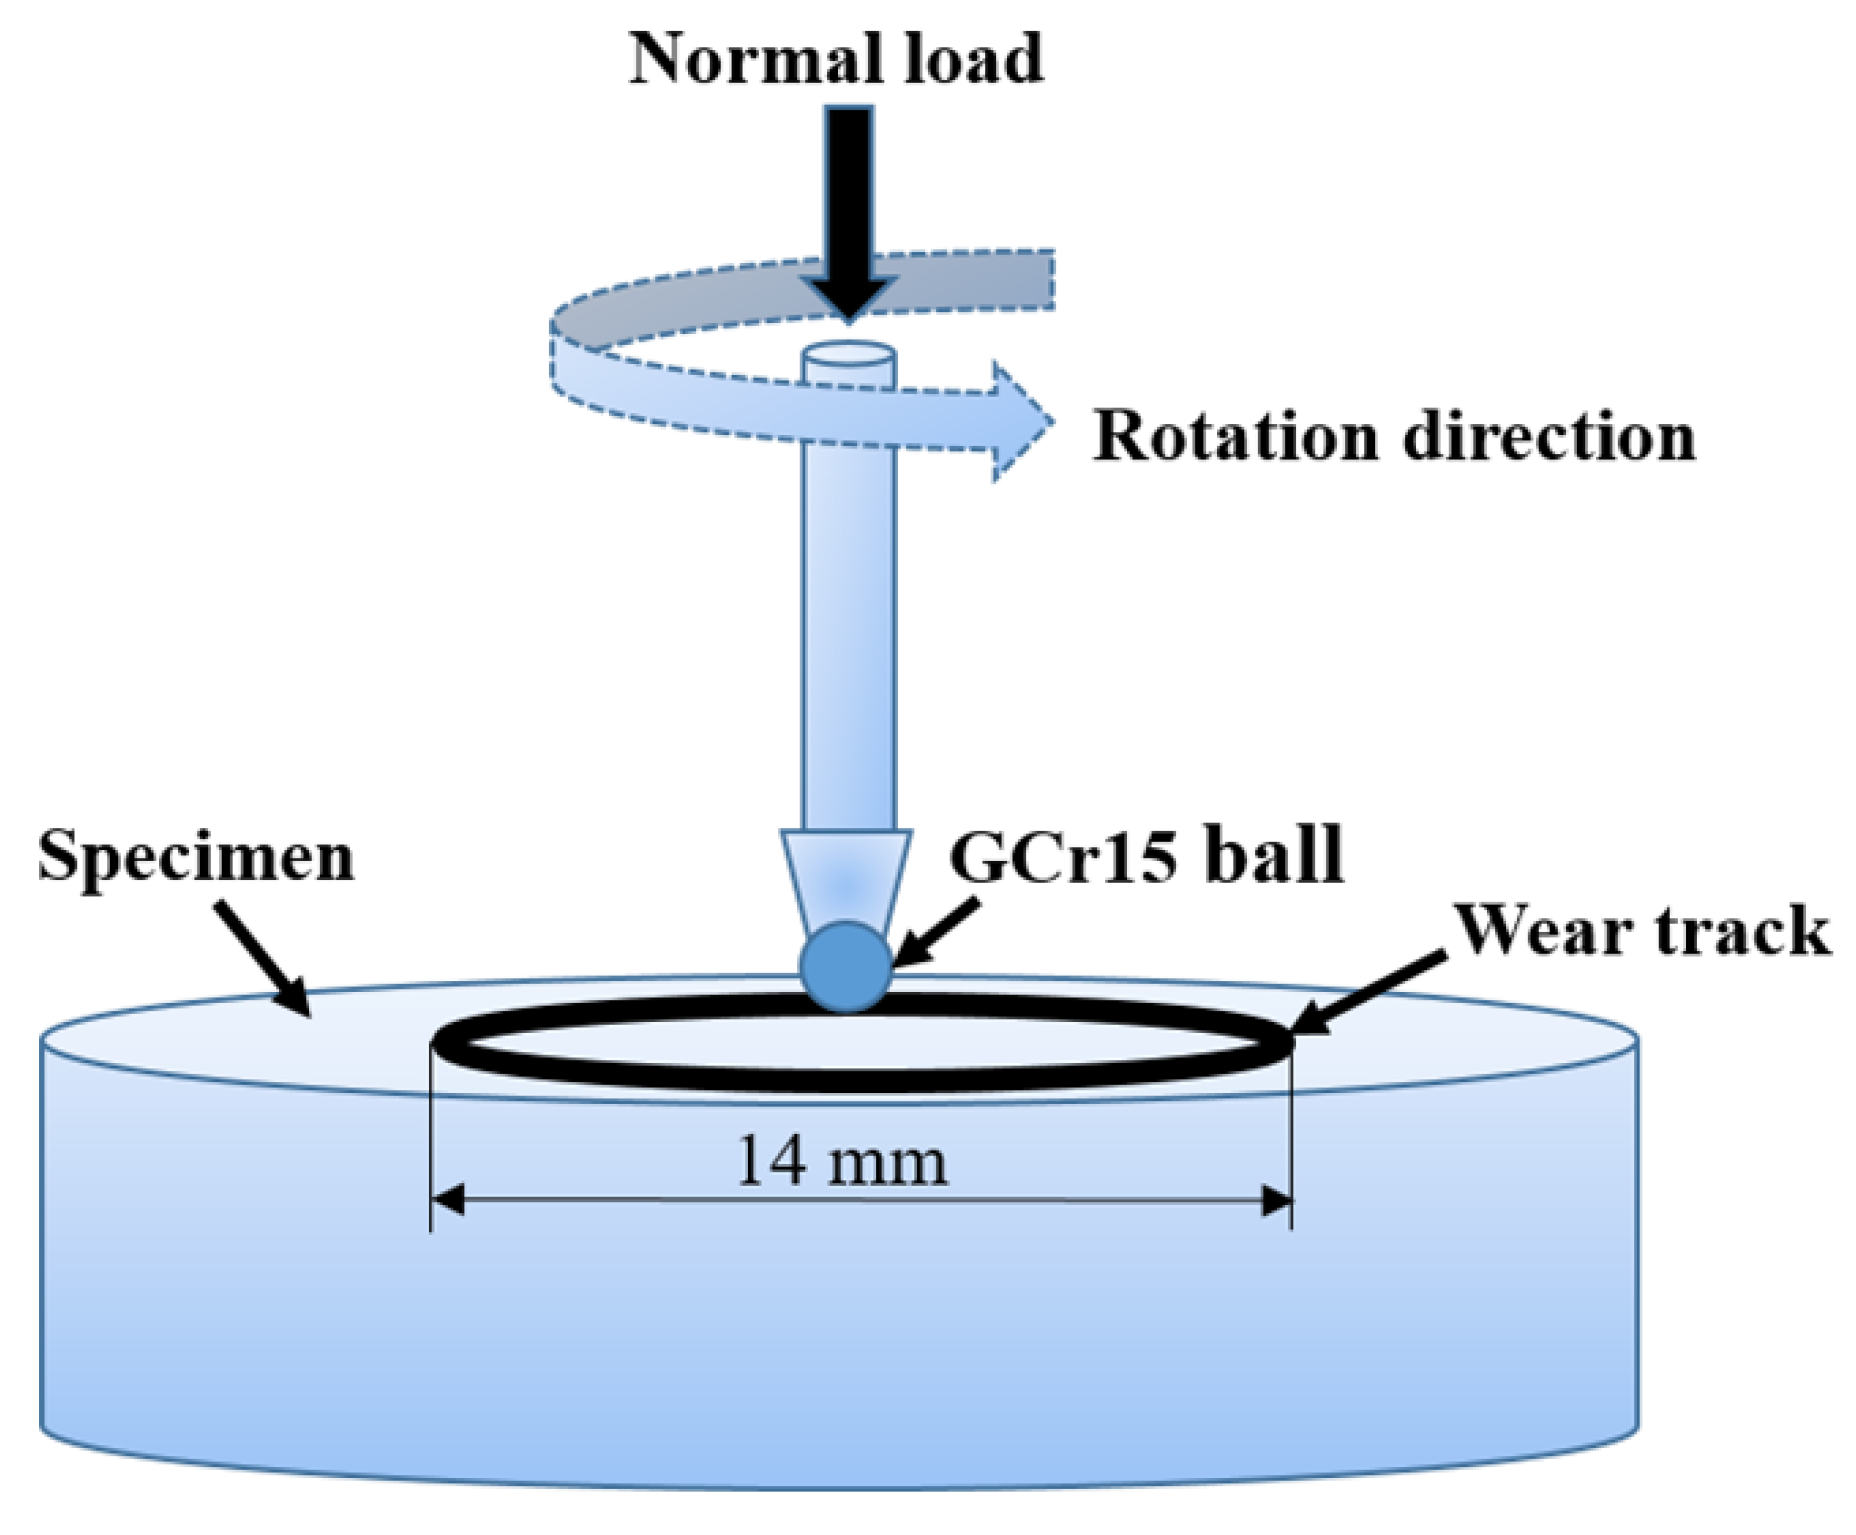
Disc specimens with a dimension of Ø 30 mm × 4 mm were machined from two ferritized samples to conduct friction and wear testing. Before testing, samples were ground and polished. The friction and wear properties of the ferritized samples were evaluated by a ball-on-disk tribometer (FHC-1D, Xi’an Rui’an Instrument Equipment Co., Ltd., Xi’an, China), as shown in
Figure 2. GCr15 steel balls with a diameter of 9.0 mm and a hardness exceeding 60 HRC were used as the grinding material. Normal loads of 3 N and 6 N were applied and the corresponding to mean contact pressure was calculated as 430 MPa and 543 MPa according to Hertzian elastic contact theory [
24,
25]. The sliding speed was 200 r/min and the rotation diameter was 14 mm. The test took 20 min to complete. Three samples were performed for wear tests under each condition to ensure repeatability. The worn surfaces and the longitudinal sections were observed by SEM. The wear profiles of samples were determined using a profile-meter. The worn volume loss was
V was determined as follows:
where
d represents diameter of the wear trace (mm),
A represents the section area of the wear track (mm
2), and
V represents the worn volume loss (mm
3).
3. Results and Discussion
The optical micrographs of FDI and FDI-UG were illustrated in
Figure 3. There were obvious differences for the two annealing samples. The FDI contained spheroidal graphite with a diameter of about 15 ± 3 μm and a graphite nodule count was about 350 ± 20 nod/mm
2 distributing homogeneously around the matrix (
Figure 4a). However, ultrafine graphite nodules could be observed in the FDI-UG besides the original spheroidal graphite (
Figure 4b). The count and the diameter of the ultrafine spheroidal graphite nodules were estimated to 3400 ± 200 nod/mm
2 and 0.8 ± 0.08 μm, respectively. The grain size of ferrite was measured approximately 29 ± 2.3 μm for FDI and 15 ± 1.7 μm for FDI-UG (
Figure 4c,d). The result mainly because the low annealing temperature (700 °C) reduced the tendency for ferrite grain growth for FDI-UG compared to FDI with the high annealing temperature (900 °C), which resulted in the formation of finer ferrite grains in FDI-UG. The microhardness of FDI and FDI-UG were measured to be 156 ± 3 HV and 183 ± 5 HV, respectively. The increase in microhardness of FDI-UG was mainly attributed to the strengthening of ferrite grain refinement. It was worth emphasizing that the increase in ferrite hardness was beneficial for the wear resistance of FDI-UG.
In order to observe the formation process of ultrafine graphite nodules, the microstructural evolution of FDI-UG was presented in
Figure 4. The matrix of the quenched sample exhibited the typical acicular martensite (
Figure 4a). When the quenched sample was annealed for 20 min, the martensite decomposed into granular carbides and ferrite formed (
Figure 4b). Additionally, some fine spheroidal particles with white contrast and ultrafine spheroidal graphite with dark contrast could be observed in the region of ferrite (
Figure 4b). After annealing 60 min, all carbides and fine spheroidal particles with white contrast transformed into ultrafine spheroidal graphite with dark contrast (
Figure 4c).
Figure 5 shows SEM images and EDS analysis of quenched ductile iron annealed at 700 °C for 20 min. The carbides with white contrast in the region A of
Figure 5a were enlarged in
Figure 5b. It could be seen that carbides appeared in granular and aggregated to form chains. The corresponding EDS analysis in the D area of
Figure 5b was shown in
Figure 5c. EDS confirmed the atomic ratio of Fe to C was about 3:1, which indicated that carbides were Fe
3C. The result was consistent to previous literature [
26], which reported that martensite easily decomposed into ferrite and Fe
3C at high temperature (>500 °C). The area in
Figure 5a with fine spheroidal particles and the ultrafine spheroidal graphite nodules were enlarged in
Figure 5c. The size of fine spheroidal particles and the ultrafine spheroidal graphite nodules was estimated about 0.8 μm. It could be seen that the fine spheroidal particles with white contrast were surrounded by granular Fe
3C with white contrast, which implied that the fine spheroidal particles with white contrast were transformed from the decomposition of granular Fe
3C. It should be noted that there was almost no granular Fe
3C around ultrafine spheroidal graphite with dark contrast (
Figure 5c), which demonstrated that the Fe
3C had totally transformed into ultrafine spheroidal graphite. The results of EDS analysis in the E, F and G areas of
Figure 5c further confirmed the transformation process from Fe
3C to ultrafine spheroidal graphite (
Figure 5E–G). It should be mentioned that the boundary of ferrite grains migration was accompanied by the aggregation and growth of Fe
3C during the recovery process of ferrite [
27]. From aggregated Fe
3C to fine spheroidal particles and then to ultrafine graphite, the composition containing C atoms gradually increased while the Fe atoms decreased (
Figure 5D,E), which indicated that the aggregated Fe
3C gradually decomposed into C atoms and Fe atoms, and the C atoms gradually aggregated to form graphite, while the Fe atoms moved into the matrix. Therefore, the fine spheroidal particles with white contrast were the transition phase from Fe
3C transforming to ultrafine graphite nodules (
Figure 5c). Additionally, it should be noted that the Si atoms content of Fe
3C transforming to ultrafine graphite gradually decreased (
Figure 5D,E), which indicated a close relationship between Si elements and the transformation Fe
3C into ultrafine graphite nodules. Some literature has reported that the binding ability between Si atoms and Fe atoms was higher than that between C atoms and Fe atoms [
28,
29], which resulted in a reduction of Si content from Fe
3C transforming into ultrafine graphite. The presence of Si element made the Fe
3C easy to decompose and transform into the stable graphite phase.
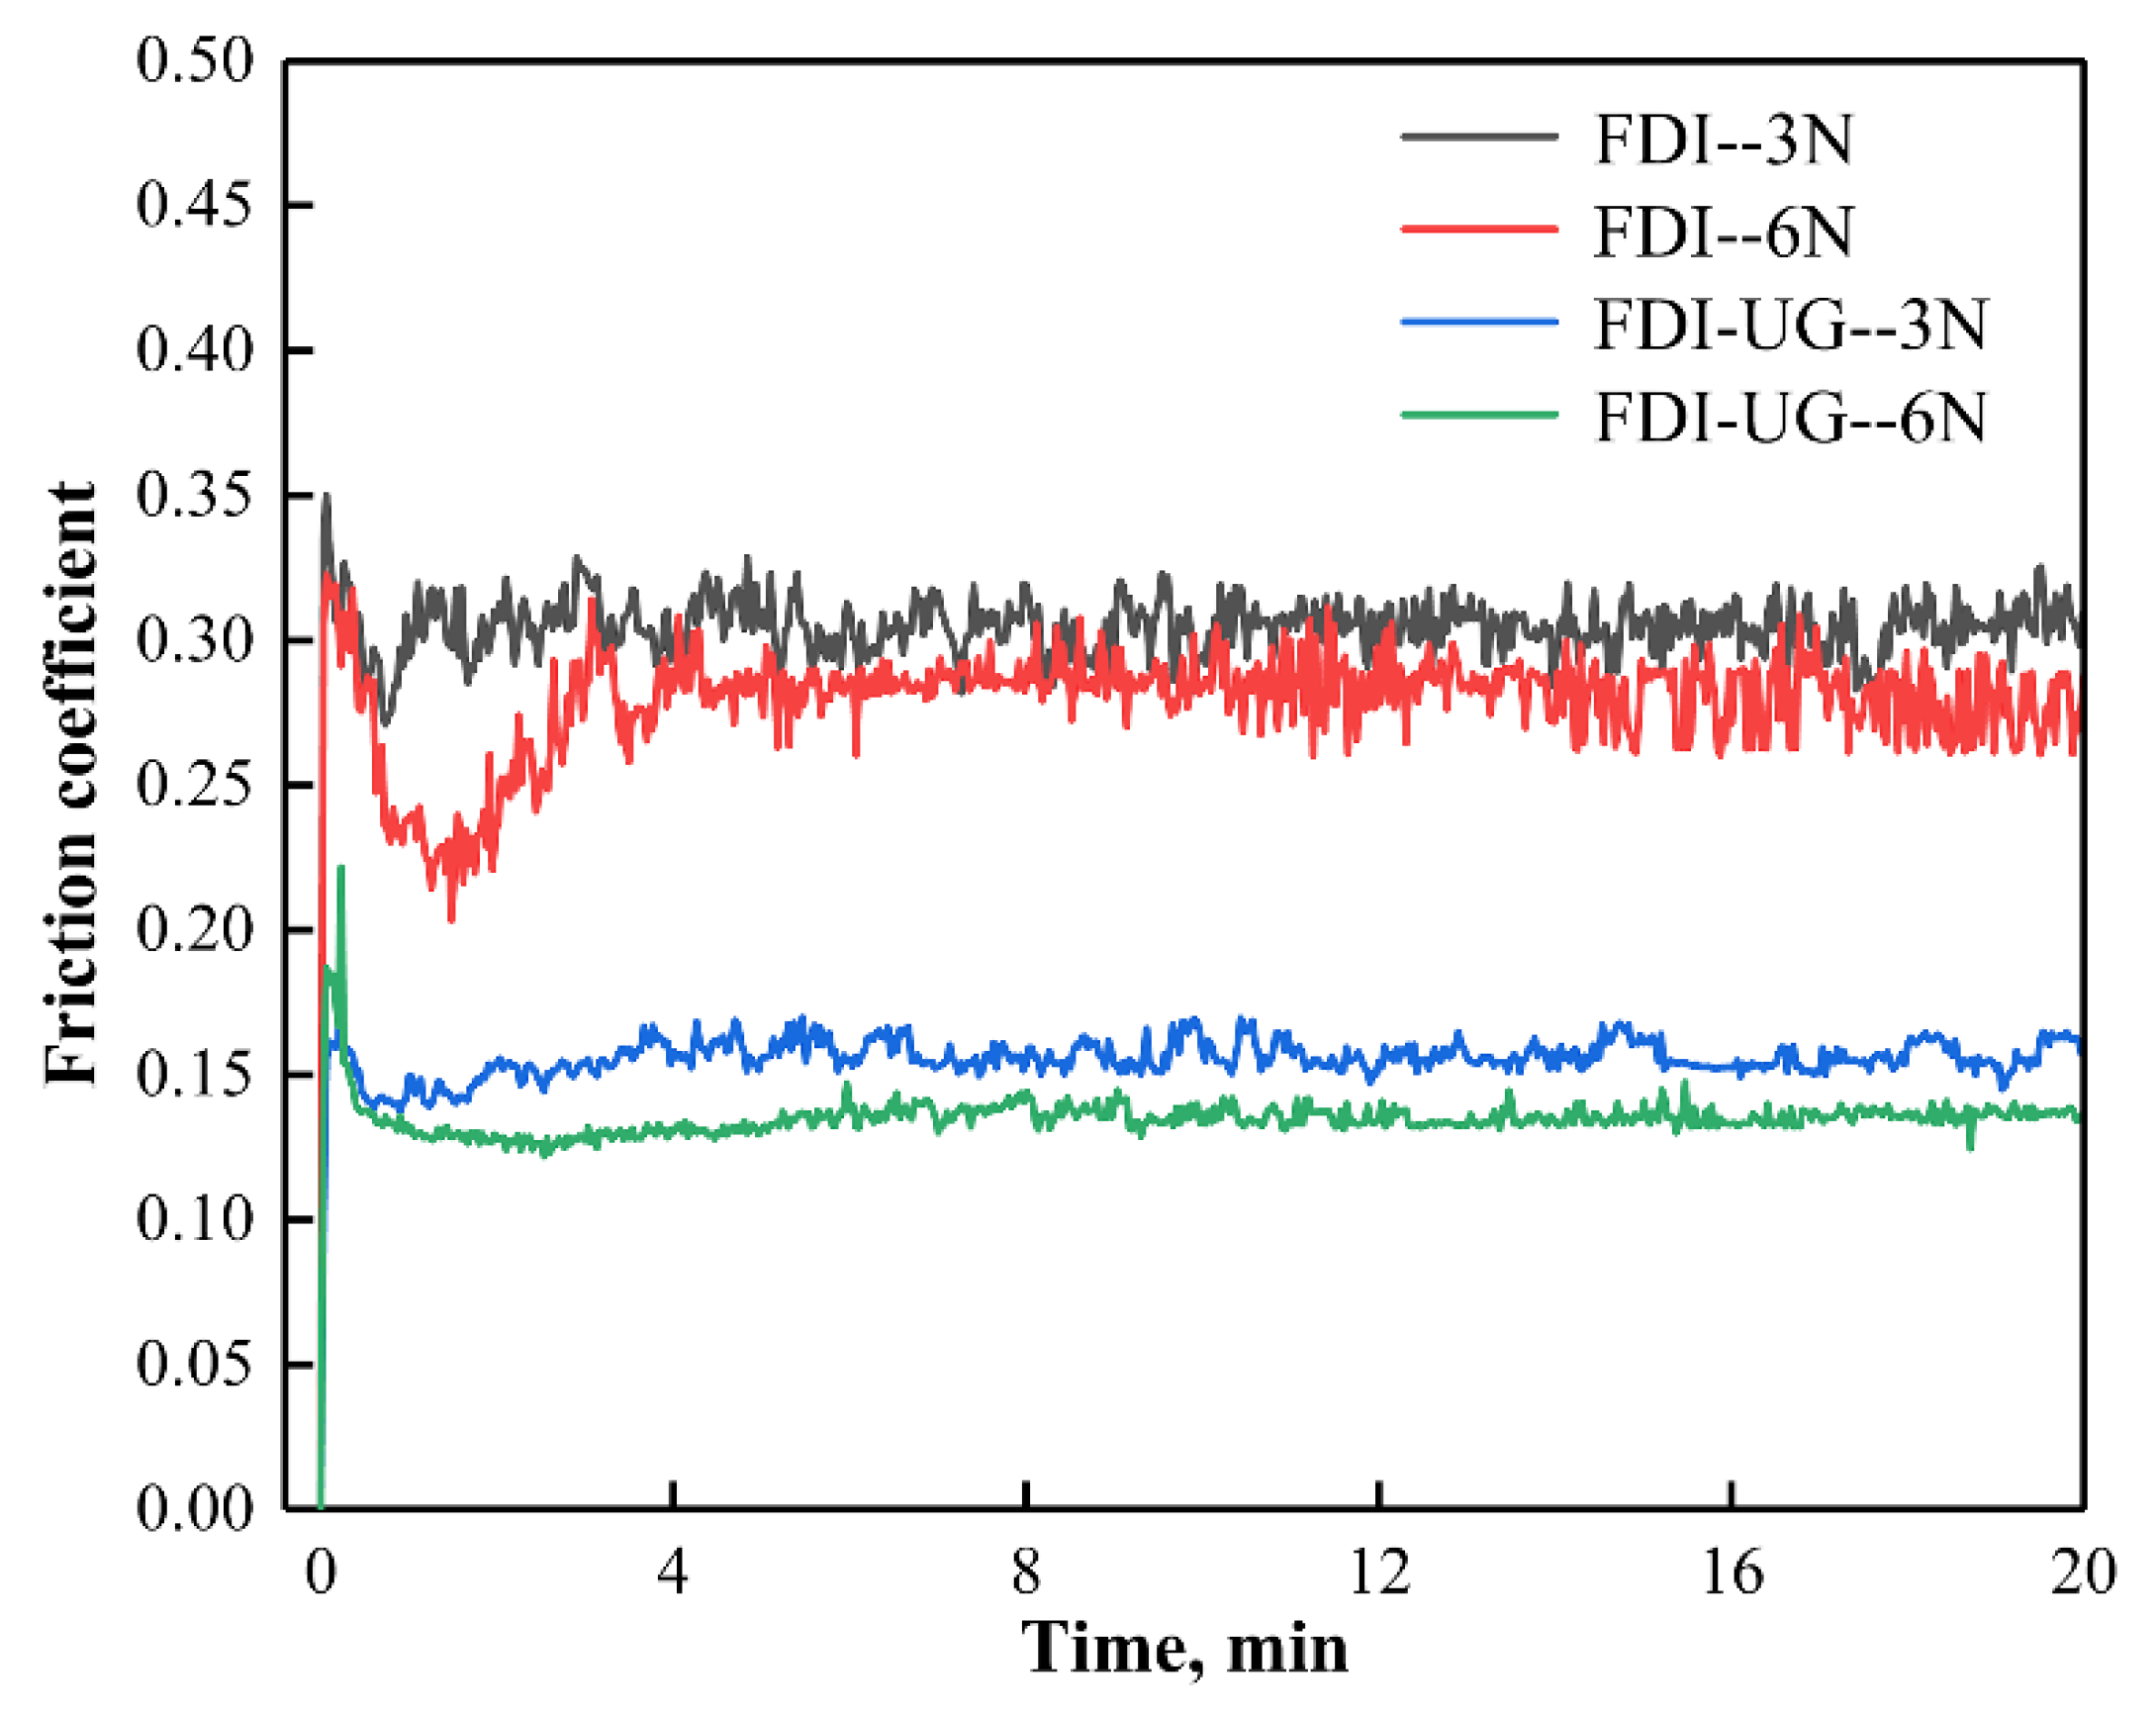
Figure 6 presents fiction coefficient curves of FDI and FDI-UG under different normal loads. The frictional resistance generated by the asperities of the contact surface first led to an increase in the friction coefficient curve of FDI. As the asperities gradually flattened, graphite was gradually dragged to the contact surface, and the friction coefficient curve of FDI reached a stable value. However, the fiction coefficient curves of FDI-UG first showed a downward trend and then directly entered steady stage. The ultrafine graphite nodules in ductile iron could be quickly dragged out to the tribosurface and effectively exert their lubricating effect in the early stages, resulting in a rapid decrease in the friction curve and reaching a stable state. It could be seen that the FDI-UG exhibited a lower friction coefficient value compared to FDI. The friction coefficient value of FDI at steady state was 0.31 ± 0.020 and 0.28 ± 0.015 at 3 N and 6 N, respectively. However, the values were 0.15 ± 0.010 and 0.13 ± 0.008 for FDI-UG, which was only half of FDI at the same normal load. The steady-state friction coefficient values of FDI-UG was similar to the friction coefficient values (0.1~0.2) of graphene platelets with 6~15 nm thicknesses used as dry lubricants in high load rolling bearings in the previous study [
30]. The result was related to the lubricating effect of ultrafine graphite nodules in FDI-UG. Additionally, it could be seen that the FDI and FDI-UG exhibited a lower friction coefficient value at higher normal load (6 N) compared to the value at lower normal load (3 N), which was attributed to the varying amount of graphite dragged out onto the tribosurface. More graphite could be dragged out to the tribosurface and played a lubricating role under high normal load (6 N) compared to the low normal load (3 N), giving rise to a lower friction coefficient value at 6 N.
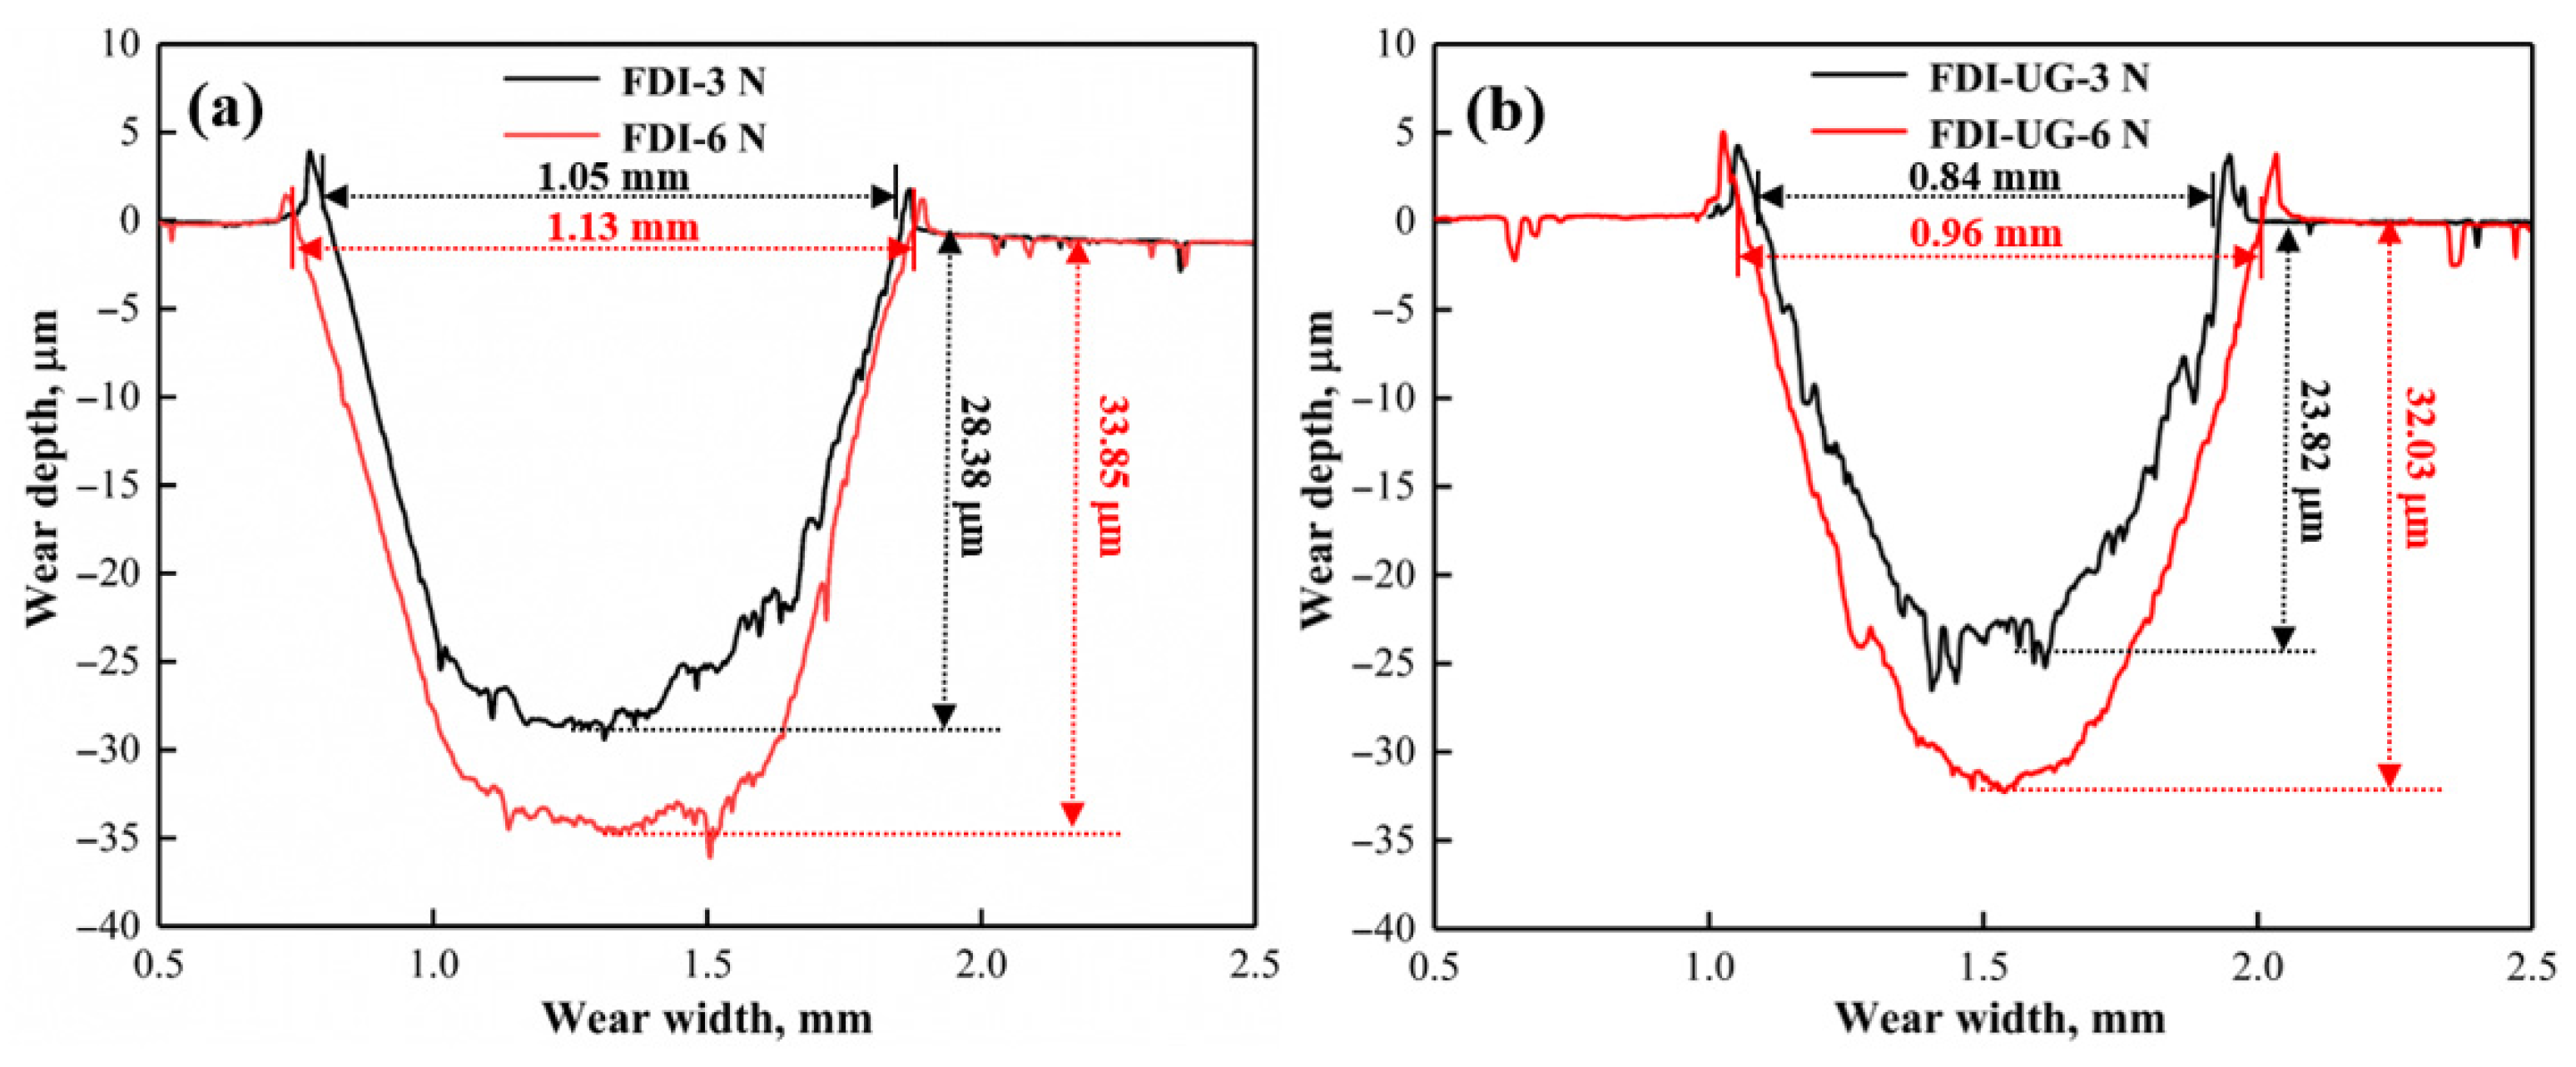
Figure 7 illustrates the profiles of wear track for FDI and FDI-UG at 3 N and 6 N. As shown in
Figure 7a,b, both the width and depth of the wear profiles for FDI and FDI-UG increased with the increase in normal loads, primarily due to the higher load resulting in more severe wear. Furthermore, under the same normal load, the wear track dimensions for FDI were larger than those of FDI-UG. For instance, the width and depth of the worn track for FDI were 1.05 mm and 28.38 μm at 3 N, respectively, while the corresponding values were measured as 0.84 mm and 23.82 μm for FDI-UG. These results indicated that FDI-UG exhibited relatively lower wear compared to FDI. The roughness (
Ra) of the friction-discs interface (FDI) was evaluated as 1.2 ± 0.23 μm and 1.5 ± 0.26 μm at normal loads of 3 N and 6 N, respectively. In contrast, the
Ra values for the FDI-UG were 0.86 ± 0.18 μm and 1.1 ± 0.19 μm at the same loads. Both
Ra values for FDI and FDI-UG increased with increasing normal loads, primarily due to more severe wear occurring on the tribo-surface under higher loads. Notably, FDI-UG exhibited a lower
Ra than FDI at equivalent loads, indicating enhanced wear resistance in FDI-UG. This superior wear resistance resulted in less wear on the tribo-surface compared to FDI. Furthermore, the lower
Ra of FDI-UG contributed to a reduced friction coefficient during friction and wear.
Figure 8 illustrates the worn volume loss for FDI and FDI-UG at 3 N and 6 N. The worn volume loss for FDI and FDI-UG increased with increasing normal load. Notably, the worn volume loss for FDI was greater than that of FDI-UG at the same load. Specifically, at 3 N, the worn volume loss for FDI was measured at (9.22 ± 0.26) × 10
−3 mm
3, while at 6 N, it increased to (11.95 ± 0.34) × 10
−3 mm
3. In contrast, the worn volume loss for FDI-UG was (6.84 ± 0.16) × 10
−3 mm
3 at 3 N and (9.47 ± 0.23) × 10
−3 mm
3 at 6 N. These results demonstrate that FDI-UG exhibited superior wear resistance compared to FDI, which was related to the effective reduction of the friction coefficient in FDI-UG due to the ultrafine graphite nodules distributing on the tribological surface. Besides, the FDI-UG with a hardness of 183 ± 5 HV was higher than FDI with a hardness of 156 ± 3 HV due to the strengthening effect of fine grains. According the Archard’s equation as follows [
31]:
where
K is wear coefficient,
N is normal load,
L is sliding distance and
H is the hardness of material. The volume loss of (
V) is proportional to normal load (
N) disproportional to the hardness of material (
H). Therefore, the FDI-UG exhibited the less volume loss compared to FDI. Meanwhile, the volume loss of FDI-UG and FDI increased with the increasing normal loads.
Figure 9 shows the worn surface for FDI and FDI-UG at 3 N and 6 N. The wear of contact surface gradually became severe and the amount of graphite worn out gradually increased with the increasing loads (
Figure 9a–d). The proportion of graphite coverage in worn surface for FDI was estimated about 15% and 20% at 3 N and 6 N, while the values were about 31% and 38% for FDI-UG at 3 N and 6 N (
Figure 9). Therefore, the friction coefficients of FDI and FDI-UG were low at 6 N compared to 3 N due to the higher graphite coverage on the tribosurface at 6 N (
Figure 6 and
Figure 9). Additionally, the FDI-UG exhibited higher graphite coverage on the tribosurface compared to the FDI, which resulted in a low friction coefficient of FDI-UG compared to FDI (
Figure 6).
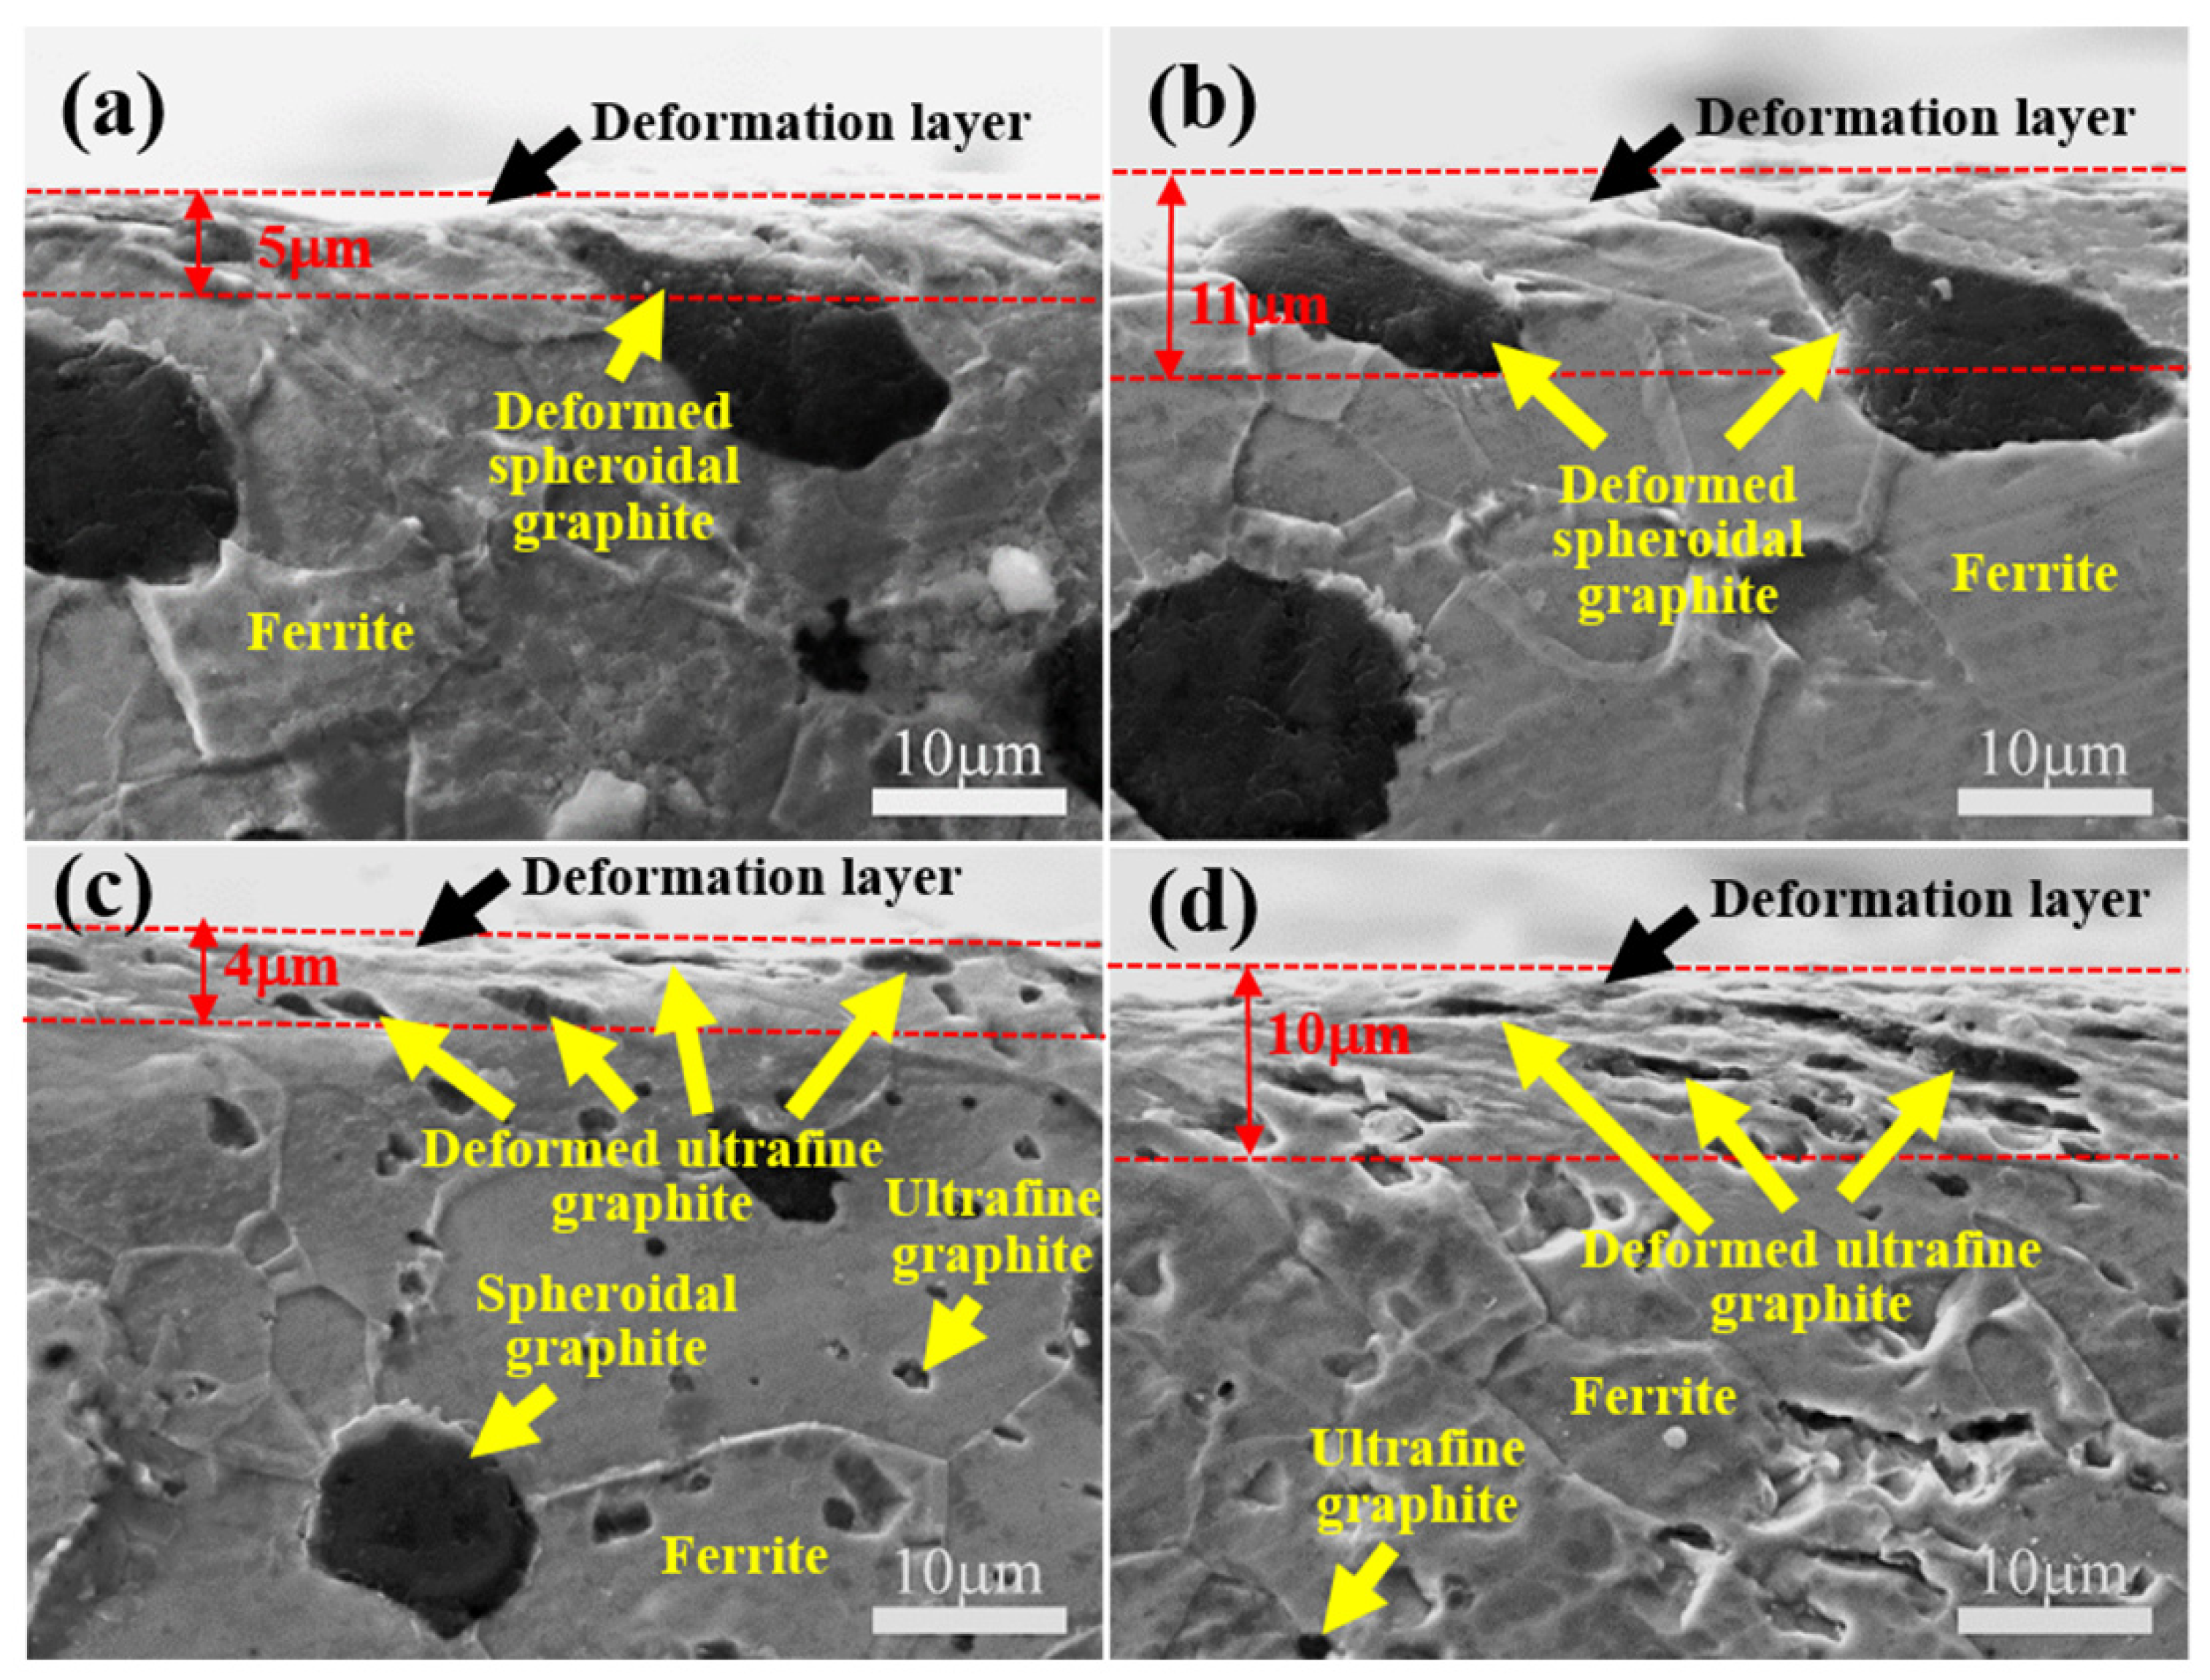
Figure 10 presents longitudinal section of worn track of FDI and FDI-UG at 3 N and 6 N. The ferrite matrix underwent varying degrees of deformation with the increasing normal loads. The deformation layer depth increased from about 5 μm to 10 μm when the load increased from 3 N to 6 N (
Figure 10). Spheroidal graphite and ultrafine graphite nodules in the ferrite were squeezed and dragged to the tribosurface to act as lubricants, which was mainly responsible for reducing the friction coefficient. More graphite were squeezed and dragged to the tribosurface with the increasing load from 3 N to 6 N (
Figure 10a–d), which resulted in a decrease in the fiction coefficient with the increasing loads. Additionally, the ultrafine graphite nodules exhibited a small size (0.8 μm) and high nodule count (3400 ± 163 nod/mm
2) distribution in ferrite compared to initial spheroidal graphite (15 ± 3 μm and 350 ± 20 nod/mm
2), and therefore more ultrafine graphite nodules could be easily dragged out to the tribosurface (
Figure 10a–d). Therefore, the graphite lubricating layer was more easily formed in FDI-UG compared to FDI, which resulted in a lower friction coefficients for FDI-UG. It should be emphasized that the matrix distributing around the original graphite was easily to be plastically deformed due to the weak strength of graphite, which would promote the formation of abrasive during wear test. This would be discussed in the following.
Figure 11 shows worn surface of FDI and FDI-UG at 3 N and 6 N. The grooves and spalling could be observed in the worn surface of FDI and FDI-UG, which indicated that the mainly abrasive failure and surface fatigue occurred (
Figure 11). Additionally, it should be mentioned that the adhesive wear also occurred for FDI under high loads (6 N). Some cracks could be found in region of spalling, which was responsible for the occurrence of spalling on worn surface (
Figure 11a–c). The more wear debris acted as abrasive particles on the worn surface of FDI compared to FDI-UG (
Figure 11), which resulted in more deep and wide grooves in the worn surface of FDI compared to FDI-UG (
Figure 11a–d). The formation of ultrafine graphite nodules in ferritized ductile iron during annealing refined the grain of ferrite, which resulted in an increase in hardness of FDI-UG (183 ± 5 HV) compared to FDI (156 ± 3 HV). Therefore, the abrasive particles was prevented forming grooves in ferrite matrix, which reduced abrasive wear in the tribosurface of FDI-UG. Therefore, the relatively less abrasive wear occurred and only shallow and fine grooves were observed in worn surfaces of FDI-UG (
Figure 11c,d). Besides, the initial spheroidal graphite could observed in worn surfaces of FDI and FDI-UG, while the additional precipitated ultrafine graphite nodules could be seen in the worn of FDI-UG (
Figure 11). The ultrafine graphite nodules in the tribosurface further effectively lubricated, which resulted in lower frictional force on the contact surface. Additionally, the adhesion occurred in the worn surface of FDI at 6 N (
Figure 11b), while this phenomenon has hardly been observed in the worn surface of FDI-UG (
Figure 11d). Meanwhile, a lot of ultrafine graphite distributed on the worn surface of FDI-UG (
Figure 11d). More ultrafine graphite in FDI-UG would be dragged out to the worn surface and reduced the direct contact area between the GCr15 ball and the FDI-UG at 6 N. Thus, the adhesive wear was suppressed in FDI-UG and the friction coefficient decreased.
Figure 12 presents a schematic diagram of FDI and FDI-UG during the friction and wear process. The microstructure of FDI was composed of initial spheroidal graphite and ferrite (
Figure 12a). The ferrite, characterized with low hardness and high plasticity, readily underwent plastic deformation under normal loads (
Figure 12b). During the friction and wear process, the initial graphite within the ferrite matrix was squeezed and transported to the tribological surface, playing a certain lubricating role and reducing the friction coefficient (
Figure 12b). In contrast, the microstructure of FDI-UG included initial spheroidal graphite, ultrafine graphite nodules, and ferrite (
Figure 12c). Under normal load, the ferrite in FDI-UG also underwent plastic deformation, leading to the squeezing and dragging of initial spheroidal graphite and ultrafine graphite nodules to the tribosurface. This resulted in a greater amount of graphite at the tribosurface of FDI-UG compared to FDI (
Figure 12d). Consequently, the distribution of denser graphite on the tribosurface of FDI-UG, which more effectively reduced the friction coefficient compared to FDI.
