Article

Understanding the Lubrication and Wear Behavior of Agricultural Components Under Rice Interaction: A Multi-Scale Modeling Study

1
School of Agricultural Engineering, Jiangsu University, Zhenjiang 212013, China
2
Key Laboratory of Modern Agricultural Equipment and Technology, Ministry of Education, Jiangsu University, Zhenjiang 212013, China
*
Author to whom correspondence should be addressed.
Lubricants 2025, 13(9), 388; https://doi.org/10.3390/lubricants13090388
Submission received: 23 July 2025 / Revised: 17 August 2025 / Accepted: 28 August 2025 / Published: 30 August 2025

Abstract

This study investigates the tribological behavior and wear mechanisms of Q235 steel components subjected to abrasive interaction with rice, a critical challenge in agricultural machinery performance and longevity. We employed a comprehensive multi-scale framework, integrating bench-top tribological testing, advanced Discrete Element Method (DEM) coupled with a wear model (DEM-Wear), and detailed surface characterization. Bench tests revealed a composite wear mechanism for the rice–steel tribo-pair, transitioning from mechanical polishing under mild conditions to significant soft abrasive micro-cutting driven by the silica particles inherent in rice during high-load, high-velocity interactions. This elucidated fundamental friction and wear phenomena at the micro-level. A novel, calibrated DEM-Wear model was developed and validated, accurately predicting macroscopic wear “hot spots” on full-scale combine harvester header platforms with excellent geometric similarity to real-world wear profiles. This provides a robust predictive tool for component lifespan and performance optimization. Furthermore, fractal analysis was successfully applied to quantitatively characterize worn surfaces, establishing fractal dimension (Ds) as a sensitive metric for wear severity, increasing from ~2.17 on unworn surfaces to ~2.3156 in severely worn regions, directly correlating with the dominant wear mechanisms. This study offers a valuable computational approach for understanding and mitigating wear in tribosystems involving complex particulate matter, contributing to improved machinery reliability and reduced operational costs.

1. Introduction

In the critical pursuit of ensuring global food security and addressing the increasing demand for agricultural output driven by population growth, the efficiency and reliability of modern agricultural machinery play an indispensable role [1,2,3,4]. Among these vital tools, the combine harvester stands as a pivotal piece of equipment for the efficient, low-loss harvesting of staple food crops such as rice, which feeds a significant portion of the world’s population [5,6,7,8,9,10]. The operational performance and long-term reliability of these machines directly impact agricultural productivity [11], farmer profitability [12,13], and overall food security [14,15].
However, during harvesting operations, the header platform [9,16] of the combine harvester, serving as the primary interface between the machine and the crop, is subjected to relentless and complex interactions. This involves continuous contact not only with rice stalks and grains, but also with varying amounts of entrained soil, sand, and other field debris [17,18,19]. This intricate tribological system leads to severe friction and wear, particularly on critical components such as the header platform’s bottom plate and the spiral auger. Such component degradation carries multi-faceted negative consequences: from an equipment perspective, it drastically shortens the machine’s service life, necessitates frequent maintenance, incurs high operational costs, and leads to unproductive downtime during peak harvesting seasons [20,21,22]. From a broader agricultural perspective, the altered surface morphology due to wear can significantly impair the material flow efficiency within the header, potentially causing costly blockages, increasing power consumption, and leading to substantial grain losses [23,24,25]. This reduction in harvest yield and increase in operational expenditure poses a significant challenge to the economic viability and sustainability of modern rice farming. Therefore, achieving an in-depth understanding and accurate prediction of the wear behavior of header platform components is not merely a mechanical engineering problem, but also a critical and pressing challenge within the interdisciplinary domain of agri-tribology.
Addressing such complex interactions, especially involving granular and particulate materials, has significantly benefited from advancements in computational science. In recent years, the Discrete Element Method (DEM) has emerged as a particularly powerful computational modeling paradigm for investigating the intricate interaction dynamics between agricultural bulk materials (e.g., grains, seeds, stalks, and soil) and various mechanical components [26,27,28]. This method’s ability to model individual particles and their contacts makes it exceptionally well-suited for simulating the highly dynamic and heterogeneous environments found within agricultural machinery. Numerous researchers have successfully employed DEM to simulate material flow behavior in key agricultural processes such as grain cleaning, conveying systems (like augers and belt conveyors), and threshing units, leading to valuable insights. These simulations have proven effective in predicting phenomena like material segregation and blockages, optimizing operational parameters to enhance throughput and minimize damage, and ultimately improving the overall efficiency and design of agricultural processing equipment [25,29].
However, a significant limitation in the majority of existing DEM-based agricultural research has been its primary concentration on the macroscopic dynamic characteristics of materials, such as flow patterns, forces, and power consumption [30,31,32,33], rarely establishing a direct, quantitative, and predictive link between material flow trajectory and the resultant component wear distribution. For instance, studies like Huang et al. [34], which examines centrifugal pump wear, focus on wear distribution within fluid–particle systems, but do not address agricultural soft abrasive wear mechanisms or integrate full-scale wear prediction with real-world validation. Similarly, work by Zhao et al. [35] investigates wear in mulching devices through DEM, optimizing structural parameters for minimal wear, but does not delve into the specific micro-mechanisms of soft biological abrasives like rice. Other studies, such as Wang et al. [36], analyze wear in cone crusher liners, focusing on the influence of load and sliding distance, which are distinct from a complex tribo-pair interaction with soft agricultural materials. The challenge of accurately predicting “component wear” from “material flow” using computational simulation, particularly under complex and often harsh agricultural operating conditions, remains a significant and largely unresolved issue that prevents comprehensive design optimization.
From a mechanistic standpoint, research into agricultural machinery wear has conventionally focused heavily on abrasive wear caused by hard, exogenous abrasives like soil and sand, which are typically much harder than common engineering steels [37,38]. While this remains a critical aspect of wear in agricultural environments, the wear mechanisms induced by the agricultural crops themselves (i.e., biomass materials such as stalks and grains) as abrasives are considerably more complex and less understood. These biomass materials are generally categorized as “soft abrasives” because their bulk hardness is substantially lower than that of the typical metal substrates used in machinery. Nevertheless, previous studies have unequivocally demonstrated that even soft abrasives like crops can cause significant wear on metal surfaces under specific conditions, through complex mechanisms involving micro-cutting, polishing, and various tribo-chemical synergistic effects [39,40]. This is particularly pertinent to rice, a crop known for the high silica content within both its stalks and husked grains, which can act as a more potent abrasive than other “soft” crops. Despite the widespread use of commonly available engineering steels like Q235 in combine harvester manufacturing, the specific wear mechanism resulting from the tribological interaction between silica-rich rice and such steel has not been systematically investigated or elucidated at the micro-level, leaving a critical knowledge gap in the field of agri-tribology. For instance, existing studies on wear in agricultural machinery often focus on hard-particle abrasion from soil [41], or general wear prediction models [35], without detailed characterization of soft biomass-induced wear at the micro-level. Similarly, research on flexible materials in soil removal components [42] explores wear mechanisms like impact and abrasive wear but does not address the specific tribological interactions of silica-rich soft crops with steel.
For a more precise and comprehensive description and evaluation of complex wear states, modern surface metrology techniques have been increasingly introduced, notably those employing fractal dimension [43,44]. Fractal theory offers a powerful mathematical framework for the multi-scale quantitative characterization of the self-similar and intricate features inherent in irregular and complex surfaces, such as those generated by wear. In contrast to conventional, single-value roughness parameters like the arithmetic mean deviation of the profile (Ra) or root mean square roughness (Rq), fractal dimension provides a more holistic and comprehensive reflection of the geometric complexity, irregularity, and heterogeneity of a worn surface across multiple scales [45,46]. While fractal dimension has been successfully applied to characterize wear in various engineering fields, including metal cutting tools, bearings, and general material science, its detailed application to analyzing the subtle yet significant morphological changes induced by soft agricultural abrasive wear remains underexplored. Leveraging fractal analysis in this context could offer a more sensitive and objective quantitative tool for assessing wear severity and machine health in agricultural applications. Current applications of fractal analysis to wear, as seen in Wang et al. [36], primarily focus on traditional abrasive wear in industrial settings, rather than the unique challenges posed by agricultural soft abrasives. Likewise, studies on ice-induced wear in marine vessels [47] use DEM-CFD coupling for wear prediction, but their focus is on hard ice particles and macroscopic wear, not micro-level characterization of soft biological abrasives with fractal geometry.
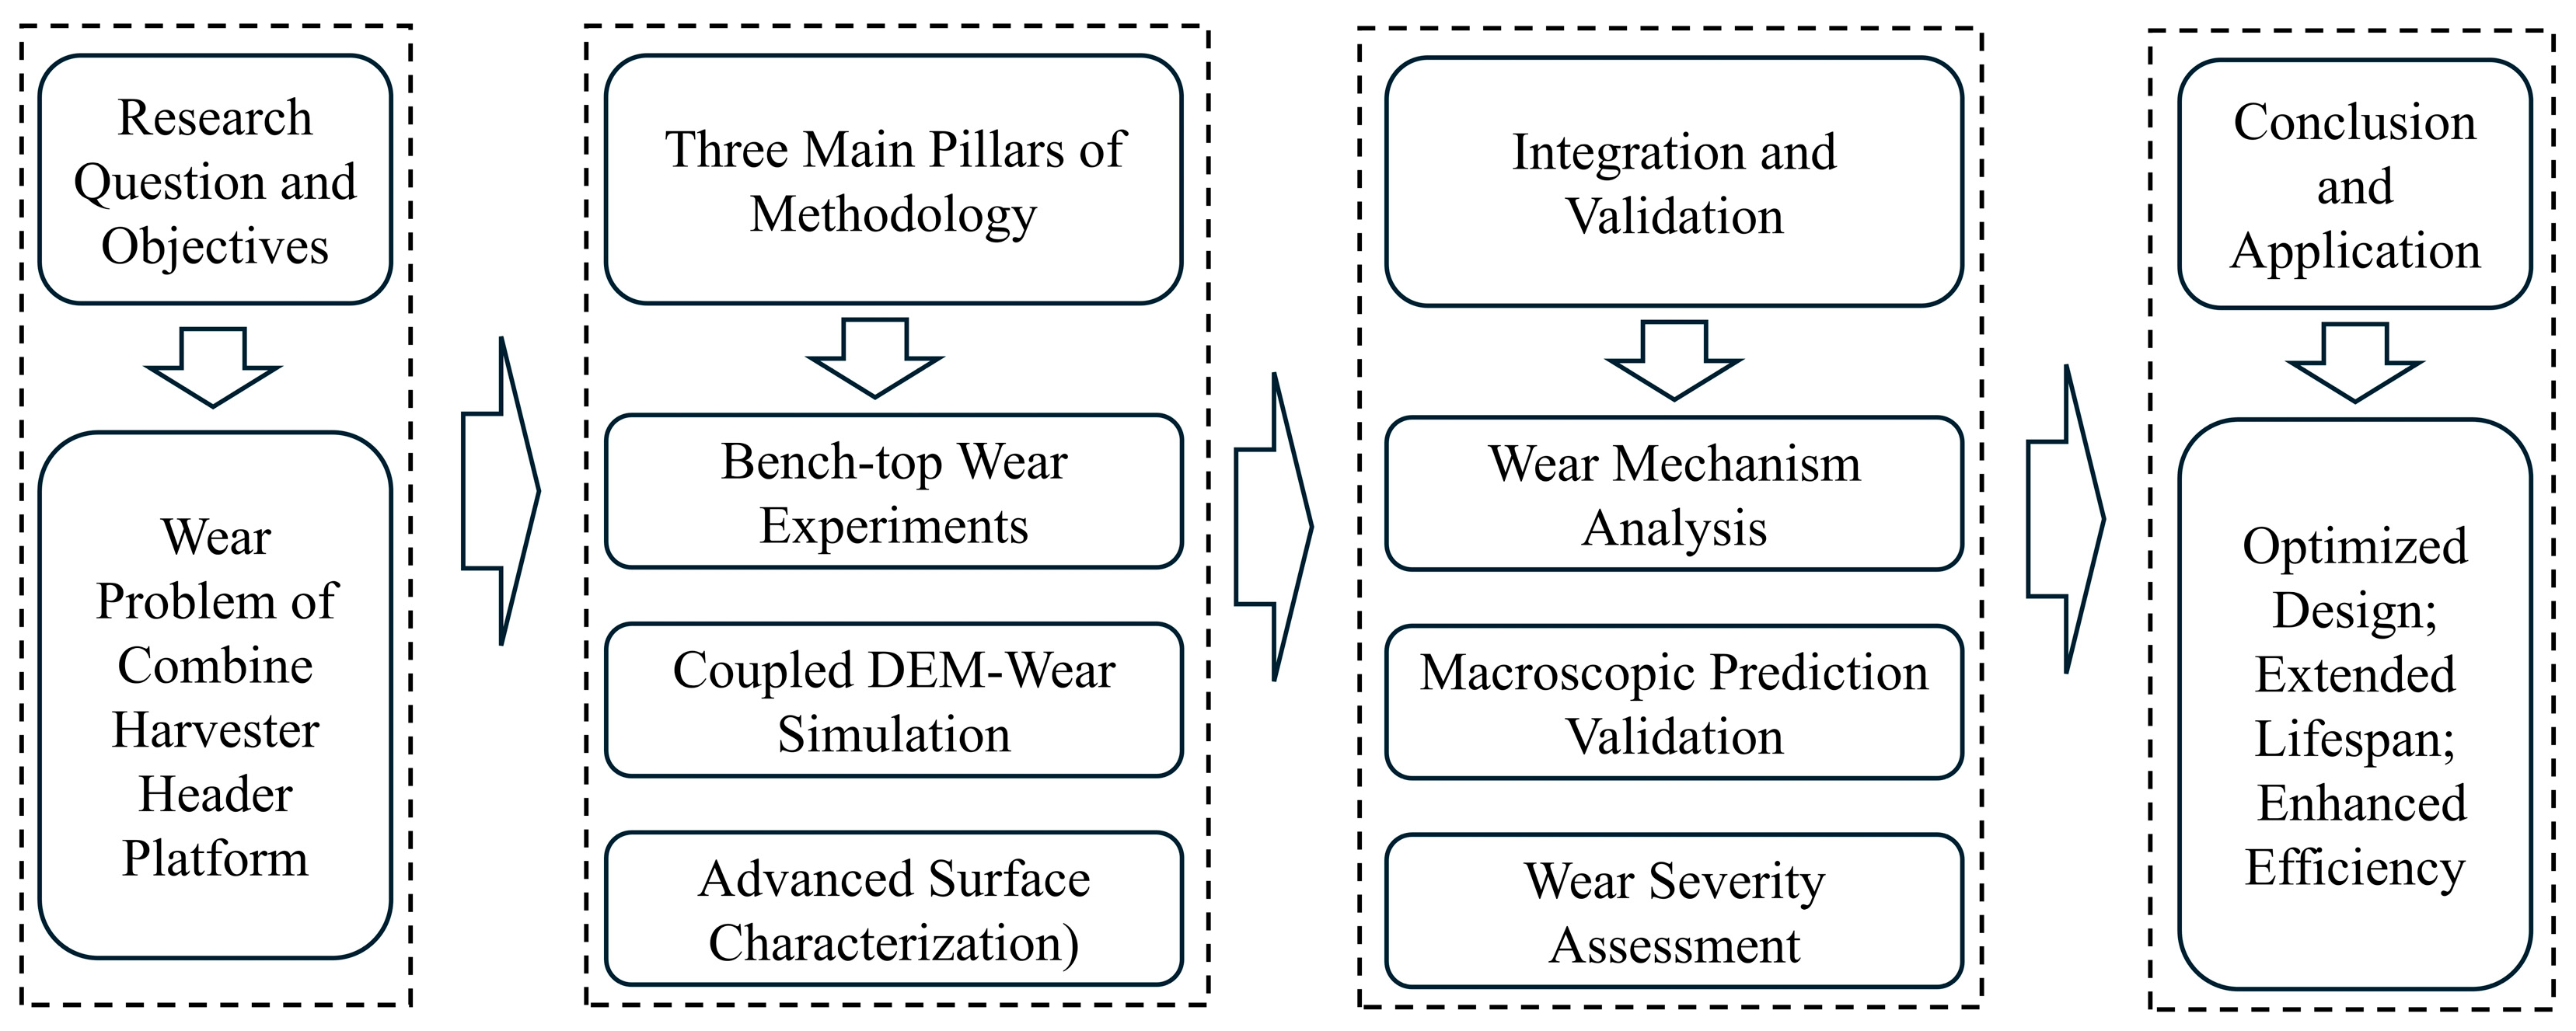
To comprehensively address these aforementioned research gaps and to provide a novel, integrated understanding of sustainable agricultural machinery design, this study systematically investigates the wear problem of the combine harvester header platform during rice harvesting. We employ a rigorous multi-scale framework that synergistically integrates bench-top experimentation, advanced coupled Discrete Element Method (DEM)-Wear simulation, and sophisticated surface characterization techniques. The overall multi-fidelity research framework and the interconnections between its main components are illustrated in Figure 1 for a clearer understanding of the investigation’s steps. The primary scientific contributions and novelty of this paper, in comparison to the existing literature, are multi-fold:
(1) For the first time, we systematically elucidate the complex soft abrasive wear mechanism of the rice–steel tribo-pair through rigorous bench tests. This fundamental understanding is crucial for guiding targeted material selection, surface engineering, and the development of more wear-resistant components in agricultural machinery design. Unlike previous studies that focus on hard particle wear or general wear prediction, this research specifically identifies and characterizes the transition from mechanical polishing to soft abrasive micro-cutting primarily driven by rice’s intrinsic silica particles, filling a critical knowledge gap in agri-tribology.
(2) We develop and validate a novel coupled Discrete Element Method (DEM)-Wear model, featuring a rigorously calibrated flexible rice stalk model. This model is capable of accurately predicting macroscopic wear “hot spots” on full-scale agricultural components, demonstrating excellent predictive fidelity and geometric similarity with real-world wear profiles observed on in-service combine harvesters. This provides agricultural engineers with a powerful, cost-effective digital tool for proactive design optimization and precise service life assessment, ultimately enhancing machinery reliability and significantly reducing operational costs for farmers. This is a significant advancement over existing DEM agricultural simulations, which primarily focus on material flow dynamics without establishing a direct, validated link to component wear prediction, particularly for complex full-scale agricultural machinery interacting with flexible biological materials. Furthermore, unlike studies using DEM-CFD for wear in other systems, this work specifically develops a robust flexible rice stalk model and validates its macroscopic wear predictions against real-world agricultural machinery.
(3) This research successfully introduces and verifies fractal dimension as a robust quantitative metric for assessing the severity of agricultural soft abrasive wear. The study demonstrates that fractal dimension (Ds) is a sensitive indicator of wear severity, increasing significantly from approximately 2.17 on unworn surfaces to 2.3156 in the most severely worn regions, which directly correlates with the observed transition in wear mechanisms. This validated methodology offers a powerful digital tool for agricultural engineers, enabling the optimization of combine harvester component design, accurate prediction of service life, and ultimately enhancing the efficiency, reliability, and sustainability of rice harvesting operations. This novel application establishes fractal dimension as a refined method for characterizing topographical changes induced by soft agricultural abrasive wear, providing a more sensitive and objective tool than conventional roughness parameters, which is largely unexplored in this specific context. This goes beyond the typical use of fractal analysis in industrial wear, focusing on subtle yet significant morphological changes due to soft biological abrasives.

2. Materials and Methods

2.1. Bench Wear Test and Wear Mechanism Analysis

To investigate the fundamental wear mechanism governing the interaction between rice and metal surfaces under controlled conditions, a bench-top reciprocating wear test was designed and conducted.

2.1.1. Experimental Apparatus and Materials

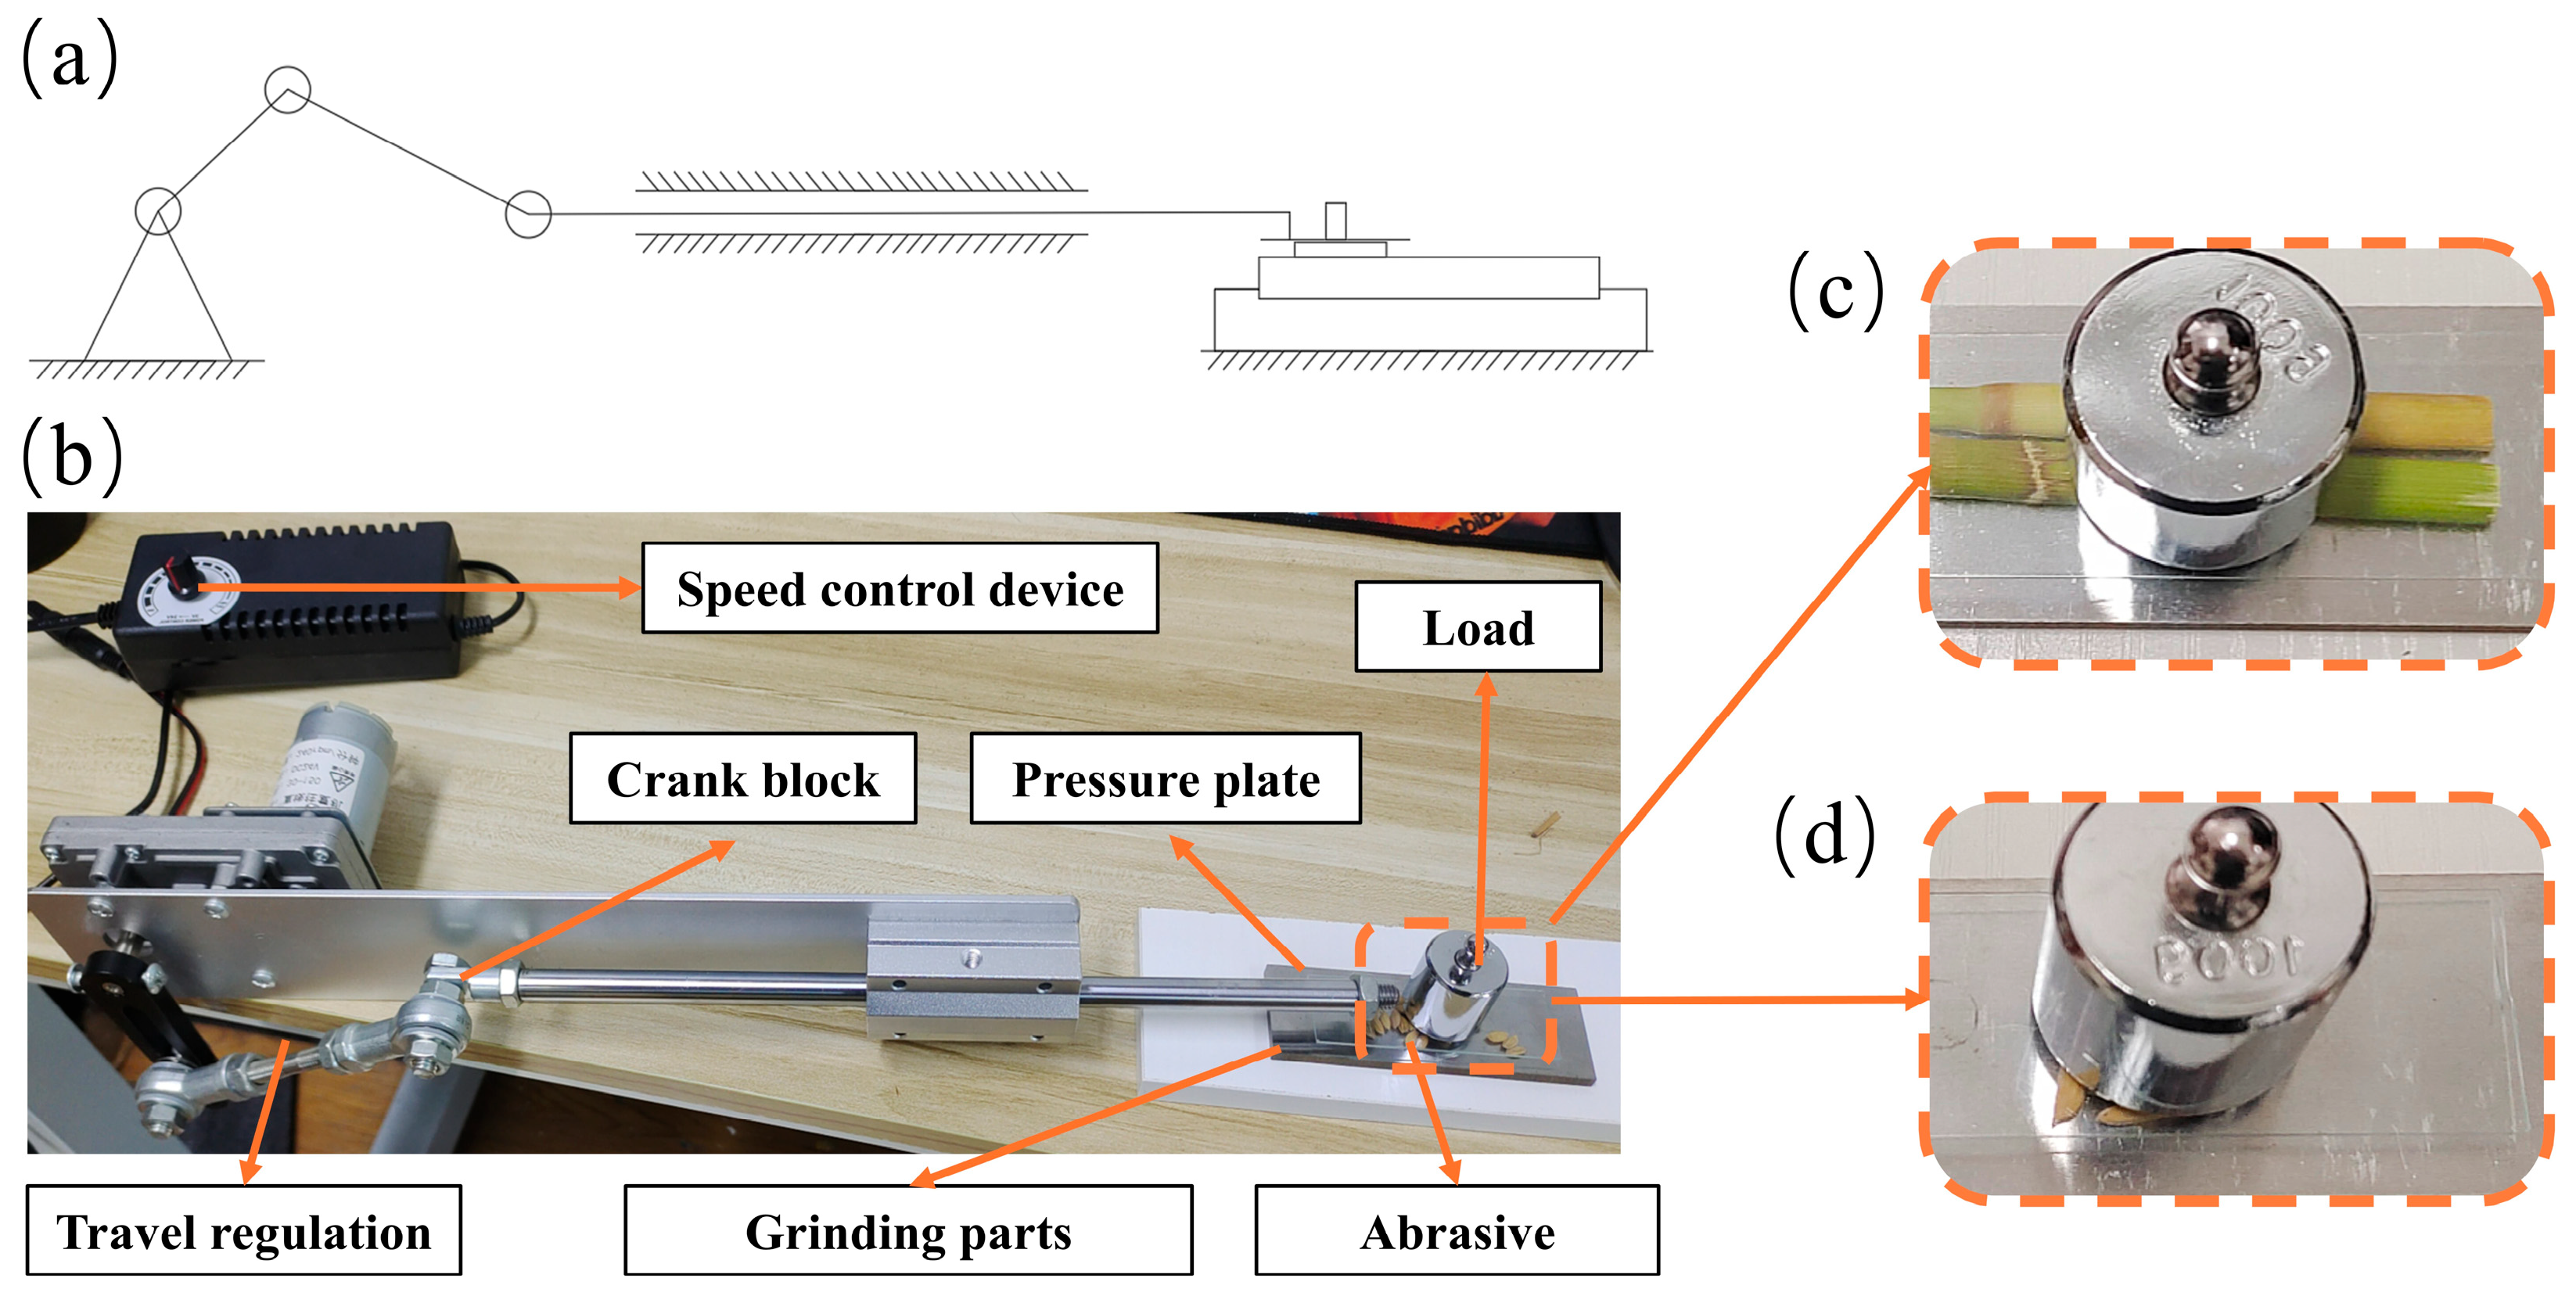
The experiment was performed on a custom-built crank-slider reciprocating wear tester, as depicted in Figure 2. This apparatus utilizes an electric motor to drive a crank, which induces linear reciprocating motion in a slider to simulate the relative sliding between the abrasive material and the specimen. The test load was applied by placing standard weights on the slider.
The wear specimen used in the experiment was a Q235 steel plate, with dimensions of 100 mm × 33.3 mm and a surface hardness of 165 HB. The abrasive material was fresh rice (variety: Nanjing 46) collected from Jiangsu Province, China, and was divided into two groups for testing: stalks and grains. The rice stalks were cut into 50 mm long segments with diameters ranging from 3 to 5.5 mm. The grains exhibited major and minor axis dimensions in the ranges of 6.65–8.21 mm and 2.52–3.25 mm, respectively.
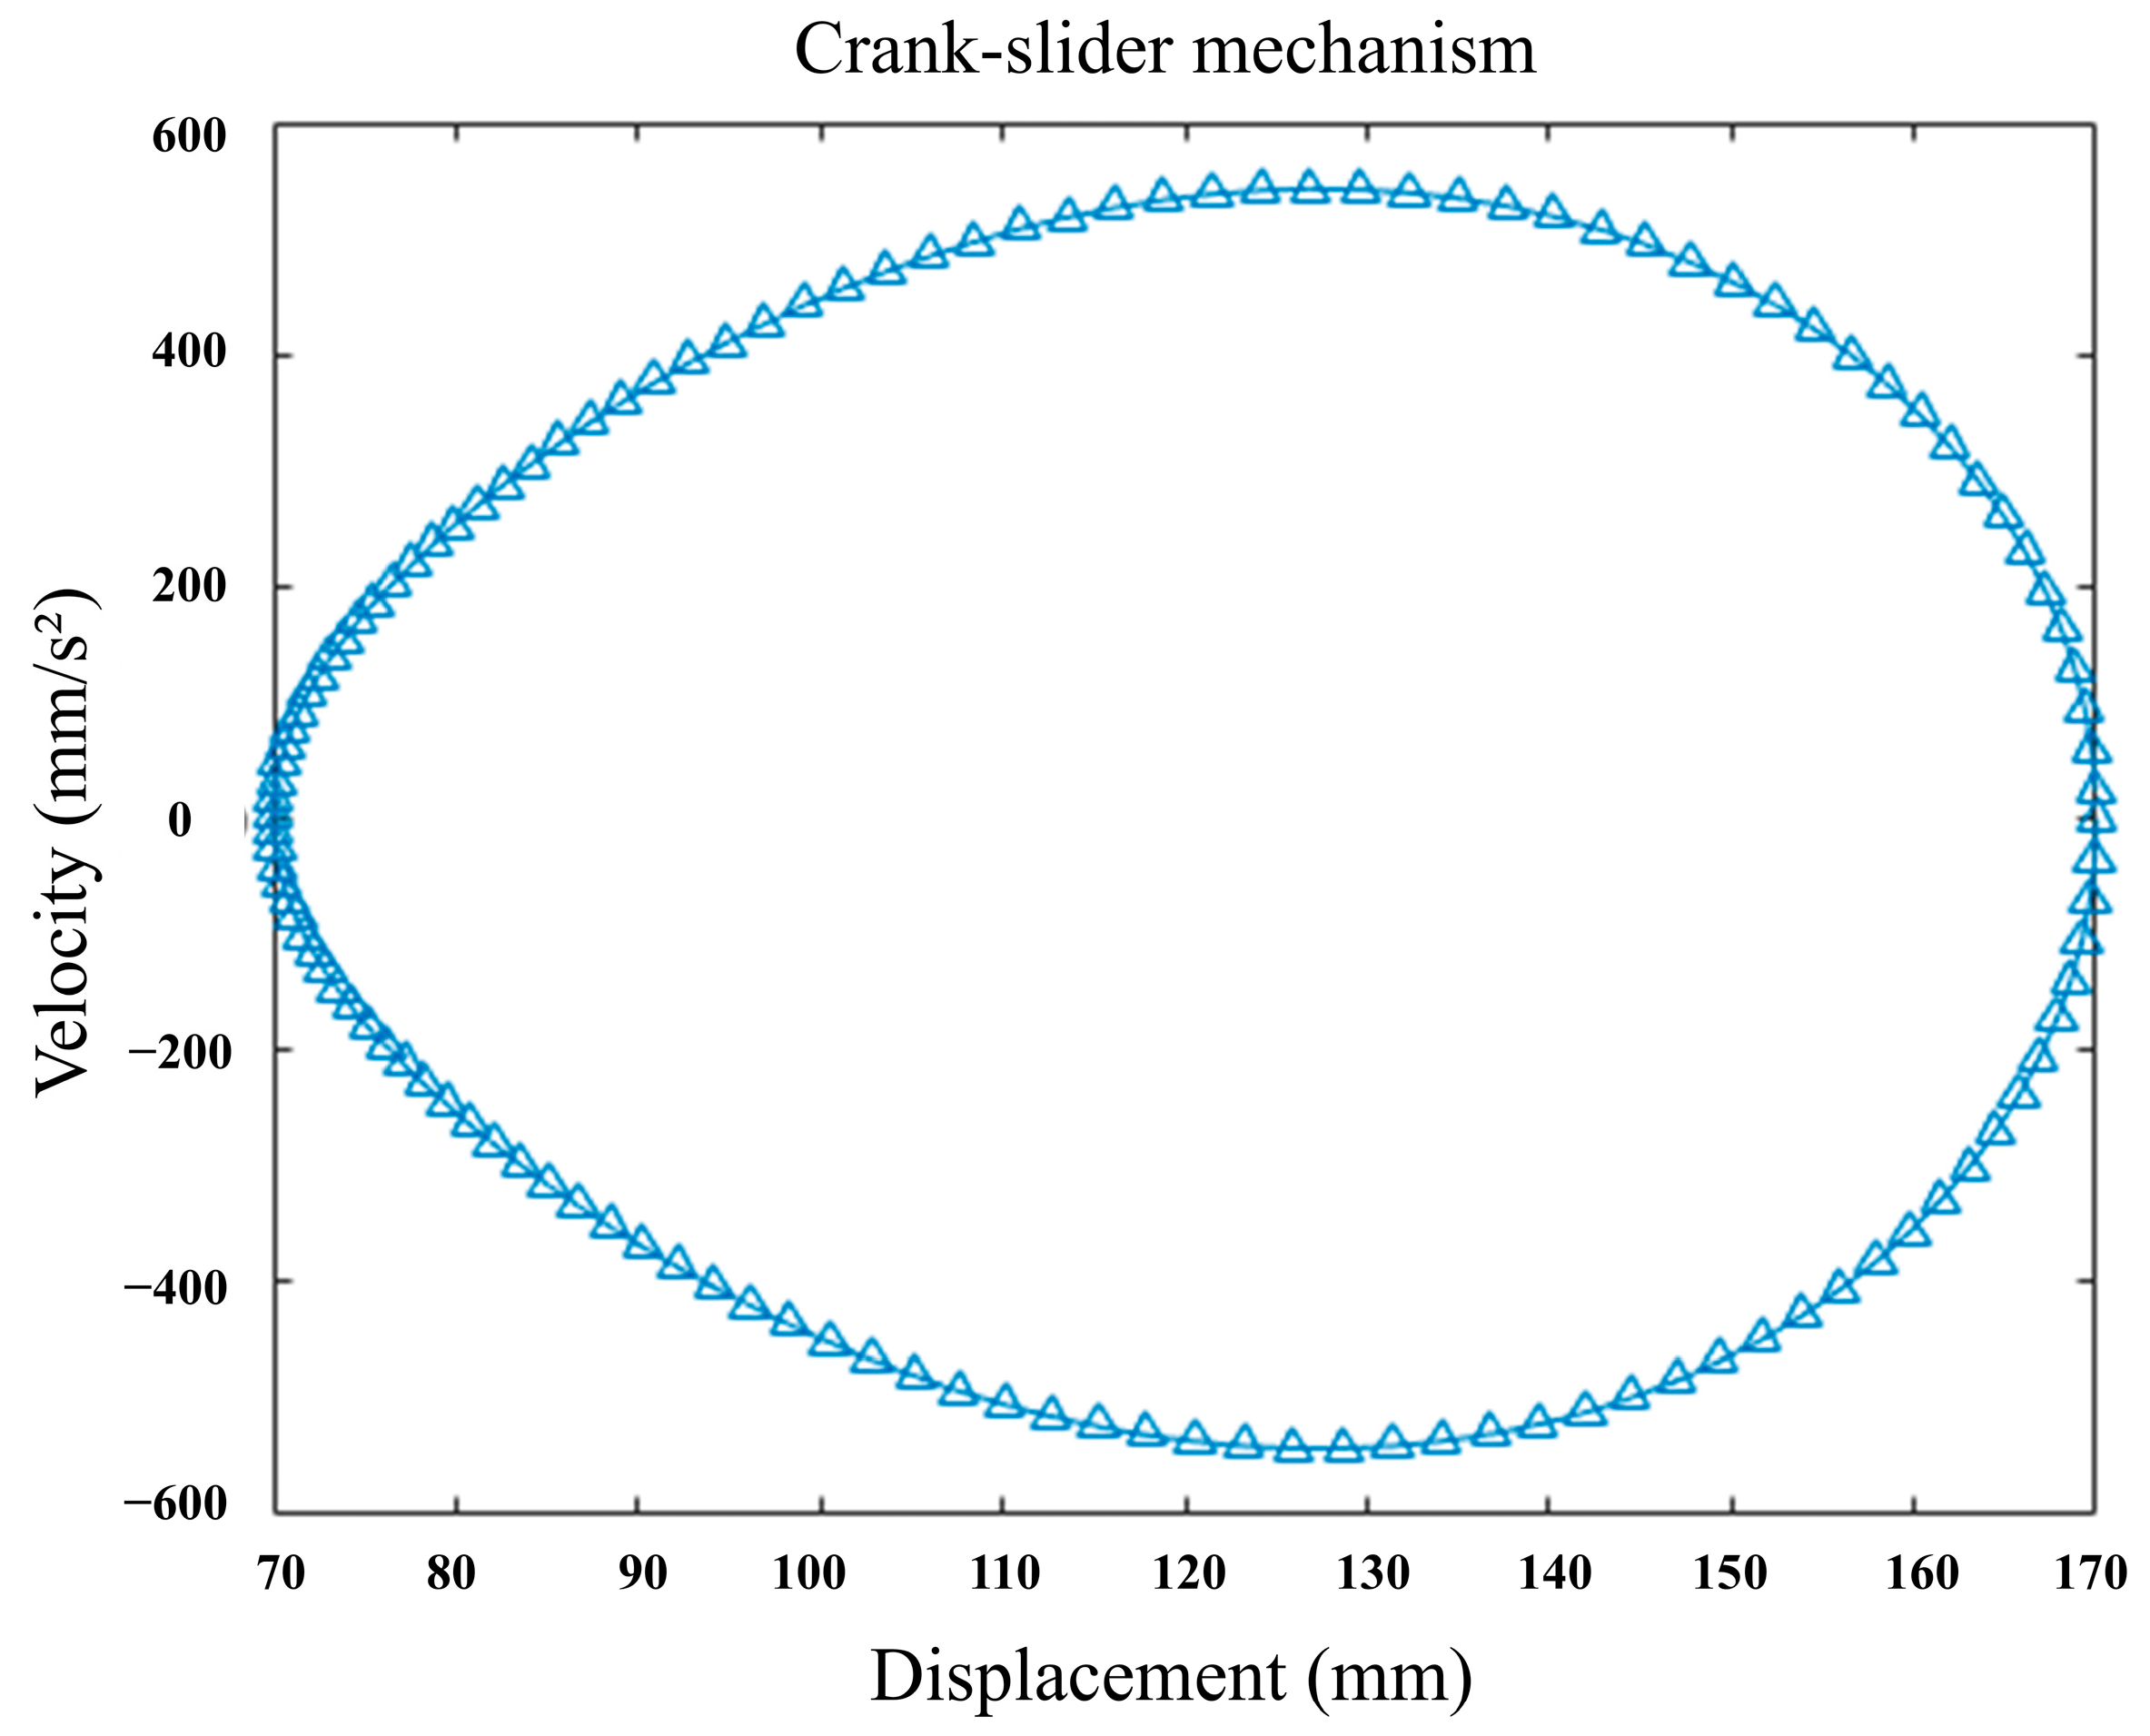
Due to the kinematics of the crank-slider mechanism, the velocity and displacement of the slider are inherently non-uniform and vary with the crank angle. The relationship between the slider’s velocity and displacement is illustrated in Figure 3. As the slider moves from its proximal to its distal end, its velocity increases with displacement while its acceleration gradually decreases. For a representative setting, a maximum velocity of 542.62 mm/s is reached at a displacement of x = 57.44 mm. After proportional scaling, the nominal average sliding velocities for the experiment were set to 340.94 mm/s, 681.87 mm/s, and 1022.81 mm/s. The contact load was applied and adjusted by placing standard weights on the slider.
Wear on the metal surface was induced using rice stalks and grains as the abrasive media. An orthogonal array was used to design the experiment, with load and sliding velocity selected as the factors. Each factor was set at three levels. The specific levels and their corresponding designations are presented in Table 1.
To mitigate the influence of extraneous factors, all Q235 steel plates were ultrasonically cleaned in acetone prior to each experiment to remove any surface contaminants. The specimen and the designated sampling points are illustrated in Figure 4a. After this pre-treatment, the mass of each specimen was measured three times using an analytical balance (as shown in Figure 4b), and the average value was recorded. The mass of the specimen was measured again following the completion of the wear test. The mass loss due to wear was determined as the difference in the specimen’s mass before and after the experiment.

2.1.2. Experimental Design and Procedure

To determine a suitable range for the experimental loads, an in situ measurement of the pressure on the header platform of a crawler-type combine harvester was first conducted during actual field operation (Figure 5). By mounting thin-film pressure sensors (DF9-40) at key locations on the bottom plate, it was determined that the contact pressure in most areas was less than 0.2 N. Informed by this result, three normal load levels were established for the bench test: 0.05 N, 0.5 N, and 1 N (corresponding to 5 g, 50 g, and 100 g weights, respectively). The decision to select load levels of 0.5 N and 1 N, which are higher than those measured in the field, was primarily based on two considerations:
Firstly, this approach facilitates an accelerated wear test. By applying moderately increased loads under laboratory conditions, a significant and measurable amount of wear can be generated within a reasonable experimental duration (240 h), thereby enabling an effective differentiation of wear behavior under the various conditions.
Secondly, employing a broader load range allows for a more comprehensive investigation into how the wear mechanism evolves with changes in load, rather than merely replicating a single, typical operating condition. This is crucial for gaining a deeper understanding of the fundamental nature of the wear behavior.
Concurrently, to investigate the effect of sliding velocity, three rotational speed levels were set at 60, 120, and 180 rpm. Based on the kinematics of the crank-slider mechanism (Figure 3), the slider’s velocity is non-uniform. The nominal average sliding velocities corresponding to these rotational speeds were calculated as 340.94 mm/s, 681.87 mm/s, and 1022.81 mm/s, respectively. The constant process parameters, which were maintained throughout the bench wear tests, are summarized in Table 2.
An L9 orthogonal array was employed for the experimental design, resulting in a total of nine test runs under different conditions. The total duration for each test run was 240 h. The experiment was paused at 60 h intervals to replace the used abrasive material (rice stalks or grains) with a fresh supply. This procedure was implemented to simulate a continuous wear process and to mitigate any potential influence of abrasive degradation on the experimental results.

2.1.3. Measurement and Characterization

The amount of wear was quantified by measuring the mass loss of the Q235 steel plate before and after the experiment. Mass measurements were performed using an electronic balance (BS-224S) with a precision of 0.1 mg; each measurement was repeated three times to obtain an average value and its corresponding standard deviation, reflecting the inherent variability of the measurements. The micro-morphology of the worn surfaces was observed using a 3D digital microscope (Keyence VHX-900f, Keyence, Osaka, Japan). This instrument is capable of acquiring high-resolution, depth-composed images and 3D surface profile data, which were subsequently used for wear mechanism analysis and fractal dimension calculation.

2.2. Coupled DEM-Wear Simulation Model

To predict the wear distribution on the full-scale header platform, a coupled Discrete Element-Wear (DEM-Wear) model was developed within the EDEM 2020 software platform.

2.2.1. Geometry and Particle Models

The geometry model of the header platform was created using 3D CAD software according to its actual dimensions and subsequently imported into EDEM. The model primarily includes key components such as the header platform’s bottom plate and the spiral auger (outer diameter: 500 mm; pitch: 440 mm), as shown in Figure 6.
To accurately represent the long, flexible characteristics of the rice stalks, a flexible particle model was adopted. This model consists of multiple spherical particles, each with a diameter of 5 mm, arranged in a linear chain. The particles are interconnected using the Hertz–Mindlin with BondingV2 contact model, as illustrated in Figure 7. This bonding model imparts normal and tangential forces, as well as bending and torsional moments, to the connections between adjacent particles. This configuration enables the entire particle chain to realistically simulate the flexible behaviors of an actual stalk, such as tension, bending, and torsion. The rice panicle, in contrast, was simplified and modeled as a rigid cluster (clump) composed of multiple particles.

2.2.2. Calibration of Key Model Parameters

The predictive accuracy of the model is critically dependent on the precise definition of its input parameters. Key contact parameters, such as the coefficients of static and rolling friction and the modulus of elasticity, were determined through the inclined plane method and quasi-static compression tests, with the results presented in Table 3.
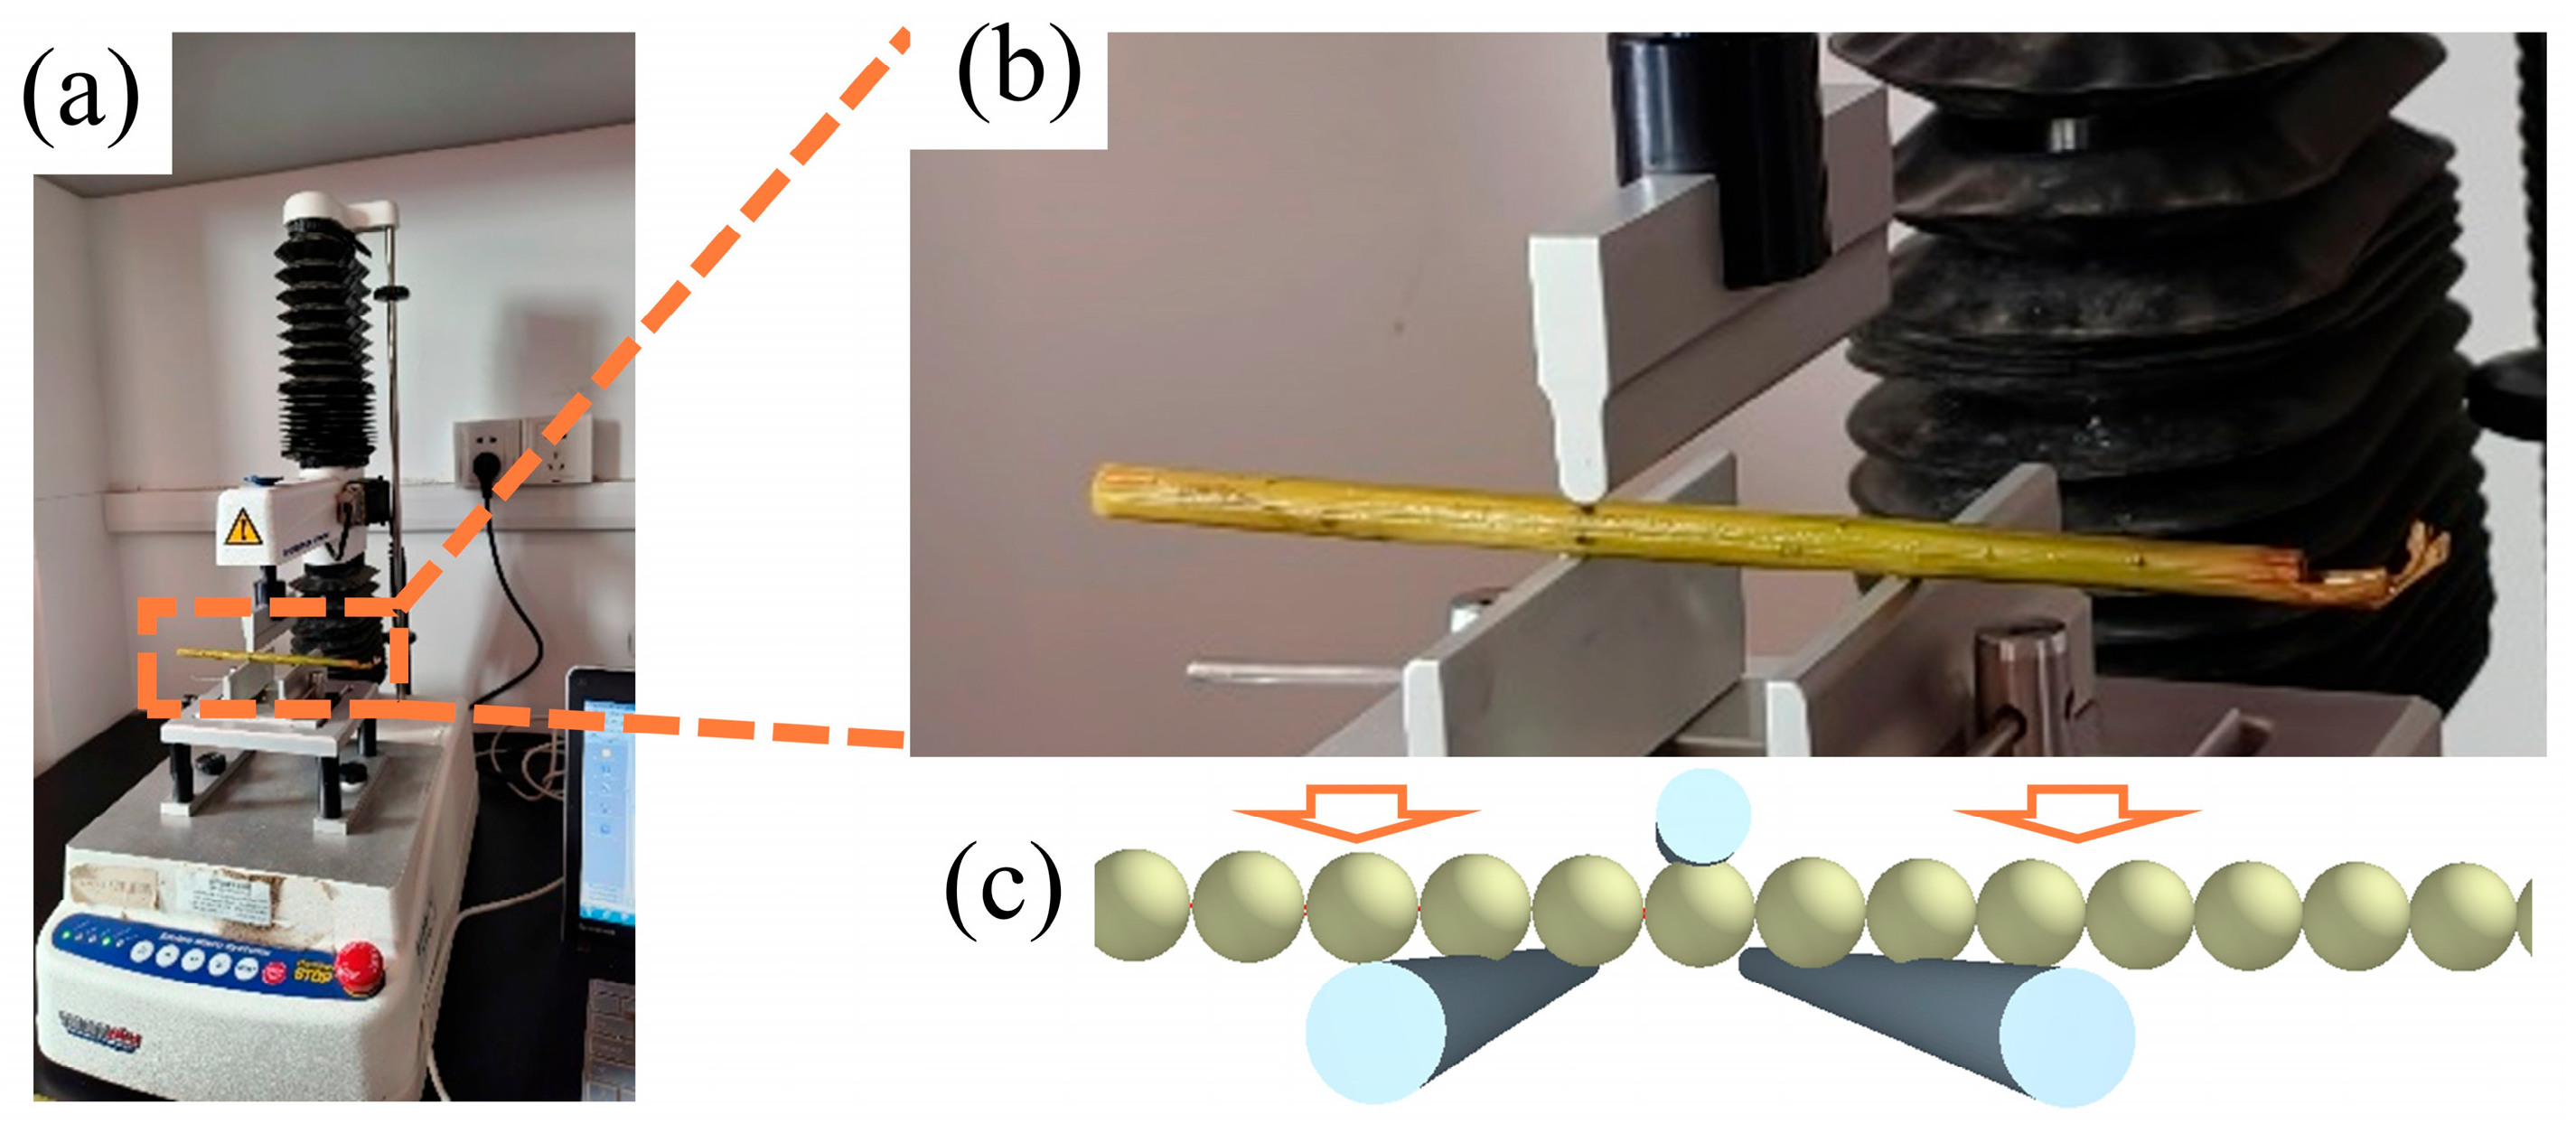
A hybrid approach, integrating physical experiments with numerical simulations, was employed to calibrate the BondingV2 connection parameters, which are critical for the flexible stalk model. First, three-point bending tests were conducted on actual rice stalks (as shown in Figure 8a,b) to obtain their force–displacement response curves. Stalk samples with a length of 100 mm were selected for these tests. The experimental setup featured two support rollers, each with a radius of 2 mm, separated by a support span of 20 mm. The central loading indenter also had a radius of 2 mm. The loading was applied at a constant velocity of 0.5 mm/s, and each test was repeated 10 times. The elastic modulus was calculated using the following formula:
E b = F L 3 48 S L
where F is the applied load (N); L is the support span (mm); S is the bending deflection of the stalk (mm); and I is the moment of inertia of the stalk’s cross-section (mm4). For a hollow circular cross-section, I is calculated as I = π/64 × [d4 − (d − 2w)4], where d is the outer diameter and w is the wall thickness of the rice stalk, both in mm.
Based on the calculations, the average elastic modulus of the stalks determined from the three-point bending tests was 2.164 GPa. A discrepancy exists between the hollow structure of a physical stalk and the solid–particle chain model adopted in the simulation for computational efficiency. The moment of inertia for the solid stalk model is calculated as I = (π/64) d4. To ensure that the model exhibits macroscopic bending behavior equivalent to that of a real stalk, the target elastic modulus for the simulation was adjusted to account for the difference in the cross-sectional moment of inertia. Following this correction, a target elastic modulus of 1.814 GPa was established for the simulation model.
Subsequently, a three-point bending simulation model, which corresponded exactly to the experimental setup, was created in EDEM (as shown in Figure 8c). Systematic optimization was then performed using Response Surface Methodology (RSM) within Design–Expert 13 software. A Central Composite Design (CCD) plan comprising 13 experimental points (as detailed in Table 4) was generated. This design facilitates the efficient exploration of the parameter space within predefined ranges: a normal stiffness range of 1 × 10¹² to 5 × 10¹² N/m3 and a tangential stiffness range of 5 × 10¹¹ to 2.5 × 10¹² N/m3.
These 13 simulation runs were executed, and the resulting equivalent elastic modulus (the response value) was recorded for each parameter combination. Regression analysis was subsequently performed on this dataset to establish a mathematical relationship between the input parameters and the response. Finally, this relationship was used to solve for the optimal parameter combination that yielded a simulated response value that most closely matched the experimental target of 1.814 GPa.

2.2.3. Wear Model and Coupling

In this study, the classic Archard wear model was integrated into the DEM simulation to calculate the amount of wear. At each simulation time step, the incremental wear depth, h i , at any given contact point i, is calculated using the following equation:
h i = k * P i / H * s i
where K is the dimensional wear constant (Pa−1), P i is the normal contact pressure at the contact point, and s i is the relative sliding distance within the time step. By accumulating the incremental wear depth on each mesh element over time, a wear distribution map of the entire component surface can be dynamically generated, thus realizing the dynamic coupling between the DEM simulation and the wear model.

2.3. Simulation Scheme and Full-Scale Validation

2.3.1. Simulation Setup

The simulation replicated the typical operating conditions of the header platform. The rotational speed of the spiral auger was set to 170 rpm. Material feeding was implemented using a particle factory with a feed rate of 8 kg/s. To investigate the effect of cutting width, different scenarios, including full cutting width (2200 mm) and half cutting width, were simulated.

2.3.2. Real-World Wear Profile Mapping and Similarity Assessment

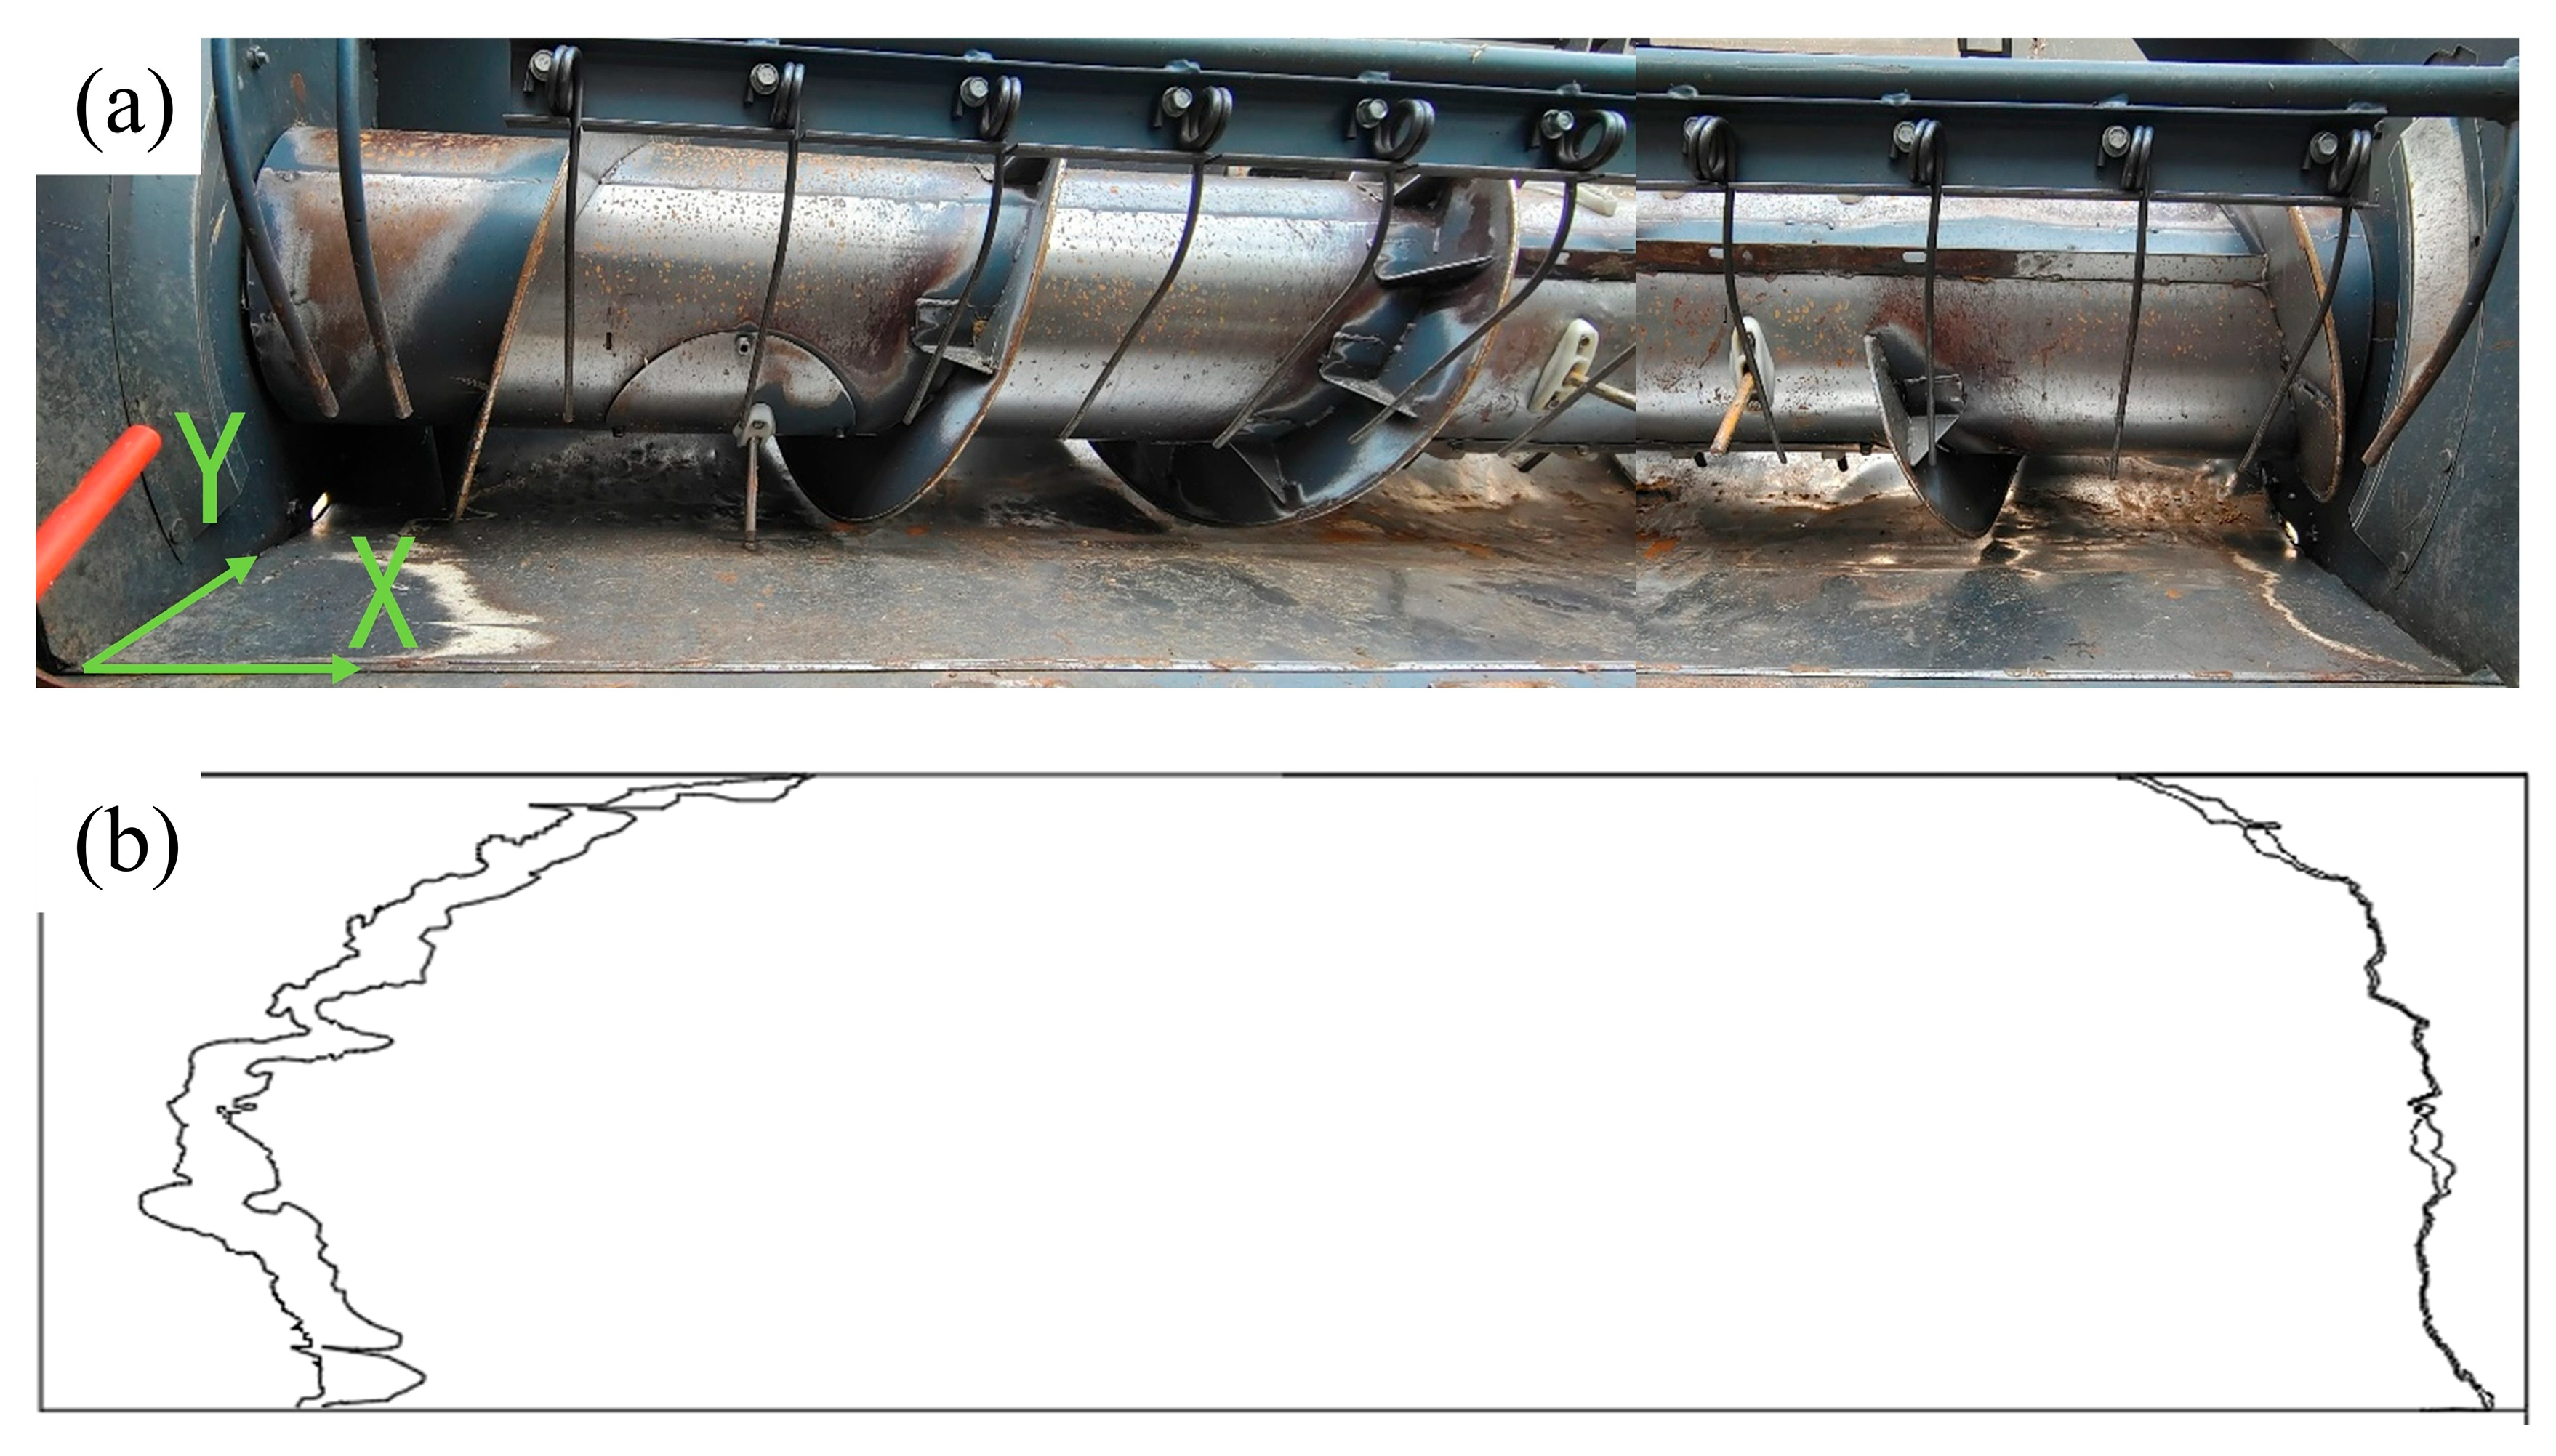
To validate the predictive capability of the simulation model, a field mapping was conducted on a header platform of the same model that had been in long-term service (approximately 1300 h), as shown in Figure 9a. The boundary profile formed by wear on its bottom plate was precisely measured using a measuring tape and an angle protractor. The measured 3D coordinate points were then projected onto a 2D plane to generate a curve representing the actual wear profile, as illustrated in Figure 9b.
To quantitatively compare the geometric similarity between the simulated prediction and the measured real-world profile, two metrics suitable for sequence comparison were introduced:
(1) Levenshtein Distance: After discretizing the profile curves into sequences of points, this metric calculates the minimum number of single-point edit operations (insertion, deletion, or substitution) required to transform one sequence into the other. A lower distance value signifies a greater similarity in the detailed shapes of the two profiles.
(2) Hamming Distance: This metric applies to two sequences of equal length. After converting the profile sequences into representative hash strings, the Hamming distance is computed as the number of positions at which the corresponding characters differ. A lower value indicates a greater similarity in the global structure of the two profiles.

2.4. Fractal Dimension Characterization of Worn Surfaces

To quantitatively characterize the complexity of the worn surfaces from a more fundamental perspective, this study employed methods from fractal geometry.

2.4.1. Fractal Dimension Calculation Method

The differential box-counting (DBC) method was used to calculate the fractal dimension (Ds) of the worn surfaces. The DBC method is an algorithm widely utilized for the analysis of images and 3D surfaces [48]. This method involves partitioning the 3D space that encompasses the surface data into a grid of cubic boxes of side length r. By counting the number of boxes, N(r), that contain at least one surface data point for a range of scales r, a relationship between N(r) and r can be established. According to fractal theory, for a fractal surface, these two quantities exhibit a linear relationship on a double-logarithmic plot, as described by the following equation:
D = lim τ 0 log ( M ) log ( τ )
n r ( i , j ) = ceil ( ( l k ) / h )
N r = i , j n r ( i , j )
D s = lim r 0 log N r log ( 1 / r )
where D is the fractal dimension; M is a measure related to the calculation method; τ is the corresponding scale; ceil is the ceiling function, which rounds a number up to the next greatest integer; and N is the number of boxes required to cover the surface morphology at a given scale τ.

2.4.2. Algorithm Validation and Application

To ensure the accuracy and reliability of the DBC algorithm for its application to the experimental data, a systematic validation was first conducted through a standard procedure. This validation was achieved by generating Weierstrass–Mandelbrot (W-M) function surfaces, which have known analytical fractal dimensions, and then comparing the computational results from the algorithm with the theoretical values. The function is given by the following expression:
z ( x , y ) = L G L D 2 ln γ M 0 1 / 2 m = 1 M n n = n i M max γ ( D 3 ) n cos ϕ m , n cos 2 π γ n x 2 + y 2 1 / 2 L cos tan 1 y x π m M 0 + ϕ m , n
where z(x, y) is the profile height of the fractal surface; L is the sample length; G is a height scaling parameter; D is the fractal dimension; γ is a frequency density parameter; M is the number of superimposed ridges on the surface; Mmax and nmax are the lower and upper frequency indices, respectively (typically n1 = 0); m ,   n represents the random phases, which are uniformly distributed in the range [0, 2π]; and Ls is the cutoff length.
Where nmax can be expressed as:
n max   =   int   log ( ( L Ls ) / log γ )
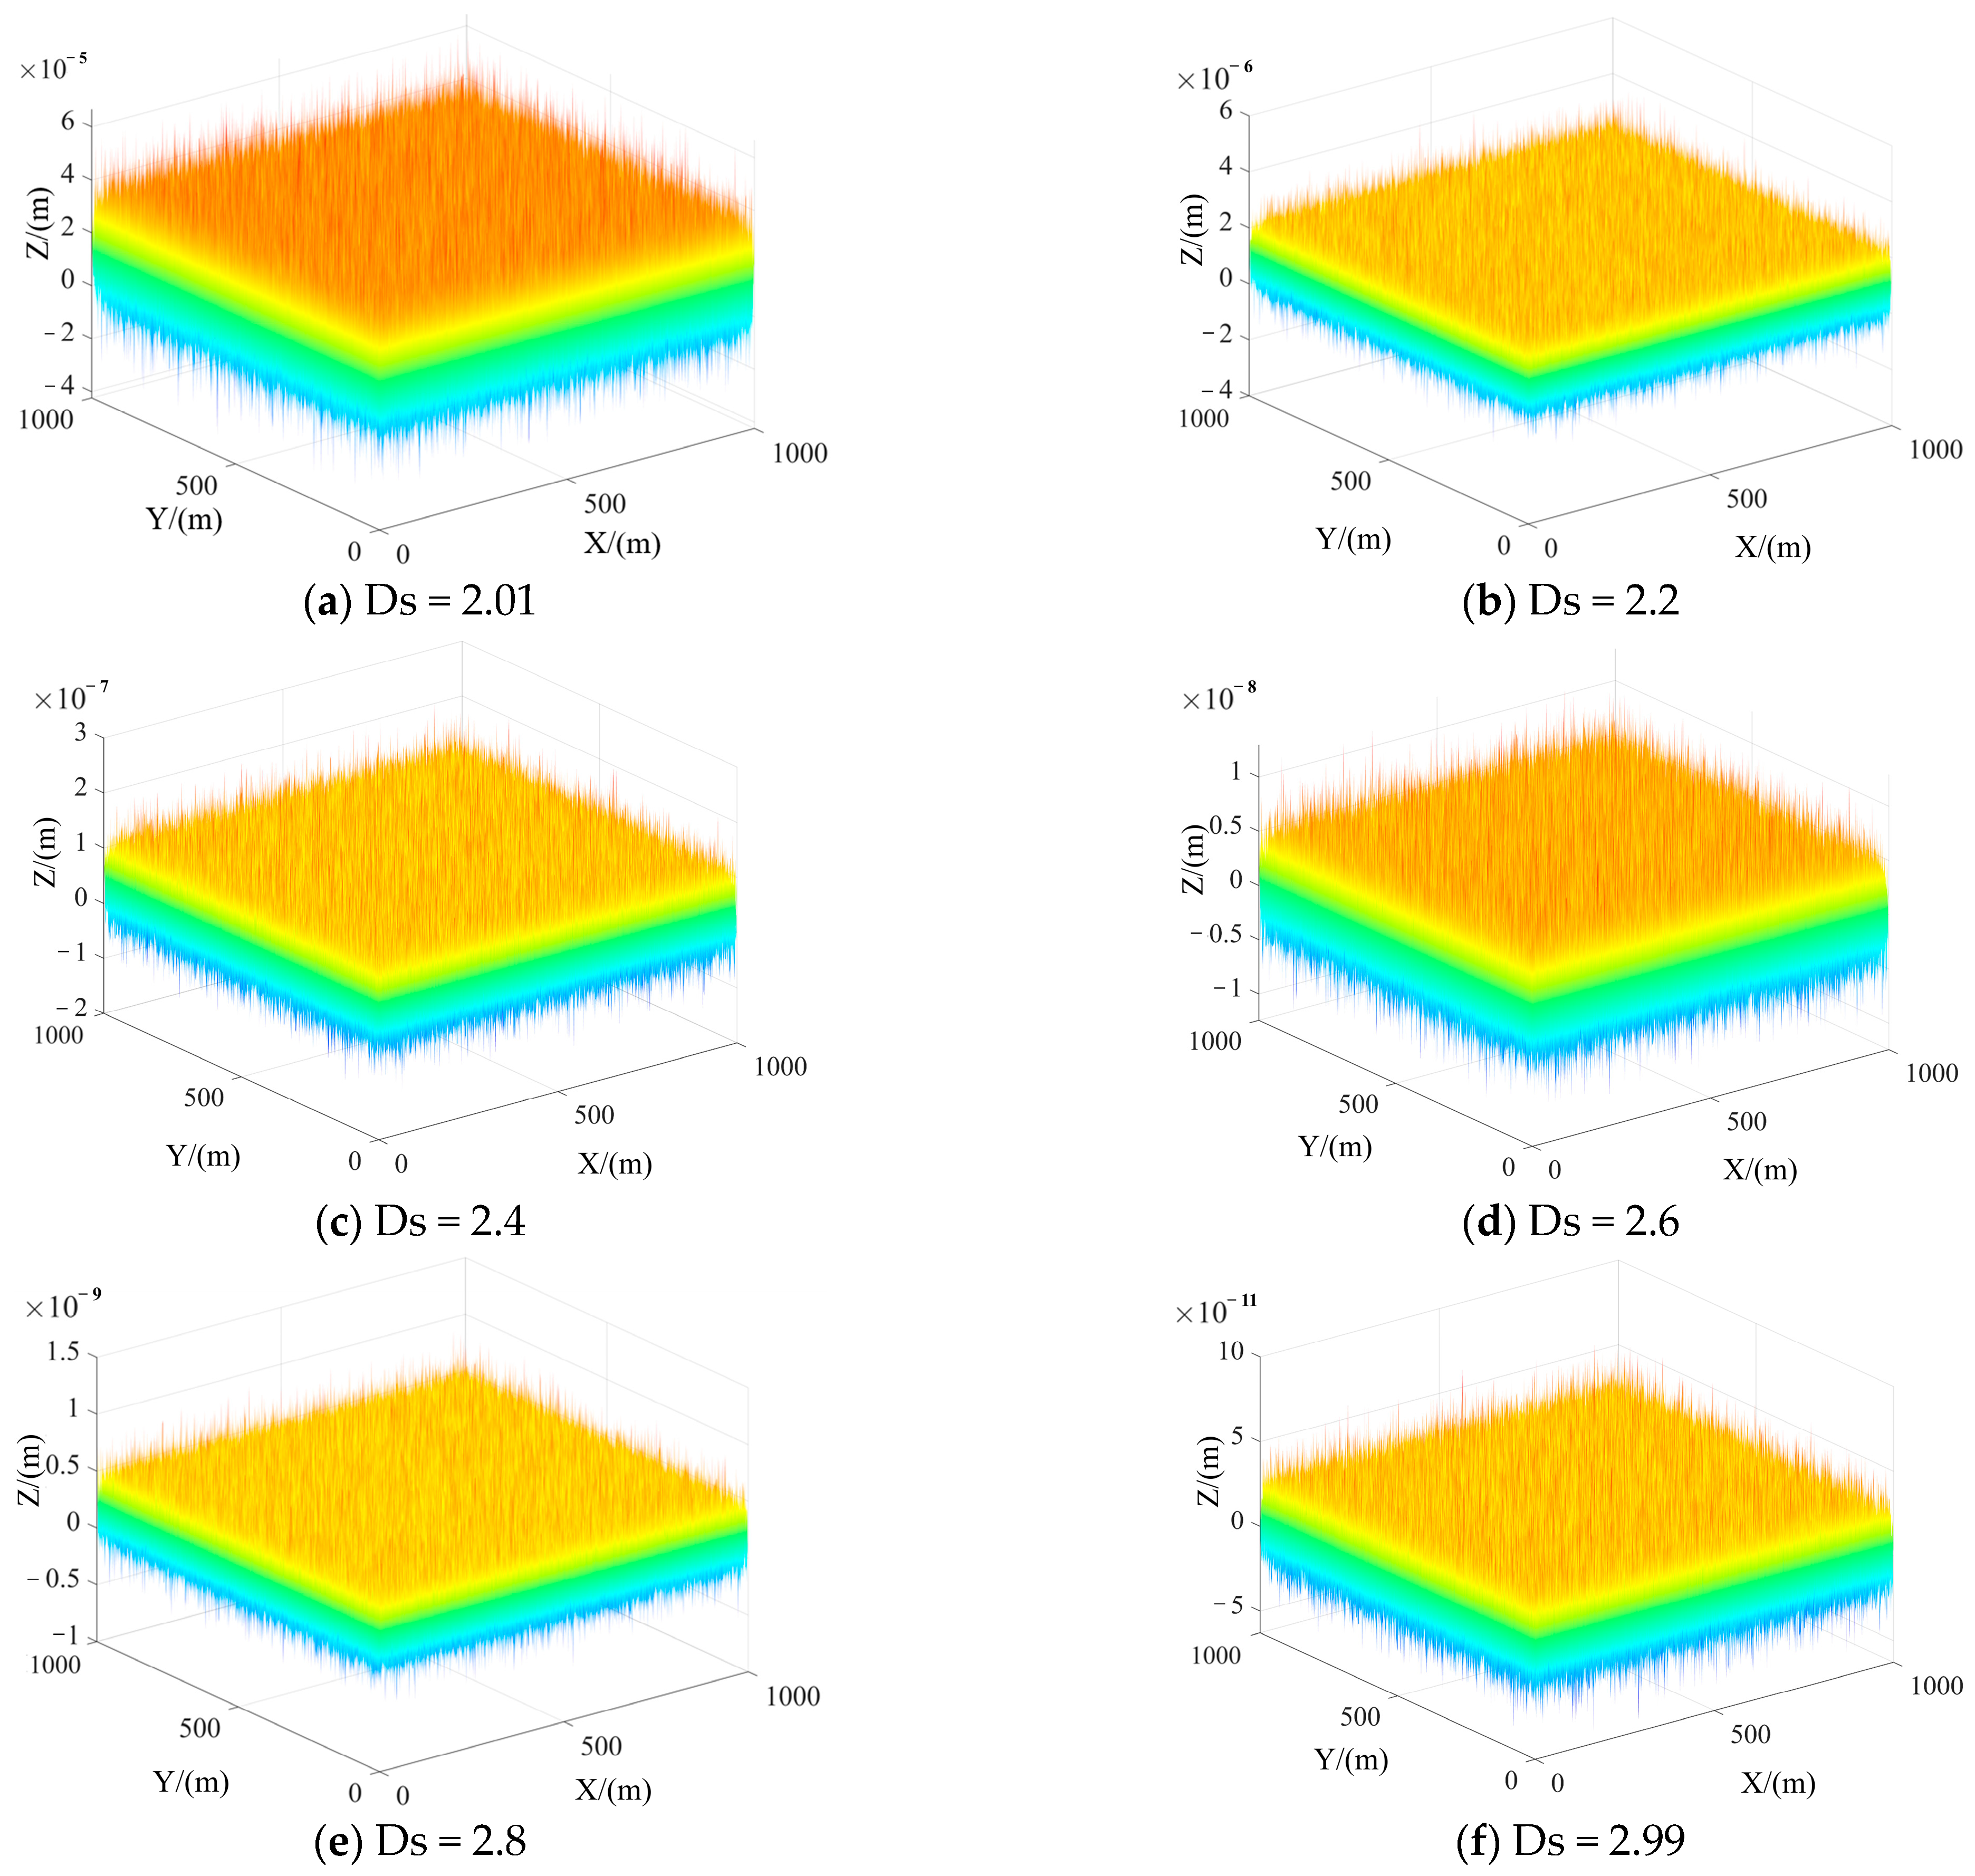
For this validation, a series of 11 standard W-M test surfaces was generated using MATLAB, with theoretical fractal dimensions (Ds) ranging from 2.01 to 2.99 at intervals of 0.1. The specific parameters used for generation were a spatial domain of 0 to 1000 for both x and y coordinates; G = 1 × 10⁻¹¹; γ = 1.5; M = 10; Ls = 2 × 10⁻⁵ m; n1 = 0; and random phases (Φm,n) uniformly distributed in the range [0, 2π]. Figure 10 visually depicts several of these W-M surfaces with representative fractal dimensions, clearly illustrating that, as the fractal dimension Ds increases, the complexity and irregularity of the surface are correspondingly enhanced.
Calculations were performed using MATLAB 2024a to generate the 3D fractal surfaces. Since integer fractal dimensions represent non-fractal geometries (e.g., D = 2 for a smooth plane), the theoretical fractal dimension (Ds) was varied from 2.01 to 2.99 at intervals of 0.1 to create a series of test surfaces. The specific parameters used for the W-M function were a spatial domain of 0 to 1000 for both x and y coordinates, G = 1 × 10⁻¹¹, γ = 1.5, M = 10, Ls = 2 × 10⁻⁵ m, n1 = 0, and random phases (φm,n) uniformly distributed in [0, 2π].
These parameters were implemented in MATLAB, and the corresponding data was used to generate the 3D fractal surfaces. As shown in Figure 10, surfaces were created for Ds values of 2.01, 2.2, 2.4, 2.6, 2.8, and 2.99. The results indicated that when the theoretical fractal dimension was in the range of 2.3 to 2.4, the relative error of our computational algorithm was less than 1%, thereby confirming its reliability. Subsequently, this validated algorithm was applied to the surface data acquired from the worn specimens by the 3D digital microscope in the bench tests. The fractal dimension of each surface was calculated to quantitatively analyze the effect of wear on the geometric complexity of the surface topography.
The results of applying our DBC algorithm to these 11 standard surfaces are presented in Table 5, which compares the calculated values with their theoretical counterparts. The validation results demonstrate the high accuracy of the algorithm. Of particular note, when the theoretical fractal dimension was within the range of 2.3 to 2.4, the algorithm’s relative computational error was less than 1%. Since this range is comparable to the complexity of the actual worn surfaces investigated in this study, this result fully validates the reliability and effectiveness of the DBC algorithm for its subsequent application to the analysis of actual worn topographies.

3. Results and Discussion

3.1. Wear Mechanism of Q235 Steel Induced by Rice

3.1.1. Macroscopic Wear Behavior

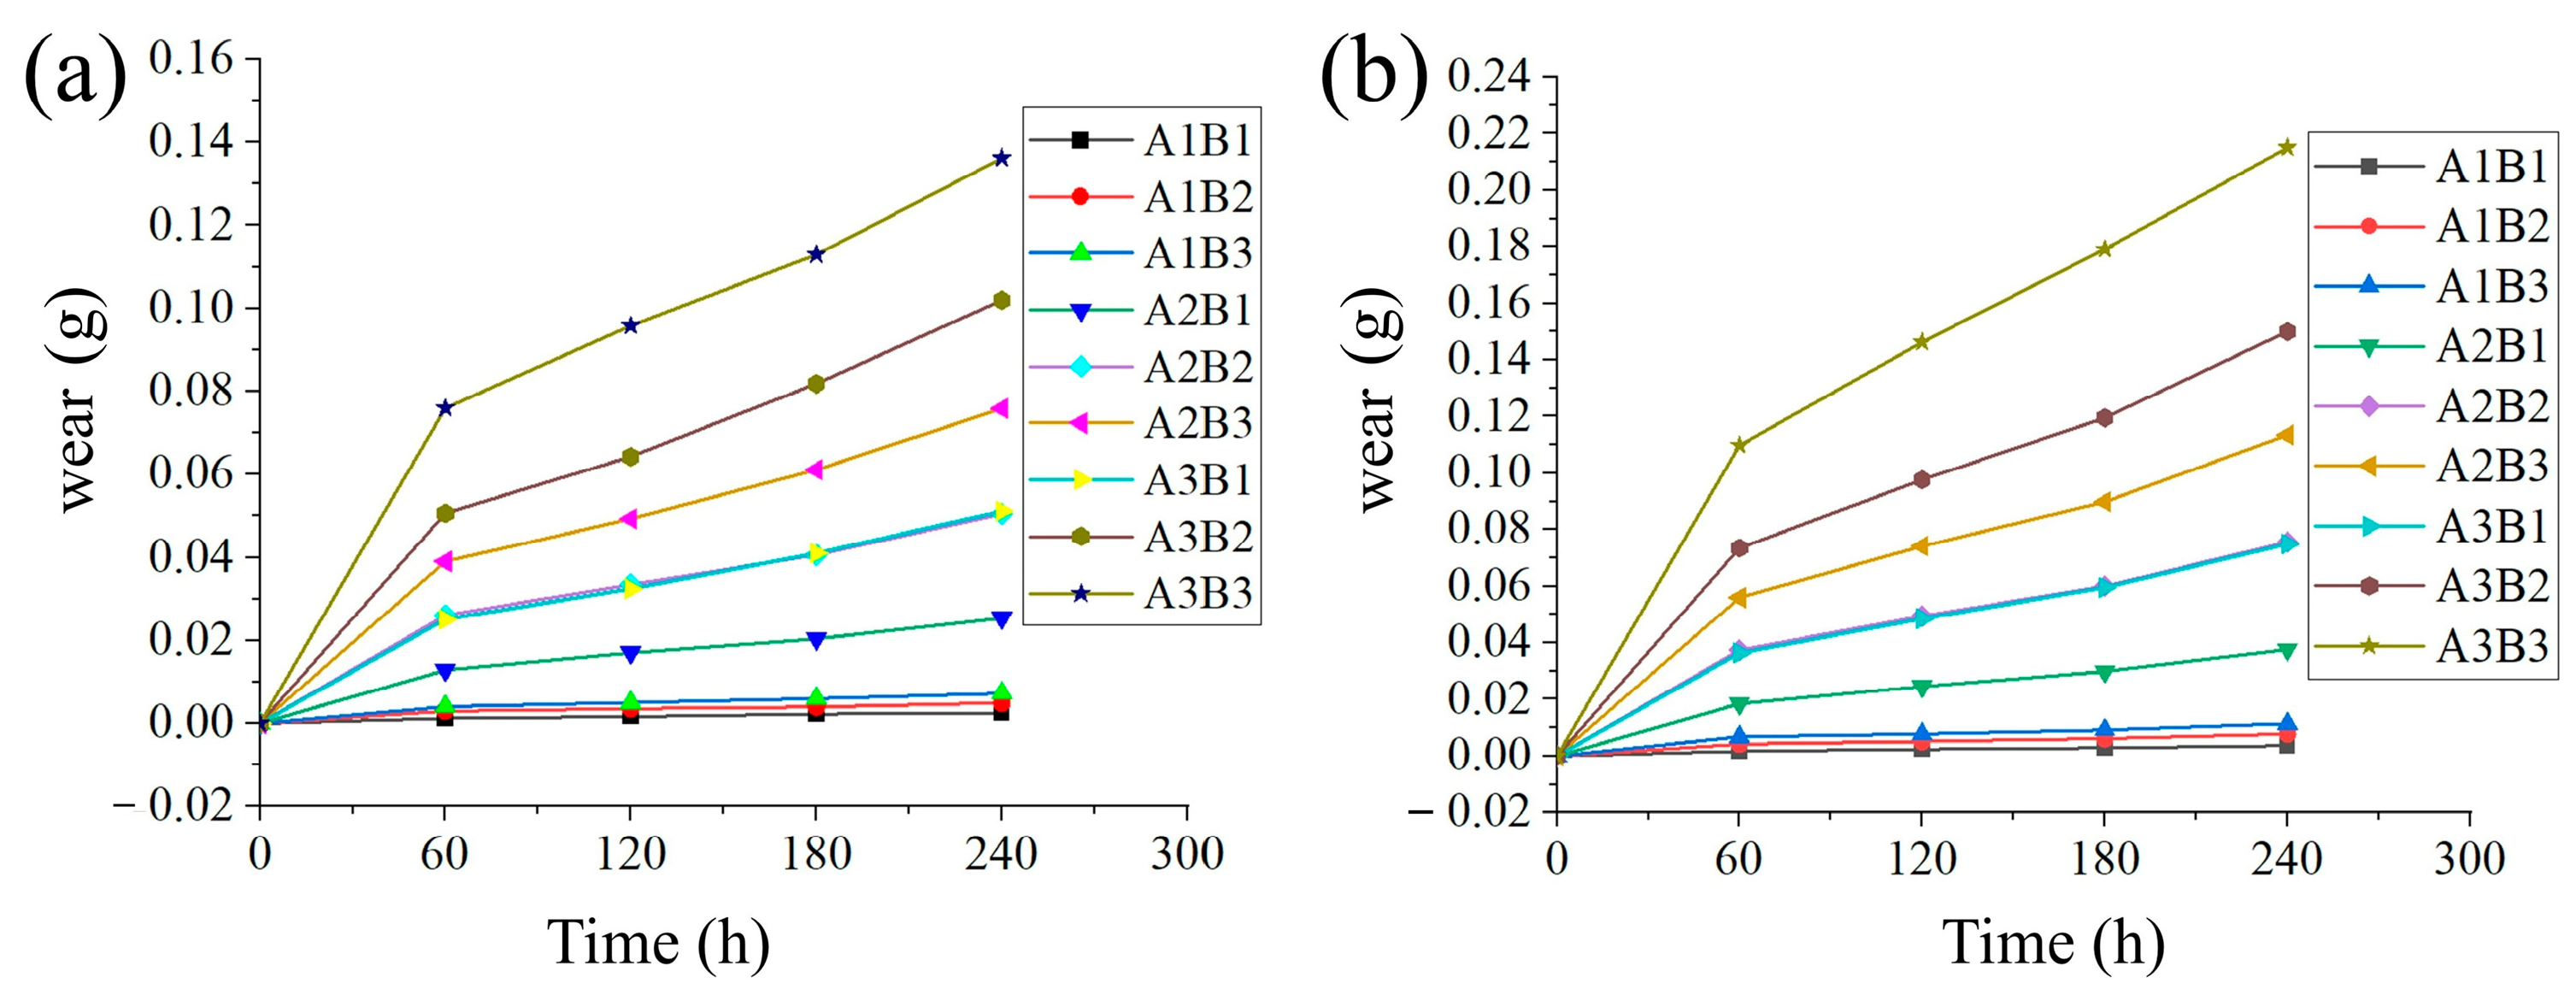
The results of the bench wear test revealed the macroscopic wear behavior of Q235 steel when subjected to wear by rice acting as a soft abrasive. Figure 11 presents the wear loss as a function of time for tests conducted with stalks (a) and grains (b) as the abrasive media. As indicated by Figure 11, the amount of wear was influenced by both the contact load and the rotational speed. The maximum wear loss was observed in the A3B3 test group, which corresponded to a contact load of 1 N and a rotational speed of 180 rpm. Under these conditions, the final wear loss after 240 h was 0.1362 g for the stalk-induced wear and 0.2151 g for the grain-induced wear. The overall wear process can be characterized by two distinct stages. The first is an initial running-in stage (0–60 h), which exhibits a higher wear rate. This is followed by a steady-state wear stage (60–240 h), during which the wear rate becomes relatively constant.
Taking the final mass loss as the primary evaluation metric, the results, as presented in Table 6, show that the wear loss is generally proportional to both the applied load and the rotational speed (which determines the number of sliding cycles). Under all tested conditions, the cumulative mass loss of the metal increased with prolonged wear duration. Notably, the wear process exhibited two distinct stages: a running-in period during the initial 0–60 h, characterized by a higher wear rate (indicated by a steeper slope in the wear curves), followed by a transition to a relatively stable wear phase where the wear rate became more gradual. This behavior is consistent with the classic running-in and steady-state wear process.
Analysis of the final mass loss data after 240 h confirms that normal load and sliding velocity are key factors influencing the extent of wear. A dedicated regression analysis was performed on the wear loss data to quantitatively assess the statistical significance of these factors, as summarized in Table 7. Within the experimental range, the wear loss demonstrated a significant positive correlation with both normal load and sliding velocity. At the highest tested condition of 180 rpm and a 1 N load, the final mass loss induced by the stalks and grains reached 0.1362 g and 0.2151 g, respectively. Under identical conditions, the wear caused by grains was consistently greater than that caused by stalks. This can likely be attributed to the higher hardness of the grain husks and the greater stress concentration generated at the contact points due to their irregular shape.

3.1.2. Micro-Morphology and Wear Mechanism

Systematic observation of the micro-morphology of worn surfaces under various conditions further revealed that the wear of Q235 steel by rice is a composite process co-dominated by mechanical polishing and soft abrasive wear, with the prevailing mechanism shifting significantly in response to changes in operating conditions.
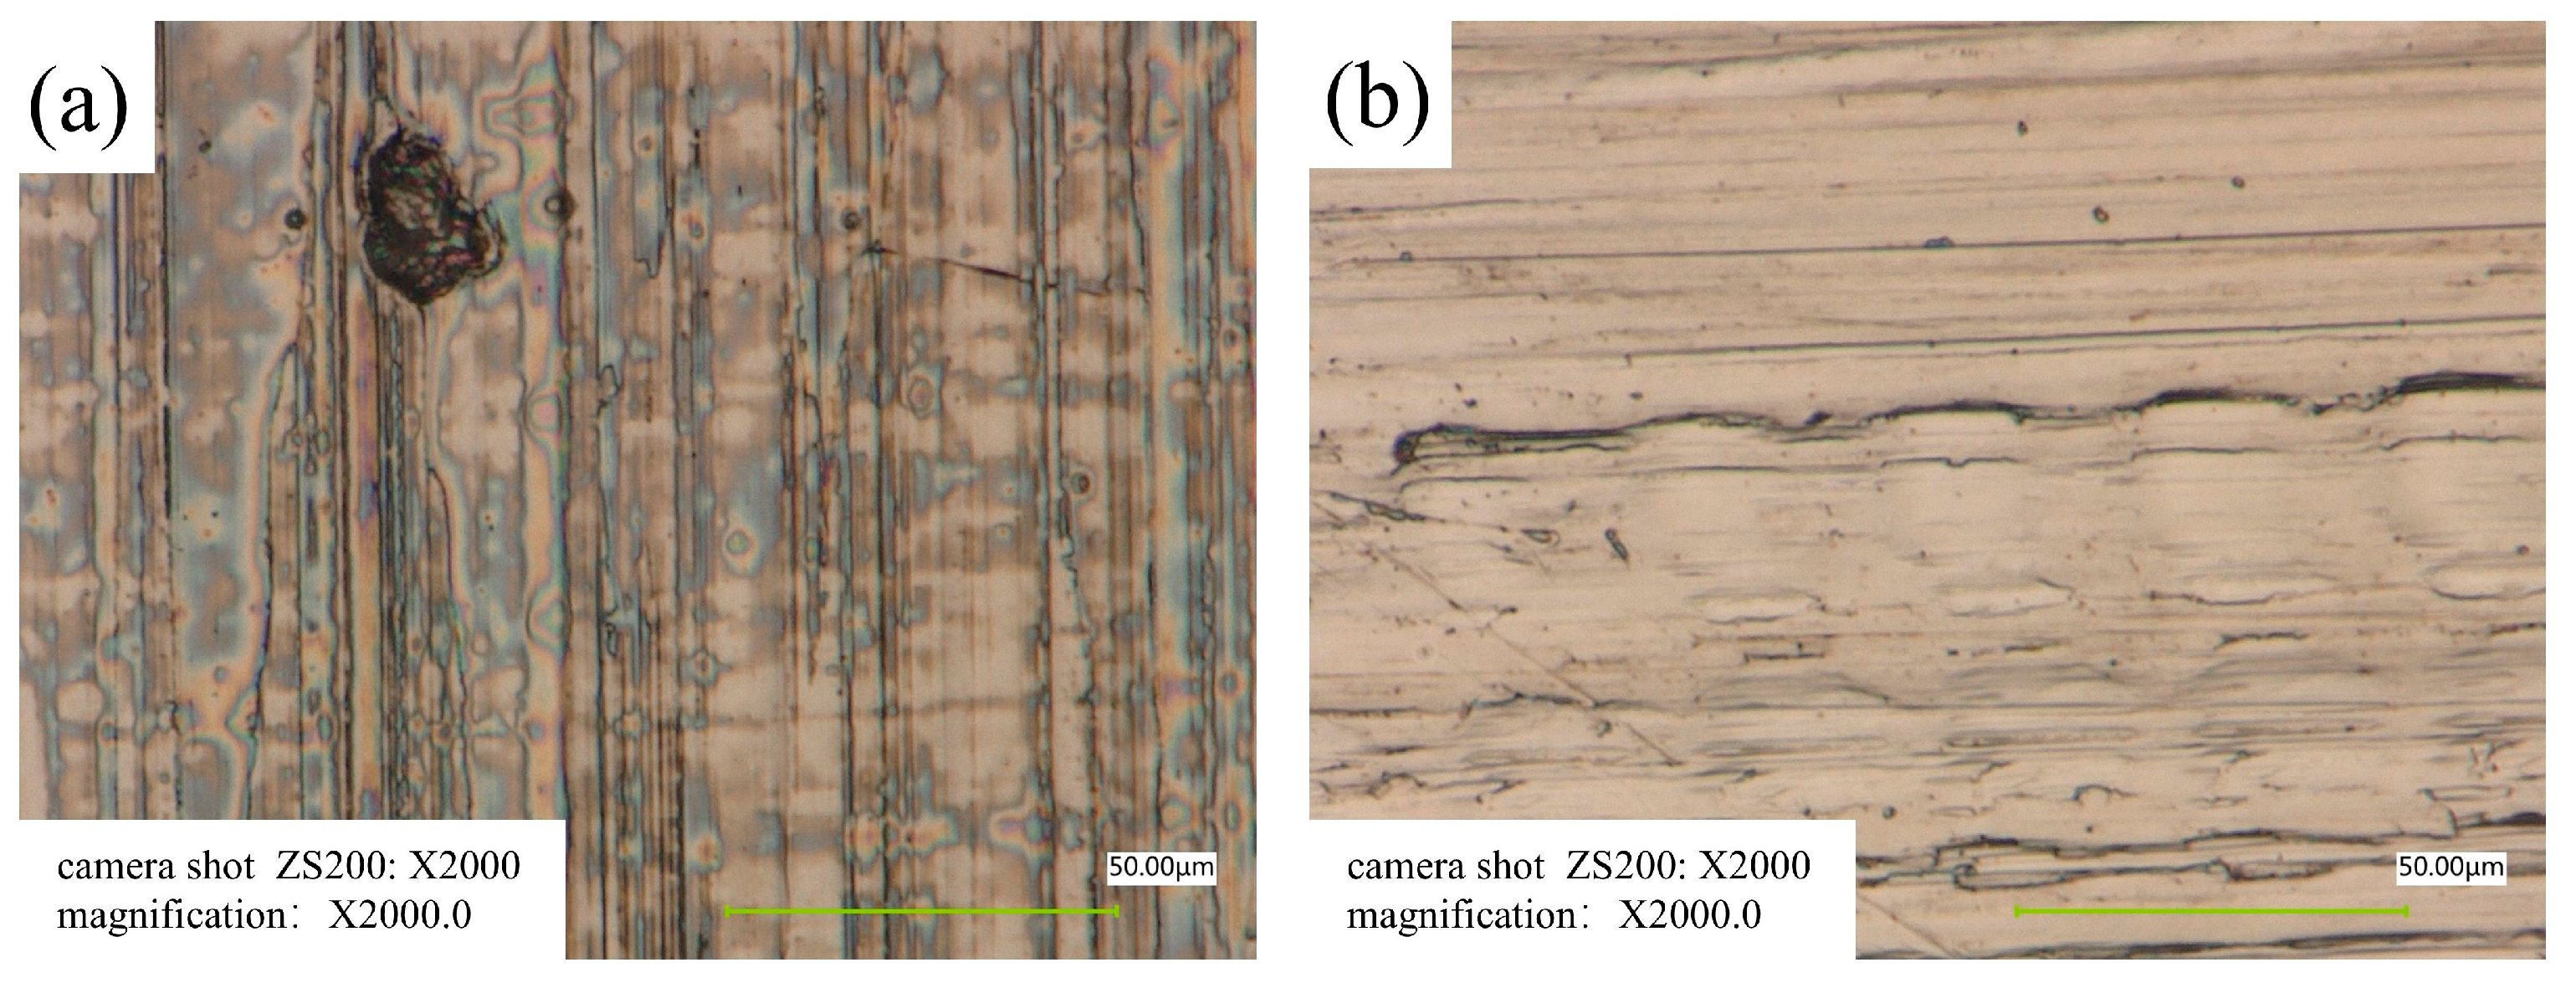
Under low load and velocity conditions (0.05 N, 60 rpm, corresponding to the A1B1 group), the wear process is predominantly governed by mechanical polishing. Figure 12a displays the uncleaned worn surface under these conditions, revealing a thin film with an iridescent sheen. This film is attributed to the transfer and spreading of the waxy layer from the rice husk during the frictional process. After this organic film was removed via ultrasonic cleaning in acetone, the underlying metal substrate appeared relatively smooth, with only a few extremely shallow scratches visible (Figure 12b). This comparison between the uncleaned and cleaned states provides compelling evidence that under these mild conditions, the interaction is primarily characterized by the transfer of organic matter and a slight polishing of the substrate.
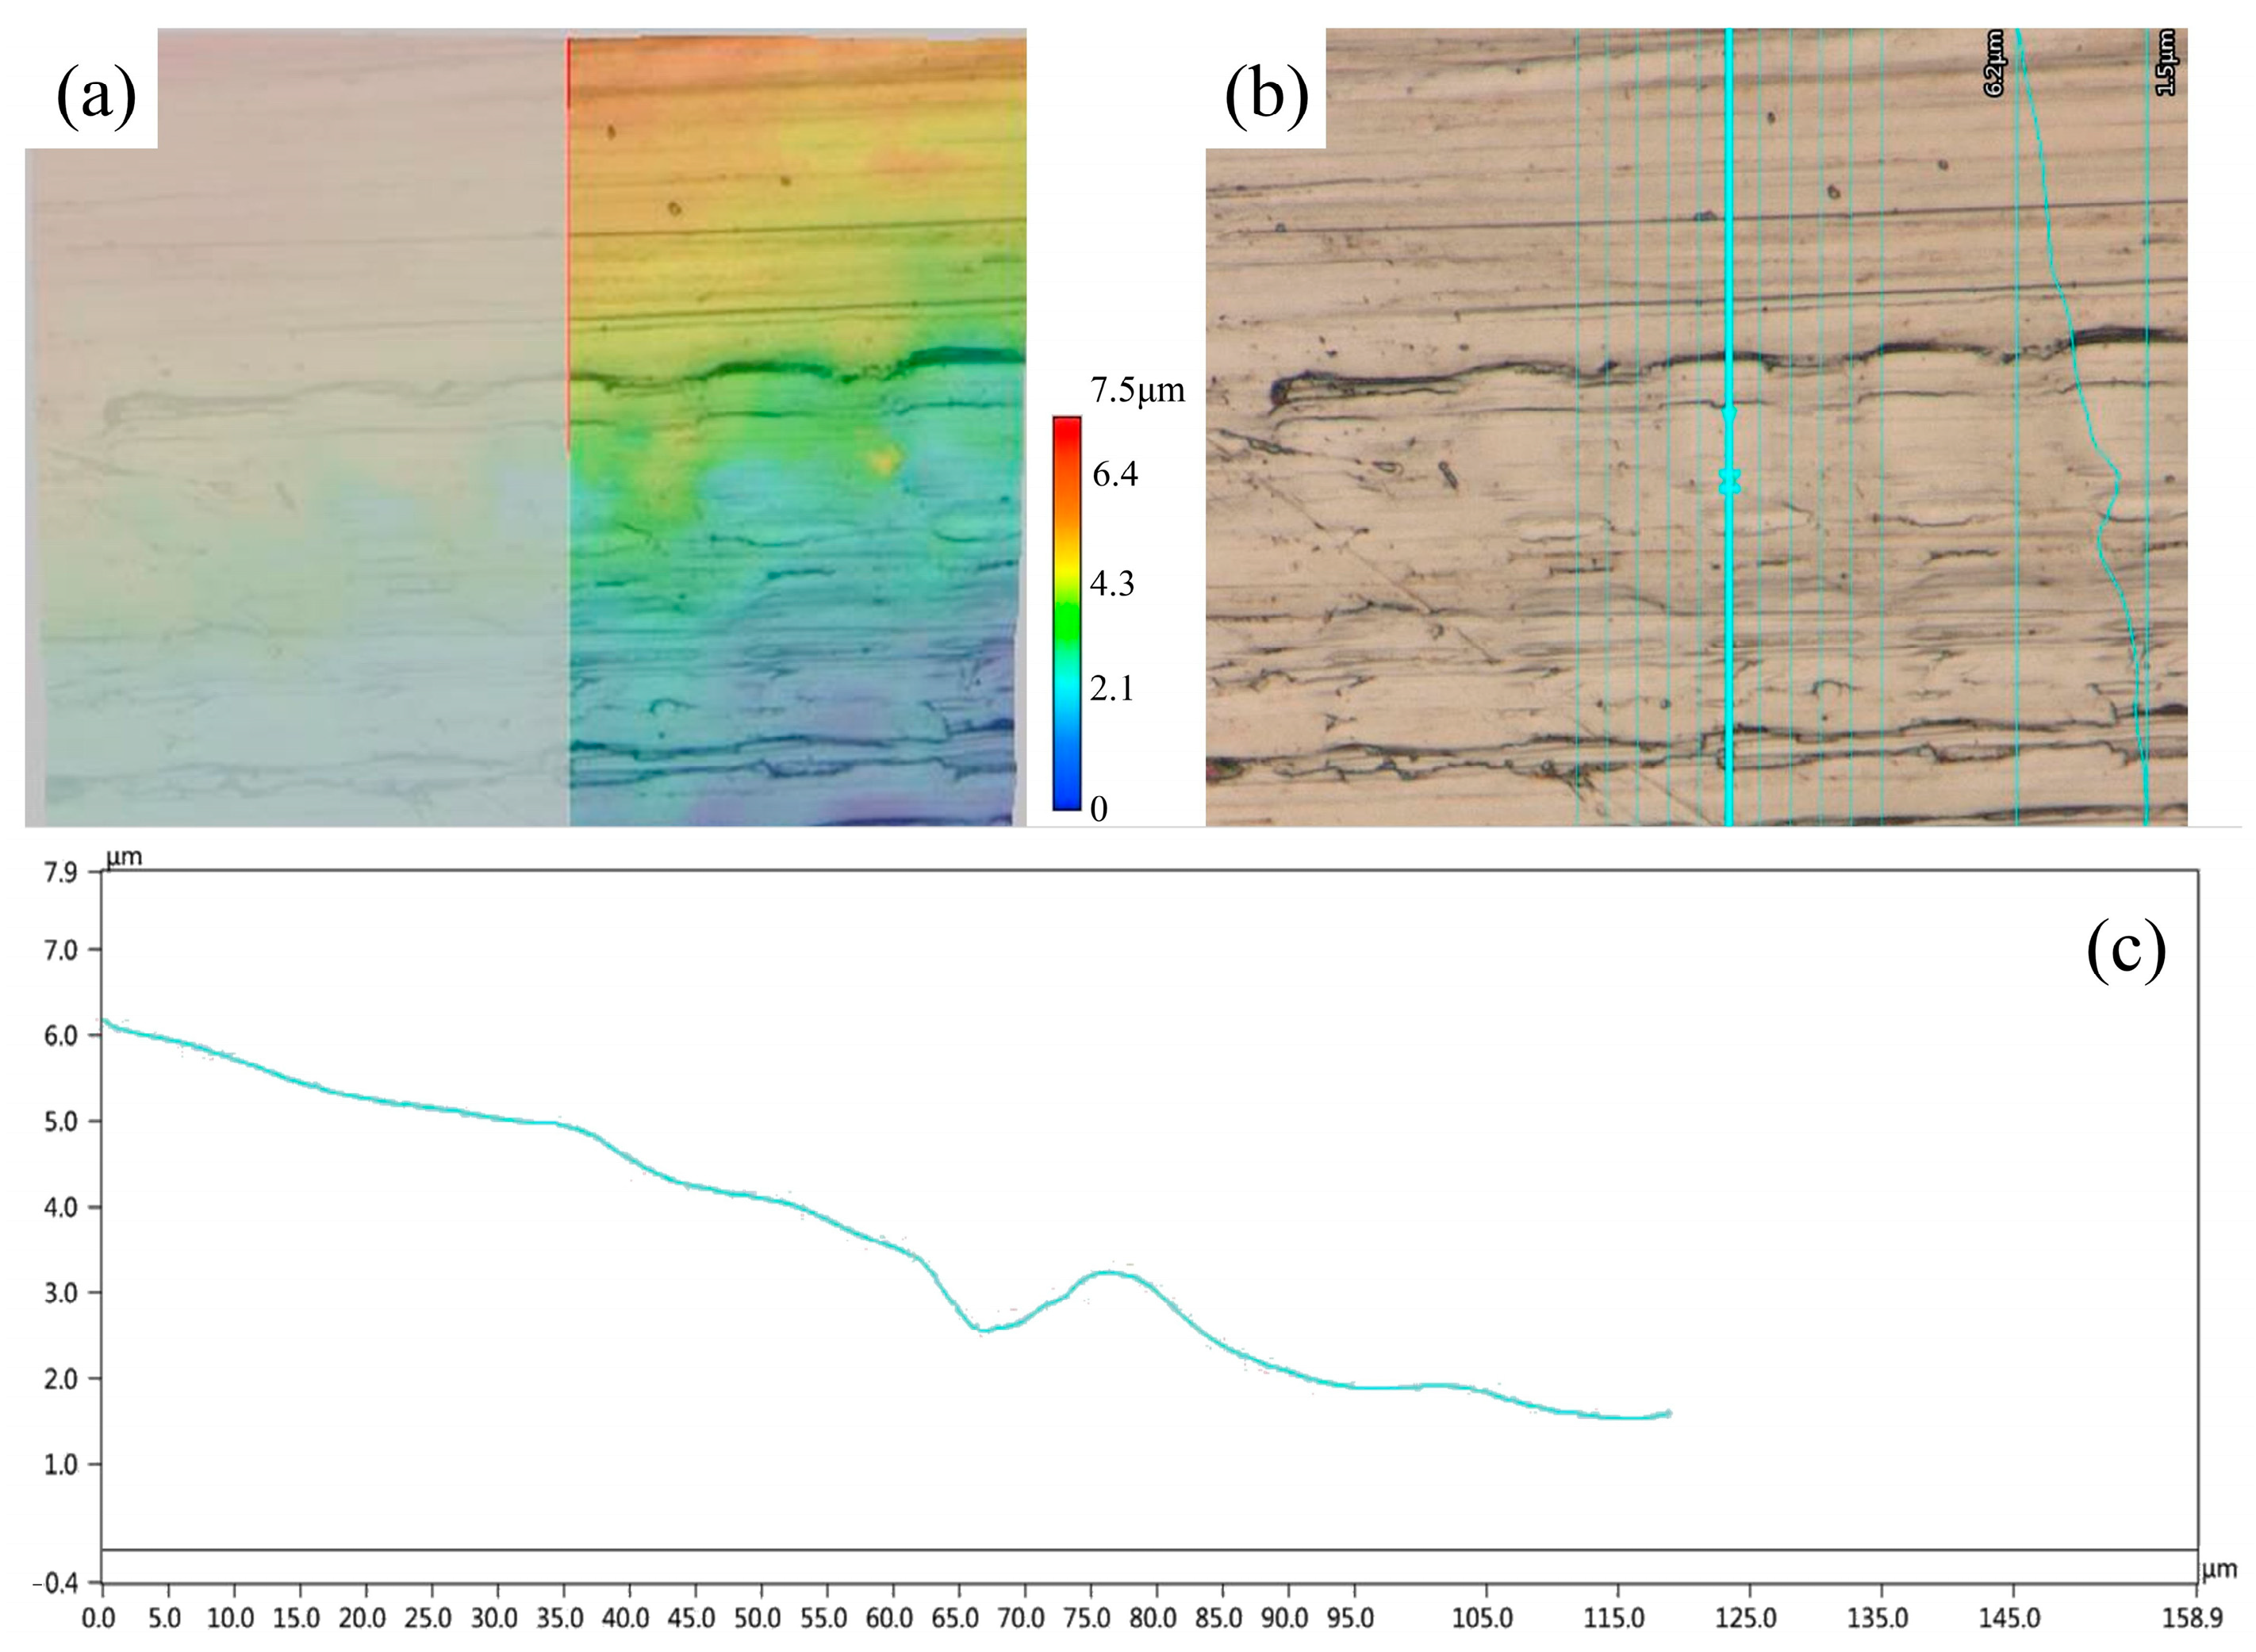
However, under high load and high velocity conditions (1 N, 180 rpm), the wear morphology underwent a significant transformation, as depicted in Figure 13. To better illustrate the surface topography, a color scale is used to represent height in the 3D image, with blue corresponding to the reference baseline and red to the highest point; the transition from blue to red signifies an increase in elevation. As shown in Figure 13a, the overall surface profile exhibits a higher elevation on one side and a lower elevation on the other, and the primary sliding wear from the grains is concentrated in the green and blue regions.
The depth-composed image (Figure 13b) reveals numerous distinct furrows and scratches parallel to the sliding direction, possessing appreciable depth. Raised ridges, formed by plastic deformation, are visible along the sides of these furrows, which is a characteristic feature of micro-cutting. The 3D profile curve (Figure 13c) also quantitatively demonstrates this, showing the surface profile descending sharply from a maximum height (approx. 6.2 μm) and forming significant valleys and irregular undulations.
This dichotomy in wear mechanisms can be attributed to the unique dual physicochemical nature of rice. On one hand, the presence of the waxy layer governs the mechanical polishing observed under mild operating conditions. On the other hand, rice, particularly its stalks, is rich in amorphous silica micro-particles, which possess a hardness of 540–570 HV. Under high contact pressure, these hard particles are sufficiently hard to indent and micro-cut the softer Q235 steel substrate (approx. 165 HB), thereby inducing significant soft abrasive wear.

3.1.3. Quantitative Characterization of Worn Surfaces via Fractal Dimension

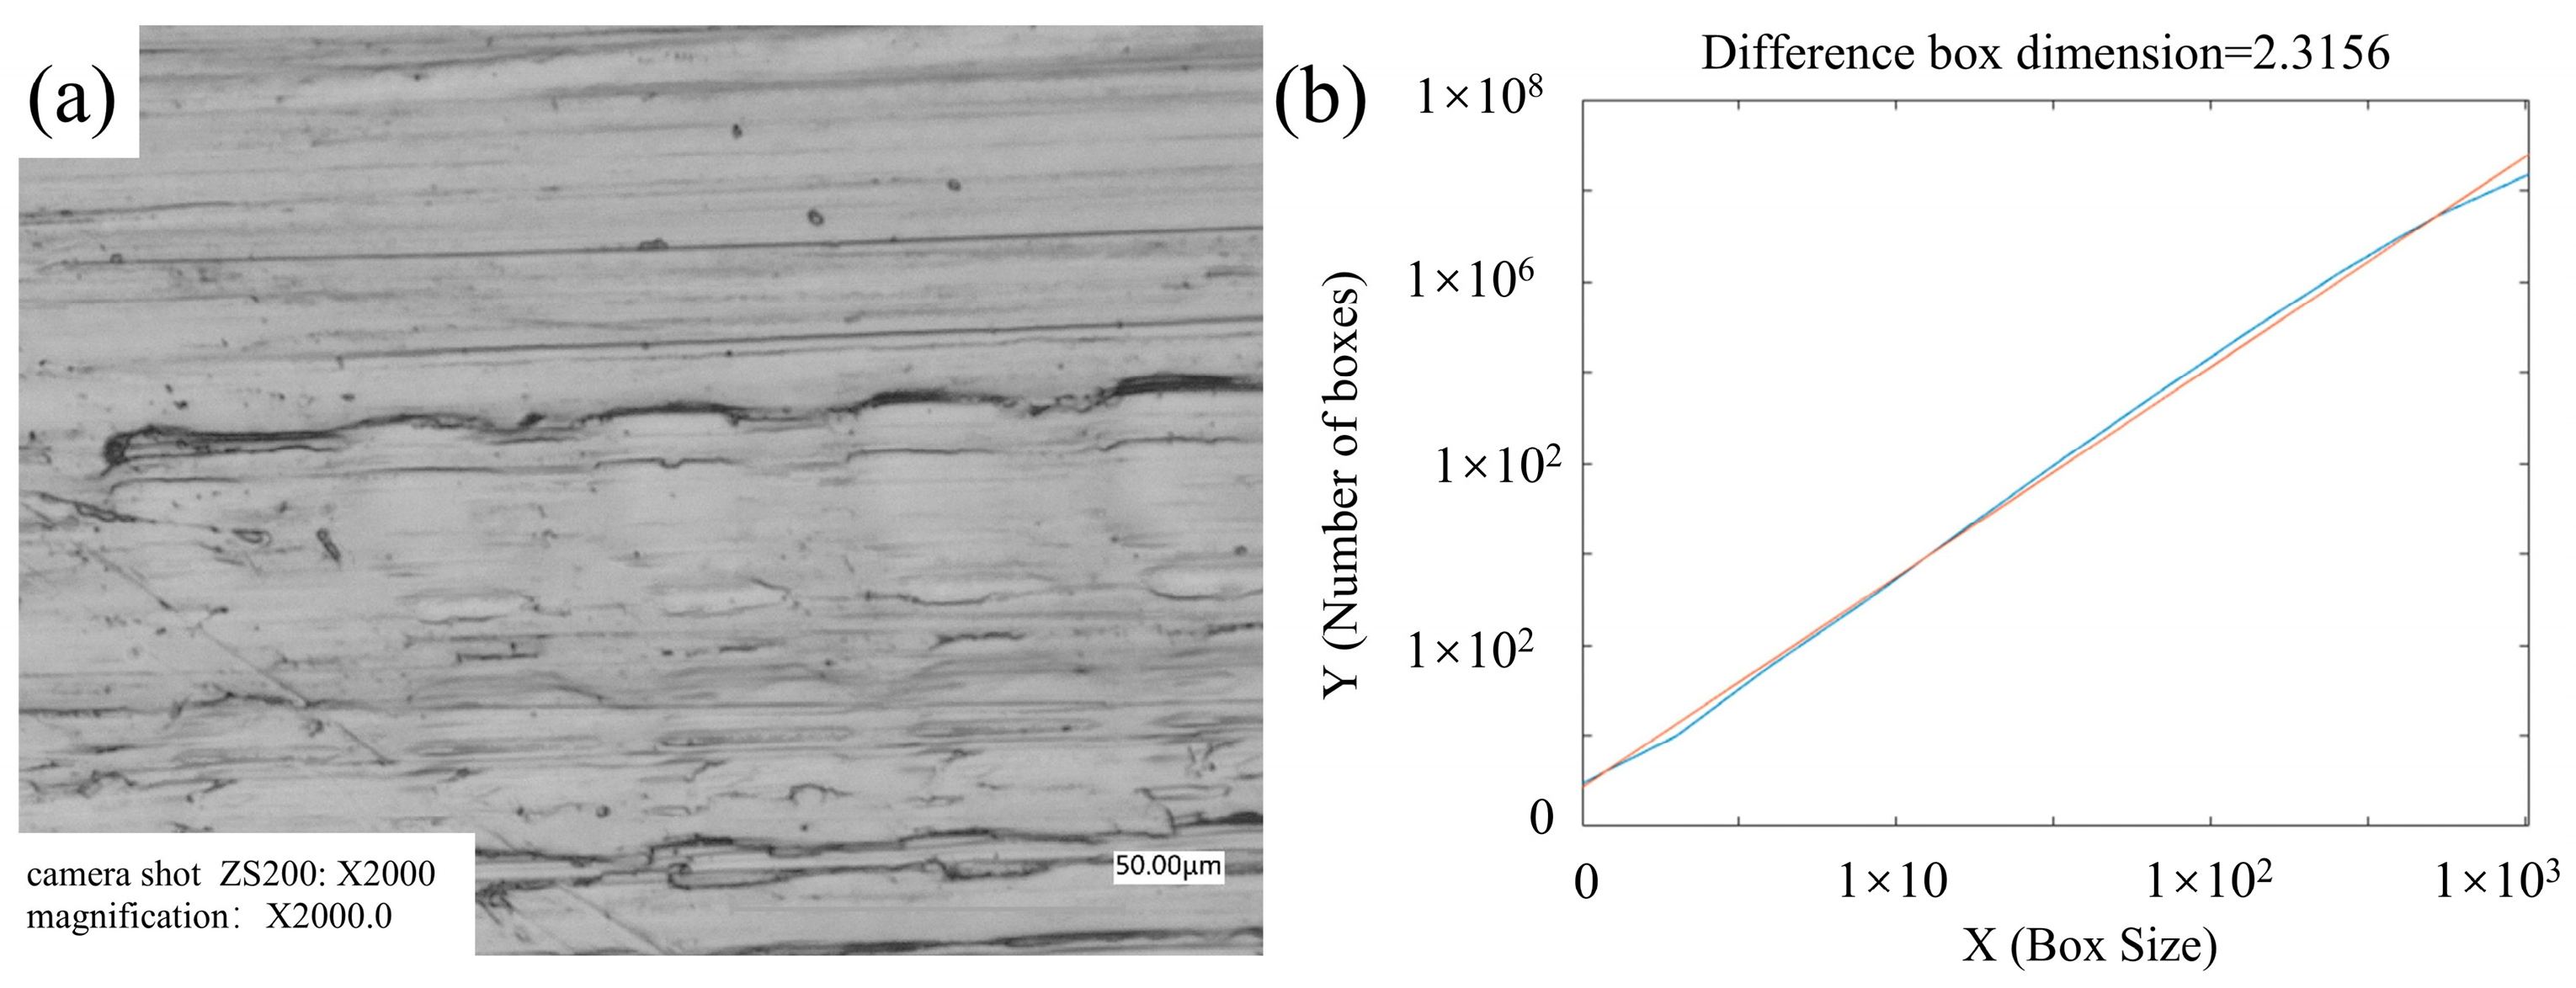
To quantitatively characterize the effect of the wear process on the geometric complexity of the surface from a more fundamental perspective, this study introduced the fractal dimension (Ds) for characterization. The A3B3 group, which experienced the most severe wear, is presented as a representative case. Figure 14a shows a grayscale image of its worn region, magnified 2000 times. When the 3D height data from this region was processed using the DBC algorithm, it yielded the double-logarithmic (log-log) plot shown in Figure 14b. The data points in the plot exhibit a strong linear relationship. Through linear regression, the slope of the fitted line was calculated to be −2.3156. Consequently, the fractal dimension (Ds) of this worn surface is 2.3156.
The results for all conditions are summarized in Table 8. The data indicate that the fractal dimension of the original, unworn surfaces ranged from 2.17 to 2.19. After the wear process, the fractal dimension of all surfaces increased to varying extents. A combined analysis of the fractal dimension difference data in this table and the mass loss data from Table 6 reveals a clear trend: conditions that resulted in greater mass loss also corresponded to a larger increase in the surface fractal dimension. For instance, the A1B1 condition with the stalk group, which had the minimum wear loss, showed an increase in Ds of only 0.0091. In contrast, the A3B3 condition with the grain group, which experienced the maximum wear loss, exhibited an increase in Ds of 0.1478.
Based on the acquired surface morphology data, the differential box-counting (DBC) method was employed to calculate the fractal dimension of the initial (unworn) surface and the surfaces after each wear test. To illustrate this process, the A3B3 test from the grain group is presented as an example. The initial surface at the central measurement point had a roughness (Ra) of 1.291 μm. After the wear test, the morphology of the worn surface was imported into MATLAB and converted to a grayscale image (Figure 14a). Its fractal dimension was then calculated, yielding a value of 2.3156, with the corresponding log–log plot for the calculation shown in Figure 14b. The fractal dimensions for the remaining worn surfaces were also calculated. These results, along with a comparison to the fractal dimension of the initial surface, are summarized in Table 8.
This phenomenon is in strong agreement with the observed micro-mechanisms. In the initial stages of wear, where mechanical polishing is the dominant process, the surface tends to become smoother, and its geometric complexity changes little; consequently, the increase in fractal dimension is not significant. As the operating conditions intensify, the soft abrasive wear mechanism is activated. The superposition of numerous grooves and plastic deformations at multiple scales makes the surface progressively more uneven and irregular. This multi-scale irregularity is precisely the characteristic that fractal geometry describes, which leads to a significant increase in its fractal dimension.
This demonstrates that the fractal dimension can not only capture the presence of wear but also quantitatively reflect its severity and the transition in the dominant mechanism. Therefore, the fractal dimension serves as an effective and sensitive quantitative metric to characterize the process of increasing topographical complexity on a metal surface induced by soft abrasive wear from materials like rice.

3.2. Development and Validation of the DEM-Wear Model

3.2.1. Results of Model Parameter Calibration

The predictive accuracy of the simulation is fundamentally dependent on the correct calibration of the flexible stalk DEM model. By executing the 13 simulation runs detailed in Table 4 and performing regression analysis on the results using Design-Expert software, a quadratic polynomial regression model was obtained. This model describes the relationship between the equivalent elastic modulus (Eeq) and the input parameters of normal stiffness (Ae1) and tangential stiffness (Be1):
E e q = 1.8812188622 + 0.53670569473704 A e 1 + 0.0074234085143291 B e 1 + 4.0743750000784 e 05 A e 1 B e 1 0.29013476435 A e 1 2 0.0045882126 B e 1 2 0.0055356182643299 A e 1 2 B e 1    0.2272235978704 A e 1 B e 1 2 + 0.1285544155 A e 1 2 B e 1 2   
where Eeq is the equivalent elastic modulus, Ae1 is the normal stiffness, and Be1 is the tangential stiffness.
The statistical analysis of this regression model, summarized in Table 9, indicates an excellent goodness of fit and high predictive capability. The model’s coefficient of determination (R2) is 1.0000, indicating that the model can account for 100% of the variation in the response value. The p-value of the model is substantially less than 0.0001, which confirms that the regression model is highly significant. The normal stiffness (Ae1) and its quadratic term (Ae12) were identified as the most significant factors influencing the model’s response. This finding is consistent with the results from the single-factor sensitivity analysis.
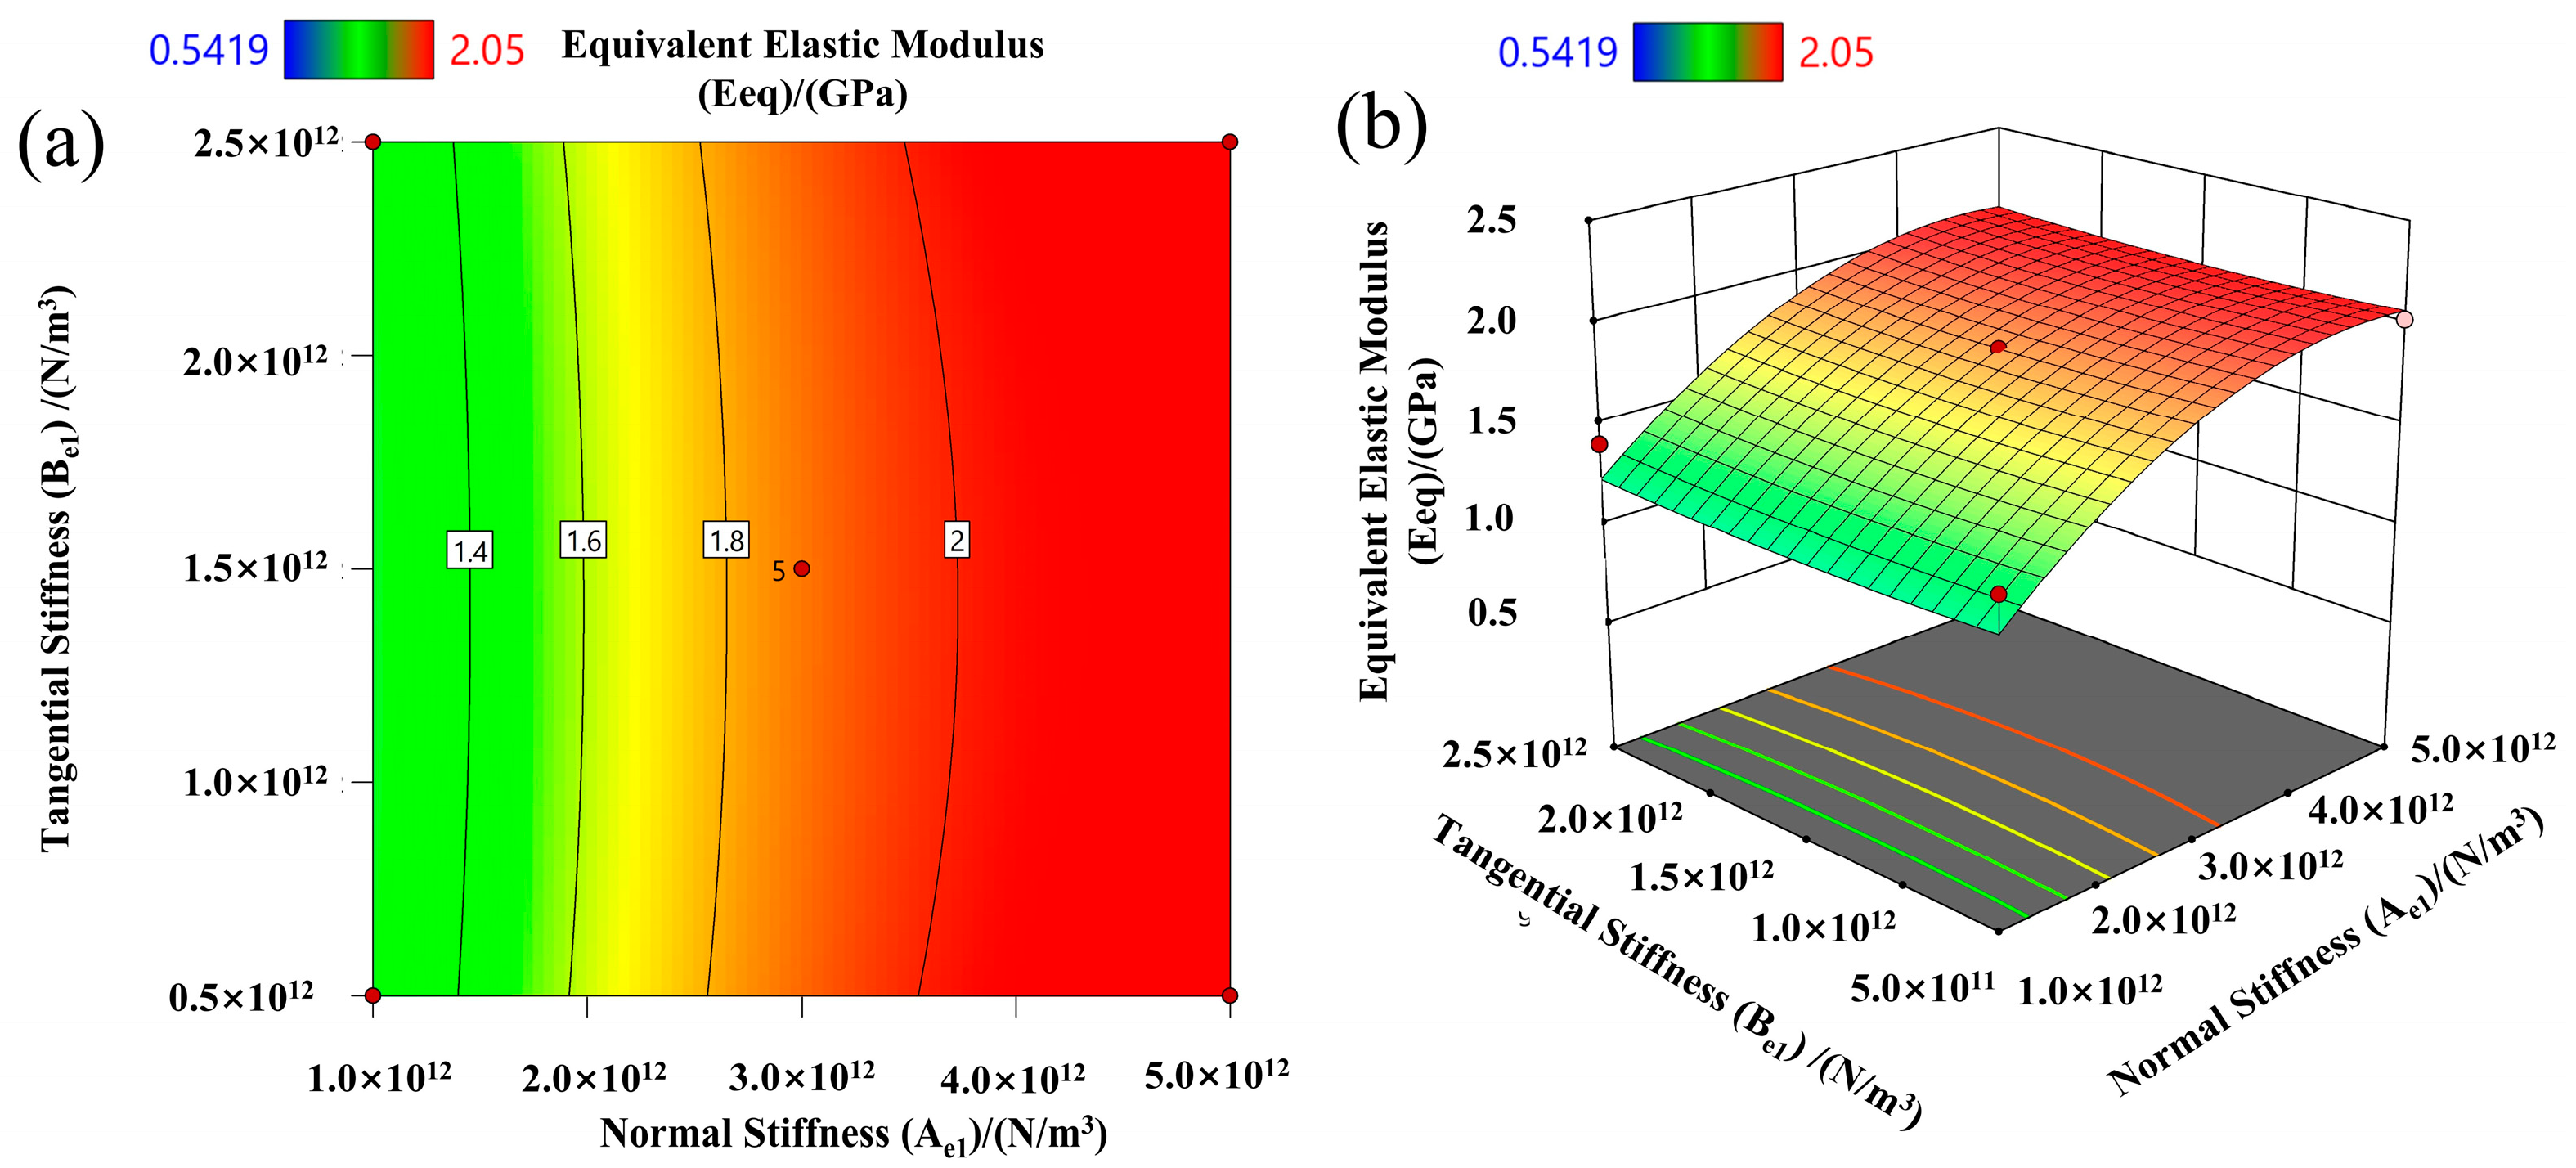
To provide a more intuitive visualization of the impact of normal stiffness (Ae1) and tangential stiffness (Be1) on the equivalent elastic modulus (Eeq), response surface and contour plots have been included. These plots clearly depict how these parameters collectively influence the equivalent elastic modulus across the experimental range, offering a visual representation that complements the regression analysis results presented in Table 9. Figure 15 illustrates trends in the equivalent elastic modulus under various parameter combinations, with the contour plot (a) providing a direct visual of the distribution of Eeq values and the 3D surface plot (b) offering a three-dimensional view of the parameter relationships.
This validated regression model was then used to determine the optimal parameter set via the optimization module in the Design-Expert software. By setting the target for the equivalent elastic modulus (Eeq) to the experimentally determined value of 1.814 GPa, the software performed a global optimization search on the 3D response surface defined by the regression model. Figure 16 visually presents the results of this optimization. To achieve the target elastic modulus (Figure 16a), the predicted optimal solution (with a desirability of 1) corresponded to a normal stiffness of 2.592 × 10¹² N/m3 (Figure 16b) and a tangential stiffness of 2.5 × 10¹² N/m3 (Figure 16c).
To verify this calibrated result, a final three-point bending verification simulation was conducted using this optimal parameter set. The resulting equivalent elastic modulus was 1.832 GPa, which has a relative error of only 0.97% when compared to the target value of 1.814 GPa. This outcome strongly confirms the accuracy and reliability of the hybrid ‘experimental-simulation optimization’ calibration methodology employed in this section, thereby establishing a robust foundation for the subsequent full-scale wear prediction.

3.2.2. Full-Scale Wear Prediction and Validation

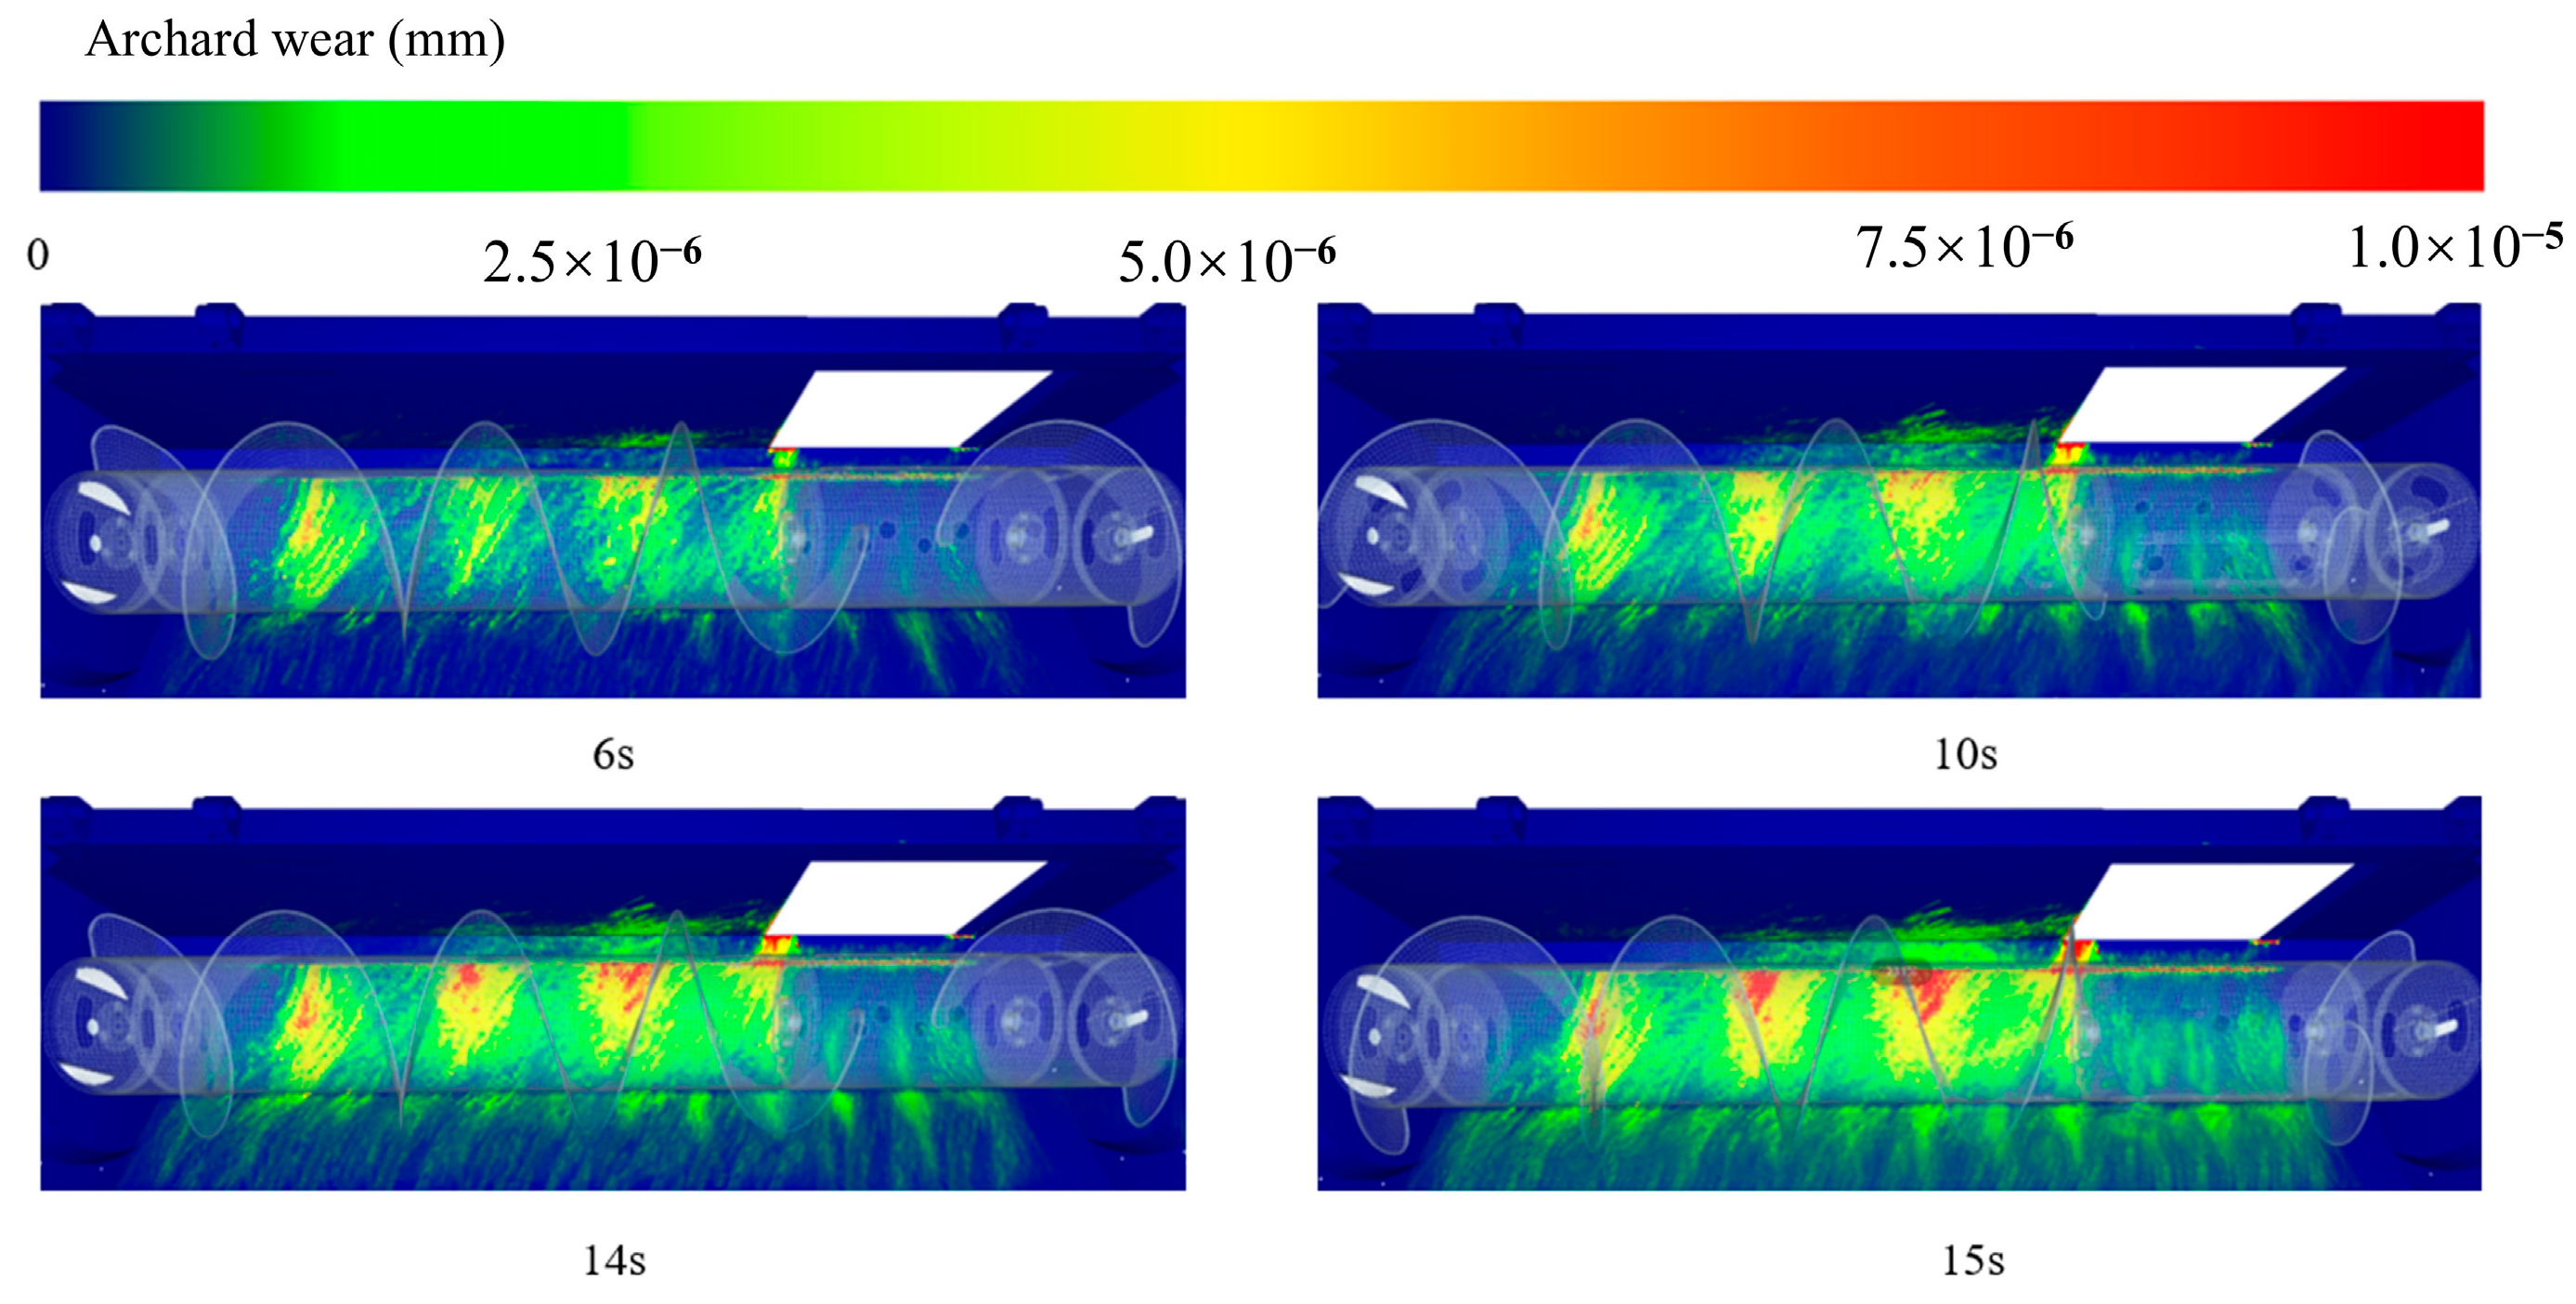
By coupling the calibrated DEM model with the Archard wear model, the wear distribution on the full-scale header platform after 15 s of continuous operation was predicted. The simulation results, presented in Figure 17, show that wear is predominantly concentrated along the paths where the material is converged by the spiral auger, forming several “hot spots” of significant wear depth. The wear region initiates from the material feeding side and progressively expands and deepens along the direction of spiral conveyance, reaching its maximum intensity near the outlet of the feeding channel.
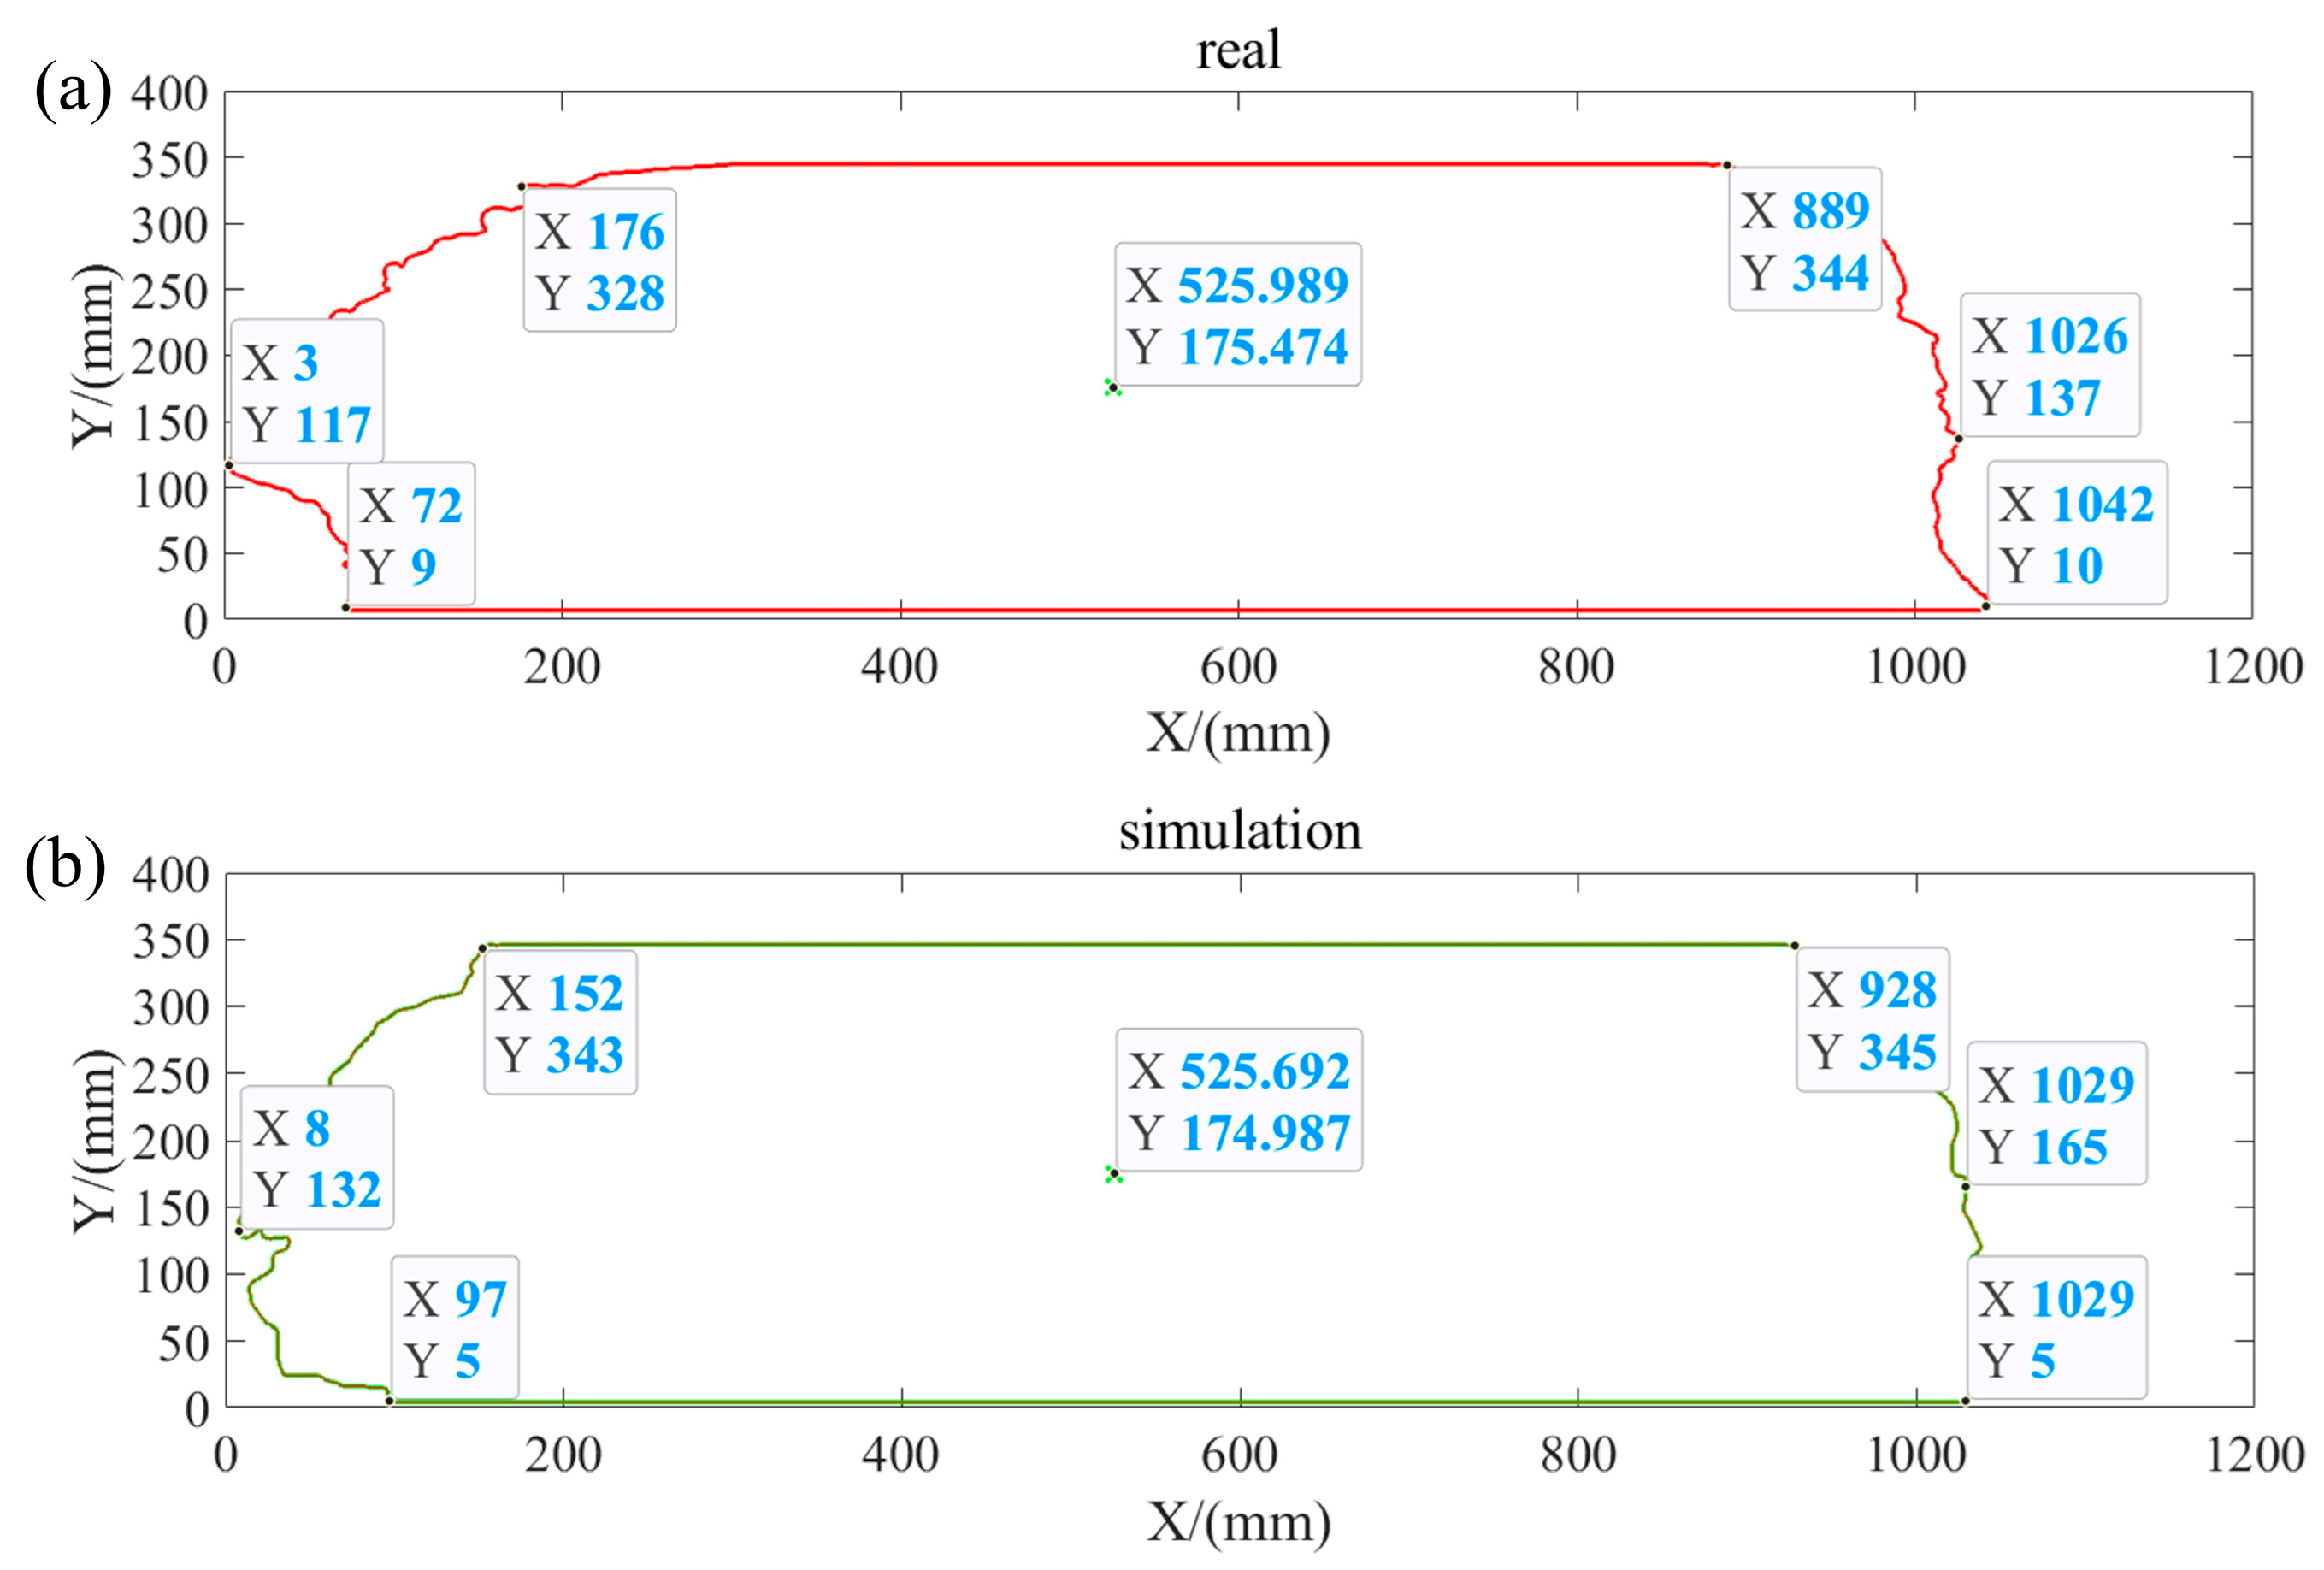
To validate the predictive capability of the model, the simulated wear profile was directly compared with the profile mapped from actual in-service equipment, as shown in Figure 18. Figure 18a shows the boundary curve of the wear profile measured from the in-service header platform, while Figure 18b displays the corresponding curve derived from the discrete element simulation. Visually, it is apparent that the two profiles exhibit a remarkable agreement in their macroscopic shape, spatial position, and overall trend. Both curves display a complex morphology characterized by multiple convex peaks, which corresponds directly to the material conveyance path of the spiral auger. A quantitative comparison yielded a Hausdorff Distance of 40.1995 pixels. This distance is exceptionally small relative to the total curve length of over 14,000 pixels (a relative value of only 0.28%), which preliminarily confirms the high degree of spatial proximity between the two profiles.
For a more profound evaluation of geometric similarity, we analyzed the two metrics suitable for sequence comparison as defined in the Methods Section. To assess the similarity between the two curves in terms of their local shape details, we calculated the edit distance (Levenshtein distance). The result was an edit distance of 0.14062 between the two profile sequences. This is an exceptionally low value, indicating that only a minimal number of edit operations (insertion, deletion, or substitution) are required to transform one sequence into the other. This, in turn, confirms their high degree of agreement in micro-scale and local geometric features.
To evaluate the consistency of the two profiles in their global structure, we calculated their Hamming similarity. It is important to note that this similarity metric is derived from the normalized Hamming distance (calculated as 1-normalized Hamming distance), where a value closer to 1 signifies higher similarity. The calculation yielded a Hamming similarity of 1, indicating that, after the hashing process, the global structural sequences of the two profiles were identical.
Collectively, the extremely low edit distance and the maximum possible Hamming similarity provide robust, multi-faceted evidence that the DEM-Wear coupled model developed in this study can effectively predict the macroscopic wear regions caused by complex material flow. This result not only validates the feasibility of the core methodology—predicting wear “hot spots” by simulating material trajectories—but also offers solid quantitative support for the model’s reliability. The minor discrepancies between the simulation and reality, such as the localized differences in smoothness visible in Figure 18, can likely be attributed to factors not accounted for in the model, such as corrosion effects, unmodeled fine impurities (e.g., sand), and the non-uniformity of material feeding in actual field operations.

3.3. Fractal Characteristics of Worn Surfaces

To gain a deeper understanding of how the wear process affects the geometric complexity of a surface, the fractal dimension (Ds) was calculated for the worn surfaces obtained from the bench tests.
The fractal dimensions of the Q235 steel surfaces under various wear conditions were calculated. The fractal dimension of the original, unworn surface was approximately 2.17. Following the wear tests, the fractal dimension of all surfaces increased. As an example, Figure 14a shows a grayscale image of the worn surface from the grain-group test A3B3 (load: 1 N; speed: 180 rpm), magnified 2000 times. The corresponding log–log plot for the DBC calculation is presented in Figure 14b. The data points in the plot exhibit a strong linear relationship. Through linear regression, the slope of the fitted line was determined to be −2.3156. Therefore, the fractal dimension (Ds) of this worn surface is 2.3156.
As indicated by Table 8, the fractal dimension of the original, unworn surfaces ranged from 2.17 to 2.19. After the wear process, the fractal dimension of all surfaces increased to varying extents. A combined analysis of the mass loss data in Table 6 and the fractal dimension difference data in Table 8 reveals a clear trend: conditions that resulted in greater mass loss also corresponded to a larger increase in the surface fractal dimension. This observed trend provides quantitative support for the direct correlation between increased wear severity and higher fractal dimension values, demonstrating the effectiveness of Ds as a sensitive metric. For instance, the A1B1 condition with the stalk group, which had the minimum wear loss, showed an increase in Ds of only 0.0091. In contrast, the A3B3 condition with the grain group, which experienced the maximum wear loss, exhibited an increase in Ds of 0.1478. This indicates that as the severity of wear intensifies, the fractal dimension of the surface correspondingly increases.
This phenomenon is in strong agreement with the micro-mechanisms observed in Section 3.1.2. In the initial stages of wear, where mechanical polishing is the dominant process, the surface tends to become smoother. Consequently, its geometric complexity changes little, and the increase in fractal dimension is not significant. However, as the load and velocity increase, the soft abrasive wear mechanism is activated. The superposition of numerous grooves and plastic deformations at multiple scales makes the surface progressively more uneven and irregular. This multi-scale irregularity is precisely the characteristic that fractal geometry describes, which leads to a significant increase in the fractal dimension.
This demonstrates that the fractal dimension can not only capture the presence of wear but also quantitatively reflect its severity and the transition in the underlying wear mechanism. Therefore, the fractal dimension can serve as an effective and sensitive quantitative metric to characterize the process of increasing topographical complexity on a metal surface induced by soft abrasive wear from materials like rice.

4. Conclusions

This study has systematically investigated the wear of the combine harvester header platform resulting from its interaction with rice, employing a multi-scale research framework that integrates bench wear tests, coupled Discrete Element-Wear (DEM-Wear) simulation, and advanced surface characterization techniques. Based on the results and discussion, the following main conclusions can be drawn:
(1) This study systematically elucidated, for the first time, the complex wear mechanism of Q235 steel, a common material in agricultural machinery, induced by its interaction with rice. The process was identified as a composite mechanism, transitioning from mechanical polishing under low-load, low-velocity conditions to significant soft abrasive micro-cutting driven by the inherent silica particles within rice under high-load, high-velocity conditions. This fundamental understanding is crucial for selecting and designing more durable materials for agricultural applications.
(2) A robust coupled Discrete Element Method (DEM)-Wear model, incorporating a rigorously calibrated flexible rice stalk model, was successfully developed and extensively validated. This model accurately predicted macroscopic wear ‘hot spots’ on full-scale combine harvester header platforms, demonstrating excellent geometric similarity with wear profiles observed on in-service agricultural machinery. This provides agricultural engineers with a powerful and reliable computational tool for proactive design optimization and service life prediction of critical components, directly contributing to improved machinery reliability and reduced operational costs in the field.
(3) The research successfully applied fractal analysis to quantitatively characterize worn surfaces, demonstrating that the fractal dimension (Ds) serves as a sensitive and effective metric for agricultural wear severity. Ds consistently increased from approximately 2.17 on unworn surfaces to 2.3156 in the most severely worn regions, directly correlating with observed wear mechanism transitions. This direct correlation between wear loss and the increase in Ds values was quantitatively supported by the experimental results and statistical analyses presented in this article, confirming Ds as a robust indicator. This establishes fractal dimension as a novel and valuable quantitative tool for assessing the topographical changes and wear state of agricultural machinery surfaces.

5. Significance and Future Work

The significance of this research lies in its establishment of a comprehensive research paradigm for the field of agri-tribology, one that integrates micro-mechanisms, macroscopic prediction, and advanced characterization. The developed DEM-Wear model functions not merely as an explanatory tool but also as a predictive one, offering a rapid and cost-effective digital platform for wear-resistance optimization and service life prediction of critical agricultural machinery components. Using this model, engineers can evaluate the influence of different design parameters (such as the pitch and blade angle of the spiral auger) on wear distribution during the design stage. This allows for proactive optimization and reduces the need for costly physical prototyping and field trials. Consequently, the findings from this research directly inform practical component design guidelines for industry, enabling optimized material selection and geometric configurations for enhanced wear resistance and extended service life.
However, certain potential constraints exist within this study, mainly in the following aspects:
1. Material Simplification: The DEM models for rice stalks and grains are based on simplified particle representations (spherical particles and clumps). While their macroscopic bending behavior was validated through calibration, the models do not fully capture the complexity of their internal microstructure and anisotropic mechanical properties.
2. Wear Model Limitations: This study employed the Archard wear model, which is an empirical model assuming constant material hardness and a direct proportionality between wear amount, sliding distance, and normal load. It does not account for dynamic changes in surface topography and local material properties during wear, nor does it fully incorporate complex tribo-thermal effects.
3. Incomplete Consideration of Environmental Factors: The current model primarily focuses on mechanical wear and does not fully account for the synergistic effects of humidity, corrosive agents (e.g., rice stalk sap), and temperature variations present in actual field environments.
4. Limited Abrasive Scope: The research predominantly focused on wear induced by rice itself (stalks and grains) as the abrasive. However, hard exogenous abrasives such as soil and sand, which play a significant role in real-world agricultural operations, were not included in the DEM simulations or wear predictions. This focused approach was deliberate, allowing us to isolate and fundamentally characterize the unique soft abrasive wear mechanisms caused by silica-rich rice, which represents a critical knowledge gap addressed for the first time in this study.
Looking ahead, this research can be further advanced in the following directions:
Model Sophistication: Incorporating chemo-mechanical effects into the model to more comprehensively simulate the synergistic action of wear and corrosion in humid field environments. Furthermore, the model could be enhanced by introducing hard particles (e.g., sand) to investigate wear behavior under mixed-abrasive conditions. This will involve developing sophisticated multi-component DEM models that integrate granular mechanics with wear models for complex mixed-abrasive flows, thereby expanding the realism of the tribological system. Beyond current simplifications, future work could also explore more advanced constitutive models for rice stalks, accounting for their anisotropic properties and complex internal structures to enhance DEM simulation accuracy. Additionally, future research should investigate the tribological behavior of components with various rice varieties, beyond Nanjing 46. This expansion would quantify the influence of different rice properties (e.g., varying silica content, stalk hardness, grain morphology) on wear rates and mechanisms, thereby broadening the applicability of the findings and validating the universality of the identified wear principles.
Materials and Surface Engineering: The established experimental and simulation platform can be leveraged to evaluate the performance of various wear-resistant materials (e.g., high-chromium cast iron, surface coatings) under rice-induced wear conditions. This would provide a scientific basis for the application of novel materials.
Dynamic Wear Evolution: Future development could focus on a dynamic wear simulation model capable of real-time geometry updates. This would allow for simulation of the feedback effect of wear on material flow behavior, enabling more accurate predictions of wear evolution over longer time scales. Additionally, the model could be extended to predict wear on other critical components of agricultural machinery and for different crop types and environmental conditions.
Author Contributions

Conceptualization, H.Z., Z.T., X.G. and B.Z.; Methodology, H.Z., Z.T., X.G. and B.Z.; Software, H.Z., Z.T. and B.Z.; Validation, H.Z. and Z.T.; Formal analysis, H.Z. and Z.T.; Investigation, H.Z., Z.T., X.G. and B.Z.; Resources, H.Z. and Z.T.; Data curation, H.Z. and Z.T.; Writing—original draft, H.Z. and B.Z.; Writing—review & editing, Z.T.; Visualization, H.Z. and Z.T.; Supervision, H.Z. and Z.T.; Project administration, H.Z. and Z.T.; Funding acquisition, H.Z. and Z.T. All authors have read and agreed to the published version of the manuscript.

Funding

This research was funded by Jiangsu University. And The APC was funded by Honglei Zhang.

Data Availability Statement

The original contributions presented in this study are included in the article. Further inquiries can be directed to the corresponding author.

Acknowledgments

This research work was supported by the Postgraduate Research & Practice Innovation Program of Jiangsu Province (KYCX25_4246), Natural Science Foundation of Jiangsu Province (BK20221368), Ministry of Education (MAET202326), and the Priority Academic Program Development of Jiangsu Higher Education Institutions (No. PAPD-2023-87).

Conflicts of Interest

The authors declare no conflicts of interest.

Statement on the Use of Generative AI and AI Assisted Technologies in the Writing Process

No generative AI or AI-assisted technologies were used during the preparation of this work.

References

  1. Wang, B.; Du, X.X.; Wang, Y.N.; Mao, H.P. Multi-machine collaboration realization conditions and precise and efficient production mode of intelligent agricultural machinery. Int. J. Agric. Biol. Eng. 2024, 17, 27–36. [Google Scholar] [CrossRef]
  2. Ma, Z.; Zhu, Y.L.; Li, J.L.; Song, Z.Q.; Yu, J.; Li, Y.M.; Xu, L.Z. Study on the performance of detection air duct and evaluation index of agricultural cleaning centrifugal fans. Biosyst. Eng. 2024, 239, 81–97. [Google Scholar] [CrossRef]
  3. Ding, C.B.; Wang, L.M.; Chen, X.Y.; Yang, H.T.; Huang, L.X.; Song, X.M. A Blockchain-Based Wide-Area Agricultural Machinery Resource Scheduling System. Appl. Eng. Agric. 2023, 39, 1–12. [Google Scholar] [CrossRef]
  4. Zhao, Z.; Huang, H.D.; Yin, J.J.; Yang, S.X. Dynamic analysis and reliability design of round baler feeding device for rice straw harvest. Biosyst. Eng. 2018, 174, 10–19. [Google Scholar] [CrossRef]
  5. Liang, Z.W.; Li, Y.M.; Xu, L.Z.; Zhao, Z. Sensor for monitoring rice grain sieve losses in combine harvesters. Biosyst. Eng. 2016, 147, 51–66. [Google Scholar] [CrossRef]
  6. Xu, L.Z.; Hansen, A.C.; Li, Y.M.; Liang, Z.W.; Yu, L.J. Numerical and Experimental Analysis of Airflow in a Multi-Duct Cleaning System for a Rice Combine Harvester. Trans. Asabe 2016, 59, 1101–1110. [Google Scholar] [CrossRef]
  7. Tang, Z.; Li, Y.M.; Cheng, C. Development of multi-functional combine harvester with grain harvesting and straw baling. Span. J. Agric. Res. 2017, 15, 1–10. [Google Scholar] [CrossRef]
  8. Wei, C.C.; Xu, L.Z.; Wang, J.T.; Li, Y.M. Inertial force balance and ADAMS simulation of the oscillating sieve and return pan of a rice combine harvester. Int. J. Agric. Biol. Eng. 2018, 11, 129–137. [Google Scholar] [CrossRef]
  9. Pang, J.; Li, Y.M.; Ji, J.T.; Xu, L.Z. Vibration excitation identification and control of the cutter of a combine harvester using triaxial accelerometers and partial coherence sorting. Biosyst. Eng. 2019, 185, 25–34. [Google Scholar] [CrossRef]
  10. Chai, X.Y.; Zhou, Y.; Xu, L.Z.; Li, Y.; Li, Y.M.; Lv, L.Y. Effect of guide strips on the distribution of threshed outputs and cleaning losses for a tangential-longitudinal flow rice combine harvester. Biosyst. Eng. 2020, 198, 223–234. [Google Scholar] [CrossRef]
  11. Ali, A.B.; Hong, L.; Elshaikh, N.A.; Basheer, A.K.; Yan, H.F. Impact of Center Pivot Sprinkler Speed and Water Regimes on Potato Crop Productivity. Int. J. Agric. Biol. 2016, 18, 1174–1180. [Google Scholar] [CrossRef]
  12. Il Islam, M.D.; Rahman, A.; Sarker, M.S.R.; Luo, J.C.; Liang, H. Factors affecting farmers’ willingness to adopt crop insurance to manage disaster risk: Evidence from Bangladesh. Int. Food Agribus. Manag. Rev. 2021, 24, 463–479. [Google Scholar] [CrossRef]
  13. Yuan, L.M.; Cai, J.R.; Sun, L.; Ye, C. A Preliminary Discrimination of Cluster Disqualified Shape for Table Grape by Mono-Camera Multi-Perspective Simultaneously Imaging Approach. Food Anal. Methods 2016, 9, 758–767. [Google Scholar] [CrossRef]
  14. Lakhiar, I.A.; Gao, J.M.; Syed, T.N.; Chandio, F.A.; Tunio, M.H.; Ahmad, F.; Solangi, K.A. Overview of the aeroponic agriculture—An emerging technology for global food security. Int. J. Agric. Biol. Eng. 2020, 13, 1–10. [Google Scholar] [CrossRef]
  15. Alhussam, M.I.; Ren, J.F.; Yao, H.X.; Abu Risha, O. Food Trade Network and Food Security: From the Perspective of Belt and Road Initiative. Agriculture 2023, 13, 1571. [Google Scholar] [CrossRef]
  16. Liu, W.; Zeng, S.; Chen, X. Design and Experiment of Adaptive Profiling Header Based on Multi-Body Dynamics-Discrete Element Method Coupling. Agriculture 2024, 14, 105. [Google Scholar] [CrossRef]
  17. Liu, S.F.; Tang, Z.; Shen, C.; Wang, T.; Liang, Y.Q. Effect of Rice Stubble on Soil Compaction Properties of a Crawler Undergoing Combine Harvester Harvesting. Eng. Agric. 2023, 43, 1–12. [Google Scholar] [CrossRef]
  18. Jing, T.T.; Tang, Z.; Ding, Z.; Liang, Y.Q.; Fang, M.; Wang, T. Paddy Soil Compaction Effect Undergoing Multi-Dimensional Dynamic Load of Combine Harvester Crawler. Agriculture 2024, 14, 202. [Google Scholar] [CrossRef]
  19. Guan, C.S.; Fu, J.J.; Xu, L.; Jiang, X.Z.; Wang, S.L.; Cui, Z.C. Study on the reduction of soil adhesion and tillage force of bionic cutter teeth in secondary soil crushing. Biosyst. Eng. 2022, 213, 133–147. [Google Scholar] [CrossRef]
  20. Guan, C.S.; Fu, J.J.; Cui, Z.C.; Wang, S.L.; Gao, Q.S.; Yang, Y.T. Evaluation of the tribological and anti-adhesive properties of different materials coated rotary tillage blades. Soil Tillage Res. 2021, 209, 104933. [Google Scholar] [CrossRef]
  21. Chen, S.R.; Ding, H.T.; Tang, Z.; Hao, S.H.; Zhao, Y.F. Influence of rice straw forming factors on ring die wear and improved wear prediction model during briquetting. Biosyst. Eng. 2022, 214, 122–137. [Google Scholar] [CrossRef]
  22. Guo, Y.F.; Sun, Z.Y.; Guo, S.; Fu, J.L. Research on a Novel Heat Treatment Process for Boron Steel Used for Soil-Engaging Components of Tillage Machinery. Agriculture 2024, 14, 1555. [Google Scholar] [CrossRef]
  23. Fu, J.; Zhang, M.; Cheng, C.; Zhao, H.; Ren, L. Mechanism study of the effect of a surface liquid film on the collision adhesion behaviour of rice stalks. Biosyst. Eng. 2025, 251, 61–72. [Google Scholar] [CrossRef]
  24. Liu, W.J.; Zeng, S.; Chen, X.G. Vortex Cleaning Device for Rice Harvester: Design and Bench Test. Agriculture 2024, 14, 886. [Google Scholar] [CrossRef]
  25. Ma, Z.; Zhu, Y.L.; Wu, Z.P.; Traore, S.N.; Chen, D.; Xing, L.C. BP neural network model for material distribution prediction based on variable amplitude anti-blocking screening DEM simulations. Int. J. Agric. Biol. Eng. 2023, 16, 190–199. [Google Scholar] [CrossRef]
  26. Zhang, S.; Tekeste, M.Z.; Li, Y.; Gaul, A.; Zhu, D.; Liao, J. Scaled-up rice grain modelling for DEM calibration and the validation of hopper flow. Biosyst. Eng. 2020, 194, 196–212. [Google Scholar] [CrossRef]
  27. Mei, F.; Li, B.; Xu, Z.; Li, X.; Zhu, X. Discrete element modeling of straw bale: An innovative approach to simulate the compression mechanics of fiber-based materials. Comput. Electron. Agric. 2025, 231, 110002. [Google Scholar] [CrossRef]
  28. Yuan, H.; Liang, S.; Wang, J.; Lu, Y. Numerical Simulation and Analysis of Vibrating Rice Filling Based on EDEM Software. Agriculture 2022, 12, 2013. [Google Scholar] [CrossRef]
  29. Yu, Y.; Cheng, Y.; Fan, C.; Chen, L.; Wu, Q.; Qiao, M.; Zhou, X. Automatic Control System for Maize Threshing Concave Clearance Based on Entrainment Loss Monitoring. Processes 2025, 13, 58. [Google Scholar] [CrossRef]
  30. Wang, J.; Xu, C.; Xu, W.; Fu, Z.; Wang, Q.; Tang, H. Discrete element method simulation of rice grain motion during discharge with an auger operated at various inclinations. Biosyst. Eng. 2022, 223, 97–115. [Google Scholar] [CrossRef]
  31. Tekeste, M.Z.; Mousaviraad, M.; Rosentrater, K.A. Discrete Element Model Calibration Using Multi-Responses and Simulation of Corn Flow in a Commercial Grain Auger. Trans. Asabe 2018, 61, 1743–1755. [Google Scholar] [CrossRef]
  32. Tian, Y.; Leis, K.; Zeng, Z. Retrofitting and Testing of a Pull-Type Small-Grain Combine Harvester. Agronomy 2023, 13, 1057. [Google Scholar] [CrossRef]
  33. Zareiforoush, H.; Komarizadeh, M.H.; Alizadeh, M.R.; Masoomi, M.; Tavakoli, H. Performance evaluation of screw augers in paddy grains handling. Int. Agrophysics 2010, 24, 389–396. [Google Scholar]
  34. Huang, S.; Huang, J.; Guo, J.; Mo, Y. Study on Wear Properties of the Flow Parts in a Centrifugal Pump Based on EDEM-Fluent Coupling. Processes 2019, 7, 431. [Google Scholar] [CrossRef]
  35. Zhao, Q.; Dai, F.; Shi, R.; Zhao, W.; Xu, P.; Deng, H.; Pan, H. Effect of Operating Parameters on the Mulching Device Wear Behavior of a Ridging and Mulching Machine. Lubricants 2024, 12, 19. [Google Scholar] [CrossRef]
  36. Wang, Z.; Wang, R.; Fei, Q.; Li, J.; Tang, J.; Shi, B. Structure and Microscopic Wear Analysis of Lining Material Based on EDEM. In Proceedings of the International Conference on Electronic Information Technology and Computer Engineering (EITCE), Beijing Normal University, Zhuhai, China, 23–24 September 2017. [Google Scholar]
  37. Napiorkowski, J.; Lemecha, M.; Konat, L. Forecasting the Wear of Operating Parts in an Abrasive Soil Mass Using the Holm-Archard Model. Materials 2019, 12, 2180. [Google Scholar] [CrossRef]
  38. Tekeste, M.Z.; Balvanz, L.R.; Hatfield, J.L.; Ghorbani, S. Discrete element modeling of cultivator sweep-to-soil interaction: Worn and hardened edges effects on soil-tool forces and soil flow. J. Terramechanics 2019, 82, 1–11. [Google Scholar] [CrossRef]
  39. Fei, J.; Sun, Z.; Zhao, D.; Li, A.; Jia, F.; Han, Y.; Li, H.; Ji, S.; Li, Z.; Feng, W. Investigation of rice debranning mechanism based on tribological behaviour between rice grains. Biosyst. Eng. 2024, 248, 130–141. [Google Scholar] [CrossRef]
  40. Yang, L.; Fan, Y.; Song, S.; Wang, D.; Zhang, Y.; Cao, M. Frictional behavior of brown rice grain during moderate processing. Tribol. Int. 2021, 162, 107123–107135. [Google Scholar] [CrossRef]
  41. Romek, D.; Selech, J.; Ulbrich, D. Use of Heat-Applied Coatings to Reduce Wear on Agricultural Machinery Components. Materials 2024, 17, 2849. [Google Scholar] [CrossRef]
  42. Ma, S.; Xu, L.; Xu, S.; Tan, H.; Song, J.; Shen, C. Wear study on flexible brush-type soil removal component for removing soil used to protect grapevines against cold. Biosyst. Eng. 2023, 228, 88–104. [Google Scholar] [CrossRef]
  43. Li, B. On the use of fractal methods for the tool flank wear characterization. Int. J. Refract. Met. Hard Mater. 2014, 42, 221–227. [Google Scholar] [CrossRef]
  44. Yuan, C.Q.; Li, J.; Yan, X.P.; Peng, Z. The use of the fractal description to characterize engineering surfaces and wear particles. Wear 2003, 255, 315–326. [Google Scholar] [CrossRef]
  45. Ding, C.; Jiang, L.; Xu, J.; Guo, S.; Zhang, J.; Xiong, P.; Piao, Z. Correlation Between Spatial Fractal and Temporal Chaos During the Sling Wear Process of AISI 5120 Steel. Int. J. Bifurc. Chaos 2025, 35, 1–27. [Google Scholar] [CrossRef]
  46. Lang, S.; Zhu, H.; Lian, X. Study on the Tribological Behaviors of a Wave Glider’s Wing’s Rotating Shaft Using Fractal and Chaotic Analysis. Lubricants 2025, 13, 185. [Google Scholar] [CrossRef]
  47. Lee, S.-J.; Lee, J.H. Application of Discrete Element Method Coupled with Computational Fluid Dynamics to Predict the Erosive Wear Behavior of Arctic Vessel Hulls Subjected to Ice Impacts. J. Mar. Sci. Eng. 2023, 11, 1774. [Google Scholar] [CrossRef]
  48. Li, S.; Wang, Z.; Mou, D. Fractal Analysis of Volcanic Rock Image Based on Difference Box-Counting Dimension and Gray-Level Co-Occurrence Matrix: A Case Study in the Liaohe Basin, China. Fractal Fract. 2025, 9, 118. [Google Scholar] [CrossRef]
Figure 1. A comprehensive methodological framework.
Lubricants 13 00388 g001
Figure 2. Schematic structure of tribological test rig: (a) 2D view of tribological test rig structure; (b) solid view of tribological test rig; (c) schematic of stalk-on-grinding; (d) schematic of grain-on-grinding.
Lubricants 13 00388 g002
Figure 3. Velocity–displacement profile of the crank-slider mechanism.
Lubricants 13 00388 g003
Figure 4. (a) Metal samples and sampling points; (b) mass measurement of a specimen using a BS-224S analytical balance.
Lubricants 13 00388 g004
Figure 5. In-situ testing of experimental loads on combine harvester cutting decks: (a) Location of test points on the cutting deck; (b) Data acquisition system and thin film pressure sensors.
Lubricants 13 00388 g005
Figure 6. Geometric model of the header platform: 3D CAD model of the (a) side view and (b) top view; (c) model of the header platform unit; (d) schematic of the simulation of the harvest conveyor of the header platform.
Lubricants 13 00388 g006
Figure 7. Model diagram of rice spike.
Lubricants 13 00388 g007
Figure 8. Calibration of the three-point bending test: (a) diagram of the three-point bending test setup—physical tester TA XTPLUS; (b) calibration test; (c) simulation test.
Lubricants 13 00388 g008
Figure 9. (a) Wear contour drawing of the header platform; (b) wear contour mapping of the header platform.
Lubricants 13 00388 g009
Figure 10. Determining the W-M fractal surface corresponding to the fractal dimension.
Lubricants 13 00388 g010
Figure 11. (a) Wear test data of the straw group; (b) wear test data of the grains group.
Lubricants 13 00388 g011
Figure 12. Seed A1B1 group Q235 wear surface: (a) not cleaned; (b) cleaned.
Lubricants 13 00388 g012
Figure 13. Morphological image of group A3B3 grains magnified 2000 times after wear: (a) 3D data image, (b) depth-synthesized image, (c) contour line of the metal plate perpendicular to the wear direction.
Lubricants 13 00388 g013
Figure 14. Grain group A3B3 magnified 2000× grayscale image (a) with topographic fractal dimension (b).
Lubricants 13 00388 g014
Figure 15. Equivalent elastic modulus response surface: (a) contour plot of equivalent elastic modulus (Eeq) as a function of normal stiffness (Ae1) and tangential stiffness (Be1); (b) 3D surface plot of equivalent elastic modulus (Eeq) as a function of normal stiffness (Ae1) and tangential stiffness (Be1).
Lubricants 13 00388 g015
Figure 16. Predicted response value: (a) target value of modulus of elasticity; (b) optimal value of normal stiffness; (c) optimal value of tangential stiffness.
Lubricants 13 00388 g016
Figure 17. Evolution of header platform wear.
Lubricants 13 00388 g017
Figure 18. Actual header platform worn edge curve and simulated worn edge curve: (a) Actual curve; (b) Simulated curve.
Lubricants 13 00388 g018
Table 1. Factors and levels for the orthogonal test.
Test No.Contact Load (A)/(N)Rotational Speed (B)/(rpm)
10.05 (A1)60 (B1)
20.5 (A2)120 (B2)
31 (A3)180 (B3)
Table 2. Constant process parameters for bench wear tests.
ParameterValueUnit
Specimen MaterialQ235 Steel-
Specimen Hardness165HB
Specimen Dimensions100 × 33.3mm
Abrasive MaterialFresh Rice (Nanjing 46 variety)-
Stalk Abrasive Geometry50 mm length, 3–5.5 mm diameter-
Grain Abrasive Geometry6.65–8.21 mm major axis, 2.52–3.25 mm minor axis-
Total Test Duration per Run240hours
Abrasive Replacement FrequencyEvery 60 h-
Environmental ConditionsLaboratory Ambient (controlled)-
Table 3. Summary of material exposure parameters.
MaterialCoefficient of RestitutionCoefficient of Static FrictionCoefficient of Rolling FrictionWear Constant/(Pa−1)
Grain–Grain0.470.650.15/
Grain–Stalk0.20.30.1/
Stalk–Stalk0.560.30.07/
Grain–Steel0.490.450.14 × 10−11
Stalk–Steel0.3570.3630.2083 × 10−11
Table 4. Summary of elastic modulus in orthogonal experimental design.
Run OrderNormal Stiffness (Ae1)/(N/m3)Tangential Stiffness (Be1)/(N/m3)Equivalent Elastic Modulus (Eeq)/(GPa)
13 × 10128.57864 × 10101.8615
21 × 10125 × 10111.4037
35.82843 × 10121.5 × 10122.0500
43 × 10122.91421 × 10121.8825
53 × 10121.5 × 10121.8819
63 × 10121.5 × 10121.8816
71.71573 × 10111.5 × 10120.5419
85 × 10122.5 × 10122.0265
93 × 10121.5 × 10121.8788
103 × 10121.5 × 10121.8819
111 × 10122.5 × 10121.4074
123 × 10121.5 × 10121.8819
135 × 10125 × 10112.0226
Table 5. Estimated fractal dimensions and absolute errors for W-M surfaces.
No.Theoretical Fractal DimensionCalculated Value (DBC Method)
Calculated ValueAbsolute Error
12.012.1042−0.1254
22.12.1813−0.0813
32.22.2511−0.0511
42.32.3139−0.0139
52.42.4022−0.0022
62.52.44920.0508
72.62.56780.0322
82.72.59970.1003
92.82.69040.1096
102.92.67060.2294
112.992.72380.2862
Table 6. Results of weight loss for each combination.
Horizontal CombinationA1B1A1B2A1B3
Stalk wear (g)0.0026 ± 0.00010.0050 ± 0.00020.0073 ± 0.0003
Seed wear (g)0.0037 ± 0.00010.0078 ± 0.00030.0115 ± 0.0004
Horizontal CombinationA2B1A2B2A2B3
Stalk wear (g)0.0254 ± 0.00100.0505 ± 0.00200.0759 ± 0.0030
Seed wear (g)0.0377 ± 0.00150.0757 ± 0.00300.1135 ± 0.0045
Horizontal CombinationA3B1A3B2A3B3
Stalk wear (g)0.0511 ± 0.00200.1020 ± 0.00400.1362 ± 0.0050
Seed wear (g)0.0749 ± 0.00300.1501 ± 0.00600.2151 ± 0.0080
Table 7. Summary of regression analysis for wear volume.
SourceSum of SquaresdfMean SquareF-Valuep-ValueSignificance
Stalk Wear (g)
Model (Load, Speed)0.01620.00828.1880.001Highly Significant
Residual0.00260.000
Total0.0188
Grain Wear (g)
Model (Load, Speed)0.03720.01925.4020.001Highly Significant
Residual0.00460.001
Total0.0428
Note: p-values < 0.05 indicate statistical significance.
Table 8. Swing results of each combination.
Horizontal CombinationA1B1A1B2A1B3A2B1A2B2
Initial Group 12.17352.18242.21382.19362.2039
Stalks2.18262.19322.24142.23782.2593
Difference0.00910.01080.02760.04420.0554
Initial Group 22.19242.16872.16882.18262.1916
Grain2.20292.17992.20492.23322.2558
Difference0.01050.01120.03610.05060.0642
Horizontal CombinationA2B3A3B1A3B2A3B3
Initial Group 12.18512.20352.19482.1863
Stalks2.25652.25612.28842.3113
Difference0.07140.05260.09360.125
Initial Group 22.17922.19622.18972.1678
Grain2.25532.25942.30752.3156
Difference0.07610.06320.11780.1478
Table 9. Response surface analysis results for linkage parameters.
SourceSum of SquaresdfMean SquareF-Valuep-Value
Model2.0680.2571.35 × 1051.38 × 10−10
Ae1—Normal Stiffness1.1511.156.04 × 1051.65 × 10−11
Be1—Tangential Stiffness2.20 × 10−412.20 × 10−41154.25 × 10−4
Ae1Bee16.64 × 10−916.64 × 10−93.48 × 10−30.956
Ae120.48110.4812.52 × 1059.45 × 10−11
Be121.20 × 10−411.20 × 10−4631.36 × 10−3
Ae12Be16.13 × 10−516.13 × 10−532.14.78 × 10−3
Ae1Be120.10310.1035.41 × 1042.05 × 10−9
Ae12Be120.033113.31 × 10−21.73 × 1042.00 × 10−8
Disclaimer/Publisher’s Note: The statements, opinions and data contained in all publications are solely those of the individual author(s) and contributor(s) and not of MDPI and/or the editor(s). MDPI and/or the editor(s) disclaim responsibility for any injury to people or property resulting from any ideas, methods, instructions or products referred to in the content.