1. Introduction
In aircraft engines, cylindrical roller bearings inevitably operate under high temperatures, high speeds, heavy loads, and other extreme conditions, and lubrication failure often emerges as the predominant failure mode [
1,
2,
3]. This phenomenon arises from the tribological coupling behaviors at the line contact interfaces, including hydrodynamic effects, frictional contact, and wear evolution, which significantly accelerate the degradation of lubrication performance [
4,
5]. Timely identification of lubrication degradation and implementation of maintenance strategies are critical for preventing premature bearing failures.
The Stribeck curve, as a classical framework in elastohydrodynamic lubrication theory, provides macroscopic judgment criteria for identifying the lubrication degradation—from full-film to mixed and boundary lubrication—by delineating nonlinear evolution patterns of the friction coefficient concerning operational parameters such as velocity, load, and viscosity [
6]. In fundamental experimental studies, the identification of lubrication degradation has traditionally relied on the Stribeck curve [
7,
8]. However, in engineering applications, this approach faces challenges in the online measurement of the friction coefficient and operational parameters due to sensor integration. Furthermore, while the Stribeck curve reveals macroscopic trends in lubrication regime transitions, it fails to establish quantitative criteria for identifying the lubrication degradation. To address these limitations, the film thickness ratio λ (defined as the ratio of the nominal minimum lubricant film thickness and the composite root mean square surface roughness height) has been proposed as a quantitative indicator, with empirical thresholds conventionally set as λ < 1 for boundary lubrication, 1 < λ < 3 for mixed lubrication, and λ > 3 for full-film lubrication [
9]. Nevertheless, this empirical relationship was derived from early stochastic analyses. Due to inadequate consideration of surface topography evolution and heterogeneous asperity contact distribution, it exhibits insufficient identification accuracy.
With advancements in sensing and information science technology, researchers have investigated the correlation between the lubrication degradation process and various condition monitoring signals to identify different lubrication states. For instance, given the analogous trends displayed for acoustic emission (AE) signals and oil film thickness concerning lubricant viscosity, Hou et al. [
10] proposed a methodology for estimating bearing lubrication states based on AE features. Xing et al. [
11] extracted the friction-induced vibration signals with two different amplitude–frequency characteristics and explored their relationships with various friction states. Results show that the friction-induced vibration can be used to identify boundary, mixed, and fluid friction states. Duan et al. [
12] conducted experimental studies on the identification of lubrication states of line contact friction pairs, and results showed that the oil film thickness measured via the ultrasonic method can distinguish elastohydrodynamic lubrication from mixed lubrication. Subsequently, the application of machine learning algorithms has significantly advanced the lubrication identification research field. By integrating clustering algorithms, artificial neural networks, and other machine learning methods, the mapping models between the above monitoring features and the lubrication degradation states were constructed [
13,
14,
15]. These methods effectively improve the accuracy and efficiency of lubrication degradation identification efforts.
The above investigations characterized the lubrication degradation process of friction pair interfaces through multi-dimensional analyses, encompassing oil film thickness, surface friction, and wear. However, from the perspective of the lubrication degradation mechanism, a single physical monitoring method is usually effective for a specific lubrication state. For instance, the oil film thickness monitoring is only applicable to a full-film lubrication state, while the vibration and acoustic emission methods become meaningful during the lubrication states involving surface contacts. Therefore, using a single physical monitoring indicator, it is difficult to characterize the entire lubrication degradation process. Moreover, current investigations predominantly depend on qualitative trend comparisons with the Stribeck curve, exhibiting a critical deficiency in mechanistic interpretability.
Physics-informed, data-driven (PIDD) methodologies have revolutionized conventional lubrication modelling and identification paradigms by embedding fluid dynamics-governing equations (e.g., Navier–Stokes and Reynolds equations) as constraints within neural network architectures [
16]. This approach enables accurate prediction of key tribological parameters, including oil film thickness, pressure distribution, elastic deformation, and friction coefficients, while simultaneously identifying lubrication states. For instance, Zhao et al. [
17,
18,
19] applied the physics-informed neural network (PINN) to the analysis of 2D hydrodynamic lubrication, demonstrating that the PINN could achieve satisfactory accuracy in calculating the film thickness, pressure distributions, and elastic responses. Xia et al. [
20] developed a PINN model to address both forward and inverse problems related to frictional contact temperature. The results show that the PINN exhibits exceptional predictive accuracy across various operational scenarios. Tang et al. [
21] used a multiscale lubrication neural network model (MLNN) to solve the Reynolds equation for rough surfaces exhibiting complex multiscale features. The proposed model reduces errors in terms of predicting the pressure distribution and load-carrying capacity, which are crucial for optimizing tribological systems requiring accurate surface interaction modelling. Although PIDD methods offer novel analytical perspectives, current research studies remain limited to parameter prediction and methodological validation, lacking robust solutions for tracking lubrication degradation processes under coupled tribological behaviors at contact interfaces. Further development is needed to address complex engineering scenarios requiring domain-specific knowledge integration.
In summary, while the classical Stribeck curve lays the theoretical foundation for lubrication state identification, its engineering applications face limitations due to the challenges in real-time monitoring of intrinsic parameters and the absence of precise identification criteria. Various physical monitoring methods, including vibration, acoustic emission, and oil film thickness monitoring, can effectively identify the lubrication states with the collaboration of machine learning algorithms. However, existing studies predominantly rely on a single physical monitoring indicator, limiting comprehensive analysis efforts. Additionally, their black box nature compromises the interpretability. Although PIDD approaches have advanced the lubrication identification research through the prediction of key tribological parameters, it is still in a preliminary research stage and is not sufficient to explain the complex degradation process involving coupled frictional behaviors. The above analysis reveals two key shortcomings in current lubrication state identification research: (1) a single physical monitoring indicator is insufficient to characterize the complete lubrication degradation process; (2) the mechanism interpretation of the degradation process remains inadequate.
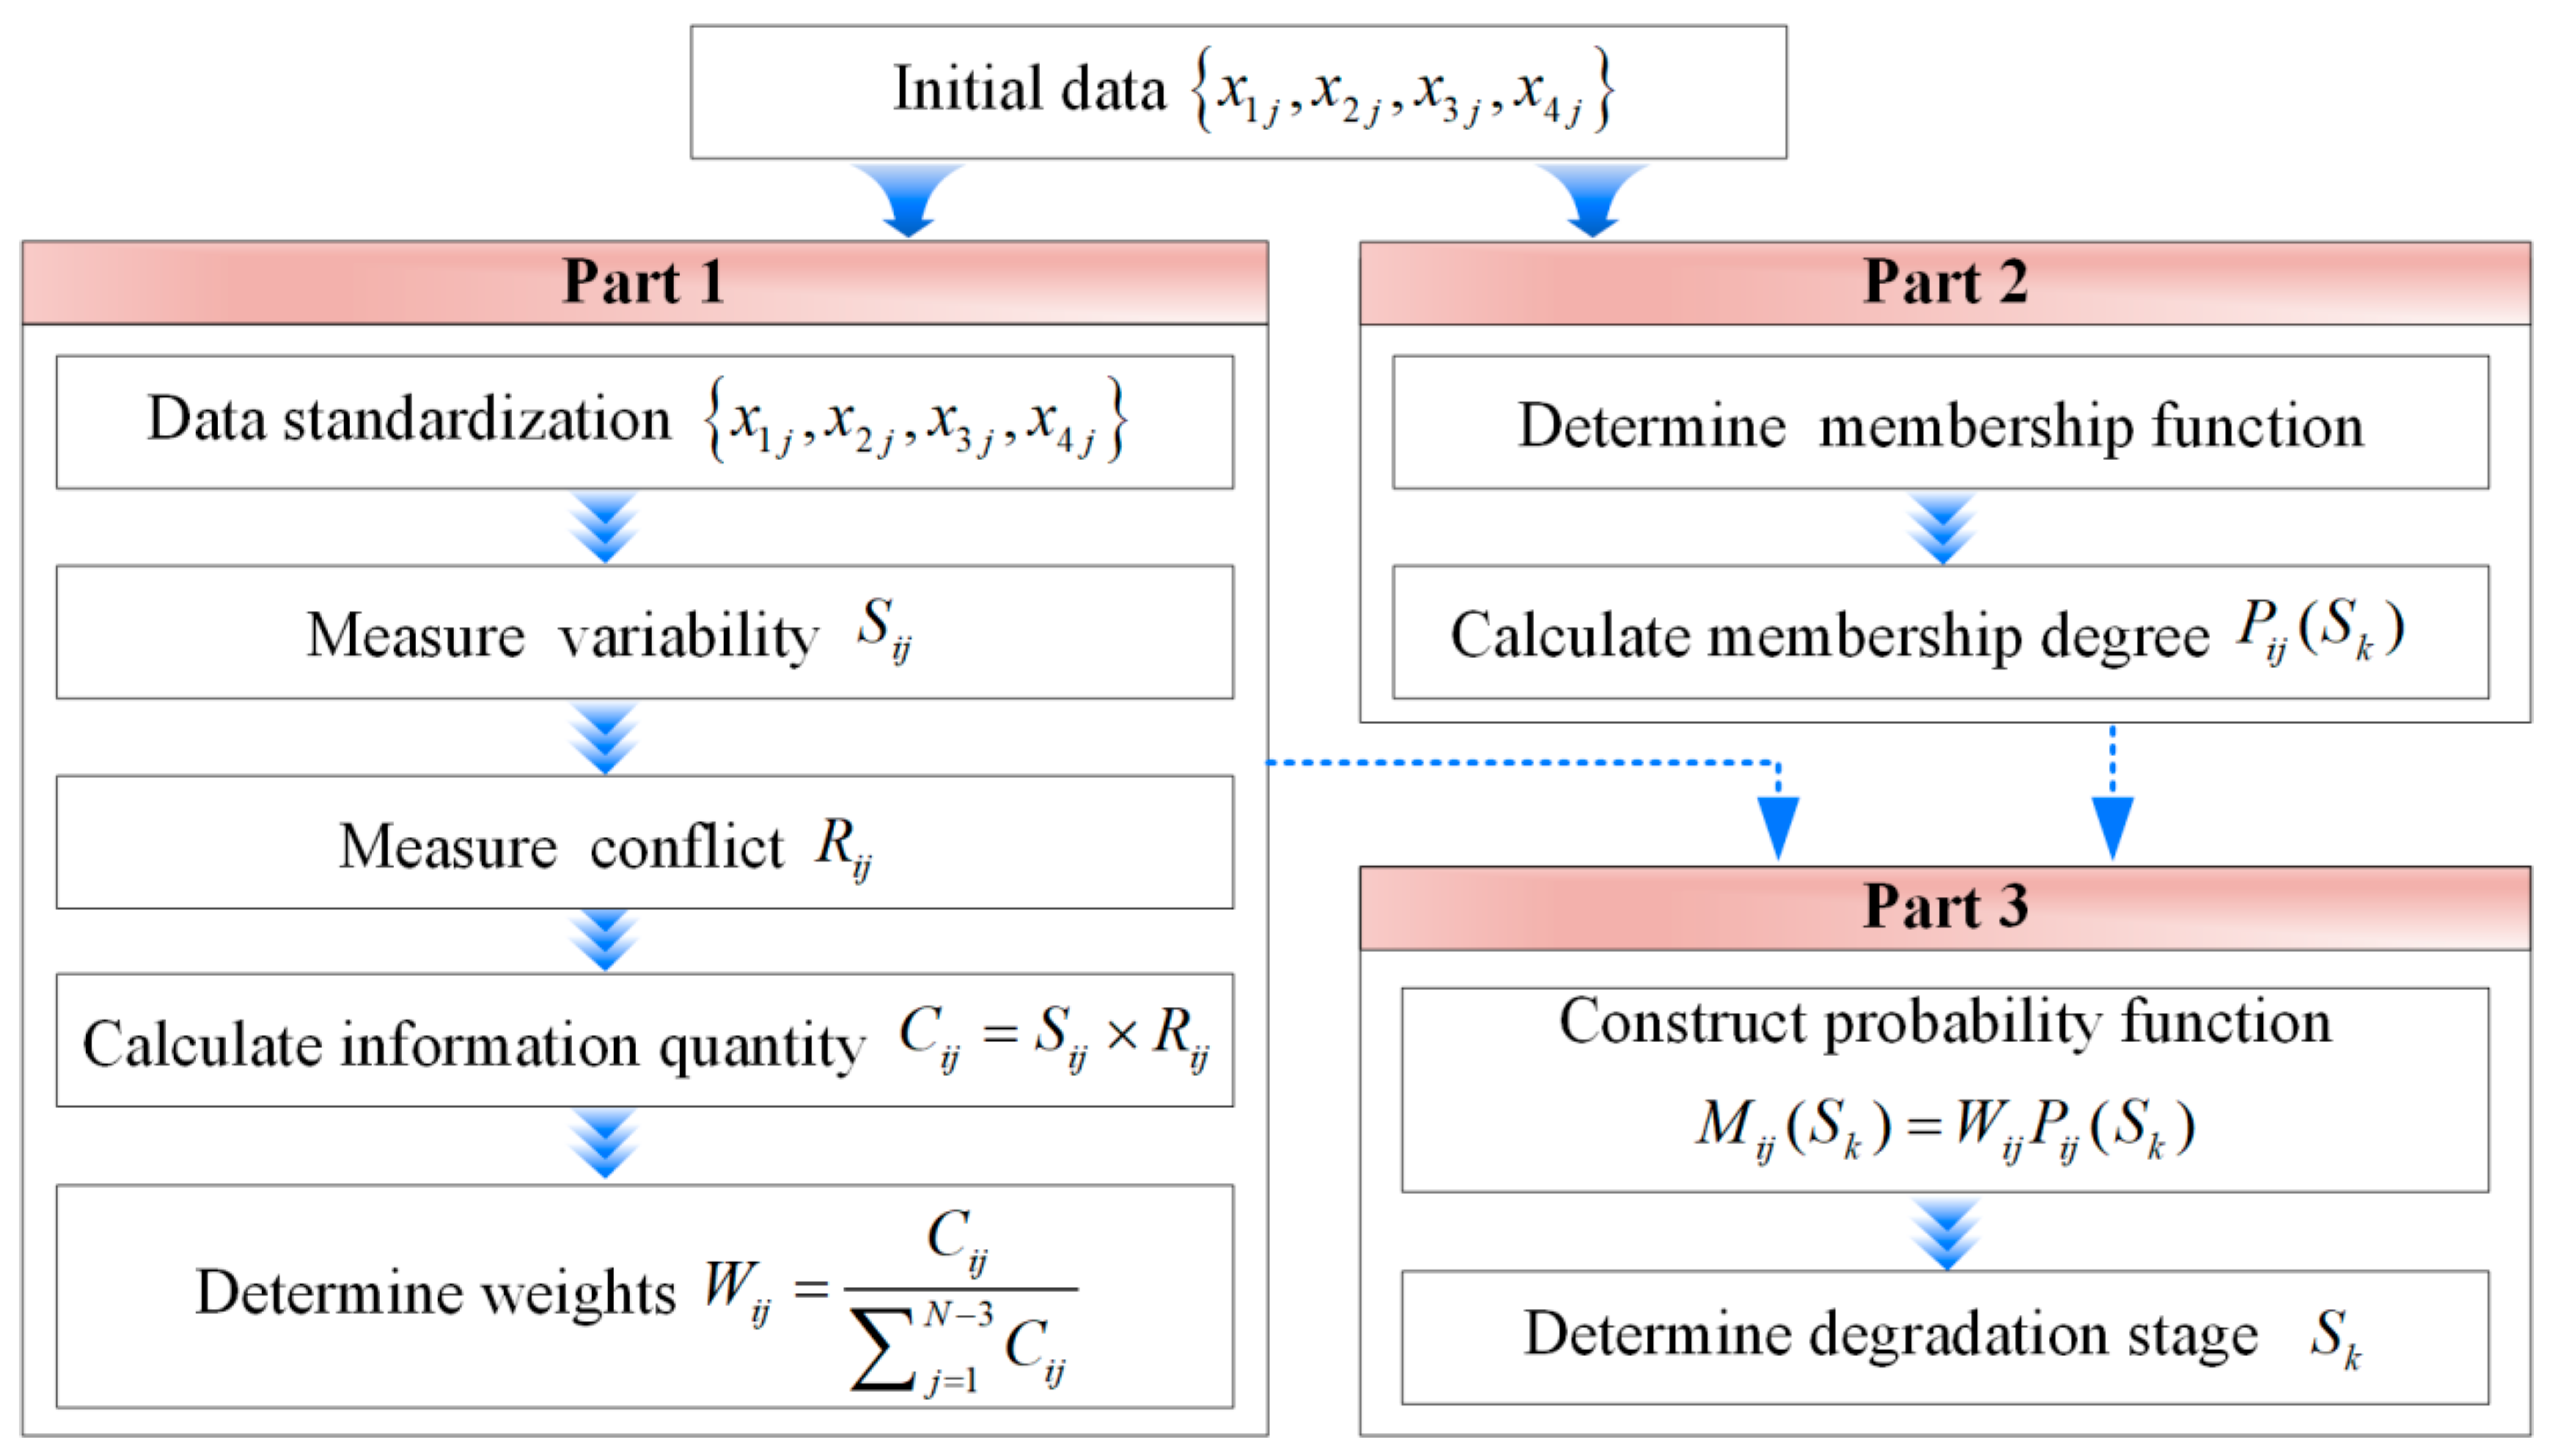
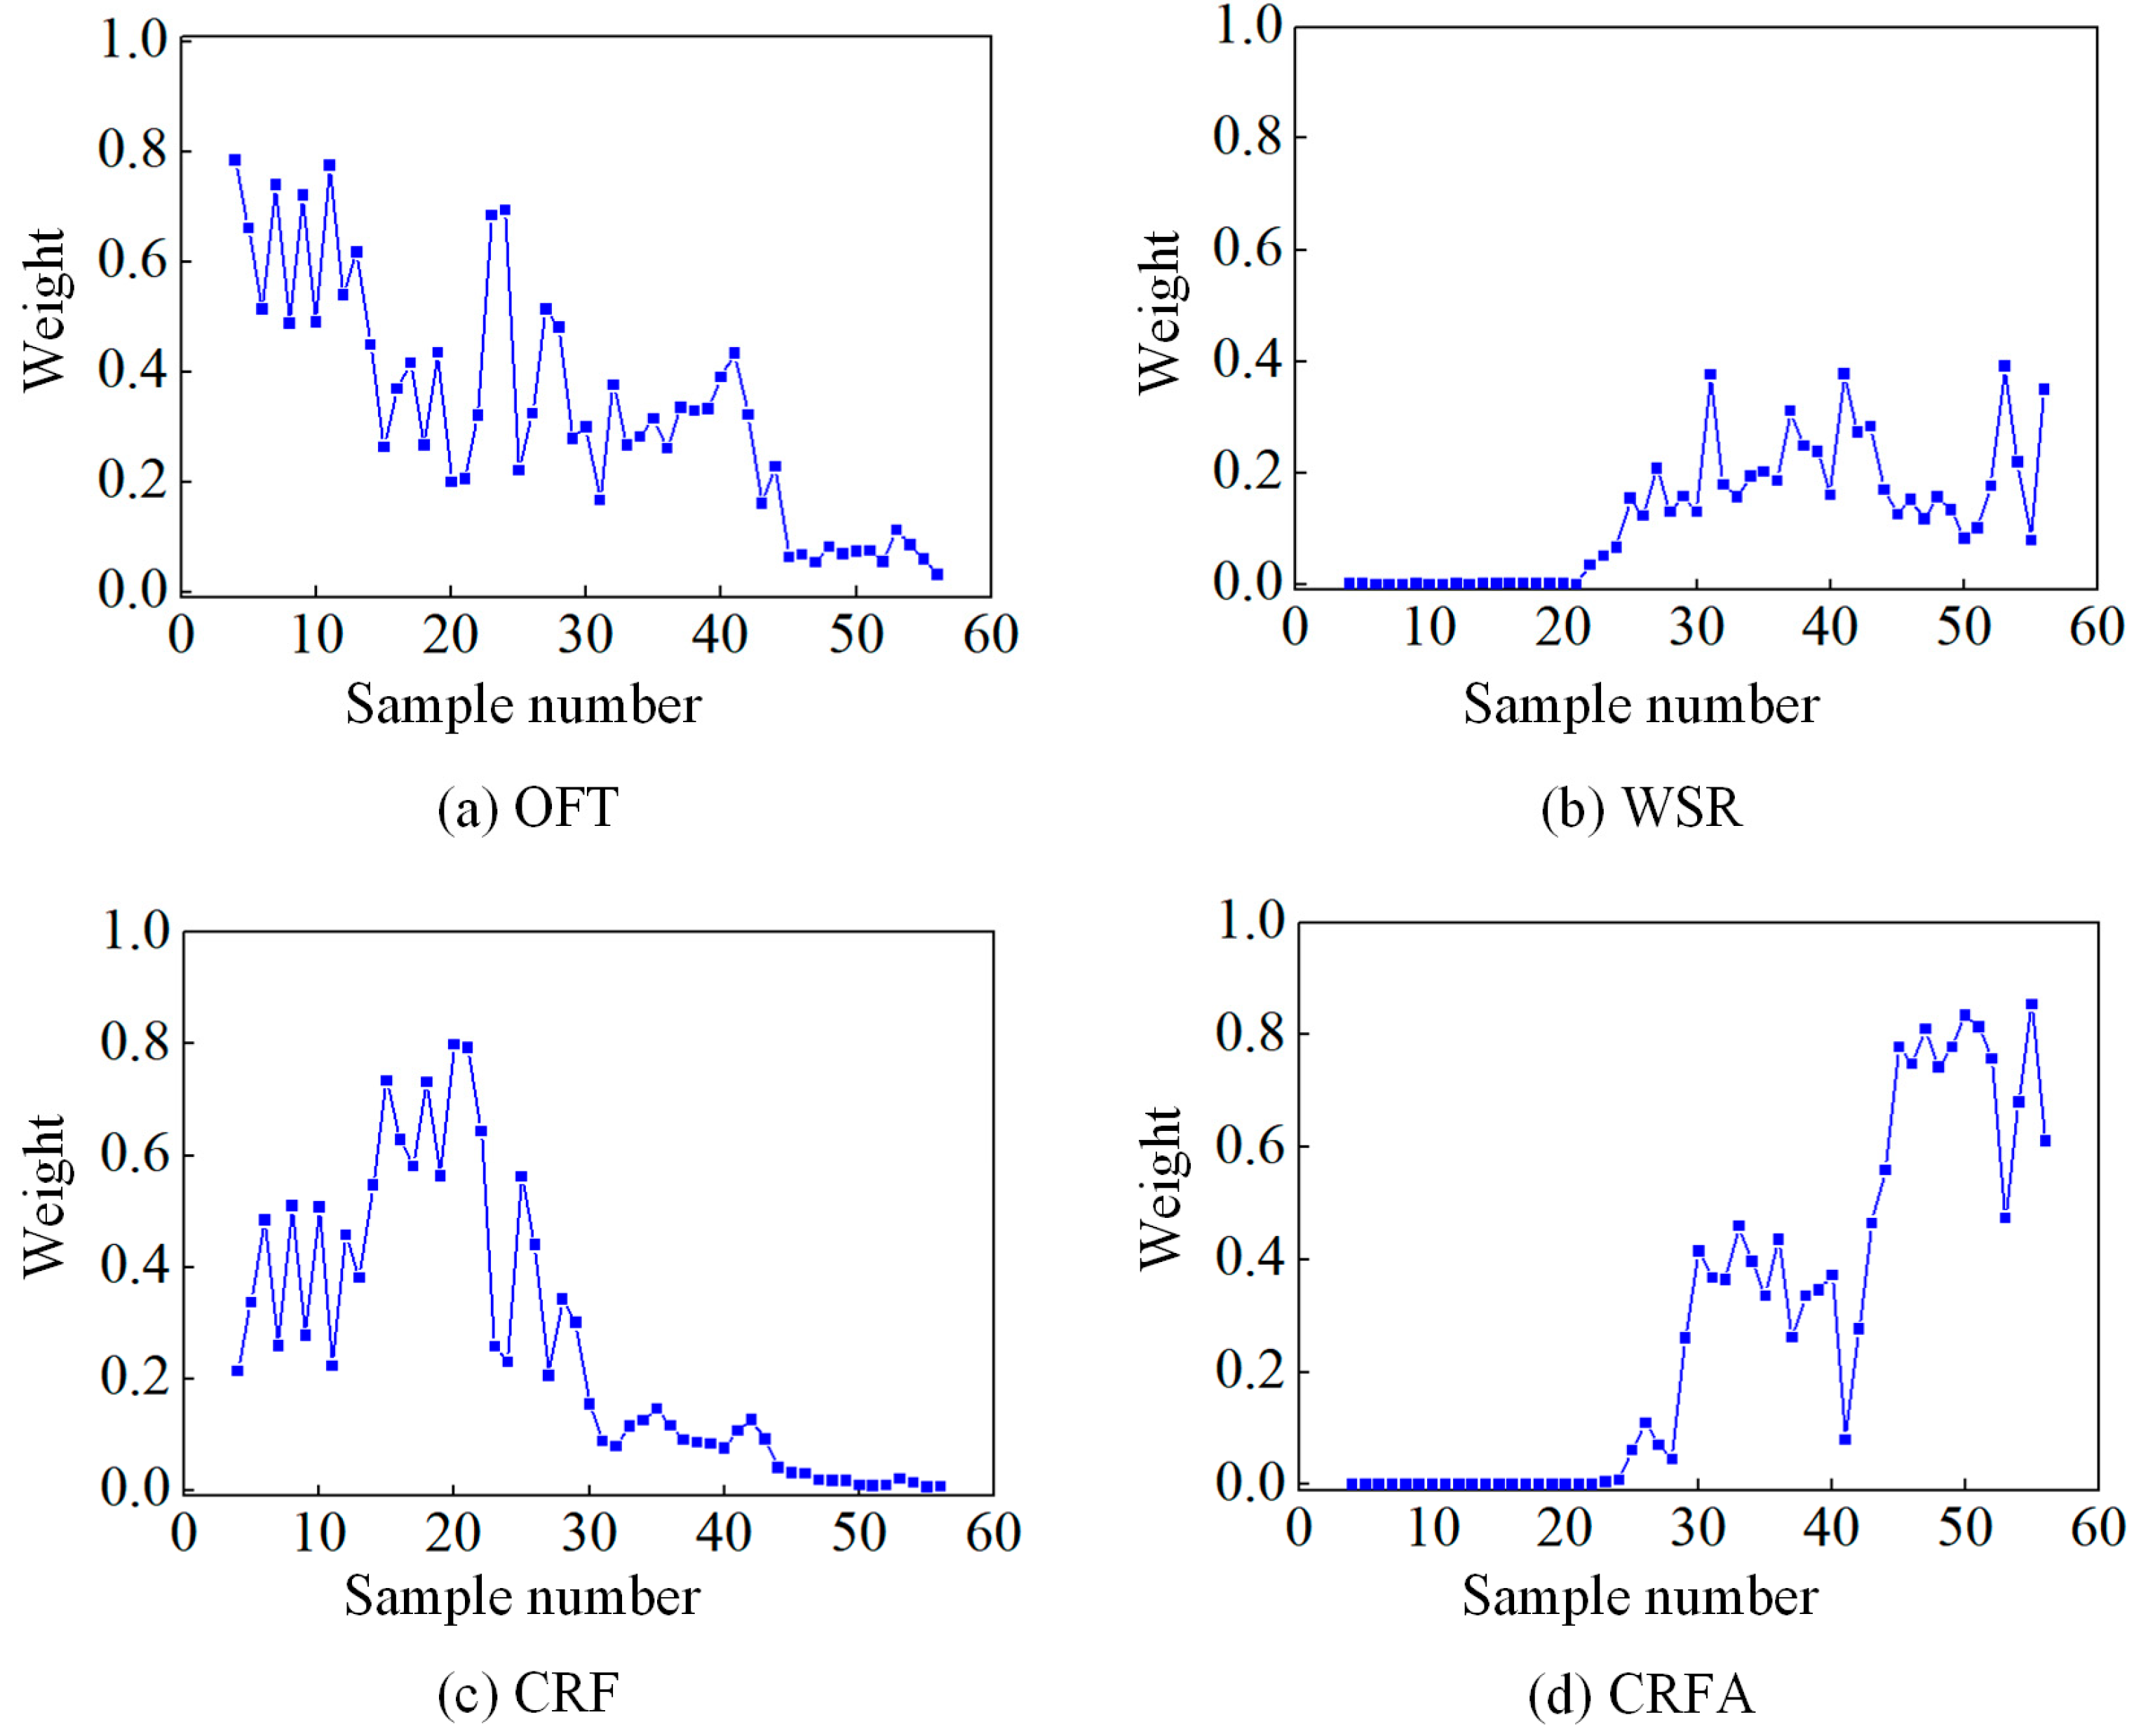
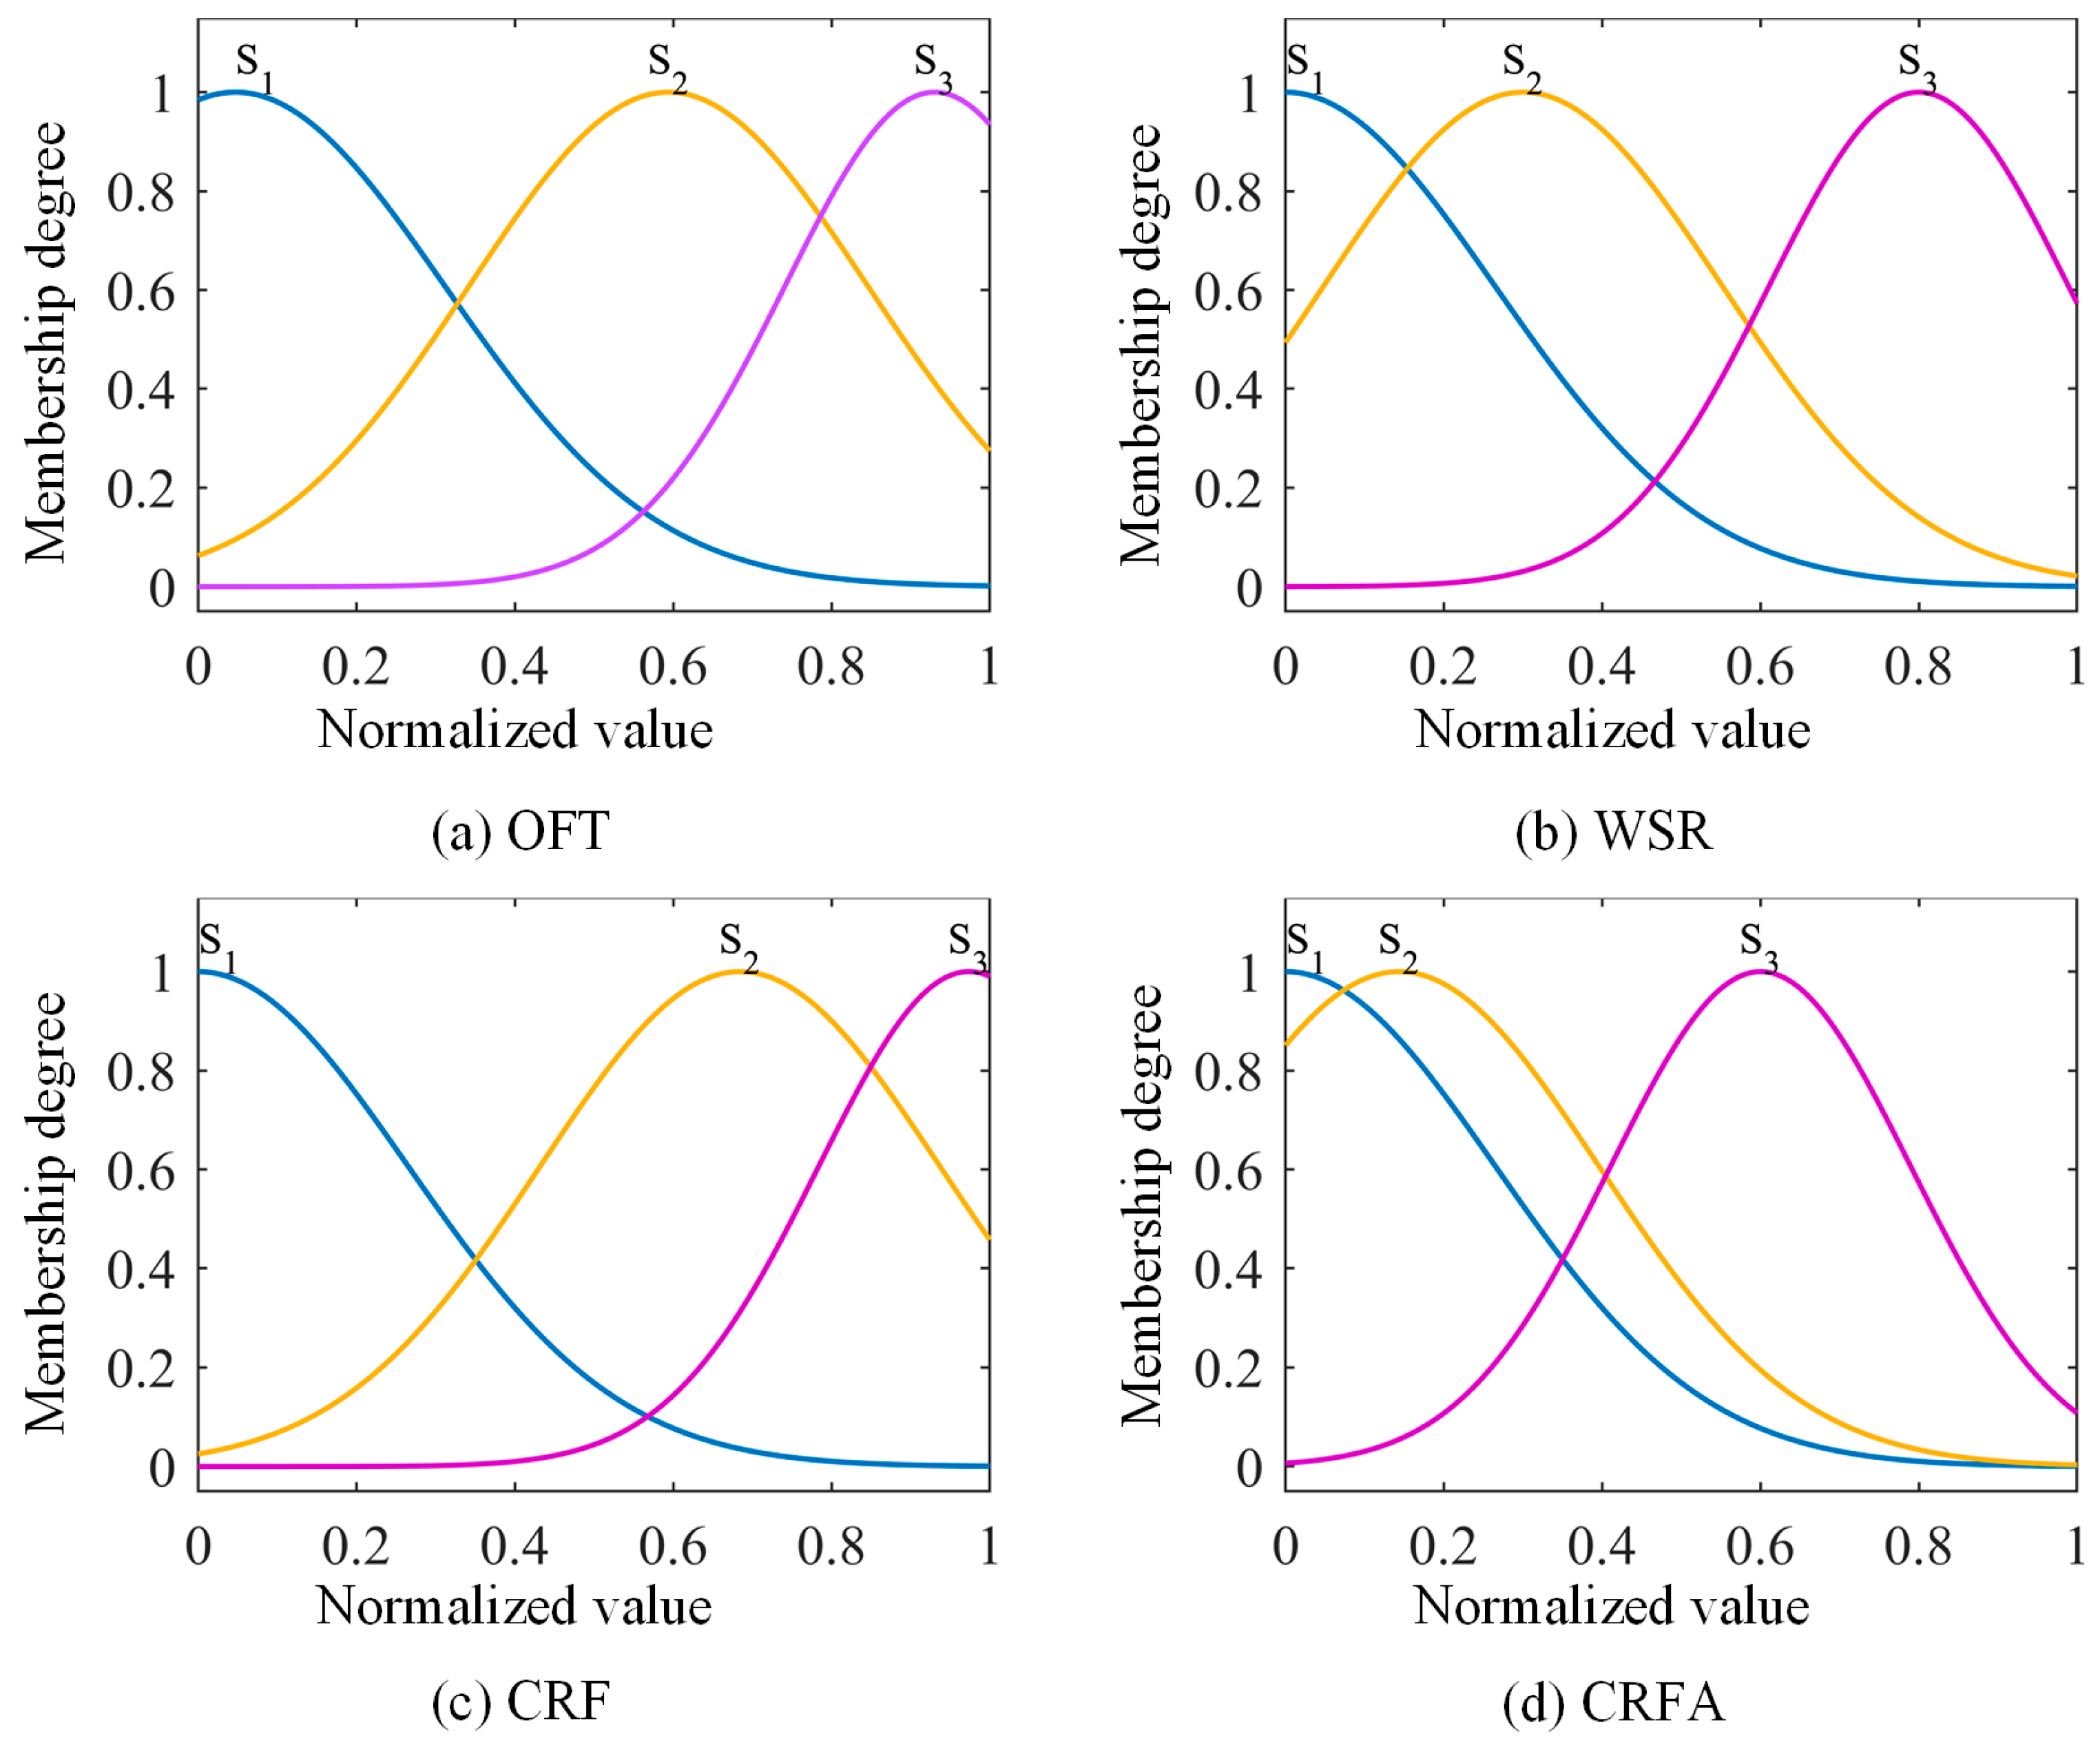
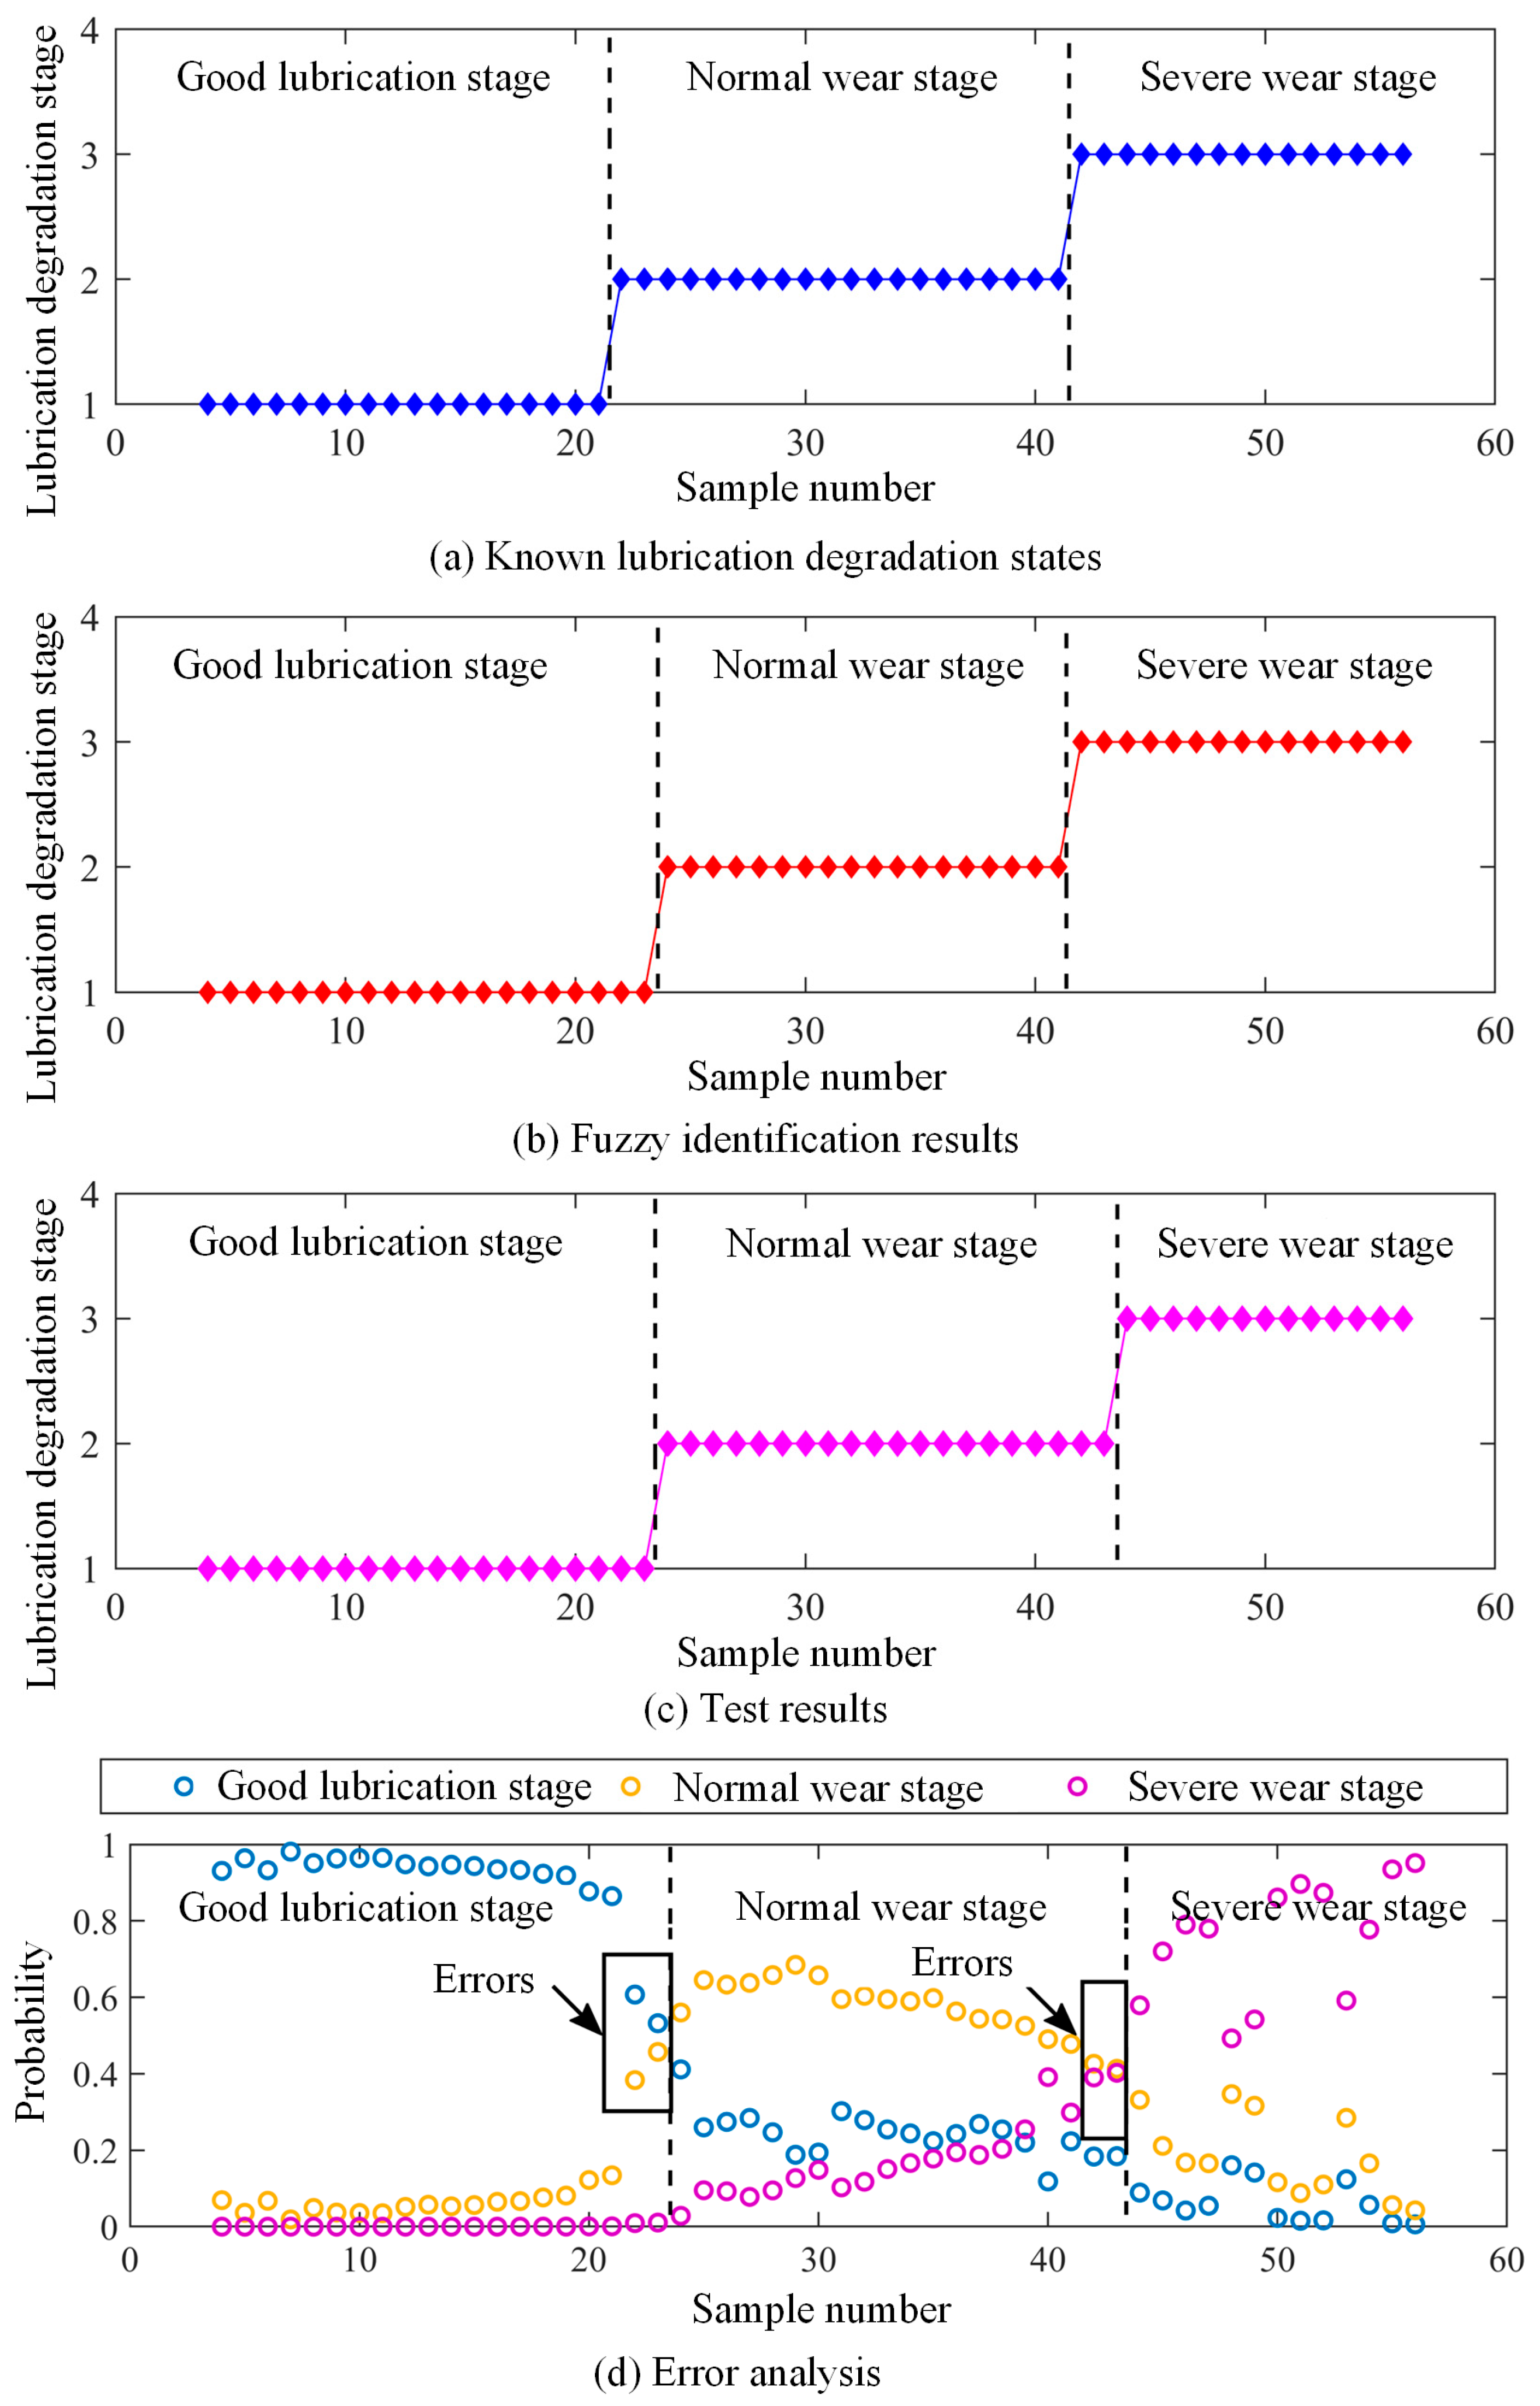
To address these two issues, this study proposes a fuzzy evaluation method for lubrication degradation state identification. Based on the coupled degradation mechanisms (oil film rupture, solid contact, and surface wear) in rolling–sliding contacts, multiple monitoring indicators extracted from the mixed elastohydrodynamic lubrication and contact dynamic models are integrated to characterize the complete lubrication degradation process. Distinct from existing machine learning and PIDD methods, this study assesses the diagnostic value of multiple monitoring indicators through mechanism evolution law and probability distribution to distinguish three typical lubrication degradation stages, which provides the superior interpretability of the multifactorial coupled lubrication degradation process analysis.
This paper is organized as follows.
Section 2 introduces the methodology for characterizing lubrication degradation.
Section 3 proposes a multi-index fusion approach for lubrication degradation identification. Experimental validation methods and results are detailed in
Section 4, followed by conclusions in
Section 5.
2. Lubrication Degradation Characterization
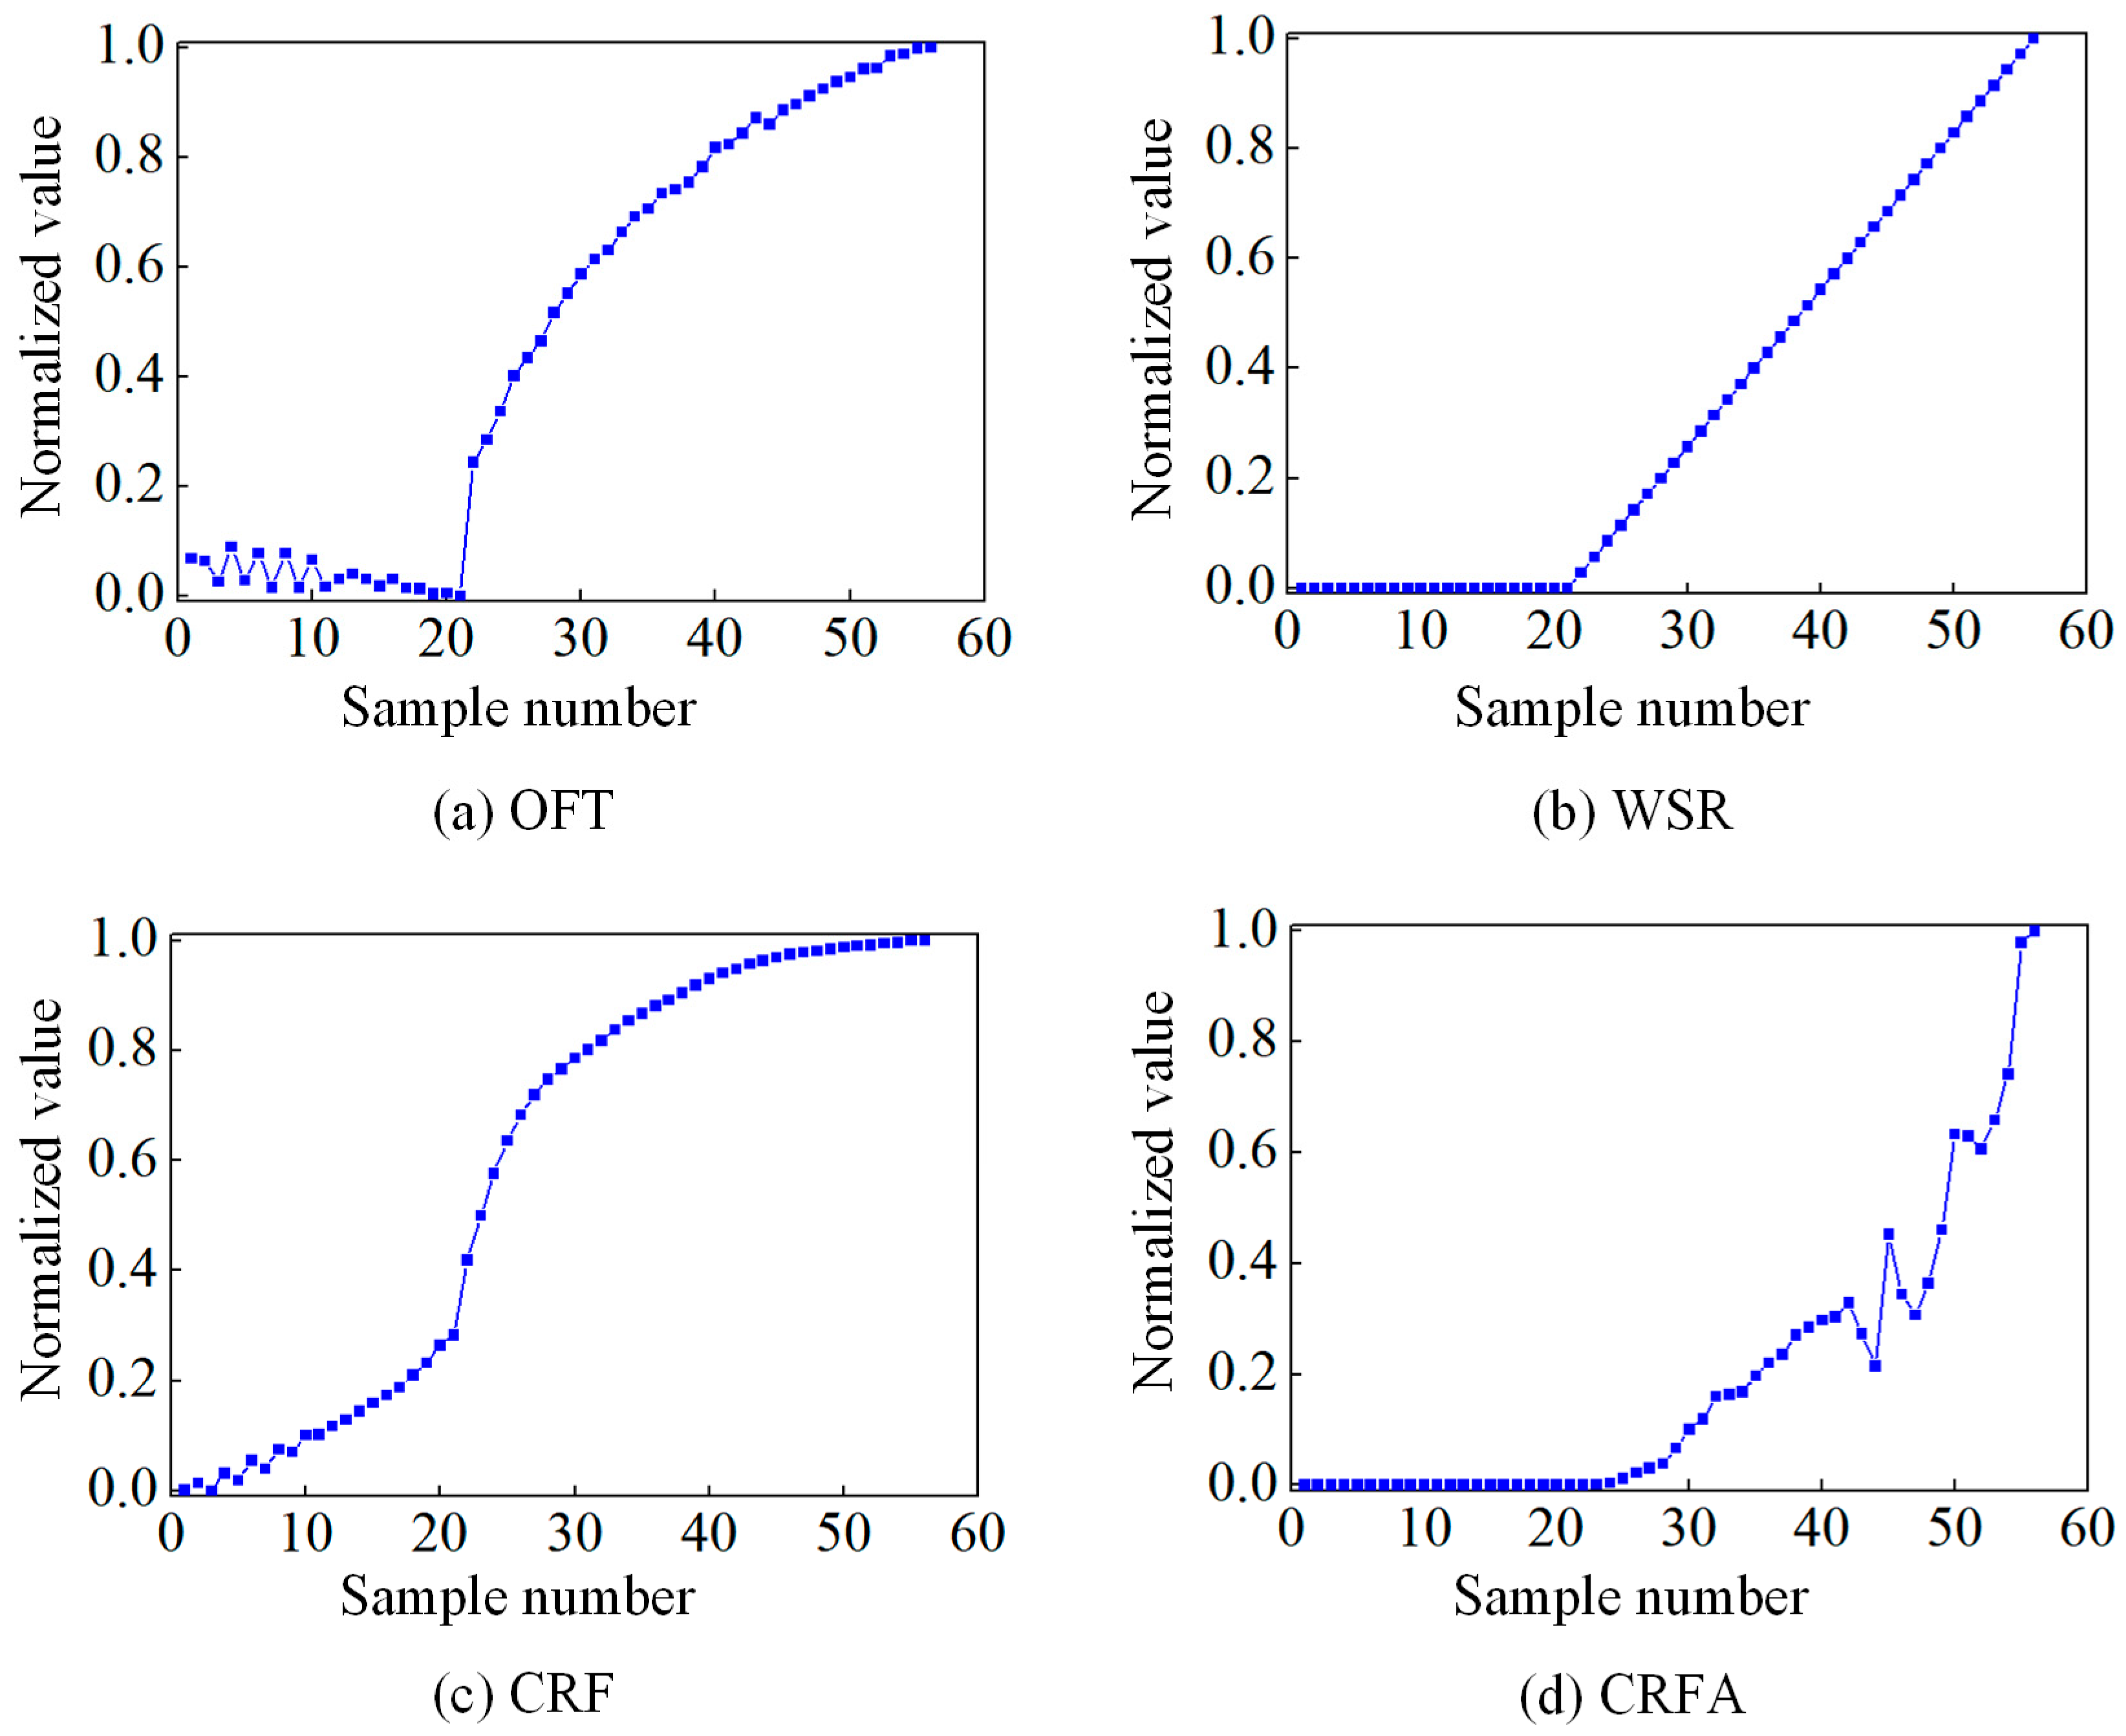
The lubrication degradation process of a line contact friction pair under ideal conditions is simulated using a coupled mixed-EHL model and contact dynamic model. Four key monitoring indicators are extracted to characterize this process—the oil film thickness (OFT), wear surface roughness (WSR), contact resonance frequency (CRF), and amplitude of CRF (CRFA). The evolutionary trend analysis reveals three distinct degradation stages—good lubrication, normal wear, and severe wear, as illustrated in
Figure 1.
2.1. Mixed-EHL Model
The mixed-EHL model is established with a mixed elastohydrodynamic lubrication analysis software that is capable of analyzing lubrication and contact characteristics in a wide range of operating conditions and simulating surface interactions in a full spectrum of lubrication regimes, from full-film and mixed lubrication down to boundary lubrication and dry contact. This commercial software, provided by Tri-Tech Solutions Inc., was developed by Professor Dong Zhu, a leading scholar in tribology, based on many years of research documented in technical papers. Numerous model validation cases have been conducted to ensure the accuracy of numerical simulation results in his early studies [
22,
23,
24,
25,
26]. The governing equations are detailed below.
Under mixed lubrication conditions, the pressure within the entire domain is governed by the Reynolds equation below [
22]:
where the
-coordinate coincides with the motion direction,
is the pressure distributed over the solution domain, and
is the sliding velocity;
is the lubricant density, which can be expressed as [
27]:
where
is the density of the lubricant at
. The effective viscosity
is calculated as follows to describe the non-Newtonian effects [
28]:
where
is a reference shear stress and
denotes the shear stress acting on the lower surface. The viscosity
follows the Barus rule, which can be expressed as [
29]:
where
is the lubricant viscosity at
and
is the pressure–viscosity exponent.
The local oil film thickness
(or gap between two rough surfaces) is formulated as [
22]:
Here,
is the normal approach between the contacting bodies,
refers to the effective radii of curvature across the contact width, and
and
denote the real roughness heights of surfaces 1 and 2, respectively. The surface elastic deformation
is obtained through the Boussinesq integral [
30]:
where
is the equivalent elastic modulus and
indicates the entire solution domain.
The load balance equation is [
22]:
Friction in mixed lubrication is usually considered as the comprehensive effect of hydrodynamic friction and asperity contact friction. The shear stress
in the hydrodynamic area can be estimated by the Bair–Winer model, expressed as [
31]:
in which the limiting shear stress
and the limiting shear elastic modulus
are functions of pressure and temperature that can be estimated empirically. The flash temperature is calculated as follows [
22]:
where
is the heat generated either by the lubricant shear stress in the hydrodynamic areas or the boundary friction in the asperity contact areas.
In the asperity contact area, the friction coefficient
is assumed as a constant (typically between 0.08 and 0.12) [
19], and the shear stress
can be expressed as:
The total friction
can then be obtained through the integration of shear stress over the entire domain, which can be expressed as:
where
is the hydrodynamic area and
is the asperity contact area.
Based on the above basic governing equations, the specific rough surfaces, constant geometric parameters, material parameters, lubricant properties, and operating conditions are input into the mixed-EHL solver. The mixed-EHL solver numerically solves the Reynolds equation using a finite difference scheme on a 256 × 256 structured grid. The computational domain spans [−1.9a, 1.9a] × [−1.6b, 1.6b] in the x-y plane, where a and b represent the Hertzian contact ellipse semi-axes. The rough surfaces are dynamically updated at each time step, and after convergence, yielding spatial distributions of film thickness, pressure, contact ratio, and friction coefficient. These results reflect the friction contact behavior under different lubrication states. The major input geometric, material, and lubricant parameters are summarized in
Table 1.
To validate the model accuracy, a specific case was conducted using the parameters in
Table 1, with a load of 500 N, speeds ranging from 4 to 0.2 m/s, and a composite surface roughness of 0.5 μm.
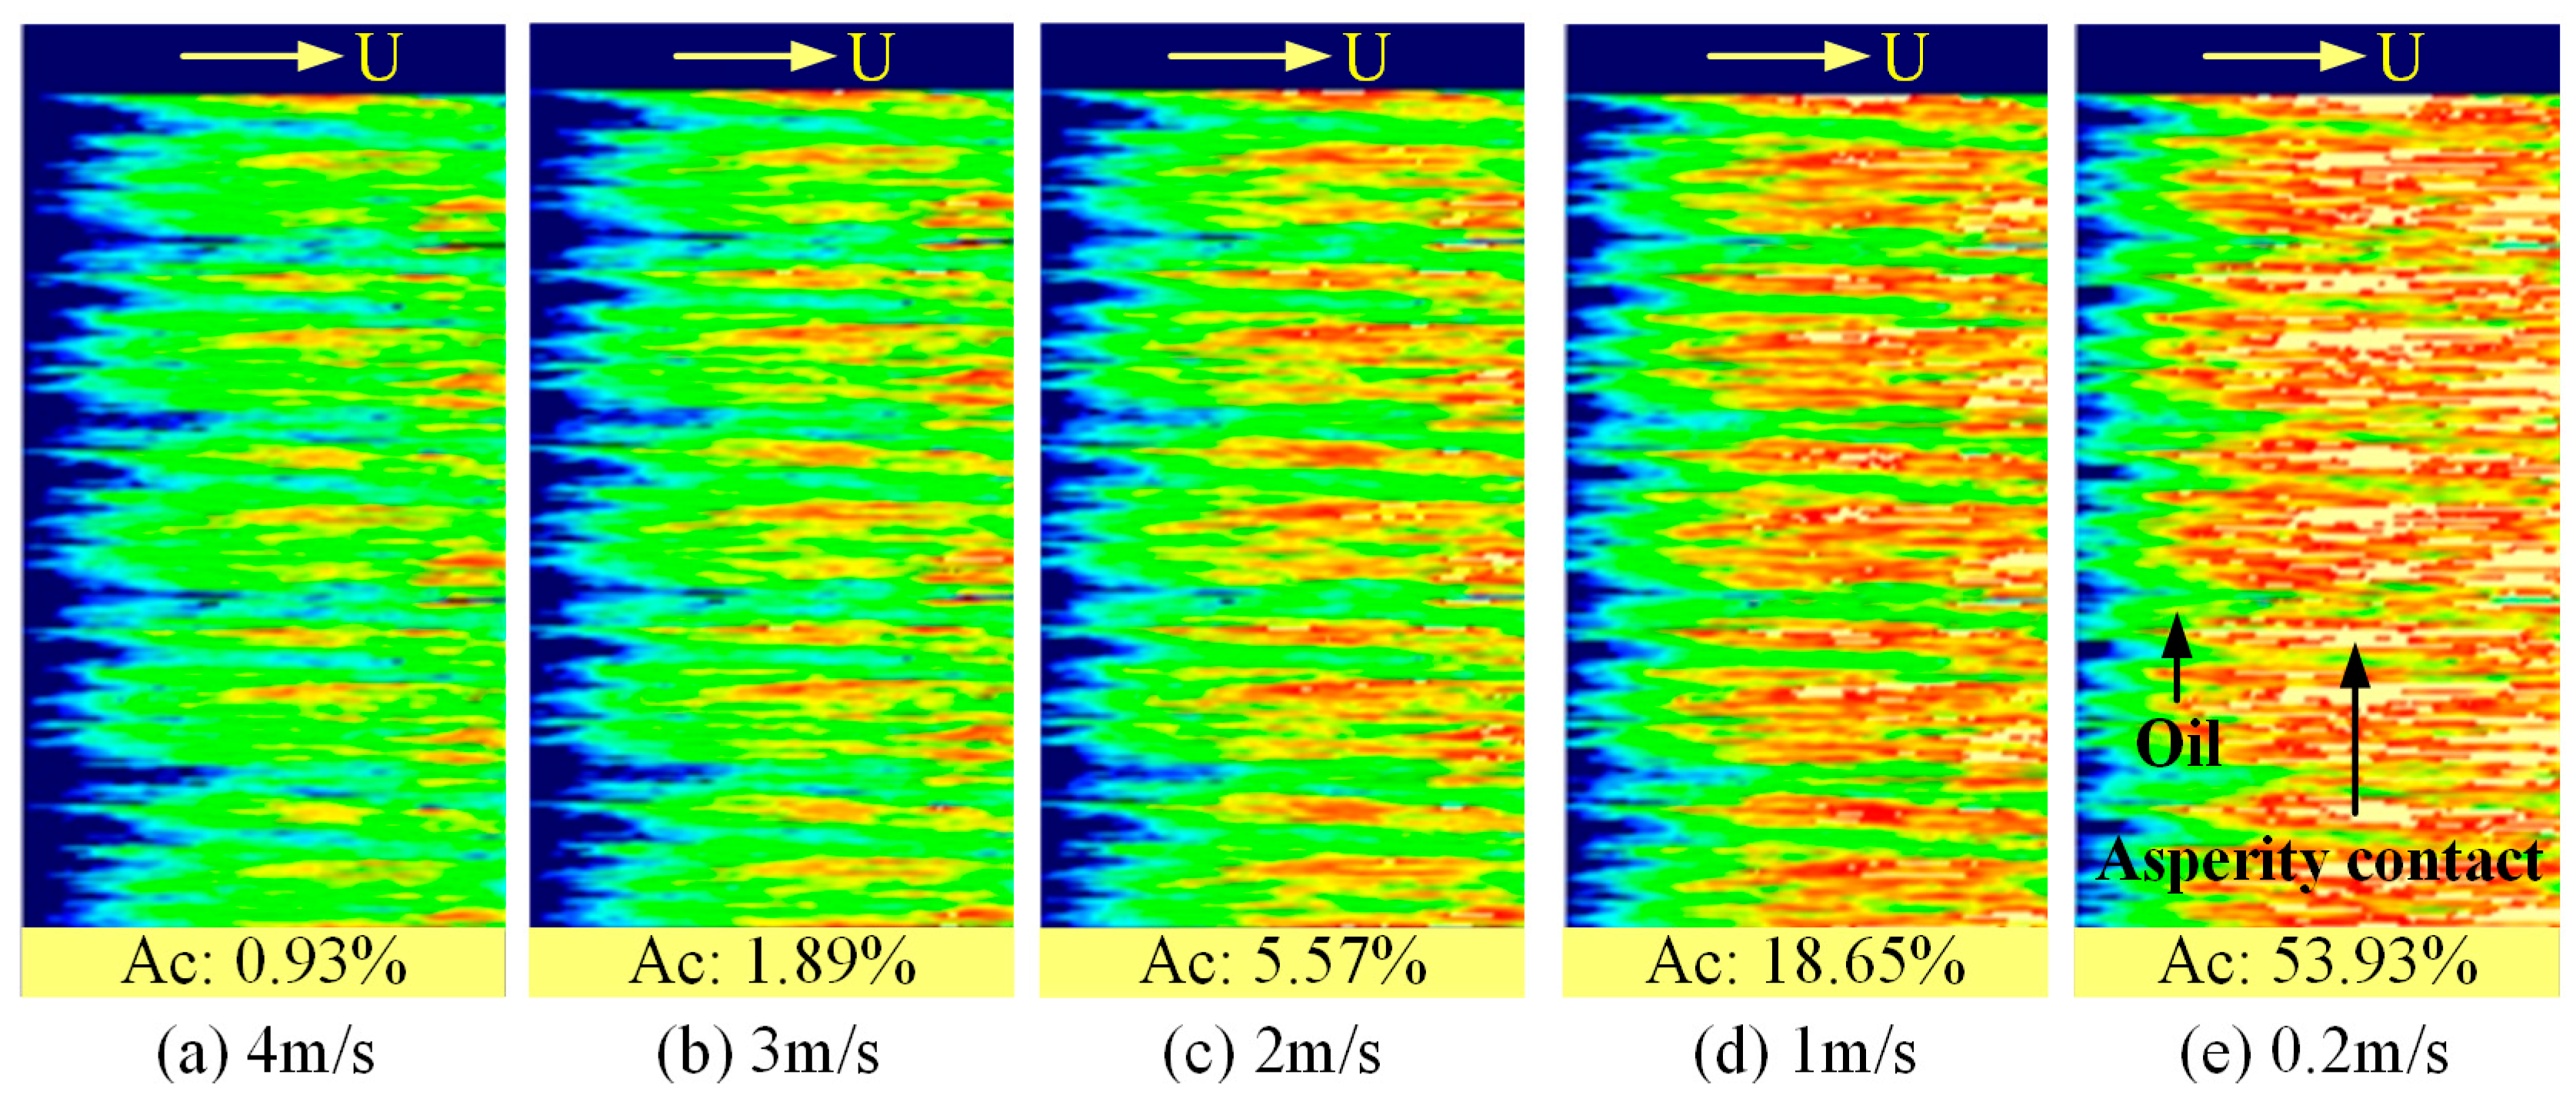
Figure 2 illustrates the evolution of surface contact states during lubrication degradation. In the solution domain, the color gradient from blue to red indicates regions filled with lubricant where the oil film progressively thins, while yellow areas represent asperity contact due to film rupture, as shown in
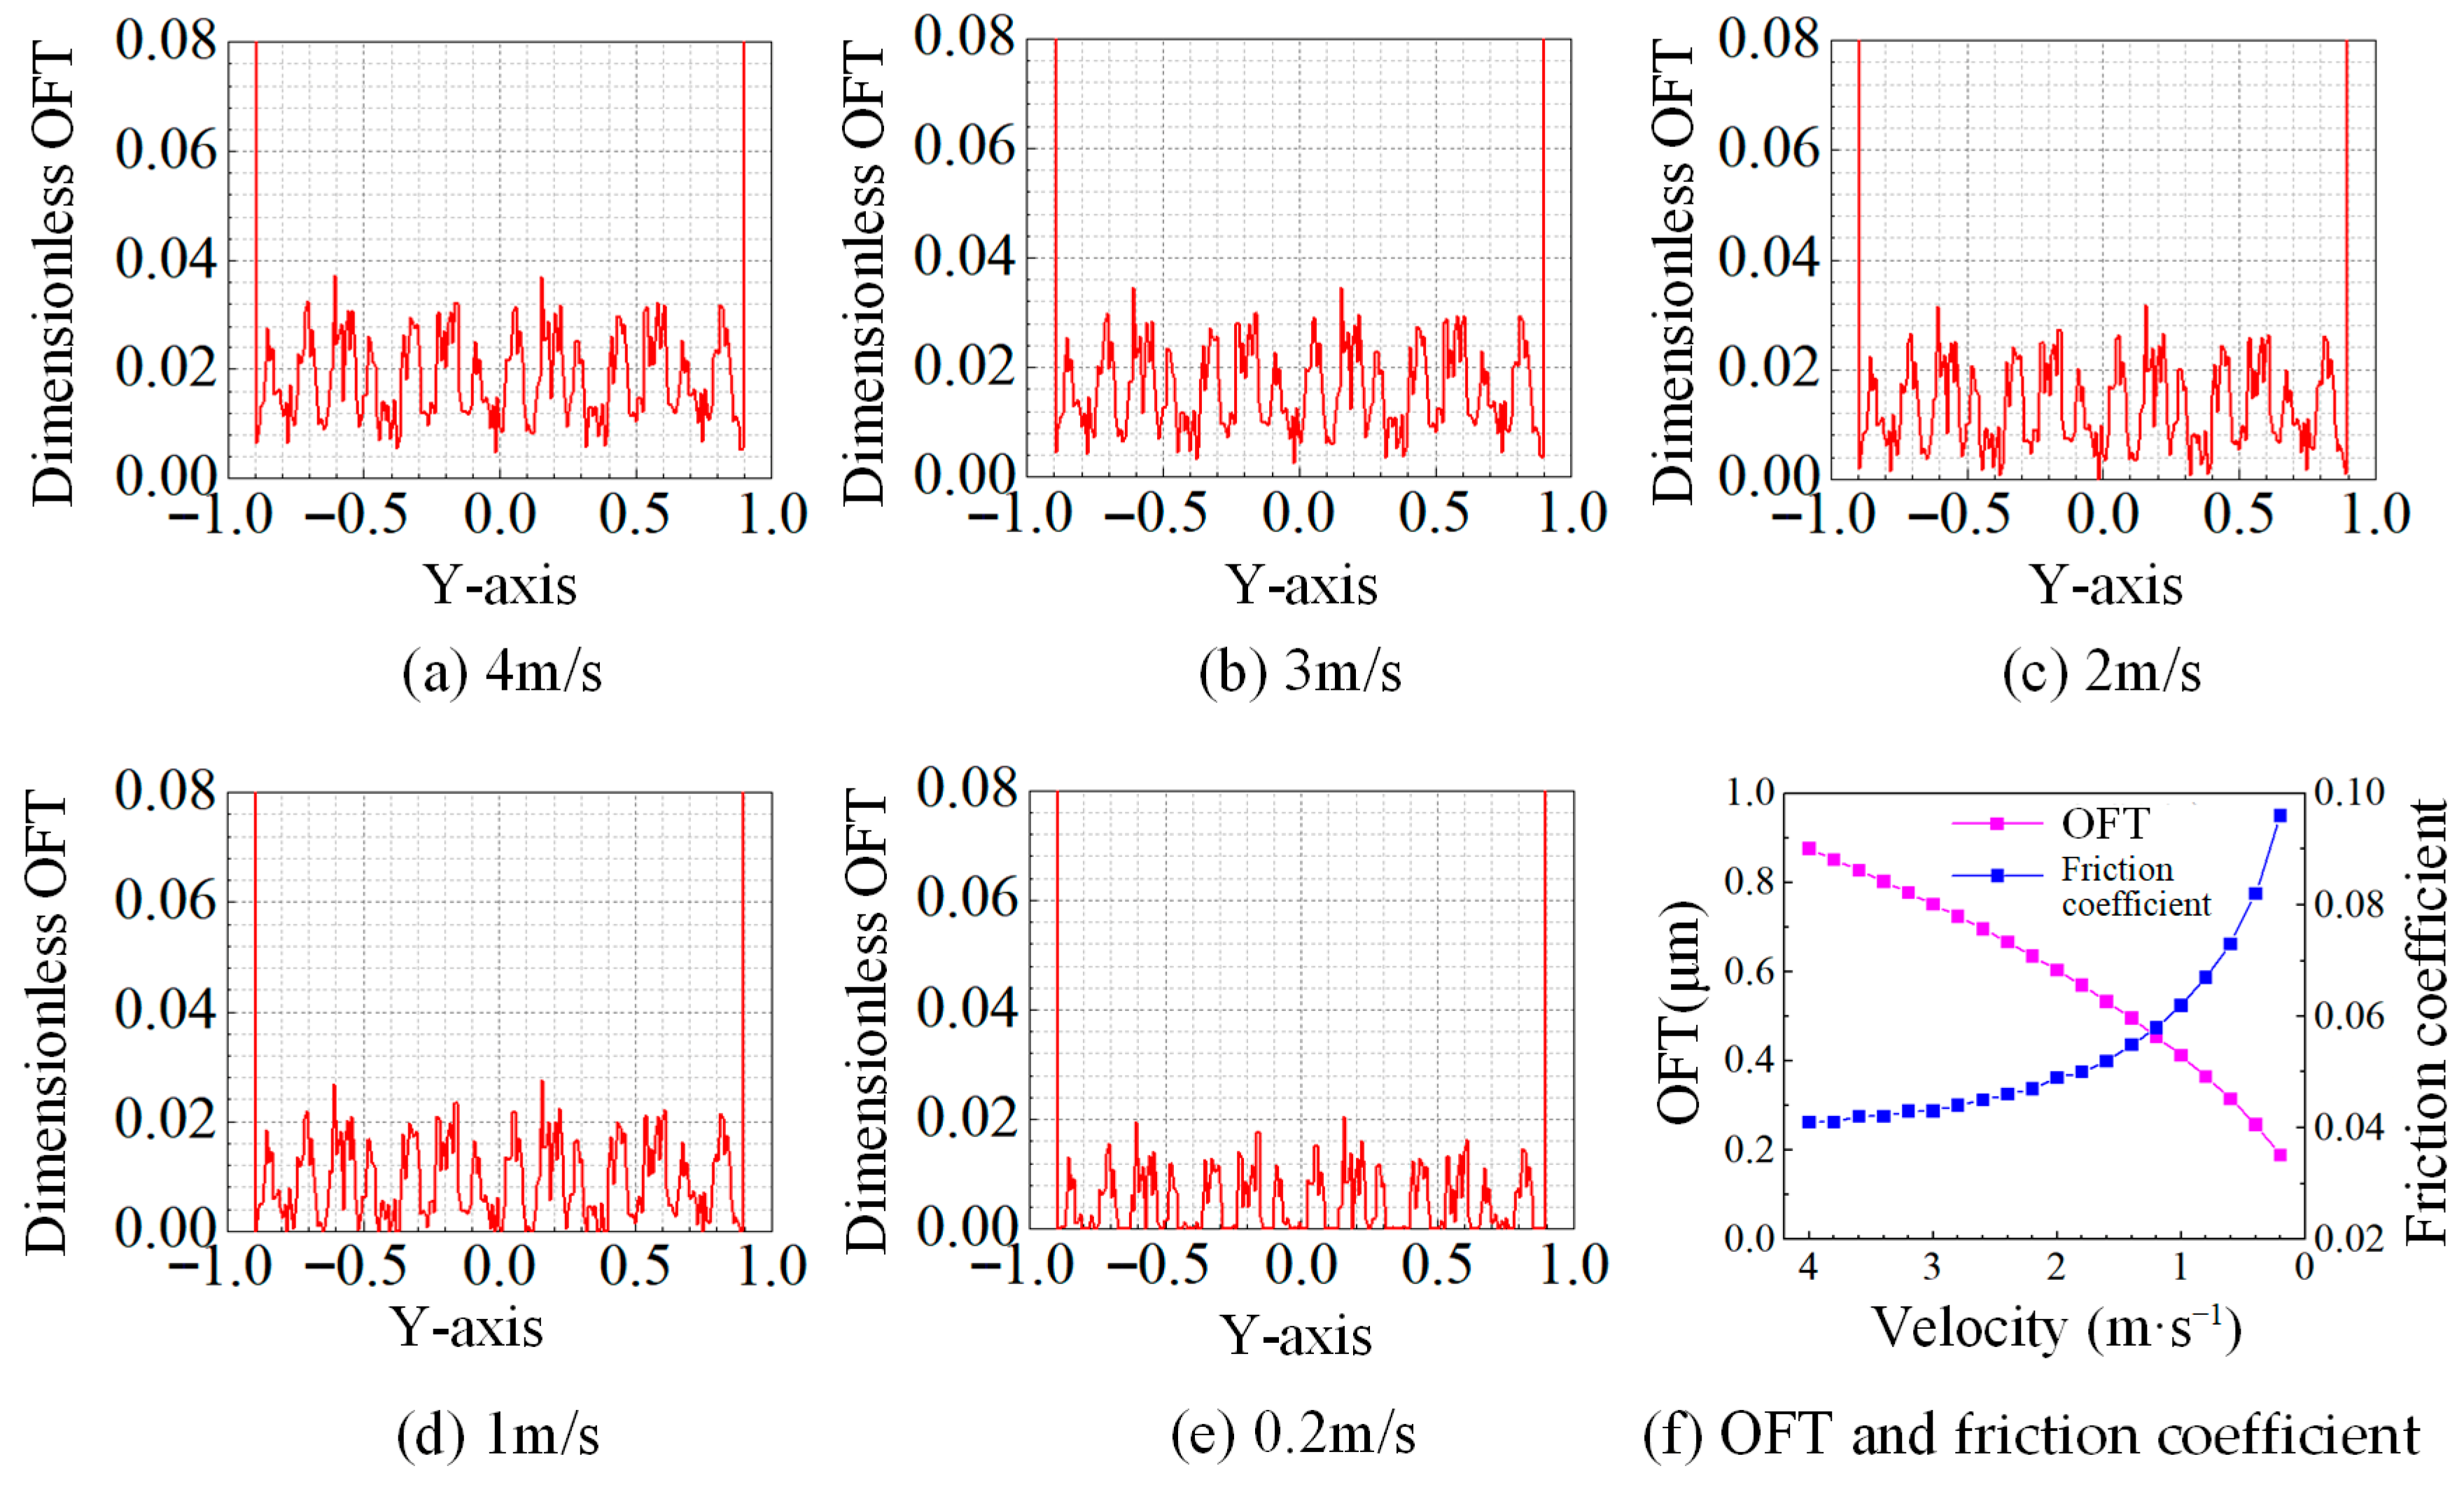
Figure 2e. Oil film distributions along the Hertzian contact centerline at different speeds are depicted in
Figure 3. Both axes display the dimensionless values. The
Y-axis indicates positions along the contact length. The dimensionless OFT is obtained by dividing the average OFT in the Hertz contact area by the Hertz contact width.
At 4 m/s, the friction pair approaches a full-film lubrication state, with an asperity contact ratio of only 0.93%, as shown in
Figure 2a and
Figure 3a. As speed decreases, the reduced hydrodynamic pressure leads to the gradual film thinning and an increased asperity contact ratio (
Figure 2b–d and
Figure 3b–d). At 0.2 m/s, extensive film rupture occurs, resulting in zero film thickness and an asperity contact ratio of 53.93% (
Figure 2e and
Figure 3e). The average OFT and friction coefficient under varying speeds are depicted in
Figure 3f. During lubrication degradation, the OFT progressively decreases, varying within a range of 0.18–0.88 μm. These values align broadly with predictions from the classical Dowson–Higginson formula (1.1507–0.1413 μm), with the discrepancy attributable to the incorporation of surface roughness effects in the present model. The friction coefficient initially exhibits a stable state followed by a rapid increase. This trend indicates that frictional forces in the initial phase of lubrication degradation originate primarily from shear within the lubricating fluid, then asperity contact friction becomes dominant due to the increased contact area. These observations are consistent with the fundamental principles of EHL theory.
2.2. Contact Dynamic Model
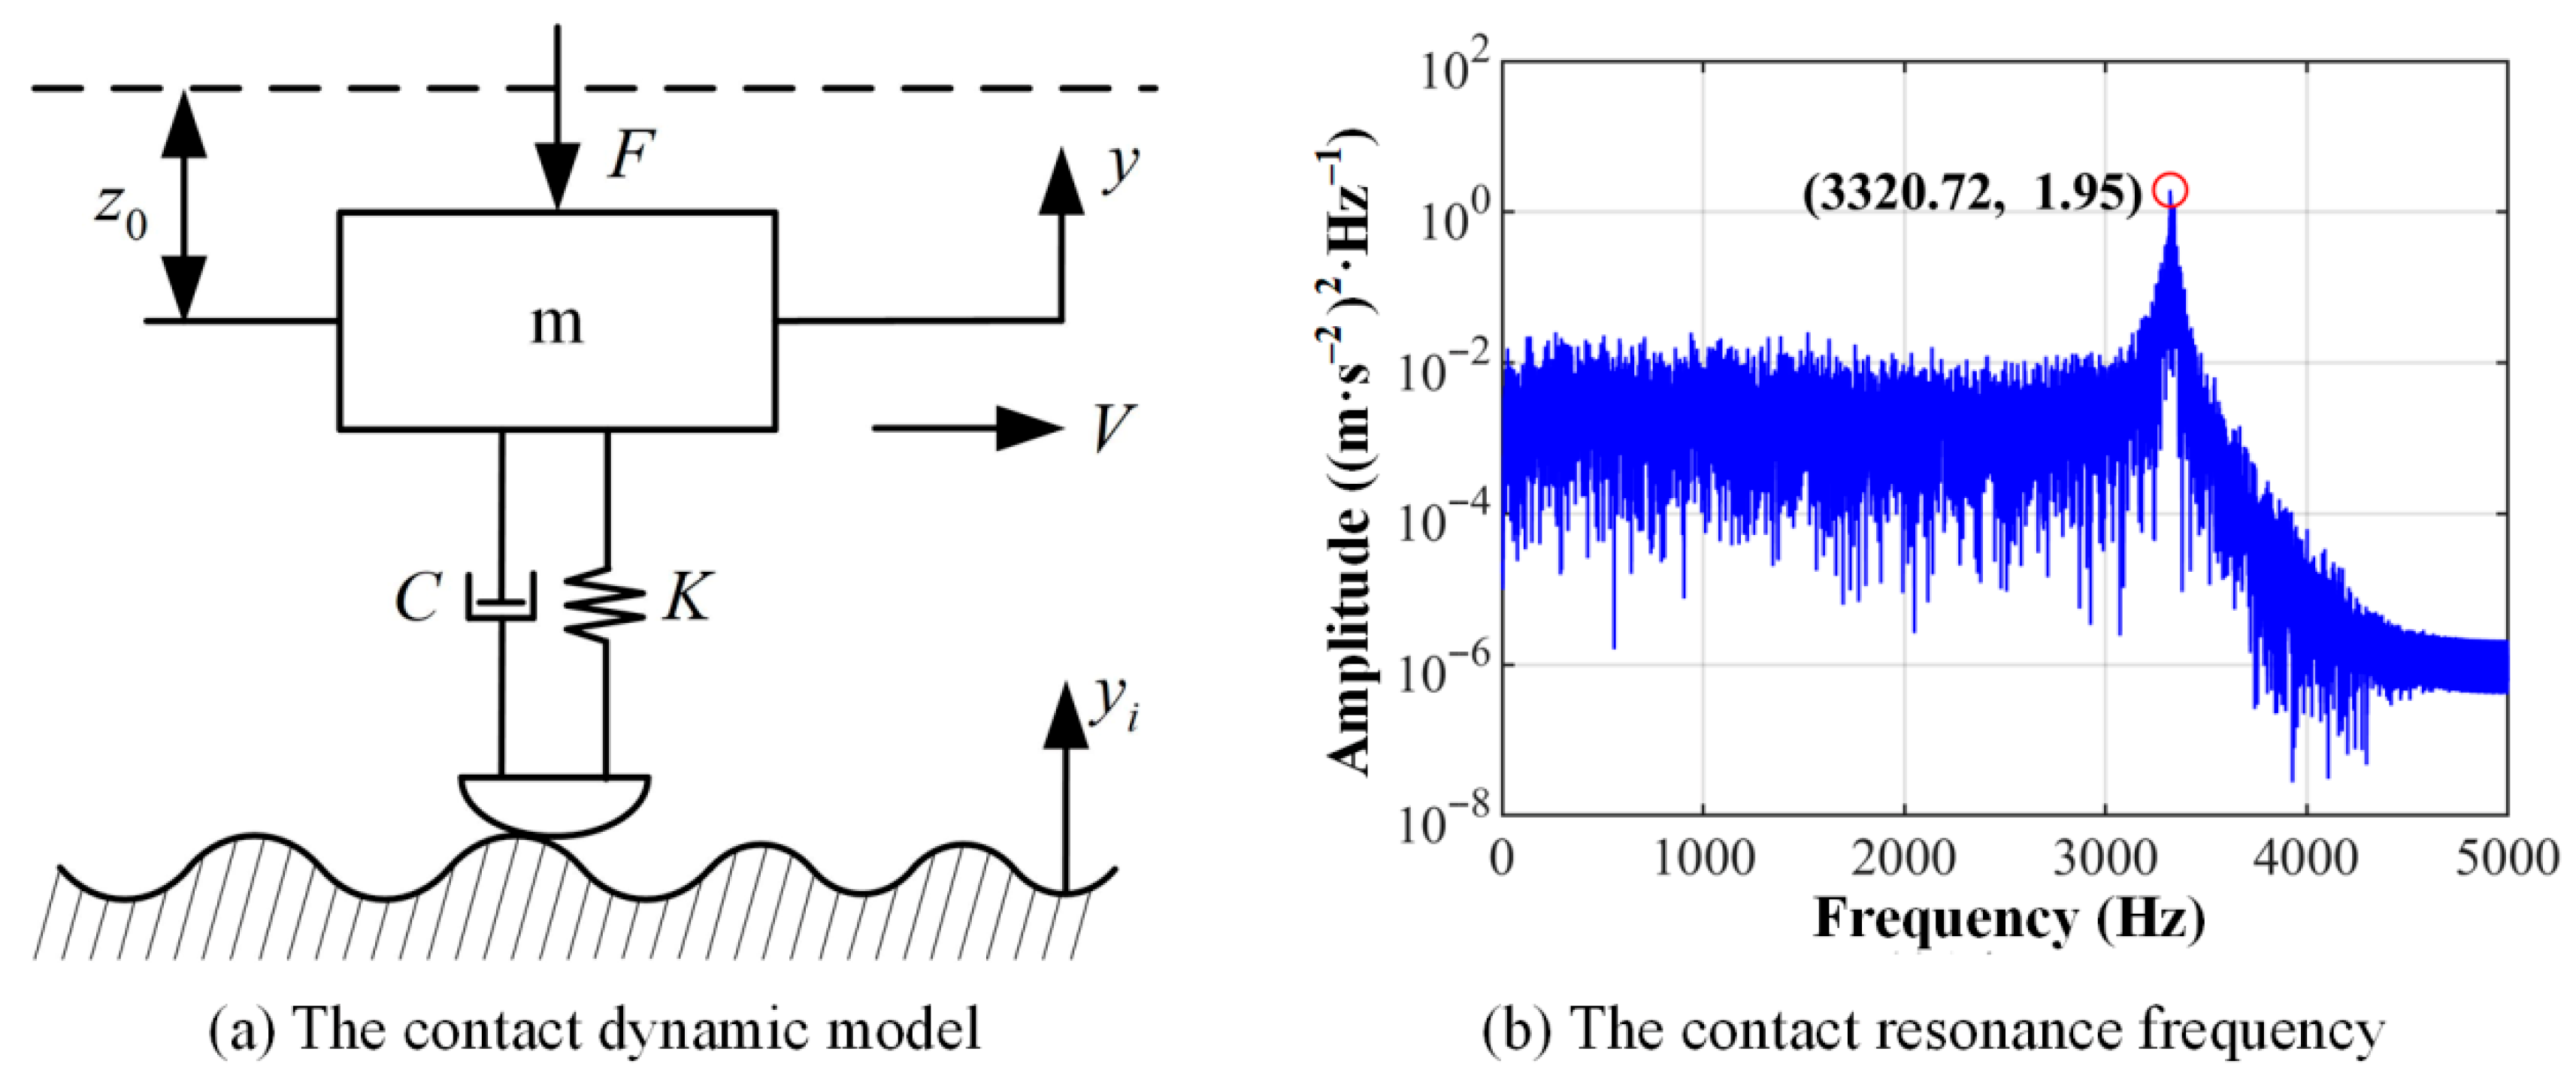
The contact dynamic behavior of the line contact friction pair is described by a two-dimensional mass spring damping system, as shown in
Figure 4a [
32]. The mass block
slides at a constant velocity
over a rough surface. Taking into account the damping force, spring force, and external load acting on the mass, the equation of motion for the system can be expressed as:
where
and
denote the system input and output, respectively, and
corresponds to the rough surface profile. The damping coefficient is represented by
, while
denotes the Hertzian contact stiffness;
refers to the static spring compression, and
indicates the instantaneous spring compression. The spring restoring force is directly proportional to the difference in spring compression
.
represents the external load.
The Hertz contact stiffness can be linearized to facilitate solving the system’s vibration response. Under constant load and small-amplitude vibration conditions, the nonlinear spring force may be approximated by an equivalent linear spring force, whose stiffness corresponds to the incremental stiffness. The motion of the mass block sliding over the rough surface can be approximated as the contact between a sphere and a smooth plane. Based on Hertz contact theory, when the contact spring reaches equilibrium under the applied external load, the static compression is given by [
30]:
where
denotes the equivalent elastic modulus and
represents the equivalent contact radius.
The incremental stiffness
is derived by differentiating Equation (14), yielding:
Then, the theoretical CRF
can be expressed as [
33]:
In contact dynamics, the damping coefficient is commonly derived from experimentally measured damping ratios, typically ranging from 0.01 to 0.1. The damping coefficient can be obtained as:
where
represents the damping ratio, which is assigned a value of 0.02 in this model. Thus, Equation (13) can be simplified as:
The rough surface is simulated using Gaussian white noise subjected to low-pass filtering. This processing converts the two-dimensional spatial surface profile into a temporal displacement input. Notably, the amplitude variation corresponds to the surface height modification, while the cut-off frequency adjustment represents the sliding velocity changes. Equation (15) is solved numerically using a fifth-order Runge–Kutta algorithm. Without additional signal processing, the characteristic frequency can be directly extracted from the power spectral density (PSD) of the acceleration response.
To validate the accuracy of the contact dynamic model, a specific case was examined with the following parameters:
,
,
,
,
. Using Equations (14)–(17), the following parameters were calculated:
,
,
,
Subsequently, the Gaussian white noise was low-pass-filtered at a cut-off frequency of 30 Hz to generate a rough surface with an amplitude of 2 μm. Both the derived parameters and the rough surface were incorporated into the contact dynamic model for solution. As illustrated in
Figure 4b, a characteristic frequency at (3320.72, 1.95) can be identified as the CRF, which is consistent with the theoretical CRF
calculated by Equation (16), thereby confirming the validity of the dynamic model.
During the lubricant degradation of the line contact friction pair, the reduction in OFT leads to surface asperity contacts, transitioning into the mixed lubrication condition. As the asperity contact area increases, surface wear initiates and progresses, eventually inducing system vibration when the wear becomes severe. Consequently, the lubrication degradation process cannot be adequately characterized by any single parameter of the oil film, wear surface, or vibration alone. In this study, the OFT, WSR, asperity contact area ratio, and contact load ratio can be obtained through the mixed-EHL model. The solved WSR, asperity contact area ratio, and contact load ratio are then incorporated into the contact dynamic model to determine the CRF and CRFA.
Figure 5 shows a mathematical flowchart of the parameter transfer relationship between two models. The specific method is detailed below:
- (1)
The WSR represents the surface profile height within the contact dynamic model. The Gaussian white noise was low-pass-filtered to generate a rough surface profile with the same value as the WSR.
- (2)
Given a constant external load, the asperity contact load ratio during lubrication degradation can be utilized to determine the contact load, incremental stiffness, damping coefficients, and theoretical CRF.
- (3)
The cut-off frequency corresponds to the sliding velocity, representing the number of asperities traversed by the mass block per unit time. Consequently, the contact area ratio during lubrication degradation corresponds to the cut-off frequency. Here, the contact area ratio can be regarded as a coefficient for adjusting the cut-off frequency, thereby investigating the CRF evolution.
2.3. Characterisation Indicators Extraction
The lubrication degradation process of a line contact friction pair is simulated through the mixed-EHL model and contact dynamic model. The simulation method is detailed in
Table 2, and comprises two distinct phases:
- (1)
Maintaining a constant surface topography (μm) and a normal load, an oil film-dominated lubrication degradation state is simulated by progressively reducing the sliding velocity from 4 m/s to 2 m/s in 21 discrete steps (with an interval of 0.1 m/s).
- (2)
Then, with the fixed velocity (2 m/s) and normal load, a surface wear-dominated lubrication degradation state is simulated by incrementally increasing the surface roughness from 0.6 μm to 4 μm in 35 steps (with an interval of 0.1 μm).
Throughout both phases, the OFT, WSR, asperity contact area ratio, and contact load ratio are recorded for each simulation step. Then, the WSR, asperity contact area ratio, and contact load ratio are input into the contact dynamic model to compute the CRF and CRFA. This set of data is used to establish the fuzzy identification model for the next section. Following a complete simulation cycle, the surface topography is regenerated to establish a new set of data for subsequent model validation.
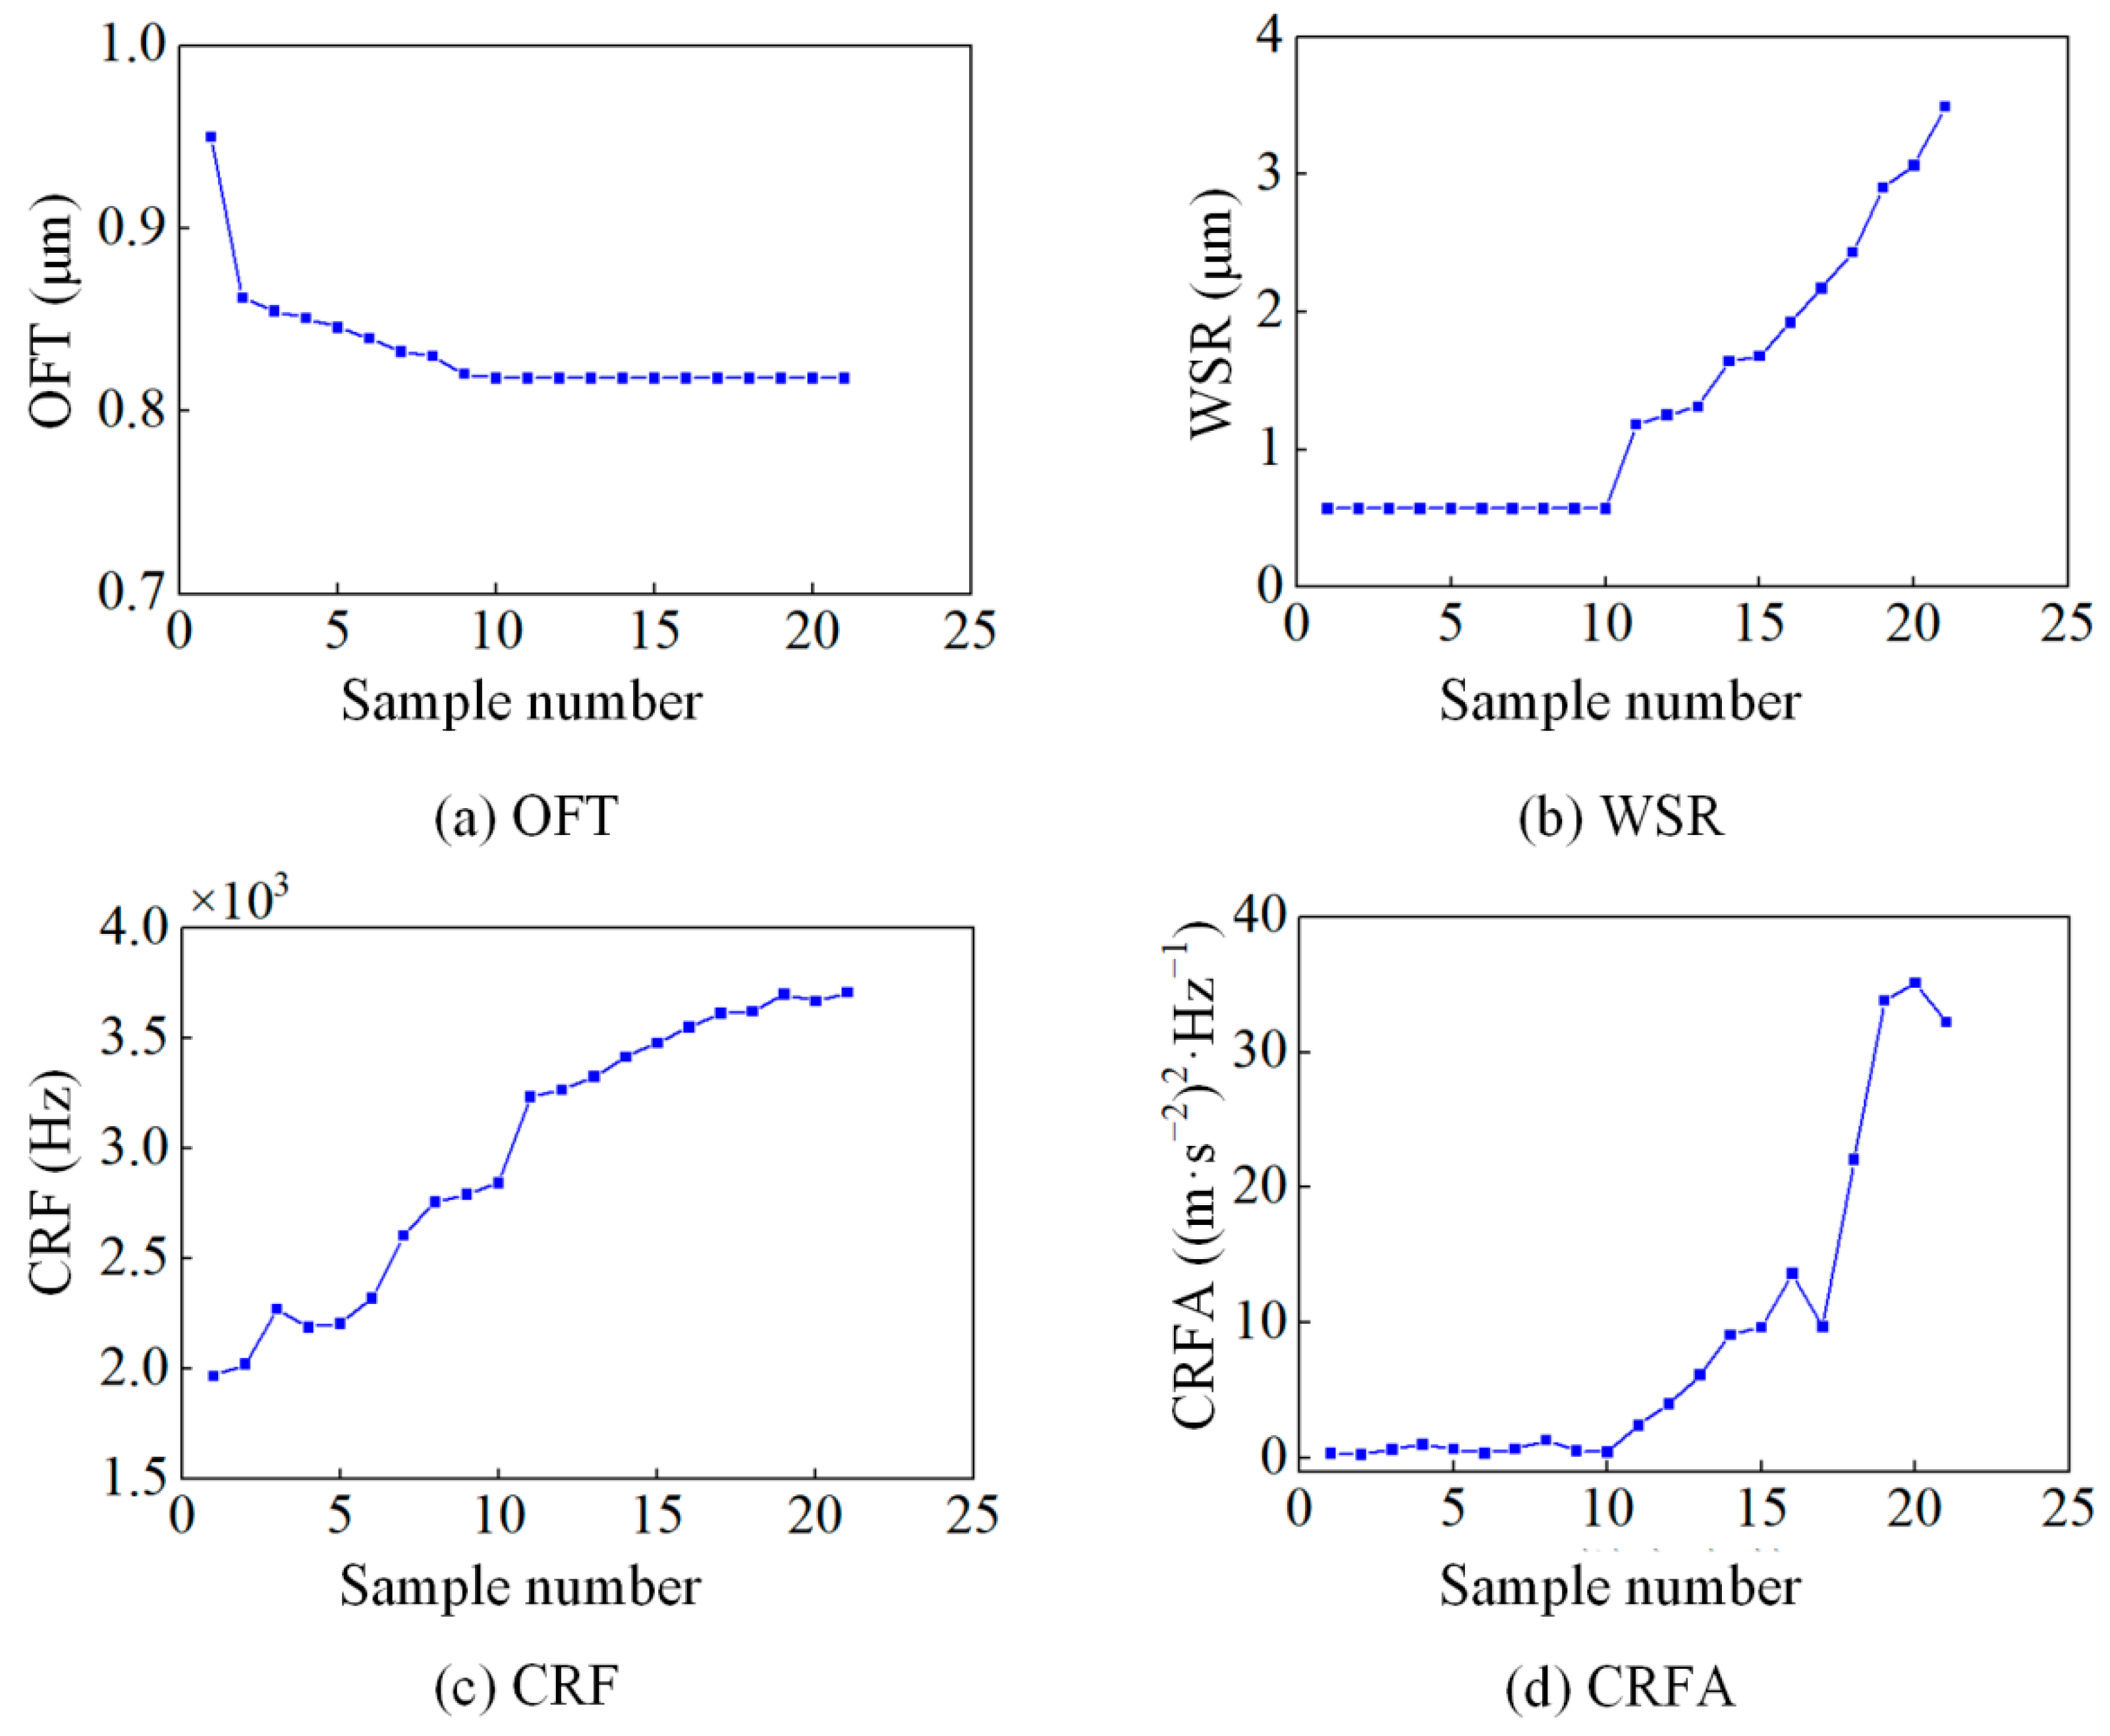
Figure 6 presents the evolution of four indicators (OFT, WSR, CRF, CRFA) during the lubrication degradation. The horizontal axis represents the sampling number of 56 sets of data. It can be seen from
Figure 6a that in the oil film-dominated stage, the OFT exhibits gradual reduction until WSR-induced surface gap formation triggers linear growth in the OFT.
Figure 6b shows the constant and linearly increasing WSR simulated in the mixed-EHL model. It can be seen from
Figure 6c,d that in the oil film-dominated stage, minimal asperity contact maintains low CRF and CRFA values, while progressive surface wear drives their subsequent increase.
Based on the evolutionary trend of four indicators, the lubrication degradation process exhibits three distinct stages:
- (1)
Good lubrication stage (samples 1–21): Characterized by the decreasing OFT and increasing CRF, this stage maintains constant WSR and near-zero CRFA despite minimal asperity contact, indicating a good lubrication state.
- (2)
Normal wear stage (samples 22–41): Emerging surface wear drives linear WSR growth and corresponding OFT increases, accompanied by elevated CRF and CRFA values due to enhanced asperity contact. Therefore, this stage is characterized by the increasing OFT, WSR, CRF, and CRFA, indicating a normal wear state.
- (3)
Severe wear stage (samples 42–56): Marked by linearly increasing OFT and WSR, this stage shows CRF stabilization and significant CRFA fluctuations resulting from coupled contact area, load, and roughness effects. This stage is distinguished by the differences in OFT, WSR, and CRFA, indicating a severe wear state.
2.4. Discussion
- (1)
The physical interpretability of four indicators
The proposed modelling framework and indicator extraction methodology demonstrate that all four parameters possess distinct physical significance and collectively provide essential characterization of the lubrication degradation process. Specifically, the OFT can effectively quantify the lubricating oil film during full-film lubrication, but it becomes less important for lubrication degradation characterization once the oil film ruptures and the asperity contact occurs. The WSR serves as a direct measure of surface wear. Due to its inherent statistical nature and negligible elastic deformation effects, it exhibits limited sensitivity for slight asperity contact, and significant WSR variations only emerge during severe wear stages. The CRF demonstrates high sensitivity to asperity contacts, enabling real-time monitoring of contact state transitions through characteristic frequency shifts correlated with contact load variations. The CRFA serves as a robust indicator of the late-stage degradation, where nonlinear coupling between the surface morphology, contact area, and contact load induces characteristic fluctuation patterns indicative of a severe wear state (see [
32] for complete analysis).
This study focuses on extracting lubrication degradation indicators from mechanism models. Nevertheless, it is necessary to discuss the feasibility of other monitoring parameters such as the temperature, acoustic emission features, and friction coefficient. Although temperature critically influences lubrication degradation, its effect predominantly manifests as oil film thinning and eventual rupture. Acoustic emission monitoring relies on detecting elastic stress waves generated by dynamic interfacial events, including film collapse, asperity contact, and wear particle generation. It remains difficult to establish a mapping relationship between acoustic emission features and lubrication states through physical models. While the friction coefficient serves as a direct indicator of lubrication conditions under Stribeck theory, its accurate measurement in practical engineering applications is often unfeasible. Therefore, the four indicators used in this study may be more reasonable.
In addition, this study adopts an idealized lubrication degradation simulation method, disregarding operational variations such as fluctuating loads, temperatures, and contamination. These factors, which are intrinsically linked to the four indicators, merit further consideration. Load directly influences the CRF. The absence of CRF excitation under fluctuating load suggests adequate lubrication, whereas its presence indicates oil film rupture—characteristic of normal or severe wear stages. Temperature variations are captured directly through changes in OFT, and do not affect the generalizability of the proposed method. Contaminants exhibit a negligible impact on the OFT under good lubrication conditions. However, under normal or severe wear stages, micron-scale contaminants at the interface can behave similarly to the surface roughness, leading to unstable CRFA values. In summary, the lubrication state in this study is characterized collectively by four indicators and ultimately determined through probabilistic distribution. Although real-world operational variations introduce uncertainty, their impact is not deterministic.
- (2)
Three typical lubrication degradation stages
The current classification of lubrication degradation stages follows the Stribeck curve, which distinguishes between full-film, mixed, and boundary lubrication regimes. However, this approach presents two limitations: (1) the absence of precise differentiation criteria; (2) for the prolonged mixed lubrication conditions commonly encountered in point and line contacts, it is difficult to further determine the state at the contact interface. This study, therefore, proposes a contact-based classification method consisting of three distinct stages: (i) non-contact (good lubrication); (ii) initial contact (normal wear); (iii) large area contact (severe wear), which provides more precise characterization of the lubrication degradation process for point and line contact scenes.
- (3)
The lubrication degradation modelling framework
It is well established that replicating the lubrication degradation through numerical simulations or experimental methods presents significant complexity and time requirements, as the process involves lubricant thermal degradation, asperity contact and deformation, and surface wear. Consequently, fundamental studies typically employ idealized degradation protocols, with velocity variation being the most common control parameter [
11,
25]. Given the protracted nature of wear development, this study implements an alternative approach by simulating wear progression through controlled surface roughness variation.
The adopted simulation methodology represents an idealized scenario that may not fully conform to real-world lubrication degradation, particularly under noisy and unstable operational conditions. However, the four indicators possess fundamental physical significance and enable robust lubrication degradation characterization. Crucially, regardless of the operational variability or degradation sequences, an integrated analysis of these indicators’ evolutionary patterns permits unambiguous identification of current degradation stages.
In summary, this section establishes a coupled modelling framework for lubrication degradation analyses, integrating the mixed-EHL model with the contact dynamic model. Although the mixed-EHL model can effectively simulate the degradation process, experimental measurements of real-time contact state evolution remain challenging. To bridge this gap, a contact dynamic model is adopted by taking the contact ratio variations as inputs to solve for contact vibration. The synergistic integration of these models generates four physically meaningful degradation indicators for line contact friction pairs.

