Article

Toward Coarse and Fine Bimodal Structures for Improving the Plasma Resistance of Al2O3

1
Secondary Battery Research Division, Pohang Institute of Metals Industry Advancement (POMIA), Pohang 37666, Republic of Korea
2
School of Materials Science and Engineering, Yeungnam University, Gyeongsan 38541, Republic of Korea
3
Chemistry Program, Universitas Pendidikan Indonesia, Bandung 40154, Indonesia
*
Authors to whom correspondence should be addressed.
These authors contributed equally to this work.
Lubricants 2025, 13(9), 374; https://doi.org/10.3390/lubricants13090374
Submission received: 4 July 2025 / Revised: 9 August 2025 / Accepted: 18 August 2025 / Published: 22 August 2025
(This article belongs to the Special Issue Tribology in Ball Milling: Theory and Applications)

Abstract

In the quest to produce high-purity alumina, bottom-up engineering via architecting the interior of ceramic with bimodal structures of alumina powders in the absence of any additives has gained considerable attention owing to the simplicity offered. The present work investigated the influence of bimodal structures containing micron (~35 μm) and submicron (~600 nm) Al2O3 powders on the formation of dense Al2O3 ceramic. To this end, ball-milling was conducted to prepare the desired sizes of powders, followed by two-step sintering in a vacuum at 1450 °C and 1650 °C with 6 h and 4 h holding times, consecutively. The bimodal structures induced the formation of Al2O3 ceramic with nearly full densification (>99%; ρ 3.95 g/cm3). Both the coarse and fine-grained moieties synergistically balanced the densification kinetics whilst suppressing abnormal grain growth. The uniform and homogeneous grain size minimized the plasma porosity down to <6.0%, limiting the penetration of plasma during the etching process.

1. Introduction

Recently, owing to the increased demand for the downsizing of semiconductor components, the need to reduce the contamination of ceramic components during plasma etching has become a hot topic in the semiconductor industry. Ceramic components are susceptible to localized degradation during plasma etching, primarily in the vicinity of pores and grain boundaries [1]. Therefore, the development of materials with not only excellent mechanical properties but also plasma resistance is critical to limiting impurity contamination, ensuring reliability, and extending the lifetime of semiconductor manufacturing. Among the prospective candidates, alumina (Al2O3) offers several advantages with respect to its economic aspect thanks to excellent characteristics, including high hardness, heat resistance, and chemical resistance [2,3]. Commercial production routes for Al2O3, however, generally produce large-sized grains with relatively high porosity, which can contribute to poor mechanical properties and low plasma stability [1,2].
Pioneer investigations on the effect of an additive by Coble et al. [4] documented that MgO could effectively suppress excessive grain growth while producing dense and transparent Al2O3 ceramics with a uniform microstructure. Moreover, MgO and NiO in small amounts improved the densification and limited the grain growth of Al2O3 during sintering [5]. One important finding was that the abnormal grain growth of Al2O3 was not caused by an intrinsic factor but rather by the impurities; therefore, a number of studies have focused on the effects of various additives/impurities [6]. They also documented the minimum amounts of SiO2 and CaO required to alter the behavior of grain growth (300 ppm SiO2, 200 ppm SiO2 and 10 ppm CaO, or 150 ppm SiO2 and 20 ppm CaO, whilst the critical concentration of calcium alone was 30 ppm) [7]. From here, the exploration of numerous additives, including TiO2, SiO2 [8,9], and rare earth metals, began to flourish. Among them, SiO2 was found to be popular thanks to its abundance in nature, unlike that of rare earth metals. Among the costly additives, silicon carbide (SiC) and yttria (Y2O3) are known for their ability to control the grain growth and improve the overall mechanical properties of Al2O3 ceramics. Nevertheless, the high manufacturing cost limits their broader application in manufacturing [10,11]. Moreover, the dissimilar coefficient of thermal expansion between Al2O3 and Y2O3 will threaten the stability of ceramics due to delamination. As a consequence, periodic maintenance would be necessary [12].
Instead of utilizing additive(s), several research works have focused on modifying the size of precursor powders and formulating size combinations in a bid to control the grain morphologies. Heterogeneous structures of powder precursors at the micro- and nanoscales would give rise to ceramic products with a higher densification level by filling spatial gaps and promote grain boundary strengthening [13,14]. Teng et al. [15] reported that the use of nanoscale alumina powder required a lower temperature in order to achieve high density and improved flexural strength as compared with the use of microscale alumina powder in the presence of SiC utilizing a hot-pressing method. The increased mechanical properties were correlated with grain refinement, grain boundary reinforcement, and trans granular fractural systems. Moreover, Sadeghi et al. [16] found via spark plasma sintering that, by increasing the ratio of fine-grained to coarse-grained powders, the agglomeration increased. When the weight percent of fine/coarse grains was increased by more than 2:8, the grain refinement effect decreased, and the porosity increased. The density increased as the percentage of nano particles increased to 4, then the density decreased with a further increase. On the other hand, despite showing promising results for dense ceramic materials, the optimization of sintering conditions is rather challenging, since the use of hot pressing, spark plasma sintering, and hot isotactic pressing requires complex equipment and more sophisticated skills in addition to relatively high costs.
In this study, we aimed to develop pure Al2O3 ceramics with improved compactness and plasma resistance by modifying the initial powder size containing micron and submicron Al2O3 powders at an optimal ratio. The typical high-density fluorine plasma generated from inductively coupled plasma (ICP) was selected as the plasma source. Microstructural characteristics, surface profiles, and etch-depth were analyzed before and after plasma exposure. In addition, we evaluated whether the absence of additives such as SiC and Yttria, together with the use of pressureless sintering, would offer a more affordable cost.

2. Materials and Methods

Alumina (α-Al2O3, >99.99%, Sumimoto Chemicals Co., Tokyo, Japan) powder was used as the starting material, and ball-milling was performed to manufacture submicron-level powder and micro-level powder. A schematic illustrating the experimental steps is shown in Figure 1. Magnesium oxide (MgO, >99.99%), used as a sintering aid at 0.15 wt. %, was added before ball-milling (Ball-Miller, Techno POONG LIM PL-BM20L, Seoul, Republic of Korea), and the concentration was adjusted by considering ball contamination. Ethyl alcohol (>99.99%), high-purity alumina balls (Φ = 5 mm), and starting material powder were mixed in a polyurethane mill jar (1000 mL), and ball-milling was performed for 12 h and 48 h, respectively, based on the preliminary results and previous publications [17,18,19]. After ball milling, the slurry is filtered using a net, followed by drying using a rotary vacuum evaporator to prevent segregation. The ethyl alcohol was evaporated by maintaining it at 70 °C, and the dried powder was sieved using a sieve.
The final particle sizes obtained after ball milling were approximately 35 μm (12 h), and about ~611 nm (48 h), as depicted in Figure 2a and Figure 2b, respectively. The powder size distribution of micron and submicron samples is displayed in Figure 2c,d. Prior to sintering, the powders were molded into a pellet-shaped specimen with the dimension of 40 × 40 × 2 mm by loading 6 g of mixed powders into the mold, followed by applying 25 MPa pressure for 30 s to perform uniaxial pressure molding. The mixed powder ratios can be found in Table 1. Stearic acid was applied to the surface of the mold as a lubricant to prevent a pressure gradient from occurring inside the specimen and to easily separate it from the metal frame after molding.
The pressed pellets were then sintered inside the high-temperature vacuum furnace (Furnace, STI SFPH, Daegu, South Korea) under the following circumstances. The pellet was first raised to 1200 °C at a heating rate of 20 °C/min, then increased to 1450 °C at a rate of 5 °C/min, followed by holding at 1450 °C for 6 h, and further elevated to 1650 °C at 5 °C/min, followed by holding for 4 h before furnace cooling. The samples were densified via pressureless sintering under vacuum with natural furnace cooling as the cooling method. The sintered specimens were polished using diamond suspension, then carefully rinsed with high-purity ethanol.
The surface of the specimens was half-covered equally using Kapton tape (polyimide film) with an opening of approximately 1 mm. The prepared samples were exposed to plasma inside an ICP plasma etcher (ICP-OES, ARCOS FHM22, Kleve, Germany) at a power of 500 W under CF4 (40 sccm) and O2 (10 sccm) atmosphere. The pressure inside the vacuum was set to 5 mTorr. To observe the surface change with respect to plasma etching time, the surface was observed using a field emission electron microscope (FE-SEM, LEO SUPRA 35, Oberkochen, Germany), and the porosity was measured using the ImageJ 1.54p program to observe the porosity. A surface profiler (DektakXT-A, Tucson, AZ, USA) was used to measure the etching depth at an interval of 2000 μm between the plasma-etched and non-etched segments. A weight-loss analyzer (Precision Adventurer Balance, AX324KR, Parsippany, NJ, USA) was employed to investigate the etching degree of samples as a function of etching time.

3. Results

3.1. Optimum Recipe for Dense and Less Porous Al2O3 Ceramic

The targeted dense ceramic materials were developed through different compositions of micron (~35 μm) and submicron (~600 nm) Al2O3 powders, as listed in Table 1, which further sintered to temperatures above 1600 °C according to Table 2.
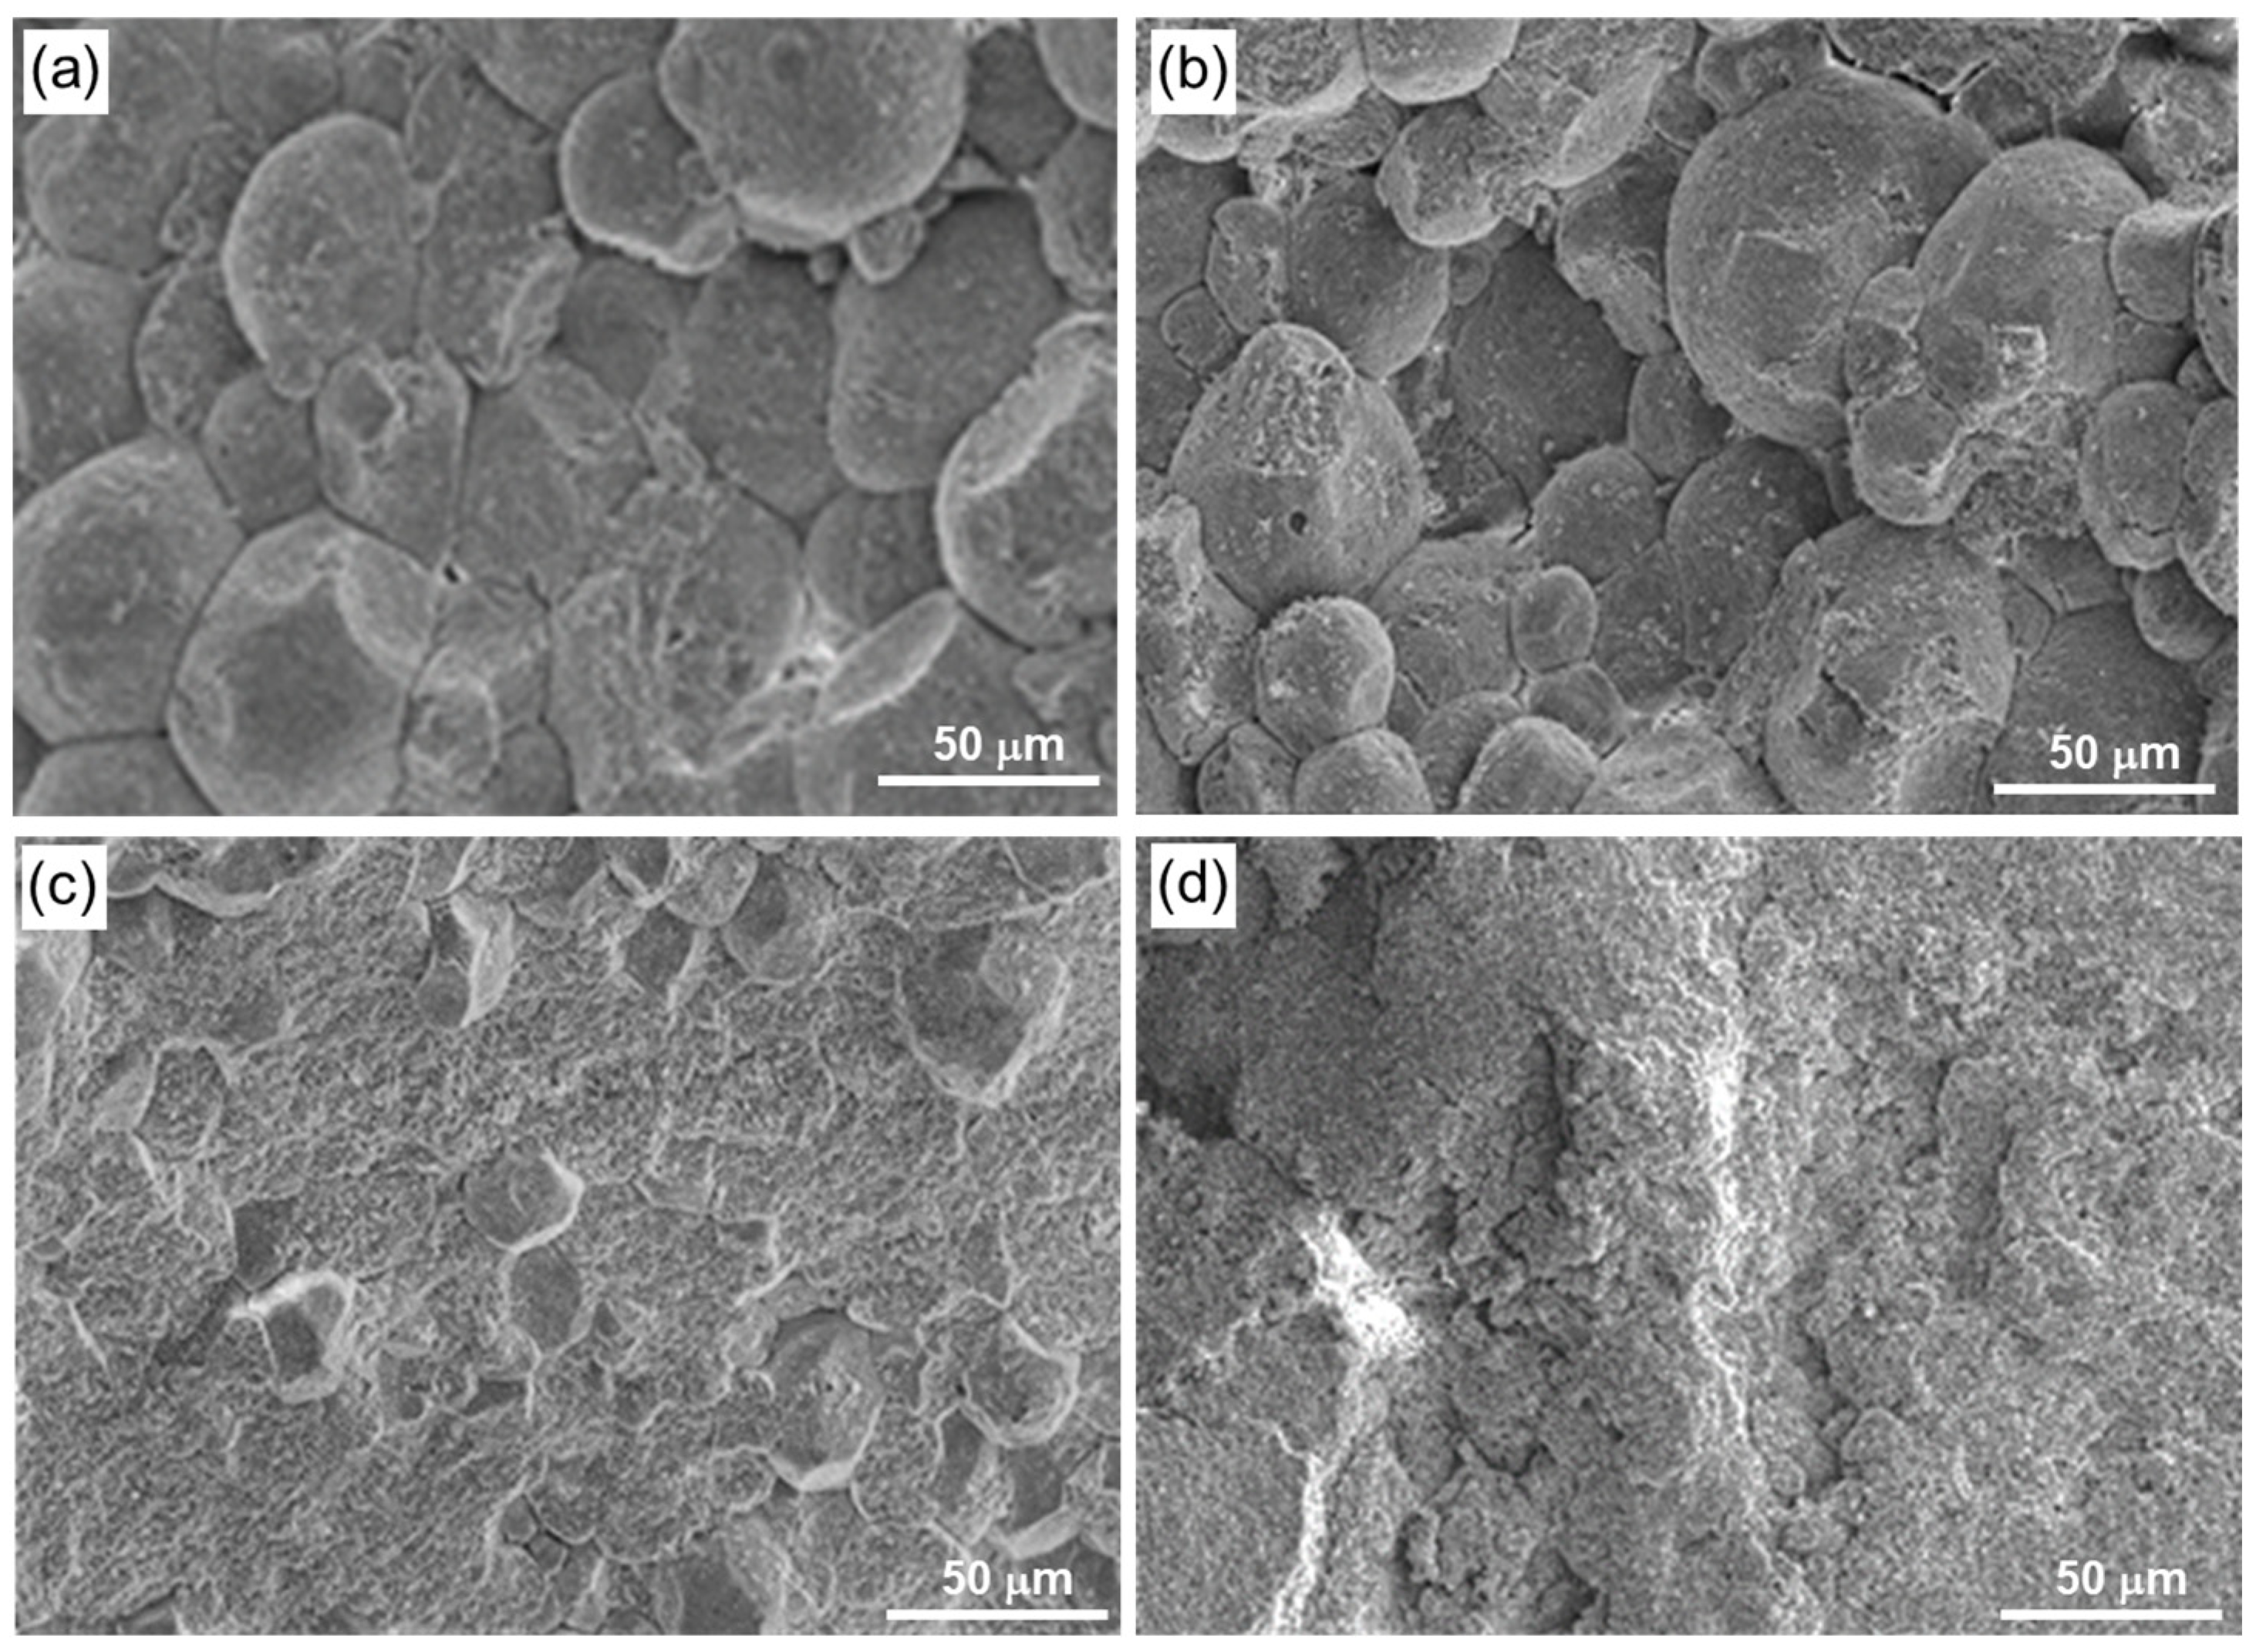
Figure 3 shows characteristics of surface morphologies on the fracture area of sintered samples. Figure 3a shows a relatively uniform distribution of equiaxed grains with relatively large grains and signs of intergranular fracture characteristics, indicating the presence of grain boundary phases. This fracture characteristic can also be observed in Figure 3b, suggesting that the cohesion between the grains was not fully optimized, although smaller grains seem to fill the space between bigger grains. On the other hand, Figure 3c shows a more homogeneous equiaxed grain with a low degree of porosity, which indicates a high density of ceramic materials. In addition, a relatively smooth fracture surface suggested that the cohesion between grains was strong, as indicated by the crack propagation, with predominantly intergranular fracture. It is noteworthy that despite a high amount of submicron powder in sample D (Figure 3d), the fracture surface exhibited a relatively rough surface, which indicated that densification might not be fully achieved due to the agglomeration of smaller particles, leaving a space that would contribute to the increase in porosity. It is concluded that the best combination of bimodal structures to obtain dense microstructures of alumina ceramic was achieved from a 5:2 ratio of micron and submicron size Al2O3, respectively. For further analysis, we would compare the results of the best recipe (sample C) to those of sample A, which utilized only micro-sized initial Al2O3 powder.
On the other hand, the use of a vacuum would eliminate the effects caused by gases during the sintering process. The entrapment of insoluble gases within pores would be one of the most common sources of porosity in ceramics, besides the entrapment of isolated pores within grains [20]. Insoluble gases such as nitrogen, argon, and helium could be trapped inside the pores unless external pressure was applied [20]. Nevertheless, nitrogen under pressure would enhance the densification by promoting particle contact and diffusion while controlling grain growth. For example, Nivot et al. [21] documented that under 2 MPa pressure of nitrogen during sintering, densification was achieved at all sintering temperatures of 1350, 1425, and 1500 °C by controlling t grain growth, grain boundary diffusion, and eliminating the closed porosity trapped in the material. Argon can require higher sintering temperatures to reach comparable densification and mechanical properties compared to air; for example, alumina sintered in argon needed about 70 °C higher temperatures for similar shrinkage and strength than air-sintered samples [22]. Non-inert gases such as oxygen and hydrogen under pressure could trigger the densification of the ceramic thanks to their high solubility, allowing trapped gases to diffuse out and suppressing excessive grain growth [23].
The density of the samples was measured from 5 different specimens, and the results are presented in Table 3. From the table, the average density of sample A is approximately 3.92 g/cm3, reaching >98% densification, whilst the density of sample C is approximately 3.95 g/cm3, reaching >99% densification.

3.2. Plasma Resistance and Local Etching

Figure 4 shows SEM images of sample A and sample C before and after plasma exposure via ICP. The porosity of sample A was predominantly higher than that of sample C before and after the etching process (Figure 4a,b). Table 4 summarizes the porosity levels of eight different specimens from both samples before and after the exposure. The porosity of sample A was approximately 11% before etching and increased to 23% after etching, with a porosity difference of about 12%. On the other hand, it was recorded that sample C showed a porosity of approximately 7% before exposure and decreased to 13%, resulting in a porosity difference of about 6%, twice lower than that of sample A. This result suggested that not only the initial porosity, which affects the etching process, but also the structural stability, including cohesion between grains, may affect the local damage level by the plasma etching. The average porosity of sample A was ~12.304%, and the average porosity of sample C was 5.974%, showing a decrease in porosity level of about twice.

3.3. Weight Loss Analysis

One of the criteria to measure plasma resistance is through weight loss analysis and etch depth under fluorine plasma conditions. The weight loss results are listed in Table 5. As time increased, the weight of both sample A and sample C decreased, and the final weight of sample A was measured as 0.00688 g, whilst that of sample C was approximately 0.00407 g, confirming that sample C was less etched.

3.4. Etch-Depth Analysis

Figure 5 shows the results of etch-depth analysis after fluorine plasma exposure in the presence and absence of Kapton tape. The etching depth was measured by a surface profiler, and the etching depth was measured at a distance of 2000 μm between the plasma-etched and non-etched areas, and the average value was obtained. The etching depths of sample A and sample C were observed to differ by approximately twice, as presented in Table 6. The results were in line with those of porosity and weight loss.

3.5. Flexural Strength Analysis

A 3-point bending strength measurement was conducted to investigate flexural strength, specifically the resistance to bending or fracture, and the results are listed in Table 7. From the results, the average flexural strength of sample A was approximately 337.5 MPa, whilst sample C was recorded at about 636.3 MPa, nearly twice that of sample A. Sample A demonstrated a brittle fracture characteristic with negligible plastic deformation, typical for ceramic materials. It is regrettable that low grain boundary density in coarse-grain samples might be ineffective to mitigate the crack propagation, in addition to the fact that the relatively high degree of porosity would provide more pathways for sample deterioration. On the other hand, sample C exhibited higher flexural strength above 600 MPa, which was significantly higher than typical alumina ceramics (300 to 400 MPa) [14], indicating excellent mechanical integrity and low porosity levels arising from an effective sintering process. Such high strength suggested that the processing strategies, including the selection of pure alumina, variation of grain size, and an optimized sintering process, were highly effective in eliminating structural defects and promoting strong cohesion between grains. The use of vacuum conditions would also contribute to the elimination of entrapped gas inside pores, yielding better compactness. The recorded value of flexural strength showed good repeatability, indicating a uniform microstructure.

4. Discussion

4.1. Sintering of Al2O3 Ceramic

Based on the microstructural results, weight loss measurements, and etch-depth analysis, determining the optimum condition for achieving dense microstructures through the use of bimodal powders was of key importance for obtaining ceramics with good mechanical and plasma-resistant properties. In the absence of additives, solid-state sintering would typically govern the sintering process. Three dominant kinetic processes were classified by Kingery et al. [24]: (i) particle rearrangement during the initial stage, (ii) solution–precipitation during the intermediate stage, and (iii) pore removal during the densification stage. This model focuses mainly on the reducing surface energy and diffusion processes. In the case of particle rearrangement, the size of the particle would define the early arrangement, since the atomic packing system might be different between coarse and fine-grained particles. The use of coarse-grained particles as a precursor exhibited relatively low grain boundary density, which further induced the formation of interstitial distance, and led to the formation of trapped pores and defects in the ceramic.
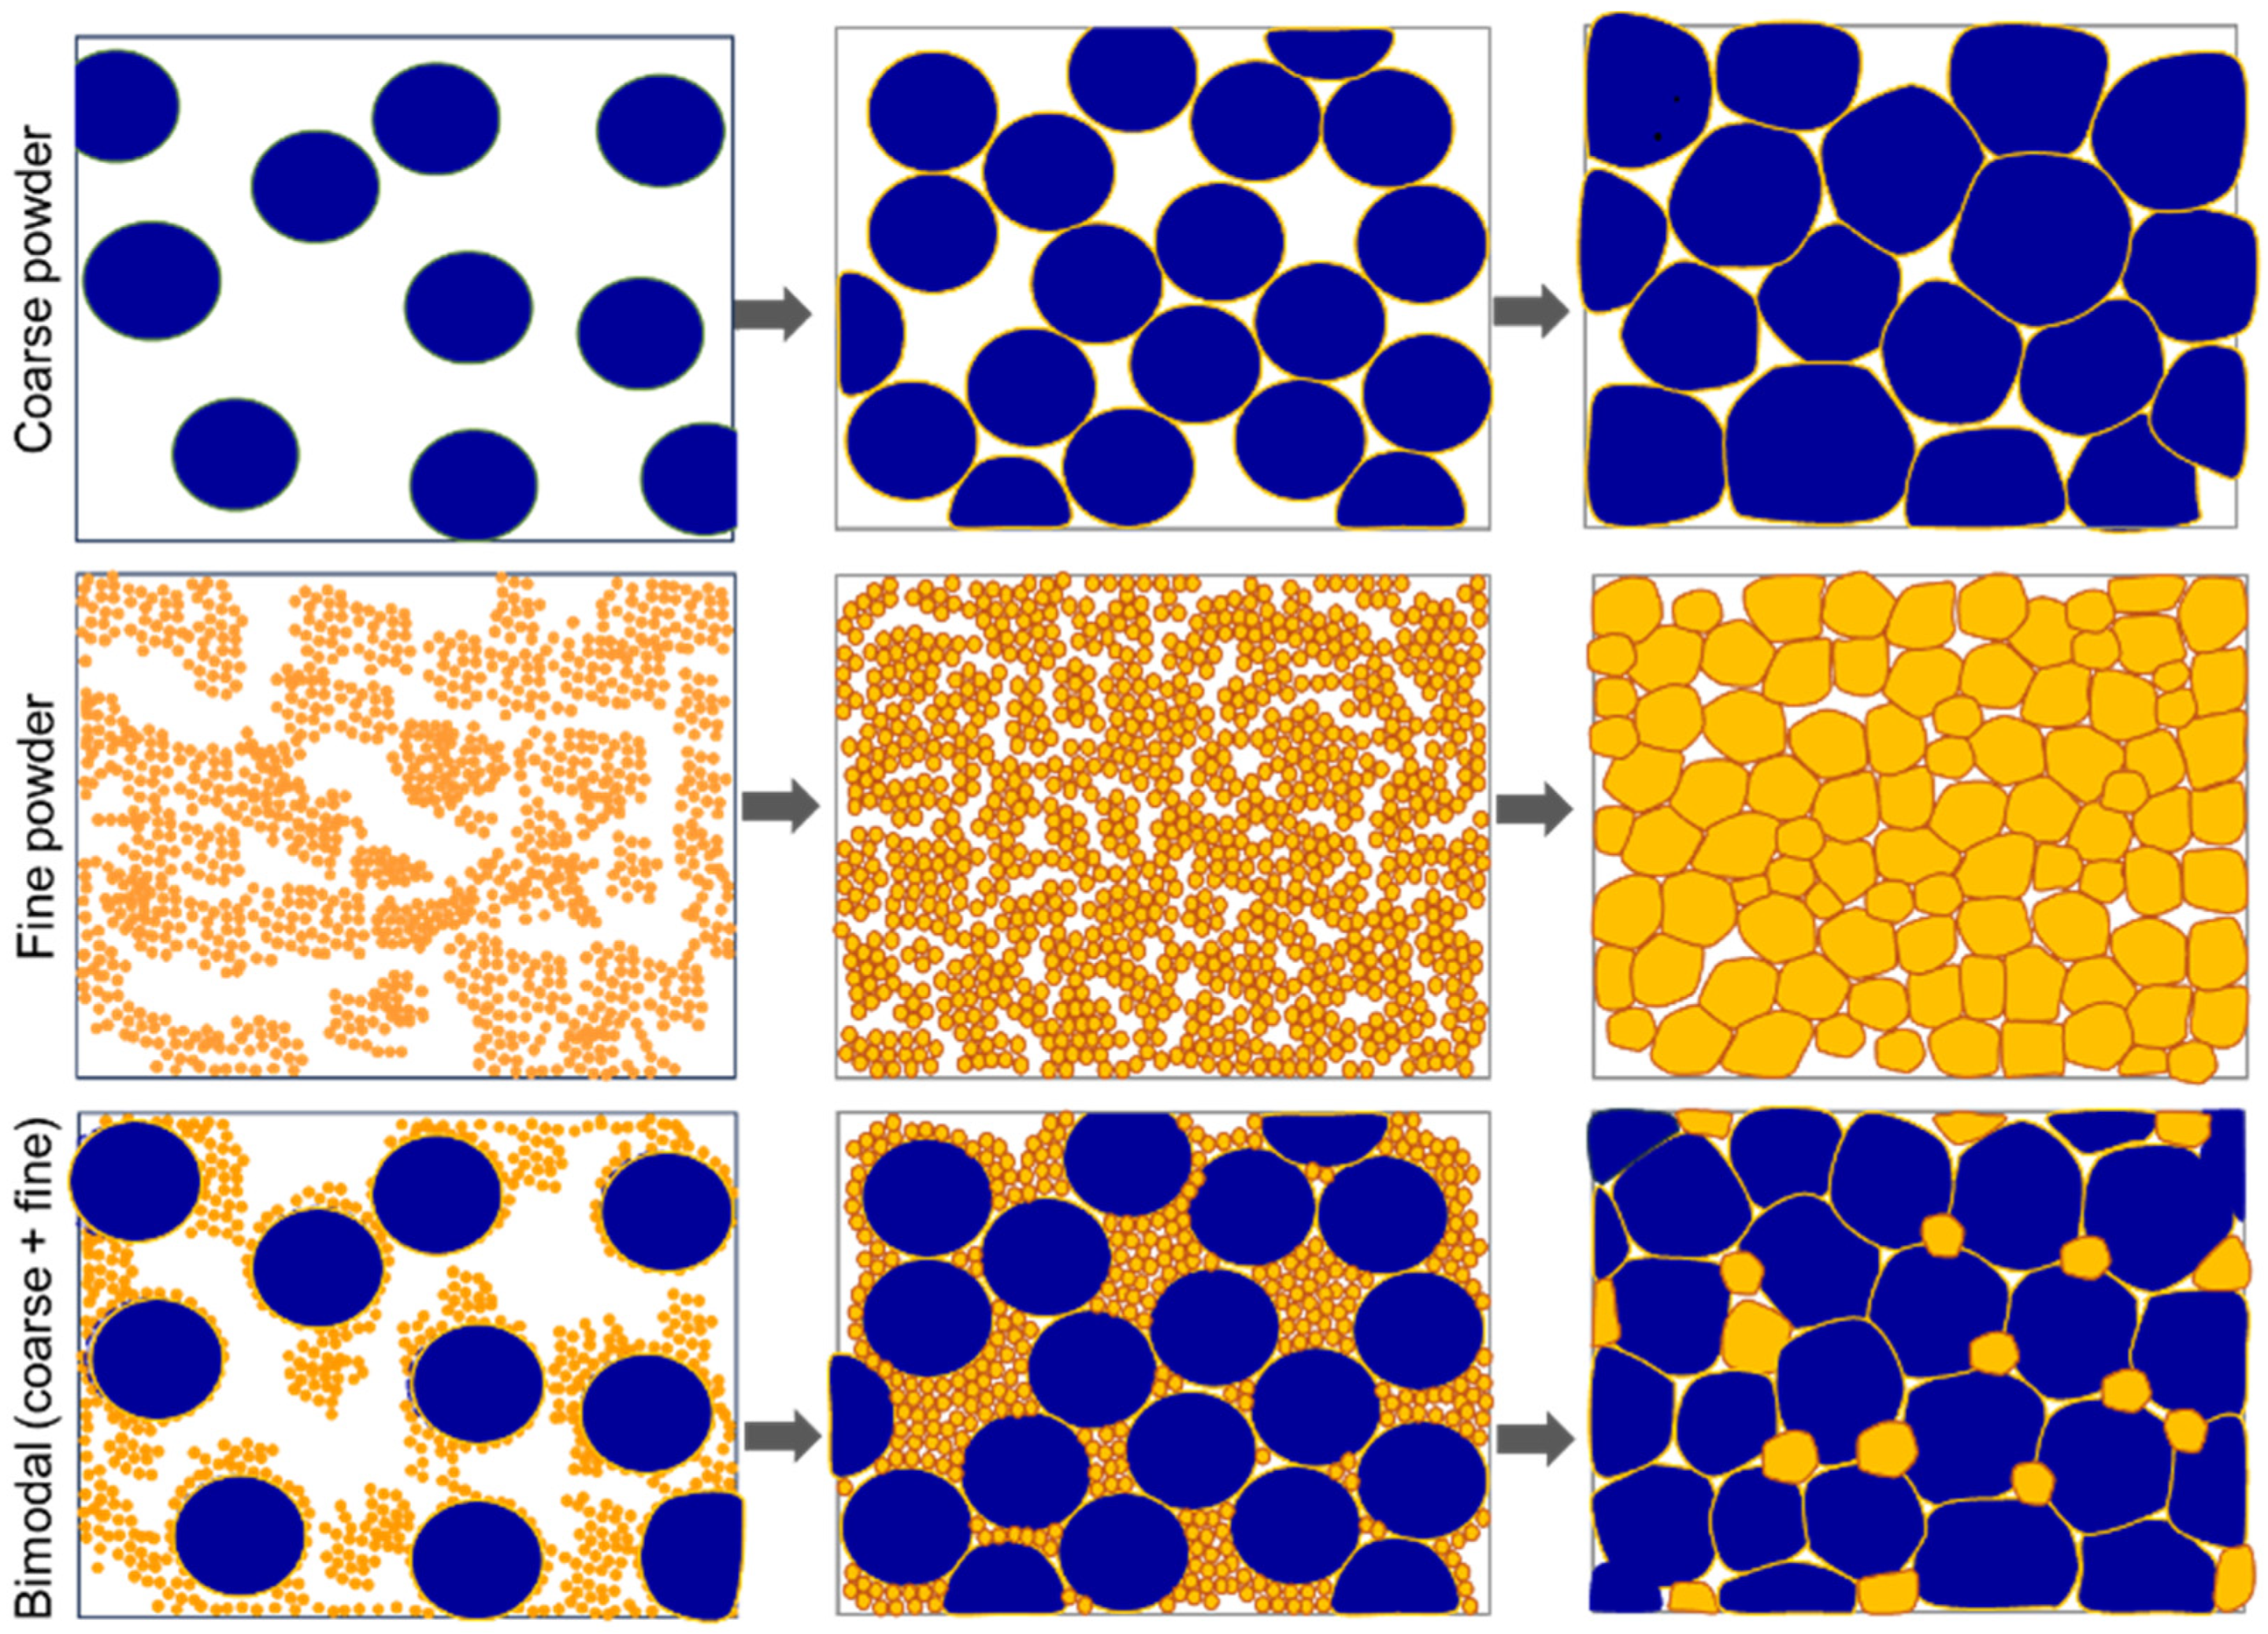
The presence of fine particles substantially increases the total surface area and, thus, the overall driving force, accelerating densification. Bimodal mixtures may demonstrate better packing efficiency, where the smaller, finer particles fill the voids between larger, coarser grains, as shown in Figure 6. This improved density of pre-sintered samples would exhibit less volume shrinkage while maintaining lower porosity during sintering. Such quality would be aligned with Kingery’s hypothesis on initial contact points and neck growth. Fine particles sinter more readily, forming necks and bridging gaps, which promotes initial densification, as shown by Equation (1) [25], illustrated in Figure 7.
relative   shrinkage     r 4 / 3 t 1 / 3
r is the radius and t is sintering time. On the other hand, the micro particles densified more slowly but benefit from the advancing network built by sintered nano particles, stabilizing the microstructure and suppressing abnormal grain growth. In the framework where the mass of powder is conserved during sintering, the conservation of mass is described by the equation of continuity in Equation (2a) [26,27]:
ρ t +   𝛻 ( ρ v ) = 0
where 𝛻 is the gradient operator, v(r,t) is the velocity field at position r and time t, and ρ(r,t) is the density function. Further, the conservation law describes how concentration changes over time due to both diffusion and advection (particle/grain movement) flux densities, as shown below in Equation (2b) [26,27]:
ρ t +   𝛻 j d i f f +   j a d v = 0
The diffusion flux would be proportional to the gradient of chemical potential or free energy, as shown in Equation (3) [28]:
j d i f f =   D   𝛻 δ F δ ρ
where D is the diffusion coefficient, and F is the total free energy of the system. The driving force for sintering is the reduction in total free energy, which includes surface energy (γsurf) and grain boundary energy (γgb), as listed in Equations (4), (5a), and (5b) [28,29]
F = V   f r , t d V
γ g b = + d x   Δ f + ε 2 2 d η 1 d x 2 + ε 2 2 d η 2 d x 2
γ s = + d x   Δ f + ε 2 2 d η 1 d x 2 + K 2 2 d ϕ d x 2
where f(r,t) is the bulk chemical free energy density.
The advection velocity field describes transport due to the motion of a local material element as a rigid body. The motion is a translation (no rotation), as listed in Equation (6):
v a =   K t i = 1 n η η i ( r ) V i d r j i ( ϕ ϕ 0 ) f ( η i , η j ) ( 𝛻 η i 𝛻 η j )
where the first sum explains the velocity field of translation by the rigid body of the ith particle. v i   =   d r   η i ( r ) is the volume of the ith particle at grain boundaries, which determines an equilibrium value of the conserved operating parameter.
According to phase field theory, the microstructure is described by one or more continuous field variables that vary between different phases and grains. For example, parameter ϕ≈1 could describe a solid region and ϕ ≈ 0 a pore or vapor region. The total free energy can be written as follows in Equation (7a) [30]:
F =   V   f ( ρ η ( α ) )   +   1 2   β ρ   𝛻 ρ 2 +   x 1 2   β η   𝛻 η ( α ) 2 d 3 r
β ρ and β η are gradient coefficients and f ( ρ η ( α ) ) is the function of free energy density, which might define the coexisting phases (solid and pore) and multiple solid domains. The local free energy density considering three particle geometries with pores in between is given in Equation (7b) [26]
f l o c   ( ϕ ,   η ,   T ) = m H ϕ 2   ( 1 ϕ ) 2 + W ϕ 2 + 6 ( 1 ϕ )   i n η η i 2 4 ( 2 ϕ )   i n η η i 3 + 3 (   i n η η i 2 ) 2
where m H ϕ and W are model parameters with energy density Jm−3. The one enclosed in a square bracket is a multiwalled potential.

4.2. Densification of Al2O3 Ceramic

Figure 7 illustrates a schematic of the sintering and densification of alumina ceramics utilizing merely coarse powders, fine powders, and bimodal structures of coarse/fine powders. As can be seen, the relatively low grain boundary density of coarse-grained materials as a precursor led to the entrapment of pores and defects in the ceramic, and subsequently, the development of interstitial spacing. On the other hand, the use of fine powder alone as a precursor might not directly resolve the porosity problems, including the tendency to agglomerate due to high surface energy. As a consequence, a full densification is unlikely to be achieved if other parameters are not optimized. In addition, a relatively fast sintering process facilitated by the high surface area of fine grains would trigger the formation of several bigger grains via abnormal grain growth, contributing to inhomogeneous microstructures and irregular material properties. In addition, excessive formation of glassy structures by fine particles in the vicinity of grain boundaries may decrease the cohesion between grains, increasing the susceptibility to intergranular fracture and microcrack propagation.
In the case of bimodal precursors, combining coarse and fine-sized powders would promote higher densification levels where abnormal grain growth would be suppressed, and agglomeration of fine powders could be minimized, whilst preventing the emergence of a glassy phase and ensuring the development of dense microstructures. If the number of fine powders was slightly higher than the optimum composition, as we found in sample D (4:3 ratio), the drawbacks associated with agglomeration and glassy structures might contribute to the decrease in compactness. The relatively smooth fracture surface and high degree of flexural strength of sample C (5:2), together with a lower number of intergranular fractures, indicated a strong grain cohesion and fewer glassy microstructures in the grain boundaries. The high density of sample C of ~3.95 g/cm3 implied a near-full densification (>99%). This is because in bimodal systems, fine particles promote grain boundary or surface diffusion in the coarse-grain matrix, acting as sintering aids. This synergistic effect led to an improvement in the density of sintered bodies and uniformity in the microstructures of alumina ceramics. In addition, the vacuum atmosphere facilitated extensive elimination of porosity and improved densification by allowing trapped gases to diffuse out and suppressing excessive grain growth. Such atmospheres with low pressure in the chamber create conditions that help the sintering to proceed more efficiently.
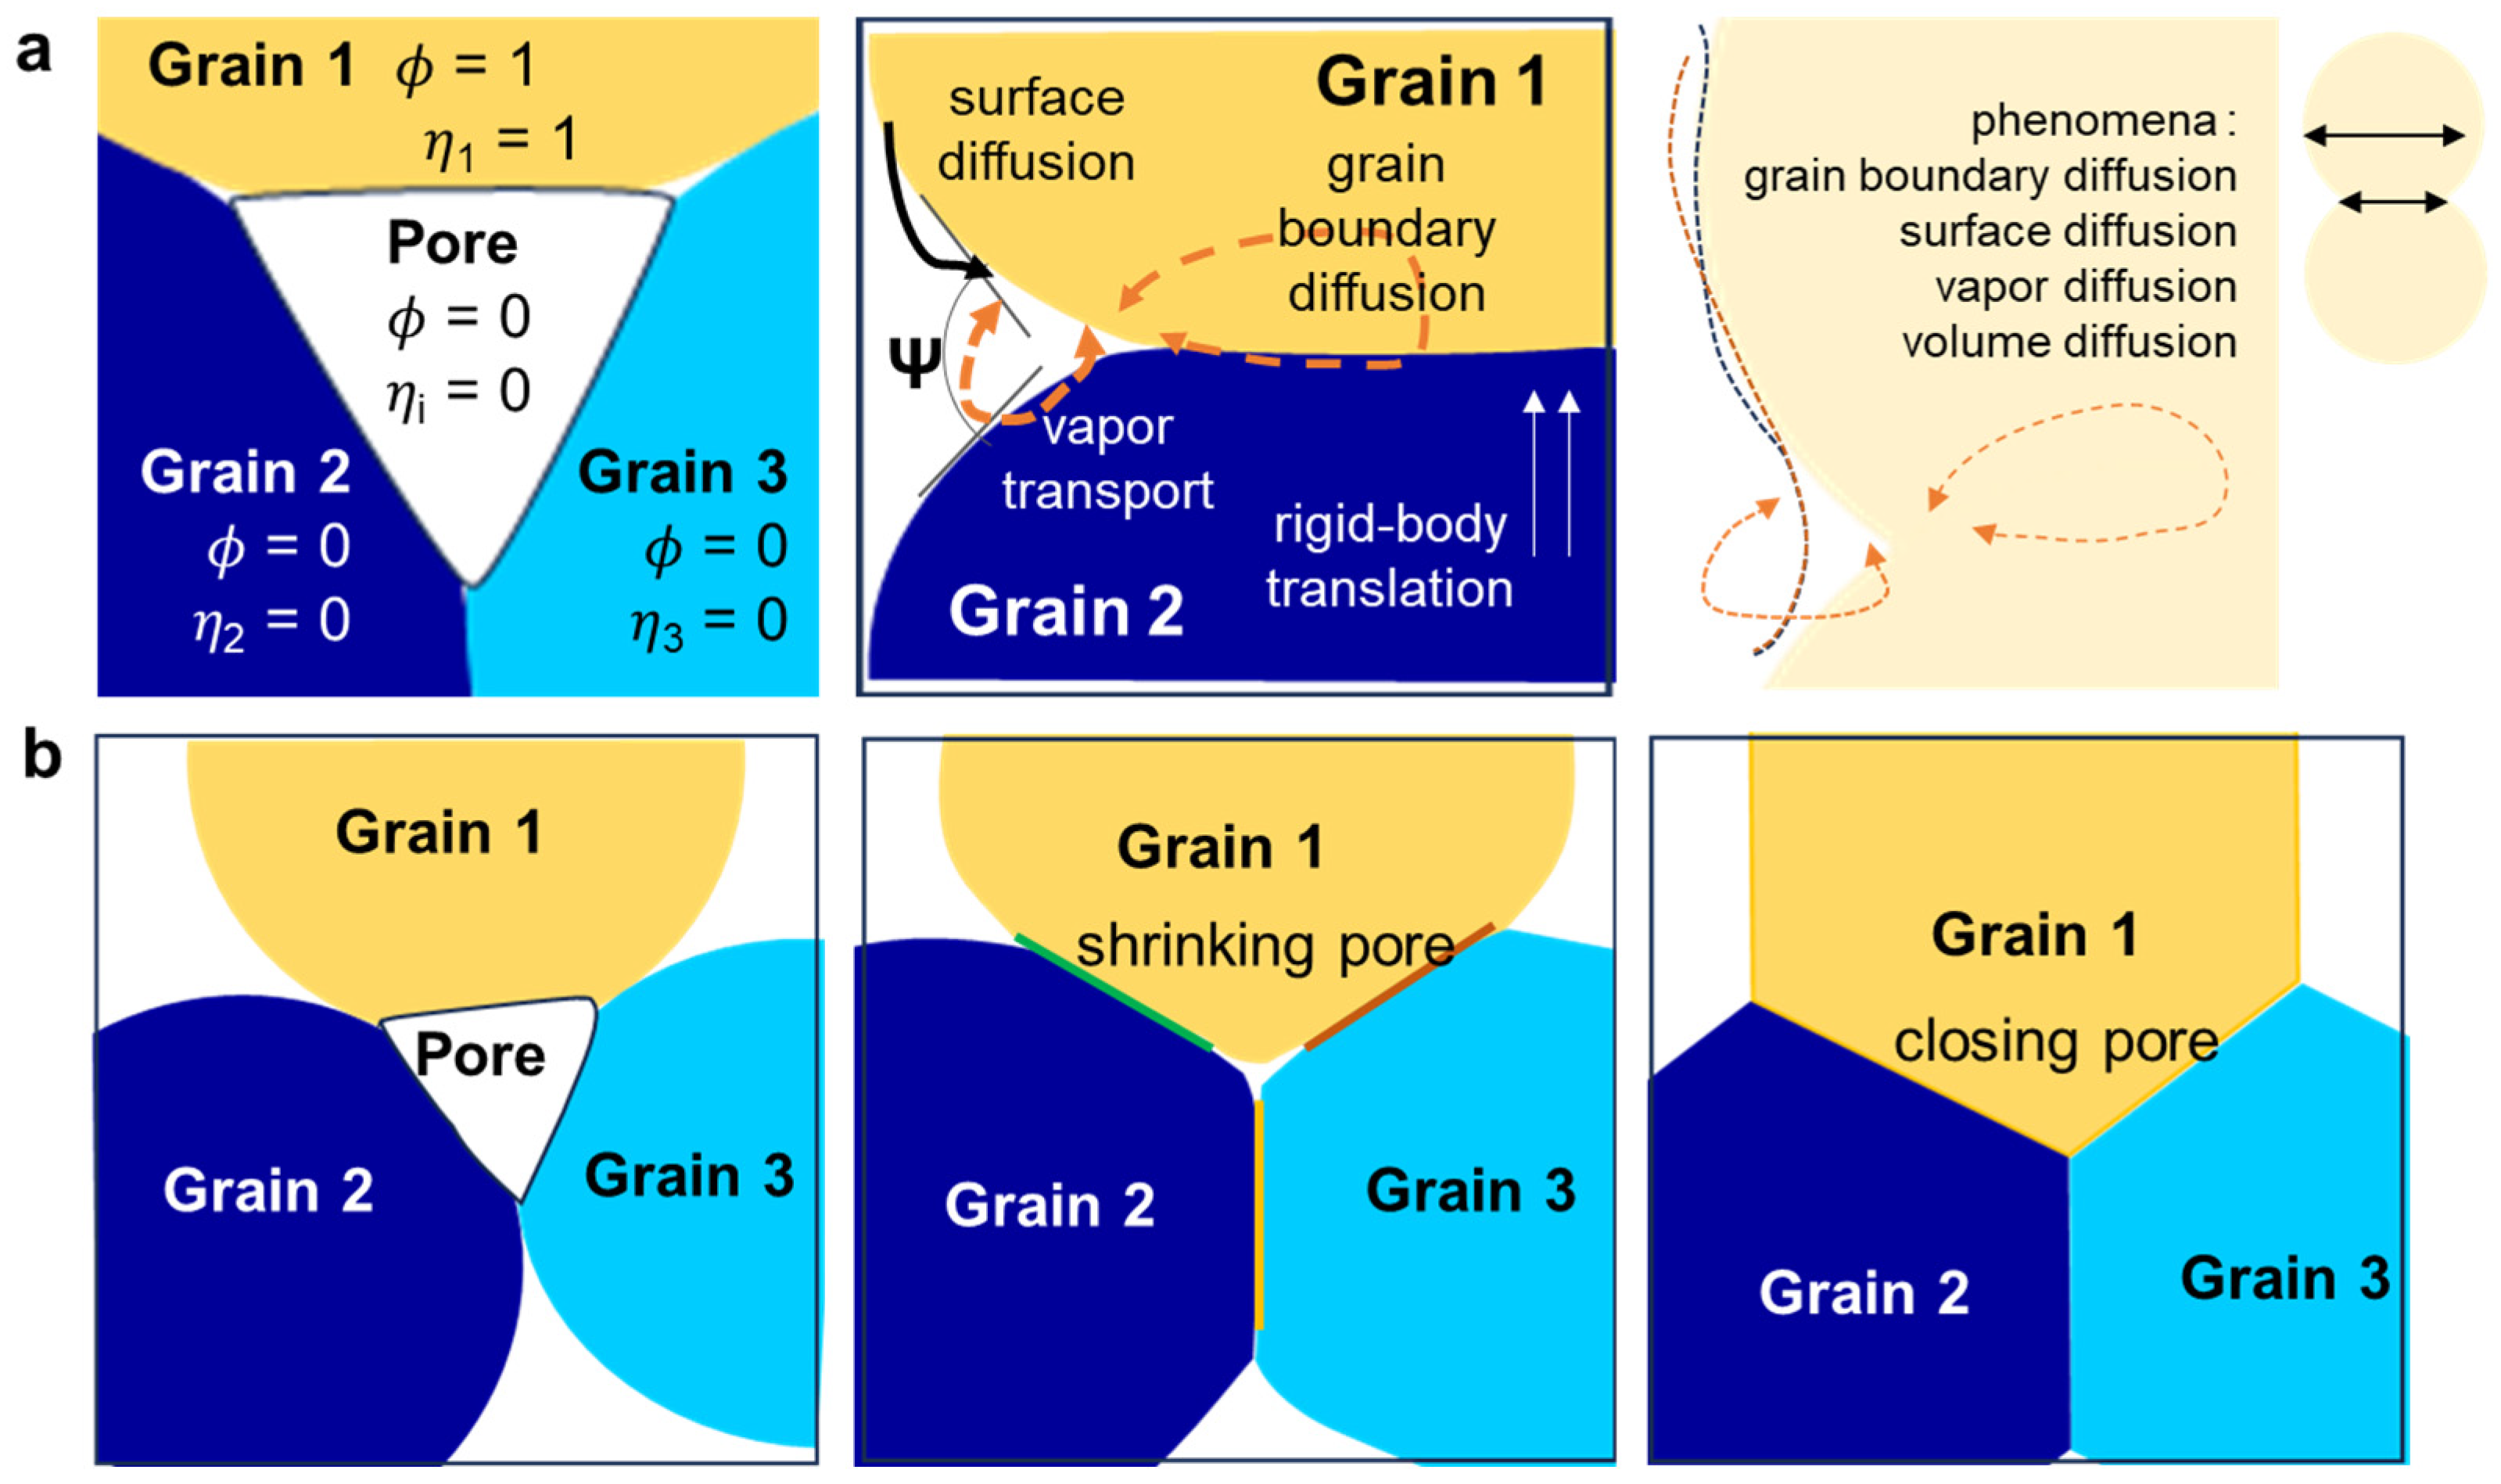
Utilizing three-particle geometry, early particle rearrangements during sintering and neck growth are illustrated in Figure 7a. The order parameters (ϕ, η) could be employed to compute the densification process by utilizing binary code in Equations (4)–(7) [26]. The development of neck and pore reduction can occur simultaneously. The process would include the progressive diffusion of grain boundary, surface, gas vapor, and volume.
During sintering, densification and neck growth between particles are modeled by Equations (8a) and (8b). The linear shrinkage ΔL/L0, which reflects densification, is shown in Equation (8a):
Δ L L 0 =   c o n s t ×   k T t n r m
k is Boltzmann constant, T is temperature of sintering, t is time, n is exponent, rm is mean particle radius. Finer particles (rm small) sinter and densify much faster due to a larger surface area and a higher driving force for mass transport.
For two spherical particles, neck growth (x, where x/r is the relative neck size) as a function of time is given by Equation (8b):
x r =   K   D t γ k T t n 1 / m
x describes neck radius, r is particle radius, D is diffusion coefficient, γ is surface energy, Ω is atomic voulme, t represents time, k is Boltzmann constant, T is absolute temperature, and n, m, K are constants.

4.3. Plasma Etching Mechanism

The bimodal structures containing micron and submicron Al2O3 powders exhibited improved plasma resistance, as clarified by lower weight loss and shallower etch depth.
To understand the erosion mechanism, we must consider both microstructure morphologies and processing conditions. In general, plasma erosion will be categorized into two types: (i) homogenous erosion and (ii) local erosion. According to a previous investigation in [31], it is suggested that an etch depth lower than 1000 nm could be an indication of a homogeneous etching process. In the present results, both samples showed an etch-depth of less than 1000 nm. Therefore, irrespective of particle size, the erosion types for both samples would be homogeneous erosion.
With respect to processing conditions, fluorine radicals would be generated during plasma etching in the CF4/O2 atmosphere. Such radicals would accordingly react with the alumina surface, forming fluorinated etch products such as aluminum fluoride (AlF3) and aluminum oxy-fluoride compounds (AlOxFy), which have low volatility [32,33]. In the presence of O2, the dissociation of CF4 would be promoted, and oxidizing species such as COF2, CO, or CO2 would be formed. Consequently, the recombination of fluorine radicals would be prevented, and a higher concentration of active F atoms would be maintained. It is reported that a 20–40% O2 addition relative to CF4 would be the maximum, beyond which rates decline due to excessive surface oxidation [34,35,36,37]. In the present work, we utilized 25% O2 addition, which falls within the optimum range. The plausible gas phase reactions are listed below in Equations (9a)–(9d) [32,33,38]:
O2− + CF3 → CF2O + F
O2− + CF2 → CFO + F
O2− + CF2 → CO + 2F
O2− + CF → CO + 2F
The etching morphology is strongly affected by the grain structure, porosity, and phase composition of alumina, where dense pure alumina experiences slower and more uniform etching due to fewer weak points, while pores and impurities might localize erosion. The etch rate depended strongly on the ion bombardment energy because it controls both the rate of forming etch products and their physical removal. Energetic ion bombardment from the plasma physically erodes fluorinated surface layers, exposing fresh alumina to continuous chemical fluorination. Electron impact reactions are listed below Equations (10a)–(10d) [32,33,38].
CF4 + e → CF3+ + F + e E = 15.9 eV
CF4 + e → CF22+ + 2F + e E = 15.0 eV
CF3 + e → CF2 + F + e E = 3.80 eV
CF2 + e → C + 2F + e E = 11.0 eV
Besides the microstructures and gas composition, the low pressure of 5 mTorr that was utilized in this study would facilitate the mean free path of ions, enhance anisotropic etching and affect surface erosion and etch uniformity [39]. Since the operating system was kept identical, the major contribution to the erosion behavior would arise from the inherent characteristics of the samples, which include the presence of pores, impurities, the degree of crystallinity, and the density of the ceramics.
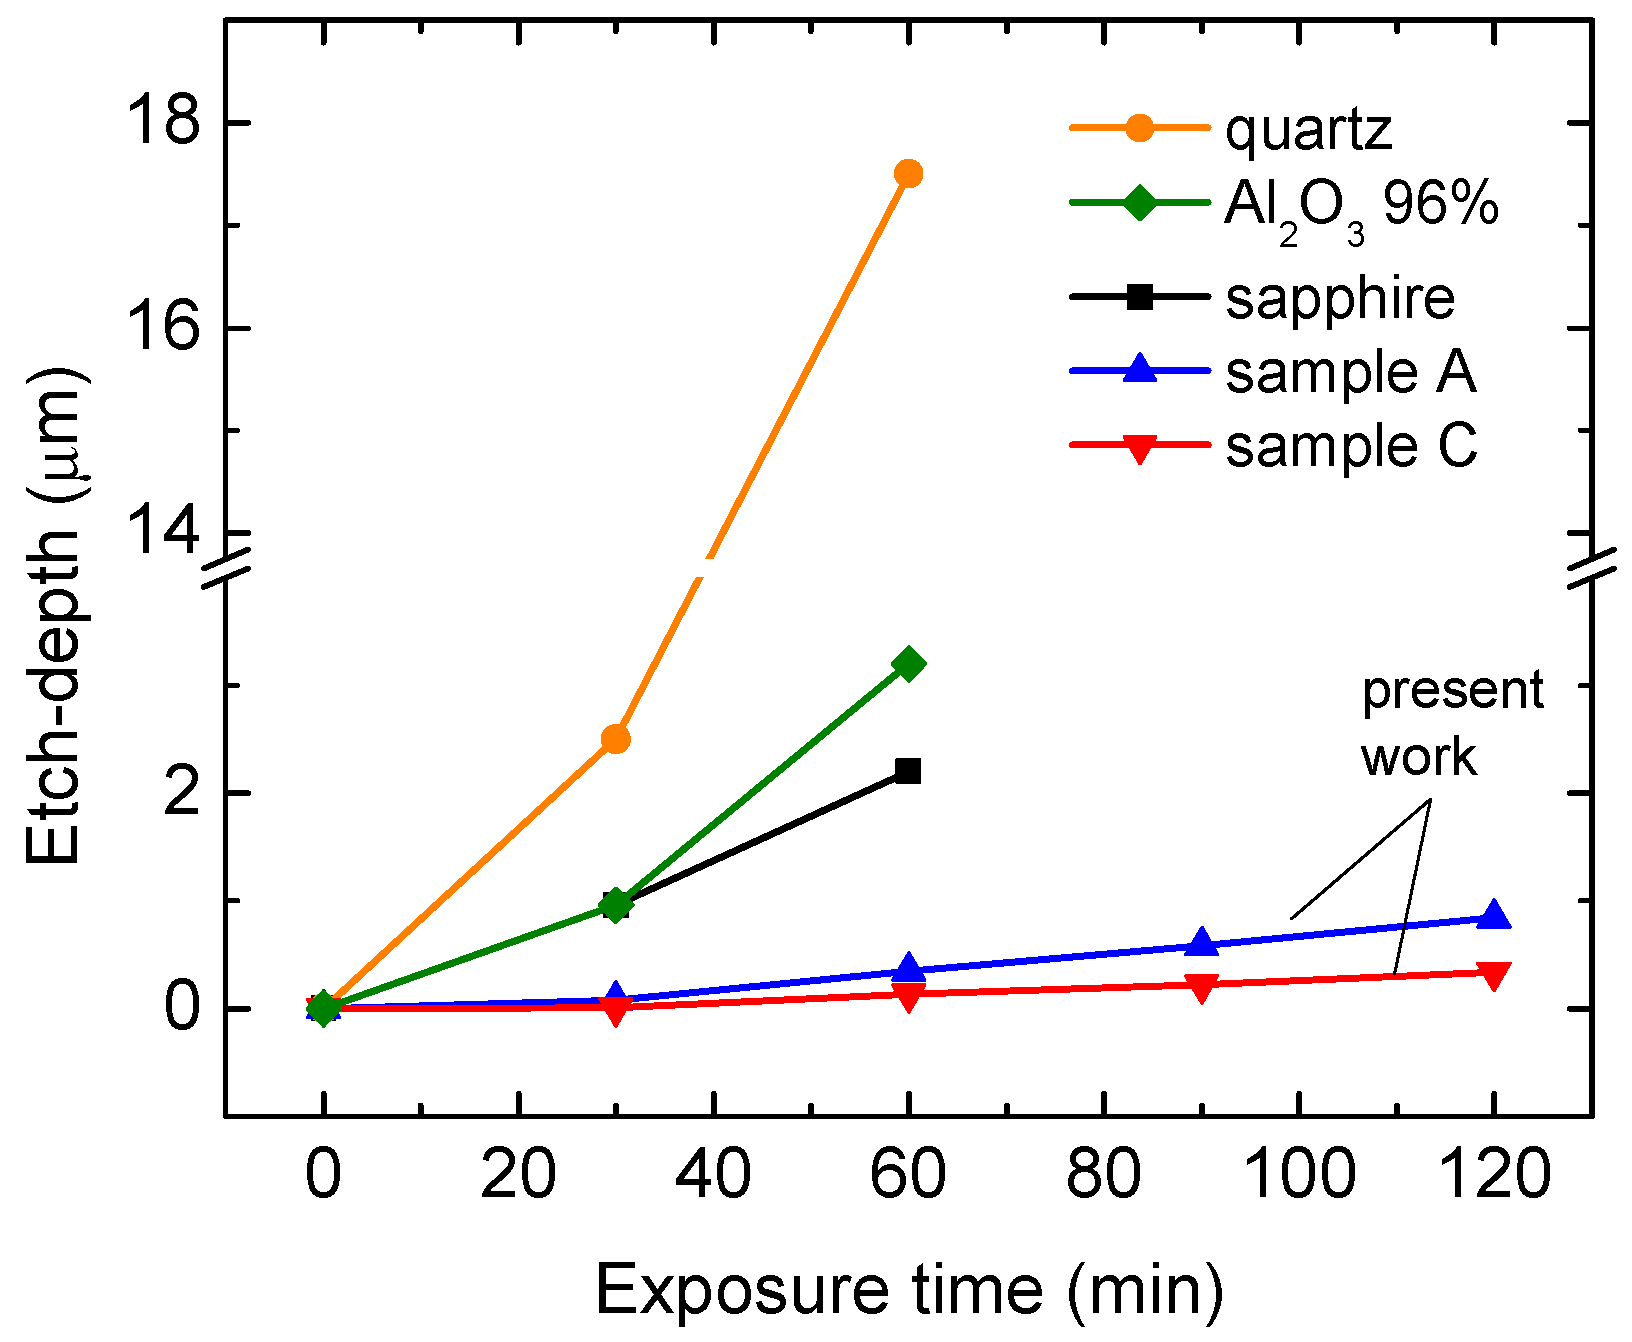
Figure 8 shows the rough comparison of etching depth from the present results with those of others [40]. In the present work, the etch depths of both samples A and C were much lower than those of quartz, 96% Al2O3, and sapphire from [40], implying that the sintering strategy from the present work was relatively effective. The generation of contaminated particles seemed to be higher in sample A as compared to that of sample C.
The correlation between the presence of additives such as SiO2 and CaO in the sample comprising 96% Al2O3 and the resultant mechanical properties in the work by Kim et al. [40] was not specifically addressed and was more focused on the effect of purity. Nevertheless, weaker grain boundary phases would account for low flexural strength in low-purity samples. Rather than affecting the properties directly, the presence of additives generally enhances the microstructural characteristics, such as ceramic density and finer grain, which accordingly improve the mechanical properties of the ceramic. For example, Duan et al. [41] reported that flexural strength, elastic modulus, and fracture toughness exhibited parallel tendencies but a non-linear trend. They initially increased with boron nitride content (0.1–1 μm), reached a peak, and then decreased as the boron nitride content continued to rise. In addition, Yıldız et al. [42] documented that the use of both double additives would be responsible for the increase in flexural strength of Al2O3-Ni composite through the refinement of the microstructure by ZrO2 nanoparticle (0.5 μm) and grain boundary strengthening by Cr2O3 addition. Although the additives were absent, we believed that the results from the current work could be categorized as plasma-resistant materials thanks to the synergistic effect caused by the bimodal structure during densification.

5. Conclusions

Bimodal structures of alumina ceramics were successfully developed through a simple two-step sintering strategy in a vacuum atmosphere at 1450 °C and 1650 °C, consecutively. The current work suggested that an excellent combination of high flexural strength and superior plasma resistance would be achieved with bimodal structures containing micron (~35 μm) and submicron (~611 nm) Al2O3 powders with the 5:2 ratio of coarse-to-fine powders. A near-full densification over 99% with a density of 3.95 g/cm3 was achieved in the absence of any additives. Further investigation would be required to establish a rigorous theoretical foundation grounded in a quantitative approach to understanding the relationship between processing strategies, characteristics of the ceramic structures, and etching mechanisms. Future studies may explore different sintering atmospheres (e.g., gas, pressure) and mixed oxide systems to further enhance plasma durability. In addition, the use of more comprehensive assessments and in-depth understanding across different scientific majors would be meaningful for a wider audience.

Author Contributions

Conceptualization, J.H.K., S.F., I.P.W. and Y.G.K.; methodology, J.H.K., I.P.W., W.B., S.F. and Y.G.K.; software, J.H.K. and I.P.W.; validation, S.F., J.-H.K. and Y.G.K.; formal analysis, J.H.K. and I.P.W.; investigation, J.H.K., I.P.W. and S.F.; resources, J.H.K., I.P.W. and W.B.; data curation, J.H.K. and W.B.; writing—original draft preparation, J.H.K., I.P.W. and S.F.; writing—review and editing, S.F., J.-H.K. and Y.G.K.; visualization, W.B. and I.P.W.; supervision, J.-H.K. and Y.G.K.; project administration, J.-H.K. and Y.G.K.; funding acquisition, Y.G.K. All authors have read and agreed to the published version of the manuscript.

Funding

This research received no external funding.

Data Availability Statement

The data presented in this study are available on request from the corresponding author. The data are not publicly available due to their containing information that could compromise the privacy of research participants.

Conflicts of Interest

The authors declare no conflicts of interest.

References

  1. Shanu, A.; Sharma, P.; Dixit, P. Micromachining of Alumina Ceramic for Microsystems Applications: A systematic review, challenges and future opportunities. Mater. Manuf. Process. 2023, 39, 892–924. [Google Scholar] [CrossRef]
  2. Fu, L.; Huang, A.; Gu, H.; Ni, H. Properties and Microstructures of Lightweight Alumina Containing Different Types of Nano-Alumina. Ceram. Int. 2018, 44, 17885–17894. [Google Scholar] [CrossRef]
  3. Lee, K.M.; Ko, Y.G.; Shin, D.H. Incorporation of Carbon Nanotubes into Micro-Coatings Film Formed on Aluminum Alloy via Plasma Electrolytic Oxidation. Mater. Lett. 2011, 65, 2269–2273. [Google Scholar] [CrossRef]
  4. Coble, R.L. Transparent Alumina and Method of Preparation. U.S. Patent 3026210A, 20 March 1962. [Google Scholar]
  5. Hsu, Y.-F.; Wang, S.-F.; Cheng, T.-W. Effects of Additives on the Densification and Microstructural Evolution of Fine θ-Al2O3 Powder. Mater. Sci. Eng. A 2003, 362, 300–308. [Google Scholar] [CrossRef]
  6. Bae, S.I.; Baik, S. Sintering and Grain Growth of Ultrapure Alumina. J. Mater. Sci. 1993, 28, 4197–4204. [Google Scholar] [CrossRef]
  7. Bae, S.I.; Baik, S. Determination of Critical Concentrations. J. Am. Ceram. Soc. 1993, 76, 1065–1067. [Google Scholar] [CrossRef]
  8. Louet, N.; Reveron, H.; Fantozzi, G. Sintering Behaviour and Microstructural Evolution of Ultrapure α-Alumina Containing Low Amounts of SiO2. J. Eur. Ceram. Soc. 2008, 28, 205–215. [Google Scholar] [CrossRef]
  9. Li, L.; Yang, H.; Sun, X.; Kang, Y.; Zhang, F.; Zhao, Y.; Li, J.; Zhao, L.; Li, J. Influence of SiO2 Addition on the Sintering Behavior and Kinetics of Fine-Sized α-Al2O3 Nanoparticles. Ceramics 2023, 49, 22187–22196. [Google Scholar] [CrossRef]
  10. Baud, S.; Thévenot, F.; Pisch, A.; Chatillon, C. High Temperature Sintering of SiC with Oxide Additives: I. Analysis in the SiC-Al2O3 and SiC-Al2O3-Y2O3 Systems. J. Eur. Ceram. Soc. 2003, 23, 1–8. [Google Scholar] [CrossRef]
  11. Wu, T.; Zhou, J.; Wu, B.; Xiong, Y. Effect of Y2O3 Additives on the Wet Abrasion Resistance of an Alumina-Based Grinding Medium. Wear 2016, 356–357, 9–16. [Google Scholar] [CrossRef]
  12. Koyama, C.; Ishikawa, T.; Watanabe, Y. Density Measurements of Molten Y3Al5O12 and Y2O3-Al2O3 Compounds Using an Electrostatic Levitation Technique. J. Am. Ceram. Soc. 2023, 106, 5648–5653. [Google Scholar] [CrossRef]
  13. Sifat, R.; Akter, M.; Rashid, A.K.M.B. Properties of Micro-Nano Particle Size Admixtures of Alumina at Different Sintering Condition. AIP Conf. Proc. 2016, 1754, 030005. [Google Scholar] [CrossRef]
  14. Koli, D.K.; Agnihotri, G.; Purohit, R. A Review on Properties, Behaviour and Processing Methods for Al- Nano Al2O3 Composites. Procedia Mater. Sci. 2014, 6, 567–589. [Google Scholar] [CrossRef]
  15. Teng, X.; Liu, H.; Huang, C. Effect of Al2O3 Particle Size on the Mechanical Properties of Alumina-Based Ceramics. Mater. Sci. Eng. A 2007, 452–453, 545–551. [Google Scholar] [CrossRef]
  16. Sadeghi, B.; Shamanian, M.; Ashrafizadeh, F.; Cavaliere, P.; Sanayei, M.; Szpunar, J.A. Microstructural Behaviour of Spark Plasma Sintered Composites Containing Bimodal Micro- and Nano-Sized Al2O3 Particles. Powder Metall. 2018, 61, 50–63. [Google Scholar] [CrossRef]
  17. Fellah, M.; Hezil, N.; Bouras, D.; Montagne, A.; Obrosov, A.; Jamshed, W.; Ibrahim, R.W.; Iqbal, A.; El Din, S.M.; Abd El-Wahed Khalifa, H. Investigating the Effect of Milling Time on Structural, Mechanical and Tribological Properties of a Nanostructured Hiped Alpha Alumina for Biomaterial Applications. Arab. J. Chem. 2023, 16, 105112. [Google Scholar] [CrossRef]
  18. Toozandehjani, M.; Matori, K.A.; Ostovan, F.; Aziz, S.A.; Mamat, M.S. Effect of Milling Time on the Microstructure, Physical and Mechanical Properties of Al- Al2O3 Nanocomposite Synthesized by Ball Milling and Powder Metallurgy. Materials 2017, 10, 1232. [Google Scholar] [CrossRef]
  19. Panigrahi, N.; Chaini, R.; Nayak, A.; Chandra Mishra, P. Impact of Milling Time and Method on Particle Size and Surface Morphology during Nano Particle Synthesis from α-Al2O3. Mater. Today Proc. 2018, 5, 20727–20735. [Google Scholar] [CrossRef]
  20. Kang, S.-J.L. What We Should Consider for Full Densification When Sintering. Materials 2020, 13, 3578. [Google Scholar] [CrossRef]
  21. Nivot, C.; Valdivieso, F. Microstructure Refinement of Alumina: Optimisation by Gas Pressure Sintering Process. Ceram. Int. 2008, 34, 1595–1602. [Google Scholar] [CrossRef]
  22. Pan, Y.; Li, H.; Liu, Y.; Liu, Y.; Hu, K.; Wang, N.; Lu, Z.; Liang, J.; He, S. Effect of Holding Time During Sintering on Microstructure and Properties of 3D Printed Alumina Ceramics. Front. Mater. 2020, 7, 54. [Google Scholar] [CrossRef]
  23. Coble, R.L. Sintering Alumina: Effect of Atmospheres. J. Am. Ceram. Soc. 1962, 45, 123–127. [Google Scholar] [CrossRef]
  24. Kingery, W.D.; Bowen, H.K.; Uhlmann, D.R.; Frieser, R. Introduction to Ceramics. J. Electrochem. Soc. 1977, 124, 152C. [Google Scholar] [CrossRef]
  25. Mortensen, A. Kinetics of Densification by Solution-Reprecipitation. Acta Mater. 1997, 45, 749–758. [Google Scholar] [CrossRef]
  26. Wang, Y.U. Computer Modeling and Simulation of Solid-State Sintering: A Phase Field Approach. Acta Mater. 2006, 54, 953–961. [Google Scholar] [CrossRef]
  27. Allen, S.M.; Cahn, J.W. A Microscopic Theory for Antiphase Boundary Motion and Its Application to Antiphase Domain Coarsening. Acta Metall. 1979, 27, 1085–1095. [Google Scholar] [CrossRef]
  28. Cahn, J.W.; Hilliard, J.E. Free Energy of a Nonuniform System. I. Interfacial Free Energy. J. Chem. Phys. 1958, 28, 258–267. [Google Scholar] [CrossRef]
  29. Abdeljawad, F.; Bolintineanu, D.S.; Cook, A.; Brown-Shaklee, H.; DiAntonio, C.; Kammler, D.; Roach, A. Sintering Processes in Direct Ink Write Additive Manufacturing: A Mesoscopic Modeling Approach. Acta Mater. 2019, 169, 60–75. [Google Scholar] [CrossRef]
  30. Ofori-Opoku, N.; Provatas, N. A Quantitative Multi-Phase Field Model of Polycrystalline Alloy Solidification. Acta Mater. 2010, 58, 2155–2164. [Google Scholar] [CrossRef]
  31. Li, Q.; Zhang, Y.; Shi, Z.; Li, W.; Ye, X. Effect of Plasma Etching Depth on Subsurface Defects in Quartz Crystal Elements. Crystals 2023, 13, 1477. [Google Scholar] [CrossRef]
  32. Tezani, L.L.; Pessoa, R.S.; Maciel, H.S.; Petraconi, G. Chemistry Studies of SF6/CF4, SF6/O2 and CF4/O2 Gas Phase during Hollow Cathode Reactive Ion Etching Plasma. Vacuum 2014, 106, 64–68. [Google Scholar] [CrossRef]
  33. Kim, J.-W.; Kim, Y.-C.; Lee, W.-J. Reactive Ion Etching Mechanism of Plasma Enhanced Chemically Vapor Deposited Aluminum Oxide Film in CF4/O2 Plasma. J. Appl. Phys. 1995, 78, 2045–2049. [Google Scholar] [CrossRef]
  34. Kimura, T.; Noto, M. Experimental Study and Global Model of Inductively Coupled CF4/O2 Discharges. J. Appl. Phys. 2006, 100, 063303. [Google Scholar] [CrossRef]
  35. Plumb, I.C.; Ryan, K.R. A Model of the Chemical Processes Occurring in CF4/O2 Discharges Used in Plasma Etching. Plasma Chem. Plasma Process. 1986, 6, 205–230. [Google Scholar] [CrossRef]
  36. Schoenborn, P.; Patrick, R.; Baltes, H.P. Numerical Simulation of a CF4/O2 Plasma and Correlation with Spectroscopic and Etch Rate Data. J. Electrochem. Soc. 1989, 136, 199–205. [Google Scholar] [CrossRef]
  37. Venkatesan, S.P.; Trachtenberg, I.; Edgar, T.F. Modeling of Silicon Etching in CF4/O2 and CF4/H2 Plasmas. J. Electrochem. Soc. 1990, 137, 2280–2290. [Google Scholar] [CrossRef]
  38. Chun, I.; Efremov, A.; Yeom, G.Y.; Kwon, K.-H. A Comparative Study of CF4/O2/Ar and C4F8/O2/Ar Plasmas for Dry Etching Applications. Thin Solid Films 2015, 579, 136–143. [Google Scholar] [CrossRef]
  39. Racka-Szmidt, K.; Stonio, B.; Żelazko, J.; Filipiak, M.; Sochacki, M. A Review: Inductively Coupled Plasma Reactive Ion Etching of Silicon Carbide. Materials 2022, 15, 123. [Google Scholar] [CrossRef] [PubMed]
  40. Kim, D.-M.; Kim, K.-B.; Yoon, S.-Y.; Oh, Y.-S.; Kim, H.-T.; Lee, S.-M. Effects of Artificial Pores and Purity on the Erosion Behaviors of Polycrystalline Al2O3 Ceramics under Fluorine Plasma. J. Ceram. Soc. Jpn. 2009, 117, 863–867. [Google Scholar] [CrossRef]
  41. Duan, X.; Jia, D.; Zhou, Y.; Yang, Z.; Wang, Y.; Ren, F.; Yu, D.; Ding, Y. Mechanical Properties and Plasma Erosion Resistance of BNp/Al2O3-SiO2 composite ceramics. J. Cent. South Univ. 2013, 20, 1462–1468. [Google Scholar] [CrossRef]
  42. Yıldız, B.K.; Tür, Y.K. An Investigation of Equibiaxial Flexural Strength and Hardness Properties of Al2O3–Ni Nanocomposites Based Microstructures with ZrO2 and Cr2O3 Additives. Mater. Sci. Eng. A 2019, 758, 103–111. [Google Scholar] [CrossRef]
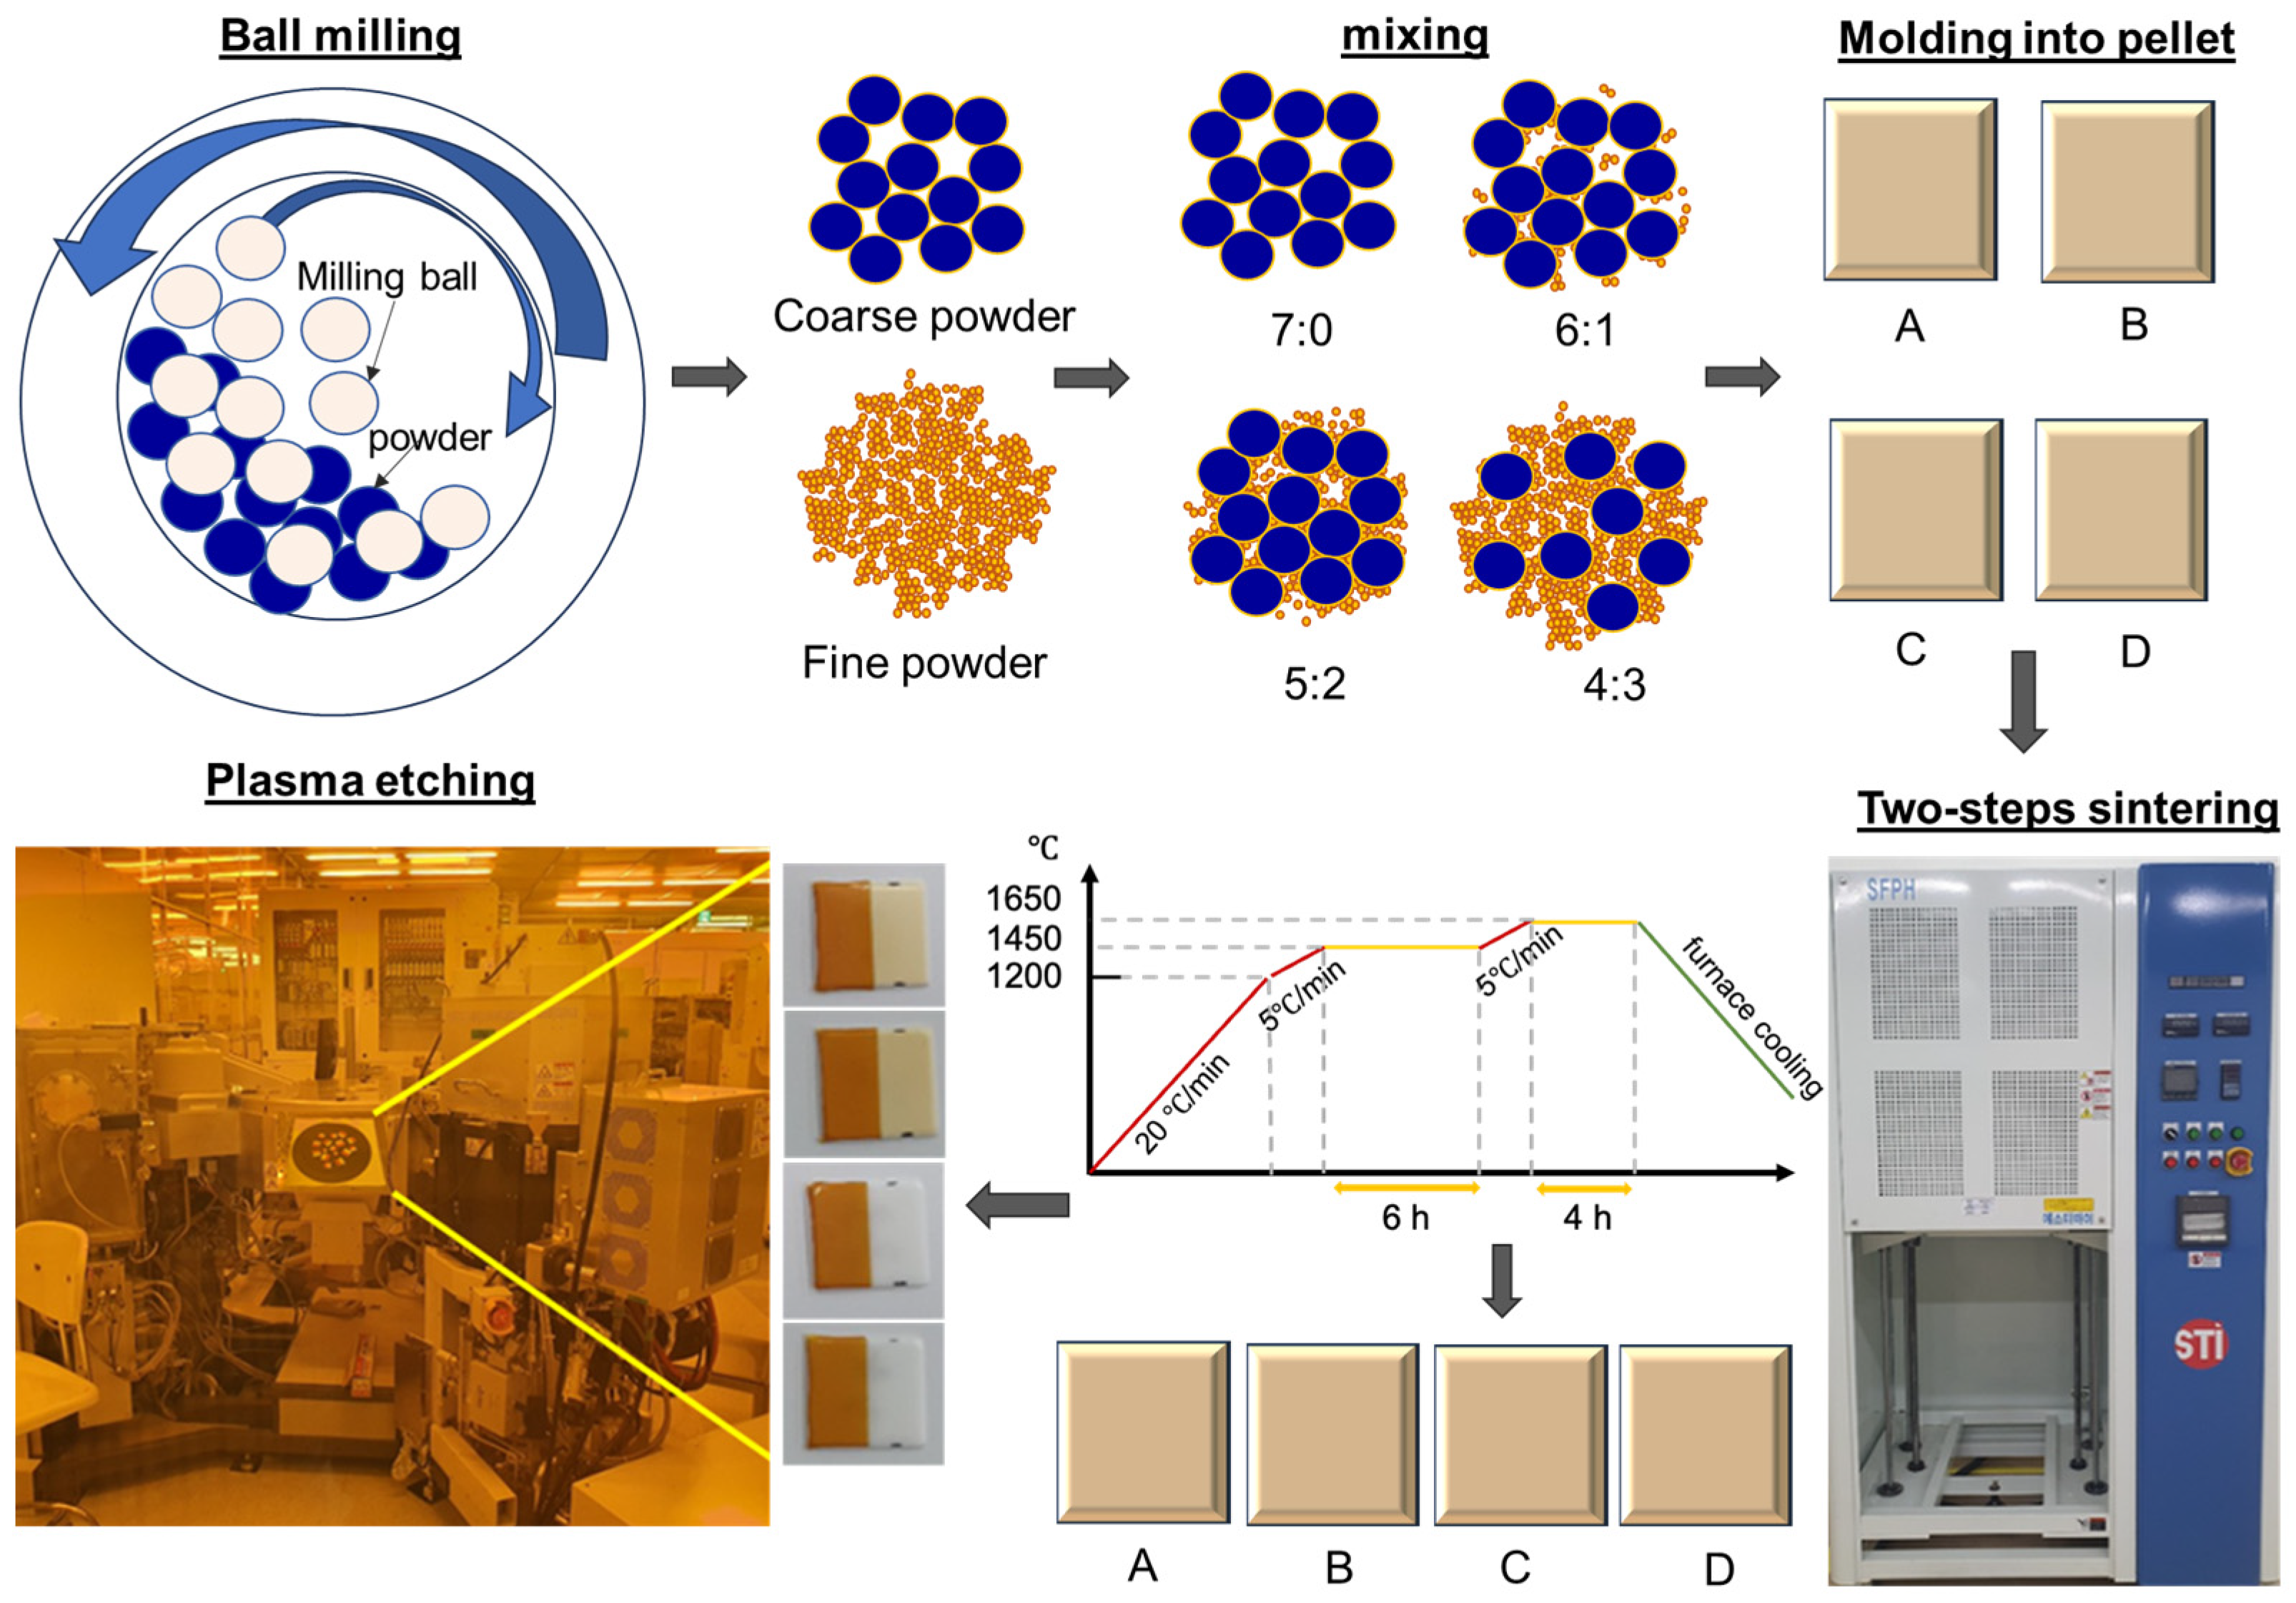
Figure 1. The schematic illustration depicts the experimental steps for the formation of Al2O3 ceramic from milling, powder mixing, molding, and two-step sintering. The plasma etching is conducted with half the surface of the samples covered with Kapton tape.
Lubricants 13 00374 g001
Figure 2. SEM images of Al2O3 powders after ball-milling for (a) 12 h (~35 μm) and (b) 48 h (600 nm) and (c,d) their respective powder size distribution.
Lubricants 13 00374 g002
Figure 3. SEM image of samples after the sintering process utilizing (a) micro-sized Al2O3 powder (sample A), and (bd) combination of micron and submicron Al2O3 powders with composition (b) 6: 1 (sample B), (c) 5:2 (sample C), and (d) 4:3 (sample D), respectively.
Lubricants 13 00374 g003
Figure 4. SEM images and pore analysis results showed the surface porosity before and after the plasma etching process of (a) sample A (b) and sample C. Sample C showed a lower degree of local etching after plasma exposure.
Lubricants 13 00374 g004
Figure 5. Surface profile images showing surface roughness taken from plasma-etched and non-etched areas of (a) sample A and (b) sample C. The red background shows the relatively flat area and the green shows the depleted area by the plasma.
Lubricants 13 00374 g005
Figure 6. Schematic illustration depicts the densification mechanism of Al2O3 ceramic utilizing fine, coarse, and combination (bimodal) powders.
Lubricants 13 00374 g006
Figure 7. A schematic to illustrate the sintering process of three-particle geometry: (a) order parameters of three grains with one pore in between, (b) step-by-step pore annihilation and densification of the ceramics.
Lubricants 13 00374 g007
Figure 8. Etch-depth of samples as a function of exposure time. The results from quartz, sapphire, and Al2O3 purity are from Ref. [40].
Lubricants 13 00374 g008
Table 1. Composition of powdered mixed raw materials.
CompositionSample A
7:0
Sample B
6:1
Sample C
5:2
Sample D
4:3
micro-scale Al2O3 (35 ± 17 μm)7 g6 g5 g4 g
sub-micron Al2O3 (611 ± 95 nm)0 g1 g2 g3 g
Table 2. Sintering details utilizing two-step strategy.
SpecimenPurityRaw MaterialsSintering Temperature
sample A99.99% Al2O3micron Al2O320 °C/min to 1200 °C, then 5 °C/min to 1450 °C (hold 6 h), and 5 °C/min to 1650 °C (hold 4 h)
sample C99.99% Al2O3micron & submicron Al2O3
Table 3. Density of ceramic materials utilizing microscale powders (sample A) and combination of micron/submicron-scale powders (sample C).
SpecimenMass
(g)
Volume
(mm3)
Density
(g/mm3)
Density
(g/cm3)
Average
(g/cm3)
sample A_13.9091994.0119920.0039326493.9326493.91915 ± 0.00961
sample A_23.9200995.0069970.0039396713.939671
sample A_33.9082994.0119920.0039317433.931743
sample A_43.895210000.0038952003.895200
sample A_53.8965999.9990.0038965043.896504
sample C_13.96811007.0069850.0039404893.9404893.95192 ± 0.00347
sample C_23.96821001.9989980.0039602833.960283
sample C_33.96551002.9989970.0039536433.953643
sample C_43.96871002.9989970.0039483593.948359
sample C_53.96871002.9989970.0039568333.956833
Table 4. Porosity of the samples before and after plasma etching.
Porosity (%)
Before EtchingAfter EtchingDifferenceAverage
Sample A_110.8722.3511.4812.03 ± 0.386
Sample A_211.5423.0711.53
Sample A_311.1323.1011.97
Sample A_411.1524.2913.14
Sample C_18.5013.905.405.98 ± 0.221
Sample C_27.9813.945.96
Sample C_37.4513.576.12
Sample C_47.3213.786.46
Table 5. Weight loss results under fluorine plasma exposure with Kapton tape cover.
Time
(min)
Weight (g)
Before Etching
Weight (g)
After Etching
Weight Loss (g)
Tape
(X)
Tape
(O)
Tape
(X)
Tape
(O)
Tape
(X)
Average
(X)
Tape
(O)
Average
(O)
Sample A301.424691.387481.422971.387470.001720.004225 ± 1.084 × 10−30.000010.0002525 ± 1.200 × 10⁻⁴
601.419341.380771.415811.380670.003530.00010
901.423191.386231.418421.385860.004770.00037
1201.412281.374721.405401.374190.006880.00053
Sample C301.363681.336881.362351.336770.001330.002535 ± 5.788 × 10−40.000110.000233 ± 6.909 × 10⁻⁵
601.349571.322861.347481.322650.002090.00021
901.370551.342831.367901.342650.002650.00018
1201.25471.228211.250641.227780.004070.00043
Table 6. Etch-depth results calculated between the plasma-etched and non-etched height.
30 min60 min90 min120 minAverage
Sample A79 nm345 nm588 nm843 nm463.75 ± 81.83 nm
Sample C6 nm132 nm218 nm337 nm173.25 ± 34.91 nm
Table 7. Flexural strength results utilizing 3-point bending.
Width
(nm)
Thickness (mm)Peak Load (kN)Strength
(MPa)
Strength
(MPa)
Sample A_14.003.020.279344.3337.5 ± 3.733
Sample A_24.003.020.267329.2
Sample A_34.003.020.278343.3
Sample A_44.003.020.270333.2
Sample C_14.023.000.50615.1636.3 ± 23.495
Sample C_24.023.000.56699.9
Sample C_34.023.050.53640.0
Sample C_44.023.050.49590.3
Disclaimer/Publisher’s Note: The statements, opinions and data contained in all publications are solely those of the individual author(s) and contributor(s) and not of MDPI and/or the editor(s). MDPI and/or the editor(s) disclaim responsibility for any injury to people or property resulting from any ideas, methods, instructions or products referred to in the content.