Abstract
The semi-autogenous grinding (SAG) mill, renowned for its high efficiency, high production capacity, and low cost, is widely used for crushing and grinding equipment. However, the current understanding of the overall particle behavior influencing its efficiency remains relatively limited, particularly the impact of the shape of SAG mill liners on material behavior. This study employs discrete element method (DEM) simulation technology to investigate the effects of different liner structures on particle trajectories and collision energy, systematically investigating the impact of lifter bars angle, height, and the number of lifter bars on grinding efficiency. The results of single-factor simulations indicate that when the lifter bars height (230 mm) and the number of lifter bars (36) are fixed, the total collision energy dissipation between steel balls and ore, as well as among ore particles, reaches a maximum of 526,069.53 J when the lifter bars angle is 25°. When the lifter bar angle is fixed at 25° and the number of lifter bars is set to 36, the maximum collision energy dissipation of 627,606.06 J occurs at a lifter bars height of 210 mm. When the angle (25°) and height (210 mm) are fixed, the highest energy dissipation of 443,915.37 J is observed with 12 lifter bars. Results from the three-factor, three-level orthogonal experiment reveal that the number of lifter bars exerts the most significant influence on grinding efficiency, followed by the angle and height. The optimal combination is determined to be a 20° angle, 12 lifter bars, and a 210 mm height, resulting in the highest total collision energy dissipation of 700,334 J. This represents an increase of 379,466 J compared to the original SAG mill liner configuration (320,868 J). This research aims to accurately simulate the motion of discrete particles within the mill through DEM simulations, providing a basis for optimizing the operational parameters and structural design of SAG mills.
1. Introduction
The SAG mill is one of the mining industry’s most widely used crushing and grinding equipment [1,2]. Among various crushing and grinding devices, SAG mills offer advantages such as high efficiency, large production capacity, and low cost [3,4,5]. Particularly in terms of production capacity, SAG mills can eliminate the intermediate and fine crushing operations, thereby improving labor productivity. In industrial applications, raw ore must be crushed and ground in an SAG mill to a particle size distribution suitable for subsequent separation. Failure to achieve an appropriate particle size distribution reduces the efficiency of subsequent grinding processes and increases grinding media consumption and overall grinding costs [6,7]. To ensure that the raw ore in the SAG mill reaches the required particle size, it is crucial to understand the movement and trajectories of particles inside the mill. The motion behavior of materials in an SAG mill is influenced not only by the physical and chemical properties of the materials themselves and operational factors but also by the characteristics of the SAG mill itself. Among these, the liner design, particularly the lifter bars, has a significant impact. However, there is relatively limited research by scholars on the influence of liners on the internal materials of SAG mills.
The DEM, as a numerical simulation technique, has become a reliable tool for studying particle behavior. DEM simulates the behavior of individual particles based on Newton’s second law of motion, incorporating various contact models, such as the Hertz–Mindlin (no-slip) model and the standard rolling friction model. In recent years, with significant advancements in algorithms and computer hardware, DEM has been applied to various powder processes, including comminution [8], storage [9,10], conveying [11,12], granulation [13,14,15], separation [16,17,18], and fluidization [19,20,21]. Therefore, the applicability of DEM simulation in SAG mill research has been demonstrated [22,23,24]. However, despite these advancements, there is still a lack of in-depth understanding of how the shape of lifter bars (which significantly affects SAG mill grinding efficiency) influences overall particle behavior. Currently, the design and optimization of SAG mill lifter bar liners still rely primarily on empirical methods. Therefore, this study uses DEM simulation technology to systematically analyze the operation process of SAG mills, particularly the impact of different lifter bar shapes on grinding efficiency.
Therefore, this study aims to investigate the influence of lifter bar geometry in semi-autogenous grinding (SAG) mills on grinding efficiency. First, a model of the mill liner was constructed using SolidWorks software (2024 version), which was simplified to a 0.3 m long cylindrical section. Subsequently, the angle of repose test was determined using the General EDEM Material Model (GEMM) database in EDEM software (2018 version) to validate the contact parameters for DEM simulation. Finally, DEM simulations were performed to study the particle grinding process under varying conditions of lifter bar angles, heights, and numbers, including visualization of particle motion trajectories and collision energy distributions. These results reveal the mechanism by which SAG mill lifter bar design affects grinding efficiency.
2. Materials and Methods
2.1. Experimental Materials
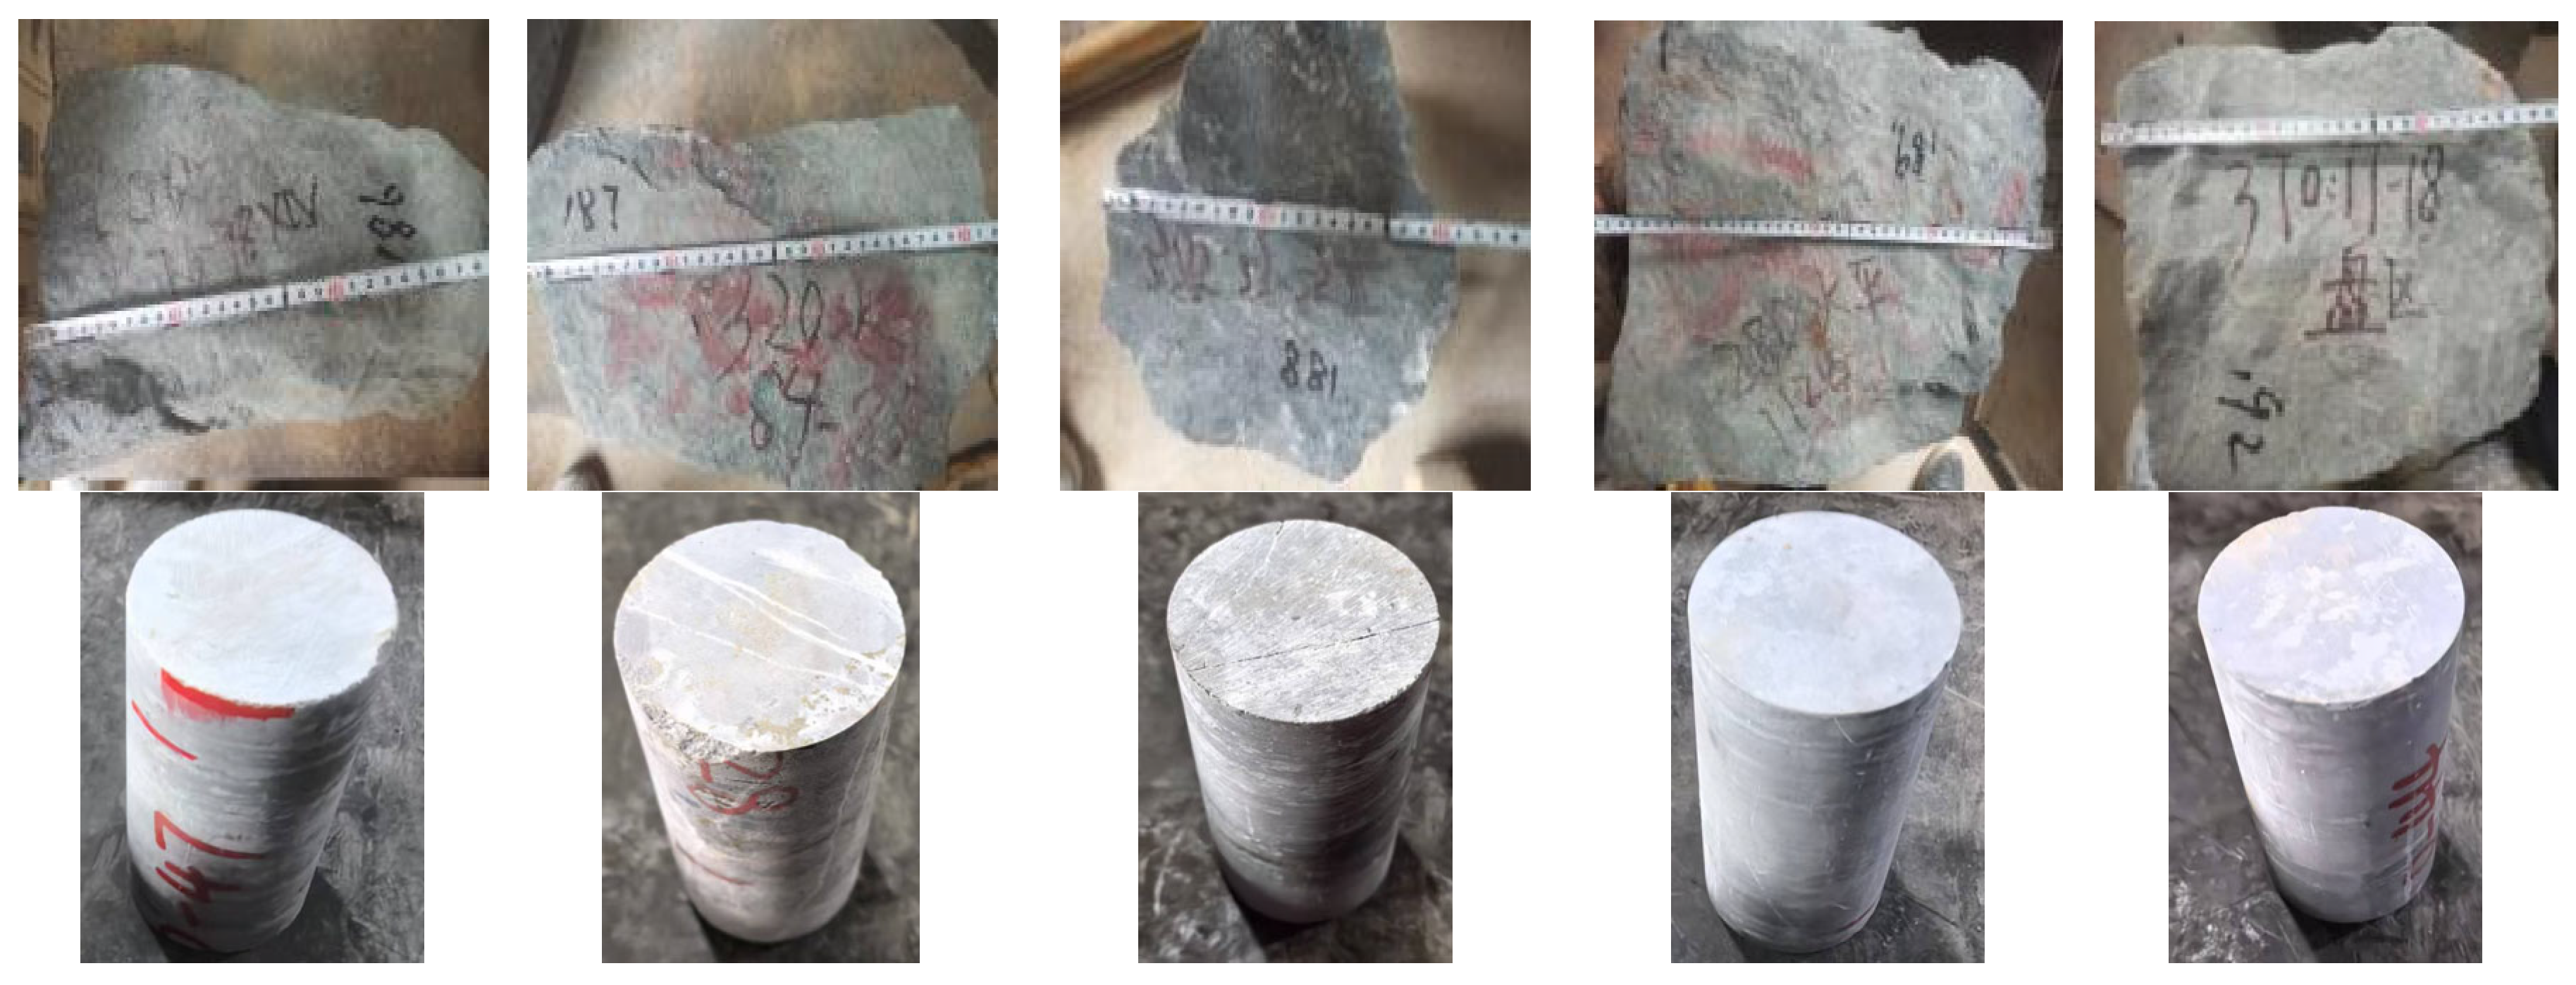
Representative ore blocks were collected from a mine in Yunnan Province (China). The ore blocks were cut into cylindrical specimens with a diameter of 10 cm and a height of 10 cm for mechanical property testing. Photographs of the original ore blocks and the prepared cylindrical specimens are shown in Figure 1. The mechanical properties of ore were tested (shear resistance, microcomputer controlled electro-hydraulic servo pressure testing machine, YAW4206T, Metus Industrial Systems (China) Co., Ltd. Shenzhen branch, Shenzhen, China; compression, computer automatic constant stress testing, machine, DYE-2000S, Tianjin Metes test machine factory, Tianjin, China), and the results of mechanical properties of ores are shown in Table 1.

Figure 1.
Ore blocks: The upper part shows the original ore blocks, and the lower part shows the polished ore blocks.

Table 1.
Results of mechanical property tests on ore samples.
Results of the mechanical property tests on the ore samples show
- (1)
- The maximum bulk density of the ore is 4.70 g/cm3, the minimum is 3.36 g/cm3, and the average is 3.86 g/cm3, indicating a relatively high bulk density.
- (2)
- The Protodyakonov hardness coefficient ranges from 6.69 (relatively soft) to 19.6 (relatively hard), indicating uneven hardness distribution. The average hardness coefficient is 9.64, classifying the ore as moderately hard overall.
- (3)
- The maximum elastic modulus is 12.6 × 10⁴ MPa, the minimum is 2.33 × 10⁴ MPa, and the average is 8.44 × 10⁴ MPa.
- (4)
- Poisson’s ratio ranges from 0.21 to 0.38, with an average of 0.27.
2.2. Experimental Procedure
A SAG mill of Φ5.5 m × 6.6 m in a concentrator served as the prototype, and its the angles, heights, and numbers of liner lifter bars were studied as objects of research to evaluate the grinding effects of numerical simulations under different structural configurations. To reduce simulation time and ensure calculation accuracy, the SAG mill cylinder liner model was simplified: The cylinder was modeled as a steel shell with liners attached to the inner wall, and a representative 0.30 m long section in the middle of the cylinder was modeled as the research object [25]. The mill rotational speed was set to 76% of critical speed, the ore filling rate was 22%, and the grinding media (steel ball) filling rate was 13%.
A geometric model of the SAG mill cylinder liner was established using SolidWorks software and then imported into EDEM software for simulation. The single-variable method and orthogonal experiment design were employed to study the effects of different liner lifter bar parameters on particle motion trajectories and collision energy distribution to analyze the mechanism of the shape of SAG mill liner lifter bars on grinding efficiency.
2.3. Numerical Modeling
2.3.1. Base Model
The Hertz–Mindlin (no-slip) model is widely recognized for its accurate and efficient force calculation in particle interactions. In this model, the normal force component is derived from Hertzian contact theory, as originally described by Hertz in 1882 [26]. The tangential force model is based on the work of Mindlin and Deresiewicz [27,28], who explored the compliance of elastic bodies in contact and the behavior of elastic spheres under varying oblique forces. Both normal and tangential forces in the model incorporate damping components, where the damping coefficient is linked to the coefficient of restitution, as detailed in the Lagrangian numerical simulations by Tsuji et al. [29]. The tangential friction force follows the Coulomb law of friction, consistent with the discrete numerical model for granular assemblies developed by Cundall and Strack [30]. Additionally, rolling friction is implemented as a contact-independent directional constant torque model, similar to the approach described by Sakaguchi et al. [31].
In particular, the normal force, Fn, is a function of normal overlap δn and is defined as
The equivalent Young’s Modulus E* and the equivalent radius R* are defined as
With Ei, vi, and Ri, and Ej, vj, and Rj being the Young’s Modulus, Poisson ratio, and radius of each sphere in contact. Additionally, there is a damping force, , given by
m* is the equivalent mass, is the normal component of the relative velocity, and β and Sn (the normal stiffness) are defined as
With e the coefficient of restitution, the tangential force, Ft, depends on the tangential overlap δt and the tangential stiffness St.
With
Here, G* is the equivalent shear modulus. Additionally, tangential damping is defined as
where is the relative tangential velocity. The tangential force is limited by Coulomb friction μsFn, where μs is the coefficient of static friction.
2.3.2. Friction Model
Rolling friction is accounted for by applying a torque to the contacting surfaces in simulations where rolling friction is important.
with μr the coefficient of rolling friction, Ri the distance of the contact point from the center of mass, and ωi the unit angular velocity vector of the object at the contact point.
2.4. Experimental Method
2.4.1. Determination of the Simulation Reference Period
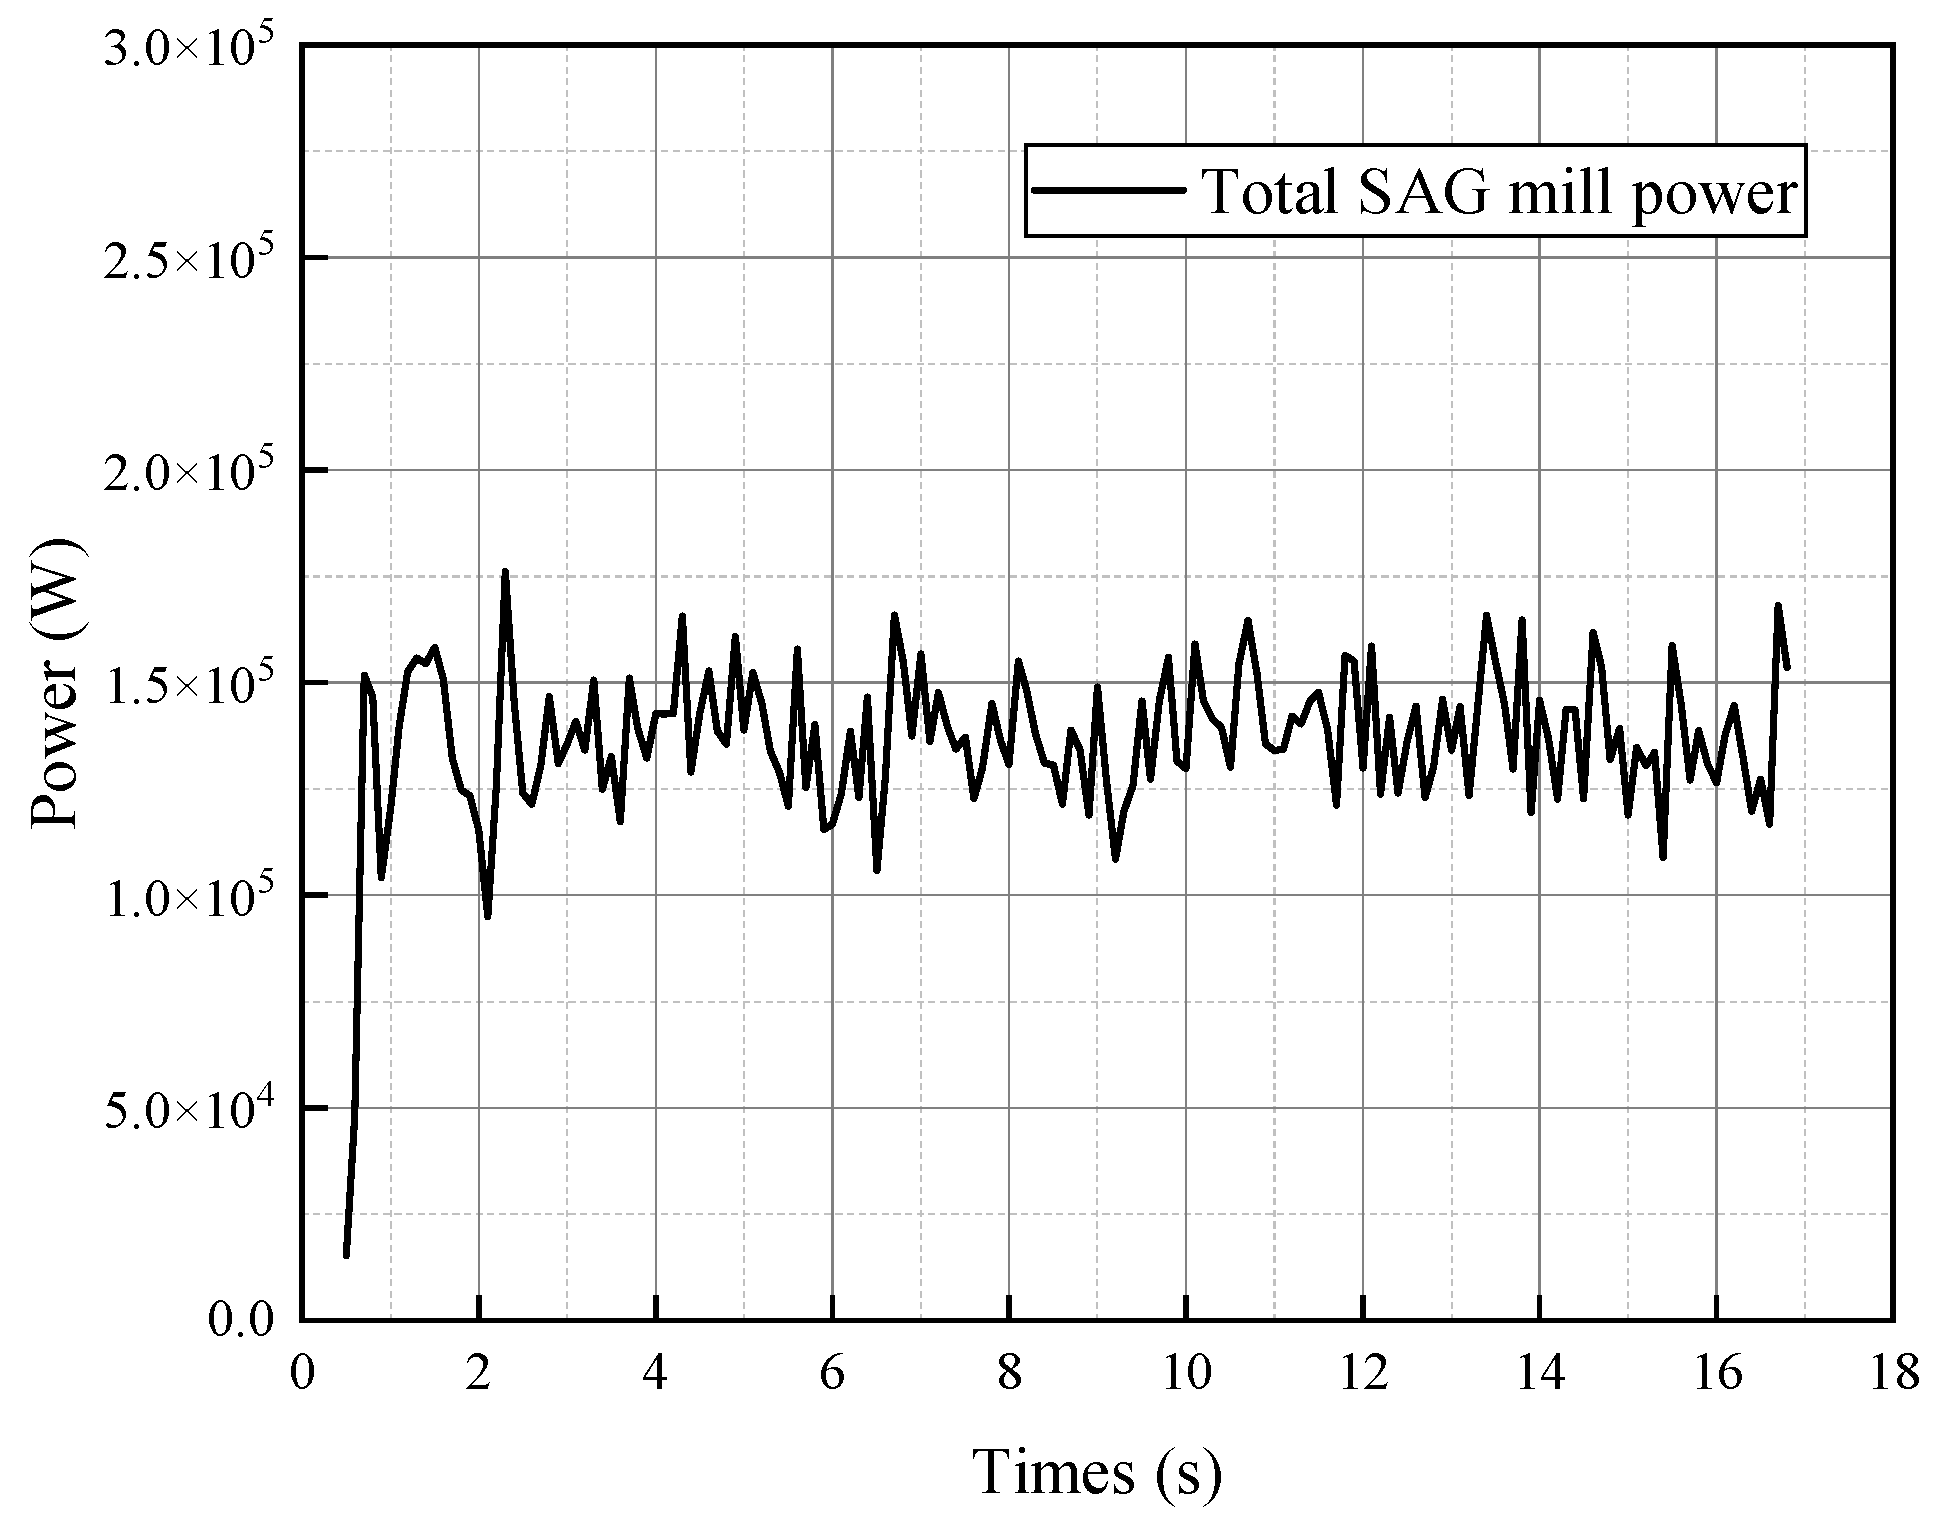
Simulations were first conducted under the actual operating conditions of the SAG mill. Based on fluctuations in power, a stable operating period of the SAG mill was identified, with the operating power profile shown in Figure 2. The results show that the total mill power of the SAG mill fluctuated significantly within the first 2.5 s, corresponding to the startup phase. Subsequently, the power stabilized, a trend also observed in the total particle kinetic energy after 12.57 s. Therefore, for collision energy calculations, data from the initial 12.57 s (startup phase) were excluded. The stable operating phase from 12.57 to 16.89 s was used for statistical analysis. Consequently, DEM simulation data for all tests were exported over the interval from 12.57 to 16.89 s, corresponding to an effective analysis duration of 4.32 s.
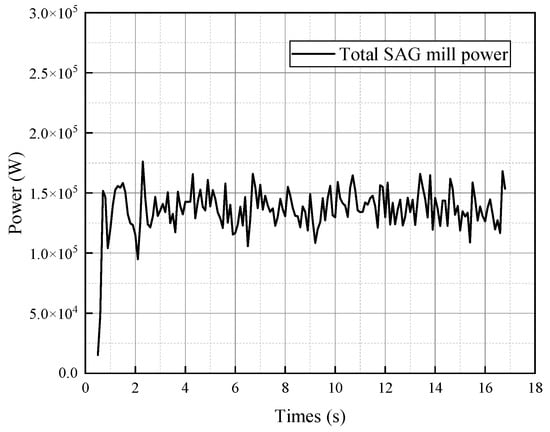
Figure 2.
Total power of the SAG mill.
The stable operation phase of the SAG mill was selected to analyze the results of the simulation experiments. By comparing the collision energy and particle motion trajectories under different conditions, the influence of changes in lifter bar parameters on the grinding process was clarified.
2.4.2. Single Variable Method
The DEM simulation study of the SAG mill cylinder liner aims to accurately simulate the motion of discrete particles within the mill, providing a basis for optimizing mill operational parameters and structural design. This study employed the single-variable method, where two of the three parameters (lifter bar angle, height, and number) were held constant while the third was varied. This approach was used to investigate the influence of each liner parameter on the motion trajectories of ore and grinding media (steel balls) and the collision energy dissipation. This provides a basis for the subsequent orthogonal experiment. The simulation experimental scheme for the single variable method is presented in Table 2.
Table 2.
DEM simulation test program.
2.4.3. Orthogonal Experimental Method
To improve simulation accuracy, evaluate the influence of SAG mill lifter bar parameters on grinding efficiency, assess the appropriateness of selected parameter values, and analyze various collision energy distributions, an orthogonal design method was employed to conduct comparative tests for lifter bar optimization.
In the relevant tests of Section 2.4.2, the optimal grinding performance of the SAG mill was achieved when the lifter bars angle was 25°, height was 230 mm, and number of lifter bars was 36 groups, as determined by the single variable method. Therefore, the lifter bar angle range in the orthogonal tests was set from 20° to 30°.
According to liner design principles, the optimal height range of lifter bars is 0.5–1.5 times the diameter of the steel balls. Given the current maximum steel ball diameter of 150 mm, the upper limit of the corresponding lifter bars height range is 230 mm. Combining experimental data analysis, to ensure maximum energy within the SAG mill is utilized for ore grinding and minimize liner wear, the lifter bar height in the orthogonal tests was set within the range of 190 mm to 230 mm.
Based on liner design principles, the ratio of lifter bar pitch to height should be between 3 and 4. When the lifter bars height is 210 mm, the minimum liner pitch is 630 mm, accommodating up to 24 lifter bars. According to relevant experimental results, the optimal grinding efficiency was achieved with 12 lifter bars groups under single-variable conditions. Therefore, the orthogonal test range for the number of lifter bars was set at 12–24 groups.
The experimental factors and their levels used in this experiment are presented in Table 3. The corresponding orthogonal test design (L9 array) is shown in Table 4.
Table 3.
Experimental factors and levels.
Table 4.
Orthogonal test L9 (34) factor level table.
3. Modeling of SAG Mill Liner
3.1. SAG Mill Liner
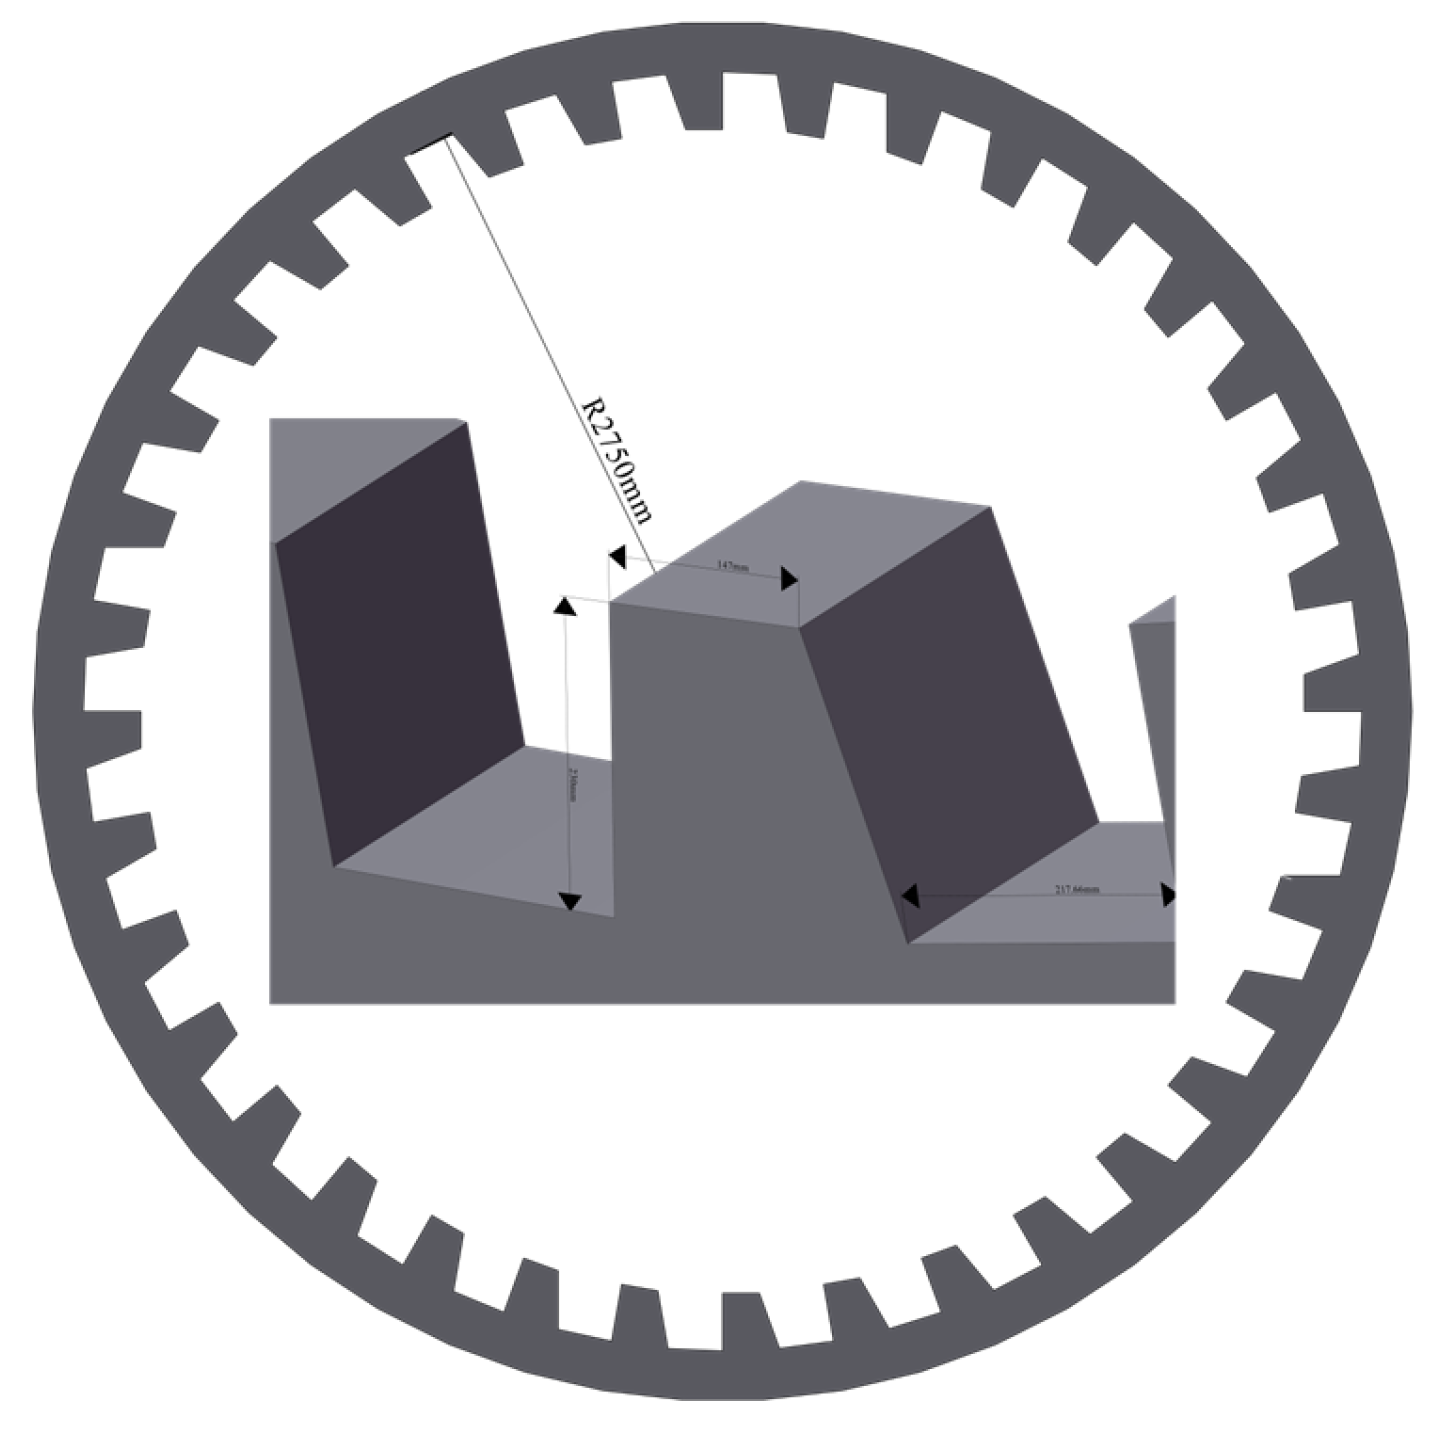
The original SAG mill liner lifter bars featured lifter bars with a 110° angle, a height of 230 mm, and a total of 36 lifter bars. The lifter bars profile is shown in Figure 3.
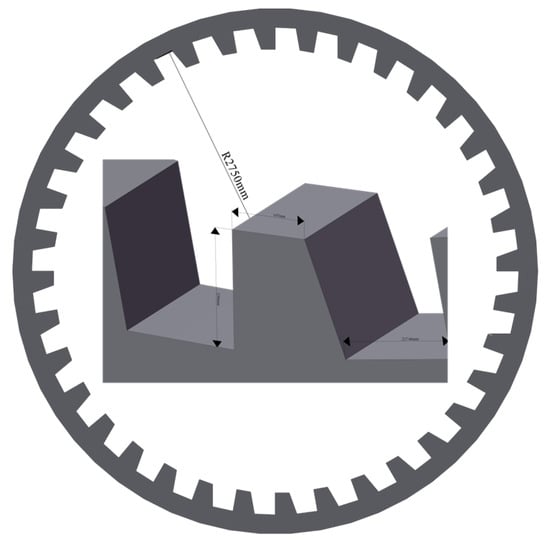
Figure 3.
Schematic diagram of the Φ5.5 m SAG mill.
3.2. Operation Parameters
The experimental conditions are summarized in Table 5.
Table 5.
Experimental conditions.
The physical properties of particles in simulations are listed in Table 6.
Table 6.
Physical properties of particles in simulations [32].
4. Results and Discussion
4.1. Results of Single-Factor Tests
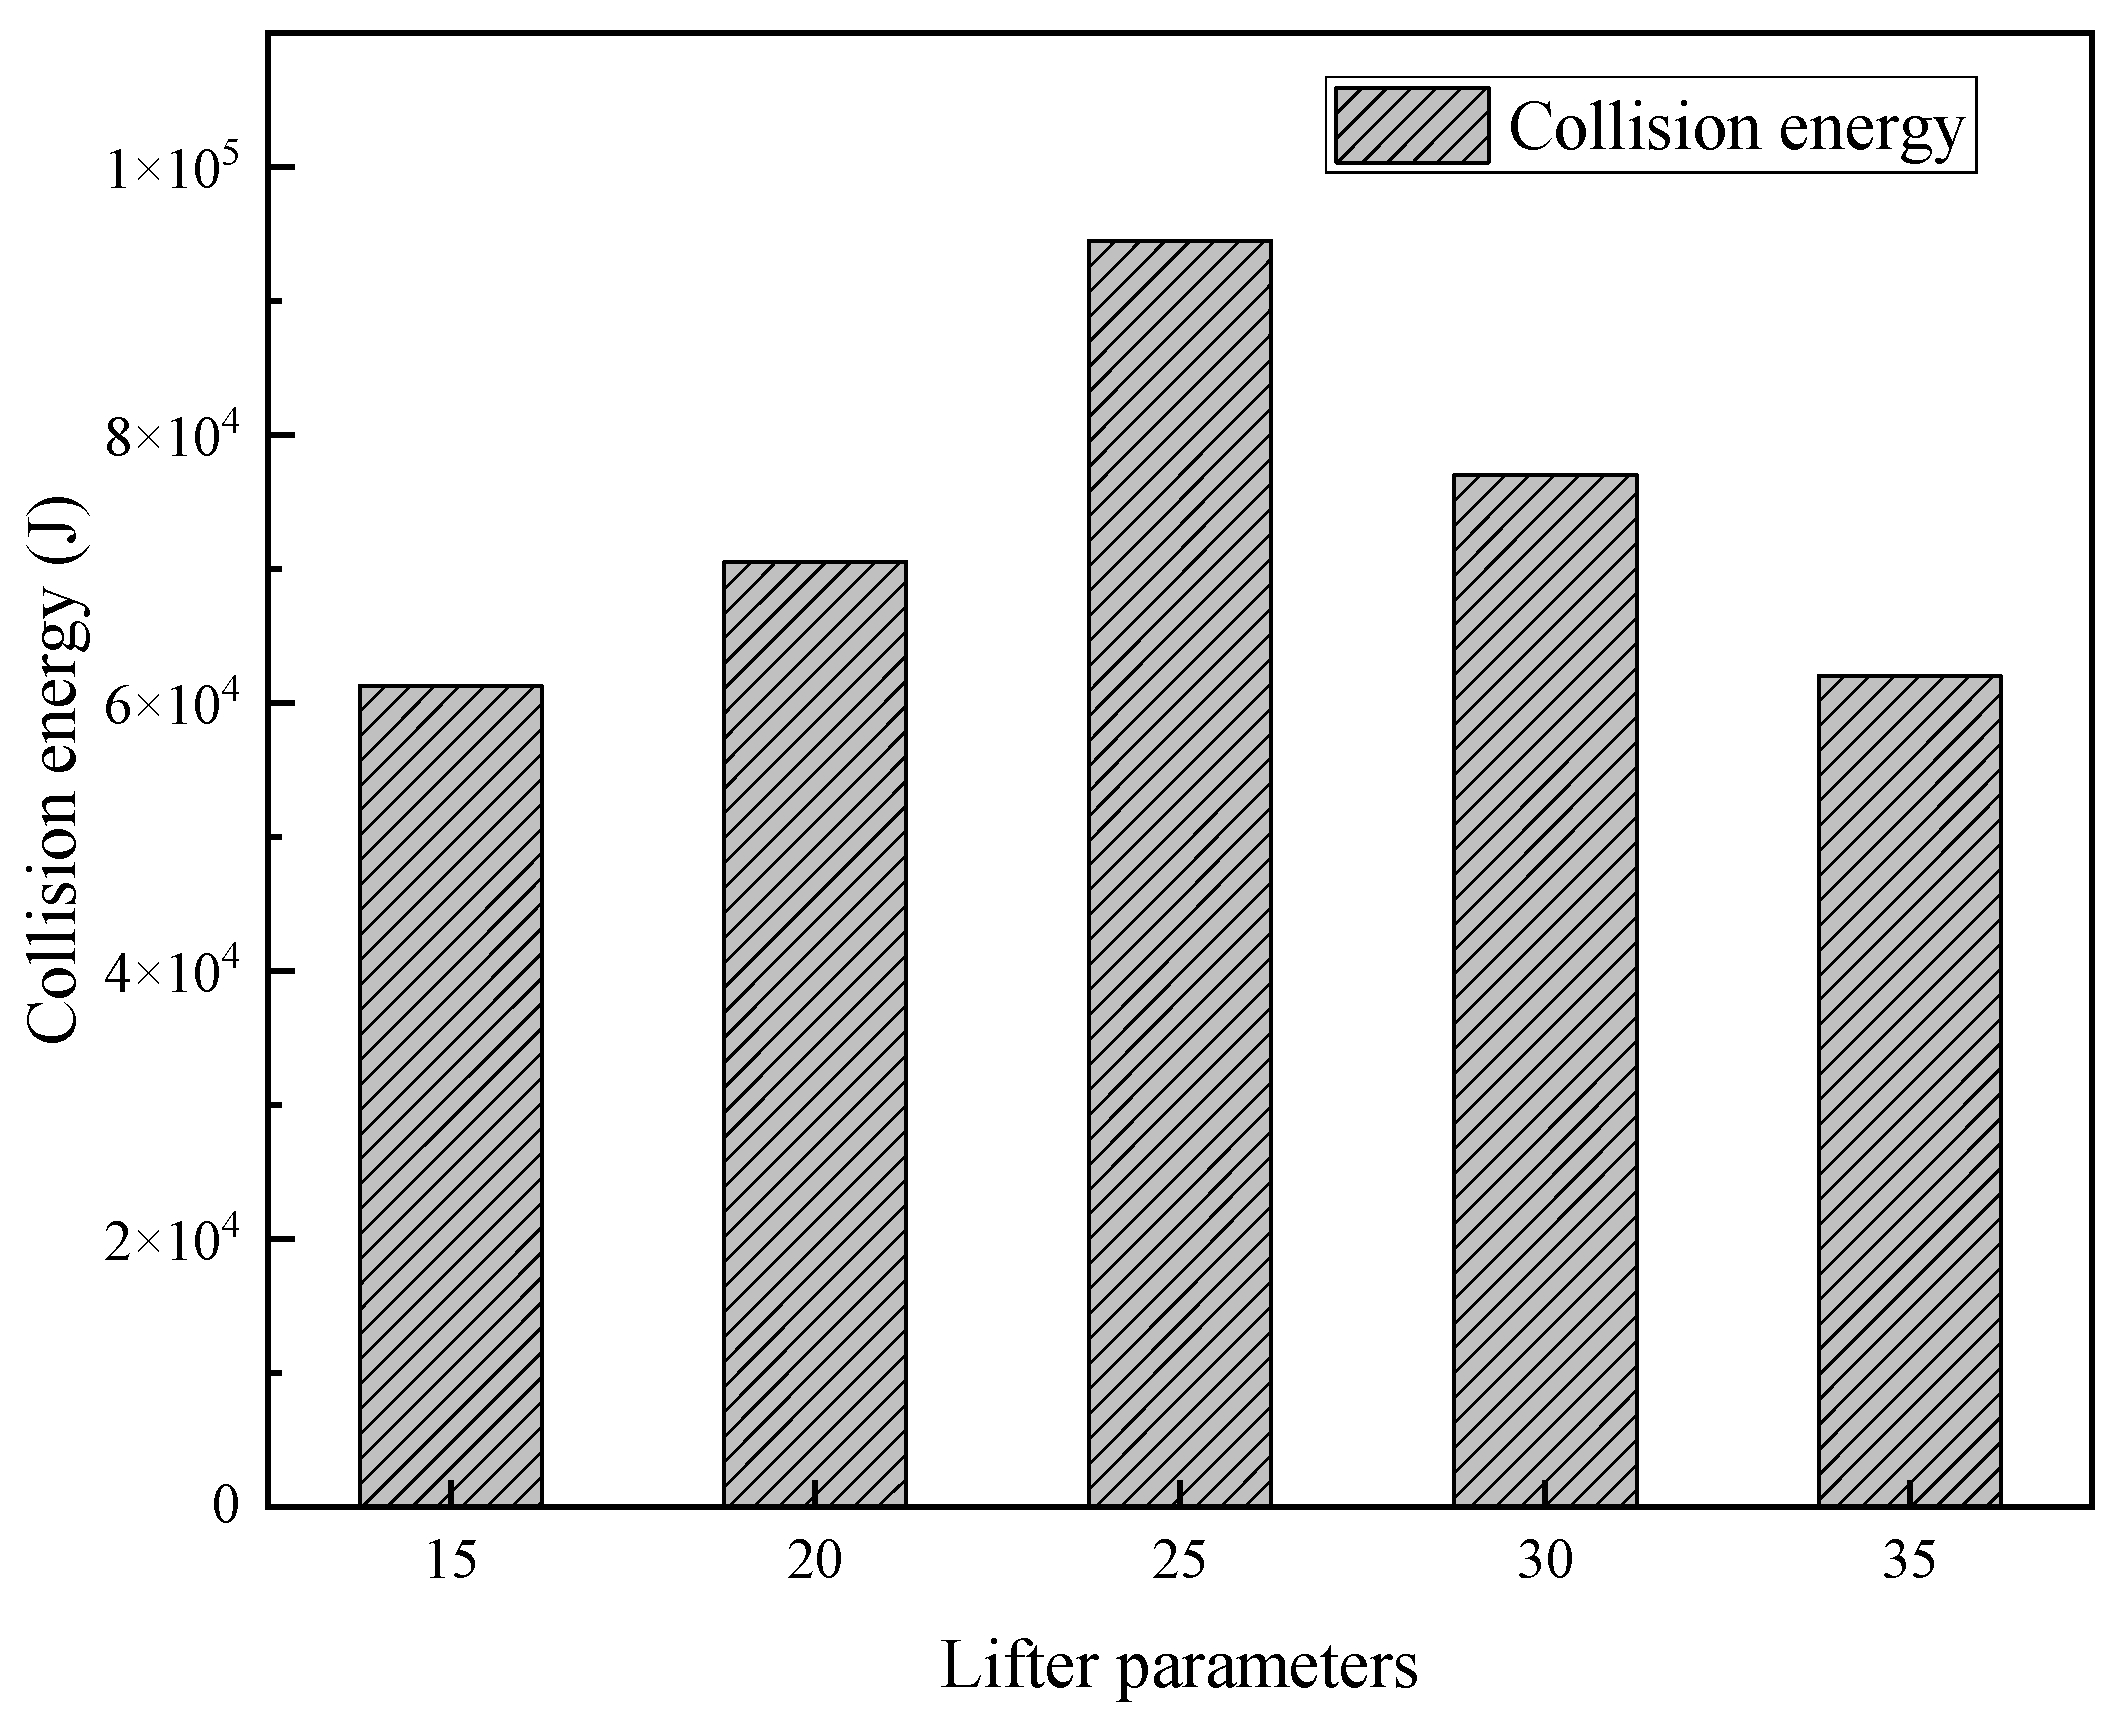
4.1.1. Effect of Lifter Angle on Particle
With the lifter bar height fixed at 230 mm and 36 lifter bars installed, we investigated the effects of lifter bars angles (15°, 20°, 25°, 30°, and 35°) on particle behavior within the mill.
Effect of Lifter Angle on Particle Movement and Trajectory
Figure 4 shows the motion states of particles inside the mill under different lifter bar angle parameters.

Figure 4.
Motion of particles in SAG mill at different lifter angles. ((a): 15°, (b): 20°, (c): 25°, (d): 30°, and (e): 35°).
The motion patterns and trajectories of particles reflect the falling zones, falling heights, and falling velocities of the media and materials inside the mill, intuitively demonstrating the material activity levels of the grinding media and materials.
As shown in Figure 4, with the gradual increase in the lifter bar angle, the load motion trajectory gradually shifts toward the center of the mill, and the material throwing trajectory transitions from scattered to dense. When the lifter bar angle is ≤25°, the smaller the lifter bar angle of the lifter bar, the higher the height to which the media is lifted by the liner, the greater the horizontal displacement distance, and the higher the probability and area of contact with the liner. When the lifter bars angle is ≥30°, the larger the lifter bars angle, the lower the height to which the media is lifted, the smaller the horizontal displacement distance, and the lower the kinetic energy, which is insufficient impact energy for effective ore breakage inside the SAG mill. A moderate lifter bar angle not only helps the media crush the ore but also reduces liner wear. A lifter bar angle of approximately 25° meets this requirement.
Effect of Lifter Angle on Particle Collision Energy
Lifter bar angle on collision energy: The collision types in the SAG mill include impacts between steel balls, steel balls and liners, steel balls and ore, ore and liners, and ore–ore collisions. The cumulative collision energy between steel balls reflects the degree of inefficient operation; the cumulative collision energy between steel balls and liners indicates the extent of impact damage to the liners; the cumulative collision energy between steel balls and ore represents the role of steel balls in grinding. The cumulative collision energy between ore and liners shows the degree of frictional wear on the liners, and the cumulative collision energy among ore particles characterizes the strength of autogenous grinding within the SAG mill. Figure 5 shows the distribution of various cumulative collision energies inside the mill under different lifter bar angles.
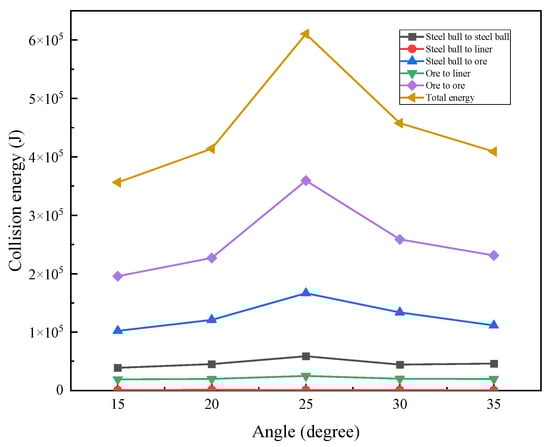
Figure 5.
Distribution of different types of collision energy in the SAG mill at varying lifter angles.
As shown in Figure 5, as the angle of the lifter bars increases from 15° to 35°, the total collision energy dissipation between the steel ball and the ore or ore particles shows a trend of first increasing and then decreasing, reaching its maximum value at 25°. The overall collision energy between the steel ball and the liners shows a decreasing trend, indicating that increasing the angle of the lifter bars appropriately can reduce the impact of the steel ball on the lifters. Overall, when the lifting angle of the semi-autogenous mill is 25°, the total energy dissipation of the collision between the steel ball and the ore or ore particles is the highest.
Effect of Lifters Angle on Stubborn Stones
In the SAG mill, some hard ores have elliptical smooth surfaces, and their shape and hardness make them highly resistant to shear and grinding, making it difficult to be crushed by impact, resulting in a lower crushing rate. This type of ore is called “hard rock” and usually exists in the particle size range of −80 + 35 mm. The main purpose of adding steel balls to the semi-autogenous mill is to crush these stubborn stones and alleviate their accumulation problem. The collision energy distribution between a 150 mm steel ball and an 80–35 mm hard rock is shown in Figure 6.
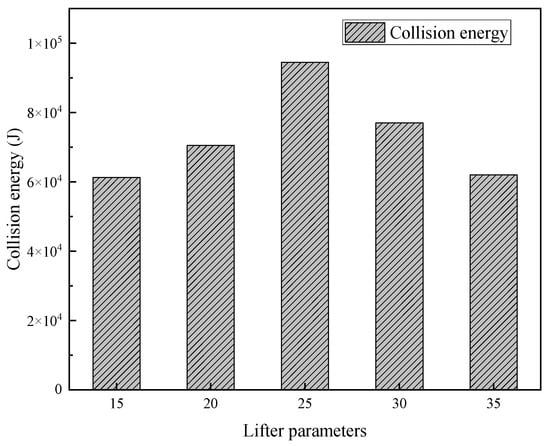
Figure 6.
Collision energy distribution between 150 mm steel balls and 80–35 mm stubborn stones at different lifter angles.
As shown in Figure 6, as the angle of the lifter bar increases from 15° to 35°, the collision energy between the steel ball and the 80–35 mm hard rock first increases, reaches its maximum value at 25°, and then decreases.
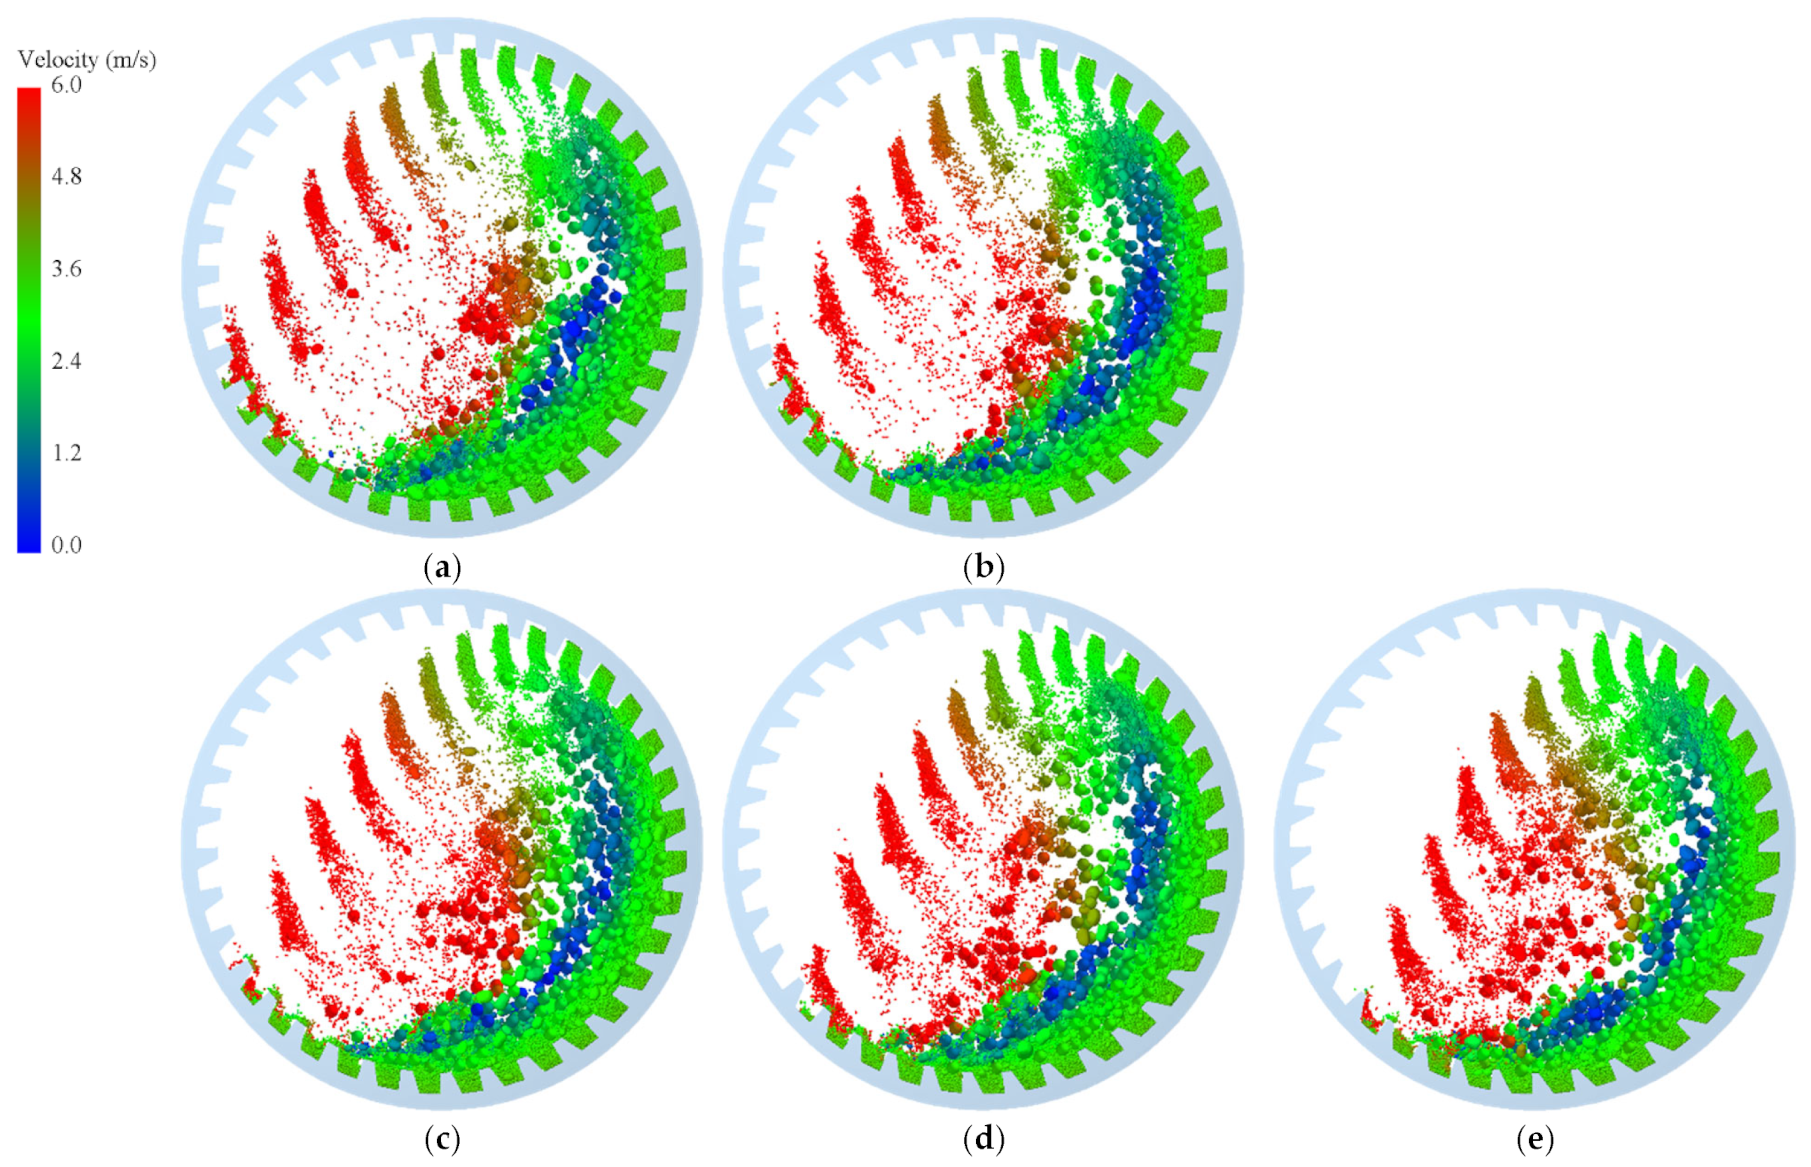
4.1.2. Effect of Lifter Height on Particle
We studied the effect of increasing the height of the strip on the particle motion pattern. The angle of the lifter bars was fixed at 25°, and the number of lifter bars groups was set to 36. The particle movement inside the mill was analyzed when the lifter bar heights were 190 mm, 210 mm, 230 mm, 250 mm, and 270 mm, respectively.
Effect of Lifter Height on Particle Movement and Trajectory
Figure 7 shows the particle motion state inside the mill under different lifter bars heights.
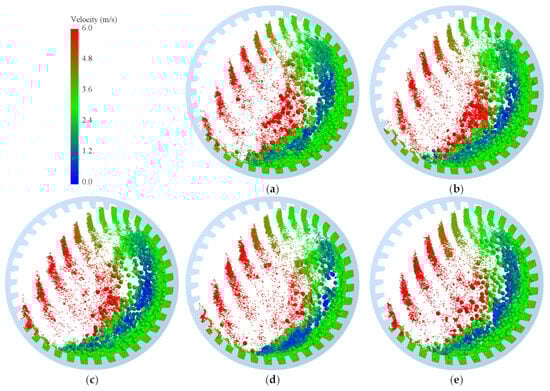
Figure 7.
Motion of particles in the SAG mill at different lifter heights ((a): 190 mm, (b): 210 mm, (c): 230 mm, (d): 250 mm, and (e): 270 mm).
From Figure 7, it can be seen that as the height of the lifting heights gradually increases, the phenomenon of material dropping becomes more pronounced. When the height of the lifter bars increases from 190 mm to 210 mm, the horizontal displacement of the steel ball dropping back point continues to lengthen, and the location of the steel ball dropping action is mostly in the material layer of the mill, indicating that the steel ball is increasingly in an active motion state with the increase of the lifter bars height, which is more conducive to the steel ball falling and acting on the bottom material, impacting and grinding the material. But when the height of the lifting bars reaches 230 mm and continues to increase, the horizontal displacement increases significantly, the trajectory of the steel ball dropping becomes more dispersed, and frequent impacts of the steel ball on the liners occur. Therefore, the appropriate height for lifting bars is around 210 mm.
Effect of Lifter Height on Particle Collision Energy
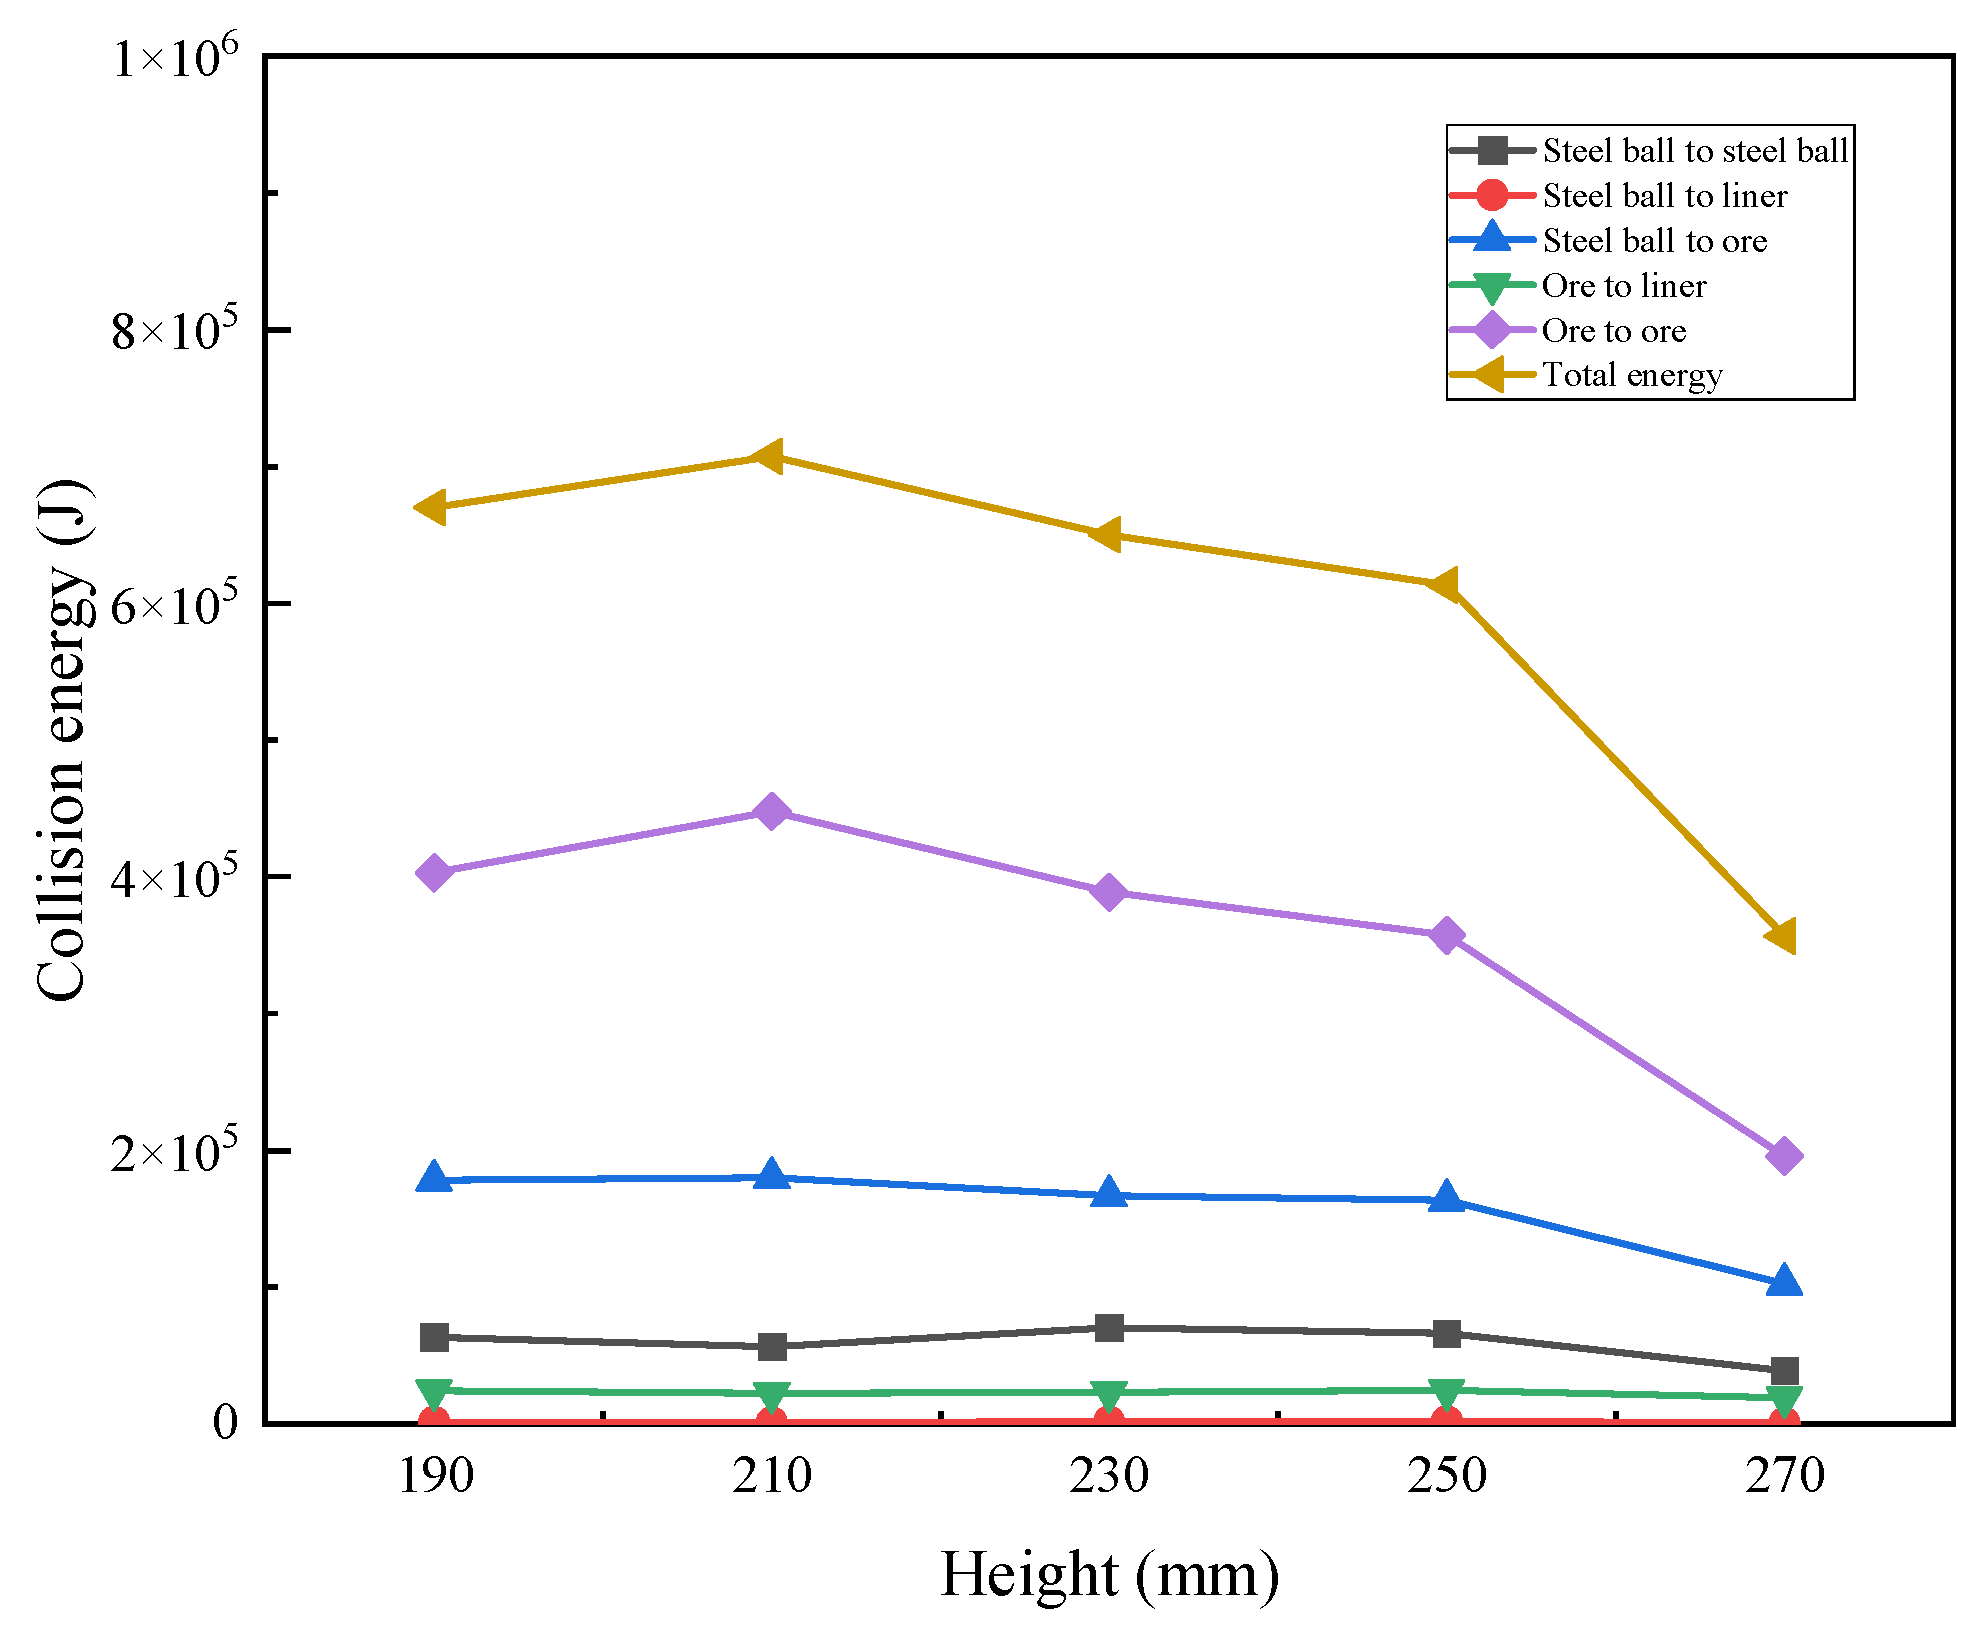
Figure 8 shows the distribution of accumulated collision energy within the mill at different heights of the lifter bars.
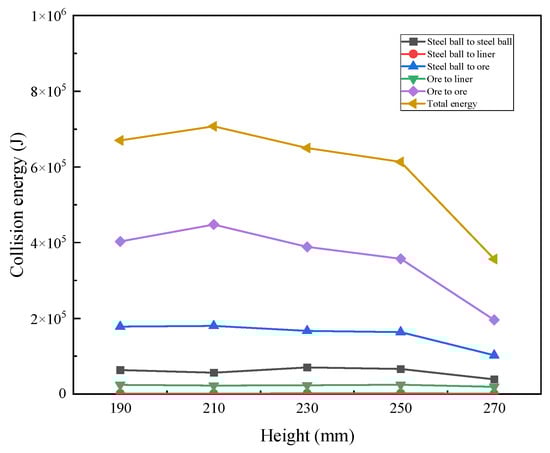
Figure 8.
Distribution of different types of collision energy in the SAG mill with varying lifter heights.
As shown in Figure 8, as the height of the lifter bar increases from 190 mm to 270 mm, the total collision energy and the collision energy between the steel ball and the ore, as well as between the ore and the ore, show a trend of first increasing and then decreasing, reaching a maximum value of 627,606.06 J at 210 mm. The collision energy between the steel ball and the liners shows an overall upward trend, indicating that the impact of the steel ball on the liners is gradually significant. Overall, when the height of the lifter bar of the SAG mill is 210 mm, the total collision energy and the collision energy between the steel ball and the ore, as well as between ores, are the highest.
Effect of Lifter Height on Stubborn Stones
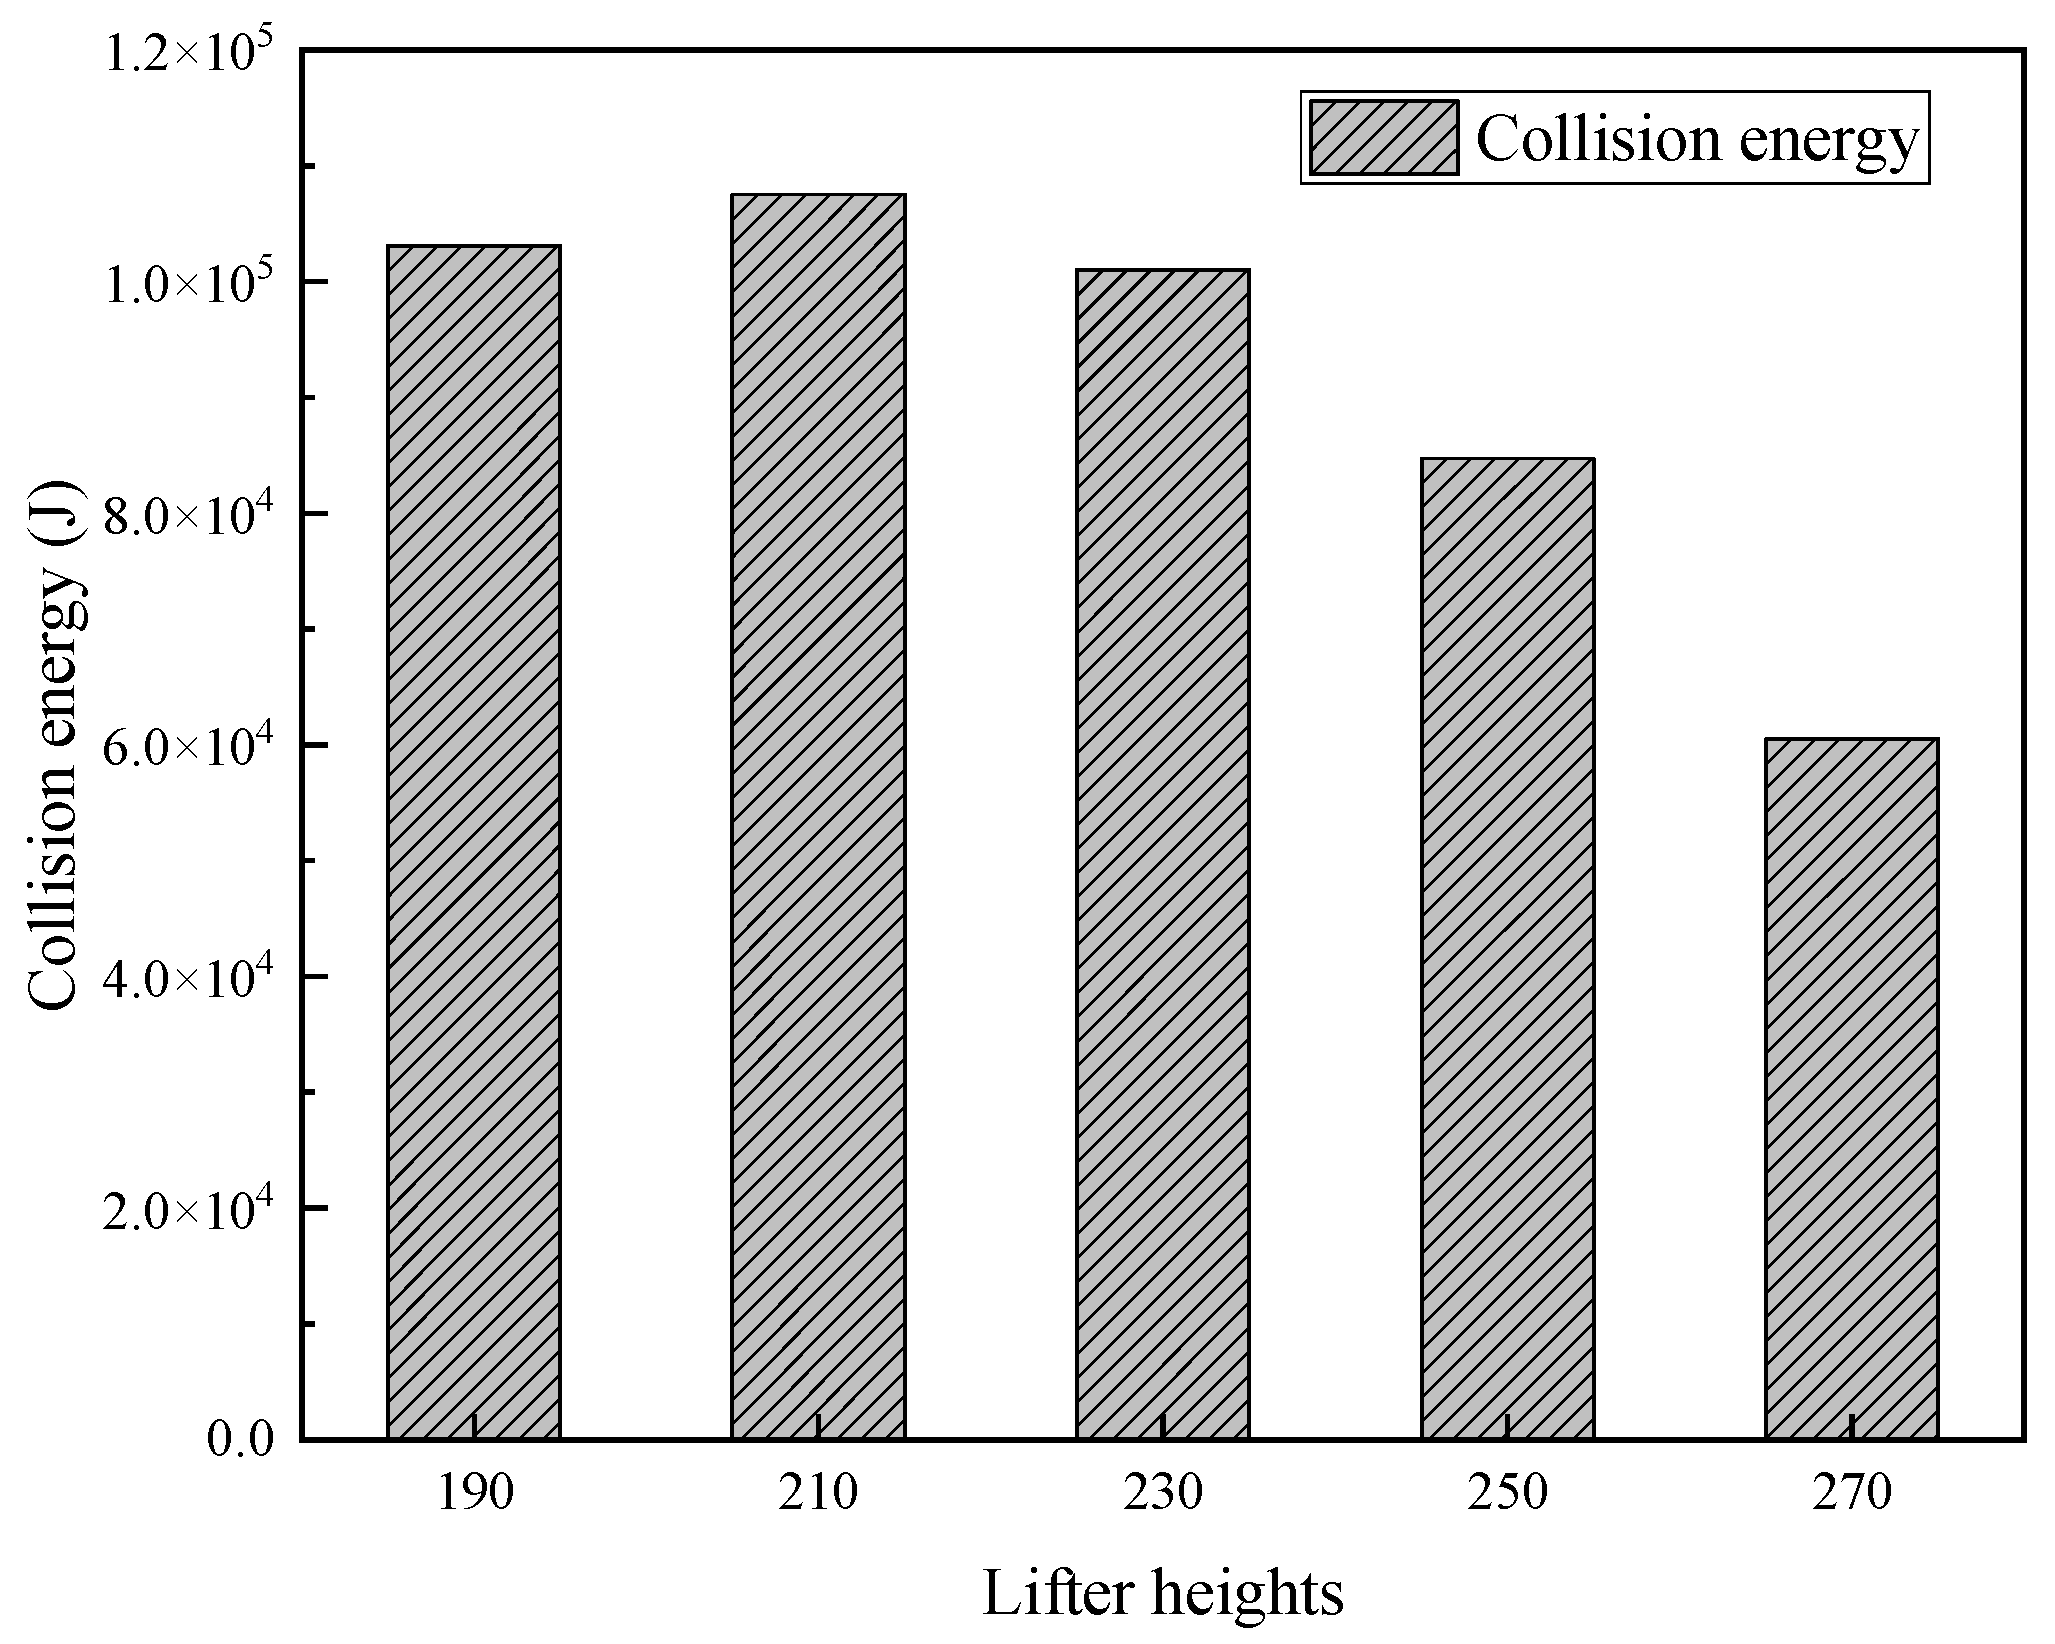
The collision energy distribution between a 150 mm steel ball and a hard rock of 80–35 mm is shown in Figure 9.
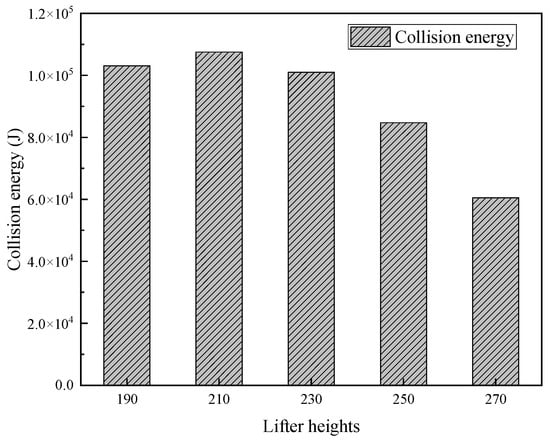
Figure 9.
Distribution of collision energy between 150 mm steel balls and 80–35 mm ore at different lifter heights.
As shown in Figure 9, as the height of the lifter bars increases from 190 mm to 270 mm, the collision energy between the steel ball and the 80–35 mm rock generally shows an upward and then downward trend, with the maximum value occurring when the height of the lifter bars is 210 mm.
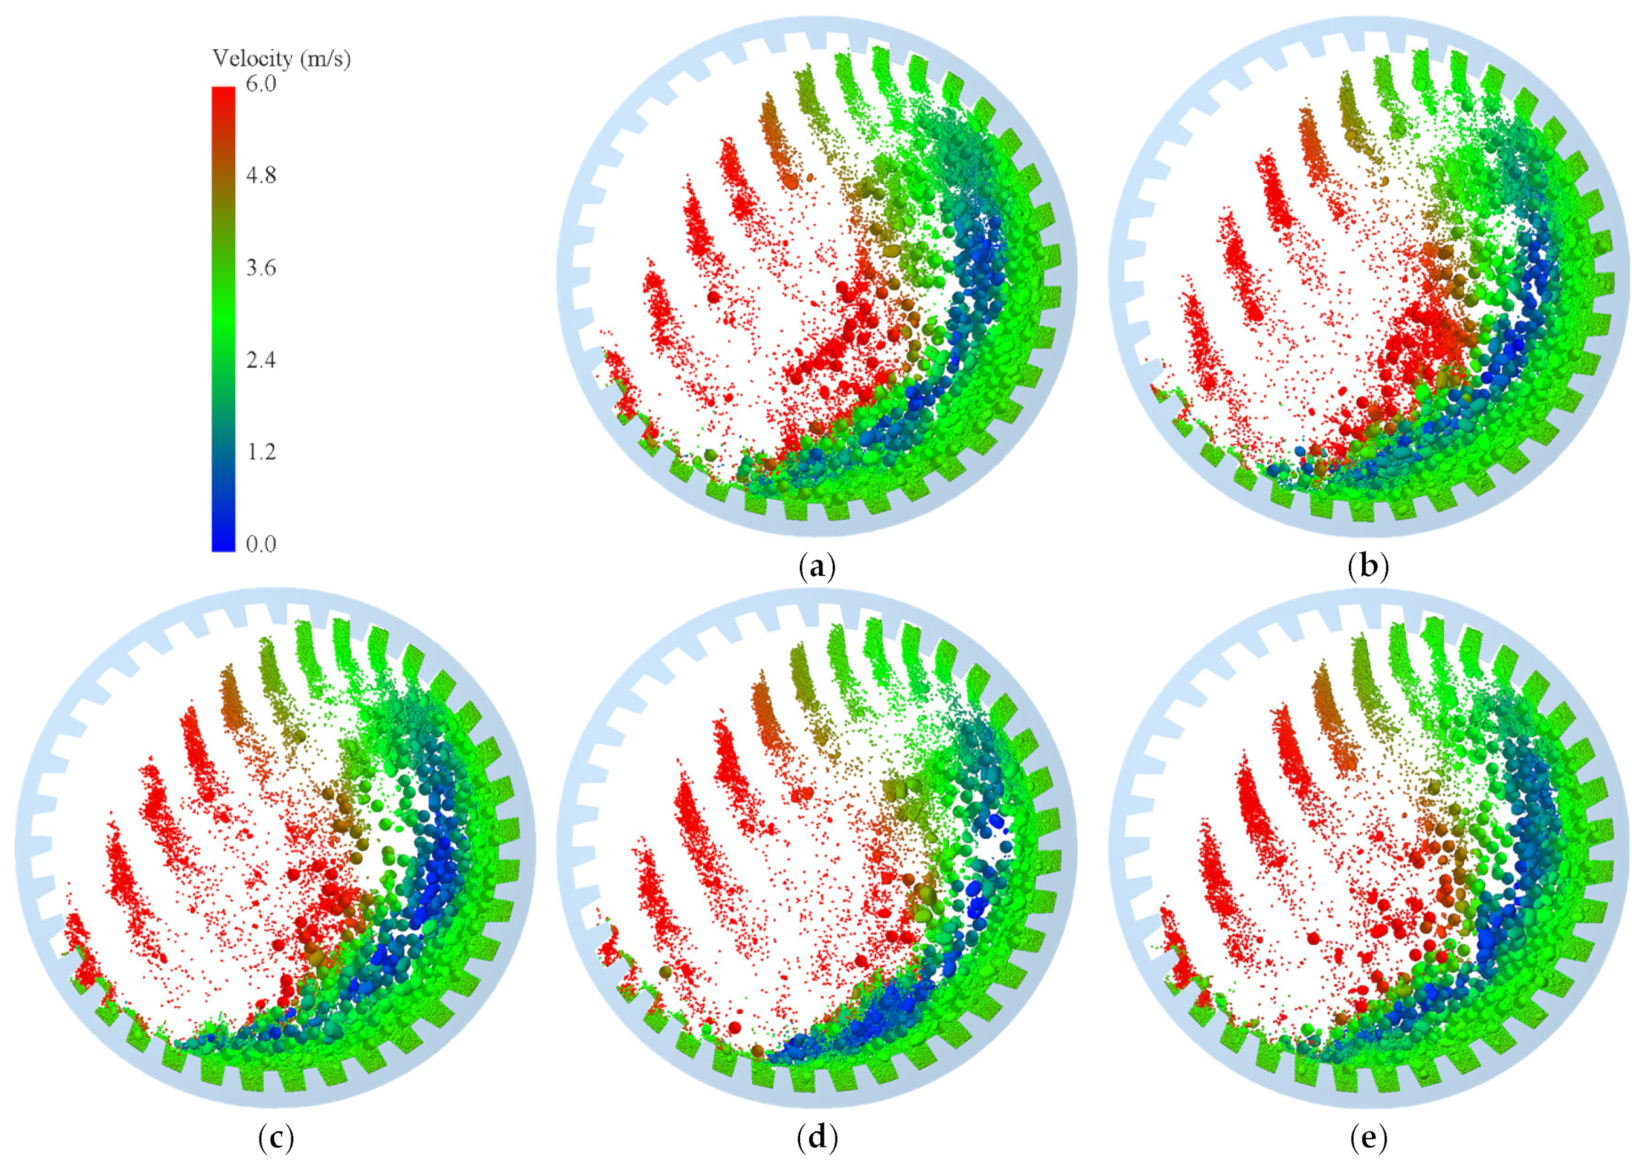
4.1.3. Effect of Lifters Group on the Particle
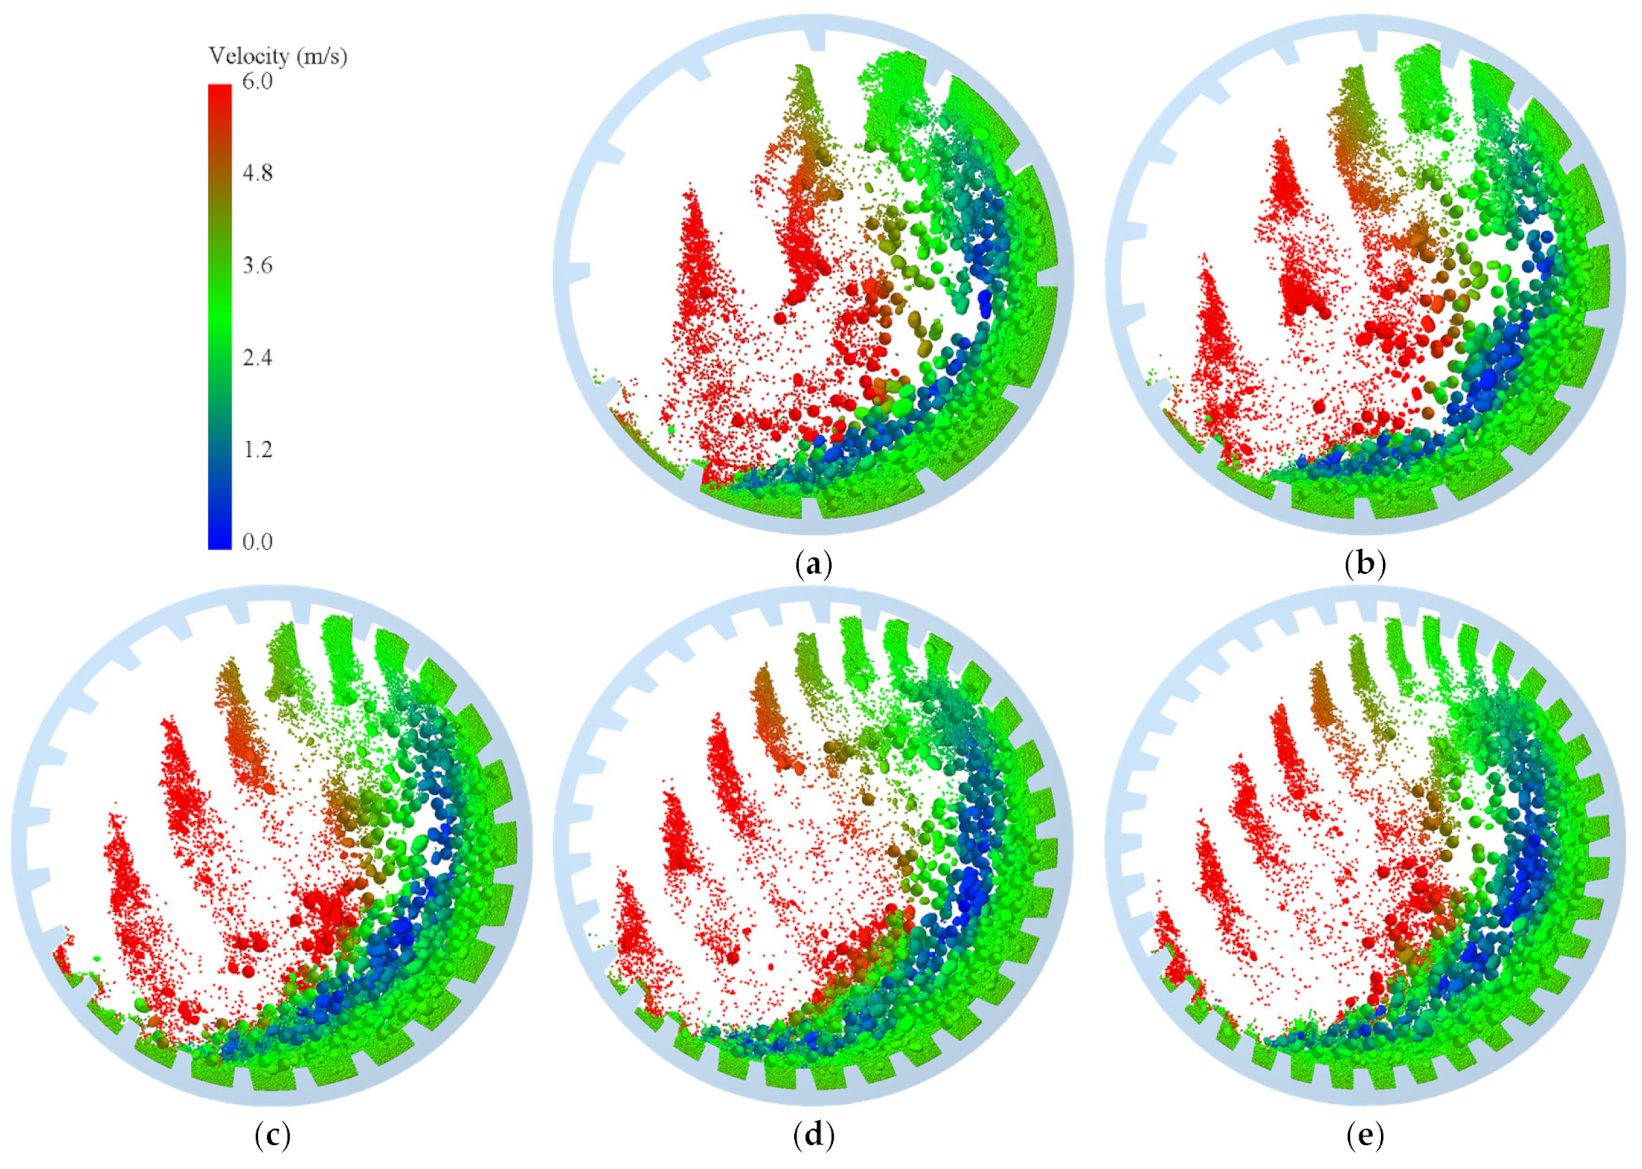
We analyzed the impact of increasing the number of strip groups on particle motion patterns. The angle of the lifting strip was set to 25°, and the height of the lifting bars was set to 230 mm. The motion state of the grinding particles was examined when the number of lifting bars groups was 12, 18, 24, 30, and 36, respectively.
Effect of Lifters Group on Particle Movement and Trajectory
Figure 10 shows the motion state of particles inside the mill under different configurations of the number of lifting bars.

Figure 10.
Motion of particles in the SAG mill with different lifter group configurations. ((a): 12, (b): 18, (c): 24, (d): 30, and (e): 36).
As shown in Figure 10, with the increase in the number of lifting strips, the single lifting amount of the cylinder liners decreases, the lifting frequency increases, but the total lifting amount decreases. In addition, with the increase in the number of liner groups in the cylinder, the horizontal displacement distance of the steel ball decreases, and the motion trajectory of the steel ball tends to transition from the throwing state to the falling state. This may be due to the steel ball being blocked by the lifting strip of the liners at the moment of throwing, which weakens the throwing speed. The more liner groups there are, the more obvious the blocking phenomenon, which in turn affects the efficient crushing of stubborn stones in the mill by the steel ball. Therefore, the fewer the number of improvement groups, the better.
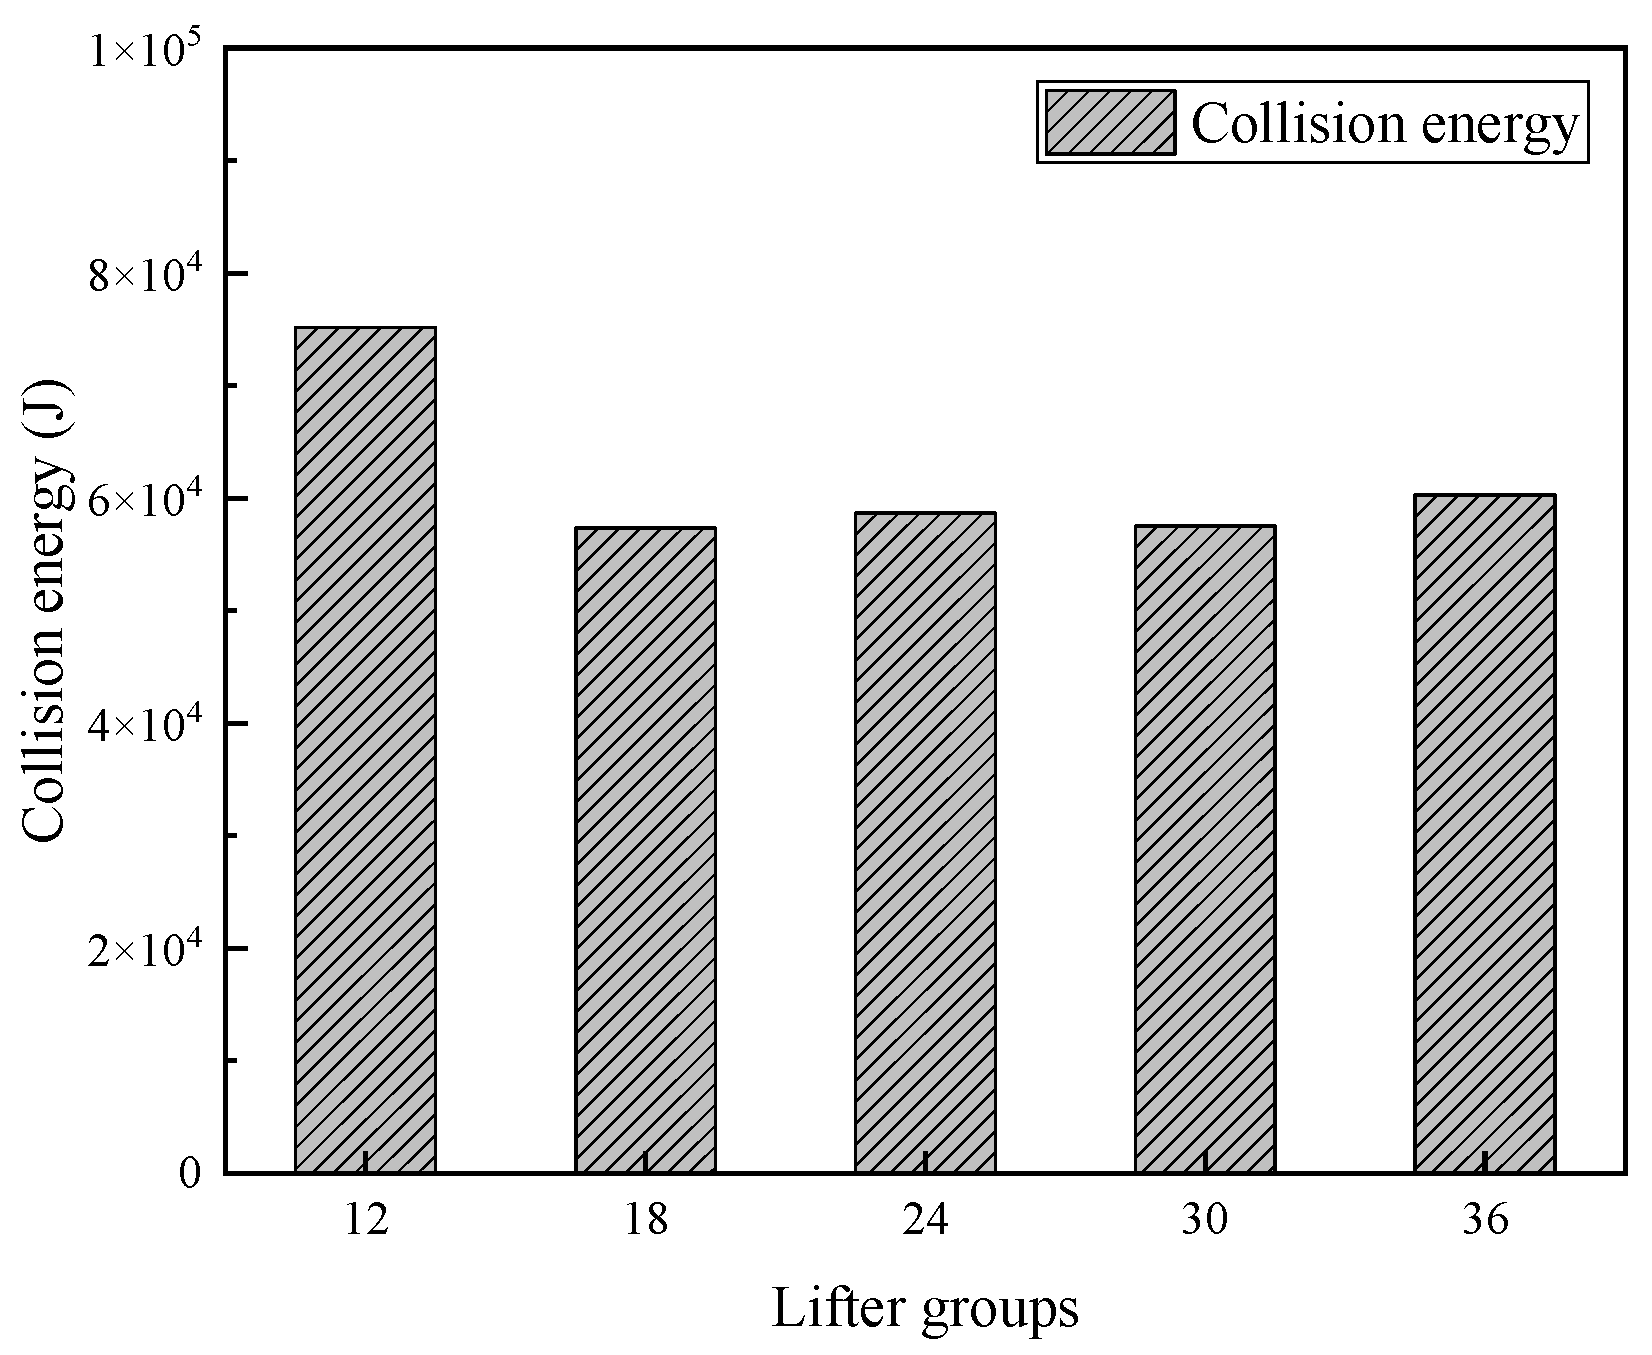
Effect of the Number of Lifter Groups on the Particle Collision Energy
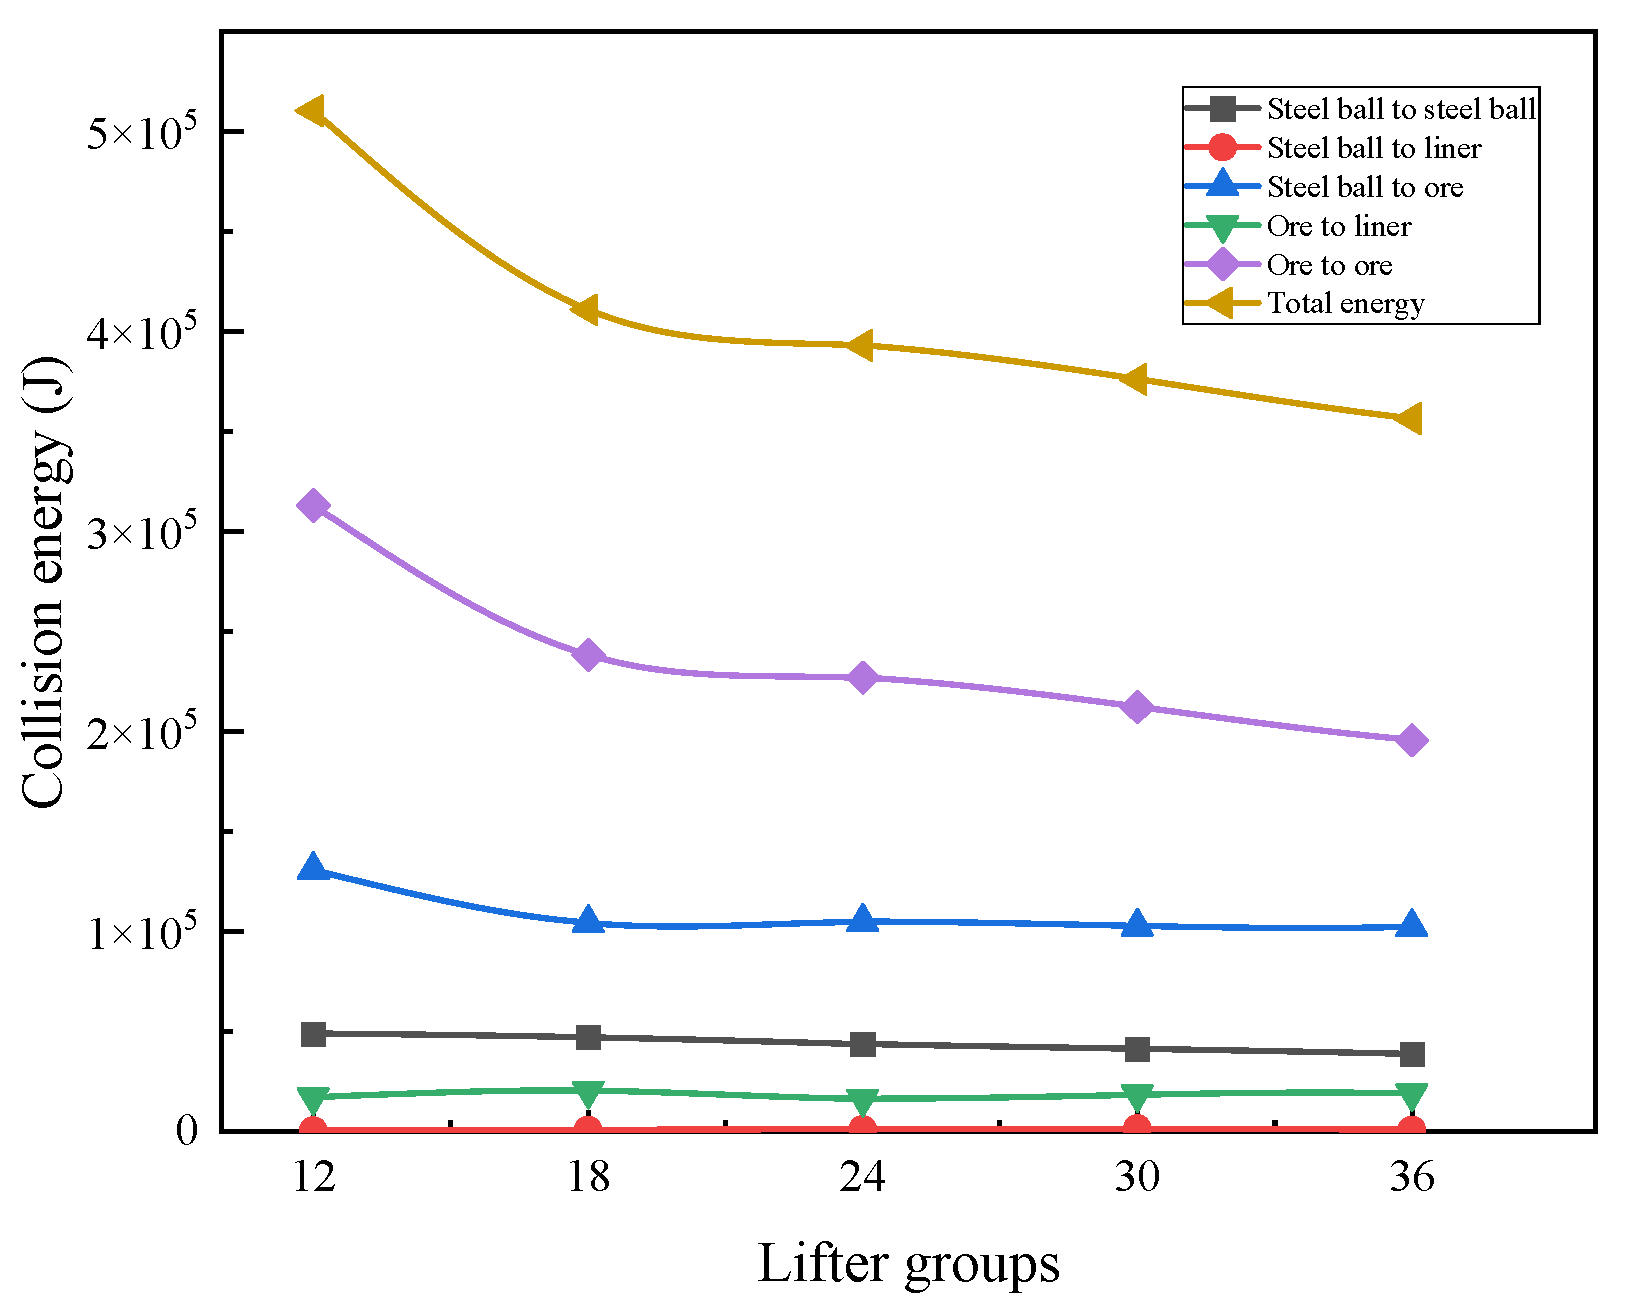
Figure 11 shows the distribution of accumulated collision energy within the mill under different numbers of lifting strips.
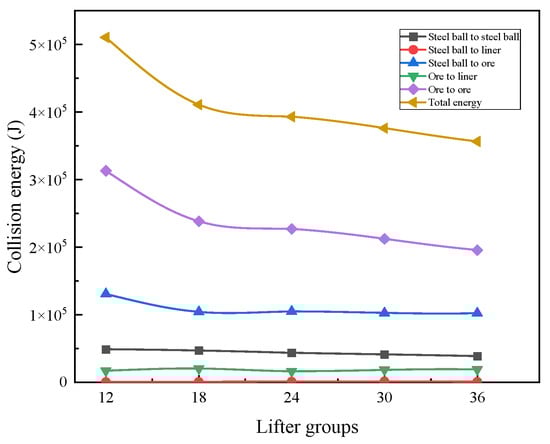
Figure 11.
Distribution of different types of collision energy in SAG mills with varying lifter group configurations.
As shown in Figure 11, with the increase in the number of strip groups, the total collision energy and the collision energy between the steel ball and the ore or ore particles gradually decrease overall. The collision energy between the steel ball and the liners first increases and then decreases, reaching its maximum value when the number of lifting strips is 30, indicating that the collision behavior between the steel ball and the liners is more significant at this time. Overall, when the number of lifting bars is 12, the cumulative collision energy between the steel ball and the liners is the lowest, while the collision energy and total collision energy between the steel ball and the ore or ore particles are the highest.
Effect of Lifters Group on Stubborn Stones
The collision energy distribution between a 150 mm steel ball and an 80–35 mm hard rock is shown in Figure 12.
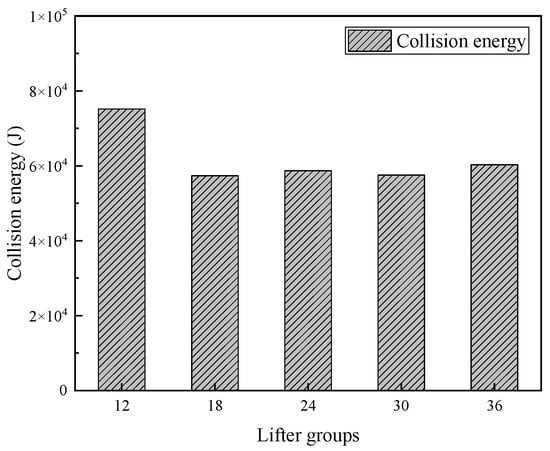
Figure 12.
Collision energy distribution between 140 mm steel balls and 80–35 mm ore for different lifters groups.
As shown in Figure 12, as the number of lifting bars groups increases from 12 to 36, the collision energy between the steel ball and the 80–35 mm hard rock gradually decreases, reaching its maximum value when the number of lifting bars is 12.
4.2. Optimization of SAG Mill Liners Using Orthogonal Tests
4.2.1. Effect of Various Lifter Parameters on Particle Movement and Trajectory
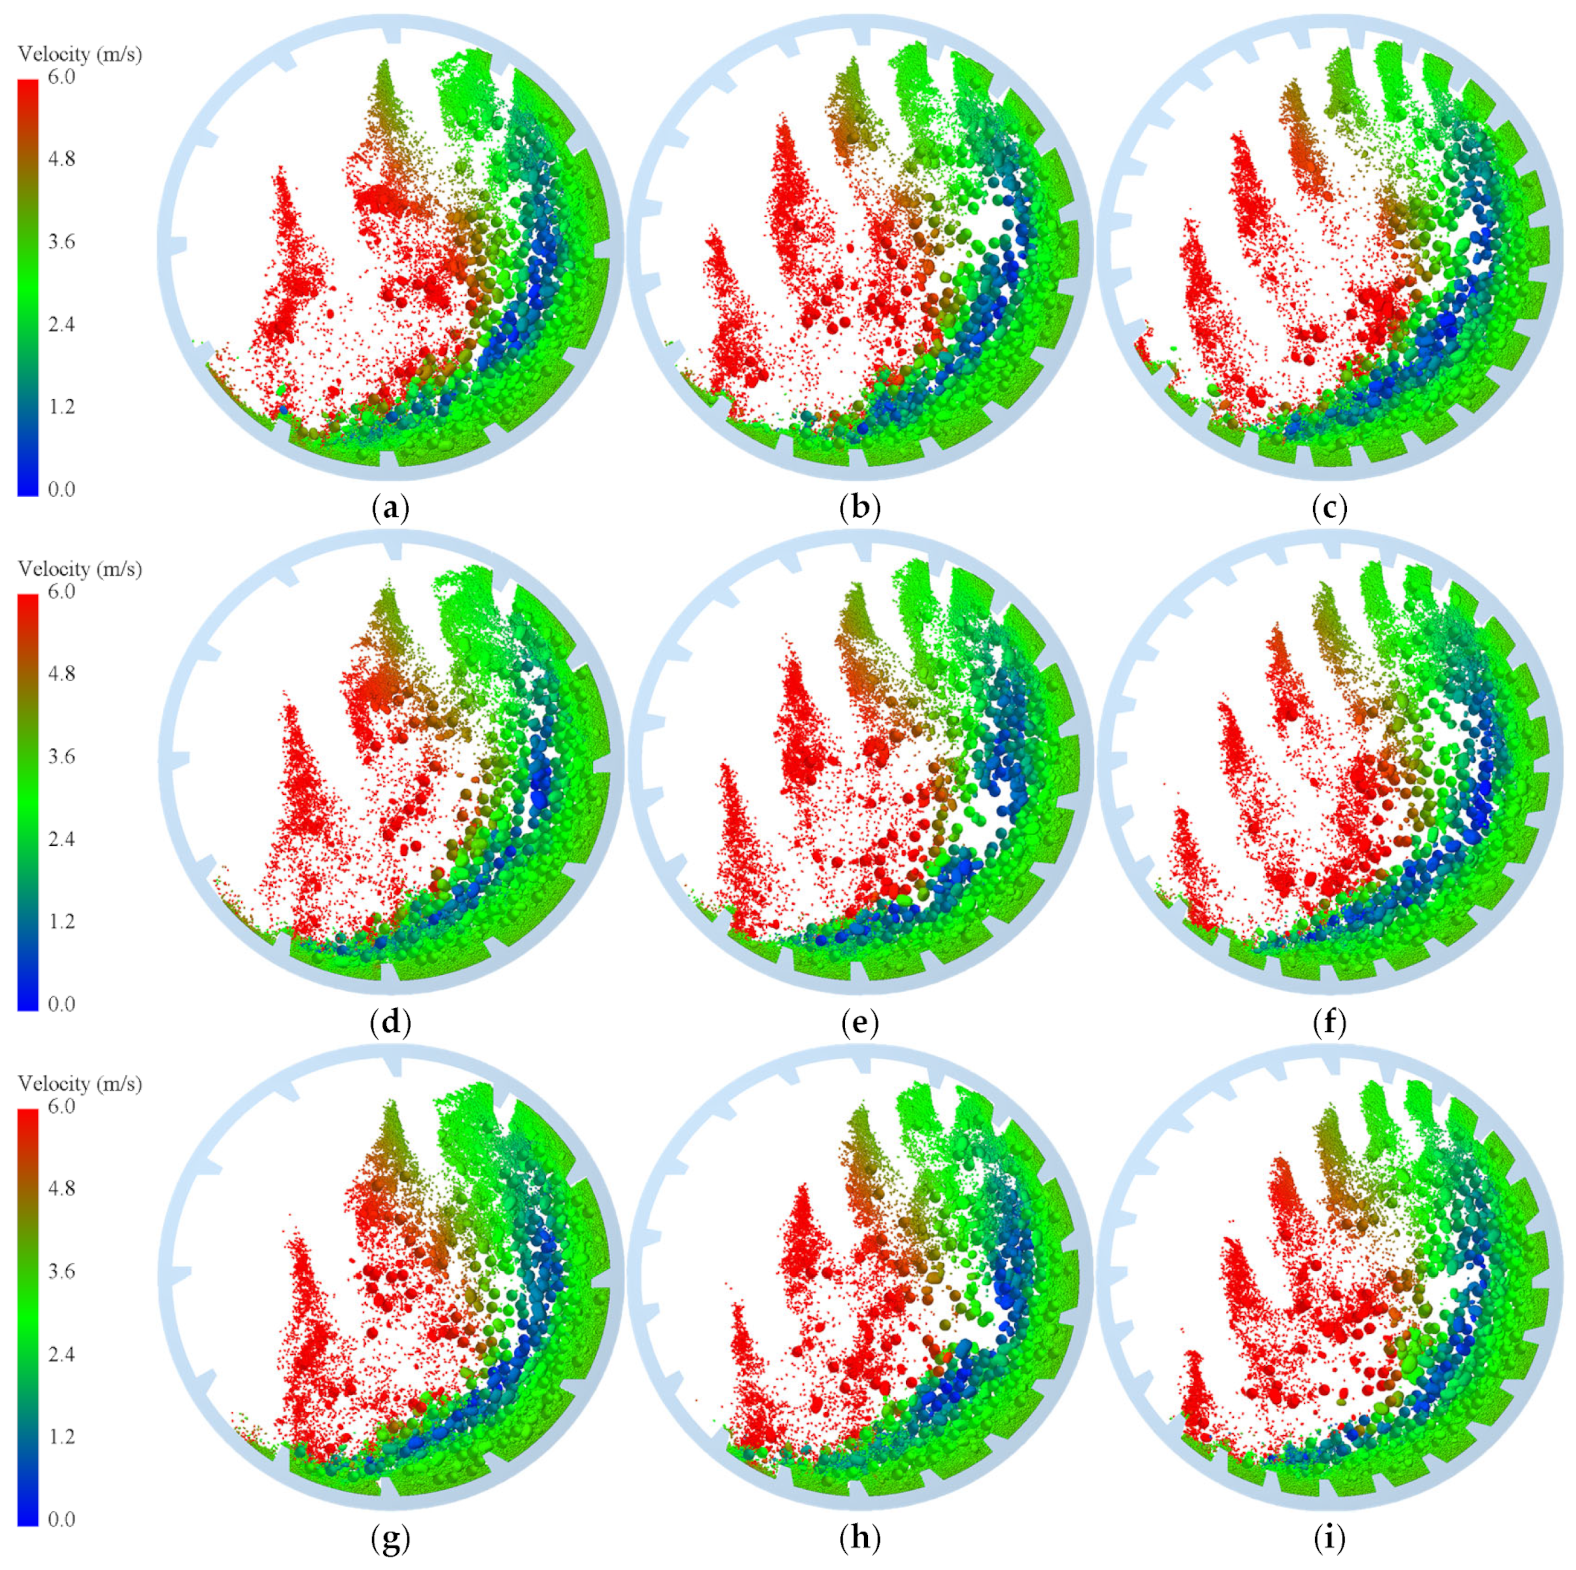
Figure 13 presents the motion state of particles inside the mill under different cases.
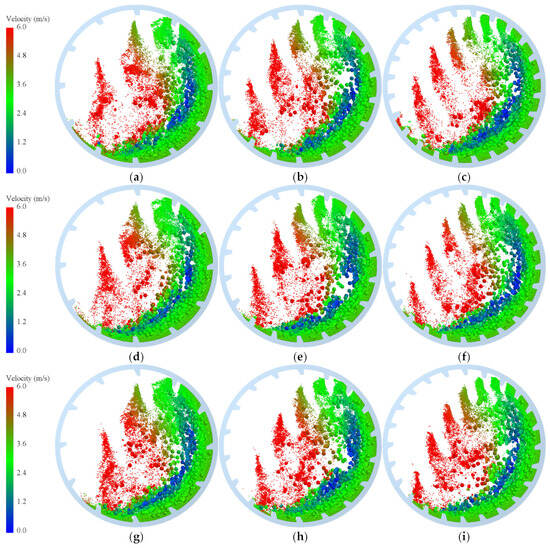
Figure 13.
Motion of particles in SAG mill at different cases. (a) 20-12-190; (b) 20-18-210; (c) 20-24-230; (d) 25-12-210; (e) 25-18-230; (f) 25-24-190; (g) 30-12-230; (h) 30-18-190; and (i) 30-24-210.
It can be seen from Figure 13 that the single volume of materials lifted gradually decreases obviously from group numbers of 12 to 24. In addition, the heights of materials lifted and horizontal displacements casted by liner gradually lower and reduce, respectively, with the angles of lifter bars increasing. Nevertheless, the effect of the height of lifter bars on grinding cannot be judged through this figure.
4.2.2. Effect of Various Lifter Parameters on Particle Collision Energy
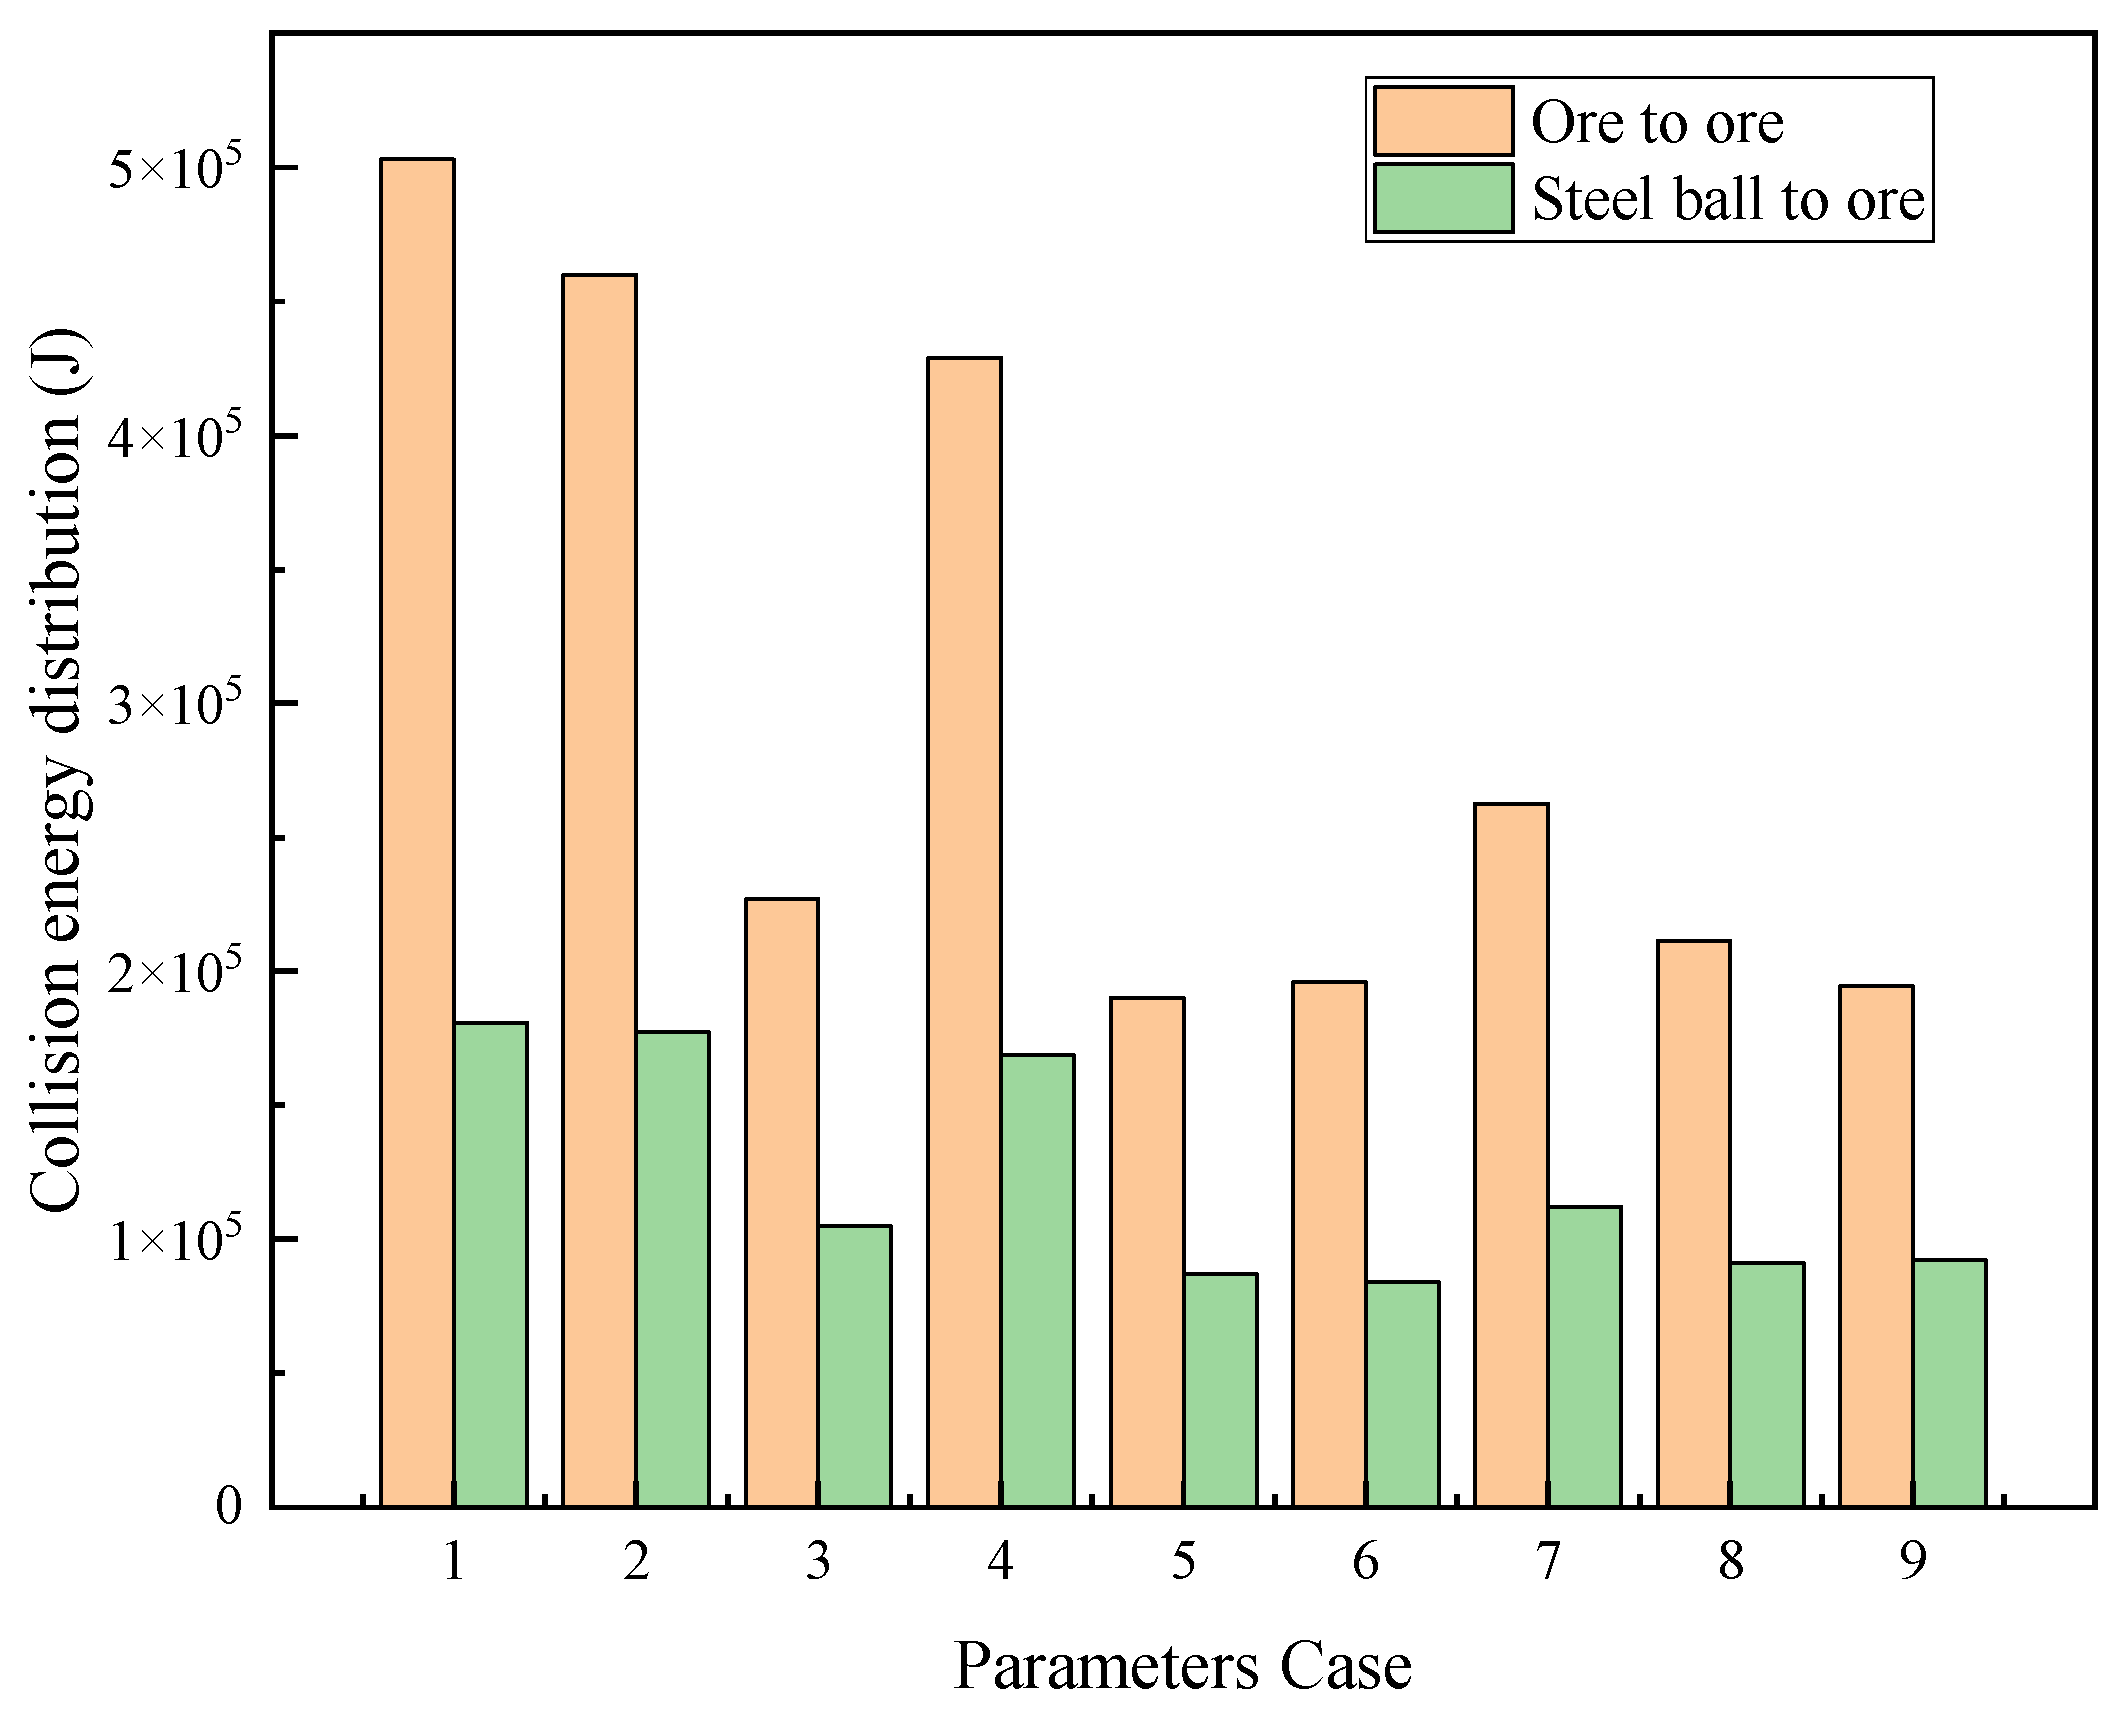
Figure 14 shows the distribution of cumulative collision energy between steel balls and ore and ore in the grinding process under different lifter bar parameters.

Figure 14.
Orthogonal experiment results: particle collision energy distribution in the SAG mill.
From the interaction between ores and between steel balls and ores, the influence of all of these factors is significant; meanwhile, the order of influence of each factor is as follows: number of lifting bars groups > lifting bars angle > lifting bars height. The factor that has the greatest impact on collision energy is increasing the number of bars groups.
According to the evaluation criteria of Group 1 and Group 2, the optimal combination for the lifting bars of the SAG mill liner is A1B1C2: lifting strip angle of 20°, 12 groups, and height of 210 mm (Table 7). Under this combination, the maximum collision energy between the largest steel ball to ore and ore to ore is 700,334 J, which is an increase of 379,466 J compared to the original SAG mill liner lifting strip (320,868 J).
Table 7.
The comprehensive score and the best combination of each factor.
5. Conclusions
We conducted a study on the grinding efficiency of an SAG mill using discrete element method (DEM) simulation. We systematically analyzed the effects of the angle, height, and number of lifter bars on the grinding efficiency, with a focus on tracking the instantaneous changes in particle motion trajectories and the distribution of collision energy between particles.
The single factor simulation results of the lifter bars angle show that when the height of the lifter bars angle (230 mm) and the number of groups (36 groups) are fixed, and the lifter bars angle is 25°, the total energy dissipation of the collision between the steel ball and the ore or ore particles is the highest, 526,069.53 J.
The single factor simulation results of the lifter bars height show that when the fixed lifter bars angle is 25°, the number of lifter bar groups is set to 36, and the lifter bars angle height is 210 mm, the total energy dissipation of the collision between the steel ball and the ore or ore particles is the highest at 627,606.06 J (this data is for 190 mm).
The single factor simulation results of the number of lifter bars groups show that when the angle (25°) and height (210 mm) of the lifter bars are fixed, and the number of lifter bar groups is 12, the total energy dissipation of collisions between steel balls and ore or ore particles is the highest at 443,915.37 J.
Orthogonal analysis of simulation results shows that increasing the number of strip groups has the most significant impact on grinding efficiency, followed by increasing the strip angle and height. The optimal parameters for determining the liners of the SAG mill are the following: lifter bars angle of 20°, number of groups of 12, and height of 210 mm. Under this combination, the total energy dissipation of the collision between the steel ball and the ore or ore particles is the highest at 700,334 J. Compared with the original SAG mill liner lifting strip, the collision energy has increased by 379,466 J.
This study reveals the mechanism by which the structural parameters of the liner lifting bars affect the grinding efficiency of an SAG mill, providing important guidance for optimizing the design and operation of the liner lifting bars in SAG mills.
Author Contributions
Y.W.: Data curation, Formal analysis, Software, and Writing—original draft and review; Q.X.: Conceptualization, Methodology, Resources, and Writing—Reviewing and editing; S.J.: Conceptualization and Methodology; M.W.: Experiment research and Writing—review; R.L.: Data curation, Investigation, Methodology, Visualization, and Writing—review and editing; G.W.: Methodology and Visualization. All authors have read and agreed to the published version of the manuscript.
Funding
This research was funded by the National Natural Science Foundation of China grant number 52374269 (Q.X.), the Key Industry Science and Technology Projects for University Services in Yunnan Province of China grant number FWCY-ZNT2024005 (Q.X.), and the Open Fund for the National Key Laboratory of Intelligent and Optimized Manufacturing of Mining and Metallurgical Processes grant number BGRIMM-KZSKL-2023-02 (S.J.).
Data Availability Statement
The raw data supporting the conclusions of this article will be made available by the authors upon request.
Acknowledgments
Thanks to all the members of the Yunnan Provincial University selective grinding quality improvement and consumption reduction scientific and technological innovation team and the relevant leader and colleges of second processing plant of Heqing Beiya Mining Co., LTD.
Conflicts of Interest
Author Yong Wang was employed by Yunnan Gold Mining Group Co., Ltd. The remaining authors declare that the research was conducted in the absence of any commercial or financial relationships that could be construed as a potential conflict of interest.
References
- Royston, D. Semi-autogenous grinding (SAG) mill liner design and development. Min. Metall. Explor. 2007, 24, 121–132. [Google Scholar] [CrossRef]
- Maleki-Moghaddam, M.; Yahyaei, M.; Banisi, S. Converting AG to SAG mills: The Gol-E-Gohar iron ore company case. Powder Technol. 2012, 217, 100–106. [Google Scholar] [CrossRef]
- Asghari, M.; VandGhorbany, O.; Nakhaei, F. Relationship among operational parameters, ore characteristics, and product shape properties in an industrial SAG mill. Part. Sci. Technol. 2020, 38, 482–493. [Google Scholar] [CrossRef]
- Faria, P.M.; Rajamani, R.K.; Tavares, L.M. Optimization of solids concentration in iron ore ball milling through modeling and simulation. Minerals 2019, 9, 366. [Google Scholar] [CrossRef]
- Gao, P.; Zhou, W.; Han, Y.; Li, Y.; Ren, W. Enhancing the capacity of large-scale ball mill through process and equipment optimization: An industrial test verification. Adv. Powder Technol. 2020, 31, 2079–2091. [Google Scholar] [CrossRef]
- Sayadi, A.R.; Khalesi, M.R.; Borji, M.K. A parametric cost model for mineral grinding mills. Miner. Eng. 2014, 55, 96–102. [Google Scholar] [CrossRef]
- Dunne, R.; Morrell, S.; Lane, G.; Valery, W.; Hart, S. Design of the 40 foot diameter SAG mill installed at the Cadia Gold Copper Mine. In Proceedings of the International Conference on Autogenous and semi-Autogenous Grinding Technology(SAG 2001), Vancouver, BC, Canada, 30 September–3 October 2001. [Google Scholar]
- Cleary, P.W.; Owen, P. Effect of operating condition changes on the collisional environment in a SAG mill. Miner. Eng. 2019, 132, 297–315. [Google Scholar] [CrossRef]
- Žurovec, D.; Hlosta, J.; Nečas, J.; Zegzulka, J. Monitoring bulk material pressure on bottom of storage using DEM. Open Eng. 2019, 9, 623–630. [Google Scholar] [CrossRef]
- Horabik, J.; Wiącek, J.; Parafiniuk, P.; Bańda, M.; Kobyłka, R.; Stasiak, M.; Molenda, M. Calibration of discrete-element-method model parameters of bulk wheat for storage. Biosyst. Eng. 2020, 200, 298–314. [Google Scholar] [CrossRef]
- Orefice, L.; Khinast, J. DEM study of granular transport in partially filled horizontal screw conveyors. Powder Technol. 2017, 305, 347–356. [Google Scholar] [CrossRef]
- Chen, Q.; Xiong, T.; Zhang, X. Study of the hydraulic transport of non-spherical particles in a pipeline based on the CFD-DEM. Eng. Appl. Comput. Fluid Mech. 2020, 14, 53–69. [Google Scholar] [CrossRef]
- Börner, M.; Bück, A.; Tsotsas, E. DEM-CFD investigation of particle residence time distribution in top-spray fluidised bed granulation. Chem. Eng. Sci. 2017, 161, 187–197. [Google Scholar] [CrossRef]
- Behjani, M.A.; Rahmanian, N.; Hassanpour, A. An investigation on process of seeded granulation in a continuous drum granulator using DEM. Adv. Powder Technol. 2017, 28, 2456–2464. [Google Scholar] [CrossRef]
- Zheng, C.; Zhang, L.; Govender, N.; Wu, C.-Y. DEM analysis of residence time distribution during twin screw granulation. Powder Technol. 2021, 377, 924–938. [Google Scholar] [CrossRef]
- Li, J.; Webb, C.; Pandiella, S.S.; Campbell, G.M. Discrete particle motion on sieves—A numerical study using the DEM simulation. Powder Technol. 2003, 133, 190–202. [Google Scholar] [CrossRef]
- Markauskas, D.; Kruggel-Emden, H.; Scherer, V. Numerical analysis of wet plastic particle separation using a coupled DEM-SPH method. Powder Technol. 2018, 325, 218–227. [Google Scholar] [CrossRef]
- Yu, C.; Lin, D.; Xu, N.; Wang, X.; Pu, K.; Wang, Z.; Zhao, G.; Geng, R.; Gong, S. DEM simulation of particle flow and separation in a vibrating flip-flow screen. Particuology 2023, 73, 113–127. [Google Scholar] [CrossRef]
- Ma, H.; Zhao, Y. Investigating the fluidization of disk-like particles in a fluidized bed using CFD-DEM simulation. Adv. Powder Technol. 2018, 29, 2380–2393. [Google Scholar] [CrossRef]
- Farivar, F.; Zhang, H.; Tian, Z.F.; Gupte, A. CFD-DEM simulation of fluidization of multisphere-modelled cylindrical particles. Powder Technol. 2020, 360, 1017–1027. [Google Scholar] [CrossRef]
- Nakamura, H.; Watano, S. Numerical modeling of particle fluidization behavior in a rotating fluidized bed. Powder Technol. 2007, 171, 106–117. [Google Scholar] [CrossRef]
- Delaney, G.; Cleary, P.; Morrison, R.; Cummins, S.; Loveday, B. Predicting breakage and the evolution of rock size and shape distributions in Ag and SAG mills using DEM. Miner. Eng. 2013, 50, 132–139. [Google Scholar] [CrossRef]
- Cleary, P.W. Effect of rock shape representation in DEM on flow and energy utilisation in a pilot SAG mill. Comput. Part. Mech. 2019, 6, 461–477. [Google Scholar] [CrossRef]
- Xie, C.; Ma, H.; Song, T.; Zhao, Y. DEM investigation of SAG mill with spherical grinding media and non-spherical ore based on polyhedron-sphere contact model. Powder Technol. 2021, 386, 154–165. [Google Scholar] [CrossRef]
- Govender, N.; Rajamani, R.; Wilke, D.N.; Wu, C.Y.; Khinast, J.; Glasser, B.J. Effect of particle shape in grinding mills using a GPU-based DEM code. Miner. Eng. 2018, 129, 71–84. [Google Scholar] [CrossRef]
- Hertz, H. Ueber die Berührung fester elastischer Körper. J. Für Die Reine Und Angew. Math. 1882, 1882, 156–171. [Google Scholar] [CrossRef]
- Mindlin, R.D.; Deresiewicz, H. Elastic spheres in contact under varying oblique forces. J. Appl. Mech. 1953, 20, 327–344. [Google Scholar] [CrossRef]
- Mindlin, R.D. Compliance of elastic bodies in contact. J. Appl. Mech. 1949, 16, 259–268. [Google Scholar] [CrossRef]
- Tsuji, Y.; Tanaka, T.; Ishida, T. Lagrangian numerical simulation of plug flow of cohesionless particles in a horizontal pipe. Powder Technol. 1992; 71, pp. 239–250. [Google Scholar] [CrossRef]
- Cundall, P.A.; Strack, O.D. A discrete numerical model for granular assemblies. Geotechnique 1979, 29, 47–65. [Google Scholar] [CrossRef]
- Sakaguchi, H.; Ozaki, E.; Igarashi, T. Plugging of the flow of granular materials during the discharge from a silo. Int. J. Mod. Phys. B 1993, 7, 1949–1963. [Google Scholar] [CrossRef]
- Wu, Y.; Xiao, Q.; Gao, Z. Hard Rock Accumulation Decrease and Grinding Effect Improvement in Semi Autogenous Grinding by Multi-Stage Ball Distribution. Chin. J. Rare Met. 2022, 46, 673–680. (In Chinese) [Google Scholar]

Disclaimer/Publisher’s Note: The statements, opinions and data contained in all publications are solely those of the individual author(s) and contributor(s) and not of MDPI and/or the editor(s). MDPI and/or the editor(s) disclaim responsibility for any injury to people or property resulting from any ideas, methods, instructions or products referred to in the content. |
© 2025 by the authors. Licensee MDPI, Basel, Switzerland. This article is an open access article distributed under the terms and conditions of the Creative Commons Attribution (CC BY) license (https://creativecommons.org/licenses/by/4.0/).