Article

Thermoxidation Stability of Gear Oils for Electric Vehicles

by
Agnieszka Skibińska
1,
Ewa Barglik
1,
Wojciech Krasodomski
1,
Magdalena Żółty
1 and
Krzysztof Biernat
2,*
1
Oil and Gas Institute—National Research Institute, Lubicz 25A, 31-503 Kraków, Poland
2
Łukasiewicz Research Network—Automotive Industry Institute, Jagiellońska 55, 03-301 Warszawa, Poland
*
Author to whom correspondence should be addressed.
Lubricants 2025, 13(8), 337; https://doi.org/10.3390/lubricants13080337 (registering DOI)
Submission received: 30 June 2025 / Revised: 21 July 2025 / Accepted: 29 July 2025 / Published: 31 July 2025
(This article belongs to the Special Issue Tribology of Electric Vehicles)

Abstract

This article presents studies on the degradation susceptibility of two commercially available gear oils used in electric passenger vehicle transmissions. A series of aging tests were conducted using selected research methods. Due to the lack of a recommended methodology for testing the thermal oxidation stability of such oils, standardized methods were applied: ASTM D5704, ASTM D8206, ASTM D2272, PN-EN 16091, and PN-C-04080. To determine the degree of degradation, changes in physicochemical parameters (kinematic viscosity at 40 °C and 100 °C and acid number) and changes in the chemical character of oil components, based on FTIR spectra, were evaluated. Significant changes in properties were found in the tested oils, which were confirmed by spectral analysis. It was found that all the mentioned methods for assessing thermal oxidation stability are suitable for evaluating such oils, but they differ in the aggressiveness of the method towards the tested oil. These methods can be ranked according to their impact on the degradation of the tested oil.

1. Introduction

Thermal oxidation stability, i.e., the resistance of oil to oxidation at elevated temperatures, is the ability of oil to maintain its chemical structure. The stability of lubricating oils is influenced not only by the chemical composition of the base oils used for their production but also by the type of refining additives used, especially oxidation inhibitors.
The oxidation process of base (hydrocarbon) oils can be represented by free-radical chain reactions [1,2]. This mechanism is a three-stage process, consisting of the following:
(1)
Initiation—under the influence of temperature, light, and the presence of oxygen, hydrocarbon structures break down and alkyl free radicals are formed.
(2)
Propagation—in which chemical reactions of radicals with oxygen occur, leading to the formation of alkyl peroxides, which, when reacting with oxygen, form typical oxidation products, i.e., aldehydes, ketones, and carboxylic acids.
(3)
Termination—i.e., the formation of stable end products of the above-mentioned reactions, such as deposits and sludges, polymers, resins, etc. [3].
Oxygen-containing components (e.g., ester oils) and refining additives (dispersants, anti-wear additives, etc.) oxidize in a similar manner.
In electric vehicle gears, lubricating oils are subjected to shear stresses resulting from constant load and gear wheel movement. Over time, long-chain structures in the oil can degrade during shearing, which also leads to the formation of radicals and the initiation of oxidation processes. Gear oils in electric vehicles operate under different conditions than gear oils in internal combustion engine vehicles [4,5]. Since single-stage gears are usually used in electric vehicles, the gear oil in these systems is subjected to different loads than in the multi-stage systems in internal combustion engine vehicles. In EV gears, there are no contaminants (such as nitrogen oxides, sulfur oxides, soot, or unburned fuel fractions) that are generated during the combustion of fuels in typical internal combustion engines, where they accelerate oil degradation. The oil is not enriched with fuel and condensation water, which limits the involvement of hydrolysis in oil degradation but does not eliminate the risk of oxidation. Furthermore, elevated operating temperatures of the lubrication system (often above 120 °C) are frequently observed, especially in integrated engine-gear systems [6]. The high rotational speed of an EV (reaching up to 20,000 revolutions per minute) can cause intense lubricating oil shearing due to high stresses and temperature increases in the contact zone [7]. Additionally, the presence of an electric field [8] and undesirable stray currents [9] can initiate a series of electrochemical reactions leading to local discharges, phenomena not occurring in internal combustion engines. All these factors can lead to intensive free radical formation in oils, resulting in the initiation of oil oxidation processes, their degradation, and even the deposition of carbon residues on gear components.
Standardized test methods for evaluating the thermal oxidation stability of oils can be divided into the following:
  • Methods are conducted until a defined value of a specific parameter is reached (e.g., an increase in acid number to 2 mg KOH/g, a decrease in oxygen pressure by 10%).
  • Oxidation methods are conducted for a specified time.
  • To assess the degree of oxidation (oil degradation), the following are used:
  • Changes in a specific lubricating oil property (before and after oxidation)—most often, changes in kinematic viscosity, acid number, and coking residue. The amount of insoluble precipitates in pentane and toluene formed during the test is assessed;
  • Determination of the induction period, which is defined as the time until the pressure drops by 10% from its maximum value, as this is considered the beginning of the oxidation reaction.
The goal of this study was to determine the effectiveness and suitability of the selected methods for evaluating thermal oxidation stability in terms of the potential differentiation of passenger car electric gear oils under elevated temperature conditions and, in the case of ASTM D5704, additionally, the load on the friction system.

2. Samples and Test Methods

Tests were conducted using two commercially available gear oils used in electric passenger vehicles.
Gear Oil A
Synthetic gear oil designed for gearboxes was exposed to high pressures and for heavily loaded transmissions. According to the manufacturer’s information, the use of this oil ensures ease of application even at low temperatures while guaranteeing viscosity stability over a wide range of operating temperatures. Its advanced formula provides optimal component protection, safeguarding gearboxes against wear and corrosion, and ensuring smooth gear changes.
Gear Oil B
This is synthetic oil for gears with dry electric motors that is dedicated for use in electric and hybrid vehicles. According to the manufacturer’s information, the use of this oil extends the lifespan of the drive system and increases the vehicle’s range on a single charge. This is a new generation oil that meets the requirements for increasing torque levels and maximum efficiency.
Test Methods
Five standardized methods were selected to test the thermal oxidation stability of lubricants differing in the way the experiment was conducted (test tube, rotating pressure vessel, glass dish, and model test bench). To compare the methods, it was assumed that the tests were conducted at a similar temperature (150–163 °C). The oxidation agent was air or oxygen. For the 3 methods, a copper catalyst was used. Contact between the oil sample and the surface of the catalyst took place in different ways (bubbling, flowing, and splashing). A description of these test methods is generally available, but, to highlight the differences, the selected methods are briefly characterized.
ASTM D5704 [10]
The test was conducted using a single-stage gear train with a 1:2 ratio. A cleaned copper plate (used as a catalyst) was placed in the gearbox, and a 120 mL sample of the tested oil was introduced through the vent hole. After stable test conditions were achieved, i.e., heating of the oil in the gearbox to the test temperature, the drive motor was started, and aeration was turned on. The test was conducted for a specified time. The degree of oil degradation was measured by the change in kinematic viscosity of the oil, the change in acid number, and the amount of pentane and toluene-insoluble deposits formed in the oil. This method allows for the assessment of thermo-oxidative stability during oil operation in friction associations where oxidation occurs, especially facilitated during lubrication when the oil is in the form of a thin layer, at an elevated temperature, with the simultaneous catalytic assistance of oxidation by the copper element.
ASTM D8206 [11]
A glass test vessel containing 4 g of oil was placed in a steel chamber at ambient temperature. The chamber was closed and purged with oxygen and then filled with oxygen to the test pressure. The test chamber was heated to the specified temperature, and, upon reaching it, time and pressure measurements began. The pressure in the vessel dropped as oxygen was consumed. The test was continued until a 10% pressure drop from its maximum value was reached, which is defined as the induction period at the test temperature.
PN-EN 16091 [12]
A sample was placed in a gold-plated steel chamber at an ambient temperature. The chamber was closed and purged with oxygen; then, it was filled with oxygen to the test pressure. The test vessel was heated to the test temperature, and, upon reaching it, time and pressure recording began. The pressure in the vessel dropped as oxygen was consumed. The test was continued until a 10% pressure drop from its maximum value was achieved, which is defined as the induction period at the test temperature.
ASTM D2272 [13]
A copper catalyst, in the form of a spirally wound wire, and a sample of the tested oil were placed in a glass vessel. This vessel was then placed in a stainless steel pressure vessel, to which an additional 5 mL of distilled water was introduced. The test vessel was filled with oxygen under pressure at room temperature. This prepared set was then placed in an oil bath, maintaining a constant test temperature. During the measurement, the pressure vessel was tilted at an angle of 30 degrees from horizontal and rotated at a speed of 100 revolutions per minute. The test ended when the pressure inside the vessel dropped by 175 kPa from the maximum pressure, which represents the oxidation resistance of the tested sample.
PN-C-04080 [14]
Tested oil (75 g), a tube through which air is passed, and a copper plate catalyst were placed in a glass test tube. This prepared set was placed in a heated block at the test temperature, and air flow was initiated. Tests were conducted for 24 h. The degree of oil degradation was assessed based on changes in kinematic viscosity at 40 °C and 100 °C, changes in viscosity index, and acid number.
Spectral evaluation by FTIR method [15]
Infrared (FTIR) spectra of the samples were recorded using a Thermo Nicolett IS5 apparatus (Thermo Electron, Waltham, MA, USA). Transmittance spectra were recorded in a ZnSe cuvette with a 0.1 mm spacer in the range of 4000 cm−1–550 cm−1, and resolution 4 cm−1. Obtained spectra were processed with Omnic TM software (OMNIC Paradigm 2.8).
The comparison of conditions for conducting thermal oxidation stability tests are in Table 1.

3. Discussion of Results

For oil samples A and B, kinematic viscosity was determined at 40 and 100 °C [16], and the acid number [17] was determined. The obtained oxidation resistance test results are summarized in Table 2.
Since the results for the ASTM D8206, ASTM D8206, and ASTM D2272 methods are timed, to compare changes in oil parameters with the parameters obtained by the ASTM D5704 and PN-C-04080 methods, the acid number was determined for them. Kinematic viscosity at 40 and 100 °C for samples after testing according to ASTM D2272 was determined—this parameter was not determined for samples after tests according to ASTM D8206 and PN-EN 16091 due to insufficient oil quantity. The viscosity index was calculated for those samples for which kinematic viscosities were determined. These results are presented in Table 3, and the parameter changes are presented in Table 4.
The observed changes in the kinematic viscosity of the tested oils A and B differ depending on the oxidation method, as each test was conducted differently. After testing by the ASTM D5704 method, the kinematic viscosity at 40 °C increased (more for oil A than B), while the kinematic viscosity at 100 °C decreased (more for oil A than B). After testing by ASTM D2272 and PN-C-04080 methods, the kinematic viscosity at both temperatures decreased.
In the case of this method, the phenomenon of shearing between gear wheels additionally occurs during oil degradation. Shearing and continuous air access throughout the test cause significant deterioration of rheological properties.
When studying thermal oxidation stability, several processes compete during oil degradation. These are oxidation processes associated with polymerization and thermochemical degradation of viscosity additives (including hydrolysis of ester structures in the presence of water/steam). In the case of ASTM D5704, tribochemical processes (shearing of oil or additives) are added. In oil samples A and B, a decrease in kinematic viscosity was observed in most cases after thermal oxidation stability testing, indicating the predominance of viscosifier destruction processes over polymerization. On the other hand, the increase in kinematic viscosity at 40 °C observed in the ASTM D5704 method, despite the fact that oxidation processes are not advanced (see FTIR analysis), may be related to tribochemical shear processes, leading to the generation of free radicals that secondarily polymerize into products that are insoluble at the test temperature.
All oils after oxidation were characterized by an elevated acid number, which indicates a high content of oxidation products. In the case of ASTM D2272, greater oil degradation may result from the dynamism of the method; that is, the pressure vessel with the sample rotates, and a thin layer of oil is in contact with oxygen. Additionally, water vapor is present between the glass vessel—which contains the oil with the catalyst—and the vessel walls.
Comparing the test results for oil A and B obtained in tests where the degree of degradation is assessed based on time when the pressure drop by 10% from its maximum value is achieved (ASTM D2272, ASTM D8206, and PN-EN 16091), it can be concluded that oil A has higher thermal oxidation stability than oil B.
To compare the chemical changes that occurred during thermal oxidation stability tests carried out by different methods, infrared spectral analysis (FTIR) was performed—transmittance spectra of fresh oils and after testing were recorded. Transmittance spectra were recorded in the range of 4000 cm−1–550 cm−1.
According to the manufacturers’ declarations, the tested gear oils are synthetic hydrocarbon oils (bands in the range of 3200–2850 cm−1, bands around 1460, 1370, 722 cm−1). The oils contain anti-wear additives of the thiophosphate type, including zinc dithiophosphate (bands around 975 and 650 cm−1) and phenolic antioxidants (band around 3650 cm−1). Additionally, oil B contains a PAO component (band around 941 cm−1) and an unidentified ester additive (bands around 1730, 1270, 1170, and 1150 cm−1). In contrast, oil A contains some carboxyl structures (weak bands around 1224, 1170, and 1155 cm−1), including ester (1740 cm−1) and acidic (1706 cm−1). The recorded spectra of oils A and B are shown in Figure 1.
The procedure used for spectral evaluation was analogous to that in studies on comparing methods for determining the thermal oxidation stability of base oils and other lubricants conducted in recent years at INiG-PIB [18]. Differential spectra of oil pairs (before and after testing) were analyzed. The recorded differential spectra are shown in the subsequent Figure 2 and Figure 3.
By analyzing the differential FTIR spectra of oils from operation, their degradation can be quantitatively assessed. Table 5 (for oil A) and Table 6 (for oil B) present a compilation of bands observed in differential FTIR spectra and their absorbances, as well as their correlations with the various degradation and oxidation processes of the tested oils.
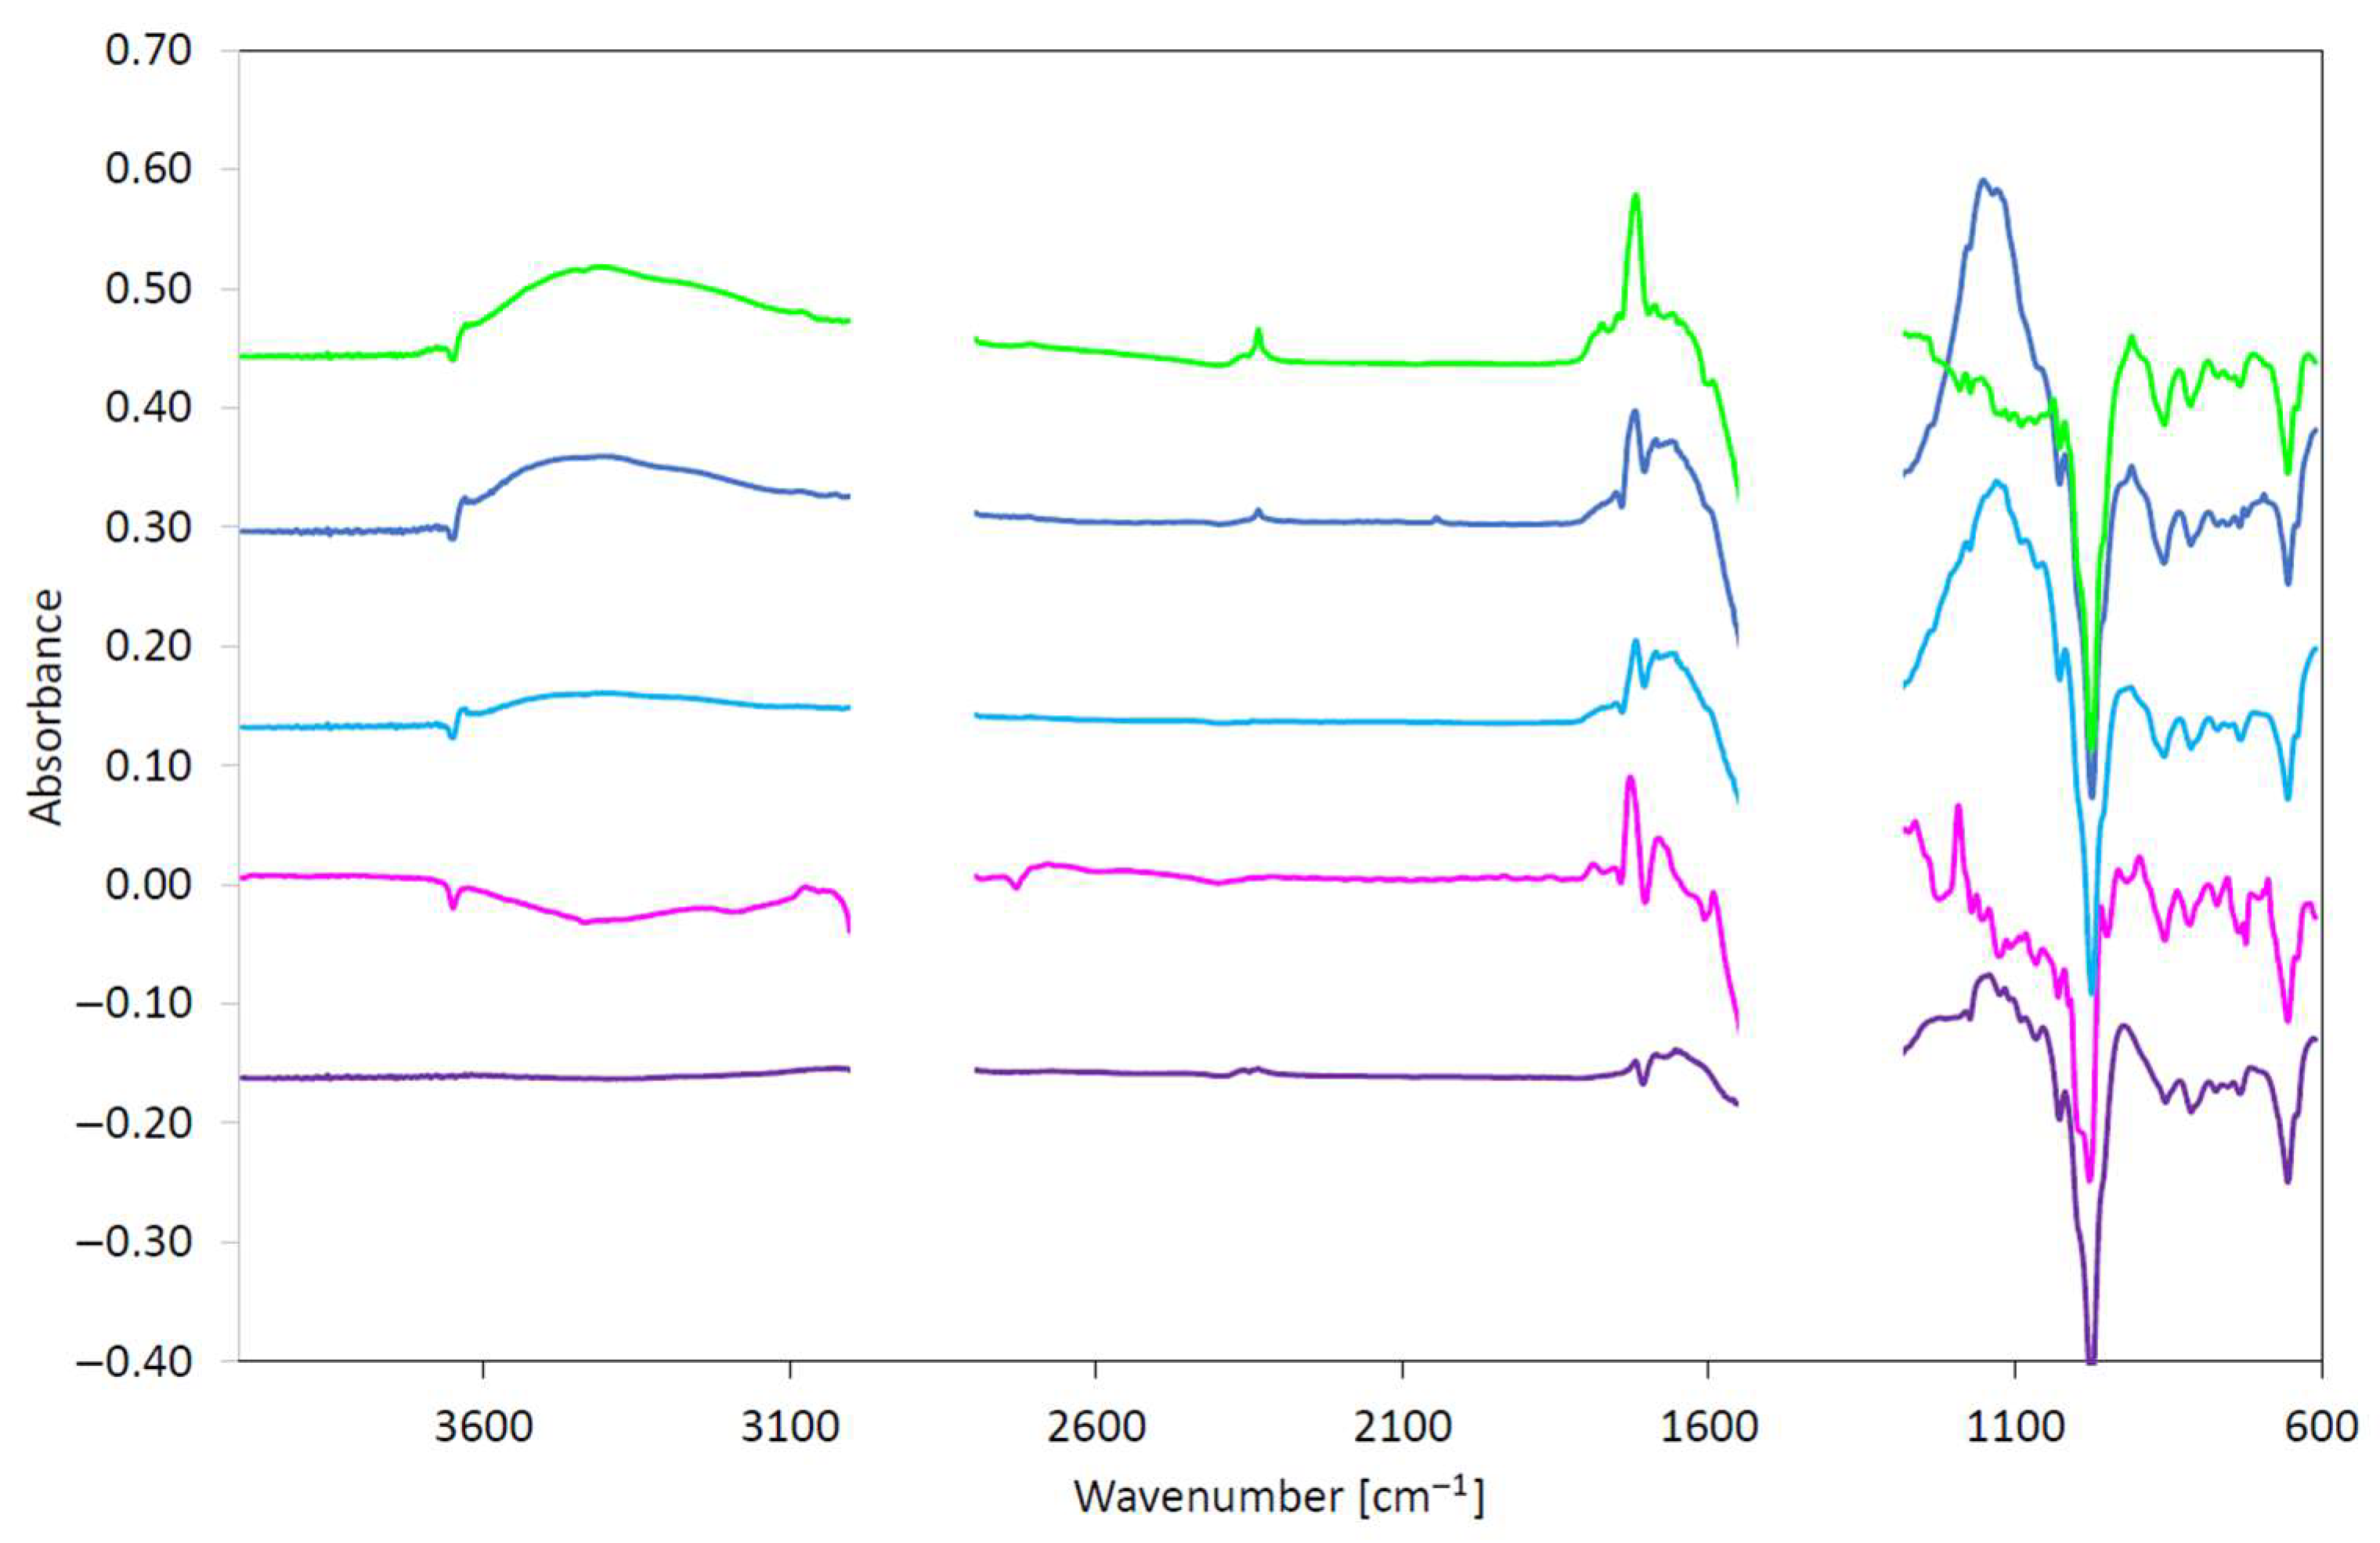
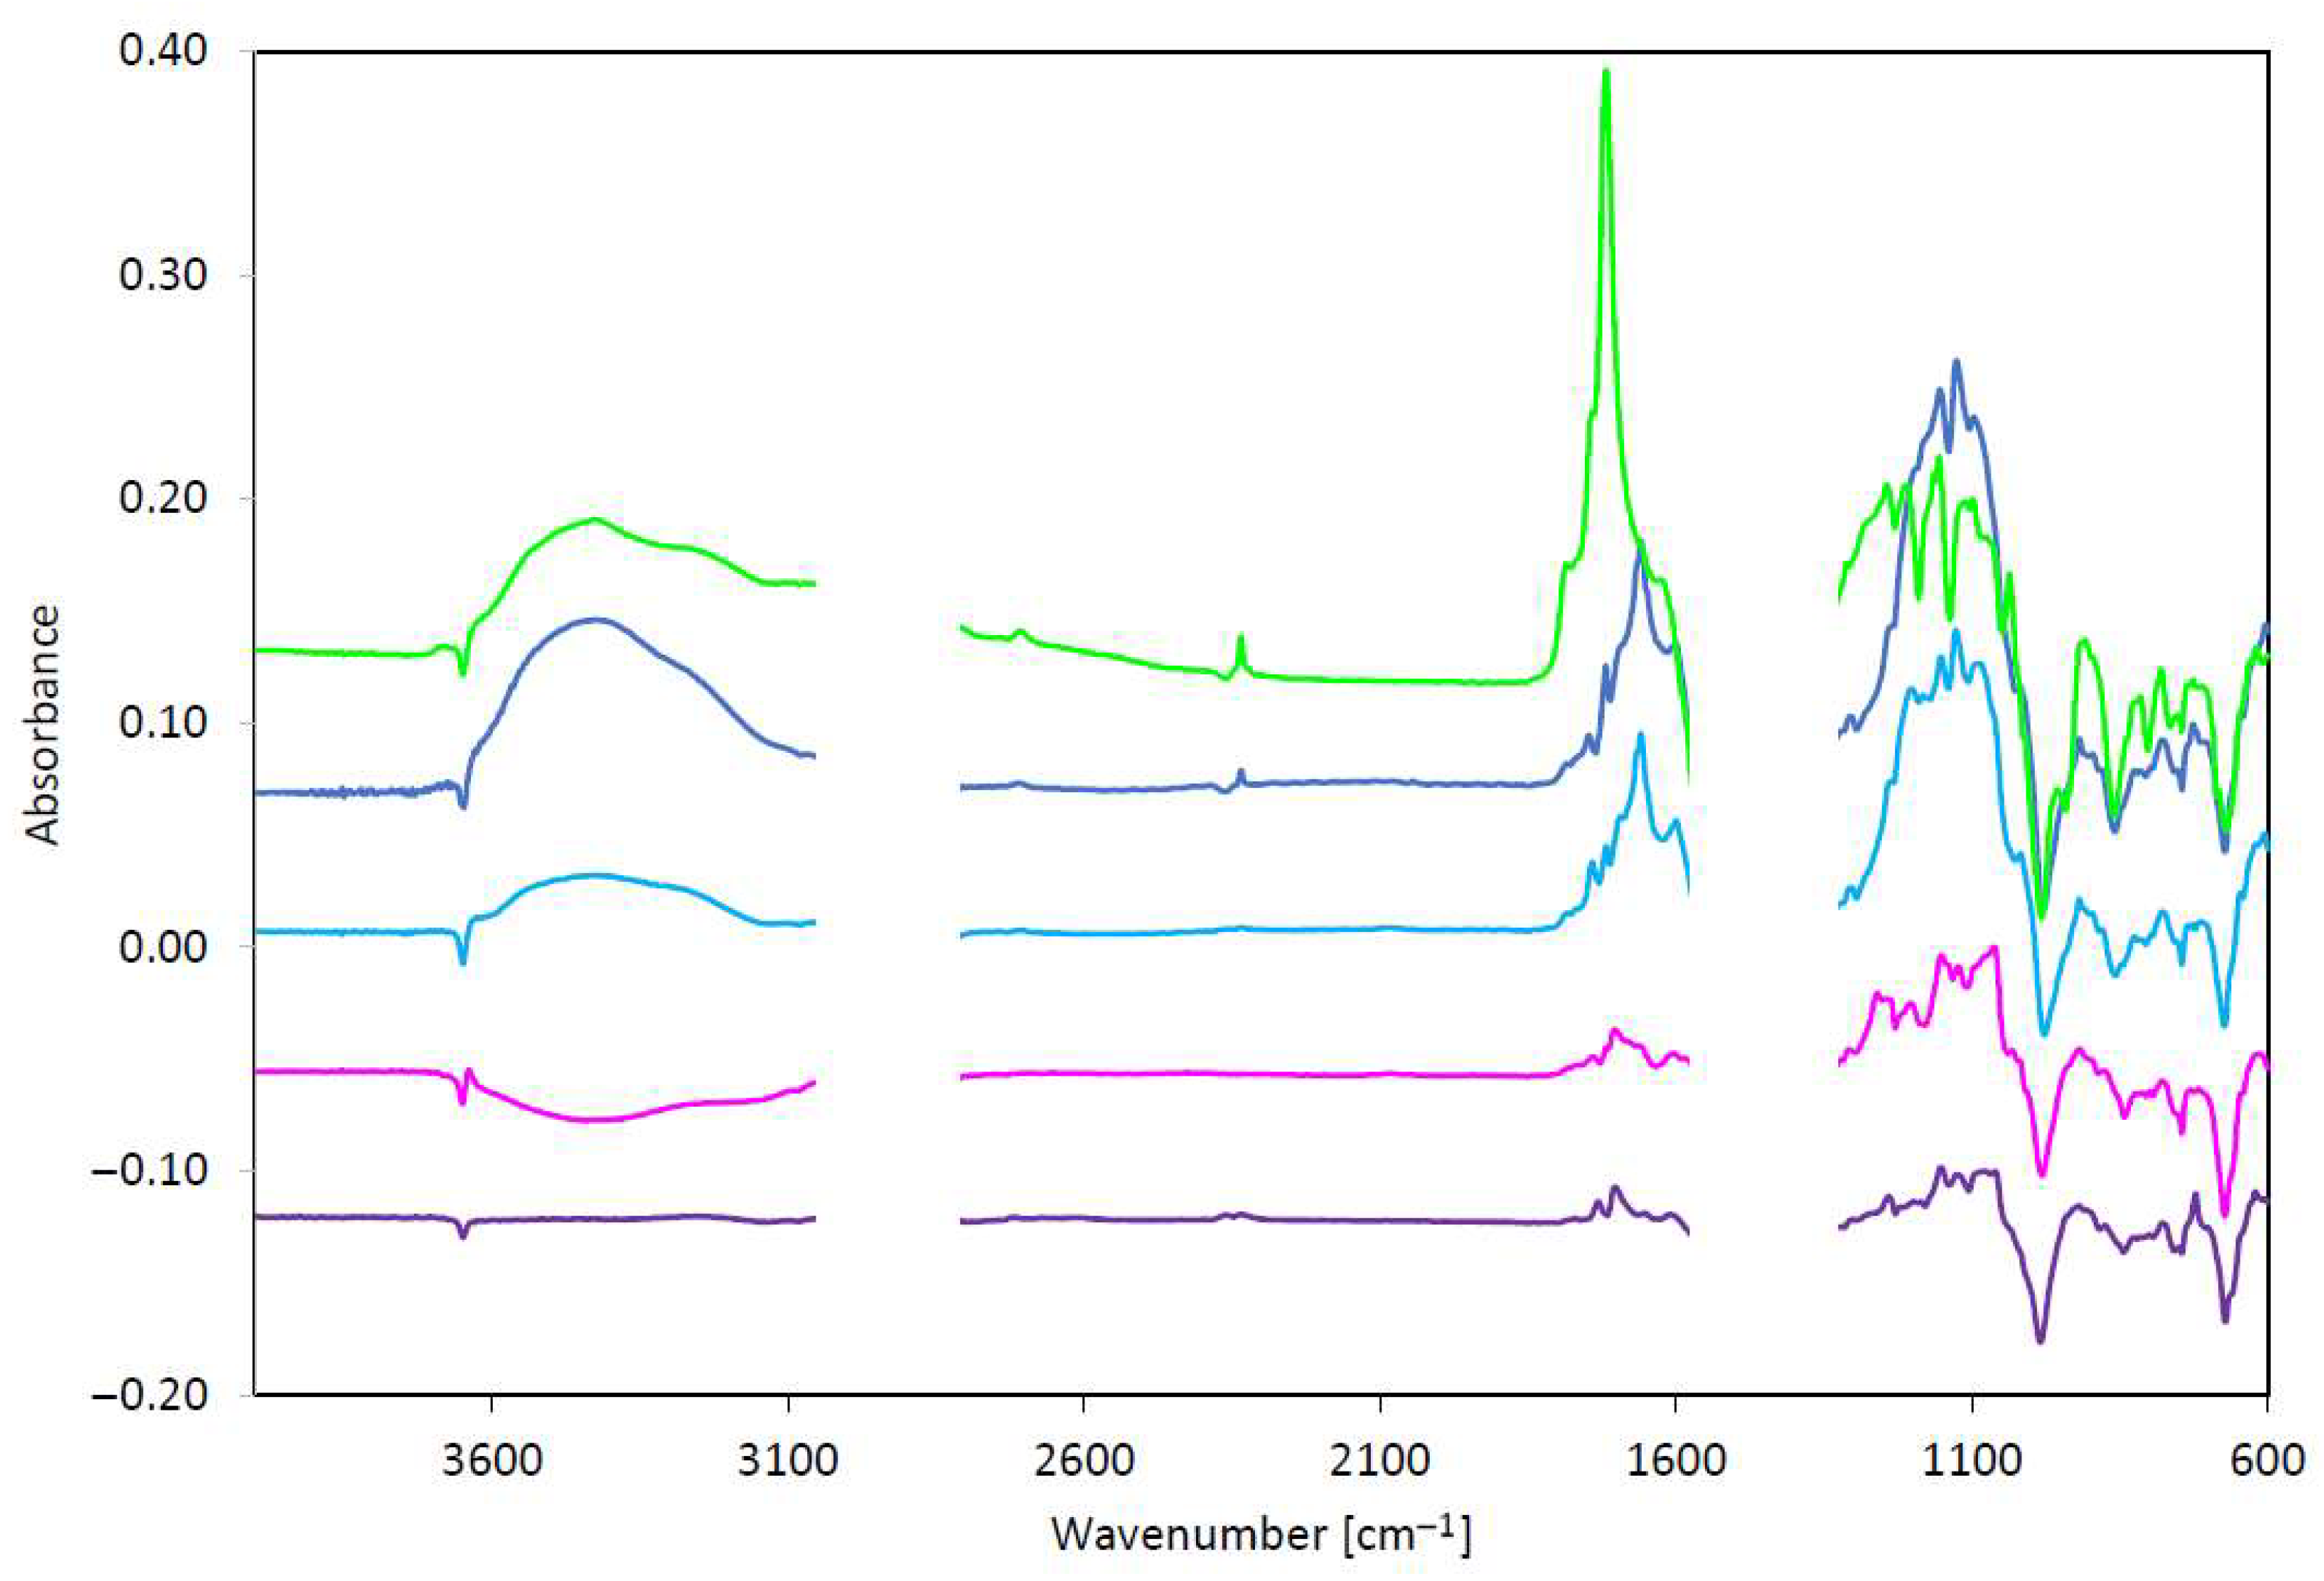
In the analysis of differential spectra, the focus was placed on several spectral areas related to oxidation processes and the degradation of EP additives and antioxidants. The critical spectral range in which bands carrying information about oil oxidation appear is from 1800 to 1640 cm−1. Bands present in this range are associated with the appearance of carbonyl and/or carboxyl structures formed in the advanced stages of oil component oxidation. The second spectral area related to oxidation processes is the range of 1200 to 1000 cm−1. Bands appearing in this range most often indicate the formation of single C-O bonds of alcohols and ethers in the initial stages of oxidation. The degradation of anti-wear additives of the thiophosphate type, including classic zinc dithiophosphates, is evidenced by negative bands in the ranges of 1000–900 cm−1 and 700–600 cm−1. The depletion of phenolic antioxidants can be observed by changes in bands in the range of 3700–3600 cm−1.
Analysis of differential spectra and data in Table 5 and Table 6 allows for the conclusion that oil B is more susceptible to destruction and oxidation processes. In the range providing information on the formation of carbonyl and carboxyl structures, the largest changes are observed for the ASTM D2272 method (absorbance is approximately 0.29 abs/0.1 mm), while changes in this range for the ASTM D8206 and PN-EN 16091 methods are in the range of 0.09 to 0.12 abs/0.1 mm, while the ASTM D5704 and PN-C-04080 methods interfere least with the oil structure (absorbance ~0.017–0.022 abs/0.1 mm).
In the case of the spectral range 1200–1000 cm−1 for oil B, the strongest degradation processes are observed for the ASTM D8206 and PN-EN 16091 methods (0.20 and 0.14 abs/0.1 mm, respectively), which indicates that, under test conditions, the degradation process is stopped at the initial stage of oxidation, where the process of forming single C-O bonds prevails. In the case of the ASTM D2272 method, the absorbance in the range is approximately 0.1 abs/0.1 mm, which, in light of the previously described spectrum, indicates advanced oxidation processes occurring during tests performed by this method. For the ASTM D5704 and PN-C-04080 methods, the absorbance in the discussed range is 0.03 to 0.06 abs/0.1 mm, indicating relatively mild test conditions and slower degradation of the tested oil.
In the range of changes related to the degradation of phosphorus EP additives, it should be noted that the ASTM D2272 method leads to stronger destruction of such structures (absorbance ~ −0.11 abs/0.1 mm), while, in other tests, a similar degree of decomposition of their primary structure is observed (absorbance ~ −0.05 abs/0.1 mm).
In the case of antioxidants, the observed changes are small. In the spectra obtained from tests performed using the ASTM D2272, ASTM D8206, and PN-EN 16091 methods, the absorbance decrease at approx. 3650 cm−1 is in the range of 0.016–0.021 abs/0.1 mm, while, for the ASTM D5704 and PN-C-04080 methods, it is approx. 0.01 abs/0.1 mm.
In light of the data obtained from spectral analysis, oil A is more resistant to destruction and oxidation processes. In the range carrying information on the formation of carbonyl and carboxyl structures, the largest changes are observed for the ASTM D2272 method, where absorbance is approximately 0.14 abs/0.1 mm. Changes in this range for the ASTM D8206, PN-EN 16091, and ASTM D5704 methods are within the range of 0.069 to 0.095 abs/0.1 mm, while the PN-C-04080 method interferes least with the oil structure (absorbance ~0.018 abs/0.1 mm).
In the case of the spectral range 1200–1000 cm−1 for oil A, the strongest degradation processes are observed for the ASTM D5704 methods (0.29 and 0.20 abs/0.1 mm, respectively), indicating that, under test conditions, the degradation process is stopped at the initial stage of oxidation, where the process of forming single C-O bonds prevails. In the case of the ASTM D2272 method, the absorbance in the range is approximately 0.01 abs/0.1 mm, which, in light of the previously described spectrum, indicates practically completed oxidation processes occurring during tests performed by this method.
For the ASTM D5704 and PN-C-04080 methods, the absorbance in the discussed range is 0.06 to 0.08 abs/0.1 mm, indicating relatively mild test conditions and slower degradation of the tested oil. In the range of changes related to the degradation of phosphorus EP additives, it should be noted that the ASTM D2272 method leads to stronger destruction of such structures (absorbance~−0.32 abs/0.1 mm), while, in tests performed by the other methods, a similar degree of decomposition of their primary structure is observed (absorbance −0.22–0.26 abs/0.1 mm).
In the case of antioxidants, the observed changes are small. In the spectra obtained for the PN-C-04080 method, no decrease in absorbance is observed, while, in other tests, the decrease in absorbance at approximately 3650 cm−1 is approximately 0.02 abs/0.1 mm.
Oil B is more susceptible to destruction and oxidation processes than oil A. In the case of assessment by the ASTM D2272 method, it can be assumed that it oxidizes twice as effectively.
FTIR spectral analysis of the oil makes it possible to identify changes related to the appearance of structures present in the oxidation products (carbonyl groups, C-O bonds) and changes in the composition of the additive packages as a result of their destruction (antioxidant additives, EP, etc.). It is not possible to draw conclusions on the hydrocarbon structural-group composition of oils on the basis of spectral studies.
The most objective methods for testing thermal oxidation stability in the case of gear oils used in electric passenger cars seem to be methods PN-EN 16091 and ASTM D8206, as they differentiate well between the degradation processes taking place. The ASTM D2272 method was selected for comparison because it differentiates inhibited oils well—however, it turned out to be too aggressive for this type of product, leading to degradation processes that are too deep. The ASTM D5704 and PN-C-04080 methods performed poorly, causing little destruction of the oils tested.
The ASTM D5704 method appeared to be potentially the most appropriate for evaluating such oils, as it takes into account tribochemical transformations associated with degradation processes on the teeth of the friction system in addition to changes in thermal processes. However, the test conditions and gear loading were found to be insufficient to fully evaluate the tested oils. Therefore, it is necessary to develop an equivalent method that allows testing under appropriate conditions.
In the ASTM D2272, ASTM D8206, and PN-EN 16091 methods, oxygen is used, while, in methods ASTM D5705 and PN-C-04080, air is used—a less destructive agent, which was confirmed by the observed changes in spectral analysis. Based on the conducted research, the authors propose a ranking of the methods used in terms of their aggressiveness towards the tested medium, from the most aggressive, ASTM D2272, through PN-EN 16091 and ASTM D8206, and ASTM D5704, to the least aggressive, PN-C-04080. The term “aggressiveness of the method” was taken to mean the effect on the degradation of the oil under test (change in its properties).

4. Conclusions

To verify the thermal oxidation stability of two commercial gear oils used in passenger electric vehicles, oxidation resistance tests were conducted using five standardized test methods. Each method is dedicated to checking the oxidation resistance of lubricants under different conditions of elevated temperature, access to oxygen or air, and the presence of a catalyst (in three out of five methods). To assess the degree of oil degradation, changes in parameters such as kinematic viscosity at 40 °C and 100 °C, viscosity index, and acid number were determined. FTIR spectral analysis was performed. Based on changes in carboxylic structures, changes in C-O structures, degradation of antioxidants, and degradation of EP additives, it was found that oil B is more susceptible to destruction and oxidation processes than oil A. In this study the effectiveness and suitability of the selected methods for evaluating thermal oxidation stability in terms of the potential differentiation of passenger car electric gear oils under elevated temperature conditions and, in the case of ASTM D5704, additionally, the load on the friction system were determined.
Based on the conducted research, a ranking of the methods used in terms of their aggressiveness towards the tested samples was proposed, from the most aggressive, ASTM D2272, through PN-EN 16091, ASTM D8206, and ASTM D5704, to the least aggressive, PN-C-04080.

Author Contributions

Conceptualization, A.S. and W.K.; Methodology, A.S., E.B., M.Ż. and K.B.; Validation, E.B.; Investigation, W.K. and M.Ż.; Supervision, K.B. All authors have read and agreed to the published version of the manuscript.

Funding

This research received no external funding.

Data Availability Statement

The original contributions presented in this study are included in the article. Further inquiries can be directed to the corresponding author.

Conflicts of Interest

The authors declare no conflict of interest.

References

  1. Cobb, T.W.; Gatto, V.J.; Moehle, W.E.; Schneller, E.R. Oxidation Fundamentals and its Application to Turbine Oil Testing. J. ASTM Int. 2006, 3, 327–336. [Google Scholar] [CrossRef]
  2. Skibińska, A. Stabilność termooksydacyjna smarów plastycznych. Nafta-Gaz. 2021, 77, 471–479. [Google Scholar] [CrossRef]
  3. Xia, D.; Wang, Y.; Liu, H.; Yan, J.; Lin, H.; Han, S. Research Progress of Antioxidant Additives for Lubricating Oils. Lubricants 2024, 12, 115. [Google Scholar] [CrossRef]
  4. König, T.; Cadau, L.; Steidle, L.; Güney, D.C.; Albrecht, J.; Weber, K.; Kley, M. A concept for comparison of new and aged lubricants in transmissions of electric vehicles and a method of oil aging on a test rig. Forsch Ingenieurwes 2023, 87, 1069–1080. [Google Scholar] [CrossRef]
  5. Parenago, O.P.; Lyadov, A.S.; Maksimov, A.L. Development of Lubricant Formulations for Modern Electric Vehicles. Russ. J. Appl. Chem. 2022, 95, 765–774. [Google Scholar]
  6. Rivera, N.; Viesca, J.L.; García, A.; Prado, J.I.; Lugo, L.; Battez, A.H. Cooling Performance of Fresh and Aged Automatic Transmission Fluids for Hybrid Electric Vehicles. Appl. Sci. 2022, 12, 8911. [Google Scholar] [CrossRef]
  7. Zhmud, B.; Najjari, M.; Brodmann, B. The Effects of the Lubricant Properties and Surface Finish Characteristics on the Tribology of High-Speed Gears for EV Transmissions. Lubricants 2024, 12, 112. [Google Scholar] [CrossRef]
  8. Shah, R.; Tung, S.; Chen, R.; Miller, R. Grease Performance Requirements and Future Perspectives for Electric and Hybrid Vehicle Applications. Lubricants 2021, 9, 40. [Google Scholar] [CrossRef]
  9. Wang, X.; Wang, Q.J.; Ren, N.; England, R. Lubrication subjected to effects of electric and magnetic fields: Recent research progress and a generalized MEMT-field Reynolds equation. Front. Mech. Eng. 2024, 9, 1334814. Available online: https://www.frontiersin.org/journals/mechanical-engineering/articles/10.3389/fmech.2023.1334814/pdf (accessed on 28 July 2025). [CrossRef]
  10. ASTM D5704-20; Standard Test Method for Evaluation of the Thermal and Oxidative Stability of Lubricating Oils Used for Manual Transmissions and Final Drive Axles. ASTM International: West Conshohocken, PA, USA, 2022.
  11. ASTM D8206-18; Standard Test Method for Oxidation Stability of Lubricating Greases—Rapid Small-Scale Oxidation Test (RSSOT). ASTM International: West Conshohocken, PA, USA, 2024.
  12. PN-EN 16091:2011; Ciekłe Przetwory Naftowe—Paliwa i Mieszaniny ze Średnich Destylatów Naftowych i Estrów Metylowych Kwasów Tłuszczowych (FAME)—Oznaczanie Stabilności Oksydacyjnej Metodą Szybkiego Utleniania w Małej Skali. Polski Komitet Normalizacyjny: Warszawa, Poland, 2023.
  13. ASTM D2272-22; Standard Test Method for Oxidation Stability of Steam Turbine Oils by Rotating Pressure Vessel. ASTM International: West Conshohocken, PA, USA, 2022.
  14. PN-67/C-04080; Przetwory Naftowe—Badania Odporności Olejów na Utlenianie. Wydawnictwa Normalizacyjne: Warszawa, Poland, 1976.
  15. DIN 51451:2004; Testing of Petroleum Products and Related Products—Analysis by Infrared Spectrometry—General Working Principles. Deutsches Institut für Normung: Berlin, Germany, 2004.
  16. PN-EN ISO 3104:2024; Przetwory Naftowe—Ciecze Przezroczyste i Nieprzezroczyste—Oznaczanie Lepkości Kinematycznej i Obliczanie Lepkości Dynamicznej. Polski Komitet Normalizacyjny: Warszawa, Poland, 2024.
  17. PN-ISO 6618:2011; Przetwory Naftowe i Środki Smarowe—Oznaczanie Liczby Kwasowej i Zasadowej—Metoda Miareczkowania Wobec Wskaźników Barwnych. Polski Komitet Normalizacyjny: Warszawa, Poland, 2011.
  18. Krasodomski, M.; Krasodomski, W.; Skibińska, A.; Żółty, M. Badania porównawcze w zakresie metod oznaczania stabilności termooksydacyjnej olejów bazowych. Przemysł Chem. 2019, 4, 563–568. [Google Scholar] [CrossRef]
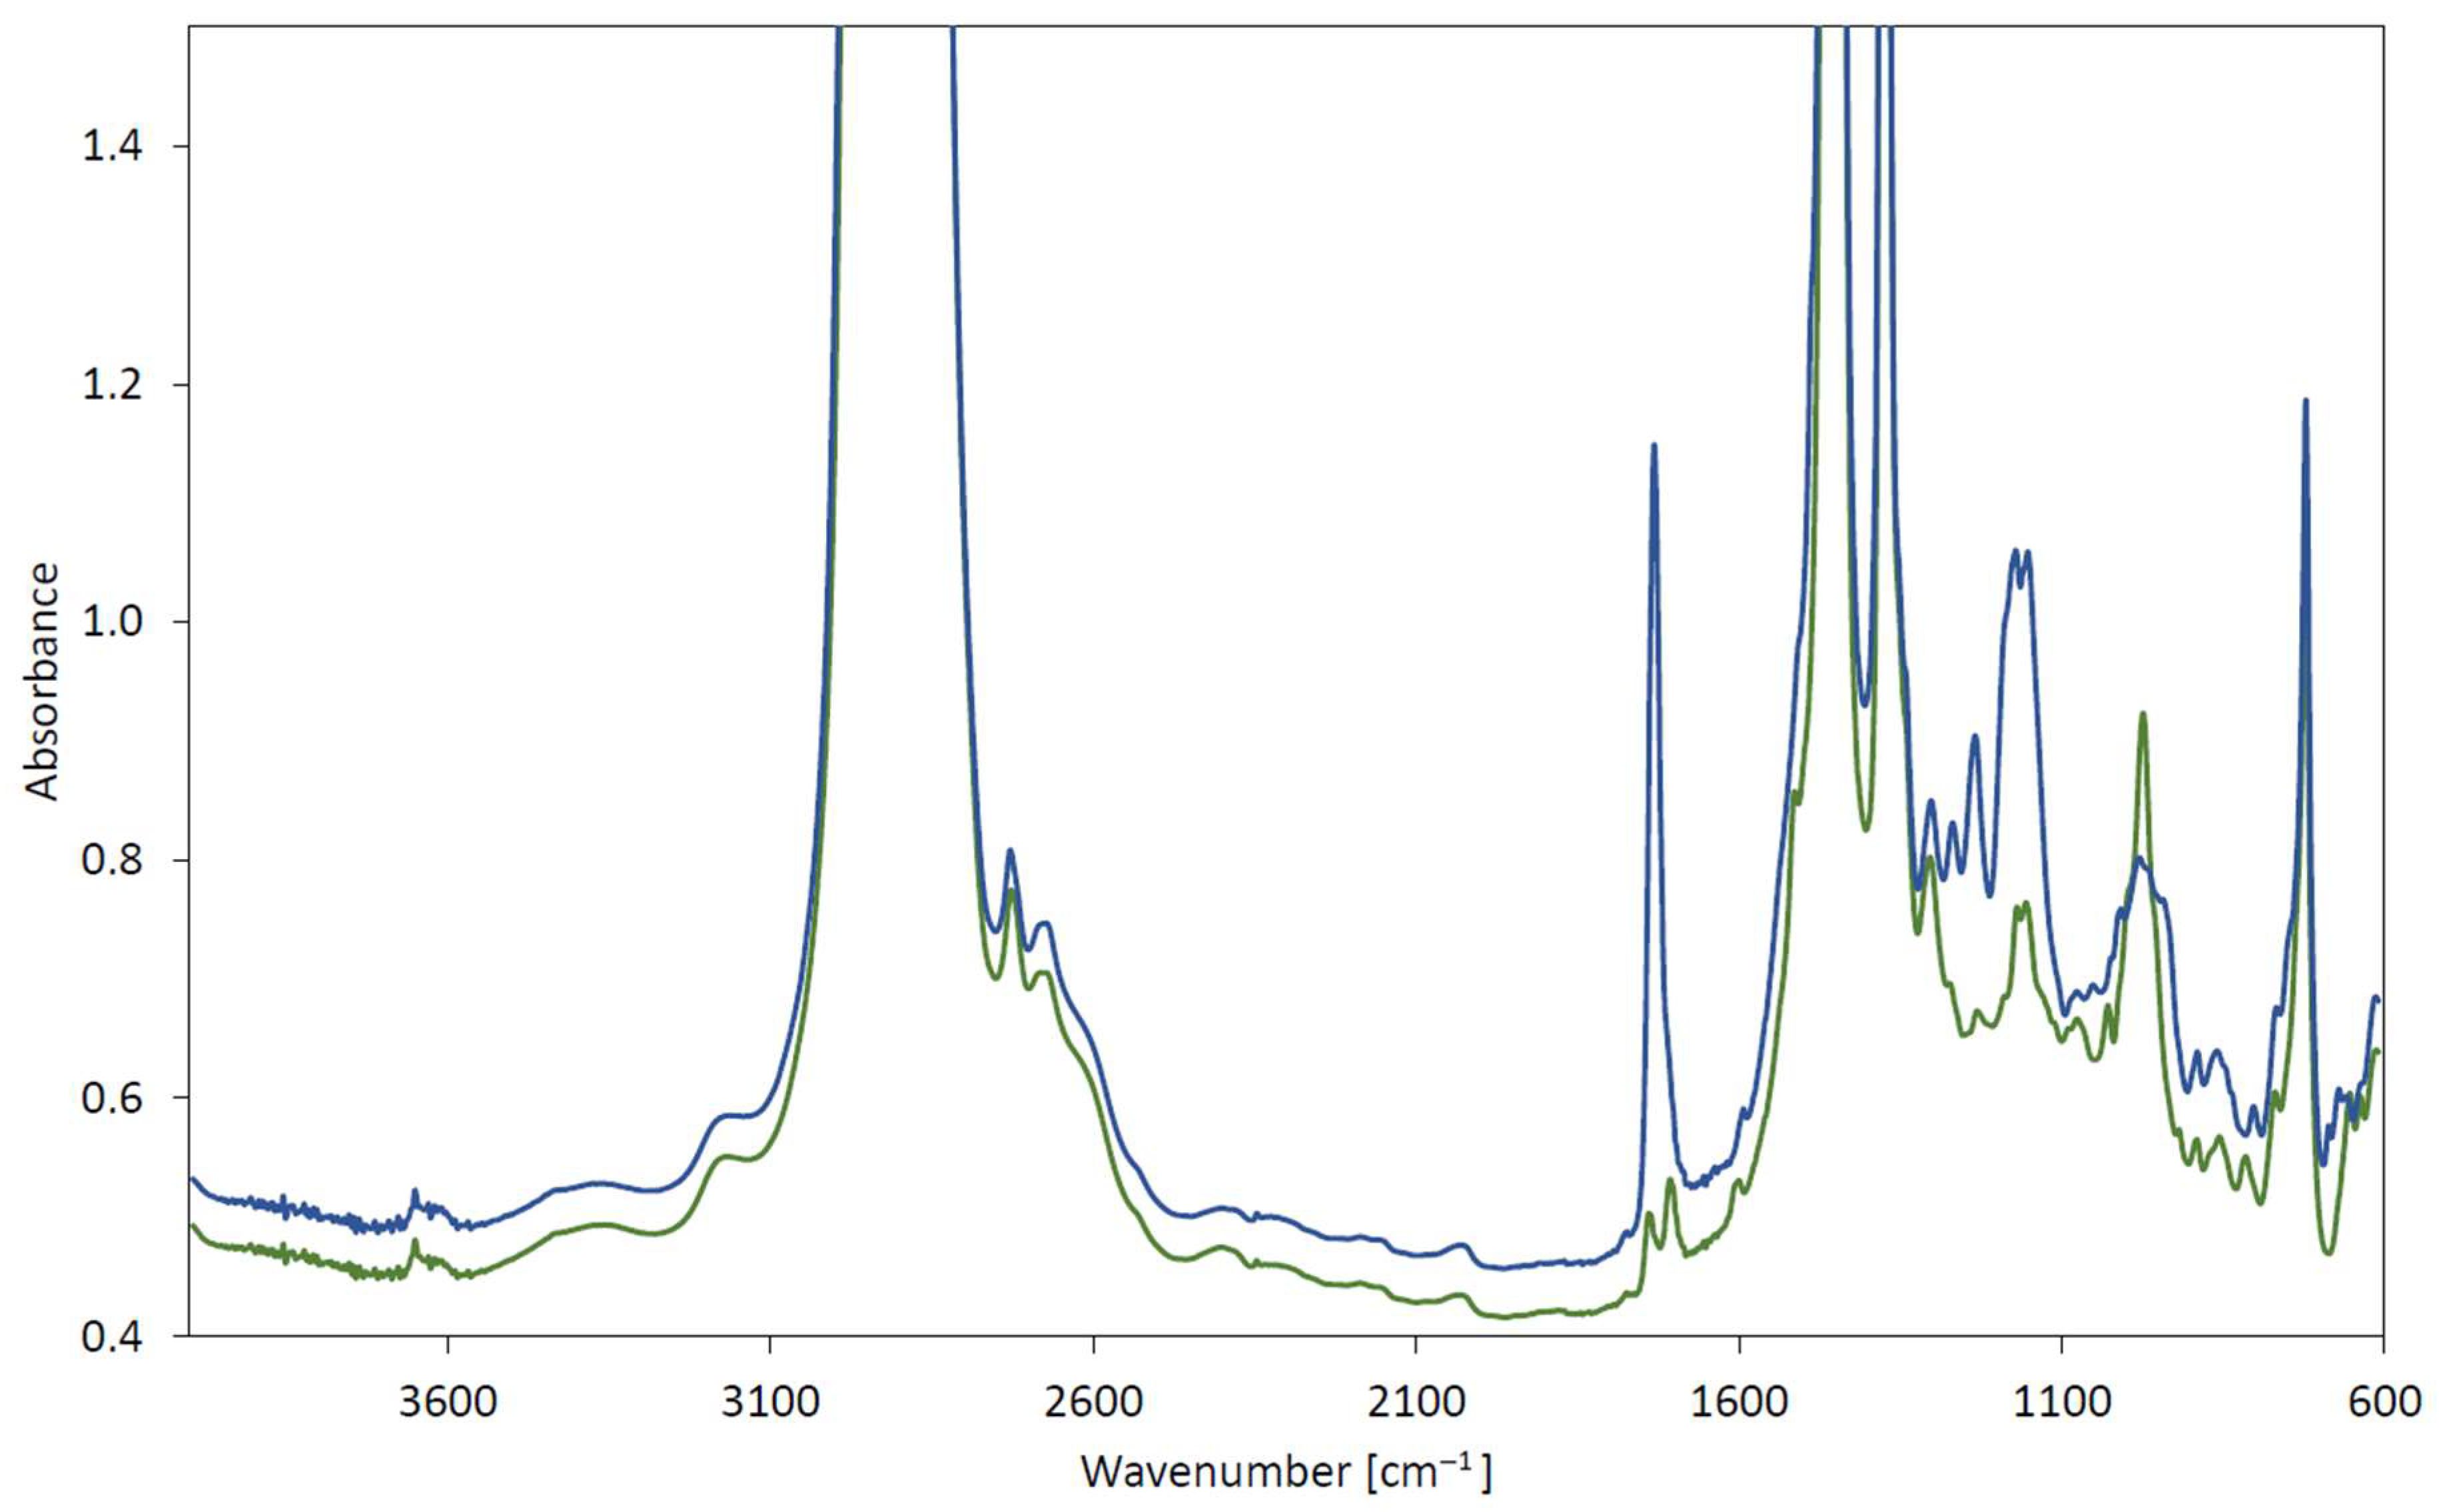
Figure 1. FTIR spectra of oils: A (dark green line) and B (dark blue line).
Lubricants 13 00337 g001
Figure 2. Differential FTIR spectra of oil A (after tests relative to before tests). Oils after testing: PN-C-04080 (violet line), ASTM D5704 (magenta line), ASTM D8206 (light blue line), EN 16091 (blue line), and ASTM D2272 (light green line).
Lubricants 13 00337 g002
Figure 3. Differential FTIR spectra of oil B (after tests relative to before tests). Oils after testing: PN-C-04080 (violet line), ASTM D5704 (magenta line), ASTM D8206 (light blue line), EN 16091 (blue line), and ASTM D2272 (light green line).
Lubricants 13 00337 g003
Table 1. Comparison of the conditions for conducting thermal oxidation stability tests for the methods used.
Test MethodMethod Specific to the ProductConditions
Temperature,
°C
CatalystSteamSample QuantityMedium
/Gas
Test Time, h,Result
ASTM D5704Automotive gear oils162.8Copper platenone120 mLair, flow
22.08 mg/min
50kinematic viscosity (at 40 and 100 °C) change,
acid number change,
catalyst mass change,
insoluble matter content
ASTM D8206Greases160.0Nonenone4 goxygen,
700 kPa
-time (in min.) until oxygen pressure drops by 10% from maximum pressure
PN-EN 16091Lubricating oils140.0Nonenone5 mLoxygen,
800 kPa
-time (in min.) until oxygen pressure drops by 10% from maximum pressure
ASTM D2272Steam
turbine oils
150.0Copper wire coilpresent50 goxygen,
620 kPa
-time (in min.) until oxygen pressure drops by 175 kPa
PN-C-04080Lubricating oils160.0Copper platenone75 gair, flow
3 dm3/h
24kinematic viscosity (at 40 °C) change,
acid number change
Table 2. Oxidation resistance test results.
Test MethodResults
Oil AOil B
ASTM D5704Kinematic viscosity change:
- at 40 °C: increase by 35.50%
- at 100 °C: decrease by 24.13%
Acid number increase by 3.97%
Catalyst mass loss: 0.0006 g
Amount of insoluble matter:
- in pentane: 0.038% (m/m),
- in toluene: 0.108% (m/m)
Kinematic viscosity change:
- at 40 °C: increase by 14.31%
- at 100 °C: decrease by 8.98%
Acid number increase by 56.00%
Catalyst mass loss: 0.0259 g
Amount of insoluble matter:
- in pentane: 0.075% (m/m),
- in toluene: 0.194% (m/m)
ASTM D8206808 min778 min
PN-EN 16091878 min748 min
ASTM D2272812 min584 min
PN-C-04080Kinematic viscosity change:
- at 40 °C: decrease by 2.47%
- at 100 °C: decrease by 0.51%
Acid number increase by 32.16%
Kinematic viscosity change:
- at 40 °C: decrease by 2.03%
- at 100 °C: decrease by 10.60%
Acid number increase by 64.03%
Table 3. Summary of the physicochemical properties of the oils tested before and after the oxidation process.
Test MethodSampleKinematic Viscosity
at 40 °C, mm/s2
Kinematic Viscosity at 100 °C, mm/s2Acid Number,
mg KOH/g
Before the TestAfter
the Test
Before the TestAfter
the Test
Before the TestAfter
the Test
ASTM D5704Oil A32.3943.896422487220682150
ASTM D8206- *- *3568
PN-EN 16091- *- *3783
ASTM D227230.2062614279
PN-C-0408031.5964552733
ASTM D5704Oli B32.0636.687625694717432719
ASTM D8206- *- *2733
PN-EN 16091- *- *2701
ASTM D227230.1063195582
PN-C-0408031.4168172859
* not enough sample to conduct test.
Table 4. Summary of results of the percentage change in the physicochemical properties of the oils tested.
Test MethodSamplePhysicochemical Property Change [%]
Kinematic Viscosity
at 40 °C
Kinematic Viscosity
at 100 °C
Acid Number
ASTM D5704Oil A35.50−24.133.97
ASTM D8206- *- *72.53
PN-EN 16091- *- *82.93
ASTM D2272−6.76−2.50106.91
PN-C-04080−2.47−0.5132.16
ASTM D5704Oil B14.41−8.8956.00
ASTM D8206- *- *56.80
PN-EN 16091- *- *54.96
ASTM D2272−6.11−17.13220.25
PN-C-04080−2.03−10.6064.03
* not enough sample to conduct test.
Table 5. Summary of the bands observed in the differential FTIR spectra and their absorbances, in association with the different degradation and oxidation processes of oil A.
Test MethodPhenolic Antioxidant DegradationCarboxyl Structure Changes/Degree of OxidationStructure C-O ChangesEP Additive Degradation (1st Band)EP Additive Degradation (2nd Band)
Range
3600–3700 cm−1
Range
1800–1640 cm−1
Range
1200–1000 cm−1
Range
1000–900 cm−1
Range
700–650 cm−1
BandAbsorbanceBandAbsorbanceBandAbsorbanceBandAbsorbanceBandAbsorbance
Unitcm−1abs/0.1 mmcm−1abs/0.1 mmcm−1abs/0.1 mmcm−1abs/0.1 mmcm−1abs/0.1 mm
ASTM D57043651−0.02017240.08511900.060981−0.247657−0.121
ASTM D82063651−0.01817180.06911320.203977−0.226653−0.063
PN-EN 160913651−0.02017210.09511530.288976−0.228656−0.049
ASTM D22723650−0.02017210.14211500.013977−0.324655−0.091
PN-C-04080--16890.01811400.086977−0.258656−0.073
Table 6. Summary of the bands observed in the differential FTIR spectra and their absorbances, in association with the different degradation and oxidation processes of oil B.
Test Method Phenolic Antioxidant DegradationCarboxyl Structure Changes/Degree of OxidationStructure C-O ChangesEP Additive Degradation
(1st Band)
EP Additive Degradation
(2nd Band)
Range
3600–3700 cm−1
Range
1800–1640 cm−1
Range
1200–1000 cm−1
Range
1000–900 cm−1
Range
700–650 cm−1
BandAbsorbanceBandAbsorbanceBandAbsorbanceBandAbsorbanceBandAbsorbance
Unitcm−1abs/0.1 mmcm−1abs/0.1 mmcm−1abs/0.1 mmcm−1abs/0.1 mmcm−1abs/0.1 mm
ASTM D57043652−0.01017030.0221152
1130
0.057
0.062
983−0.048675−0.067
ASTM D82063649−0.02016600.0941201
1151
1129
1086
0.117
0.132
0.144
0.129
976−0.051673−0.046
PN-EN 160913652−0.01616600.1111156
1124
0.188
0.203
981−0.061674−0.031
ASTM D22723649−0.0211744
1718
0.129
0.295
11550.108981−0.114668−0.072
PN-C-040803648−0.0091704
0.017
11550.026986−0.056675−0.047
Disclaimer/Publisher’s Note: The statements, opinions and data contained in all publications are solely those of the individual author(s) and contributor(s) and not of MDPI and/or the editor(s). MDPI and/or the editor(s) disclaim responsibility for any injury to people or property resulting from any ideas, methods, instructions or products referred to in the content.