Abstract
As the core component of ultra-precision machine tools, the manufacturing errors of aerostatic spindles are inevitable due to the limitations of machining and assembly processes, and these errors significantly affect the spindle’s static and dynamic performance. To address this issue, a force model of the unbalanced air film, considering the straightness errors of the rotor’s radial and thrust surfaces, was constructed. Unlike conventional studies that rely solely on idealized error assumptions, this research integrates actual straightness measurement data into the simulation process, enabling a more realistic and precise prediction of bearing performance. Rotors with different tolerance specifications were fabricated, and static performance simulations were carried out based on the measured geometry data. An experimental setup was built to evaluate the performance of the aerostatic spindle assembled with these rotors. The experimental results were compared with the simulation outcomes, confirming the validity of the proposed model. To further quantify the influence of straightness errors on the static characteristics of aerostatic spindles, ideal functions were used to define representative manufacturing error profiles. The results show that a barrel-shaped error on the radial bearing surface can cause a load capacity variation of up to 46.6%, and its positive effect on air film load capacity is more significant than that of taper or drum shapes. For the thrust bearing surface, a concave-shaped error can lead to a load capacity variation of up to 13.4%, and its enhancement effect is superior to those of the two taper and convex-shaped errors. The results demonstrate that the straightness errors on the radial and thrust bearing surfaces are key factors affecting the radial and axial load capacities of the spindle.
1. Introduction
Due to its advantages such as high precision, low frictional loss, and suitability for high-speed operation, the aerostatic spindle has been widely applied in ultra-precision machining [1,2,3]. Surface geometric errors in aerostatic spindle components are difficult to eliminate, even with improved manufacturing precision. This is mainly caused by the inherent limitations of machine tools and fixtures [4]. These geometric errors can generally be categorized into roundness and cylindricity, surface waviness, and roughness [5]. Under high-speed conditions, the static characteristics of rotor assemblies can change significantly, with manufacturing errors being a major contributing factor [6,7]. Moreover, the variation in static performance differs depending on the type and magnitude of manufacturing errors. Therefore, it is of great significance to investigate the influence of manufacturing errors on the performance of aerostatic spindles.
Subsequently, increasing attention has been paid to the impact of surface form errors on aerostatic spindles. Zheng [8] developed a dynamic mathematical model that considers roundness, cylindricity, and spindle rotational speed, and proposed a discrete radius coefficient index for shaft parts based on roundness measurement data. Simulation calculations based on measurement cylindricity data were conducted and compared with the measurement spindle rotational accuracy, revealing that shafts with smaller discrete coefficients exhibited smaller rotational errors. Cappa’s [9] study showed that rotor roundness errors are a primary cause of spindle radial motion errors and proposed appropriate tolerance design guidelines. Zhuang [10] solved the Reynolds equation using a small perturbation method and found that compared to the circumferential direction, the performance of thrust bearings is more sensitive to radial waviness. Wang [11], through the finite difference method (FDM), demonstrated that when the amplitude of waviness increases within a certain range, both the load-carrying capacity and mass flow rate of the bearing decrease. Chen [12] proposed a novel method for studying fluid–solid interaction problems in gas bearing rotor systems and systematically analyzed the effects of manufacturing errors—including roundness, convexity, concavity, and taper—on the dynamic performance of the rotor system. The results showed that roundness errors with spatial orders of 1 and 2 significantly increase the error motion amplitude and should be strictly avoided. Li [13] investigated the effects of circumferential and axial machining errors in bearing sleeves on the static and dynamic characteristics of aerostatic spindles. The results indicated that axial rectangular and triangular waviness can enhance spindle stability to some extent; however, as the amplitude of the error increases, the stability of the spindle tends to deteriorate. Lin [14] analyzed the impact of surface roughness on the dynamic stiffness and damping characteristics of aerostatic thrust bearings, showing that both the shape and height of the roughness profile significantly affect the average stiffness and damping of the bearing. Kumar et al. [15] studied the impact of random surface roughness on the performance of Rayleigh step bearings operating under thermo-elastohydrodynamic lubrication (TEHL), and concluded that the orientation of surface roughness has a pronounced effect on bearing performance. Zhang [16] developed a predictive model to study the relationship between synchronous radial errors motion and roundness errors in gas bearings, and the results showed that increasing the number of restrictor orifices can significantly reduce synchronous error motion.
In addition to surface form errors of individual components, rotor misalignment during operation can also significantly impact various bearing performance characteristics, may lead to mutual wear between the rotor and bearing in severe cases. Axis misalignment generates unbalanced mass, resulting in tilt motion errors in the aerostatic spindle, which critically affect the machining quality of parts. Ding [17] investigated the combined effects of manufacturing errors, bearing misalignment, and inertia on the performance of gas bearings. The study revealed that manufacturing errors have a significant impact on bearing performance, while misalignment mainly affects the moment. Cai [18] applied for a patent on a dual-axis air-bearing platform with dynamic tilt compensation, which is used to adjust the flatness of the air-bearing mechanism and improve the motion accuracy of the platform. Cui [19] studied the effect of spindle taper on the thickness of the bearing film, and both numerical and experiment results indicated that axial waviness errors significantly influence the area and position of the high-pressure region. Phalle [20] examined the effect of journal misalignment on the static and dynamic performance of bearings under bushing wear conditions and found that bearings with higher offset coefficients exhibit better overall performance. Cai [21] proposed a new type of gas hydrostatic bearing based on active compensation, addressing the bandwidth limitation of traditional active compensation methods and thereby improving the static and dynamic performance of the bearing. Michal [22] studied the performance variation in multi-pad hydrostatic bearings in large-scale structures under the influence of manufacturing and assembly errors, and proposed corresponding compensation and prediction methods, with a particular focus on the application of compliant support materials in such bearings. Zhao [23] further explored the impact of journal misalignment on the stability threshold of the aerostatic bearing–rotor system. The results demonstrated that the critical whirl stability threshold decreases with decreasing eccentricity, while the critical inertial force threshold increases with increasing eccentricity. Ning [24] used the perturbation method to analyze the influence of five types of manufacturing errors—including taper error, ellipticity, and journal eccentricity—on the performance of air-lubricated gyroscopes, and found that taper error has the most significant effect. An et al. [25] utilized Euler’s dynamic equations to study the impact of spindle tilt motion on machining accuracy. Through simulation and experimental validation, they proposed an inertia tensor criterion to reduce surface waviness errors in machined parts. Mallya et al. [26] investigated the effect of rotor misalignment on the static characteristics of water-lubricated radial bearings with axial grooves. Theoretical analysis revealed that rotor tilt influences the load-carrying capacity of the bearing and that horizontal and vertical misalignments affect the friction coefficient differently. Liu [27] proposed a high-precision air-bearing motion platform and method for wafer inspection, which enables active or passive compensation after detecting straightness and flatness errors of the air-bearing platform. The method is not limited to vertical straightness errors but can also be extended to the detection and compensation of horizontal straightness errors. Sun [28] proposed a method for predicting the rotational accuracy of aerostatic spindles based on the manufacturing errors of critical components, and combined it with the Monte Carlo method to determine the contribution of each component’s tolerance to the overall rotational accuracy. Zhang et al. [29] analyzed the effects of form and position errors on the load capacity and critical inertial force of pure aerostatic and hybrid gas spindles. The results showed that for aerostatic spindles, the critical inertial force increases while the load capacity decreases with increasing form and position errors, whereas for hybrid gas spindles, the trends are reversed.
However, most existing studies on the influence of manufacturing errors in bearing–rotor systems focus on the effects of circumferential errors under static conditions, while the effects of straightness errors remain insufficiently explored. Moreover, many simulation models in prior work adopt idealized mathematical functions to describe error profiles, which often fail to reflect the actual geometry of machined components. As a result, the deviation between modeled and real errors limits the accuracy and applicability of those simulation results to practical engineering problems.
To address these limitations, this study investigates the influence of straightness errors on the static characteristics of aerostatic spindles, by integrating actual measurement data into numerical simulations. A theoretical model considering the straightness errors of both radial and thrust bearing surfaces was developed, and rotors with different tolerance specifications were fabricated. Instead of relying on ideal assumptions, the real error profiles were measured and directly applied in the simulation, ensuring a realistic and quantitative analysis of error impact. An experimental setup was constructed to test the radial and axial load capacities of the aerostatic spindle assembled with these rotors. The comparison between simulation and experimental results validates the proposed model and highlights the critical role of straightness errors in spindle performance. This research provides a more practical and accurate approach for guiding the design and optimization of aerostatic bearing systems.
2. Establishment of the Force Model for an Aerostatic Spindle Considering Straightness Errors
2.1. Formulation of the Steady-State Reynolds Equation
Straightness errors in critical components directly affect both the thickness and distribution of the internal air film in the aerostatic spindle, as well as the mass distribution of the rotor assembly. Variations in air film thickness result in pressure changes within the flow field, thereby generating unbalanced air film forces and moments. In addition, non-uniform mass distribution of the rotor assembly causes the center of mass to deviate from the rotational axis, resulting in dynamic constraint forces. Accordingly, in this chapter, an extended Reynolds equation accounting for straightness errors is derived based on the three-dimensional Navier–Stokes equations and the finite difference method. A discrete formulation of the air film pressure is also presented. For the purpose of modeling and analysis, the following assumptions are made:
(1) The internal air film thickness of the aerostatic spindle studied and fabricated in this work is approximately 10 μm, which is significantly smaller than the dimensions of the radial and axial bearing surfaces (e.g., radius and length). The airflow within the spindle is assumed to be laminar, and variations in the air properties along the film thickness direction are neglected [30].
(2) The internal air channels of the aerostatic spindle are specially designed such that most of the exhausted air contributes to internal cooling. Additionally, the materials used for the spindle components exhibit good thermal conductivity. Therefore, the air within the spindle is assumed to be isothermal.
(3) The air viscosity is considered insensitive to pressure variations. Based on the isothermal assumption, the air viscosity within the spindle is treated as constant.
(4) The spindle operates under a condition of fixed eccentricity, meaning that axial displacement and tilt of the spindle axis during motion are not considered.
Based on the above assumptions, each infinitesimal element in the flow field satisfies the three conservation laws, and the force balance in the x-direction is given by
Mass conservation is also satisfied, where the mass flowing out of the infinitesimal element per unit time equals the rate of change in mass within the element. The continuity equation of the air is thus given by
Since the air density, denoted as ρ, does not vary with time, where
Meanwhile, the air also satisfies the state equation:
The Reynolds equation for calculating air pressure can be obtained as follows:
The mass flow rate of air through a single orifice is given by Equation (6):
where is the supply pressure, is the area of the orifice, and can be obtained from Equation (7).
where , is the critical pressure ratio, k is the adiabatic index, and is the flow coefficient.
2.2. Fluid Mechanics Modeling of the Radial Surface Considering Straightness Errors
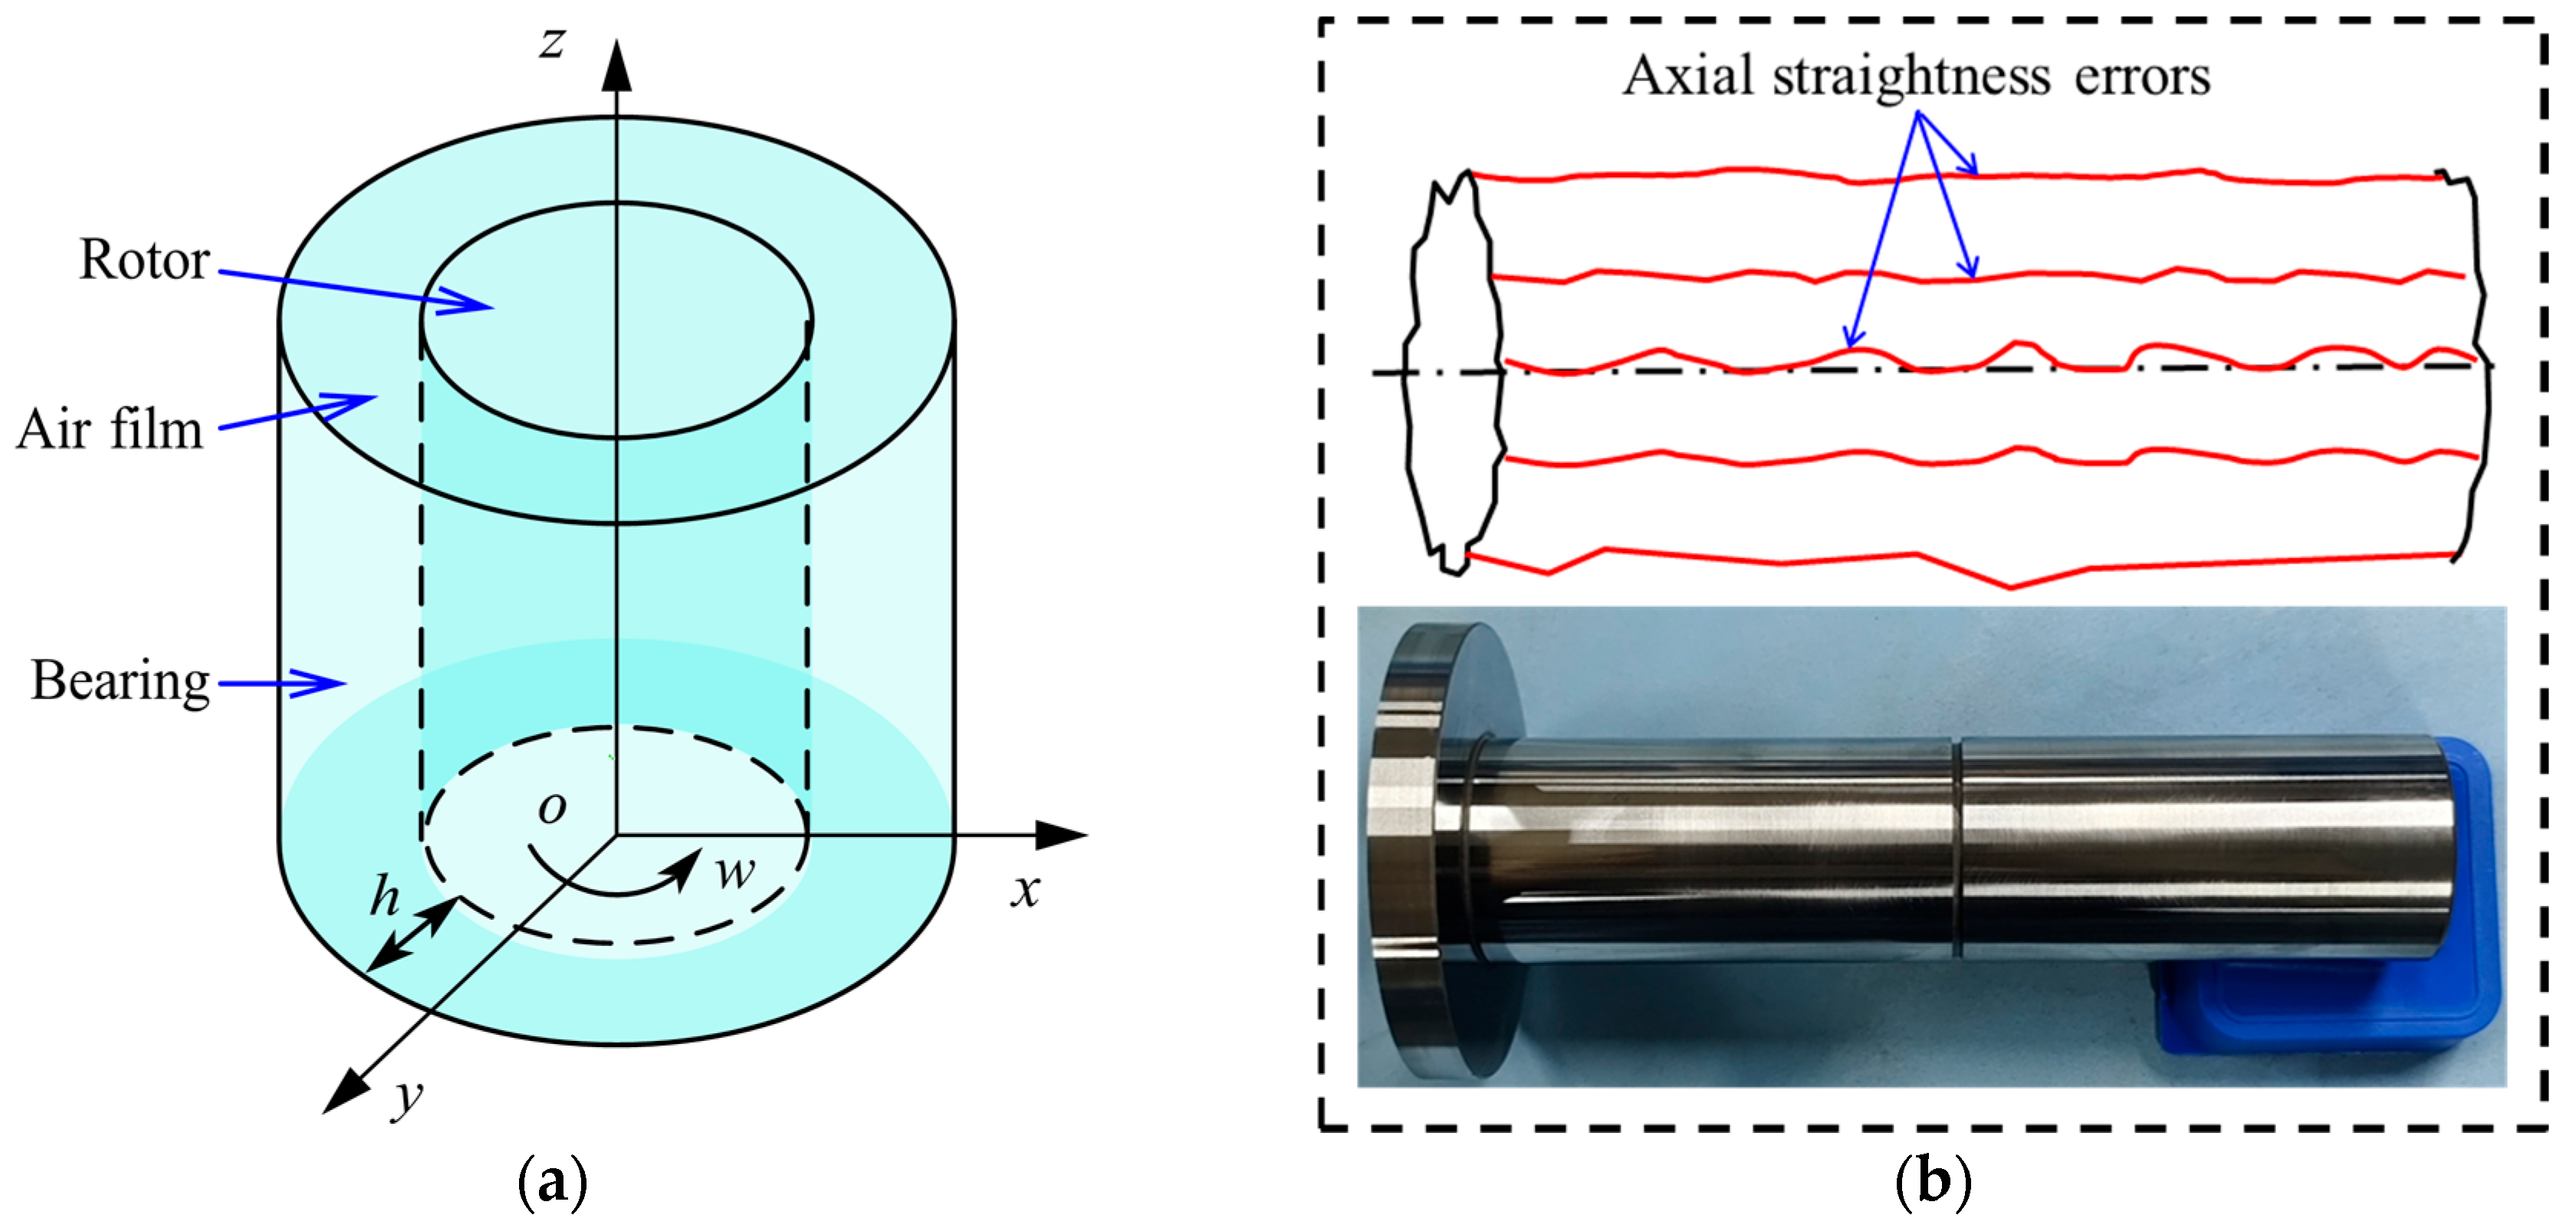
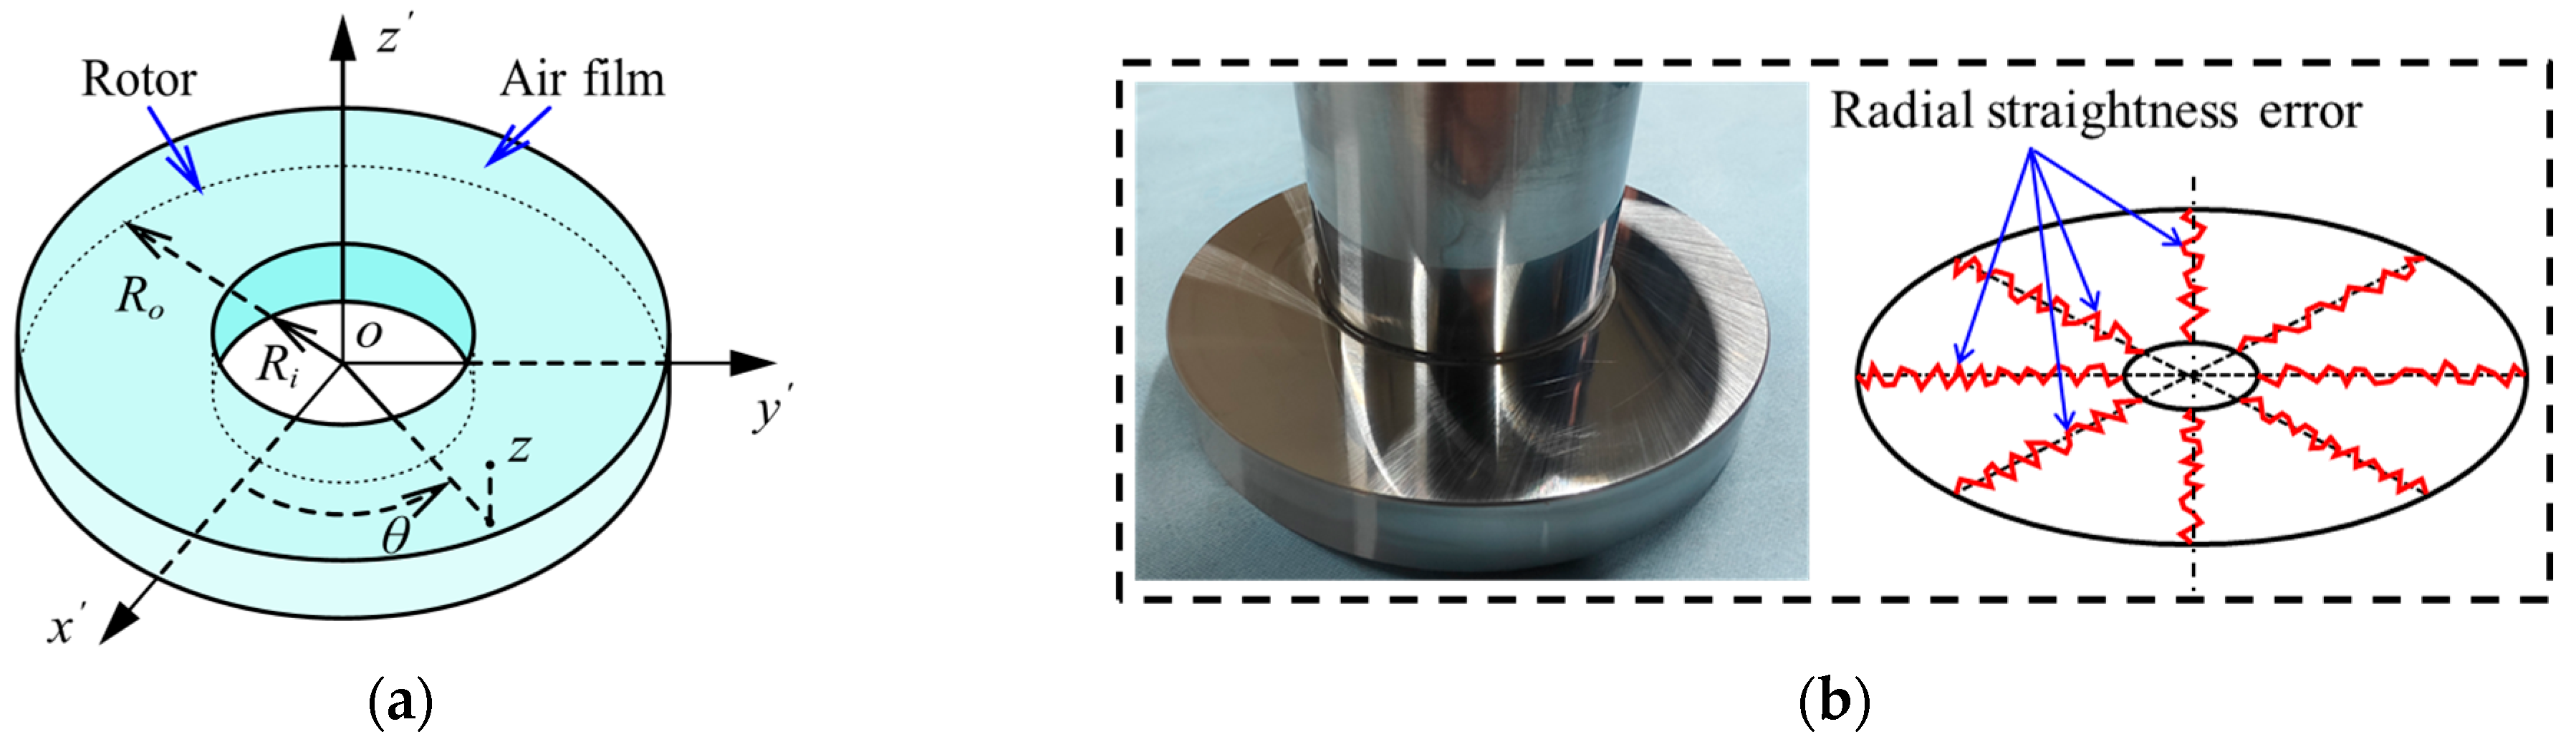
The ideal model of the aerostatic spindle and bushing in cylindrical coordinates is shown in Figure 1a. However, when considering actual manufacturing errors, axial straightness deviations exist on the rotor surface, as illustrated in Figure 1b. The first-order approximate Reynolds equation that incorporates straightness errors but assumes steady-state conditions is given in Equation (8) [31]:

Figure 1.
Schematic Diagram of the Radial Working Surface. (a) Ideal air film. (b) Working surface with straightness errors.
Based on the ideal air assumption, the air density term in Equation (8) can be converted into a pressure term using Equation (9):
where U is the tangential velocity of the radial bearing surface, and ρatm and patm represent the density and pressure of the ideal air under standard atmospheric conditions, respectively.
The radial bearing surface, composed of the radial bearing and rotor, consists of a pair of cylindrical surfaces whose profiles can be categorized into axial and circumferential profiles. These profiles primarily affect the radial load capacity and stiffness of the aerostatic spindle. Figure 2 illustrates the axial profile manufacturing errors, which are characterized by straightness deviation. These shape errors cause the radial working surface profiles of the bearing and rotor to deviate from the ideal contour, thereby affecting the uniformity of the air film thickness distribution. Dimensional errors in the inner diameter of the bearing and the outer diameter of the rotor lead to deviations of the average air film thickness from the design value.
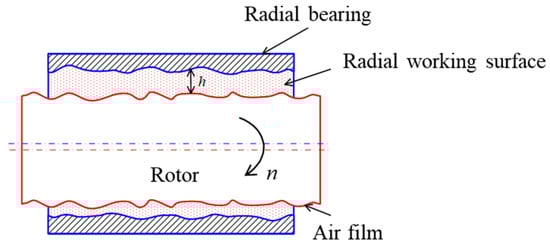
Figure 2.
Axial structural diagram of the radial bearing-rotor considering straightness errors.
Based on a spatial coordinate system established at the center of the bearing, if the geometric data of the bearing and rotor working surfaces are known, the air film thickness within the radial working surface can be defined as
Here, j_bz and j_sz represent the coordinates of the bearing and rotor at the axial position z on the radial working surface, respectively, and ez is the eccentricity coordinate of the rotor. It can thus be concluded that, when neglecting factors such as thermal deformation and rotor centrifugal expansion, straightness errors are the decisive factor in determining the air film thickness within the radial working surface.
By nondimensionalizing Equation (8) and incorporating the air inflow term, the resulting expression can be written as
where
The dimensionless parameters used are [32]
where R is the radius of the radial bearing, L is the length of the bearing, C is the nominal single-sided radial clearance between the rotor and the bearing, and Vin is the initial velocity of air entering the air film gap through the orifice.
Equation (11) is discretized using the second-order finite difference method. Since the fluid pressure inside the aerostatic spindle is generally positive, the air film pressure at all nodes within the radial working surface can thus be calculated.
where
The radial load capacity of the working surface is obtained by summing the pressures at each node:
where Srotor is the area corresponding to each node.
2.3. Fluid Mechanics Modeling of the Thrust Surface Considering Straightness Error
Figure 3a illustrates a schematic diagram of the thrust bearing surface represented using both a Cartesian coordinate system (ox’y’z’) and a cylindrical-polar coordinate system (r, θ, z). Directions z’ and z correspond to the air film thickness, while Ri and Ro denote the inner and outer diameters of the bearing, respectively. It can be observed that the cylindrical-polar coordinate system better reflects the structural characteristics of the thrust surface and maintains consistency with the representation used for the radial bearing surface. Figure 3b shows the radial straightness errors of the actual rotor thrust surface.

Figure 3.
Schematic diagram of the spindle thrust working surface. (a) Ideal thrust working surface. (b) Working surface with straightness errors.
With the z-axis aligned along the air film direction, and using h to represent the film thickness, the Reynolds equation for the thrust surface considering manufacturing errors can be derived, based on the method proposed by Pinkus and Lund, as follows [33]:
For an ideal air, by substituting for and incorporating the air inflow term, Equation (15) is modified as follows:
Here, Vin represents the velocity of air entering through the restrictor orifice.
Unlike radial working surfaces, ideal thrust working surfaces consist of paired parallel annular planes, thus their manufacturing errors can be quantified through flatness measurements. As shown in the partial axial schematic of a thrust bearing-rotor assembly with manufacturing errors (Figure 4), geometric form errors induce deviations of thrust surface profiles from ideal configurations, compromising the uniformity of air film thickness distribution between the bearing and rotor. Concurrently, dimensional errors systematically shift the average air film thickness away from designed specifications.
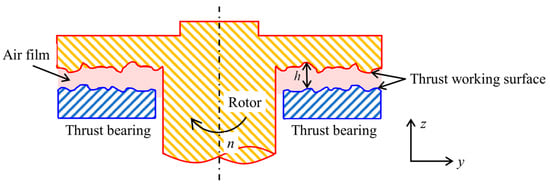
Figure 4.
Structural diagram of the thrust bearing-rotor considering straightness errors.
If the geometric data of the mating surfaces of the thrust bearing and the rotor are known, the air film thickness at any position within the thrust surface can be defined as
where t_bz(r) and t_sz(r) are the z-axis coordinates of the bearing and rotor radial profiles at radius r, respectively, and h0 is the average air film thickness.
We use dimensionless parameters as follows:
The dimensionless form of Equation (16) is given by
After discretizing Equation (18), a unique solution can be obtained as
where
Thus, by integrating the pressure over the entire thrust surface, the load-carrying capacity W can be obtained as
In the equation, ra represents the outer radius of the bearing, and r0 denotes the inner radius.
3. Measurement and Testing Equipment
3.1. Measurement Equipment
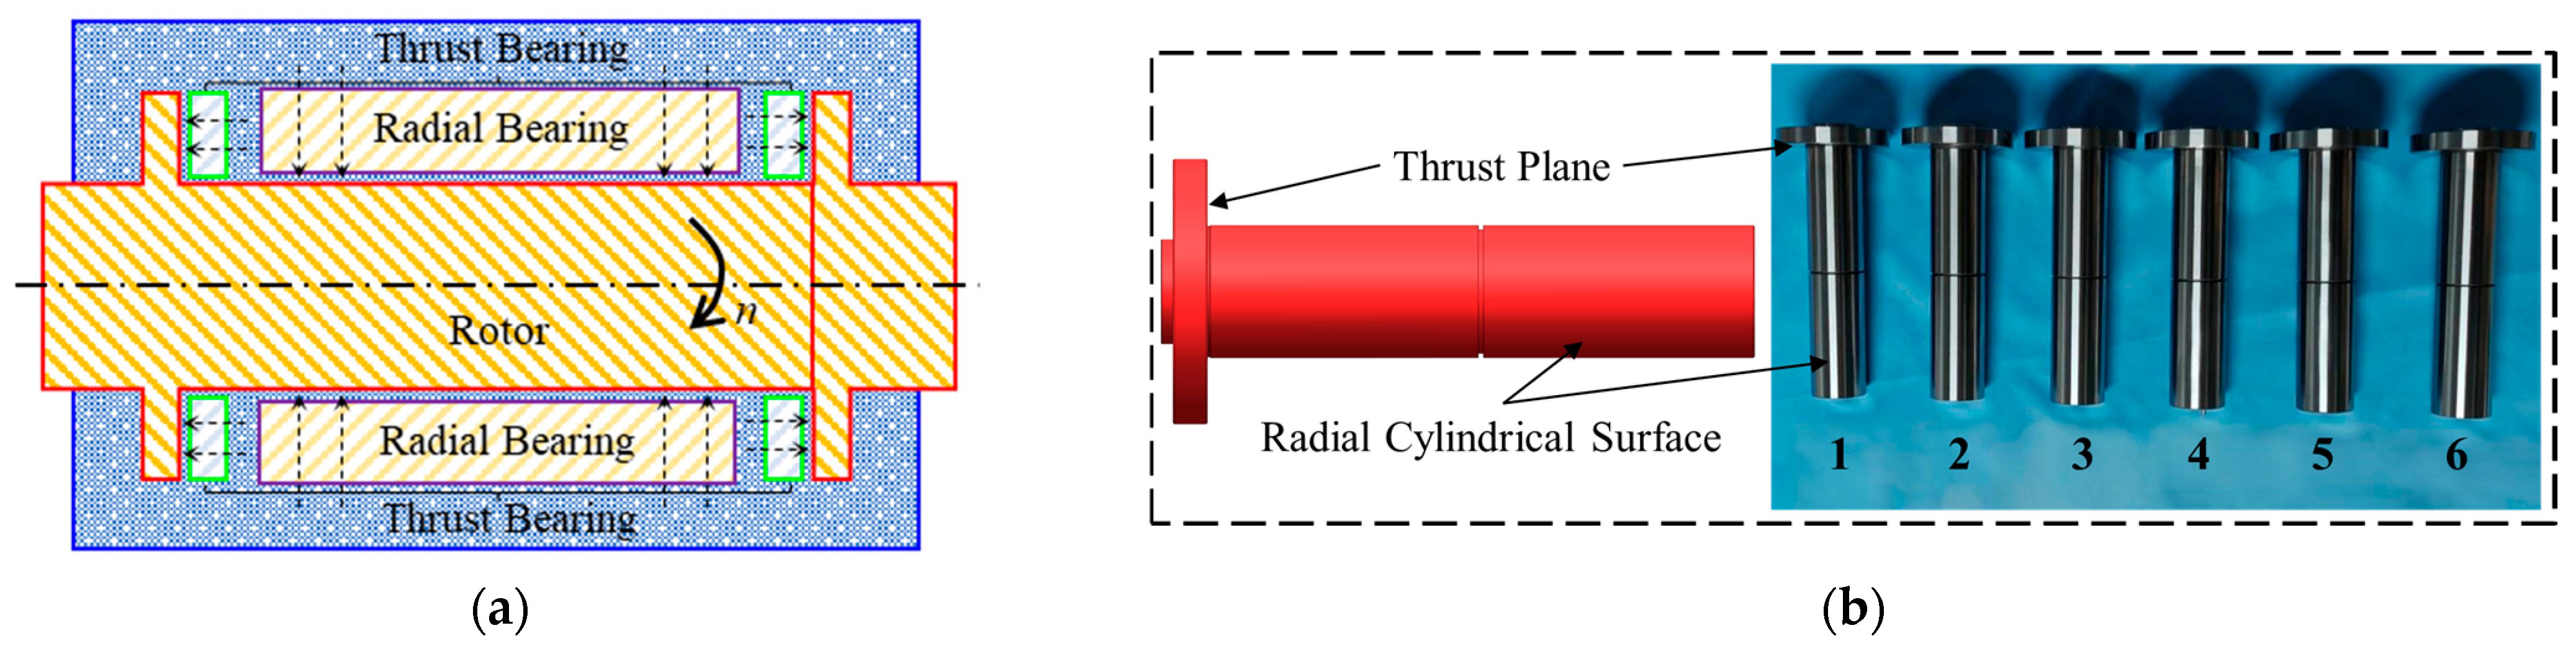
High-precision aerostatic spindles typically adopt an “H”-shaped structural configuration, with thrust bearings symmetrically positioned on both sides of the rotor, as shown in Figure 5. In this design, the parallelism between the thrust bearing surfaces and the axial air film gap can be more easily controlled with high precision through assembly techniques. As a result, this type of spindle exhibits superior overall performance and is widely used in high-speed, high-precision machining applications such as optical component grinding and precision mold finishing. The manufacturing errors of aerostatic spindles originate from both machining and assembly inaccuracies. The manufacturing errors of aerostatic spindles originate from machining and assembly inaccuracies of their components. Due to the limitations of current manufacturing technology, the dimensional errors of key components are typically on the micrometer scale, which is comparable to the thickness of the air film. As a result, these manufacturing errors can significantly affect the air film thickness distribution and consequently influence the static and dynamic performance of the spindle.
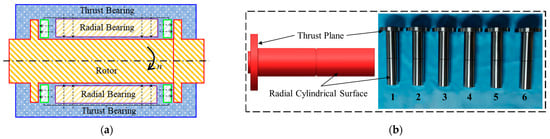
Figure 5.
Schematic diagram of the “H”-shaped spindle. (a) “H”-shaped spindle structure. (b) Schematic diagram of measurement positions.
Different types of manufacturing errors have different impacts on the aerostatic spindle, with the most direct effects being the uniformity of the air film thickness and distribution, as well as the unbalanced mass of the rotor. Based on the location where the manufacturing errors affect the uniformity of the air film thickness and distribution, the critical manufacturing errors in the bearing and rotor assembly can be categorized into two types: paired radial working surface errors and thrust working surface errors. Each working surface pair consists of the mating surfaces of the bearing and the rotor. To further investigate the influence of straightness errors on the static and dynamic characteristics of the aerostatic spindle, six shafts were fabricated with identical parameters except for differences in straightness tolerance. The mating dimensions of the radial and thrust working surfaces were then measured. The key technical specifications of the roundness measuring instrument are shown in Table 1. To ensure measurement accuracy, the instrument is calibrated using standard cylinders and rings in accordance with established procedures.

Table 1.
Key technical specifications of the cylindricity measuring instrument.
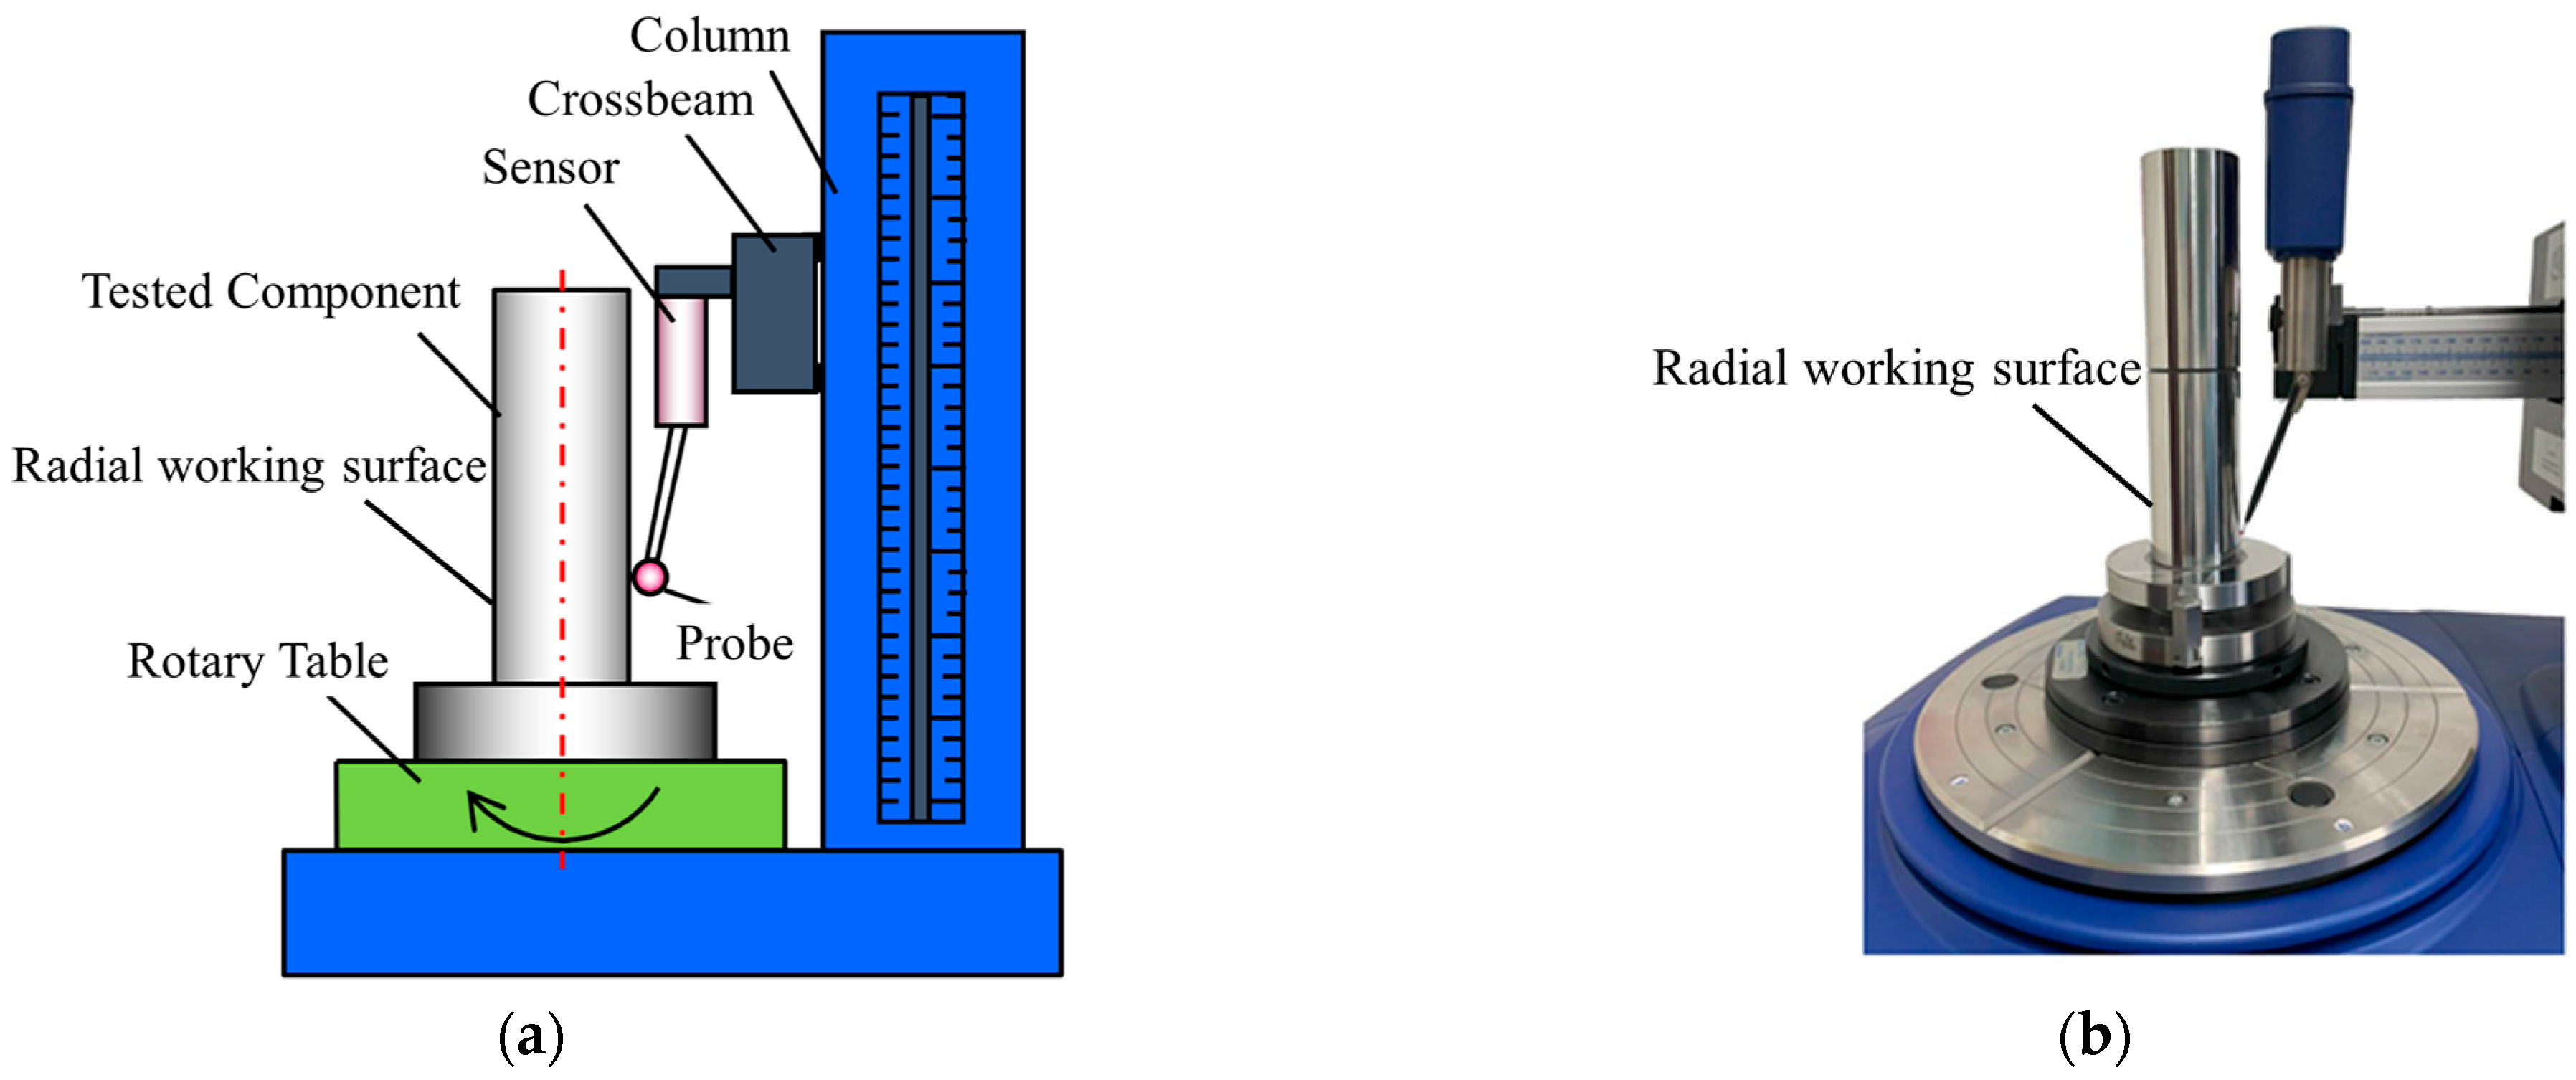
Figure 6 shows the equipment used for measuring the axial straightness errors of the rotor’s radial working surface with a roundness measuring instrument. The axial straightness error of the radial working surface was measured for each of the six rotors. First, the turntable was leveled, and the probe was positioned; then, the turntable was locked, and the sensor probe was moved upward by the column while collecting data. Due to the presence of an exhaust groove in the middle of the radial working surface, the measurement was divided into two sections: from 0 to 95 mm and from 105 to 200 mm in height, covering a total length of 200 mm, containing 300 data points.

Figure 6.
Measurement equipment for the radial working surface of the rotor. (a) Schematic. (b) Photograph.
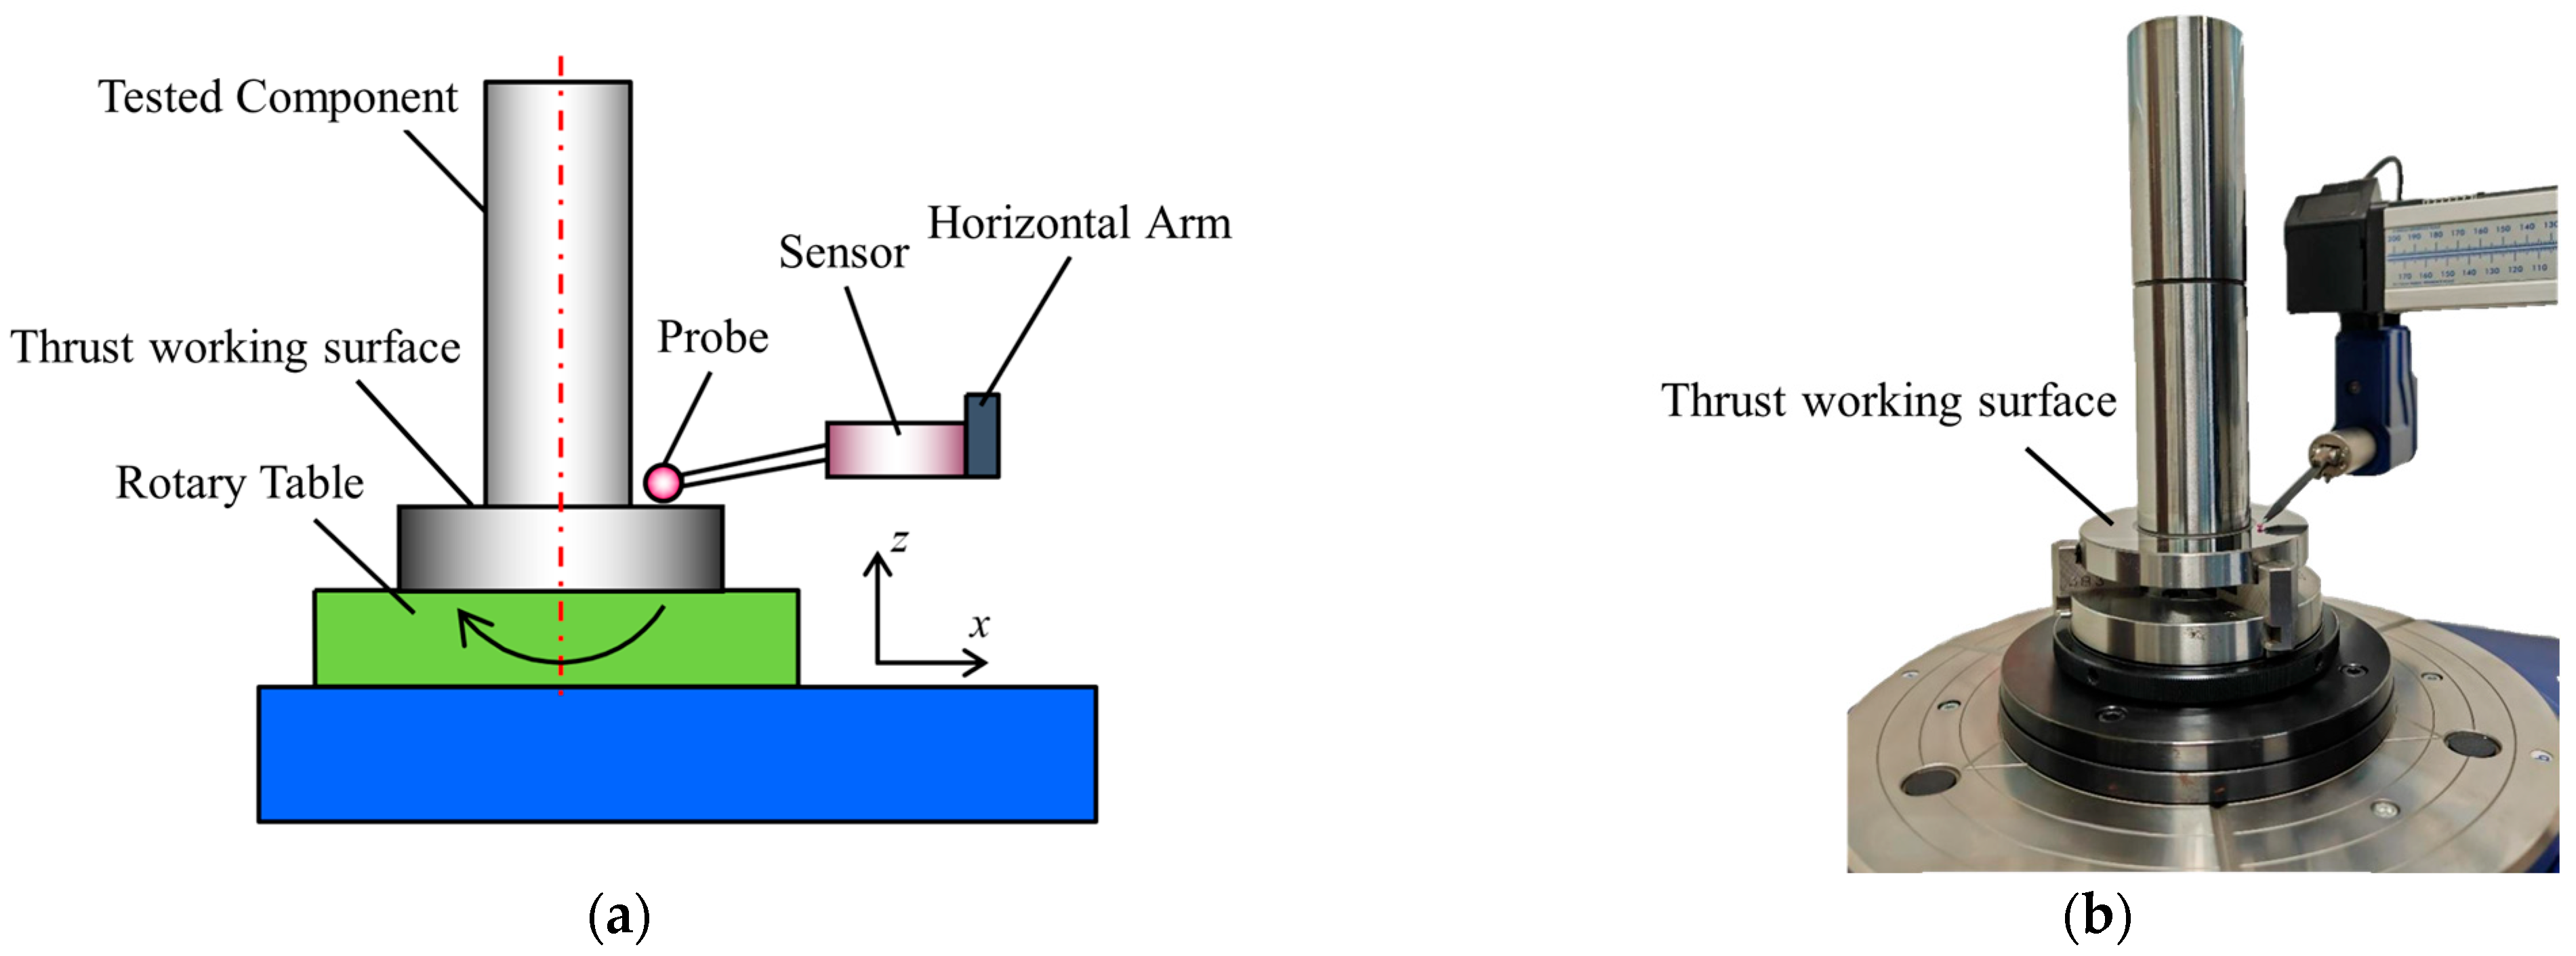
Figure 7 shows the equipment used for measuring the straightness errors of the rotor’s thrust working surface with a roundness measuring instrument. During the measurement, the turntable was first leveled, and the probe was positioned; then, the turntable was locked, and the sensor was moved in the positive x-direction by the horizontal arm while collecting data. The straightness errors of the thrust working surface were measured for each of the six rotors within a radial range of 30–45 mm, covering a total length of 15 mm. One measurement contains 300 data points.
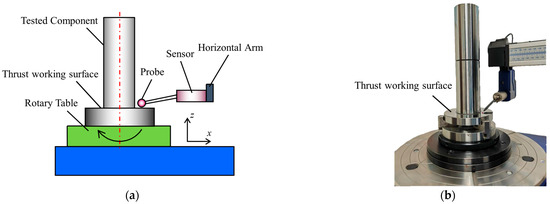
Figure 7.
Measurement equipment for the thrust working surface of the rotor. (a) Schematic. (b) Photograph.
3.2. Experiment Equipment
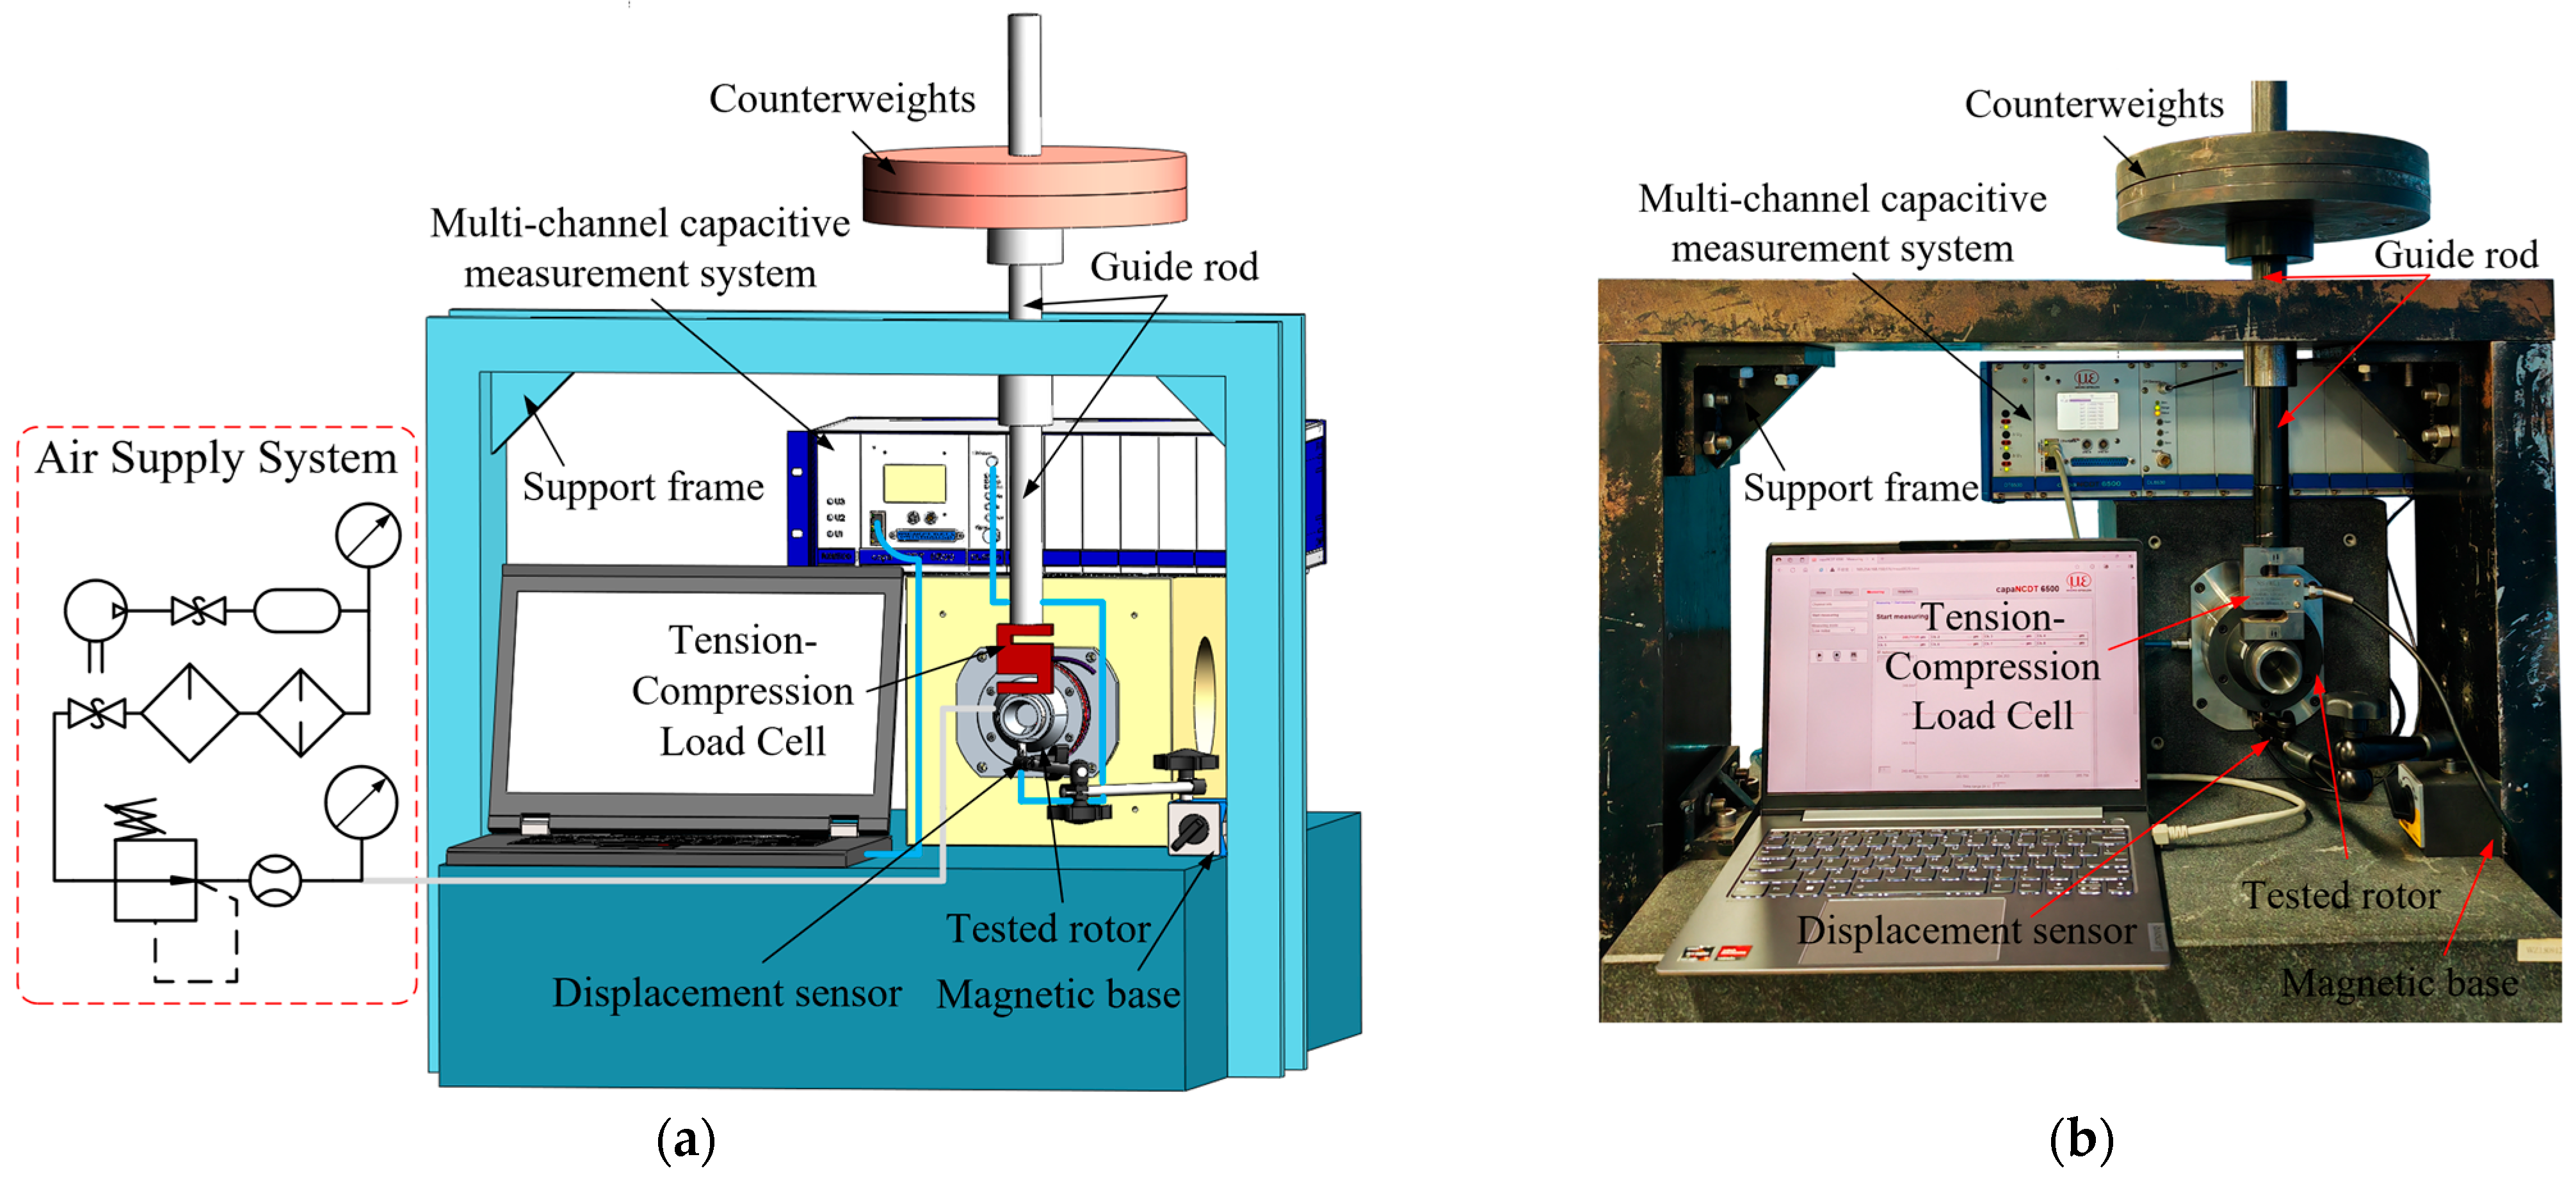
To validate the simulation results, a static load capacity test system for the aerostatic spindle was constructed to measure its radial and axial load capacities. Figure 8 shows the experiment equipment of the system used for radial load capacity testing, while Figure 9 presents the configuration used for axial load capacity testing. Each of the six rotors was sequentially installed into the spindle system, along with the assembly of bearings, motor, and other components. The motor used was a Kollmorgen KBMS-17H01 frameless motor (This device is a KBMS-17H01 frameless motor from Kollmorgen (USA), assembled at its factory in Tianjin, China), with a rated speed of 9600 r/min.

Figure 8.
Configuration of the radial load capacity test system. (a) Schematic. (b) Photograph.
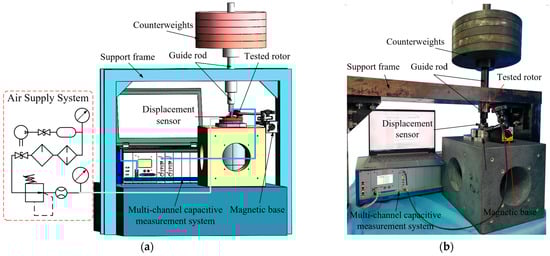
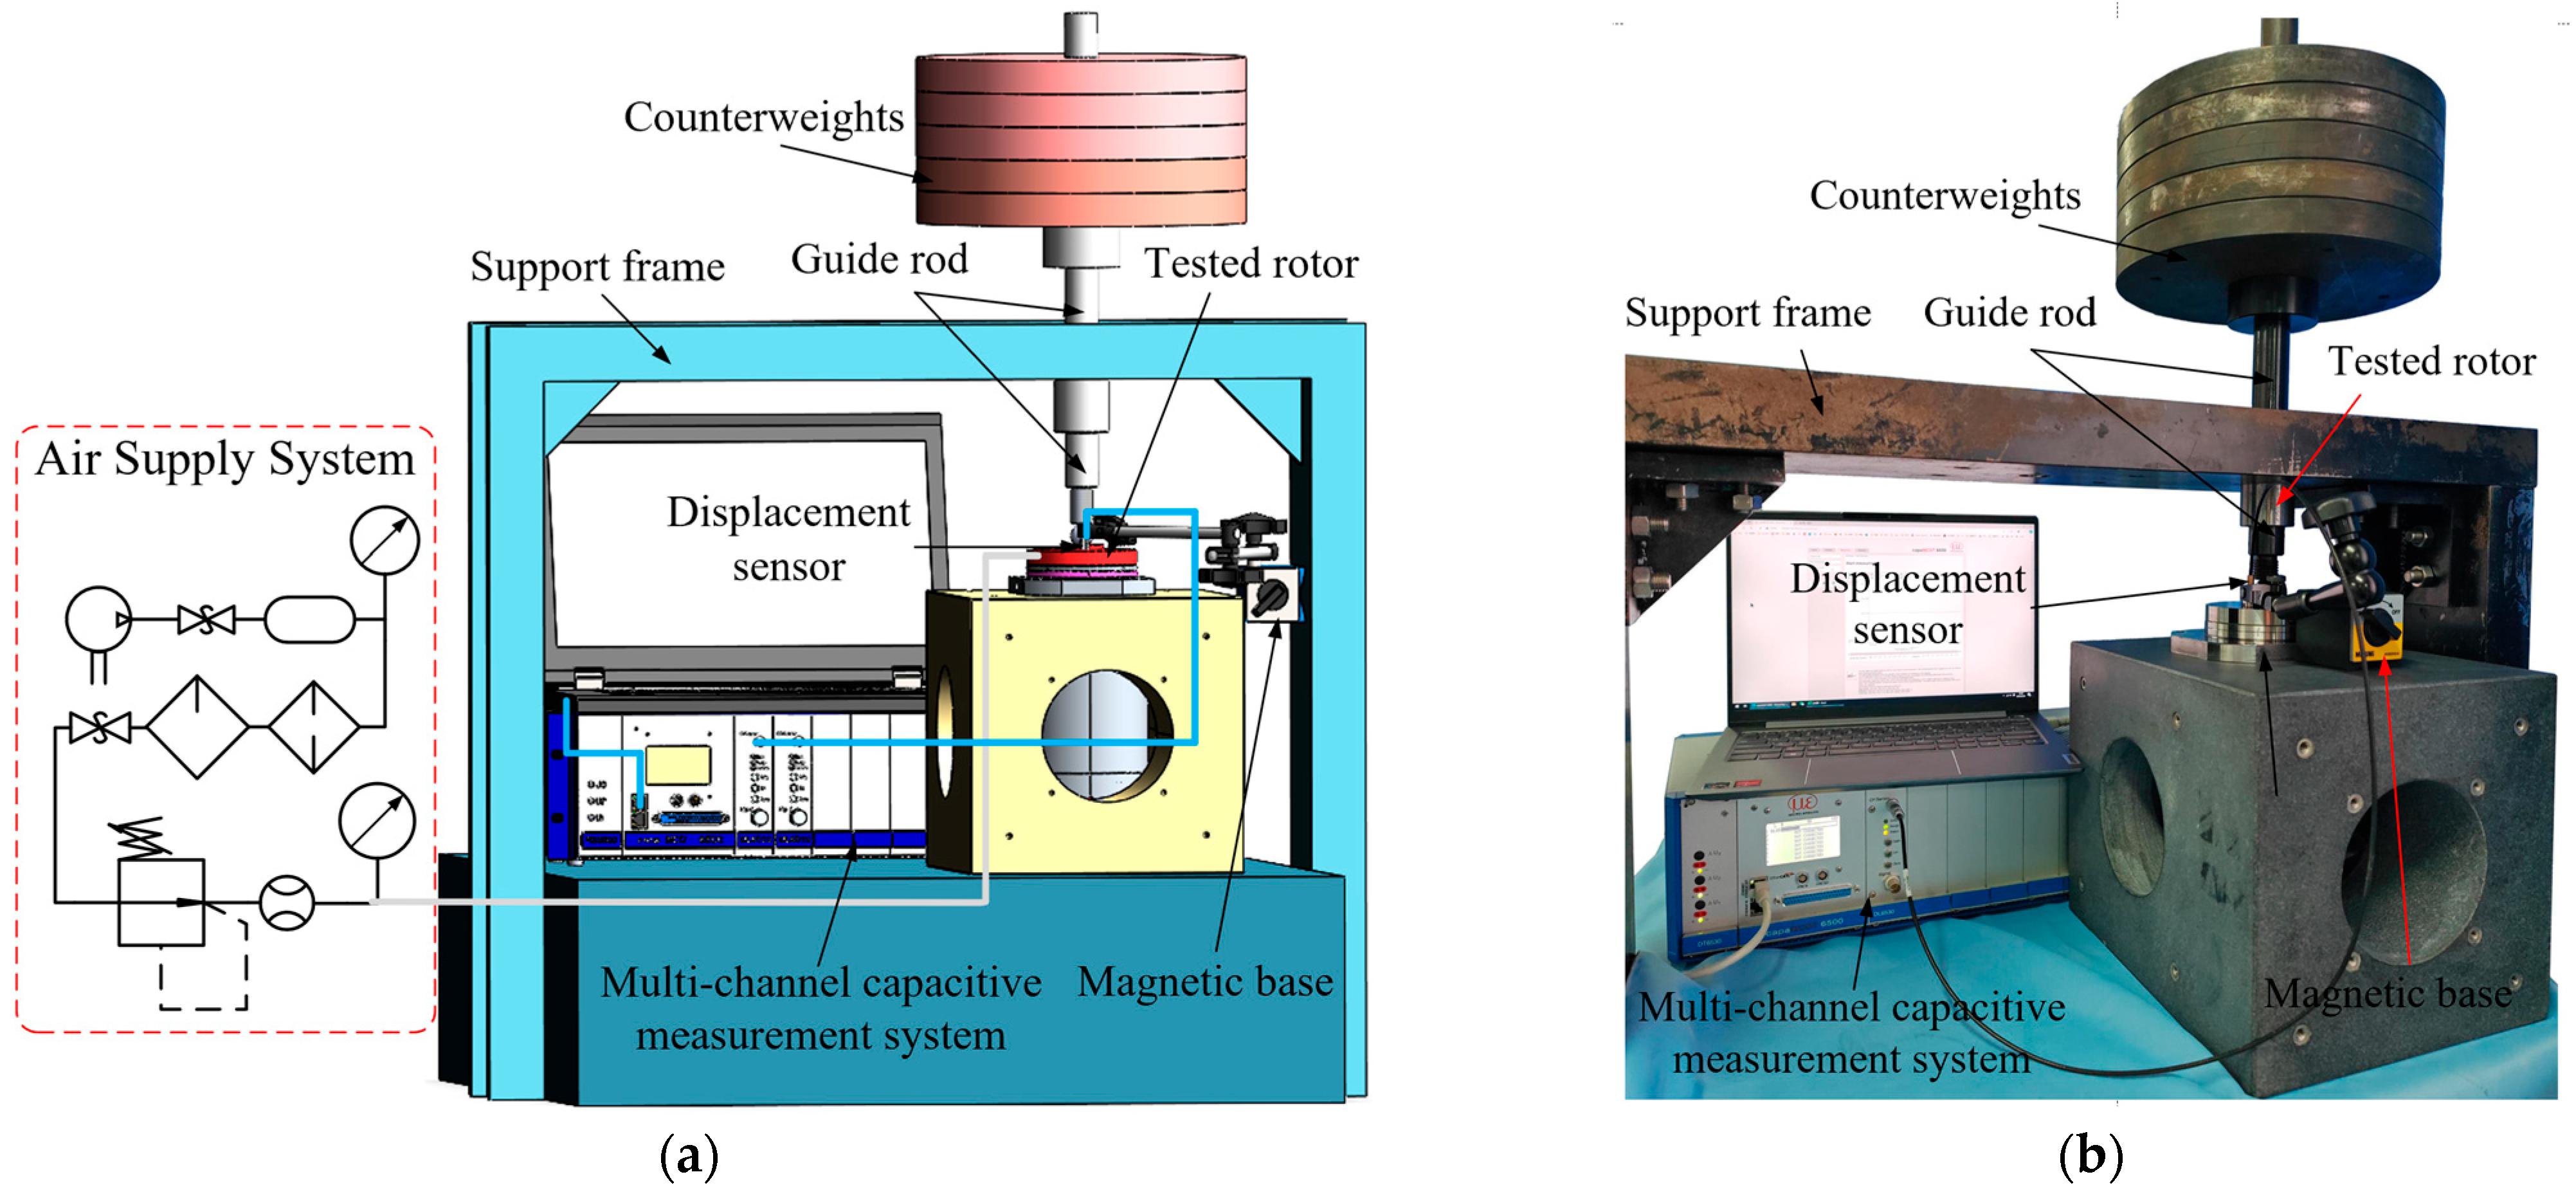
Figure 9.
Configuration of the axial load capacity test system. (a) Schematic. (b) Photograph.
Figure 8 and Figure 9 each include two subfigures: (a) is a schematic model of the static load capacity test system for the aerostatic spindle, and (b) is a photograph of the physical test bench. Table 2 lists the main equipment used in the experimental setup.
Table 2.
Key technical specifications of the cylindricity experiment equipment.
The entire test system consists of three main components: the spindle unit, the loading unit, and the measurement unit. The spindle unit comprises the spindle body and a mounting base. For radial load capacity testing, the spindle unit is installed horizontally, and the rotor chuck is in contact with the force sensor at the end of the guide rod. For axial load capacity testing, the spindle unit is installed vertically, and the loading head at the end of the guide rod is connected to the axial working surface via a centering steel ball. The loading unit consists of a support frame, a guide rod, and counterweights. The guide rod is fixed to the support frame via an axial sliding sleeve, and the counterweights are placed on the upper end of the guide rod to apply load to the spindle unit through the rod. The measurement unit includes systems for load measurement, displacement measurement, and air consumption measurement. By increasing or decreasing the counterweights on the guide rod, varying loads can be applied radially or axially to the aerostatic spindle. The computer connects to the capacitive multi-channel system via Ethernet to configure sensor parameters and acquire data. Displacement sensors are used to measure the variation in air film thickness in the loading direction, which is then used to determine the relationship between load capacity and air film thickness. At the back end of the test system, the air supply unit includes a filtration system, a pressure regulator, and a flow meter, which are used to filter air, adjust the supply pressure, and measure the air consumption of the spindle.
Based on the actual performance and operating conditions of the aerostatic spindle, four supply pressure levels were set: 0.40, 0.45, 0.50, and 0.55 MPa. A total of eleven loading states were used: 0, 5, 10, 15, 20, 25, 30, 35, 40, 45, and 50 kg. During the entire test process, all loading conditions were tested under each supply pressure, and both displacement and flow rate data were recorded. For radial load capacity measurements, the equipment shown in Figure 8 was used. First, under an open air supply, the load was applied to the maximum level. The air supply was then shut off, and after the system stabilized, the displacement sensor reading was recorded as the zero reference. Next, the pressure regulator was used to set the spindle’s air supply pressure to the target value. Subsequently, counterweights were removed one by one from the guide rod to apply different loads, while simultaneously recording displacement and flow rate data. After completing tests for one pressure level, the supply pressure was adjusted to the next value, and the entire procedure was repeated until tests at all pressure levels were completed. For axial load capacity measurements, the equipment shown in Figure 9 was used. Due to spatial constraints, a tension-compression sensor was not installed at the end of the guide rod. However, since the test employed quantitatively controlled loading, and both the testing procedure and loading parameters were the same as those for the radial measurements, the absence of the force sensor did not affect the accuracy of the test results.
4. Effect of Straightness Errors on the Static Characteristics of the Aerostatic Spindle
4.1. Simulation Analysis of the Effect of Straightness Errors on Load Capacity
4.1.1. Effect of Straightness Errors on Radial Surface Load Capacity
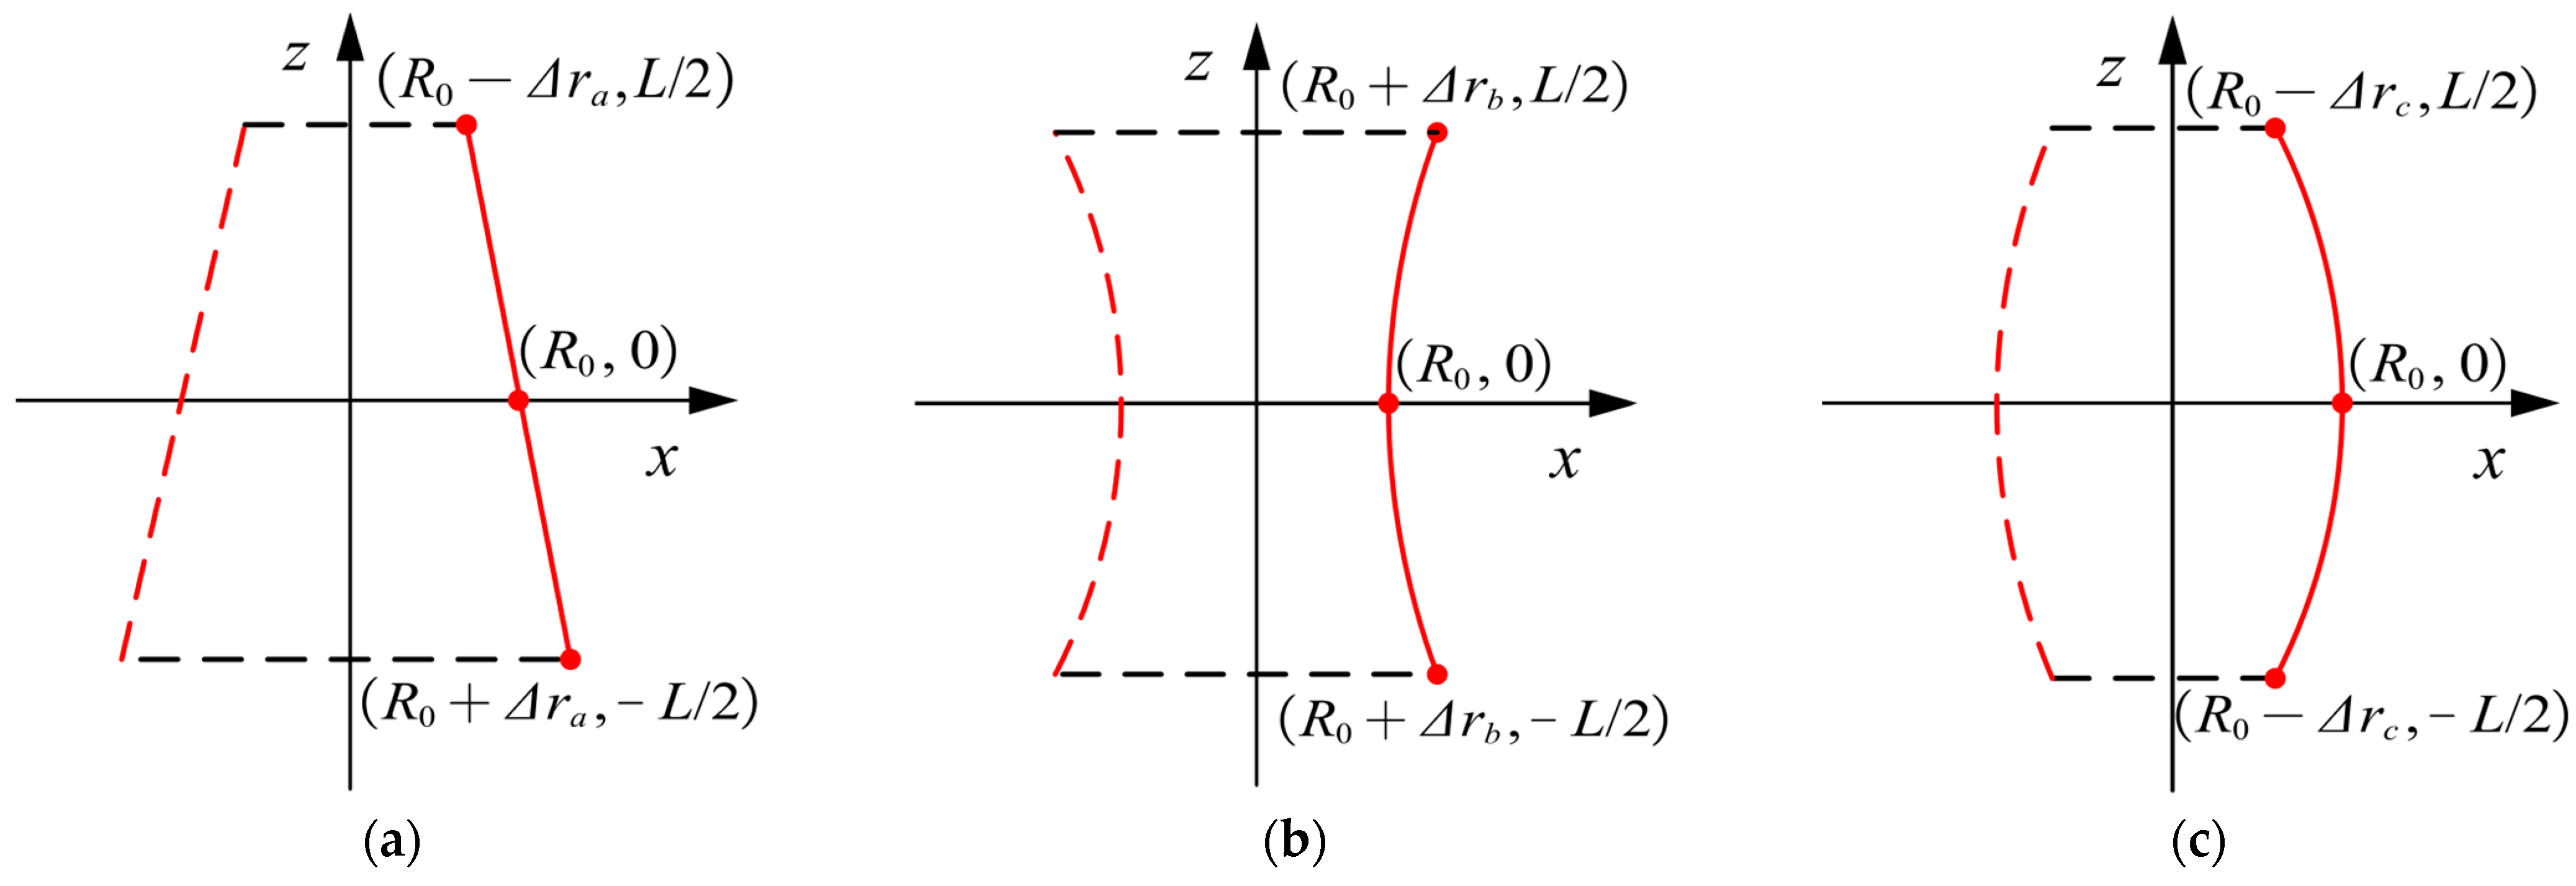
According to the R10 preferred number series [34] and the actual machining accuracy of the aerostatic spindle rotor, four roundness error reference values were selected: 0.63, 0.80, 1.00, and 1.25. There are three commonly used ideal straightness errors models: taper, barrel-shape, and drum-shape [9]. These geometries can be represented by line segments or circular arcs, and are referred to as the characteristic lines of ideal straightness errors. Figure 10 and Equation (21) illustrate the definitions and governing equations of these characteristic lines, respectively.
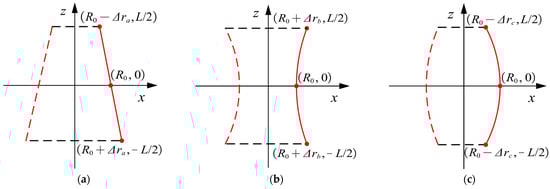
Figure 10.
Illustration of characteristic line definition for ideal axial straightness errors. (a) Taper-shape. (b) Barrel-shape. (c) Drum-shape.
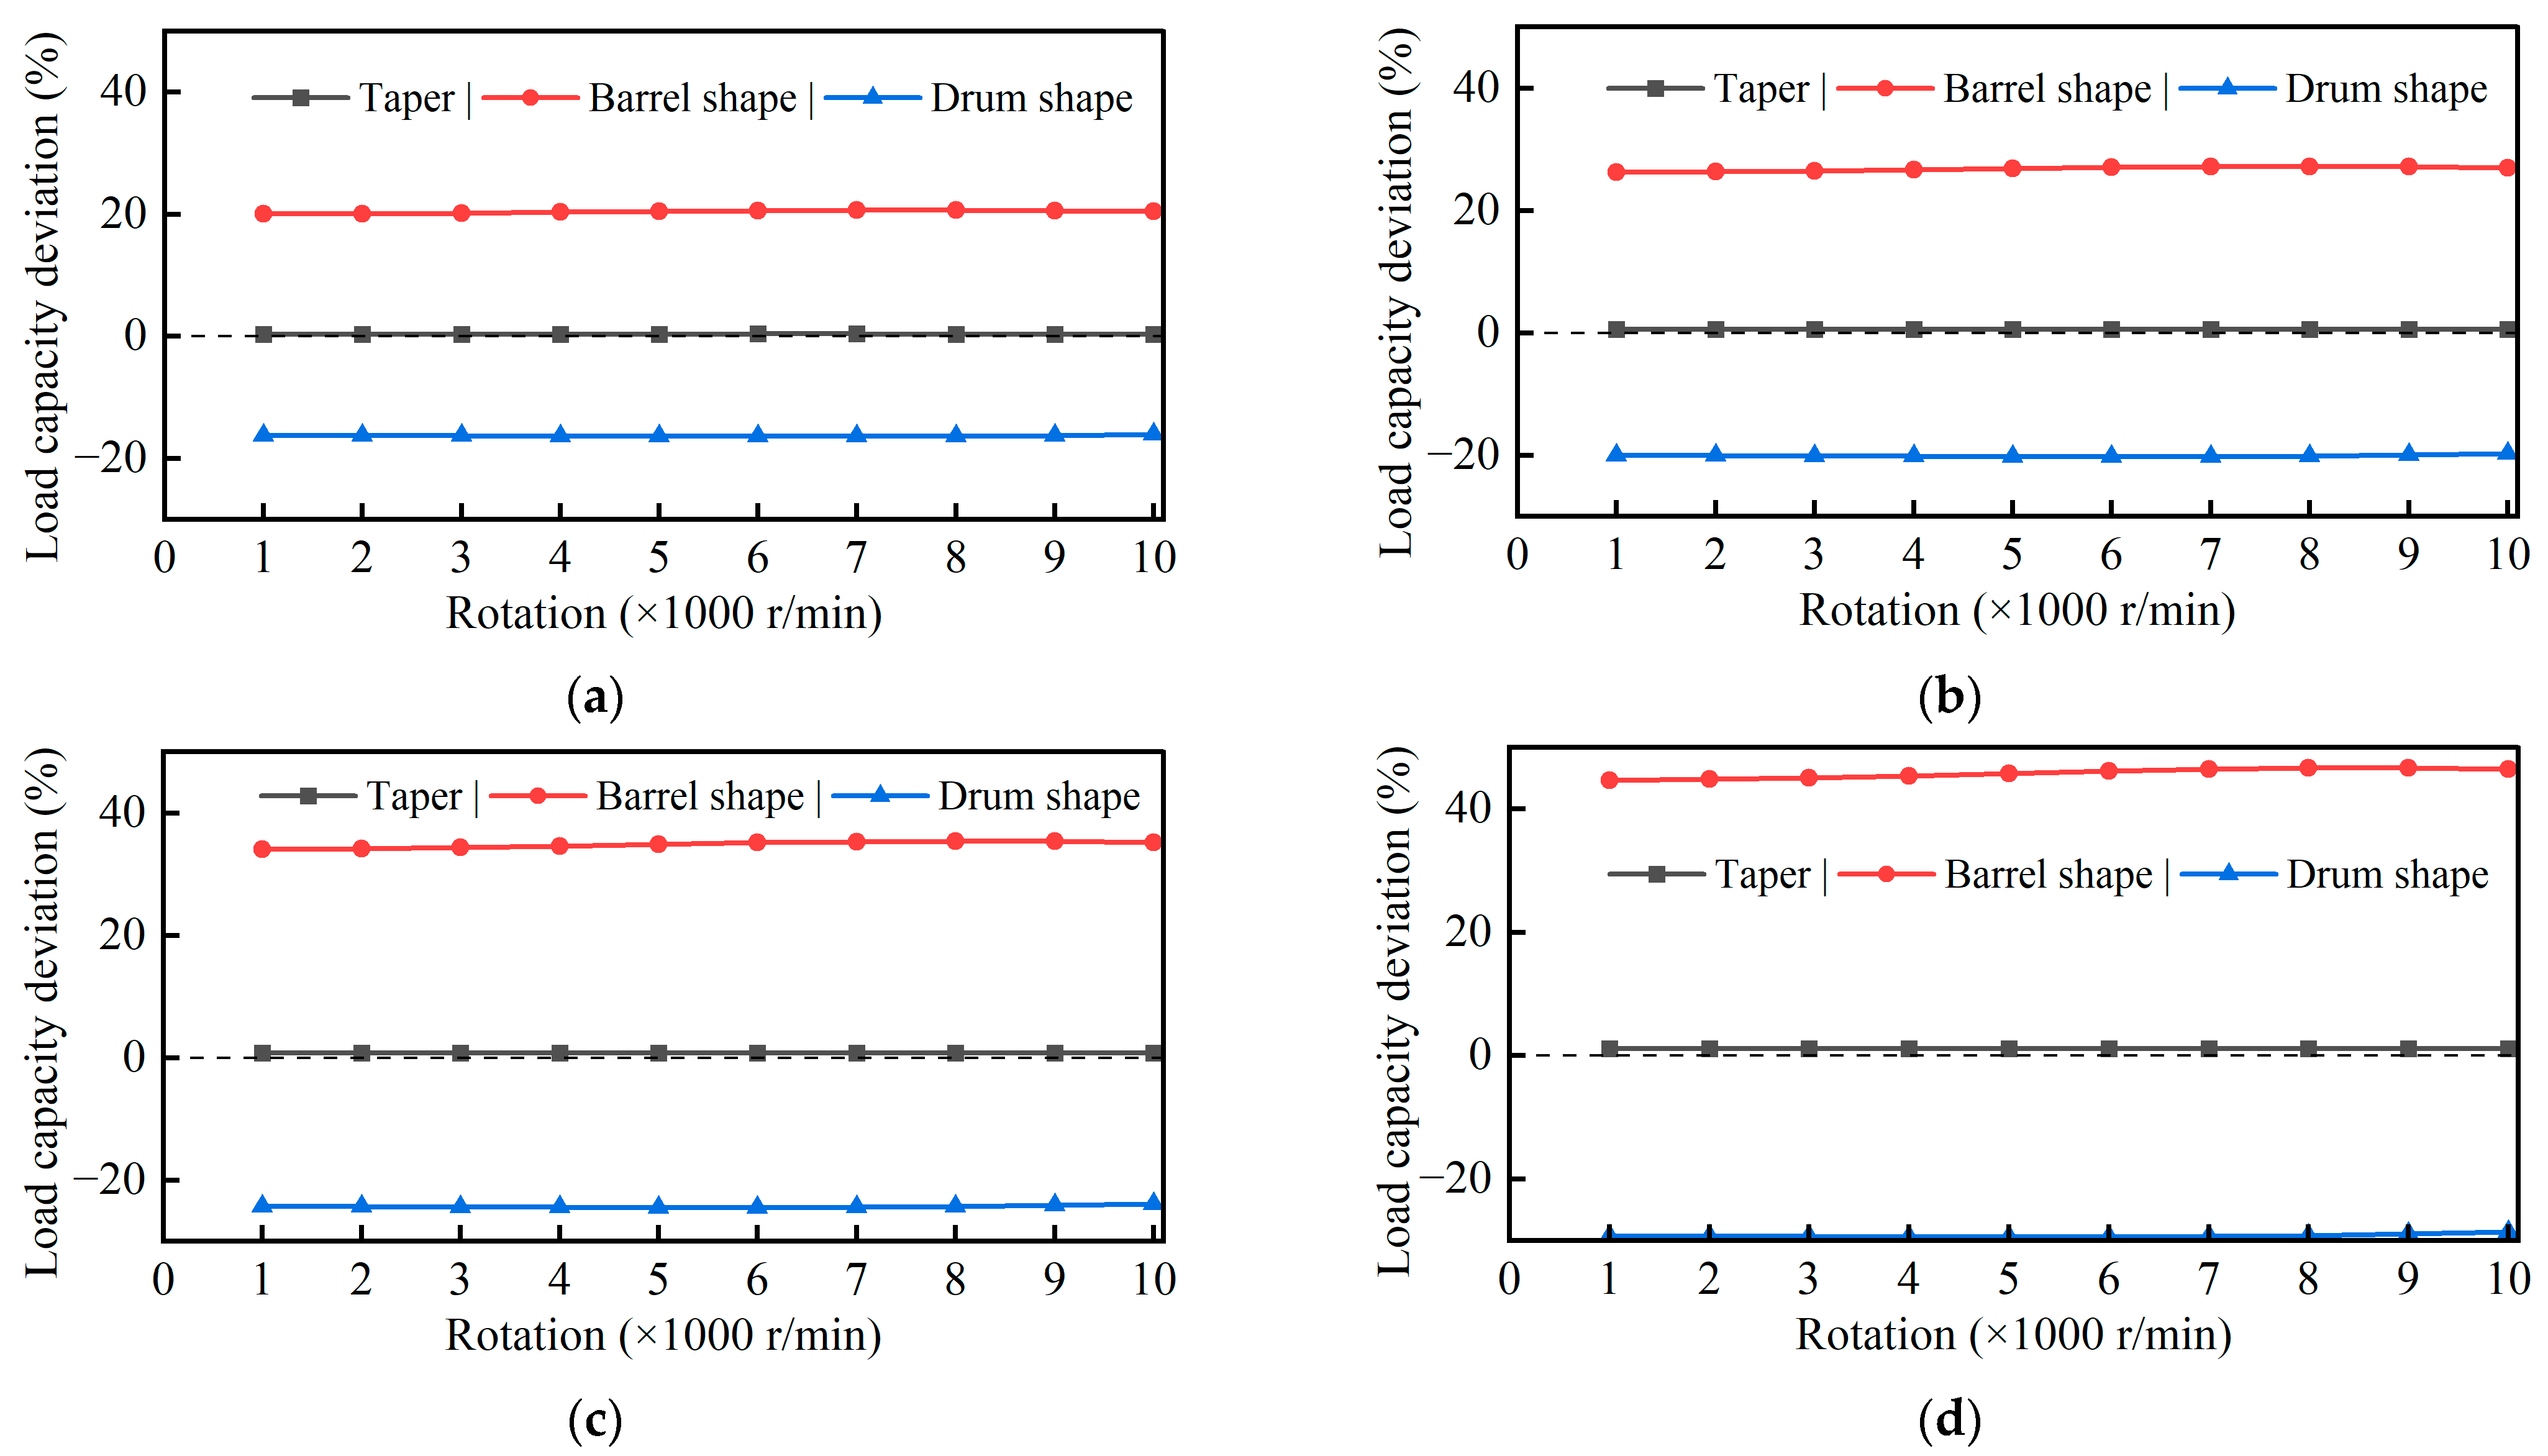
Here, R0 and L are the nominal radius and length of the radial bearing or rotor, and z∈[−L/2, L/2], 2Δra, Δrb, and Δrc are the corresponding straightness error values. Figure 11 shows the deviation in the average bearing capacity of the rotor compared to the ideal rotor at different rotational speeds, considering only the axial straightness errors of the radial working surface. In each subfigure, a horizontal reference line is added at the “0” value of the vertical axis, which represents the bearing capacity baseline of the ideal rotor at different rotational speeds.
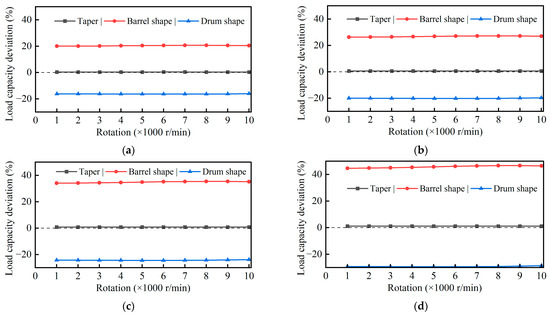
Figure 11.
Effect of different straightness error values on the load capacity of rotor radial working face. (a) Straightness error value: 0.63 μm. (b) Straightness error value: 0.80 μm. (c) Straightness error value: 1.00 μm. (d) Straightness error value: 1.25 μm.
It can be observed that as the rotational speed increases, the bearing capacity deviation of the tapered, barrel-shape, and drum-shape rotors shows no significant change compared to the ideal rotor. The tapered rotor consistently exhibits a very small deviation in bearing capacity (less than 2%) compared to the ideal rotor. The barrel-shape rotor shows lower bearing capacity than the ideal rotor, and the deviation increases with the magnitude of the straightness error, reaching a maximum deviation of −30%. In contrast, the drum-shape rotor demonstrates higher bearing capacity than the ideal rotor, and the deviation also increases with the straightness error, with the maximum deviation approaching 50%. When a drum-shape rotor is installed inside the radial bearing, the air film is thicker in the middle and thinner at the ends, resulting in an “air-converging” effect, which leads to higher bearing capacity. In practical applications, the bearing capacity can be improved by controlling the rotor’s axial profile. However, this approach poses significant manufacturing challenges.
4.1.2. Effect of Straightness Error on Thrust Surface Load Capacity
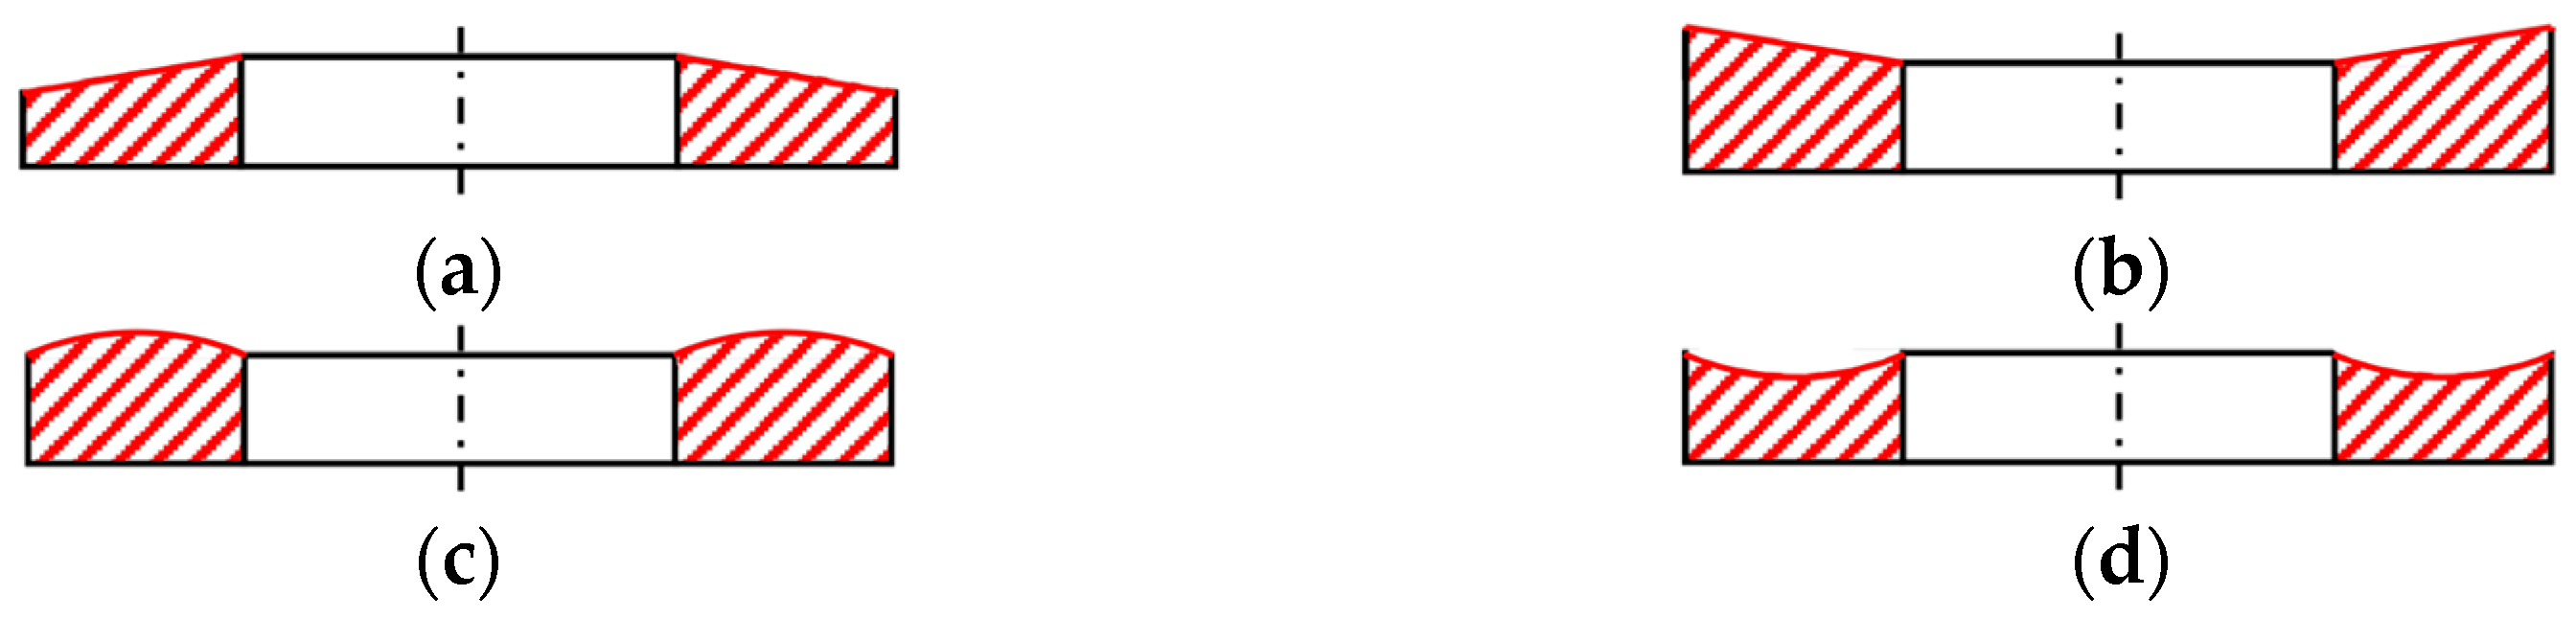
The radial manufacturing errors of the thrust surface generally refer to straightness errors. Based on the structural characteristics of the thrust-bearing–rotor assembly, four ideal straightness error models are selected in this study. These models are classified as outward-tapered, inward-tapered, convex, and concave, as shown in Figure 12. These shapes can be represented using line segments or arcs and are referred to as characteristic lines of ideal radial straightness errors. The governing Equation (22) for the axial profile characteristic lines of these four types are given in the corresponding expressions.
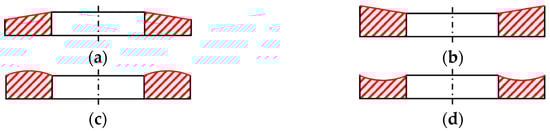
Figure 12.
Radial profile of the thrust working surface with idealized straightness errors. (a) Outward taper. (b) Inward taper. (c) Convex shape. (d) Concave shape.
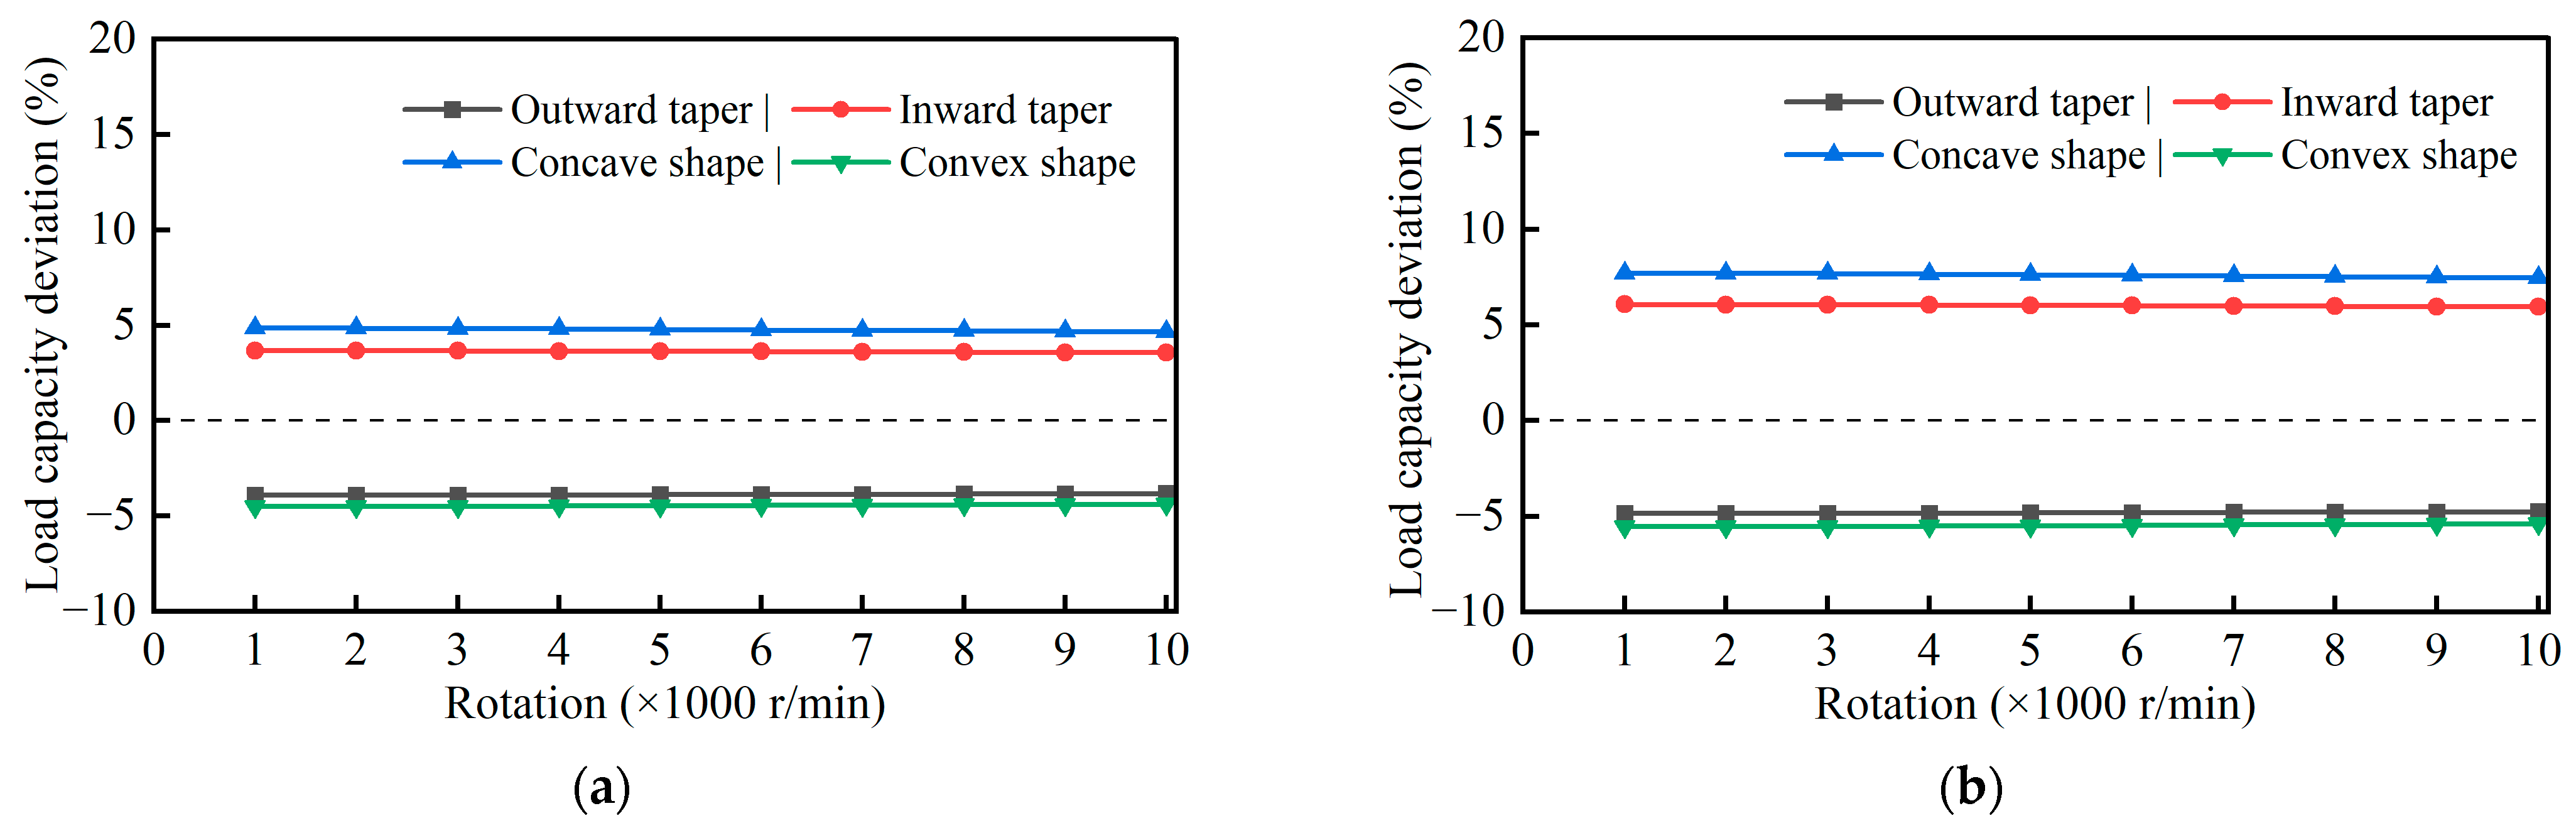
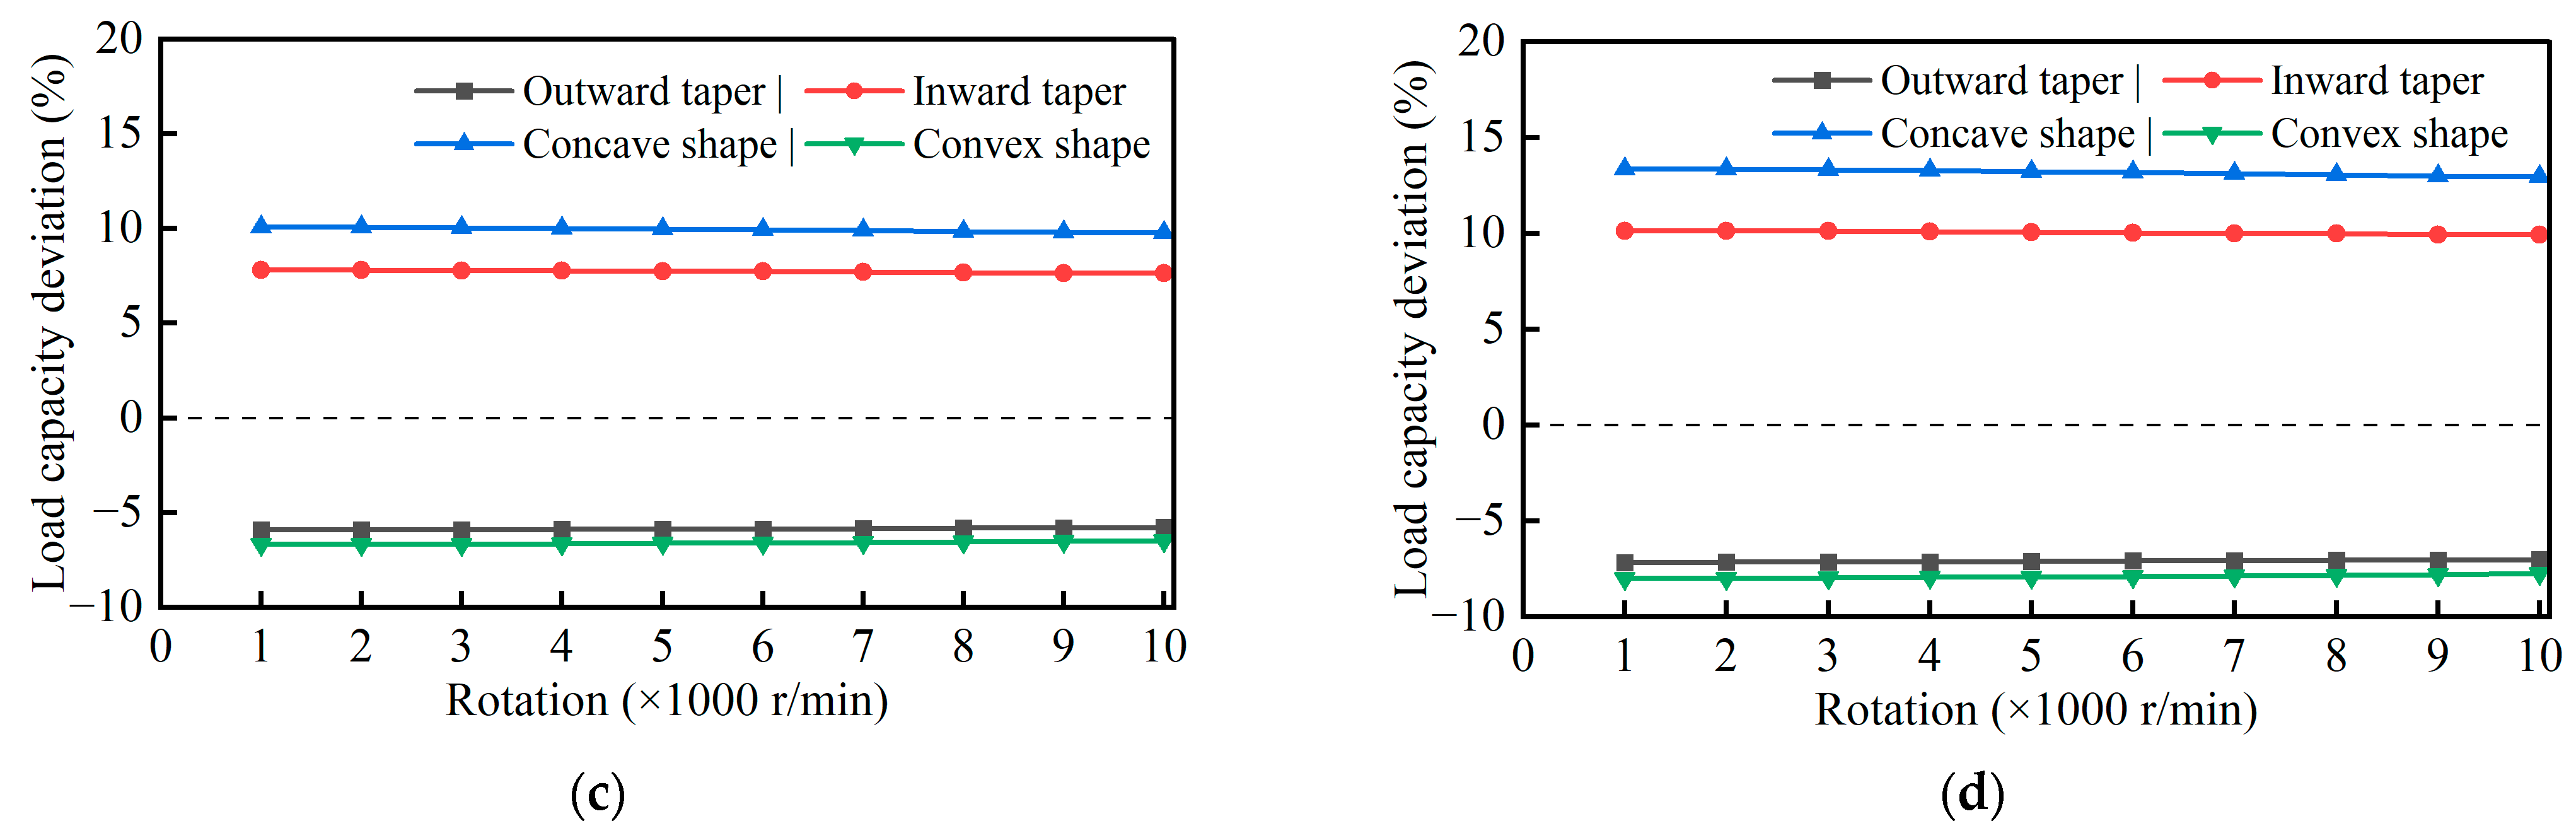
Let r1 and r2 denote the inner and outer radii of the thrust surface, respectively, with r∈[r1,r2]. The symbols Δza, Δzb, Δzc, and Δzd represent the corresponding straightness error values. Using ideal circular arcs along the four radial characteristic lines shown in Figure 12, comprehensive manufacturing error models for the thrust surface were constructed. The average load capacity deviations within the rotational speed range of 1000–10,000 r/min were then calculated. The radial straightness error values were set to 0.63, 0.80, 1.00, and 1.25 μm, respectively. The results are shown in Figure 13.
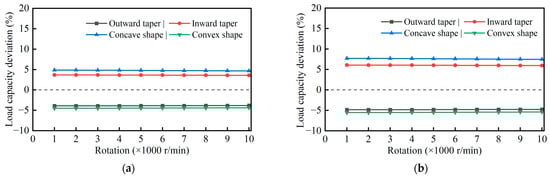
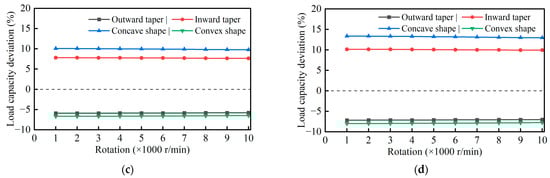
Figure 13.
Effect of different straightness error values on the load capacity of rotor thrust working face. (a) Straightness error value: 0.63 μm. (b) Straightness error value: 0.80 μm. (c) Straightness error value: 1.00 μm. (d) Straightness error value: 1.25 μm.
As shown in Figure 13, when the radial straightness error value remains constant, the load capacity deviation of different thrust surfaces stays nearly unchanged as the rotational speed increases. However, as the radial straightness error increases, the deviation in load capacity gradually becomes more pronounced for all thrust surface profiles. Despite this, the order of load capacity from highest to lowest remains the same: concave, inward-sloped, outward-sloped, and convex. When the radial straightness error is 0.63 μm, the load capacity deviations for thrust surfaces constructed using the four different radial characteristic profiles all remain within ±5%.
4.2. Comparison and Analysis of Experiment and Simulation Results
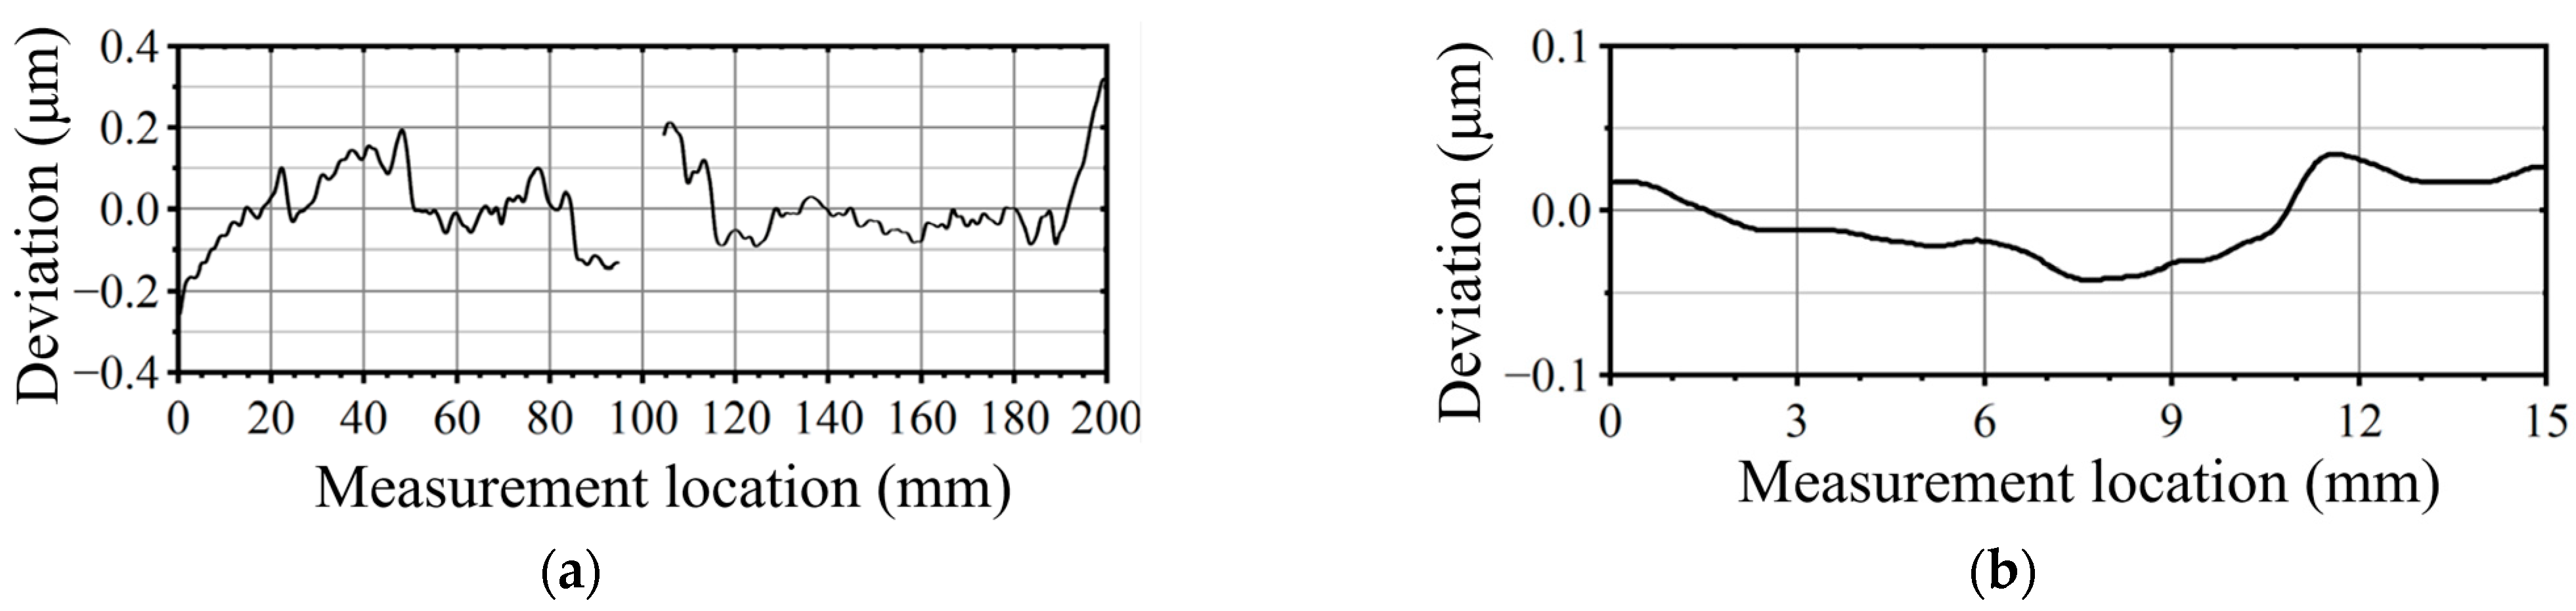
After the measurements in Section 3.1, the specific measurement results for Rotor 1 are shown in Figure 14. The axial straightness errors of the radial working surfaces for the remaining rotors are listed in Table 3, and the radial straightness errors of the axial working surfaces are presented in Table 4.
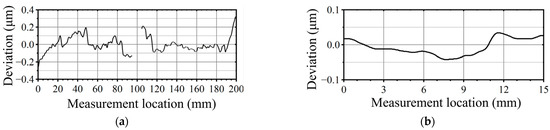
Figure 14.
Measured straightness error of rotor 1. (a) Straightness of the radial working surface. (b) Straightness of the thrust working surface.
Table 3.
Measured axial straightness errors of the six rotors.
Table 4.
Radial straightness measurement results of the six rotors.
The air film thickness of an air -lubricated aerostatic radial bearing is determined by the actual dimensions of the shaft and bearing sleeve. Based on the collected straightness error data of the rotor’s critical working surfaces, the fit dimensions between the rotor and the bearing can be calculated to obtain the actual air film thickness. According to the measurements and calculations, the outer diameters of the six rotors are 49.997, 50.002, 49.999, 50.003, 50.000, and 50.001 mm, respectively, while the average inner diameter of the bearings is 50.022 mm. This results in an average single-sided radial air film thickness of 10.8 μm, with a deviation of less than 10% from the designed thickness of 10 μm. During operation, the bearing remains stationary while the rotor rotates. For the radial bearing and rotor, under the assumption that circumferential manufacturing errors are negligible, axial manufacturing errors can significantly affect the circumferential distribution of the air film thickness but do not cause substantial thickness fluctuations. Therefore, this type of manufacturing error influences the radial load capacity of the aerostatic spindle.
The average single-sided axial air film thickness is 10.3 μm, with a deviation of less than 10% from the designed thickness of 10 μm. When the aerostatic spindle is in operation, manufacturing errors on the thrust working surfaces affect the axial distribution of the air film thickness. As a result, such manufacturing errors influence the load-carrying capacity of the thrust working surfaces.
4.2.1. Comparison of Radial Load Capacity
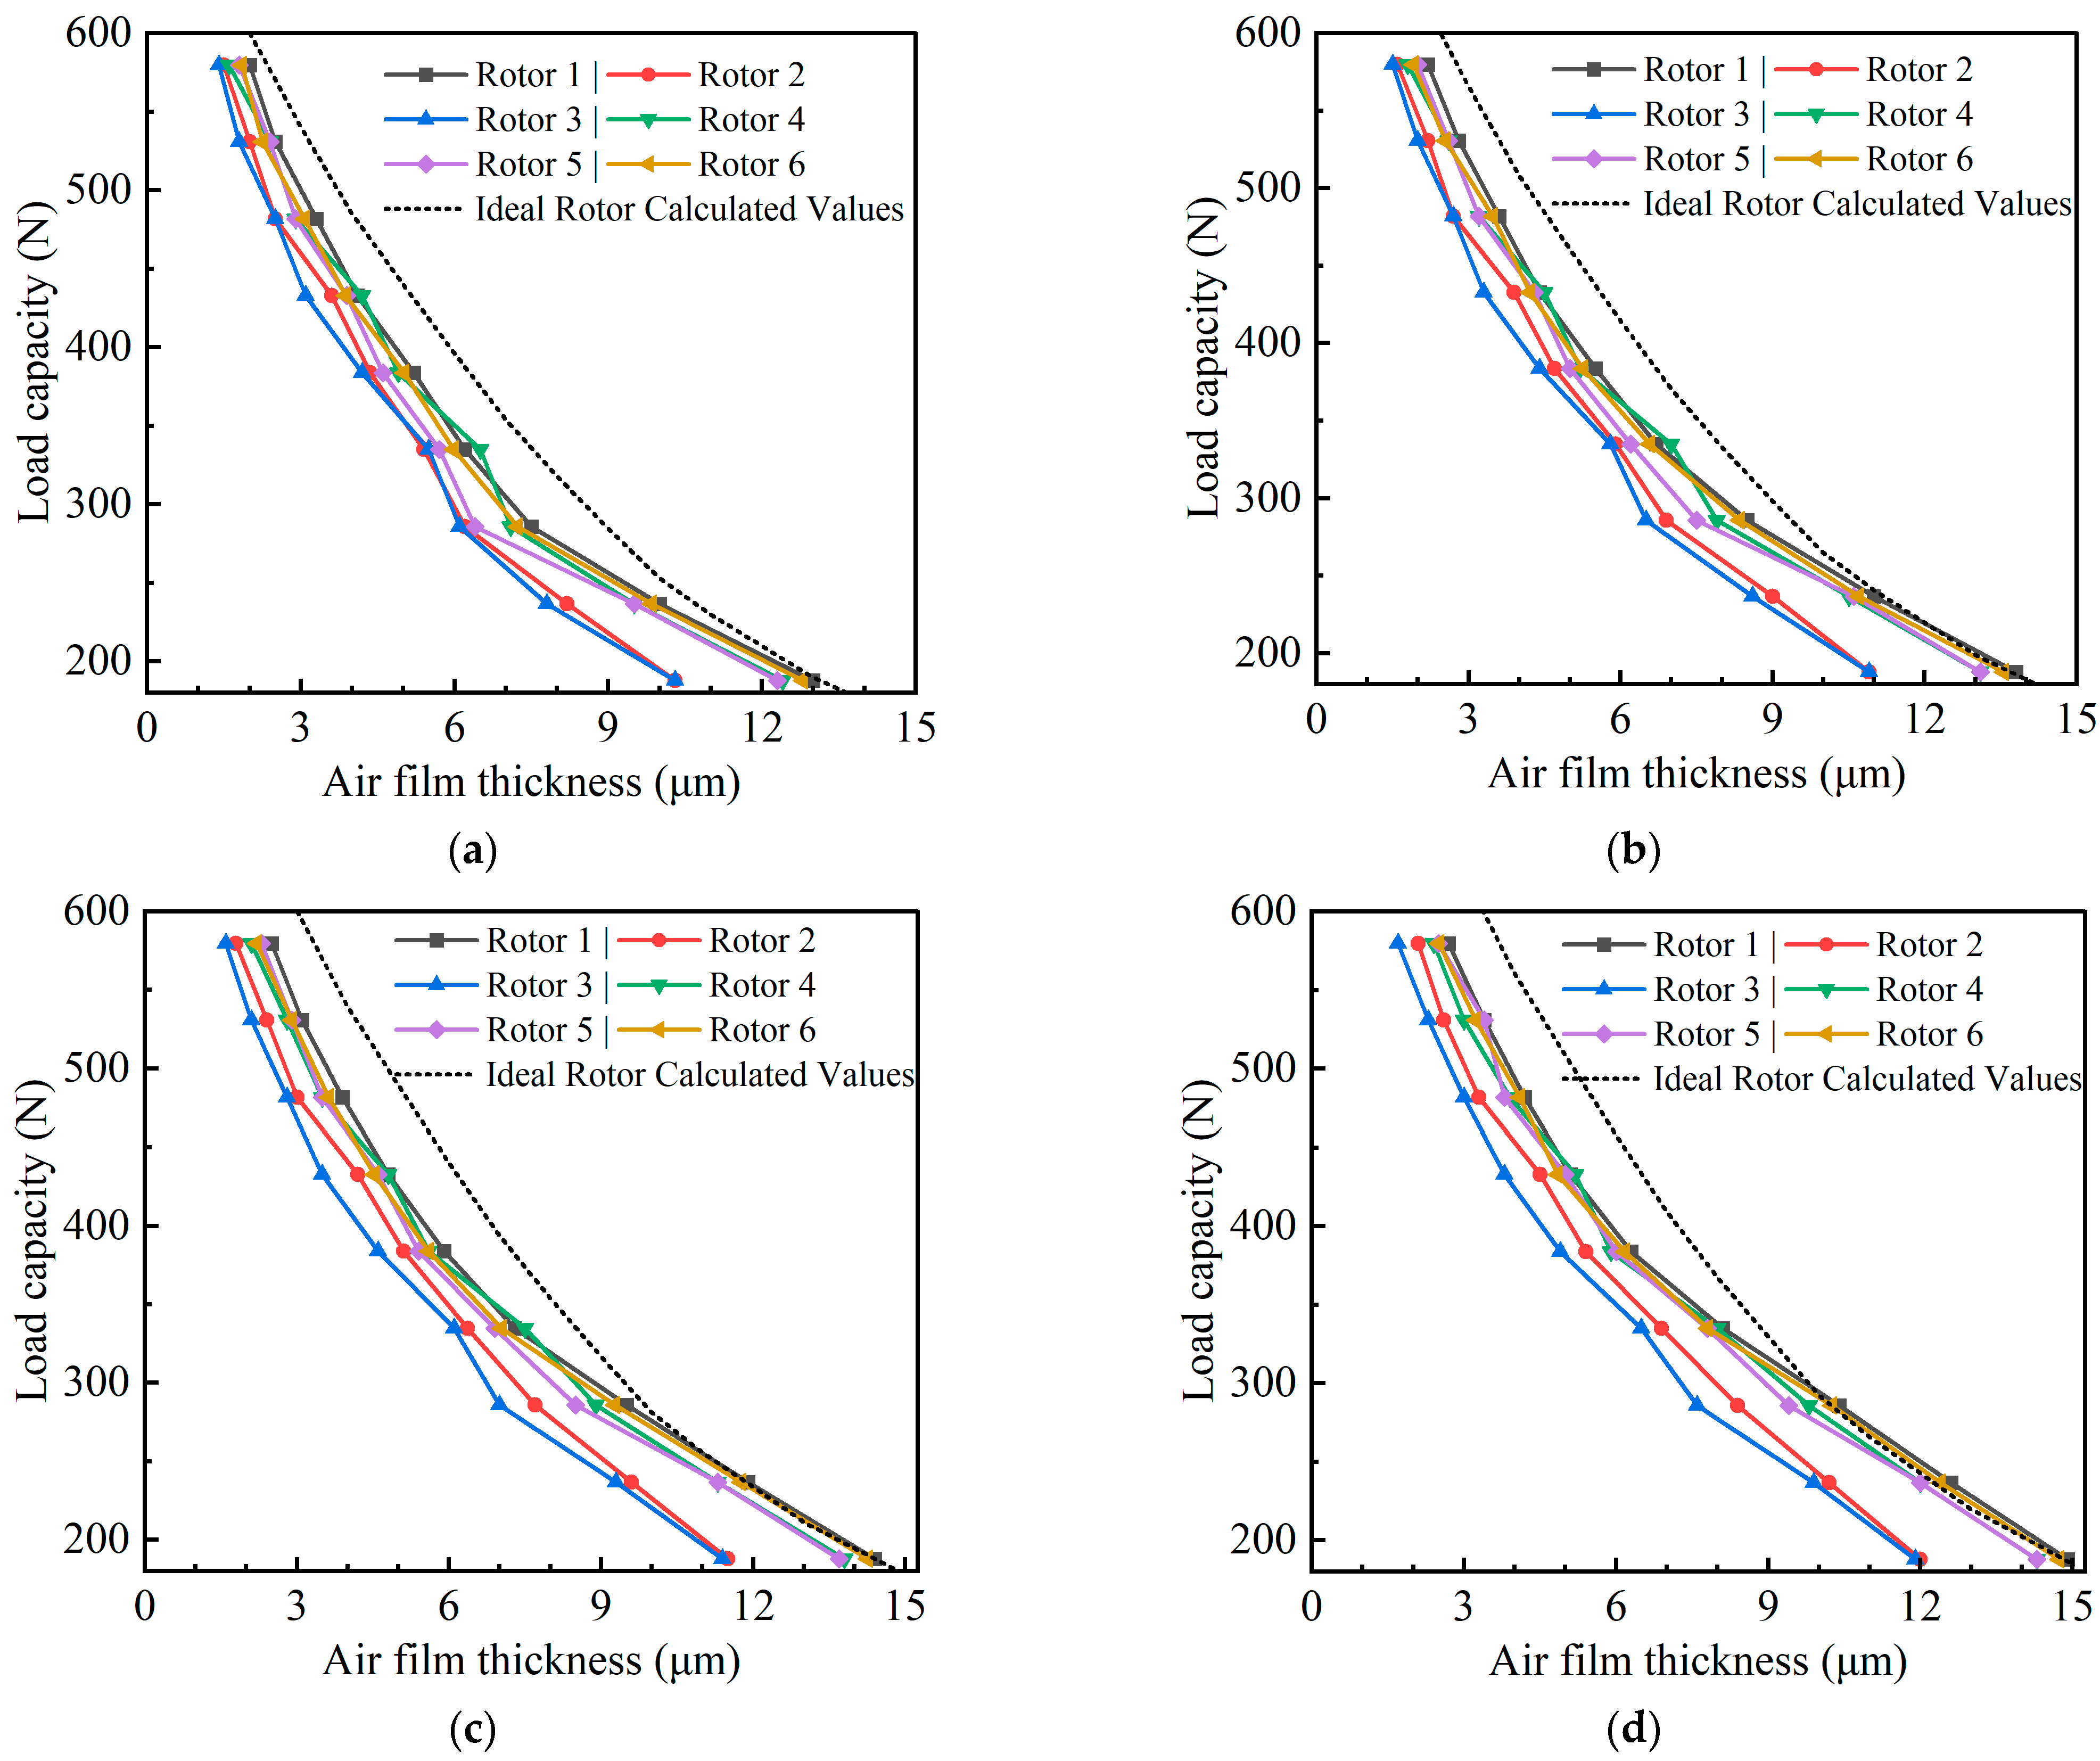
By incorporating the actual measured straightness data into the model and comparing the results with experimental values, the influence of straightness error can be evaluated more accurately and realistically [34]. The radial load and air film thickness measurement results of different rotors under various supply pressures, along with the calculated values for an ideal rotor, are plotted together as shown in Figure 15. To facilitate horizontal comparison, all subplots share the same axis range. It can be observed from the figure that, under different supply pressures, the calculated load characteristics of the ideal rotor are consistently higher than the experimental values of the various rotors. A third-order polynomial fitting method was applied separately to both the calculated and experimental data. The comparison of the fitted curves shows that the difference between the calculated and experimental values is less than 20%. For some rotors, the maximum air film thickness exceeds the average radial film thickness measured in Section 3.1. Analysis indicates that, in addition to measurement errors, there are two main causes: first, the rotor shaft may exhibit slight deflection under eccentric loading; second, the test system may deform as the applied load varies. Taking all these factors into account, it can be concluded that the Aerostatic model proposed in this study shows good agreement with the experiment measurements of the radial bearing load capacity.
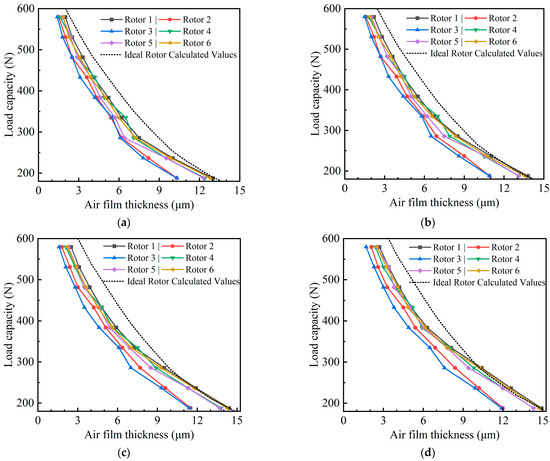
Figure 15.
Measured radial load capacity at different supply pressures. (a) Supply pressure: 0.40 MPa. (b) Supply pressure: 0.45 MPa. (c) Supply pressure: 0.50 MPa. (d) Supply pressure: 0.55 MPa.
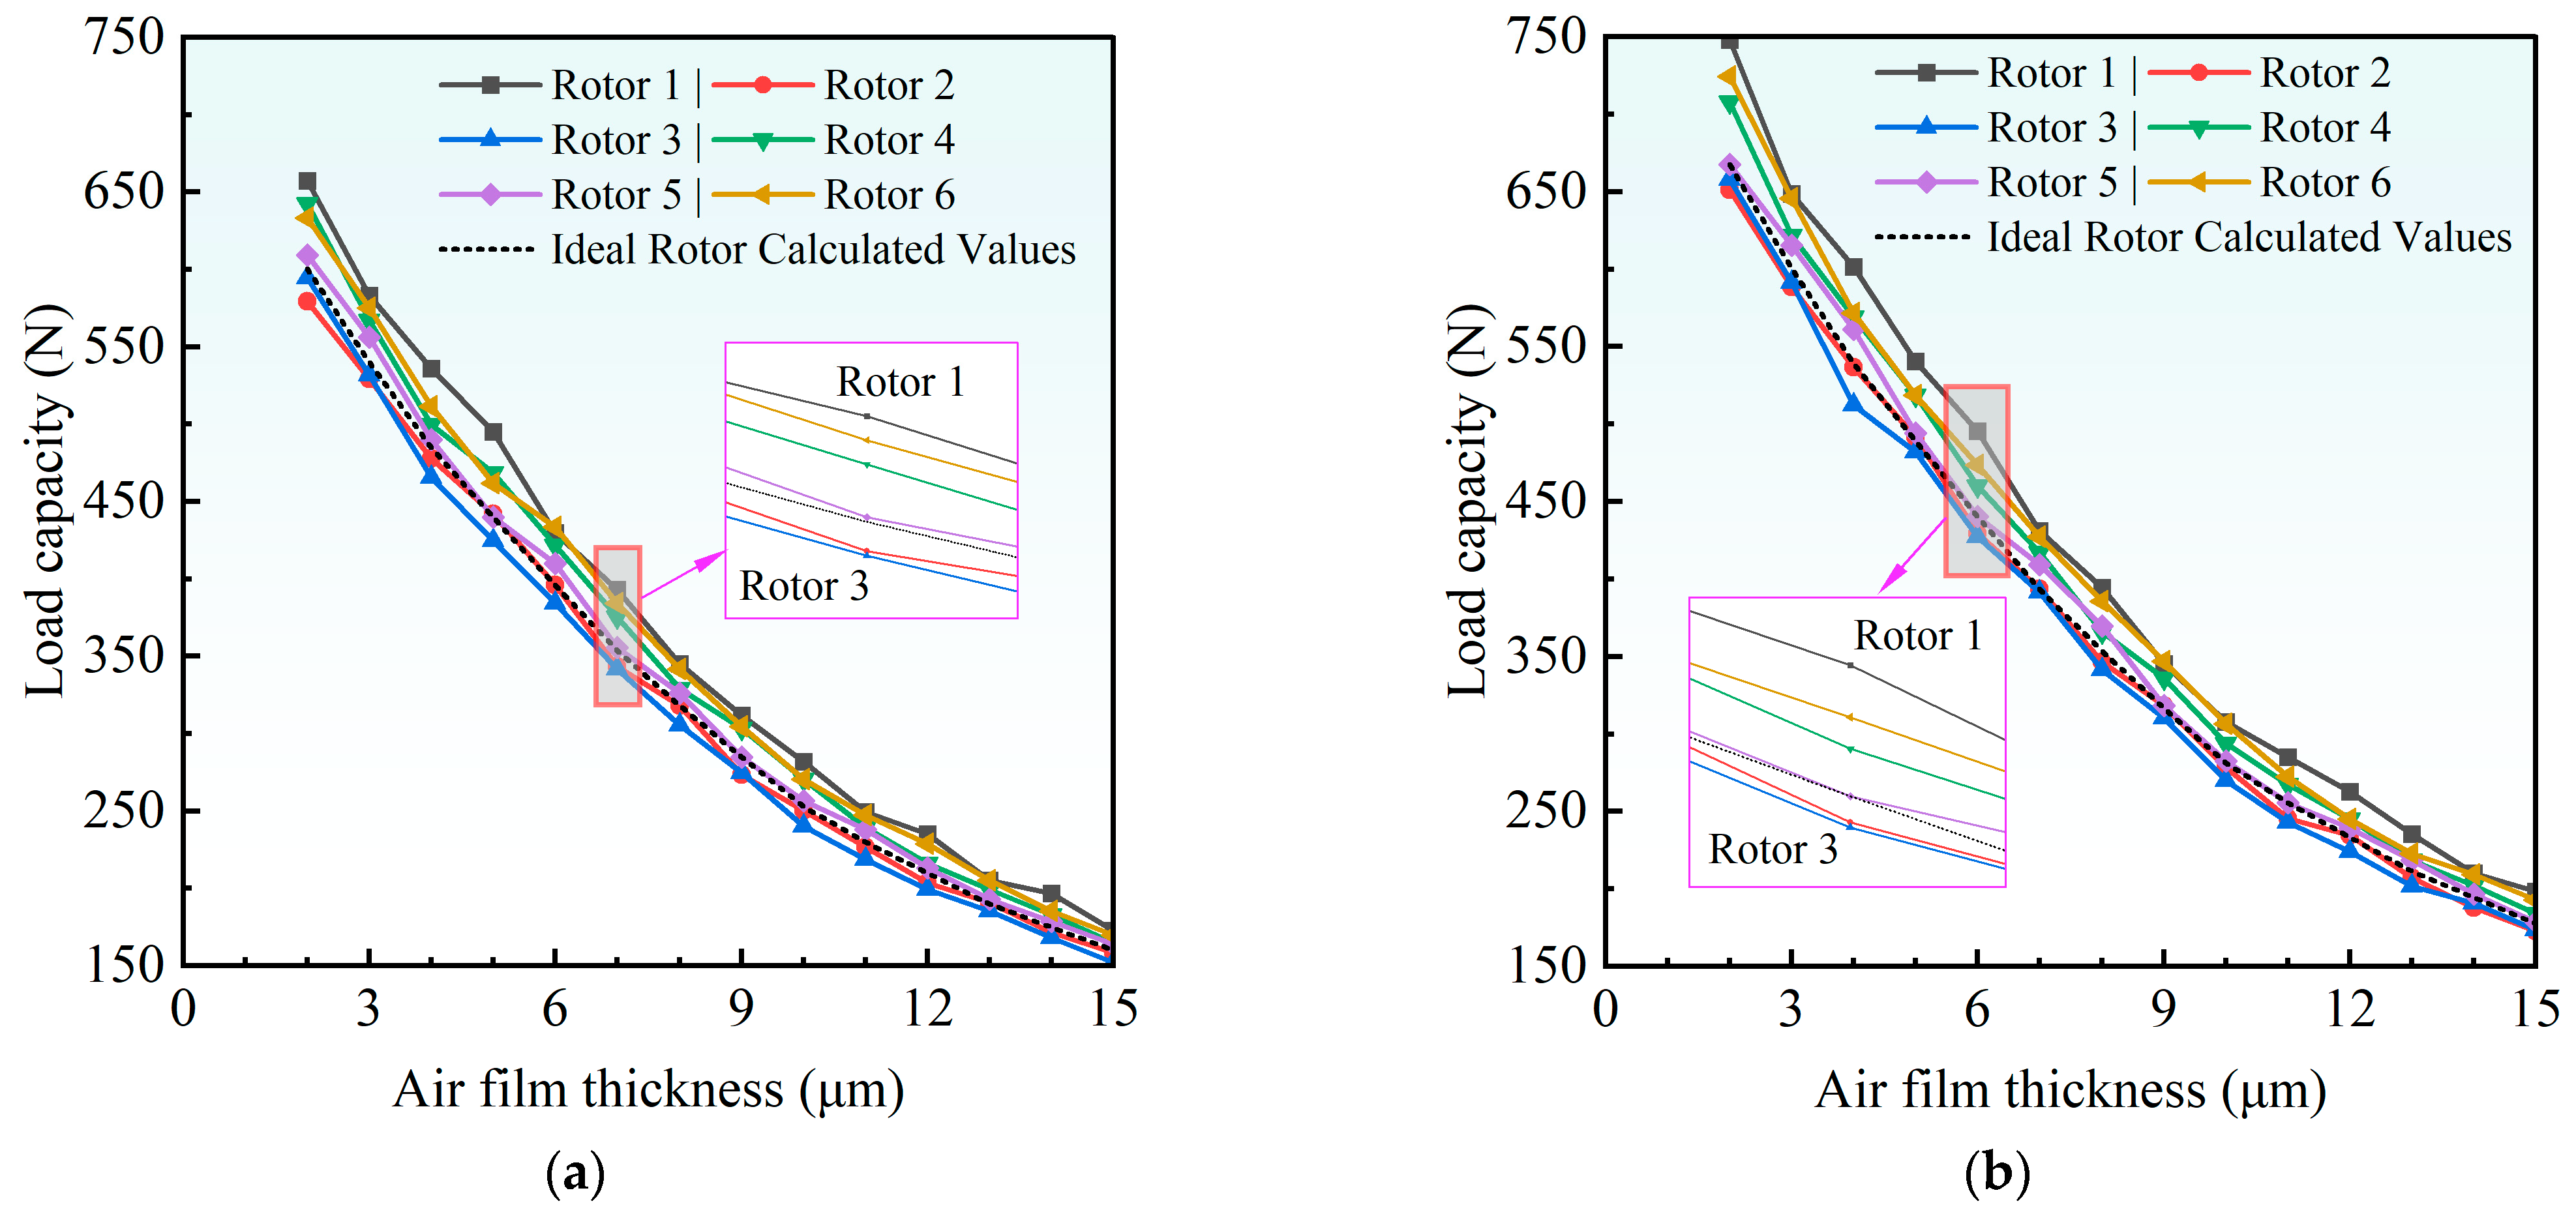
Referring to the load capacity calculation method described in Section 2.1, the axial straightness error data of the six rotor radial cylindrical surfaces shown in Table 3 were used for calculation under supply pressures of 0.40 MPa and 0.50 MPa. The results are shown in Figure 16, which also includes the calculated values for an ideal rotor without straightness error as a reference, consistent with Figure 15.
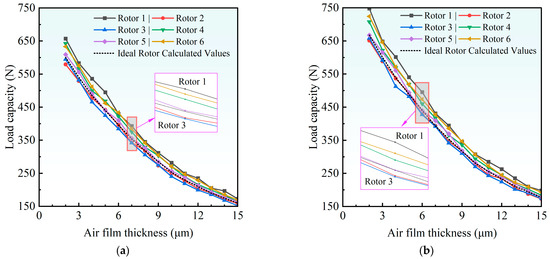
Figure 16.
Simulation results of radial Load capacity considering straightness error. (a) Supply pressure: 0.4 MPa. (b) Supply pressure: 0.5 MPa.
Both the experiment and simulation results demonstrate that under the same supply pressure, the load capacity characteristics of the six rotors show clear differences: Rotors 1, 4, and 6 exhibit nearly identical and the highest load capacities; Rotors 5, 2, and 3 show progressively lower load capacities. As the air film thickness increases, the load capacity of all rotors decreases significantly. With an increase in supply pressure, the differences in load capacity characteristics between different rotors remain nearly the same, and all load capacity curves shift to the right. Therefore, to enhance the radial load capacity of the rotor, the air film thickness can be reduced or the supply pressure increased. A cross-comparison between the experimental and simulation results shows that, taking the ideal rotor calculation as the reference, the simulation results for a given rotor are higher than the experimental results. Although the differences in load characteristics among rotors are more pronounced in the experimental results than in the simulation, the ranking of rotor load capacities remains largely consistent between the two. This further validates the accuracy of the simulation model presented in this study. Hence, it can be concluded that the axial straightness error of the rotor’s radial working surface is a critical factor influencing its radial load capacity.
4.2.2. Comparison of Axial Load Capacity
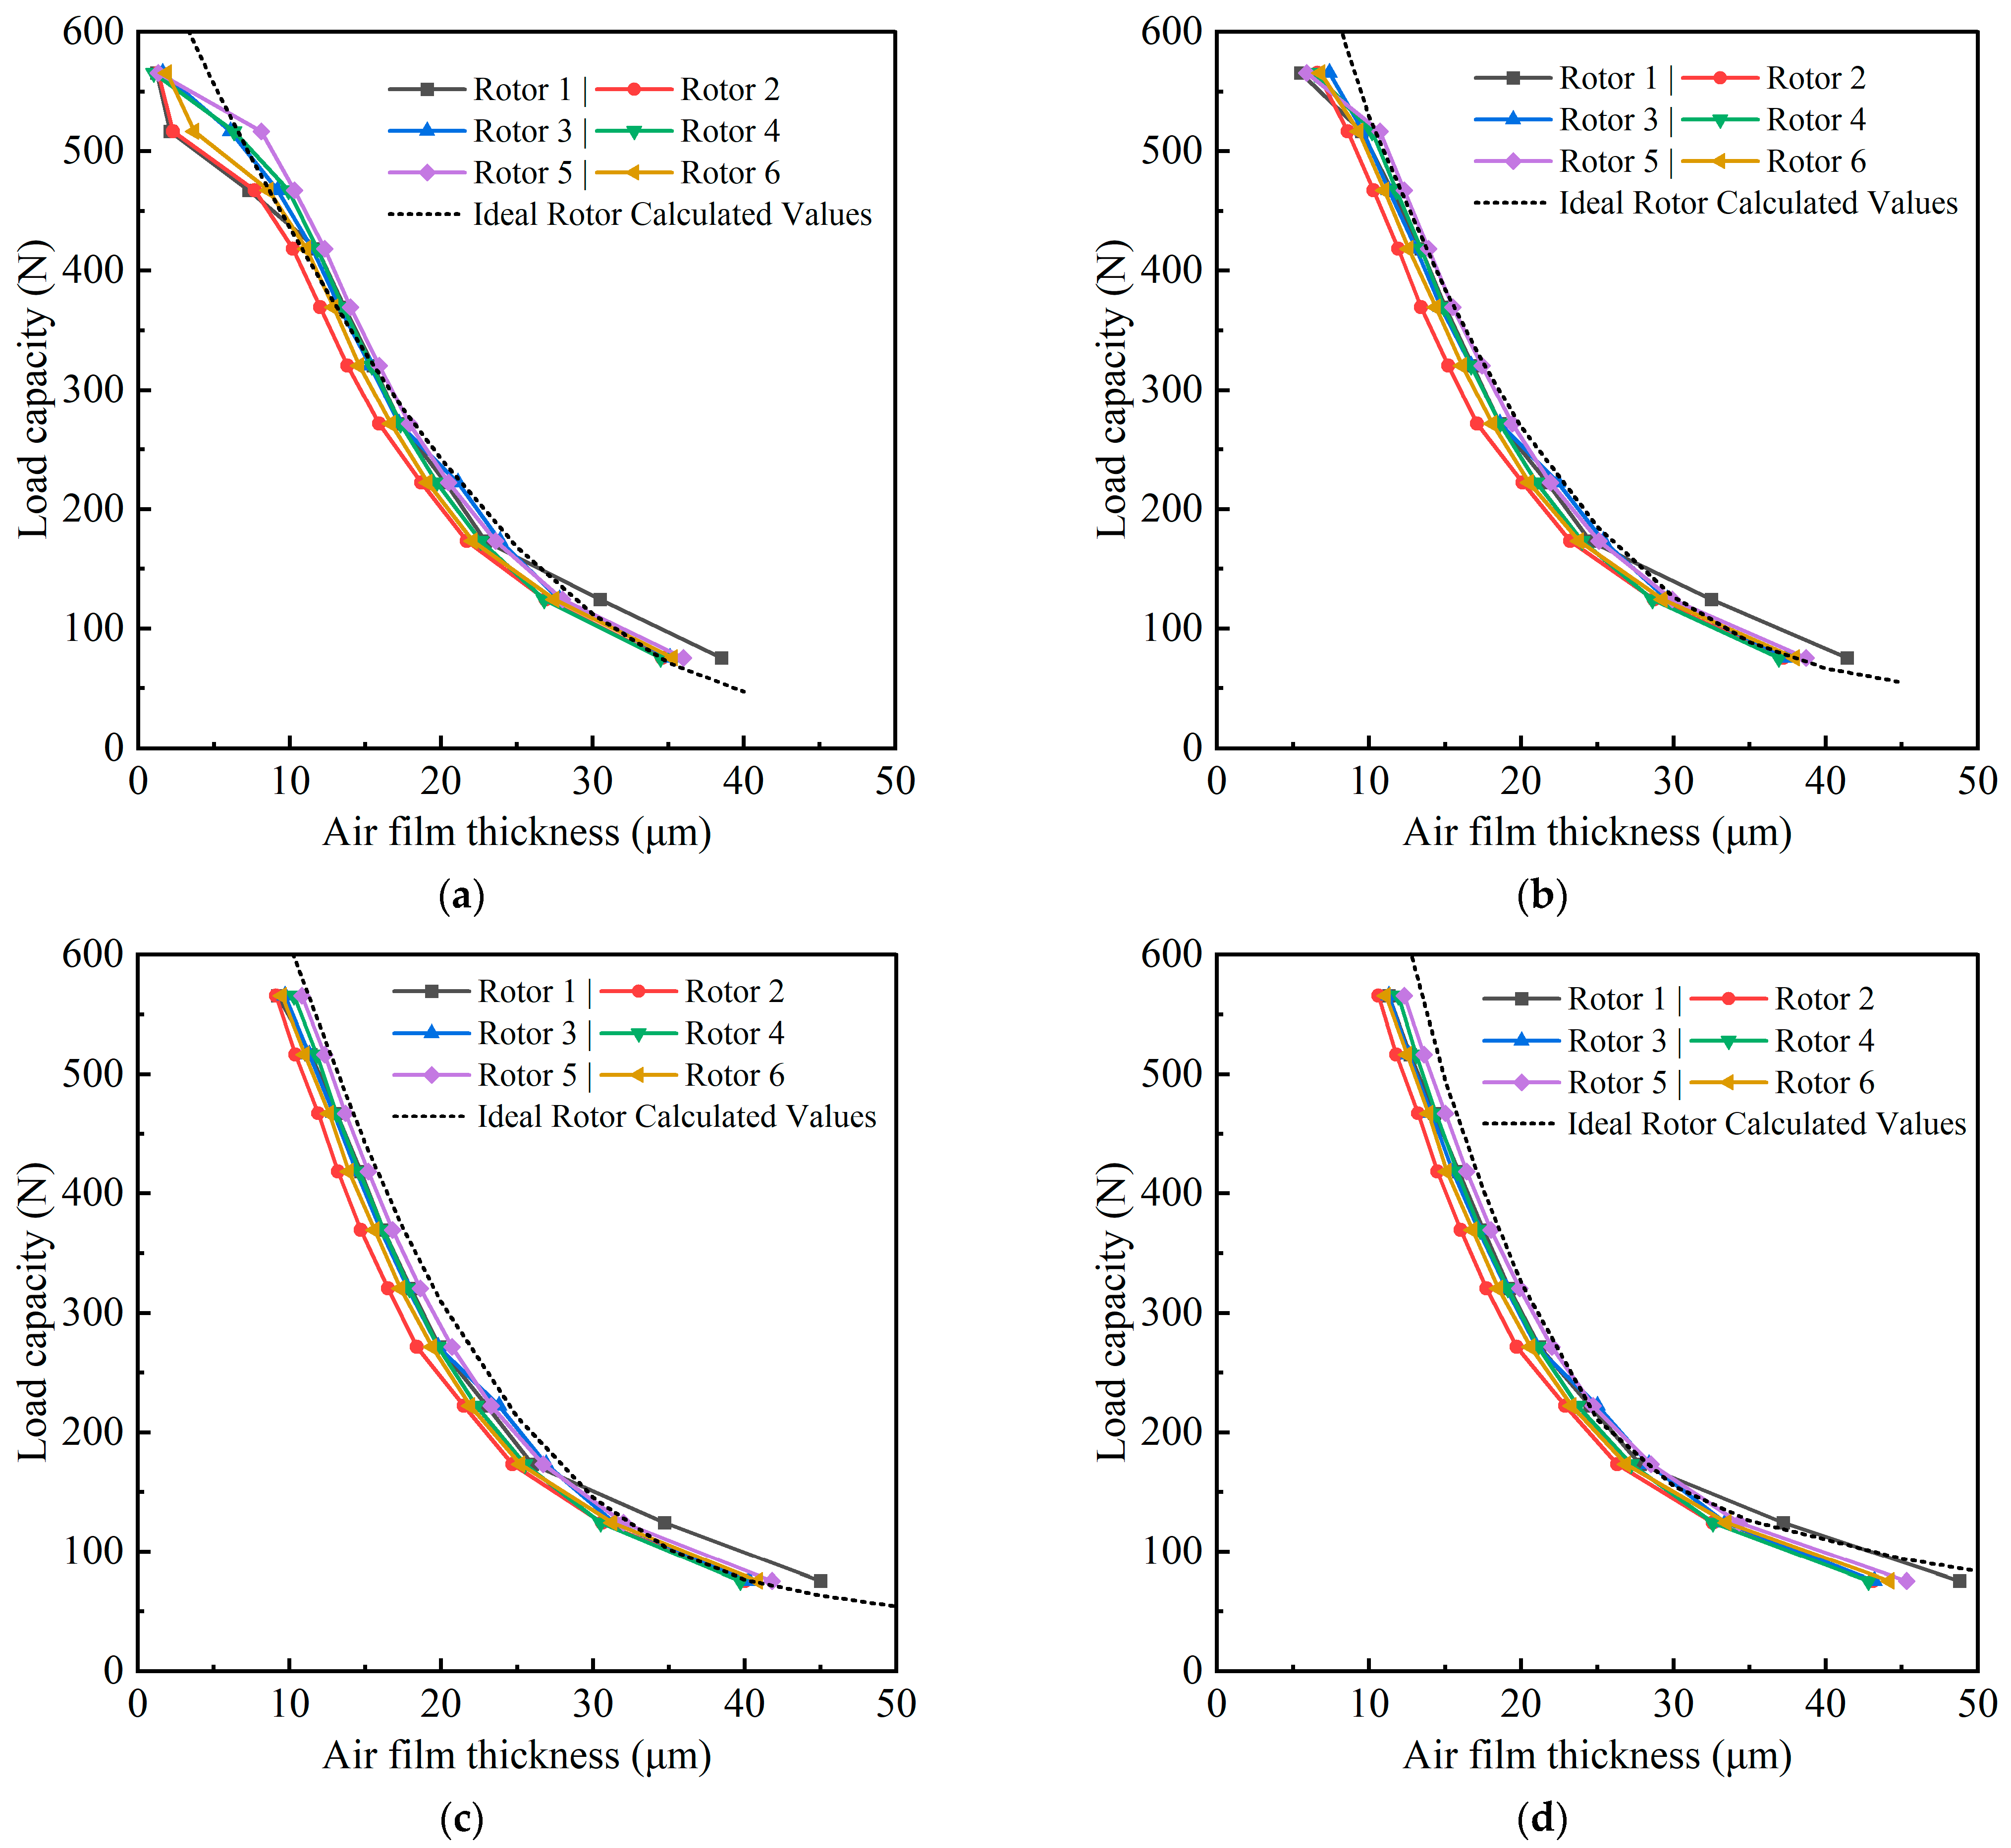
The axial load capacity and air film thickness measurements for different rotors under various supply pressures were plotted together with the calculated values for an ideal rotor, as shown in Figure 17. From the figure, it can be observed that under different supply pressures, the calculated load capacity characteristics of the ideal rotor show minimal deviation from the experimental values of the actual rotors. Both the calculated and measured data were fitted using a third-order polynomial method. The comparison of the fitted results shows that the deviation between simulation and experiment remains within 15%. Considering experimental uncertainties, it can be concluded that the fluid dynamics model established in this study demonstrates good agreement with the experimental data for thrust bearing load capacity. During axial load capacity testing, to maximize the measurable range of air film thickness and collect more data points, the motor shaft was not installed at the rotor end. As a result, the thrust bearing at the end of the spindle remained open, and air consumption measurements were not conducted.
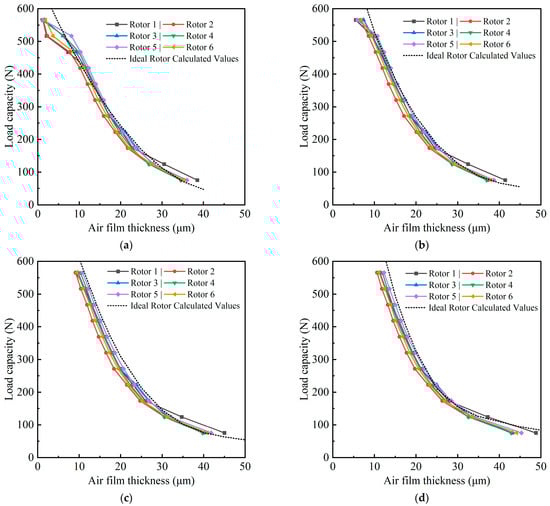
Figure 17.
Measured axial load capacity at different supply pressures. (a) Supply pressure: 0.40 MPa. (b) Supply pressure: 0.45 MPa. (c) Supply pressure: 0.50 MPa. (d) Supply pressure: 0.55 MPa.
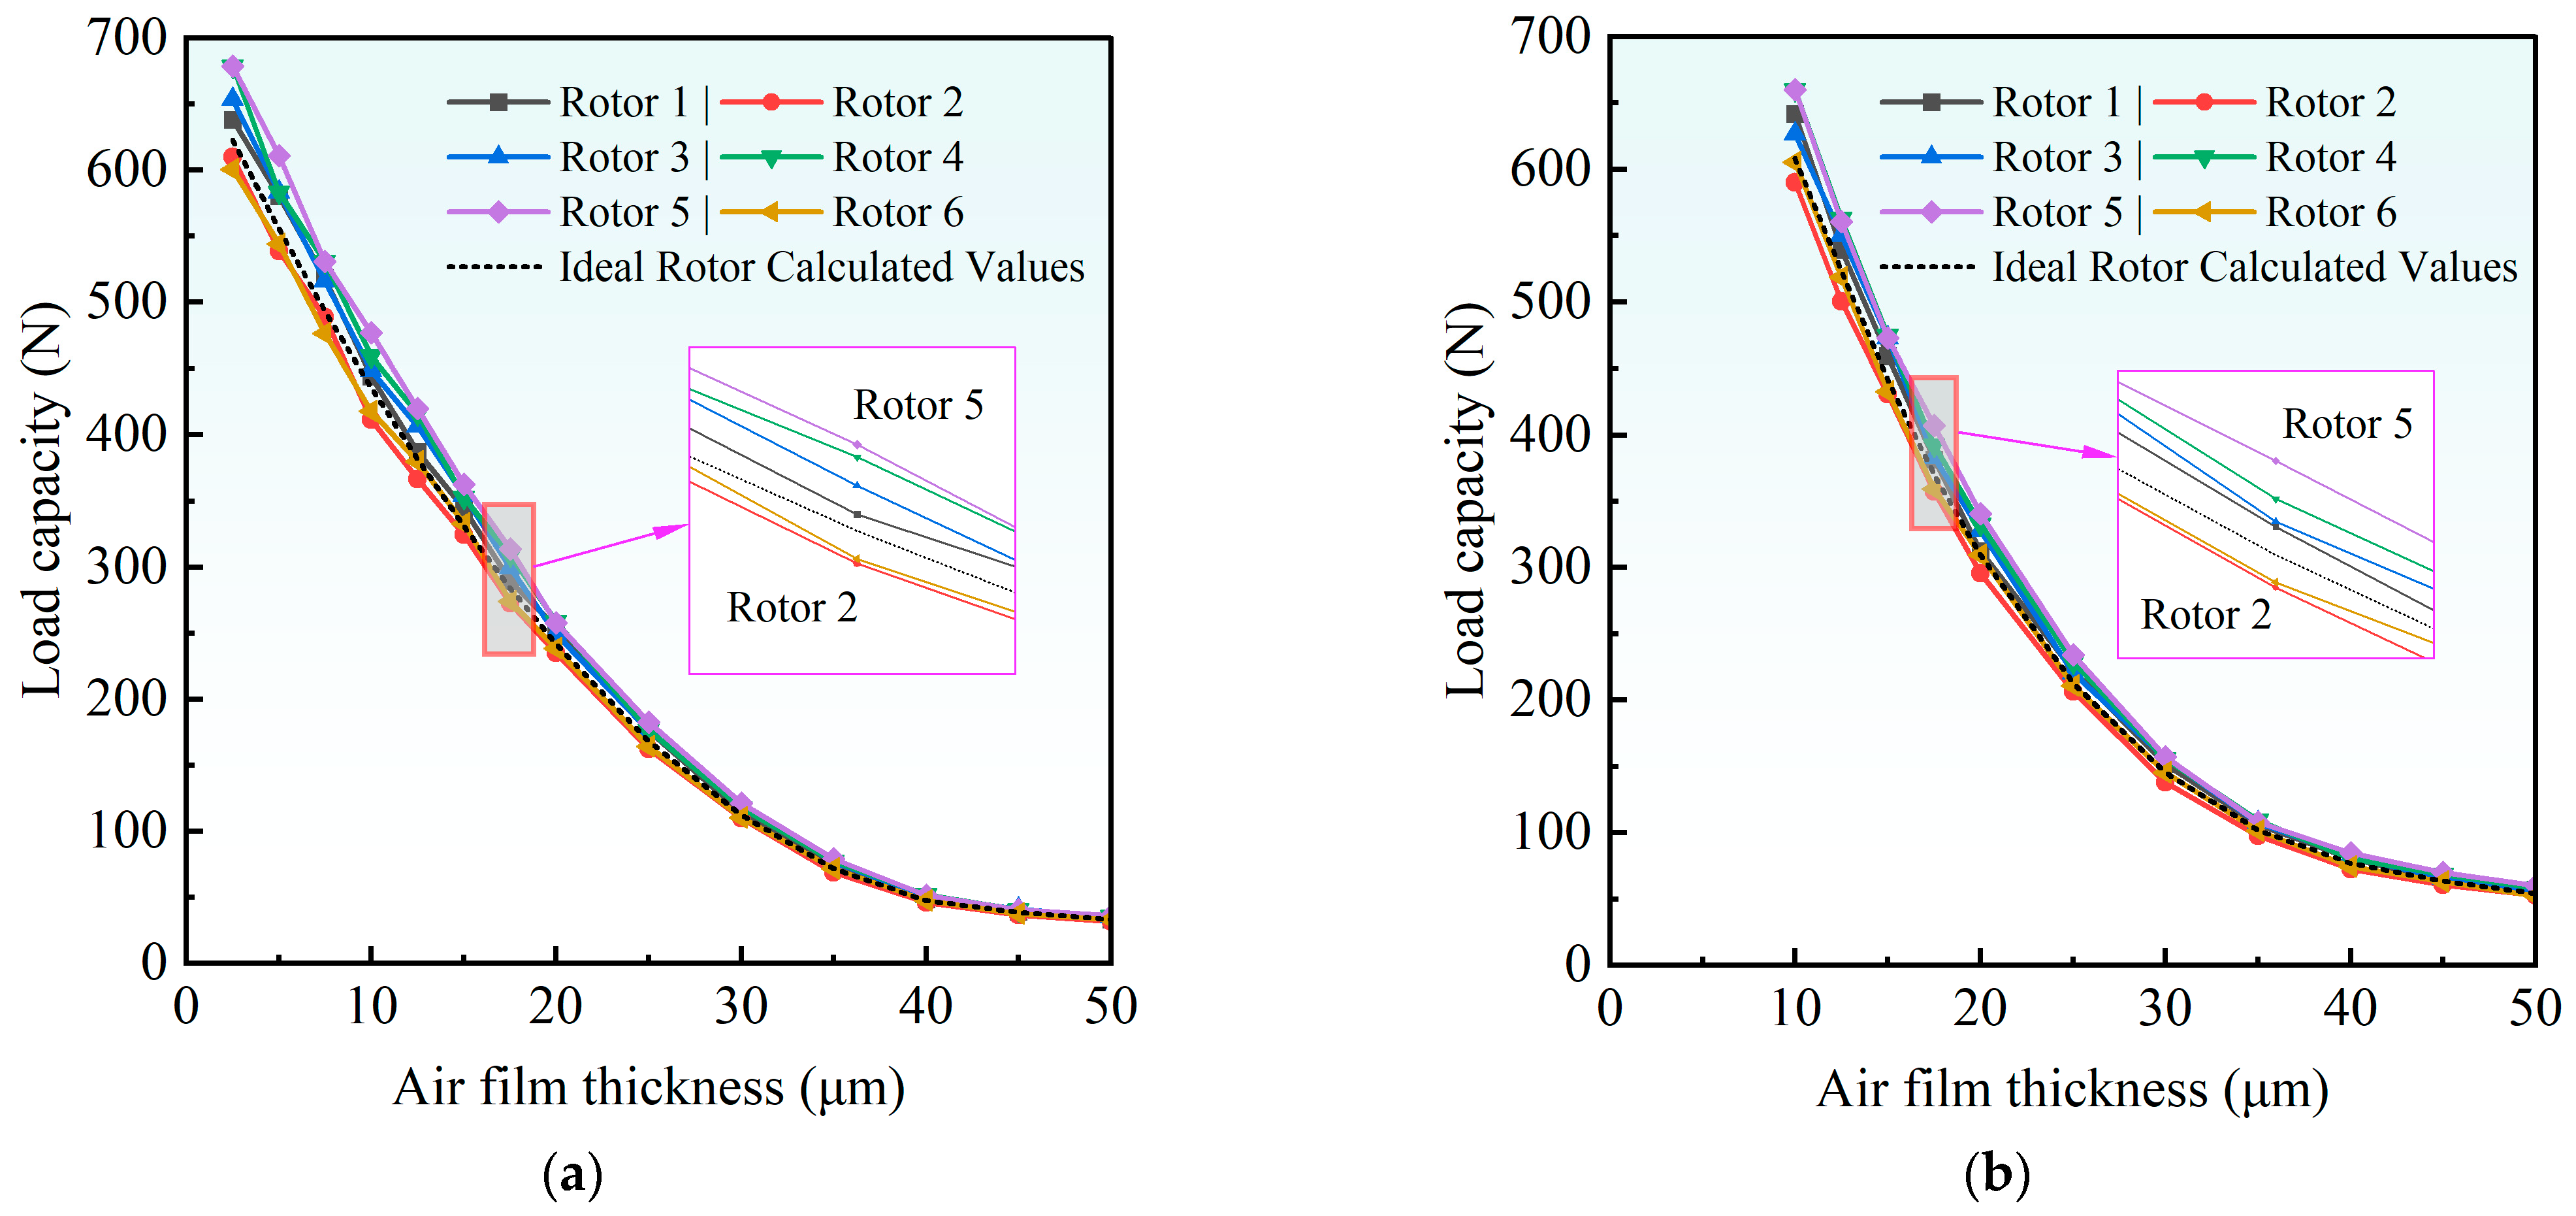
Calculations were performed using the radial straightness error measurement data of the front thrust working surfaces of the six rotors shown in Figure 14, with supply pressures set at 0.40 and 0.50 MPa. The results are shown in Figure 18, which also includes the calculated values for an ideal rotor without considering straightness errors as a reference. From the figure, it can be seen that when the air film thickness is small, the calculated load capacity characteristics of different rotors show significant differences, with some higher and some lower compared to the ideal rotor. However, as the air film thickness gradually increases, the load capacity characteristics of the different rotors become increasingly close to that of the ideal rotor. Under both supply pressures, when the air film thickness is the same, the order of load capacity magnitude for the six rotors remains almost unchanged, ranked from largest to smallest as Rotor 5, 4, 3, 1, 6, and 2.
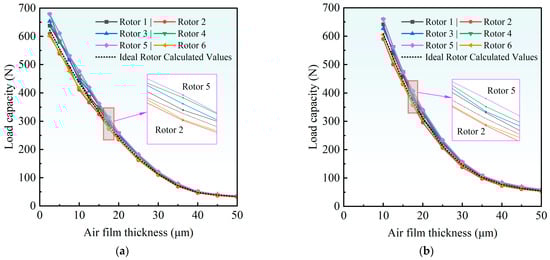
Figure 18.
Simulation results of axial load capacity considering straightness error. (a) Supply pressure: 0.4 MPa. (b) Supply pressure: 0.5 MPa.
Both the experiment and simulation results show that when the air supply pressure remains constant, Rotor 5 generally has the highest load capacity, followed by Rotor 4, while Rotors 6 and 2 have the lowest load capacities. As the air supply increases, except for a few data points, the load capacity characteristic curves of all rotors do not change significantly but shift to the right overall. This means that increasing the air supply pressure improves the overall load capacity without altering the load capacity characteristics. Using the ideal rotor’s calculated values as a benchmark, a lateral comparison of the measured and simulated load capacity characteristics under the same air supply pressure reveals that the ranking of the six rotors’ load capacities is basically consistent in both test and simulation results. Moreover, during the entire axial and radial load capacity testing process, all conditions remained the same except for changing the rotors. Therefore, it can be concluded that the radial straightness error of the rotor’s thrust working surface is an important factor affecting its axial load capacity.
5. Conclusions
This study aims to investigate the influence of manufacturing errors on the load characteristics of aerostatic spindles. A numerical model considering straightness errors was established based on the finite difference method and integrated with measured data of rotor straightness errors. A static testing system for aerostatic spindles was constructed to experimentally evaluate the performance of spindles with different rotors. Numerical results were compared with experiment data, and the main conclusions are summarized as follows:
(1) Among the ideal straightness error shapes, the taper-, barrel-, and drum-shape are all axisymmetric. Rotors constructed using these error profiles do not generate additional fluctuations in air film thickness during rotation. Thus, axial straightness errors affect the spindle’s load capacity but have minimal impact on its dynamic stability.
(2) Comparing experiment data with simulation results based on measured errors shows that the load capacity ranking of the six rotors is consistent. This is because straightness errors only affect the axial distribution of air film thickness and do not cause fluctuations in the film thickness. Therefore, straightness errors are important factors influencing both radial and axial load capacities of the aerostatic spindle.
(3) The simulations conducted were based on actual cylindricity measurement data, and the good agreement between experiment and simulation results validates the fluid mechanics model considering the straightness errors proposed in this study. This provides an effective basis for subsequent evaluation of manufacturing errors in aerostatic spindles.
Author Contributions
Conceptualization, G.Z.; Methodology, Y.G.; Software, G.W.; Validation, W.W.; Formal analysis, Y.L.; Investigation, H.Y.; Resources, S.Z. All authors have read and agreed to the published version of the manuscript.
Funding
This research was funded by the Zhongyuan University of Technology’s 2025 Graduate Student Scientific Research and Innovation Program under grant number YKY2025ZK44.
Data Availability Statement
The original contributions presented in this study are included in the article. Further inquiries can be directed to the corresponding author.
Conflicts of Interest
The authors declare no conflict of interest.
References
- Zang, L.; Hou, W.; Liu, L.; Hu, H.; Wang, X.; Jia, Y.; Hao, Y.; Li, Y.; Zhao, B. The Application and Development of Static Pressure Air Floating in the Field of Micro-Low-Gravity Simulation Experiments for Spacecraft. Lubricants 2025, 13, 258. [Google Scholar] [CrossRef]
- Wen, Z.; Gu, H.; Shi, Z. Key Technologies and Design Methods of Ultra-Precision Aerostatic Bearings. Lubricants 2023, 11, 315. [Google Scholar] [CrossRef]
- Wang, L.; Han, J.; Tang, Z.; Zhang, Y.; Wang, D.; Li, X. Geometric Accuracy Design of High Performance CNC Machine Tools: Modeling, Analysis, and Optimization. Chin. J. Mech. Eng. 2025, 38, 87. [Google Scholar] [CrossRef]
- Zha, C.; Li, T.; Zhao, Y.; Chen, D. Influence of microscale effect on the radial rotation error of aerostatic spindle. Proc. Inst. Mech. Eng. Part J J. Eng. Tribol. 2020, 234, 1131–1142. [Google Scholar] [CrossRef]
- Li, B.; Zhou, D.; Xu, W.; Zhang, Y. Effect of Surface Waviness on Stability of Hydrodynamic Journal Bearing Systems. J. Mech. Eng. 2019, 55, 51–59. [Google Scholar]
- Bangotra, A.; Sharma, S. Effect of partial surface waviness on the dynamic and stability performance of journal bearing. Lubr. Sci. 2024, 36, 197–215. [Google Scholar] [CrossRef]
- Chu, J.; Wu, S.; Wang, J.; Wang, Y.; Wang, S.; Xu, F. Analysis of gas foil thrust bearing considering manufacturing errors: Modeling and experiments. Mech. Syst. Signal Process. 2025, 232, 112698. [Google Scholar] [CrossRef]
- Zhang, G.; Zheng, J.; Yu, H.; Zhao, R.; Shi, W.; Wang, J. Rotation accuracy analysis of aerostatic spindle considering shaft’s roundness and cylindricity. Appl. Sci. 2021, 11, 7912. [Google Scholar] [CrossRef]
- Cappa, S.; Reynaerts, D.; Al-Bender, F. Reducing the Radial Error Motion of an Aerostatic Journal Bearing to a Nanometre Level: Theoretical Modelling. Tribol. Lett. 2014, 53, 27–41. [Google Scholar] [CrossRef]
- Zhuang, H.; Ding, J.; Chen, P.; Chang, Y.; Zeng, X.; Yang, H.; Liu, X.; Wei, W. Effect of surface waviness on the performances of an aerostatic thrust bearing with orifice-type restrictor. Int. J. Precis. Eng. Manuf. 2021, 22, 1735–1759. [Google Scholar] [CrossRef]
- Wang, X.; Zhou, L.; Huang, M.; Yue, X.; Xu, Q. Numerical investigation of journal misalignment on the static and dynamic characteristics of aerostatic journal bearings. Measurement 2018, 128, 314–324. [Google Scholar] [CrossRef]
- Chen, P.; Ding, J.; Zhuang, H.; Chang, Y. A novel method for studying fluid-solid interaction problems of the rotor system in air bearings with manufacturing errors. Mech. Syst. Signal Process. 2023, 202, 110709. [Google Scholar] [CrossRef]
- Li, R.; Li, Y.; Wang, P.; Ye, Y.; Li, X.; Chen, Y. Influence of Manufacturing Errors on Static and Dynamic Performances of Aerostatic Spindle. Mech. Sci. Technol. Aerosp. Eng. 2024, 43, 650–659. [Google Scholar]
- Lin, J. Surface roughness effect on the dynamic stiffness and damping characteristics of compensated hydrostatic thrusts bearings. Int. J. Mach. Tools Manuf. Des. Res. Appl. 2000, 40, 1671–1689. [Google Scholar] [CrossRef]
- Kumar, R.; Azam, M.S.; Ghosh, S.K. Influence of stochastic roughness on performance of a Rayleigh step bearing operating under Thermo-elastohydrodynamic lubrication considering shear flow factor. Tribol. Int. 2019, 134, 264–280. [Google Scholar] [CrossRef]
- Zhang, P. Accuracy prediction model of an orifice-compensated aerostatic bearing. Precis. Eng. 2021, 72, 837–846. [Google Scholar] [CrossRef]
- Chen, P.; Ding, J.; Zhuang, H.; Chang, Y.; Liu, X. Influence of manufacturing errors and misalignment on the performances of air journal bearings considering inertia effects based on SUPG finite element method. Measurement 2022, 189, 110443. [Google Scholar] [CrossRef]
- Ji Hua Laboratory. A Dual-Axis Air-Bearing Platform with Dynamic Tilt Compensation, Control Method and Exposure Machine. CN202411522424.4, 17 December 2024. [Google Scholar]
- Cui, H.; Wang, Y.; Yue, X.; Huang, M.; Wang, W.; Jiang, Z. Numerical analysis and experimental investigation into the effects of manufacturing errors on the running accuracy of the aerostatic porous spindle. Tribol. Int. 2018, 118, 20–36. [Google Scholar] [CrossRef]
- Sharma, S.C.; Phalle, V.M.; Jain, S.C. Combined Influence of Wear and Misalignment of Journal on the Performance Analysis of Three-Lobe Three-Pocket Hybrid Journal Bearing Compensated with Capillary Restrictor. J. Tribol. 2012, 134, 011703-1–011703-11. [Google Scholar] [CrossRef]
- COIMS. LTD High Precision Air Bearing Stage with Capability of Parasitic Error Compensation. US202217668425, 10 October 2023. [Google Scholar]
- Michalec, M.; Polnický, V.; Foltýn, J.; Svoboda, P.; Šperka, P.; Hurník, J. The prediction of large-scale hydrostatic bearing pad misalignment error and its compensation using compliant support. Precis. Eng. 2022, 75, 67–79. [Google Scholar] [CrossRef]
- Zhang, J.; Zhao, H.; Zou, D.; Ta, N.; Rao, Z. Comparison study of misalignment effect along two perpendicular directions on the stability of rigid rotor-aerostatic journal bearing system. Proc. Inst. Mech. Eng. Part J J. Eng. Tribol. 2020, 234, 1618–1634. [Google Scholar] [CrossRef]
- Ning, Y.; Li, Y.; Zhang, D. The effect of manufacturing errors on the performance of a gas-dynamic bearing gyroscope. Machines 2022, 10, 1010. [Google Scholar] [CrossRef]
- An, C.H.; Zhang, Y.; Xu, Q.; Zhang, F.H.; Zhang, J.F.; Zhang, L.J.; Wang, J.H. Modeling of dynamic characteristic of the aerostatic bearing spindle in an ultra-precision fly cutting machine. Int. J. Mach. Tools Manuf. 2010, 50, 374–385. [Google Scholar] [CrossRef]
- Mallya, R.; Shenoy, S.B.; Pai, R. Static characteristics of misaligned multiple axial groove water-lubricated bearing in the turbulent regime. Proc. Inst. Mech. Eng. Part J J. Eng. Tribol. 2017, 231, 385–398. [Google Scholar] [CrossRef]
- Sanying Precision (Tianjin) Instrument Equipment Co., Ltd. A High-Precision Air-Bearing Motion Platform and Method for Wafer Inspection. CN202111374217.5, 14 June 2024. [Google Scholar]
- Sun, Y.; Hong, J.; Liu, Z.; Guo, J. A Calculating Method for the Geometric Rotation Accuracy of Precision Spindles Considering the Manufacturing Errors of Component Parts. J. Mech. Eng. 2017, 53, 173–182. [Google Scholar] [CrossRef]
- Zhang, G.; Zheng, J.; Yu, H.; Chen, T.; Shan, S.; Peng, C. Influence of shape errors and inertia effects on the error motion of the aerostatic spindle. Proc. Inst. Mech. Eng. Part J J. Eng. Tribol. 2024, 238, 260–271. [Google Scholar] [CrossRef]
- Xiao, H.; Li, W.; Zhou, Z.; Huang, X.; Ren, Y. Performance analysis of aerostatic journal micro-bearing and its application to high-speed precision micro-spindles. Tribol. Int. 2018, 120, 476–490. [Google Scholar] [CrossRef]
- Banerjee, M.B.; Shandil, R.G.; Katyal, S.P.; Dube, G.S.; Pal, T.S.; Banerjee, K. A nonlinear theory of hydrodynamic lubrication. J. Math. Anal. Appl. 1986, 117, 48–56. [Google Scholar] [CrossRef]
- Hamrock, B.J.; Schmid, S.R.; Jacobson, B.O. Fundamentals of Fluid Film Lubrication; Taylor and Francis: Milton Park, UK; CRC Press: Boca Raton, FL, USA, 2004. [Google Scholar]
- Pinkus, O.; Lund, J.W. Centrifugal Effects in Thrust Bearings and Seals Under Laminar Conditions. J. Lubr. Technol. 1981, 103, 126–136. [Google Scholar] [CrossRef]
- Zhang, G. Manufacturing Errors Modeling and Dynamic, Static Characteristics Research of High-Precision Aerostatic Spindle. Ph.D. Thesis, Xi’an University of Technology, Xi’an, China, 2024. [Google Scholar]


Disclaimer/Publisher’s Note: The statements, opinions and data contained in all publications are solely those of the individual author(s) and contributor(s) and not of MDPI and/or the editor(s). MDPI and/or the editor(s) disclaim responsibility for any injury to people or property resulting from any ideas, methods, instructions or products referred to in the content. |
© 2025 by the authors. Licensee MDPI, Basel, Switzerland. This article is an open access article distributed under the terms and conditions of the Creative Commons Attribution (CC BY) license (https://creativecommons.org/licenses/by/4.0/).