Mechanisms of Adhesion Increase in Wet Sanded Wheel–Rail Contacts—A DEM-Based Analysis


Abstract
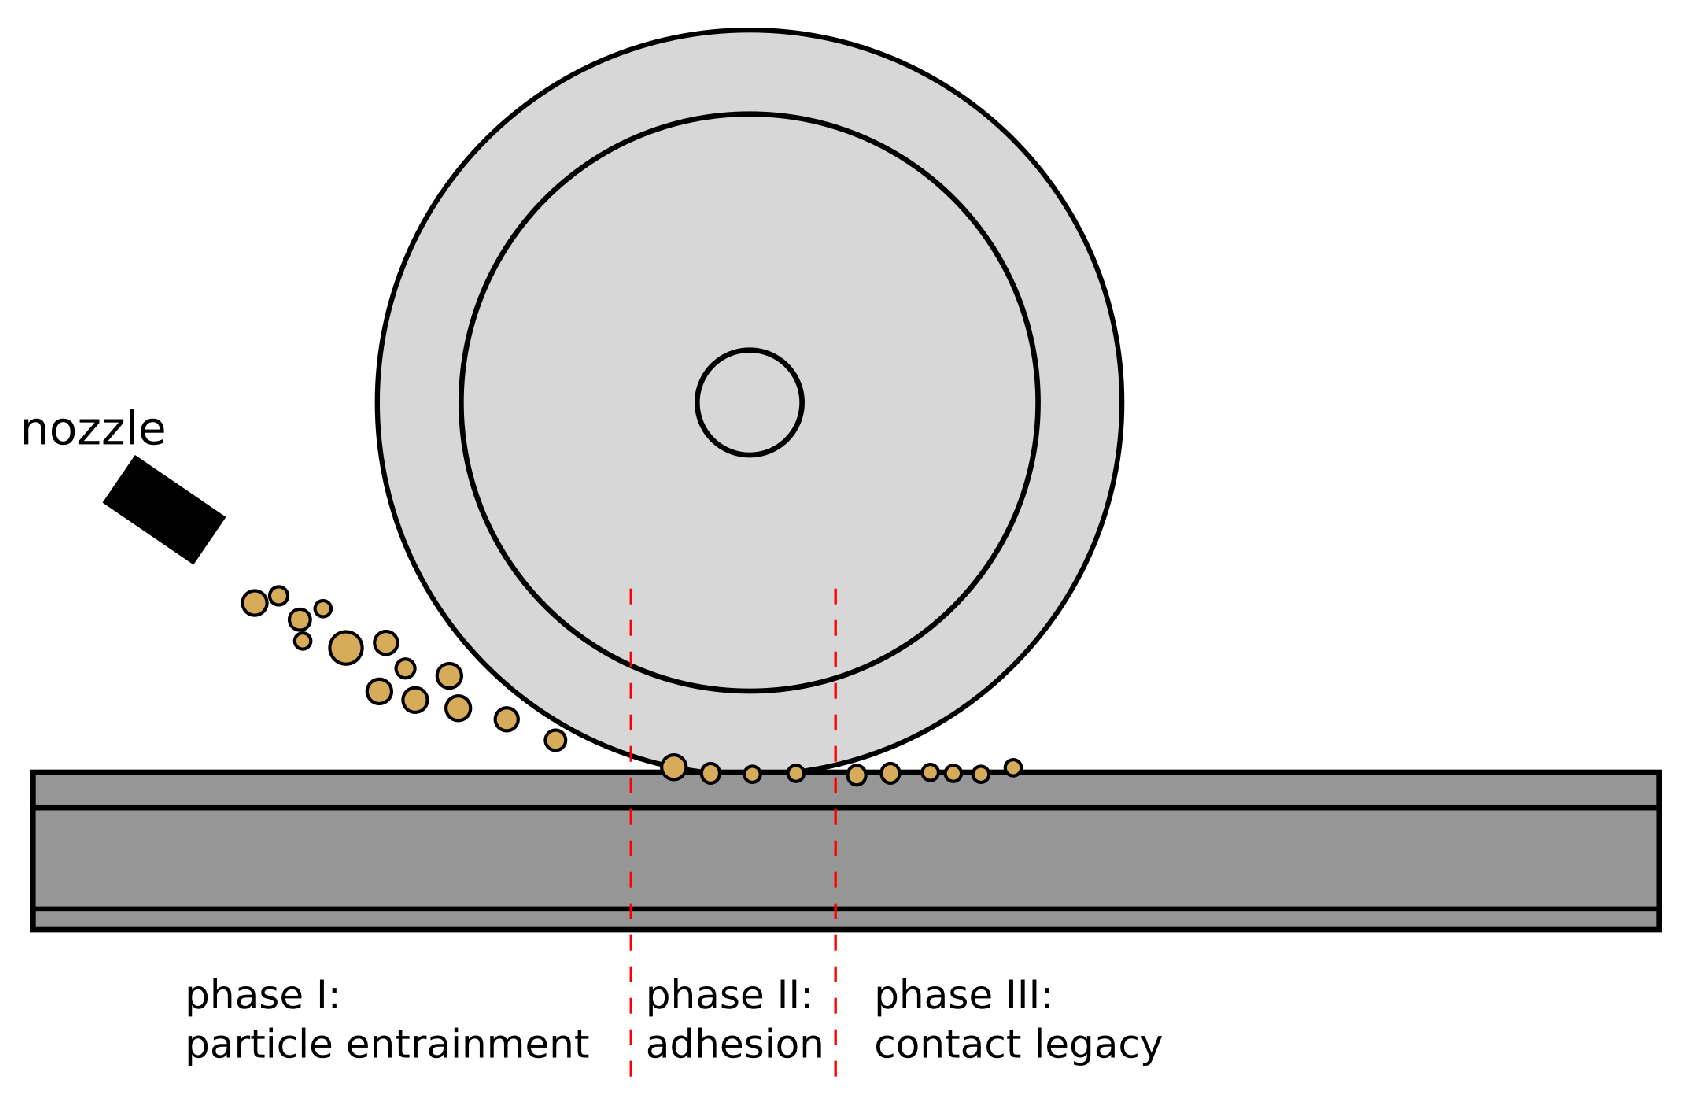
1. Introduction
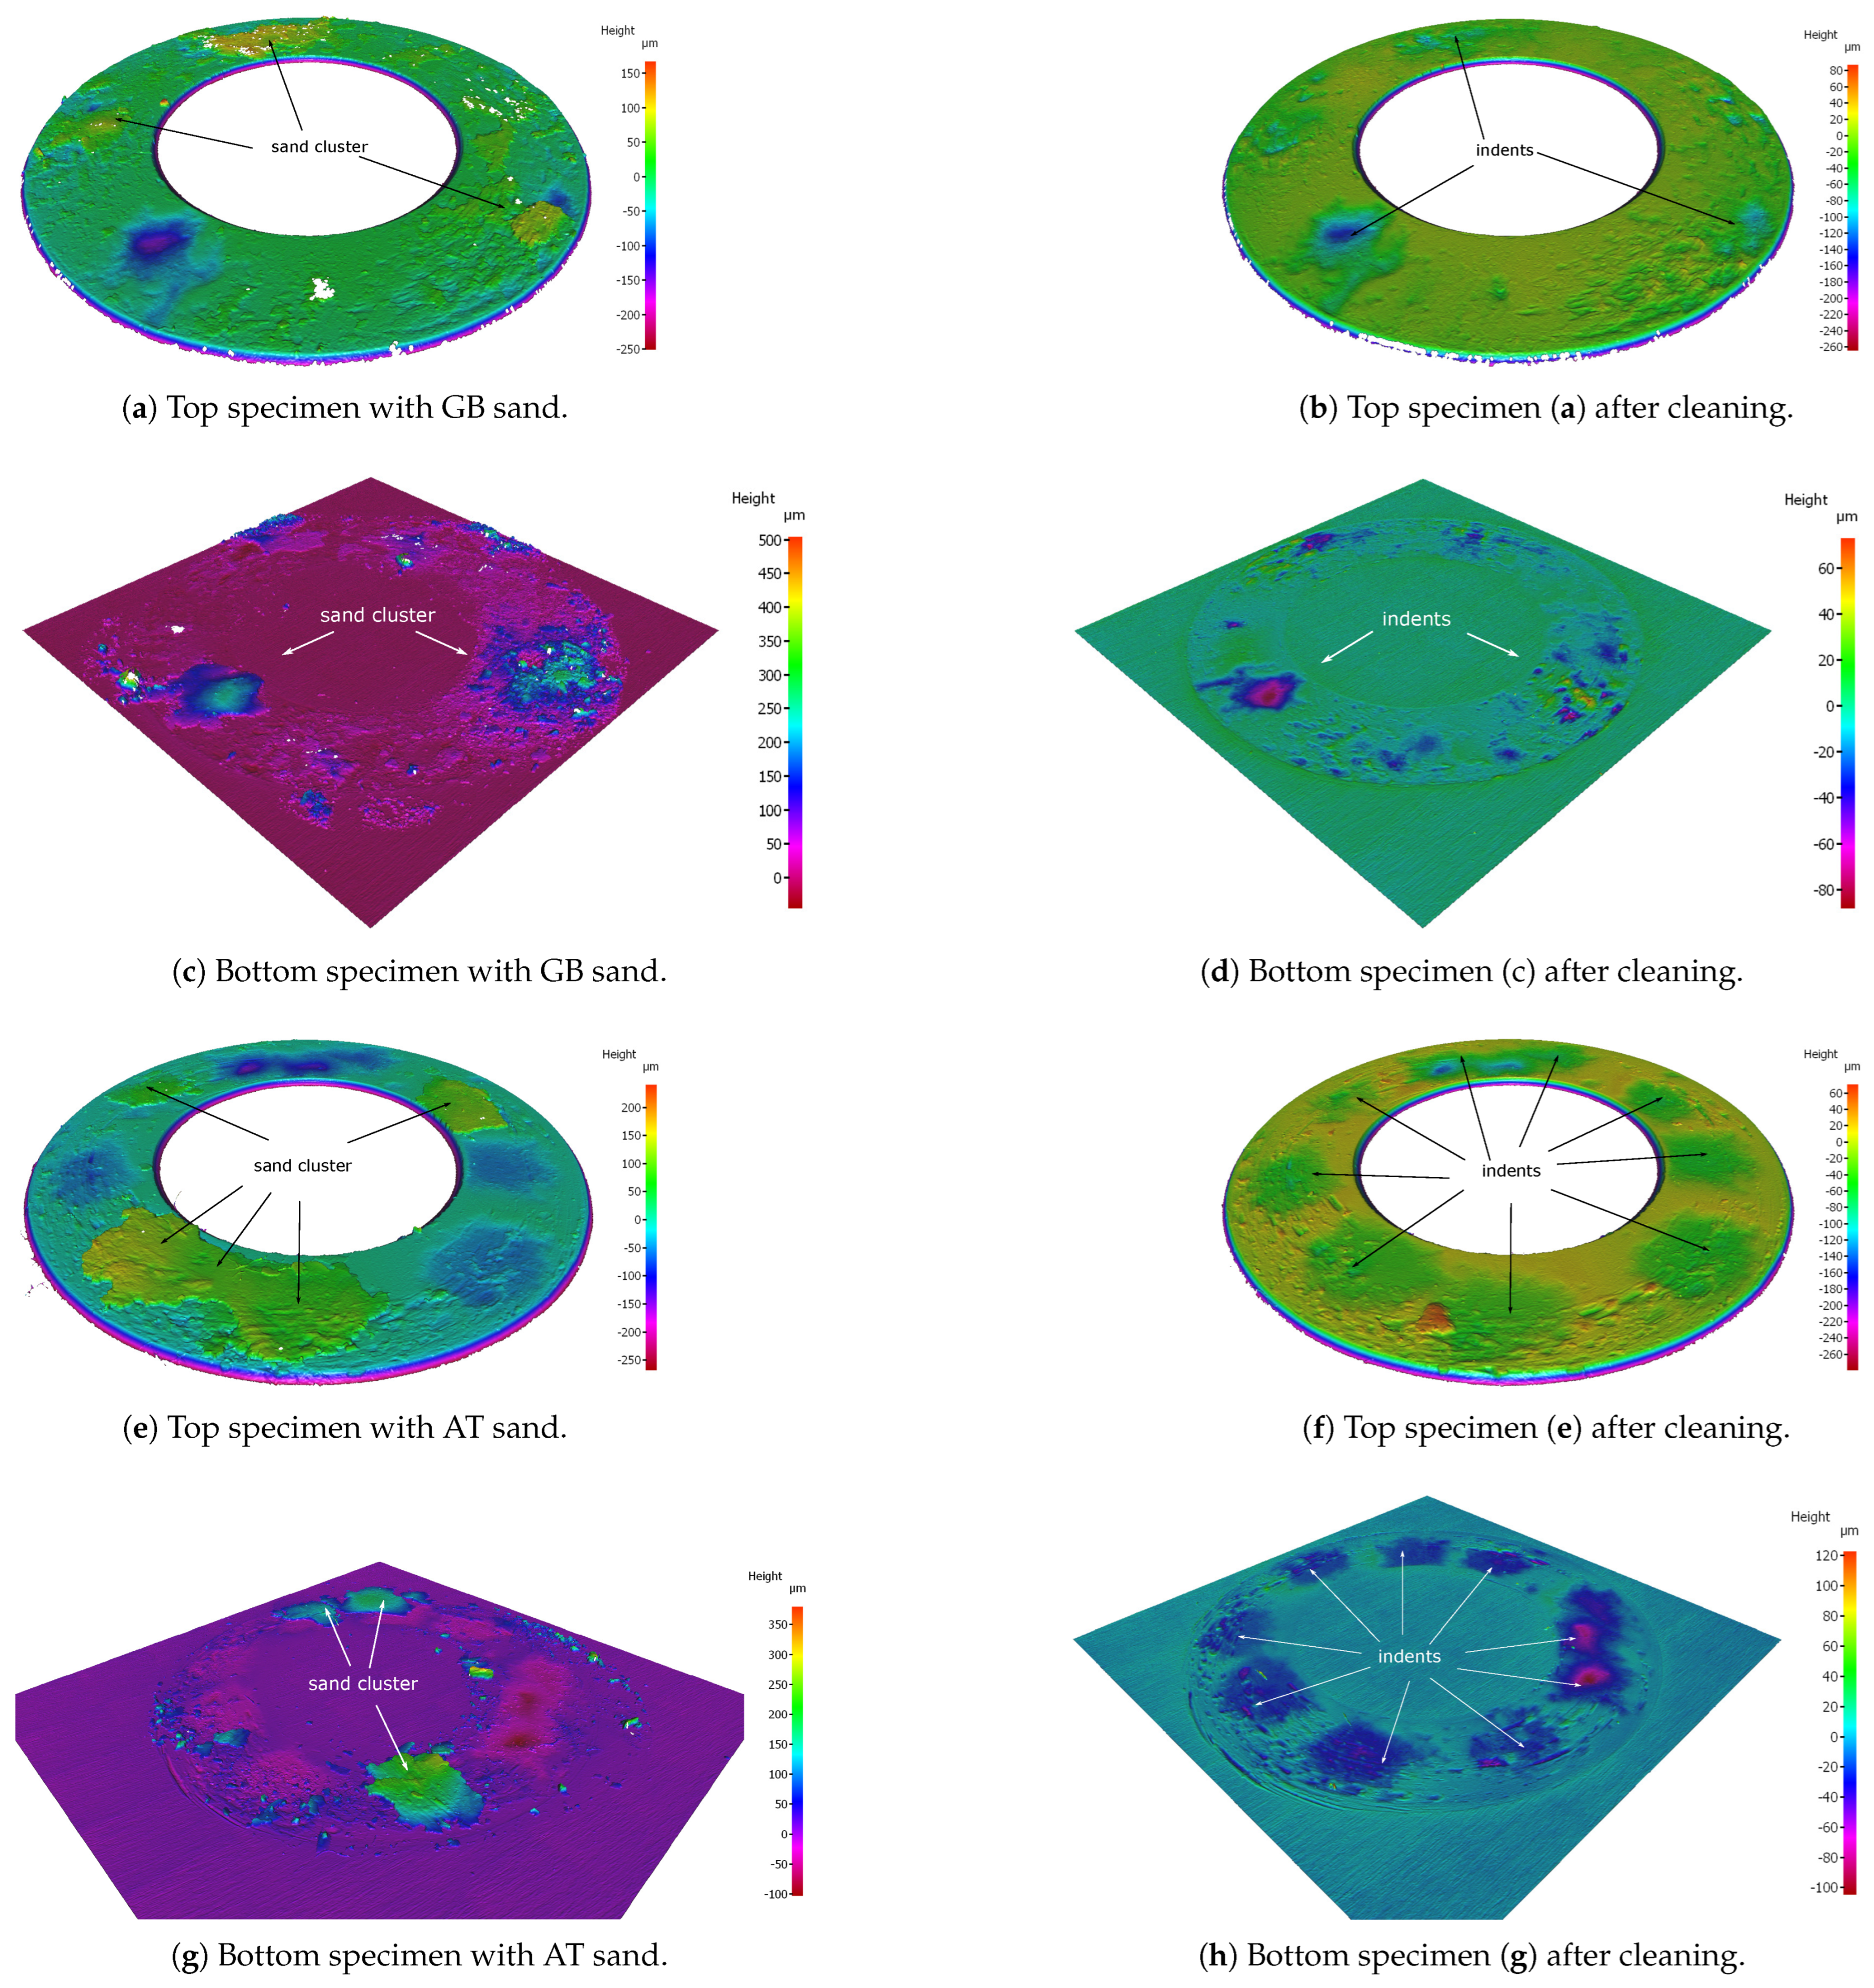
2. Experimental Results of High-Pressure Torsion (HPT) Tests
3. DEM Modelling of a Sanded Wheel–Rail Contact
4. HPT Test Simulation Under Wet Conditions
4.1. Unsanded HPT Test
4.2. Sanded HPT Tests: Crushing Phase
4.3. Sanded HPT Tests: Shearing Phase
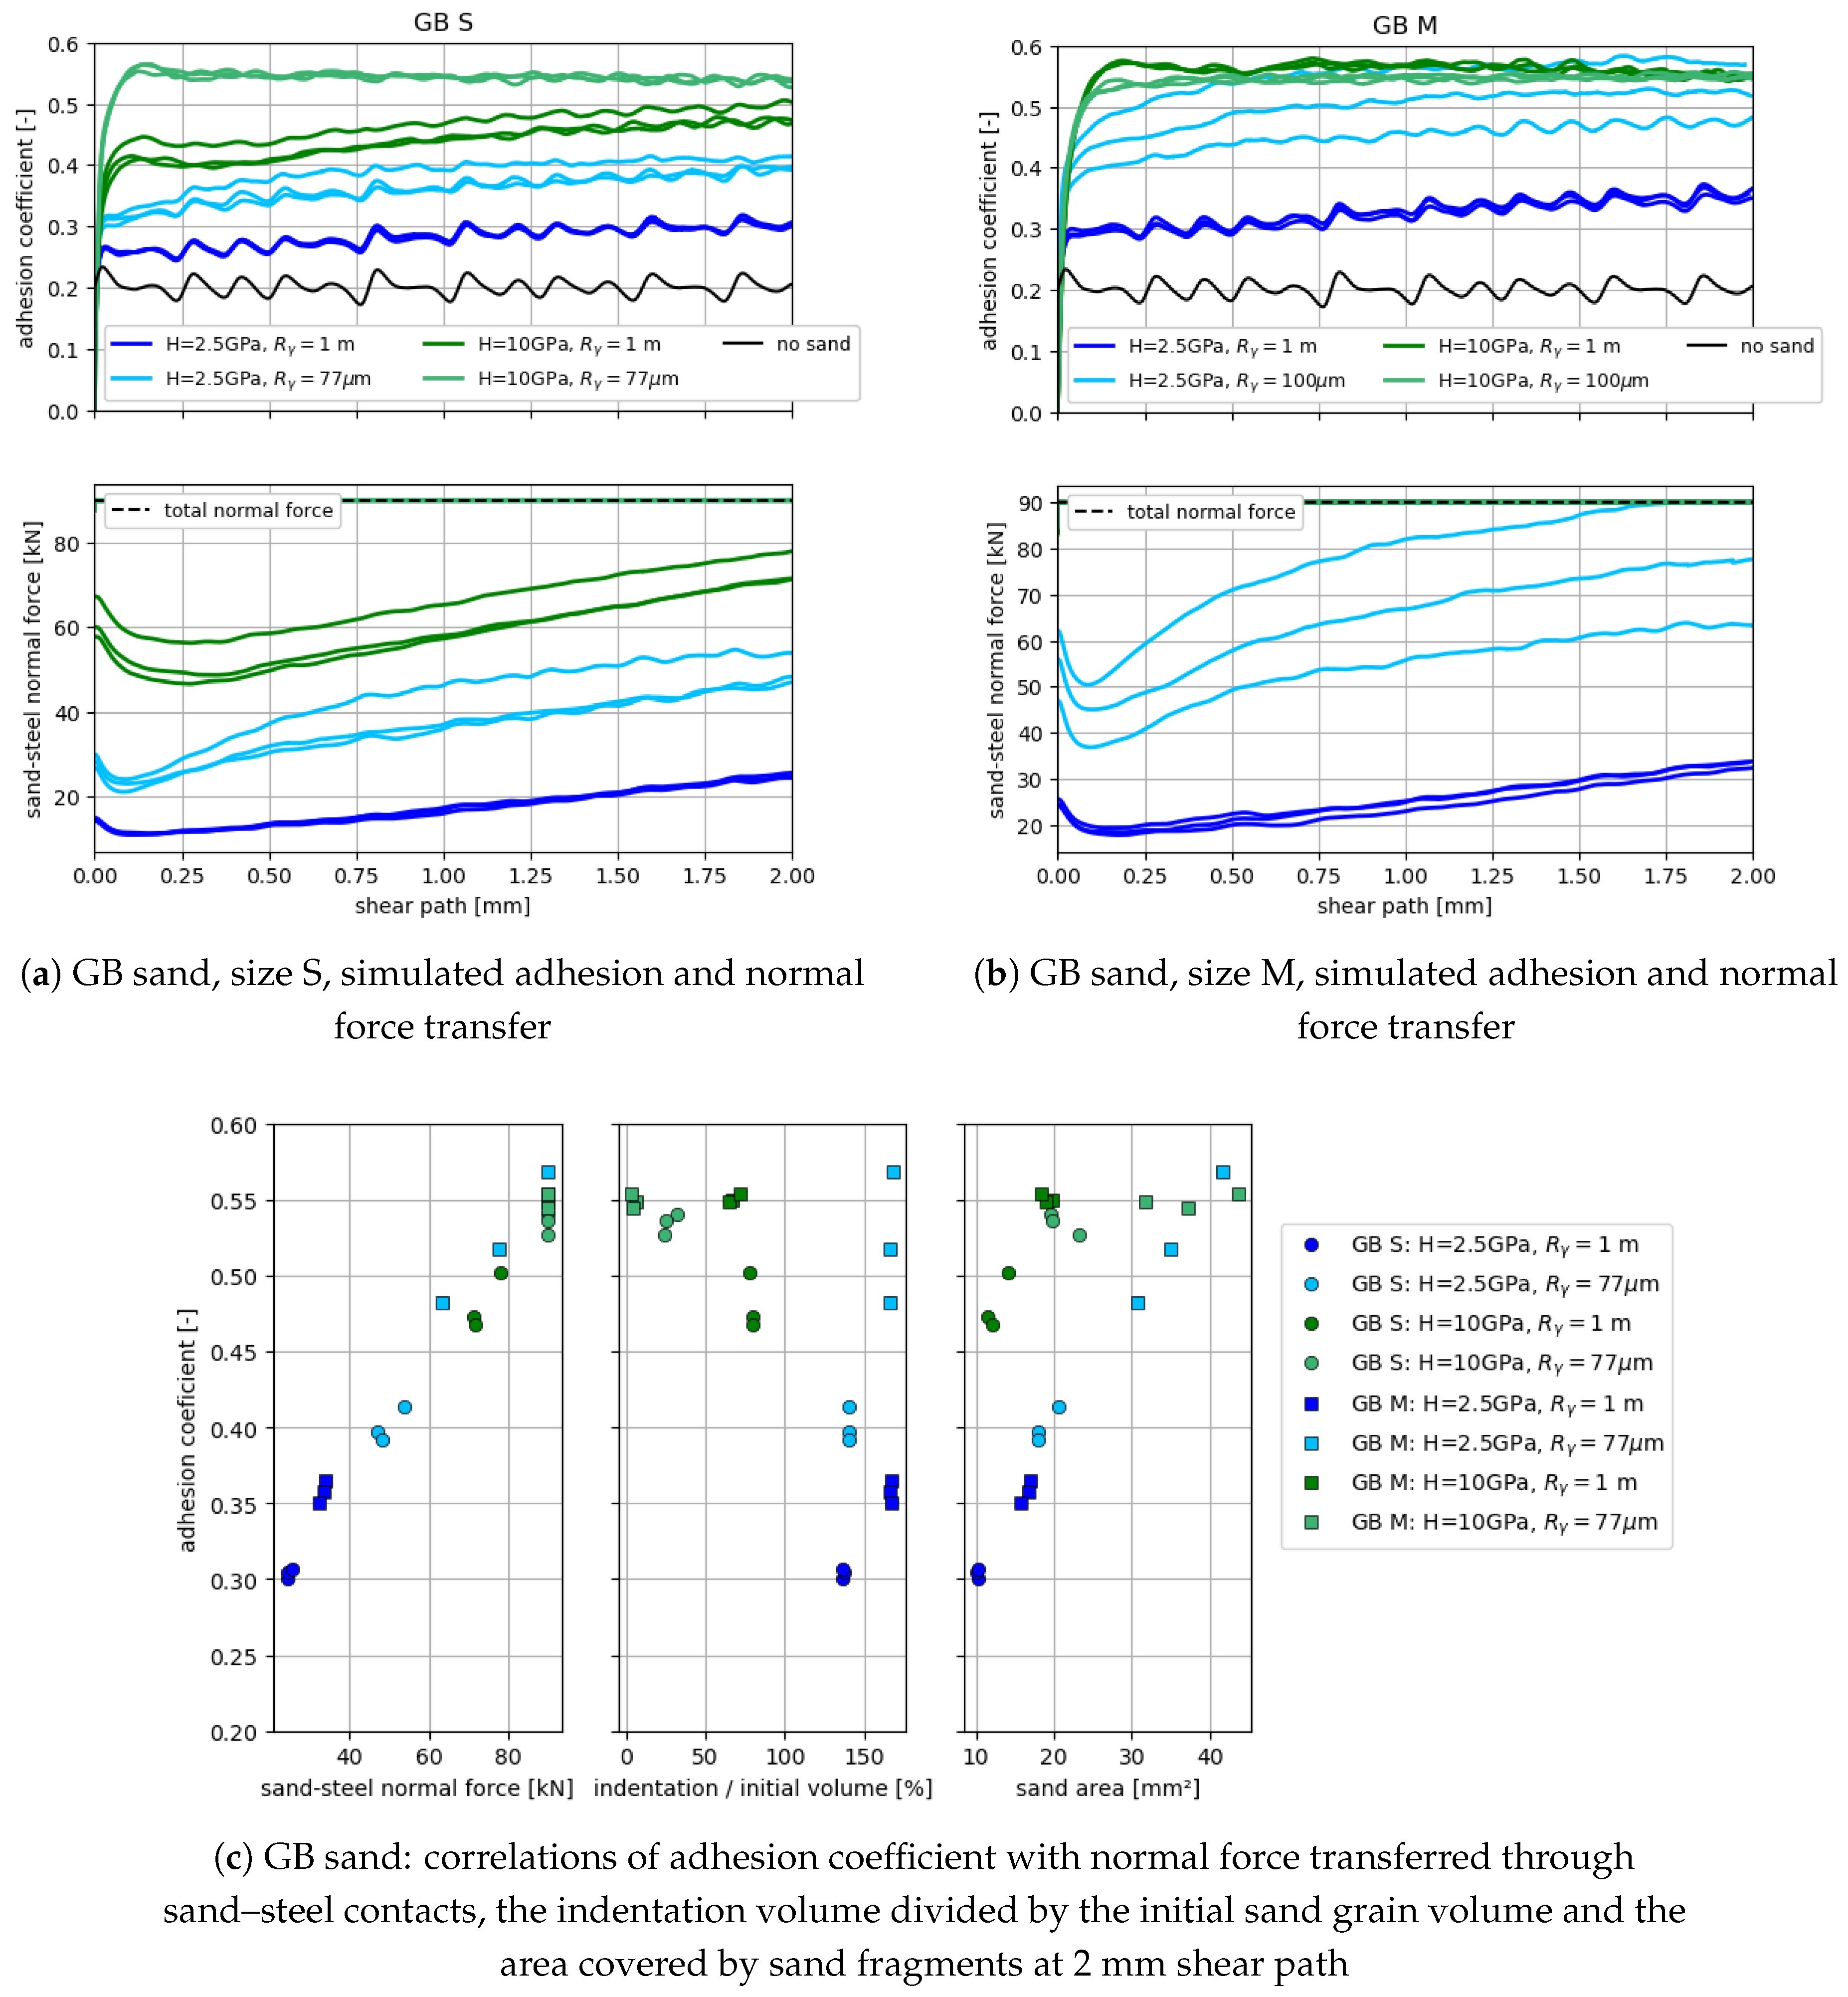
4.3.1. Parameter Variations in the Shearing Phase
4.3.2. Shearing of GB and AT Sand
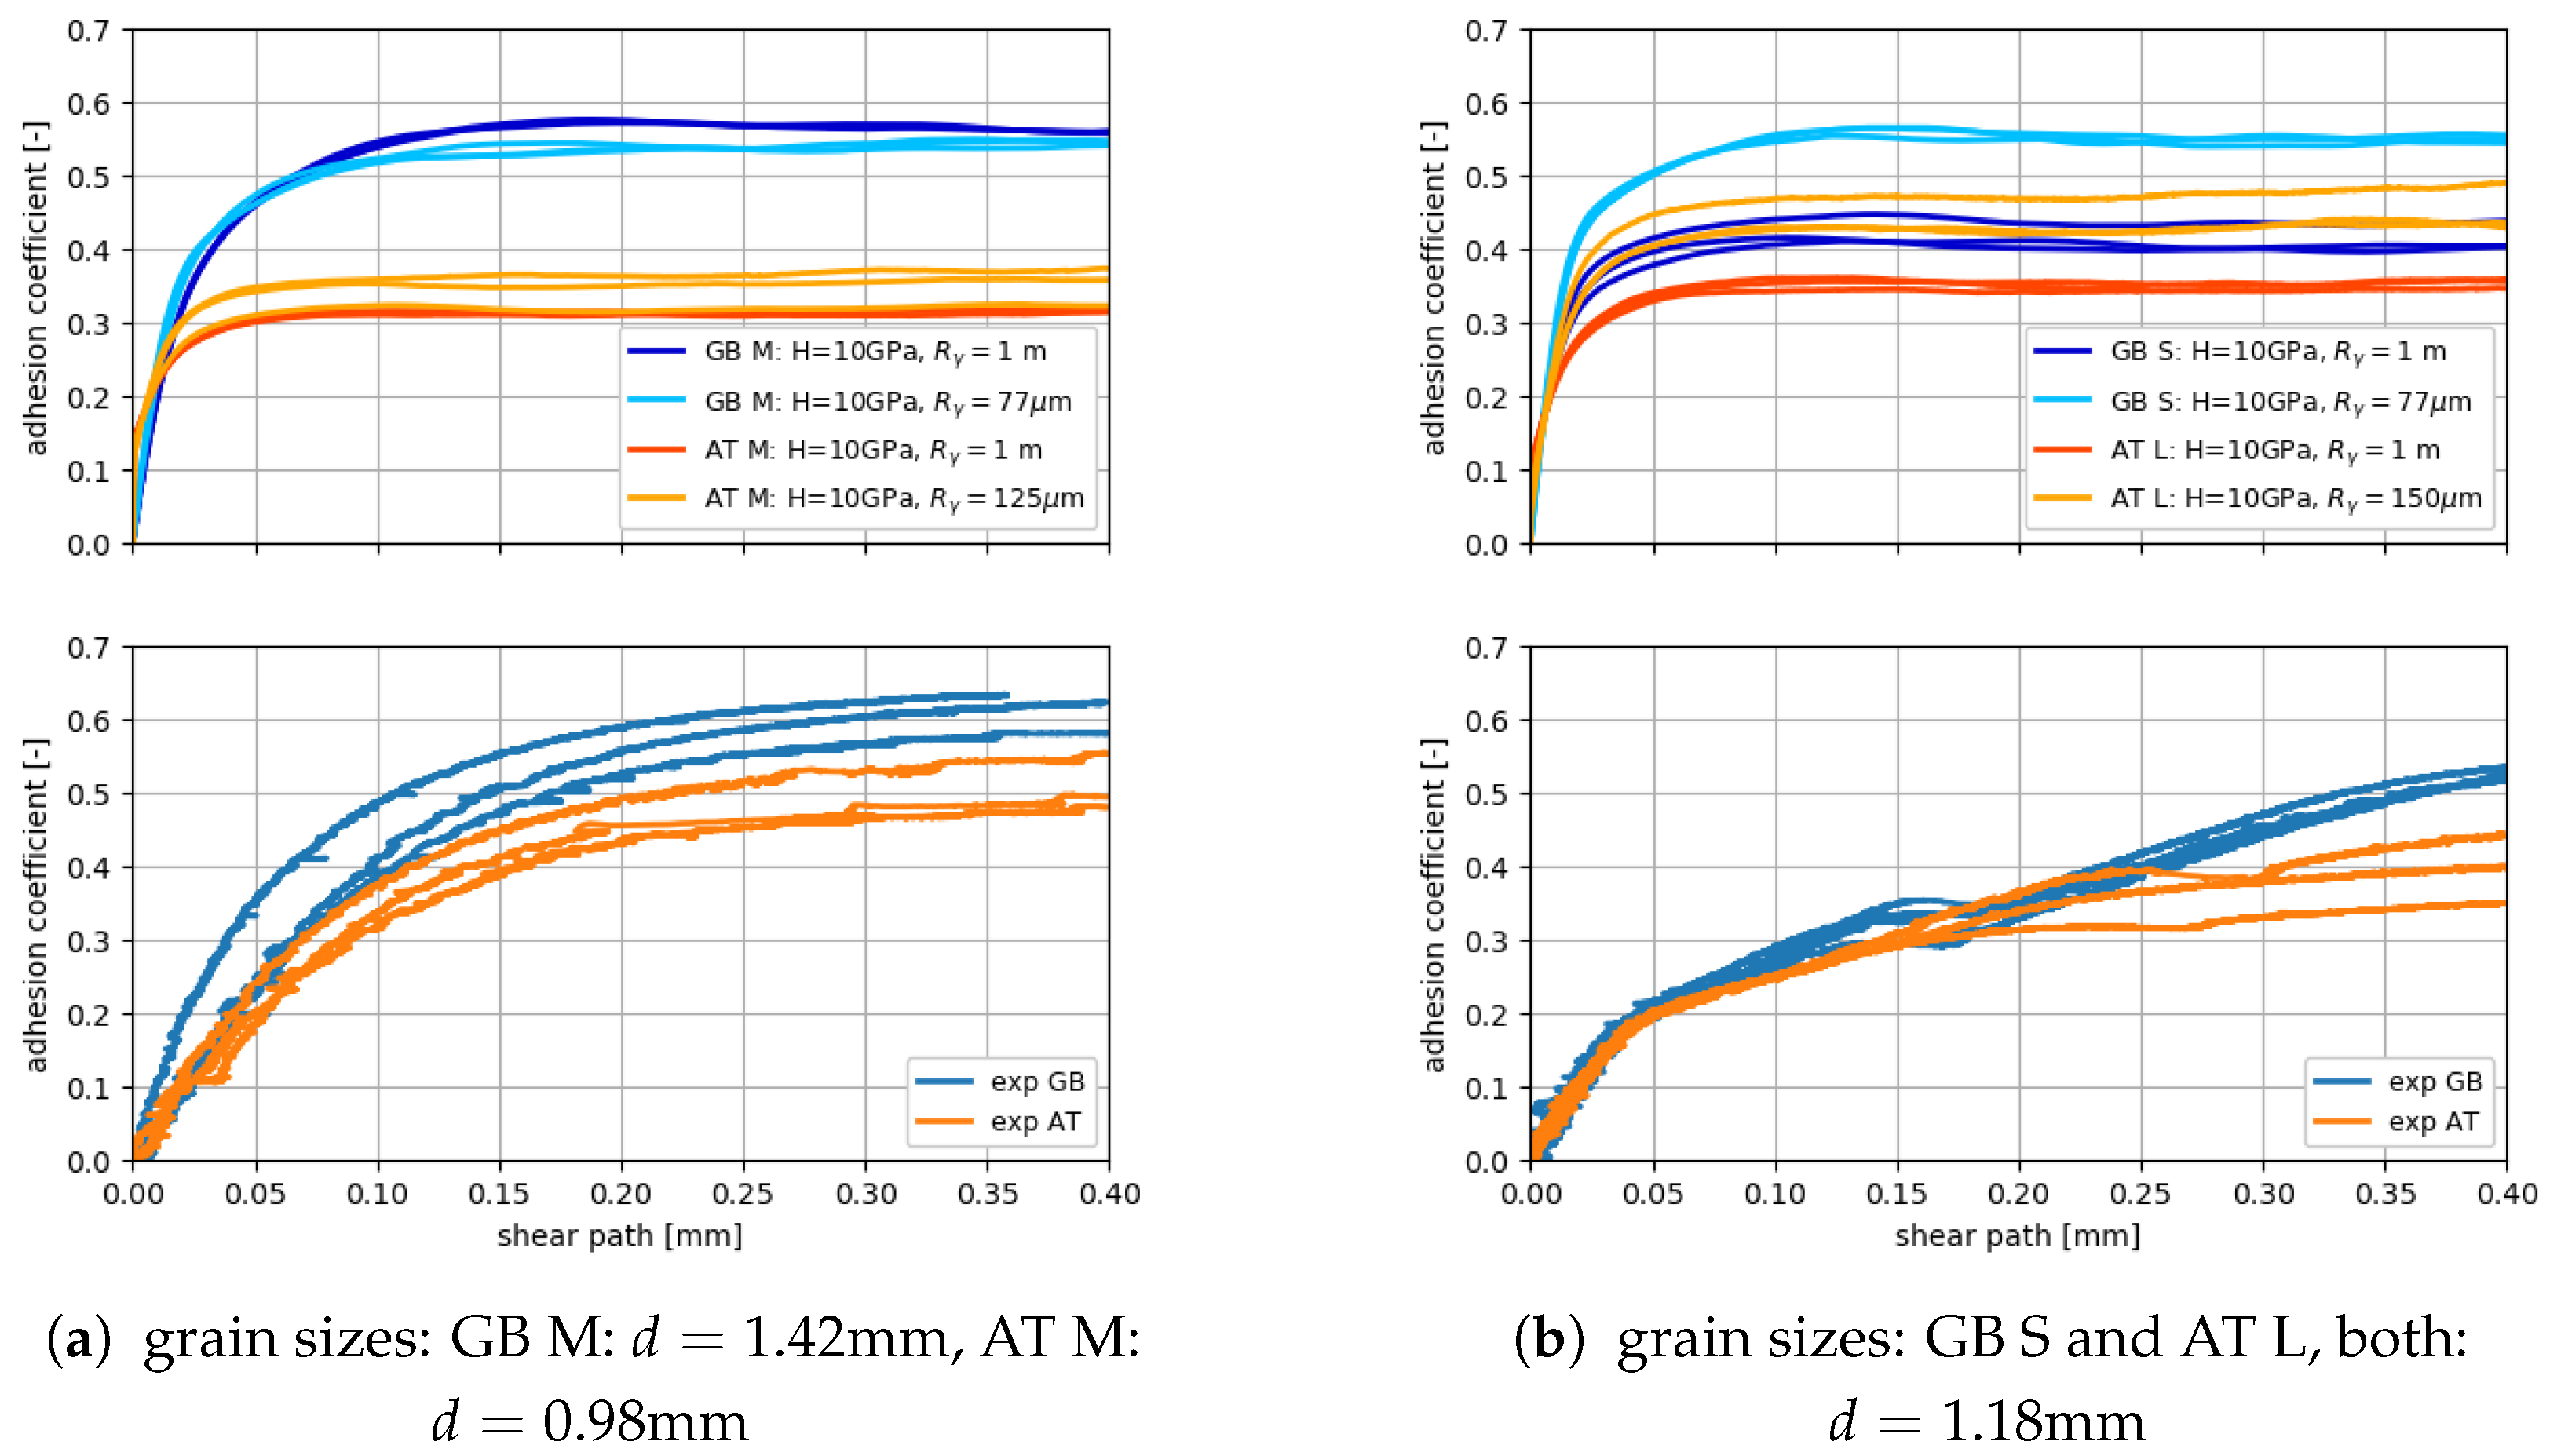
4.4. Sanded HPT Test: Comparing Results for AT and GB Sand to Experiments
5. Conclusions and Outlook
- The coefficient of friction between sand and steel strongly influences the maximal simulated adhesion.
- Associated with this, the higher the amount of normal force being transferred through sand–steel contacts, the higher the simulated adhesion (assuming that the coefficient of friction is higher for sand–steel contacts than for wet steel–steel contacts). A maximal value is reached for separated steel surfaces; thus, the complete normal force is transferred through sand–steel contacts.
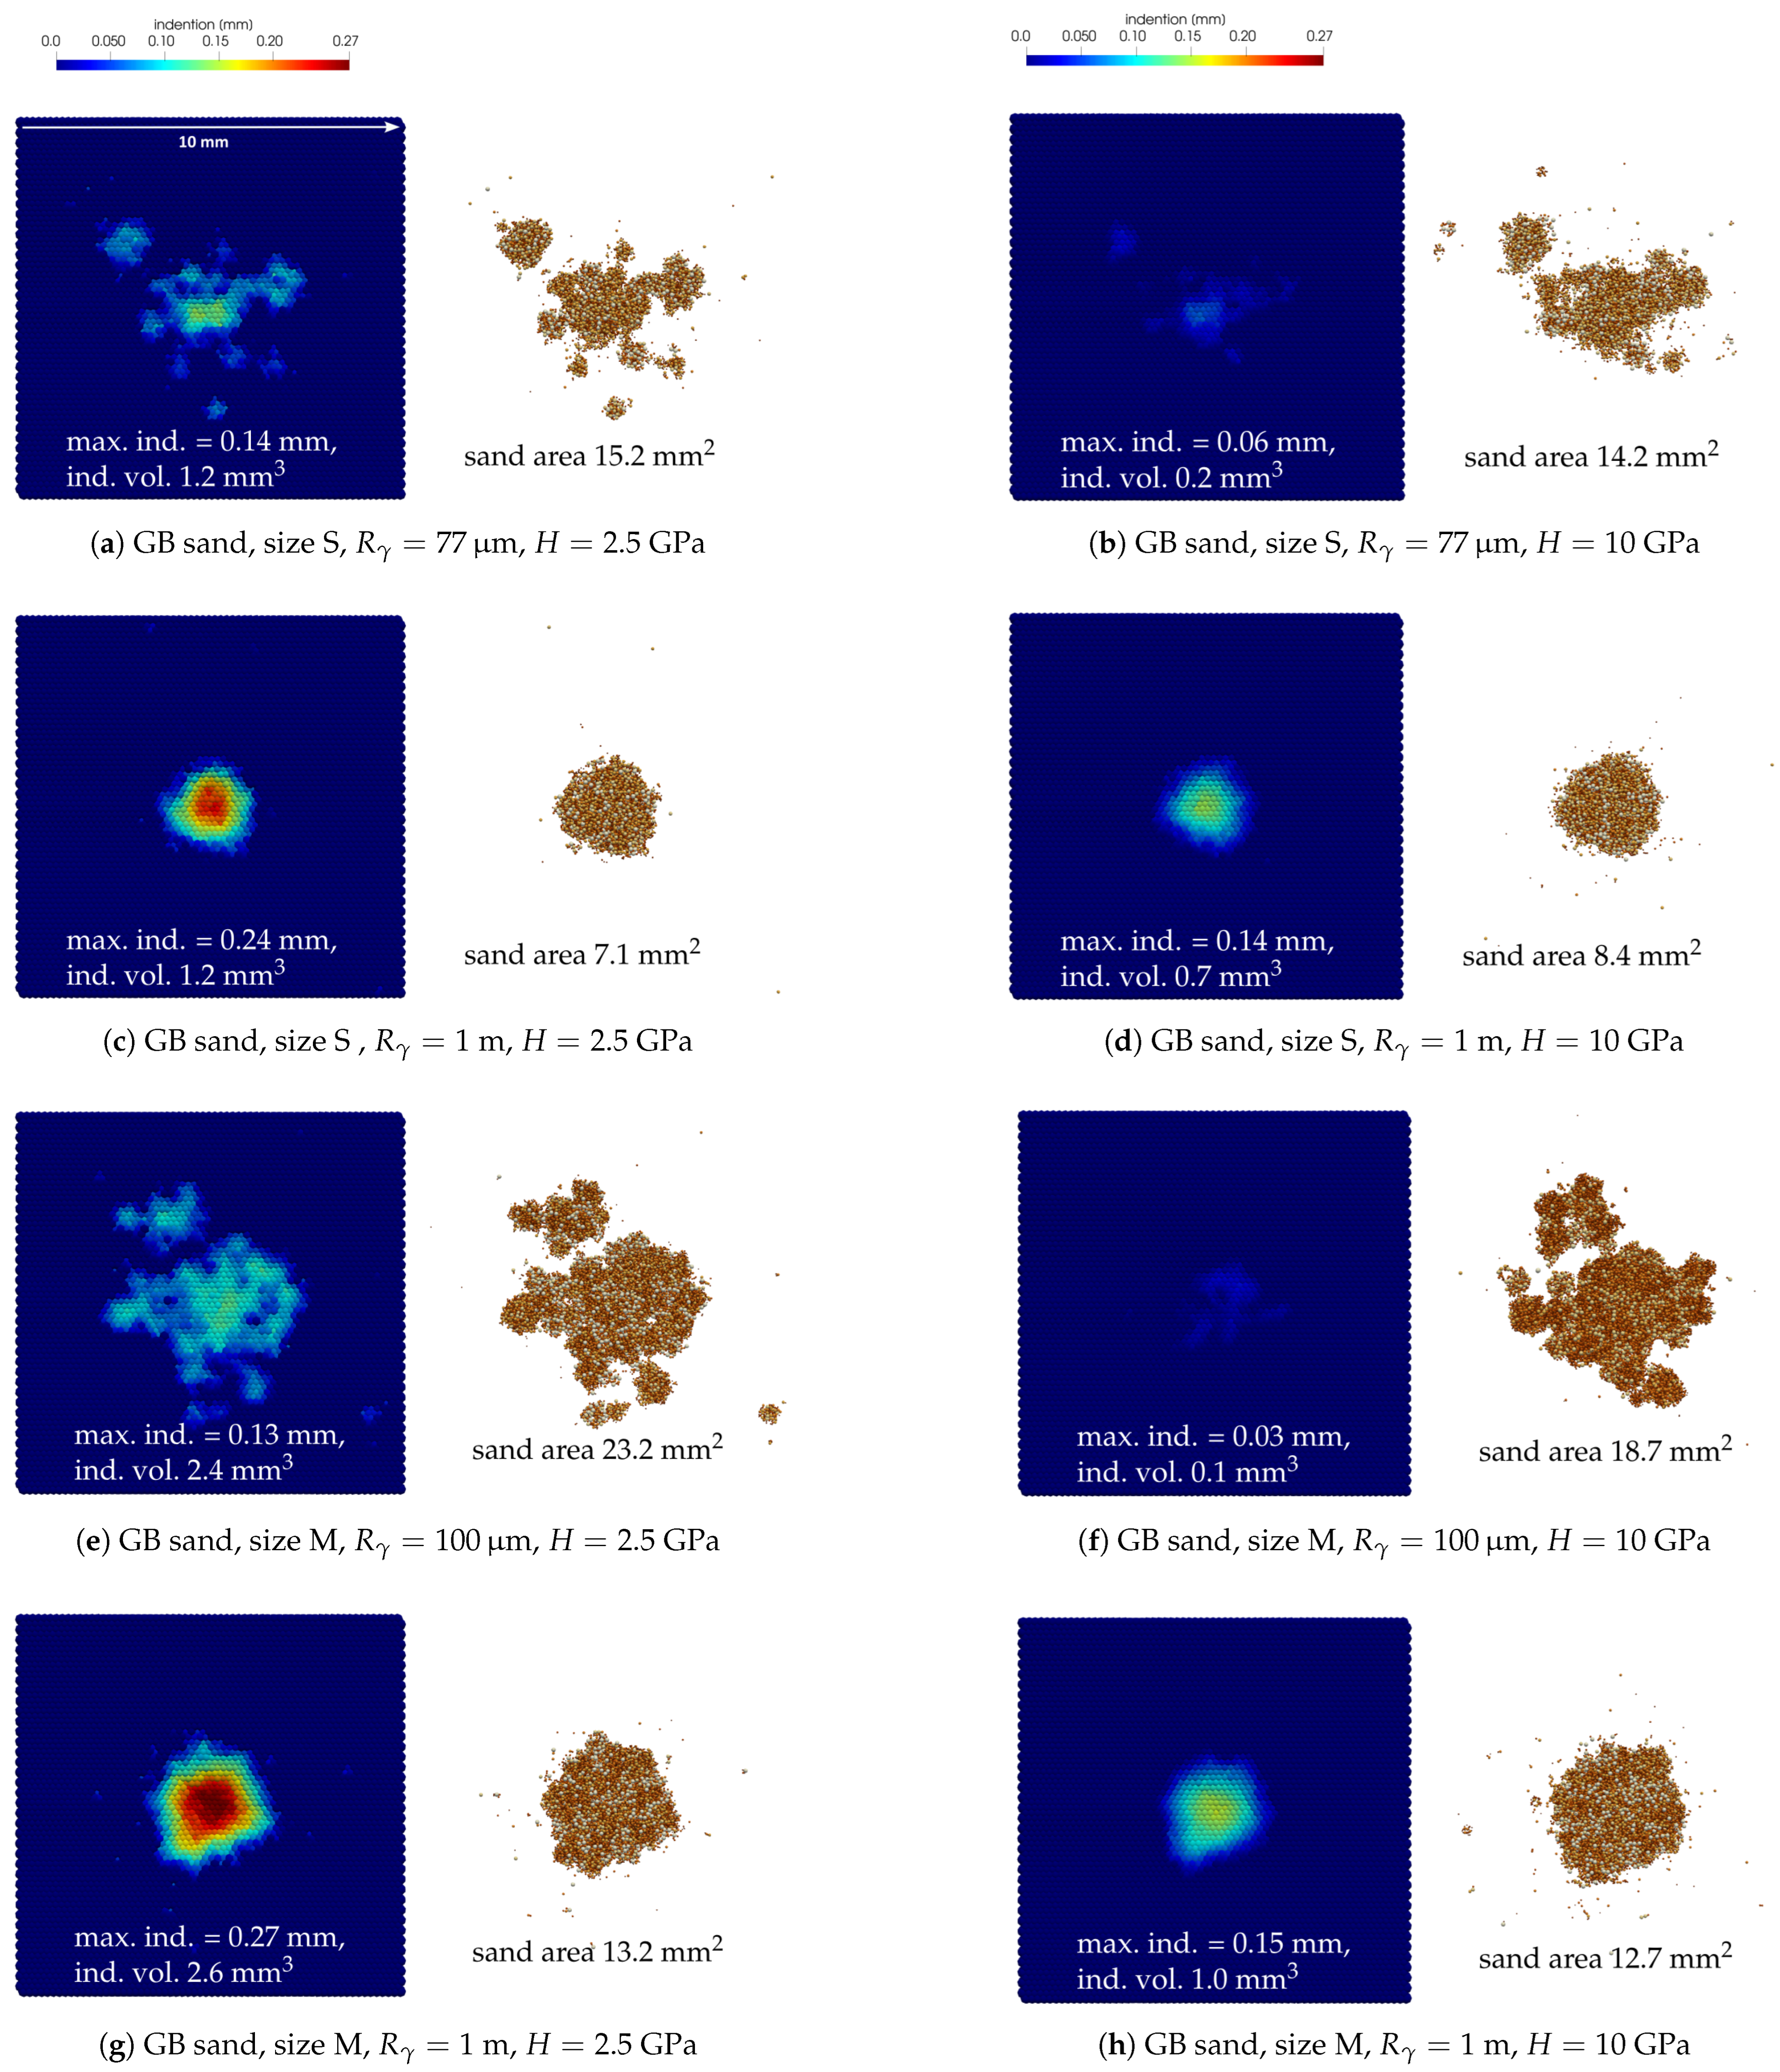
- Larger sizes of the initial sand grain and higher fragment spread both result in a larger area covered by sand fragments.
- Higher steel hardness results in reduced indentation.
- Both effects lead to a higher amount of normal force being transferred through sand–steel contacts and thus promote separation of steel surfaces.
- Full surface separation happens very rarely in practical wheel–rail sanding and could lead to problems in train detection.
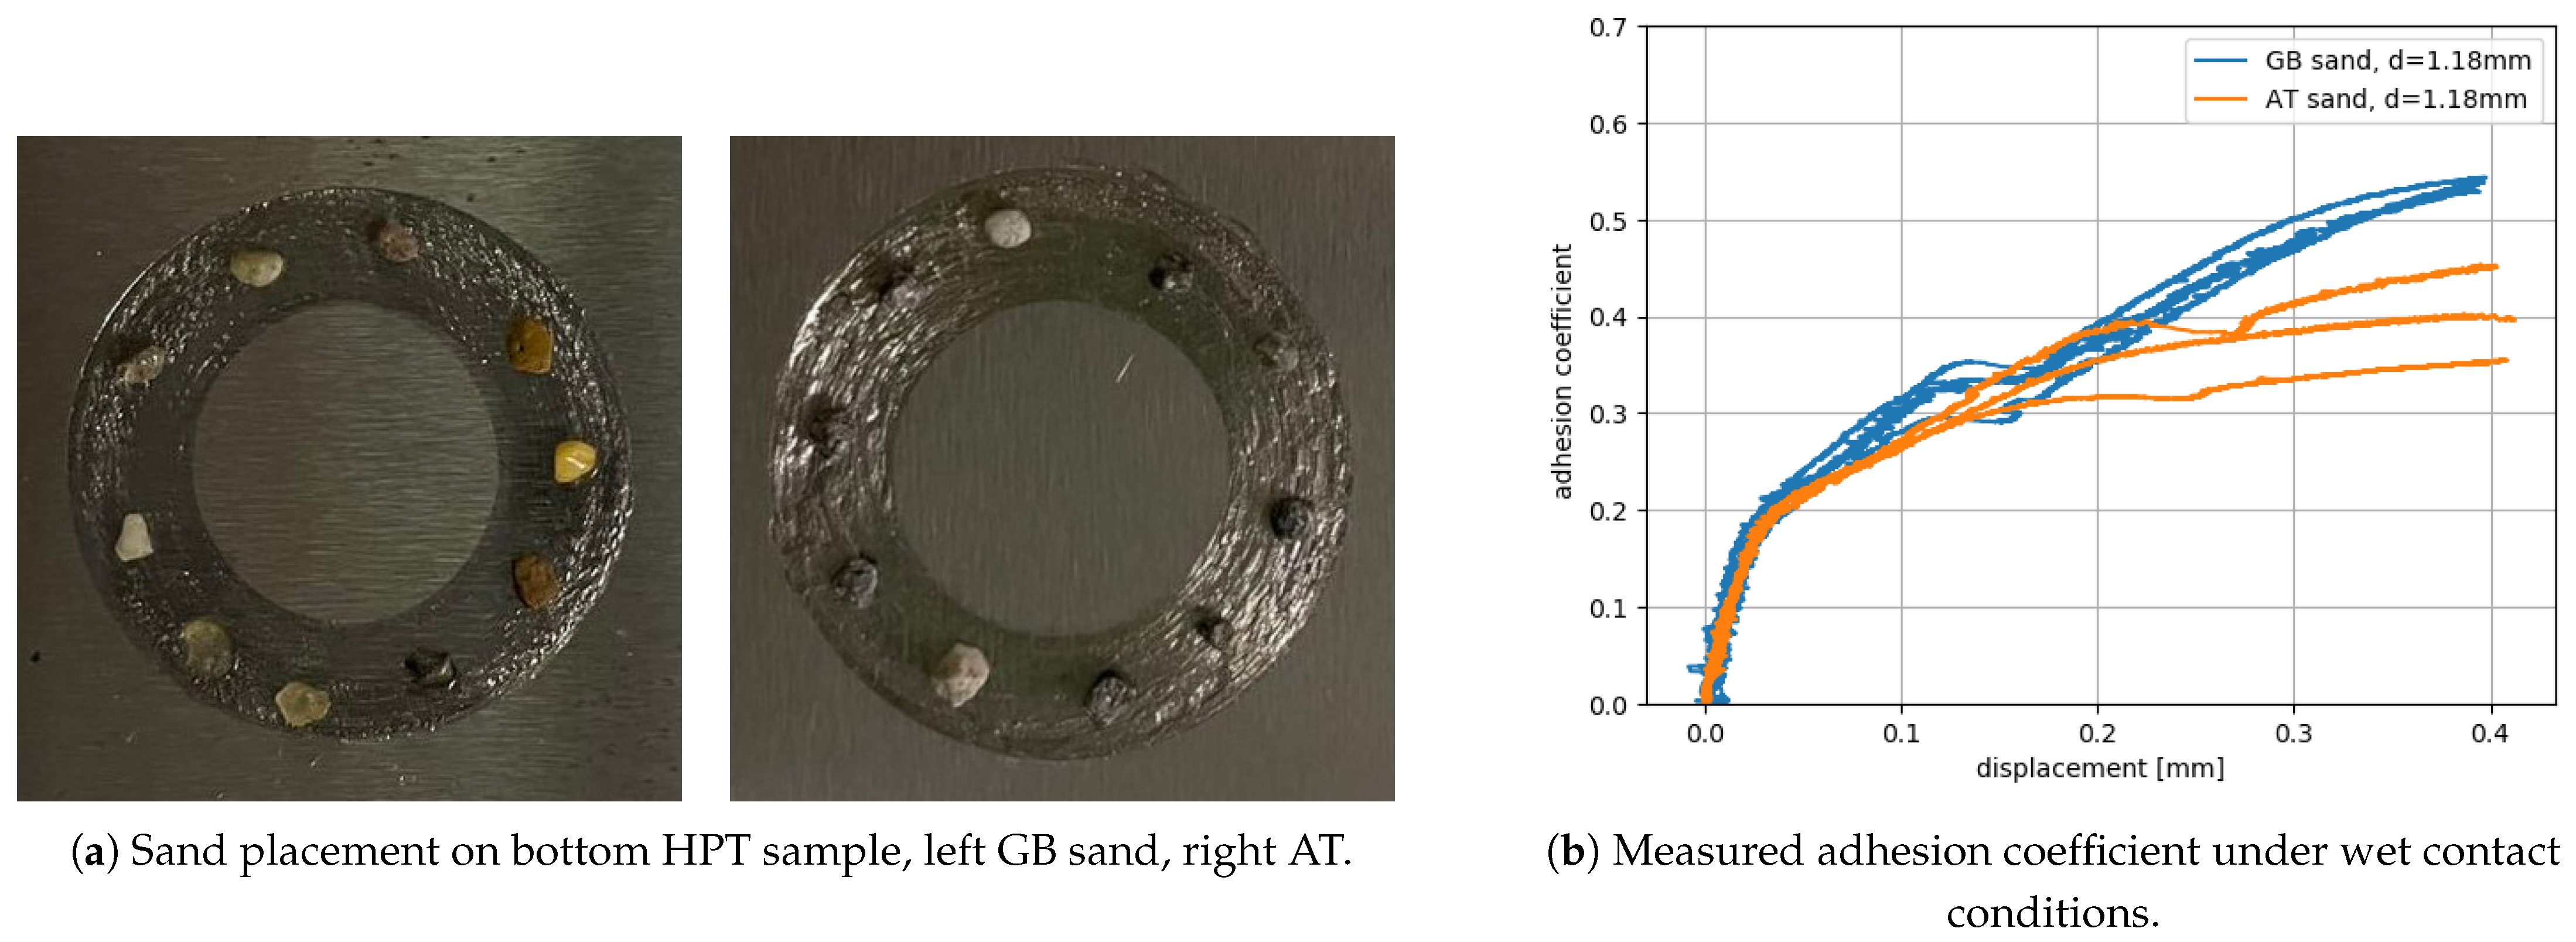
- Two measurements of wet HPT tests are available: First, average-sized initial grains are used for GB and AT sands. Second, the same initial grain size is used. In both cases, GB sand shows higher measured adhesion than AT sand.
- A comparison between simulations and experiments is conducted qualitatively. For both cases, simulated adhesion is higher for GB sand. Thus, simulation and experimental results are in qualitative agreement.
Author Contributions
Funding
Data Availability Statement
Conflicts of Interest
Abbreviations
| 3BL | third body layer |
| AC | maximal adhesion coefficient |
| AT sand | rail sand used in Austria |
| DEM | Discrete Element Method |
| DMT | Derjaguin–Muller–Toporov cohesion model |
| GB sand | rail sand used in Great Britain |
| HPT test | High-Pressure Torsion test |
| PSD curve | particle size distribution curve |
| R8T steel | steel used for manufacturing wheels |
| R2600 steel | steel used for manufacturing rails |
| Nomenclature | |
| d [m] | sphere diameter |
| [m] | mass median diameter |
| E [Pa] | Young’s modulus |
| [-] | Poisson’s ratio |
| [-] | coefficient of friction |
| [kg/] | density |
| [-] | coefficient of restitution |
| [m/s] | maximal fragment velocity after breakage |
| [m] | radius below which particles are considered unbreakable |
| [J/] | cohesion parameter |
| [m] | radius below which particles are considered cohesive |
| [Pa s] | dynamic viscosity |
| H [Pa] | hardness |
| [-] | mobilised friction |
References
- Eden, H.C.; Garnham, J.E.; Davis, C.L. Influential microstructural changes on rolling contact fatigue crack initiation in pearlitic rail steels. Mater. Sci. Technol. 2005, 21, 623–629. [Google Scholar] [CrossRef]
- Alwahdi, F.; Kapoor, A.; Franklin, F. Subsurface microstructural analysis and mechanical properties of pearlitic rail steels in service. Wear 2013, 302, 1453–1460. [Google Scholar] [CrossRef]
- Garnham, J.; Davis, C. Very early stage rolling contact fatigue crack growth in pearlitic rail steels. Wear 2011, 271, 100–112. [Google Scholar] [CrossRef]
- Chang, C.; Chen, B.; Cai, Y.; Wang, J. An experimental study of high speed wheel-rail adhesion characteristics in wet condition on full scale roller rig. Wear 2019, 440–441, 203092. [Google Scholar] [CrossRef]
- Descartes, S.; Desrayaud, C.; Niccolini, E.; Berthier, Y. Presence and role of the third body in a wheel-rail contact. Wear 2005, 258, 1081–1090. [Google Scholar] [CrossRef]
- Niccolini, E.; Berthier, Y. Wheel-rail adhesion: Laboratory study of “natural” third body role on locomotives wheels and rails. Wear 2005, 258, 1172–1178. [Google Scholar] [CrossRef]
- Singh, R.K.; Shindhe, M.; Rawat, P.; Srivastava, A.K.; Singh, G.K.; Verma, R.; Bhutto, J.K.; Hussein, H.S. The Effect of Various Contaminants on the Surface Tribological Properties of Rail and Wheel Materials: An Experimental Approach. Coatings 2023, 13, 560. [Google Scholar] [CrossRef]
- Vasic, G.; Franklin, F.J.; Kapoor, A.; Lucanin, V. Laboratory simulation of low-adhesion leaf film on rail steel. Int. J. Surf. Sci. Eng 2008, 2, 84–97. [Google Scholar] [CrossRef]
- Buckley-Johnstone, L.; Trummer, G.; Voltr, P.; Meierhofer, A.; Six, K.; Fletcher, D.; Lewis, R. Assessing the impact of small amounts of water and iron oxides on adhesion in the wheel/rail interface using High Pressure Torsion testing. Tribol. Int. 2019, 135, 55–64. [Google Scholar] [CrossRef]
- Olofsson, U.; Lyu, Y. Open System Tribology in the Wheel–Rail Contact—A Literature Review. Appl. Mech. Rev. 2017, 69, 060803. [Google Scholar] [CrossRef]
- Huang, W.; Cao, X.; Wen, Z.; Wang, W.; Liu, Q.; Zhu, M.; Jin, X. A Subscale Experimental Investigation on the Influence of Sanding on Adhesion and Rolling Contact Fatigue of Wheel/Rail Under Water Condition. J. Tribol. 2017, 139, 011401. [Google Scholar] [CrossRef]
- Suhr, B.; Skipper, W.A.; Lewis, R.; Six, K. Sanded Wheel–Rail Contacts: Experiments on Sand Crushing Behaviour. Lubricants 2023, 11, 38. [Google Scholar] [CrossRef]
- Foo, C.T.; Omar, B.; Jalil, A.S. A review on recent wheel/rail interface friction management. J. Phys. Conf. Ser. 2018, 1049, 012009. [Google Scholar] [CrossRef]
- Wang, W.; Zhang, H.; Wang, H.; Liu, Q.; Zhu, M. Study on the adhesion behavior of wheel/rail under oil, water and sanding conditions. Wear 2011, 271, 2693–2698. [Google Scholar] [CrossRef]
- Wang, W.; Liu, T.; Wang, H.; Liu, Q.; Zhu, M.; Jin, X. Influence of friction modifiers on improving adhesion and surface damage of wheel/rail under low adhesion conditions. Tribol. Int. 2014, 75, 16–23. [Google Scholar] [CrossRef]
- Shi, L.; Li, Q.; Kvarda, D.; Galas, R.; Omasta, M.; Wang, W.; Guo, J.; Liu, Q. Study on the wheel/rail adhesion restoration and damage evolution in the single application of alumina particles. Wear 2019, 426–427, 1807–1819. [Google Scholar] [CrossRef]
- Shi, L.; Wang, C.; Ding, H.; Kvarda, D.; Galas, R.; Omasta, M.; Wang, W.; Liu, Q.; Hartl, M. Laboratory investigation on the particle-size effects in railway sanding: Comparisons between standard sand and its micro fragments. Tribol. Int. 2020, 146, 106259. [Google Scholar] [CrossRef]
- Wang, C.; Shi, L.; Ding, H.; Wang, W.; Galas, R.; Guo, J.; Liu, Q.; Zhou, Z.; Omasta, M. Adhesion and damage characteristics of wheel/rail using different mineral particles as adhesion enhancers. Wear 2021, 477, 203796. [Google Scholar] [CrossRef]
- Omasta, M.; Machatka, M.; Smejkal, D.; Hartl, M.; Křupka, I. Influence of sanding parameters on adhesion recovery in contaminated wheel–rail contact. Wear 2015, 322–323, 218–225. [Google Scholar] [CrossRef]
- Kumar, S.; Krishnamoorthy, P.K.; Prasanna Rao, D.L. Wheel-Rail Wear and Adhesion With and Without Sand for a North American Locomotive. J. Eng. Ind. 1986, 108, 141–147. [Google Scholar] [CrossRef]
- Grieve, D.G.; Dwyer-Joyce, R.S.; Beynon, J.H. Abrasive wear of railway track by solid contaminants. Proc. Inst. Mech. Eng. Part F J. Rail Rapid Transit 2001, 215, 193–205. [Google Scholar] [CrossRef]
- Lyu, Y.; Zhu, Y.; Olofsson, U. Wear between wheel and rail: A pin-on-disc study of environmental conditions and iron oxides. Wear 2015, 328–329, 277–285. [Google Scholar] [CrossRef]
- Roberts, J.J.; Green, S.I. Experimental study of train sanding. Proc. Inst. Mech. Eng. Part F J. Rail Rapid Transit 2021, 235, 265–274. [Google Scholar] [CrossRef]
- Yue, Z.; Zhang, S.; Ding, H.; Song, X.; Lin, Q.; Guo, J.; Wang, W. Experimental study on the influencing factors of particles jetting behavior in train sanding adhesion enhancement. Powder Technol. 2024, 448, 120302. [Google Scholar] [CrossRef]
- Carter, F.W. On the Action of a Locomotive Driving Wheel. Proc. R. Soc. Lond. Series A 1926, 112, 151–157. [Google Scholar] [CrossRef]
- Fromm, H. Berechnung des Schlupfes beim Rollen deformierbarer Scheiben. Zeitschrift für Angew. Math. Und Mech. 1927, 7, 27–58. [Google Scholar] [CrossRef]
- Johnson, K. The effect of a tangential contact force upon the rolling motion of an elastic sphere upon a plane. J. Appl. Mech. 1958, 25, 339–346. [Google Scholar] [CrossRef]
- Johnson, K. The effect of spin upon the rolling motion of an elastic sphere upon a plane. J. Appl. Mech. 1958, 25, 332–338. [Google Scholar] [CrossRef]
- Kalker, J. The computation of three-dimensional rolling contact with dry friction. Int. J. Numer. Methods Eng. 1979, 14, 1293–1307. [Google Scholar] [CrossRef]
- Kalker, J.J. On the Rolling Contact of Two Elastic Bodies in the Prescence of Dry Friction. Ph.D. Thesis, Delft University of Technology, Delft, The Netherlands, 1967. [Google Scholar]
- Kalker, J.J. Simplified Theory of Rolling Contact. Delft Progr. Rep. Ser. C Mech. Aeronaut. Eng. Shipbuild. 1973, 1, 1–10. [Google Scholar]
- Kalker, J.J. A Fast Algorithm for the Simplified Theory of Rolling Contact. Vehicle Syst. Dyn. 1982, 11, 1–13. [Google Scholar] [CrossRef]
- Kalker, J.J. Three-Dimensional Elastic Bodies in Rolling Contact; Kluwer Academic Press: Cambridge, MA, USA, 1990; ISBN 978-94-015-7889-9. [Google Scholar]
- Knothe, K. History of wheel/rail contact mechanics: From Redtenbacher to Kalker. Vehicle Syst. Dyn. 2008, 46, 9–26. [Google Scholar] [CrossRef]
- Poritsky, H. Stresses and deflections of cylindrical bodies in contact with application to contact of gears and of locomotive wheels. J. Appl. Mech—Trans. Asme 1950, 17, 191–201. [Google Scholar] [CrossRef]
- Meymand, S.Z.; Keylin, A.; Ahmadian, M. A survey of wheel–rail contact models for rail vehicles. Veh. Syst. Dyn. 2016, 54, 386–428. [Google Scholar] [CrossRef]
- Wang, H.; Wang, W.; Liu, Q. Numerical and experimental investigation on adhesion characteristic of wheel/rail under the third body condition. Proc. Inst. Mech. Eng. Part J J. Eng. Tribol. 2016, 230, 111–118. [Google Scholar] [CrossRef]
- Spiryagin, M.; Bernal, E.; Oldknow, K.; Persson, I.; Rahaman, M.L.; Ahmad, S.; Wu, Q.; Cole, C.; Mcsweeney, T. Implementation of roughness and elastic-plastic behavior in a wheel-rail contact modeling for locomotive traction studies. Wear 2023, 532–533, 205115. [Google Scholar] [CrossRef]
- Fang, C.; Jaafar, S.A.; Zhou, W.; Yan, H.; Chen, J.; Meng, X. Wheel-rail contact and friction models: A review of recent advances. Proc. Inst. Mech. Eng. Part F J. Rail Rapid Transit 2023, 237, 1245–1259. [Google Scholar] [CrossRef]
- Liu, B.; Vollebregt, E.; Bruni, S. Review of conformal wheel/rail contact modelling approaches: Towards the application in rail vehicle dynamics simulation. Veh. Syst. Dyn. 2024, 62, 1355–1379. [Google Scholar] [CrossRef]
- Gao, H.; Pfaff, R.; Babilon, K.; Ye, Y. A comprehensive wheel–rail contact model incorporating sand fragments and its application in vehicle braking simulation. Veh. Syst. Dyn. 2024, 0, 1–20. [Google Scholar] [CrossRef]
- Descartes, S.; Renouf, M.; Fillot, N.; Gautier, B.; Descamps, A.; Berthier, Y.; Demanche, P. A new mechanical-electrical approach to the wheel-rail contact. Wear 2008, 265, 1408–1416. [Google Scholar] [CrossRef]
- Zhang, C.; Maramizonouz, S.; Milledge, D.; Nadimi, S. An electro-mechanical contact model for particulate systems. Powder Technol. 2024, 440, 119759. [Google Scholar] [CrossRef]
- Gautam, A.; Green, S.I. Computational fluid dynamics–discrete element method simulation of locomotive sanders. J. Rail Rapid Transit 2021, 235, 12–21. [Google Scholar] [CrossRef]
- Maramizonouz, S.; Nadimi, S.; Lewis, R. CFD-DEM modelling of particle entrainment in wheel–rail interface: A parametric study on train characteristics. Acta Mech. 2024, 235, 6077–6087. [Google Scholar] [CrossRef]
- Zhang, C.; Nadimi, S.; Maramizonouz, S.; Milledge, D.; Lewis, R. A Discrete Element Model of High-Pressure Torsion Test to Assess the Effect of Particle Characteristics in the Interface. J. Tribol. 2024, 146, 081501. [Google Scholar] [CrossRef]
- Suhr, B.; Skipper, W.A.; Lewis, R.; Six, K. DEM simulation of single sand grain crushing in sanded wheel-rail contacts. Powder Technol. 2024, 432, 119150. [Google Scholar] [CrossRef]
- Suhr, B.; Skipper, W.; Lewis, R.; Six, K. DEM modelling of surface indentations caused by granular materials: Application to wheel–rail sanding. Comput. Part. Mech. 2024, 11, 2353–2367. [Google Scholar] [CrossRef] [PubMed]
- Li, H.; McDowell, G.; Lowndes, I. Discrete element modelling of a rock cone crusher. Powder Technol. 2014, 263, 151–158. [Google Scholar] [CrossRef]
- Capozza, R.; Hanley, K. A comprehensive model of plastic wear based on the discrete element method. Powder Technol. 2022, 410, 117864. [Google Scholar] [CrossRef]
- Skipper, W. Sand Particle Entrainment and its Effects on the Wheel/Rail Interface. Ph.D. Thesis, University of Sheffield, Sheffield, UK, 2021. [Google Scholar]
- Skipper, W.; Nadimi, S.; Chalisey, A.; Lewis, R. Particle characterisation of rail sands for understanding tribological behaviour. Wear 2019, 432–433, 202960. [Google Scholar] [CrossRef]
- Smilauer, V.; Angelidakis, V.; Catalano, E.; Caulk, R.; Chareyre, B.; Chèvremont, W.; Dorofeenko, S.; Duriez, J.; Dyck, N.; Elias, J.; et al. Yade Documentation, 3rd ed.; The Yade Project; Zenodo: Geneva, Switzerland, 2021. [Google Scholar] [CrossRef]
- Angelidakis, V.; Boschi, K.; Brzeziński, K.; Caulk, R.A.; Chareyre, B.; del Valle, C.A.; Duriez, J.; Gladky, A.; van der Haven, D.L.; Kozicki, J.; et al. YADE - An extensible framework for the interactive simulation of multiscale, multiphase, and multiphysics particulate systems. Comput. Phys. Commun. 2024, 304, 109293. [Google Scholar] [CrossRef]
- Thornton, C.; Cummins, S.J.; Cleary, P.W. An investigation of the comparative behaviour of alternative contact force models during inelastic collisions. Powder Technol. 2013, 233, 30–46. [Google Scholar] [CrossRef]
- Iwashita, K.; Oda, M. Rolling Resistance at Contacts in Simulation of Shear Band Development by DEM. J. Eng. Mech. 1998, 124, 285–292. [Google Scholar] [CrossRef]
- Ai, J.; Chen, J.F.; Rotter, J.M.; Ooi, J.Y. Assessment of rolling resistance models in discrete element simulations. Powder Technol. 2011, 206, 269–282. [Google Scholar] [CrossRef]
- Wensrich, C.; Katterfeld, A. Rolling friction as a technique for modelling particle shape in DEM. Powder Technol. 2012, 217, 409–417. [Google Scholar] [CrossRef]
- Coetzee, C. Calibration of the discrete element method: Strategies for spherical and non-spherical particles. Powder Technol. 2020, 364, 851–878. [Google Scholar] [CrossRef]
- Rößler, T.; Richter, C.; Katterfeld, A.; Will, F. Development of a standard calibration procedure for the DEM parameters of cohesionless bulk materials—Part I: Solving the problem of ambiguous parameter combinations. Powder Technol. 2019, 343, 803–812. [Google Scholar] [CrossRef]
- Ciantia, M.; Arroyo, M.; Calvetti, F.; Gens, A. An approach to enhance efficiency of DEM modelling of soils with crushable grains. Géotechnique 2015, 65, 91–110. [Google Scholar] [CrossRef]
- de Bono, J.; McDowell, G. Particle breakage criteria in discrete-element modelling. Géotechnique 2016, 66, 1014–1027. [Google Scholar] [CrossRef]
- Zhou, W.; Wang, D.; Ma, G.; Cao, X.; Hu, C.; Wu, W. Discrete element modeling of particle breakage considering different fragment replacement modes. Powder Technol. 2020, 360, 312–323. [Google Scholar] [CrossRef]
- Derjaguin, B.; Muller, V.; Toporov, Y. Effect of contact deformations on the adhesion of particles. J. Colloid Interface Sci. 1975, 53, 314–326. [Google Scholar] [CrossRef]
- Six, K.; Skipper, W.; Lewis, R.; Suhr, B. A DEM based approach to understand the physics is sanded wheel-rail contacts. In Proceedings of the 13th International Conference on Contact Mechanics and Wear of Rail/Wheel Systems (CM2025), Tokyo, Japan, 22–26 September 2025. [Google Scholar] [CrossRef]


| Material | Young’s Modulus E [GPa] | Poisson Ratio [-] | Coeff. of Friction [-] | Density | Coeff. of Restitution [-] |
|---|---|---|---|---|---|
| GB sand | 86.5 | 0.3 | 0.5 | 2650 | 0.5 |
| AT sand | 79.1 | 0.3 | 0.7 | 2650 | 0.3 |
| steel | 200.0 | 0.28 | 0.2 | 7833 |
| Sand | [Pa s] | [m] | [m] | ||
|---|---|---|---|---|---|
| GB | 0.12 | 0.012 | 64 | 800 | 100 |
| AT | 0.08 | 0.012 | 53 | 800 | 125 |
| Parameters | GB Sand | AT Sand |
|---|---|---|
| grain size [mm] | 1.18 (S: 25%), 1.43 (M: 50%) | 0.98 (M: 50%), 1.18 (L: 75%) |
| cohesion activ. radius | low: S: 77, M: 100, high: S&M: | low: M: 125, L: 150, high: S&M: |
| hardness H [GPa] | 2.5, 10 | 2.5, 10 |
| Parameters | GB Sand |
|---|---|
| friction coefficient sand–steel [-] | 0.2, 0.5, 1.0 |
| friction coefficient sand–sand [-] | 0.5, 1.0 |
Disclaimer/Publisher’s Note: The statements, opinions and data contained in all publications are solely those of the individual author(s) and contributor(s) and not of MDPI and/or the editor(s). MDPI and/or the editor(s) disclaim responsibility for any injury to people or property resulting from any ideas, methods, instructions or products referred to in the content. |
© 2025 by the authors. Licensee MDPI, Basel, Switzerland. This article is an open access article distributed under the terms and conditions of the Creative Commons Attribution (CC BY) license (https://creativecommons.org/licenses/by/4.0/).
Share and Cite
Suhr, B.; Skipper, W.A.; Lewis, R.; Six, K. Mechanisms of Adhesion Increase in Wet Sanded Wheel–Rail Contacts—A DEM-Based Analysis. Lubricants 2025, 13, 314. https://doi.org/10.3390/lubricants13070314
Suhr B, Skipper WA, Lewis R, Six K. Mechanisms of Adhesion Increase in Wet Sanded Wheel–Rail Contacts—A DEM-Based Analysis. Lubricants. 2025; 13(7):314. https://doi.org/10.3390/lubricants13070314
Chicago/Turabian StyleSuhr, Bettina, William A. Skipper, Roger Lewis, and Klaus Six. 2025. "Mechanisms of Adhesion Increase in Wet Sanded Wheel–Rail Contacts—A DEM-Based Analysis" Lubricants 13, no. 7: 314. https://doi.org/10.3390/lubricants13070314
APA StyleSuhr, B., Skipper, W. A., Lewis, R., & Six, K. (2025). Mechanisms of Adhesion Increase in Wet Sanded Wheel–Rail Contacts—A DEM-Based Analysis. Lubricants, 13(7), 314. https://doi.org/10.3390/lubricants13070314