Article

The Importance of Fiber Orientation for the Performance of High-Performance Polymer-Based Hybrid Materials in Sliding Contact with Steel

by
Alois K. Schlarb
1,2,3,*,
Miaozi Huang
1,
Yao Xu
1,
Chi Hua
1 and
Leyu Lin
1,2
1
Chair of Composite Engineering (CCe), RPTU Kaiserslautern-Landau, Gottlieb-Daimler-Str. Bld. 44, 67663 Kaiserslautern, Germany
2
Research Center OPTIMAS, RPTU Kaiserslautern-Landau, 67663 Kaiserslautern, Germany
3
Institute for Rubber Plastics, Qingdao University of Science and Technology (QUST), Qingdao 266042, China
*
Author to whom correspondence should be addressed.
Lubricants 2025, 13(6), 234; https://doi.org/10.3390/lubricants13060234
Submission received: 10 April 2025 / Revised: 22 May 2025 / Accepted: 22 May 2025 / Published: 24 May 2025

Abstract

The properties of composite materials depend not only on the composition but also on the distribution and orientation of the fillers, i.e., on the internal material architecture. Using the example of two differently composed PEEK-based hybrid materials, the influence of fiber orientation on the tribological behavior of these materials in sliding contact with steel was investigated. The tribological performance of these composites was assessed using a pin-on-disc (PoD) tribometer, testing in a pv range from 0.25 to 32 MPa·m/s. The findings indicate that the printed specimens exhibit a high degree of fiber orientation aligned parallel to the printing paths. Conversely, the injection-molded samples display a three-layered structure across the thickness, with fibers in the skin layers aligned parallel to the injection direction but perpendicular to it in the core. These variations in morphology are evident in both the mechanical properties and the tribological behavior. To describe the influence of the fiber orientation on tribological properties, a model is proposed that allows the prediction of tribological properties for any fiber orientation. Although fiber orientation appears to be the dominant factor in tribological behavior, there is also a clear influence of additional fillers.

1. Introduction

In recent years, functional and intelligent polymers have increasingly been used in automotive components and everyday products. The development of high-performance materials aims to create energy-efficient products by reducing friction, improving wear behavior, and enhancing service life and reliability. In the last ten to fifteen years, additive manufacturing (AM), also known as 3D printing, has become a key focus in research and development, being used effectively for creating prototypes, replacement parts, and small-scale production runs. Fused filament fabrication (FFF), a type of 3D printing that uses thermoplastic materials, is especially favored for its low start-up costs, simplicity, and versatility. FFF provides several benefits compared to conventional manufacturing techniques, including the elimination of costly molds and the ability to produce parts with intricate shapes. This cutting-edge approach also makes it possible to create highly efficient parts designed for specific functions. In the FFF process, a thermoplastic filament is heated in a nozzle, which then carefully lays down the polymer strands in a layer-by-layer fashion along set routes. The ability to construct parts from individual polymer strands gives FFF its unique anisotropic properties, which can be leveraged to achieve specific performance goals.
The alignment effect can be further enhanced by reinforcing the polymer matrix with fibers. When an external load is applied, the fibers in such composites bear the load while the matrix ensures the material cohesion and protection of the fibers. In the case of a sliding tribological load, the loads are applied both perpendicular and parallel to the sliding surface. Therefore, here too, the fibers mainly absorb the normal and shear forces introduced into the composite sliding body [1,2]. Yet, how well SCFs can support weight is not just about the fibers; it also depends on how they are arranged and aligned with the force acting on them, as is often seen in materials reinforced with fibers. Therefore, it is essential to understand how the arrangement of fibers affects how materials behave in a system that involves friction. The way fibers are arranged in a material usually depends on how it is made. For example, in parts made by injection molding, the way fibers are oriented changes with the thickness of the part and is hard to control in complicated shapes. On the other hand, studies have recently found that the fused filament fabrication (FFF) method can ensure the fibers are perfectly aligned in the direction they are being added, leading to materials that are stronger, more rigid, and perform better in terms of friction and wear [3,4,5,6].
In recent times, a variety of research has been conducted on the possibility of utilizing fused filament fabrication (FFF) to create thermoplastic materials for applications in tribology [7,8,9,10,11,12,13,14,15,16,17,18,19]. For example, Hervan et al. [14] looked into how the process conditions affect the tribological characteristics of printed PLA, discovering that while the thickness of the layers did not have a significant impact on the coefficient of friction (Cof), the orientation of the layers did significantly affect it, depending on the applied load. Similarly, Norani et al. [20] found that reducing the thickness of the layers to 0.1 mm led to a decrease in wear rate by up to 30%. Zhang et al. [21] examined the influence of infill density on PLA, achieving Cof values close to 0.25 with an infill density of 50%, but noted that the wear rate could reach up to 0.71 mm3/Nm. Ballesteros et al. [22] looked into the tribological characteristics of 3D printed nylon with a snake skin pattern, observing a decrease in Cof compared to random surfaces. Abdollah et al. [23] investigated the effect of different internal structures in ABS printed parts, finding that the triangular flip structure inside the material positively affected both friction and wear, with Cof values and specific wear rates of around 0.3 and 30 × 10−5 mm3/Nm, respectively. There have also been efforts to improve the tribological performance of 3D-printed parts by incorporating various additives and lubricants. For example, adding 5% graphite to PLA led to a reduction in Cof and wear rate by about 19% and 60%, respectively [24]. Similar results were observed by Przekop et al. [19] with PLA containing 10% graphite, which reduced wear rates by 65%. Ramachandran and his team [18] demonstrated even better performance by adding SiO2 to PLA, and Hanon [12] noted significant improvements in wear behavior by adding bronze particles. Prusinowski et al. [10,25] pointed out that carbon fibers significantly reduced wear in printed ABS. Despite these advancements, the use of such materials for tribological applications has been limited due to issues like low heat resistance and poor mechanical properties, which are essential for tribological systems operating under dry sliding conditions with high loads.
Recently, Lv et al. [26] published a paper on the tribological anisotropy of carbon fiber reinforced PEEK printed using fused filament fabrication. The authors focused on the properties parallel to the printed surface. The tests were carried out in a pressure range of p = 2–20 MPa at a single speed (v = 1 m/s). As a key result, they found that an antiparallel fiber orientation, i.e., 90° to the direction of friction, gave the best results, whereas a parallel orientation and an orientation 45° relative to the alignment of the fibers showed poorer properties. They thus confirm the results published for injection-molded PEEK-based tribocompounds in [27] for a pv range of 1–5 MPa·m/s.
In addition to these parameters, which can be specifically adjusted in extrusion-based 3D printing, the composition of the tribological composites naturally plays a decisive role. This has been studied in the past, but often independently of the processing technology and material structure parameters such as filler distribution and orientation. The most important findings on the function of individual components in a tribological high-performance composite are only mentioned here as examples [1,2,4,27,28,29,30].
The aim of our study is to investigate the influence of fiber orientation in a wide pv range with sliding speeds up to 4 m/s for tribologically proven high-performance materials and to derive information for the design of plain bearings made of these materials. Extrusion-based 3D printing is used to adjust the fiber orientation relative to the sliding direction, and the results are compared with injection-molded samples with a three-layer structure, which are generally used for the tribological characterization of composites against steel at the model test level.

2. Experimental and Methodology

2.1. Materials and Sample Preparation

Two tribocomposites, C1 and C2, were primarily compounded on a twin-screw extruder (ZSE 18 MAXX, Leistritz Extrusionstechnik GmbH, Nürnberg, Germany). Their composition is shown in Table 1.
The screw speed on the twin-screw extruder was set to 200 rpm with barrel temperatures at 120/200/290/340/370/395/395/395/395/395 °C from the hopper to the die. The extruded strands were passed through a water bath and then granulated.
From the pellets of both materials, filaments with 1.8 ± 0.05 mm diameters were produced by extruding them through a single-screw extruder (model EX6, manufactured by Filabot in Barre, VT, USA). The details of the extrusion process are outlined in Table 2.
The 3D printing of 50 × 50 × 4 mm3 sheets was carried out using an updated FFF 3D printer (Ultimaker 2, Ultimaker B.V., Utrecht, The Netherlands). The tensile test specimens, in accordance with DIN ISO EN 527/1BB, were machined from the printed plates. The whole processing sequence, starting with supplied granulate and ending with the completed printed parts, is illustrated in Figure 1.
The samples were printed under the conditions listed in Table 3. In the printing process, the material was deposited along the x-direction (printing direction), while the layers were built up along the z-direction (build direction). Due to flow-induced alignment, the short carbon fibers predominantly aligned along the x-direction, i.e., the printing direction. For a comparative analysis, sheets of 50 × 50 × 4 mm3 were also produced using an injecting molding machine (ENGEL victory 200/80 spex, ENGEL Germany GmbH, Germany). An injection pressure of 1200 bar and cylinder temperature of 300/375/385/390/395 °C were employed, and the tool temperature was set to 180 °C.
For tribological studies, samples measuring 4 × 4 × 4 mm3 were cut from both the printed and injected sheets, which were subsequently bonded to pure PEEK backing (Figure 2), resulting in test pins with a volume of 4 × 4 × 10 mm3.

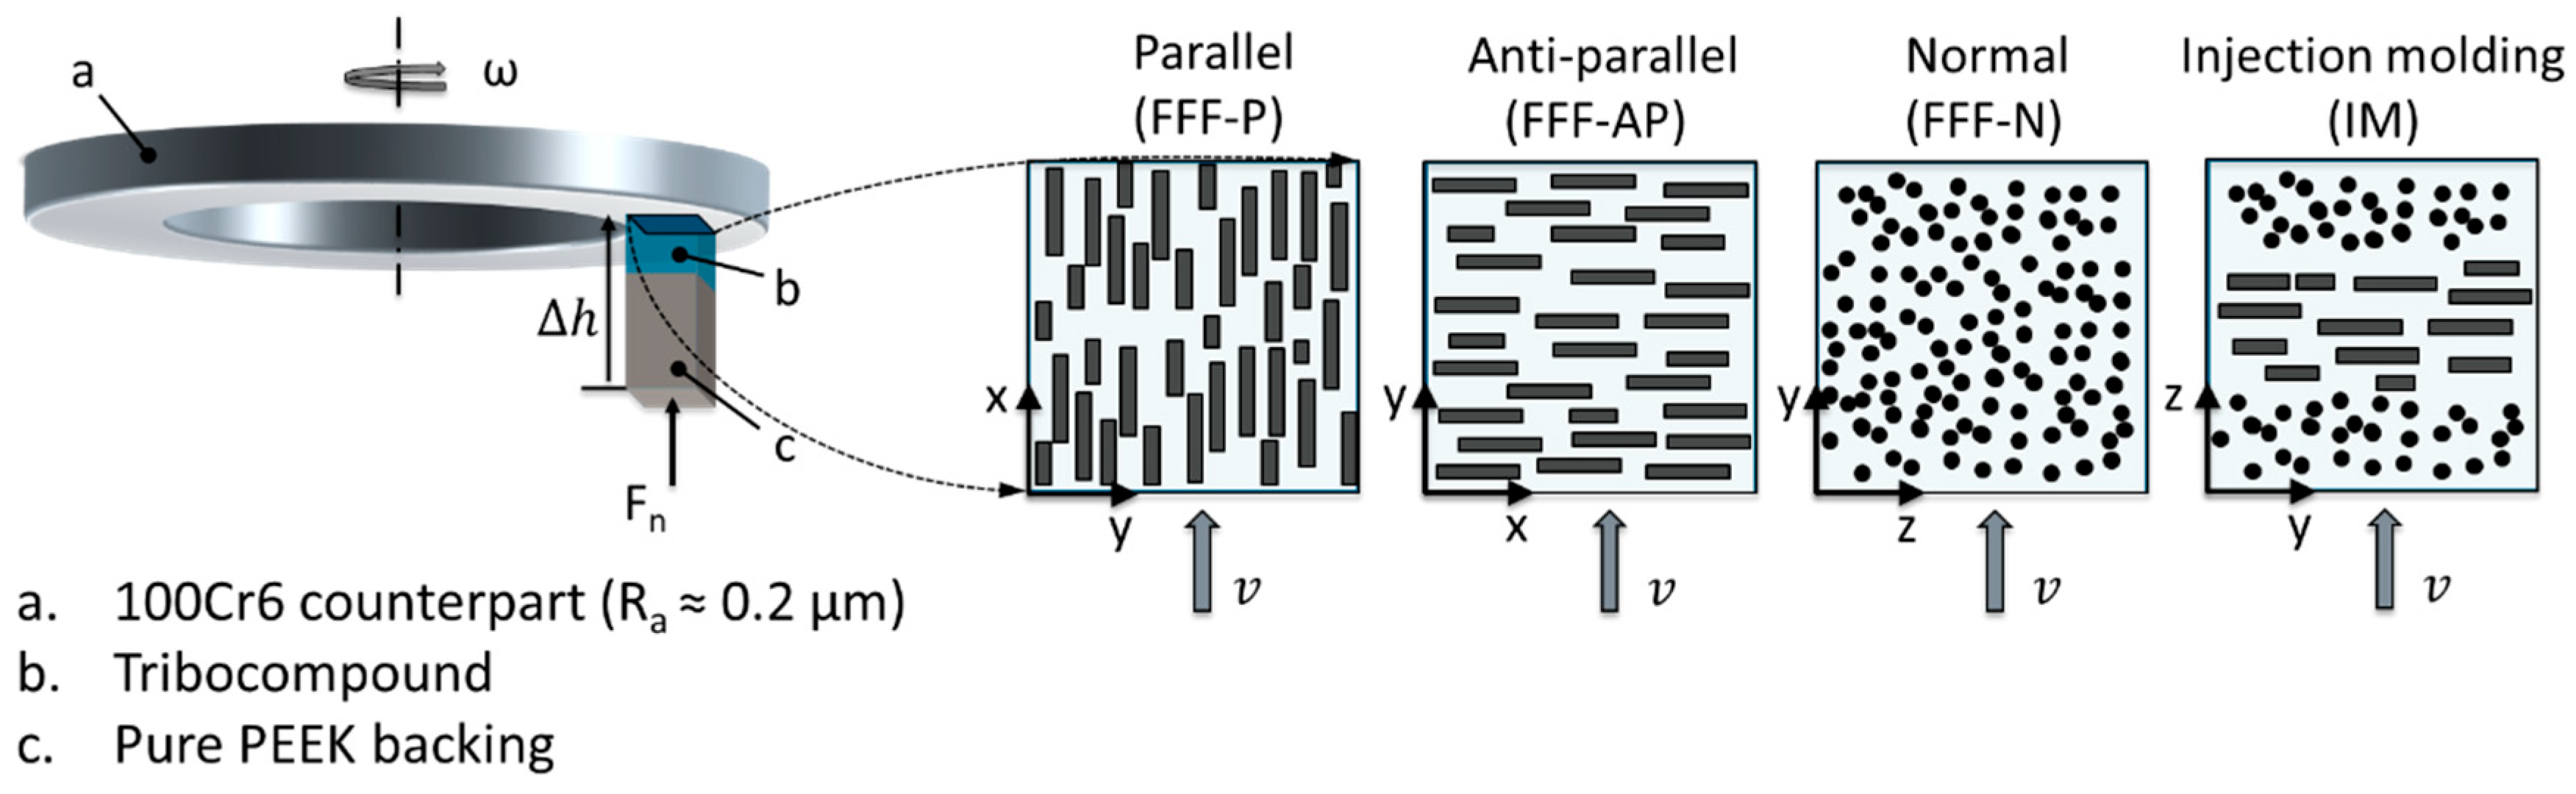
2.2. Testing Methods

Tensile tests were carried out on a universal tensile test machine (Zwick RetroLine Z010, ZwickRoell GmbH & Co. K, Ulm, Germany) up to an elongation of 0.25% at a pull-off speed of 1 mm/min and then increased to 50 mm/min until the specimens failed. These tests were conducted over a temperature range of 23 ± 2 °C and a humidity range of 50 ± 10%. The specimens were tested parallel (x = 0°) and perpendicular (y = 90°) to the printing direction, as illustrated in Figure 1. All recorded data are averages of at least five individual measurements.
To evaluate the morphology, the 3D-printed (FFF) and injection-molded (IM) plates were first embedded in epoxy resin (EpoFix, Struers GmbH, Germany). They were then ground and polished to examine the alignment and length of the fibers and possibly pores using a 3D laser scanning microscope (LSM) (VK-X1050, Keyence Corporation, Osaka, Japan).
Subsequently, the images were analyzed with a Matlab code for binary image analysis [31], and the orientation components of the fibers were determined.
The experiments on friction were carried out in a dry sliding setup with a Pin-on-Disc (PoD) tribometer made by us. As counterbodies, we used standard bearing washers (LS2542, made by Schaeffler, Germany), which had an average roughness (Ra) of 0.2 μm. The body pins underwent a “pre-worn” process in two steps, involving grinding papers of grit sizes P240 and P1000 in sequence. Tribological tests were conducted on the top printing layer (xy-plane) and the side surface (yz-plane). On the xy-plane, the sliding direction was parallel (FFF-P) and antiparallel (FFF-AP) to the fiber orientation. On the yz-plane, the sliding direction was normal (FFF-N) to the fibers. Furthermore, tribological tests were performed on the yz-plane of injection molded specimens, referred to as IM (as shown in Figure 2).
In the course of the study, the normal force (Fn), frictional force (Ff), and decrease in the height ( h ) of the pin were measured and recorded.
Subsequently, the linear wear rate (wl) was calculated using Formula (1):
w l = h t
where t represents the sliding time.
The tests were conducted using an intelligent test strategy developed at the chair. This involved defining both characteristic pv combinations in advance and selecting additional combinations based on statistical criteria in the parameter field. The tribometer was programmed to automatically identify the stationary friction phase. Following this, it was maintained at each selected pv level for a predetermined duration before moving on to the next load level. The contact pressure was set between 0.5 MPa and 8 MPa, with a velocity range of 0.5 to 4 m/s. The order of the load levels was randomized for each test. Each tribometer run was repeated at least twice, ensuring testing at least 45 pv levels for a single fiber orientation.
The coefficients of friction and wear rates were determined by averaging the measured data during the stationary phase of all tests across pv levels. To delve into the friction and wear mechanisms, selected worn surfaces after testing were examined. This analysis was performed using a 3D laser scanning microscope (VK-X1050, Keyence Corporation, Japan) and scanning electron microscope (SEM) (FEI Quanta 600 FEG, Hillsboro, OR, USA).

3. Results and Discussion

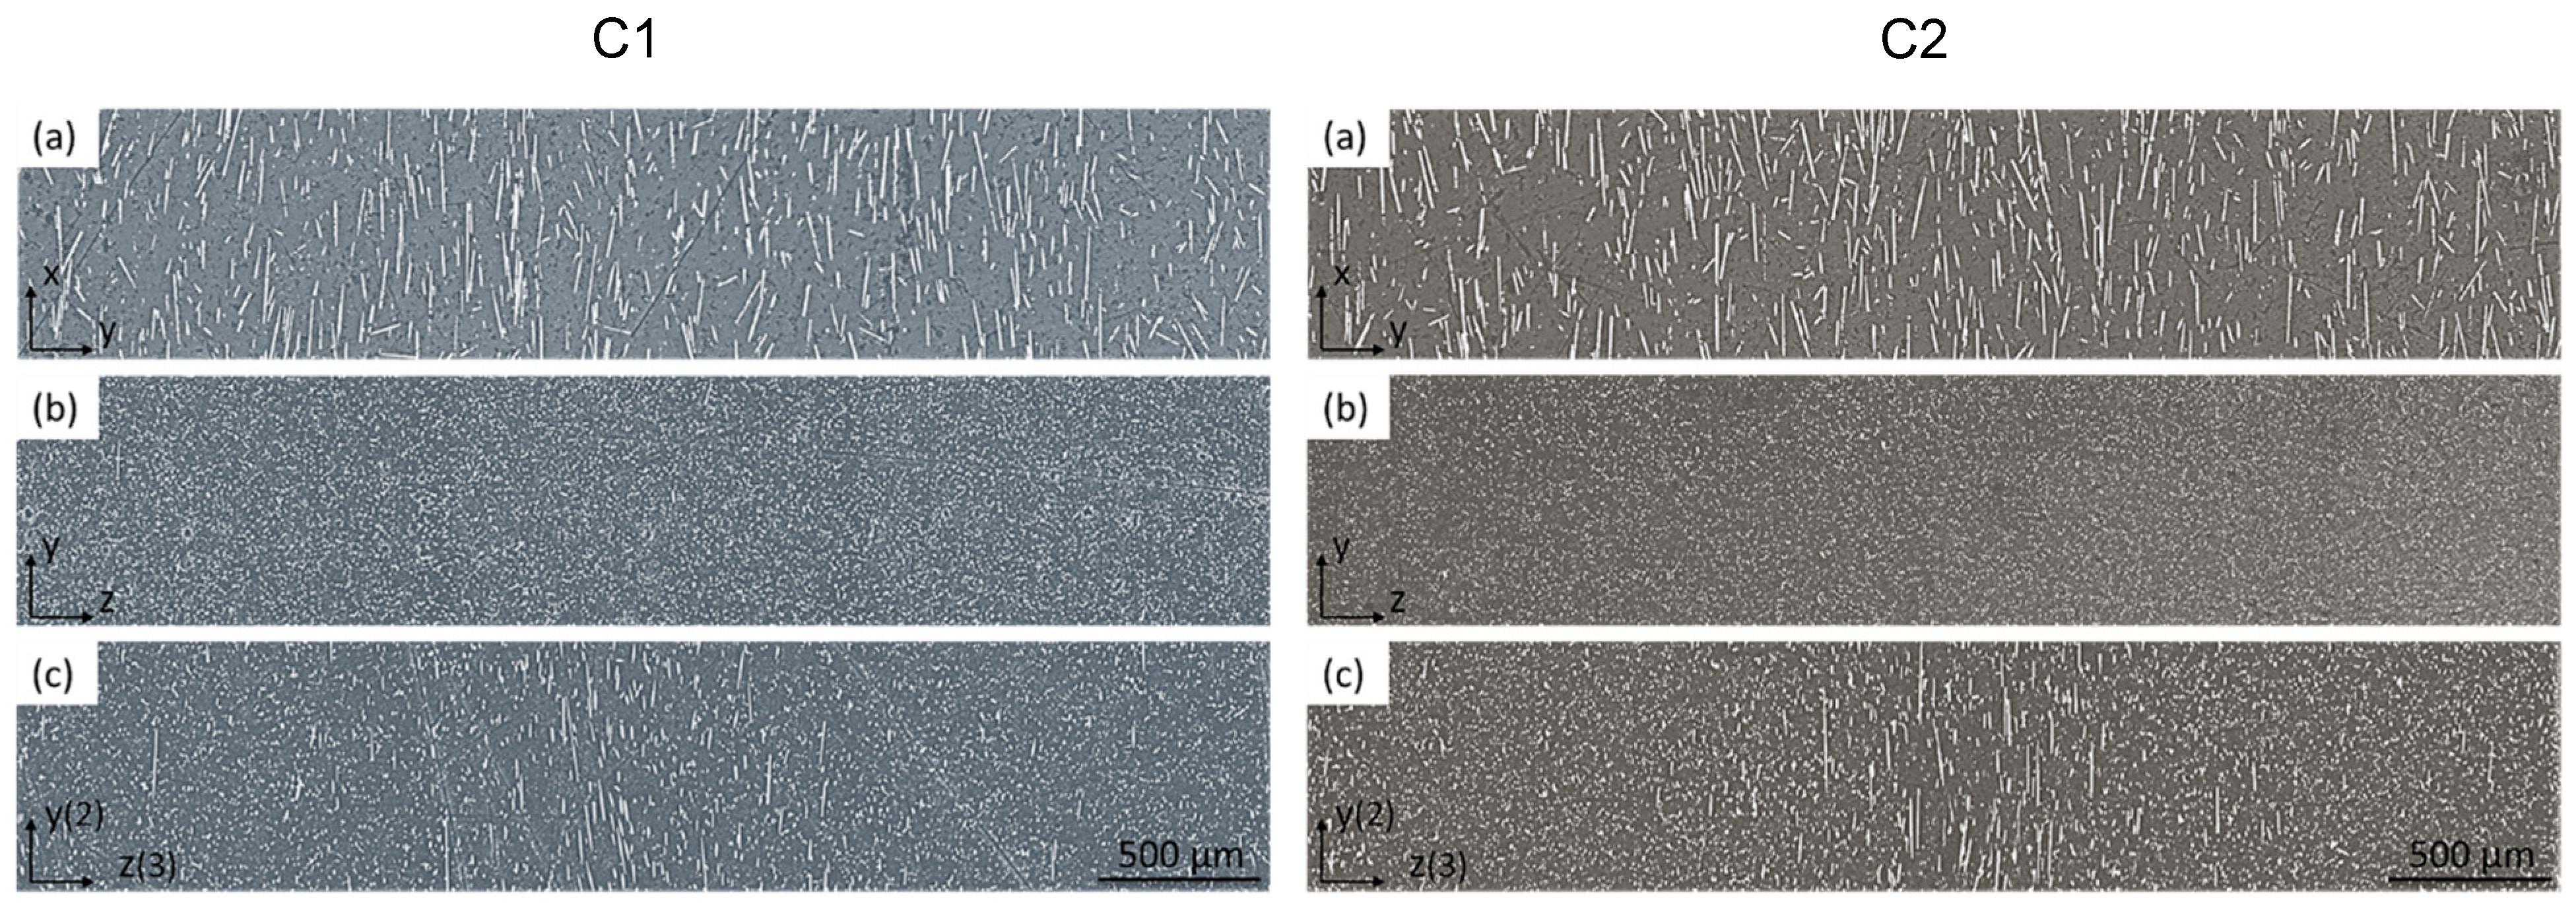
3.1. Morphology Characteristics

Figure 3 shows polished surfaces of the differently produced samples of the two tribocomposites. At first glance, there are no differences in the morphology/fiber orientation of the two composites. In the printed samples (Figure 3a,b), the carbon fibers are distributed evenly throughout the PEEK matrix, with a predominant alignment in the direction of printing. On the other hand, in the injection-molded samples (Figure 3c), the fibers show alignments parallel to the direction of injection molding in the skin areas of the plates and perpendicular to the direction of injection molding in the core area of the plates.
Table 4 shows the results of the image analysis of the polished specimens with respect to the effect of fiber orientation.
Again, there are no significant differences to be seen.

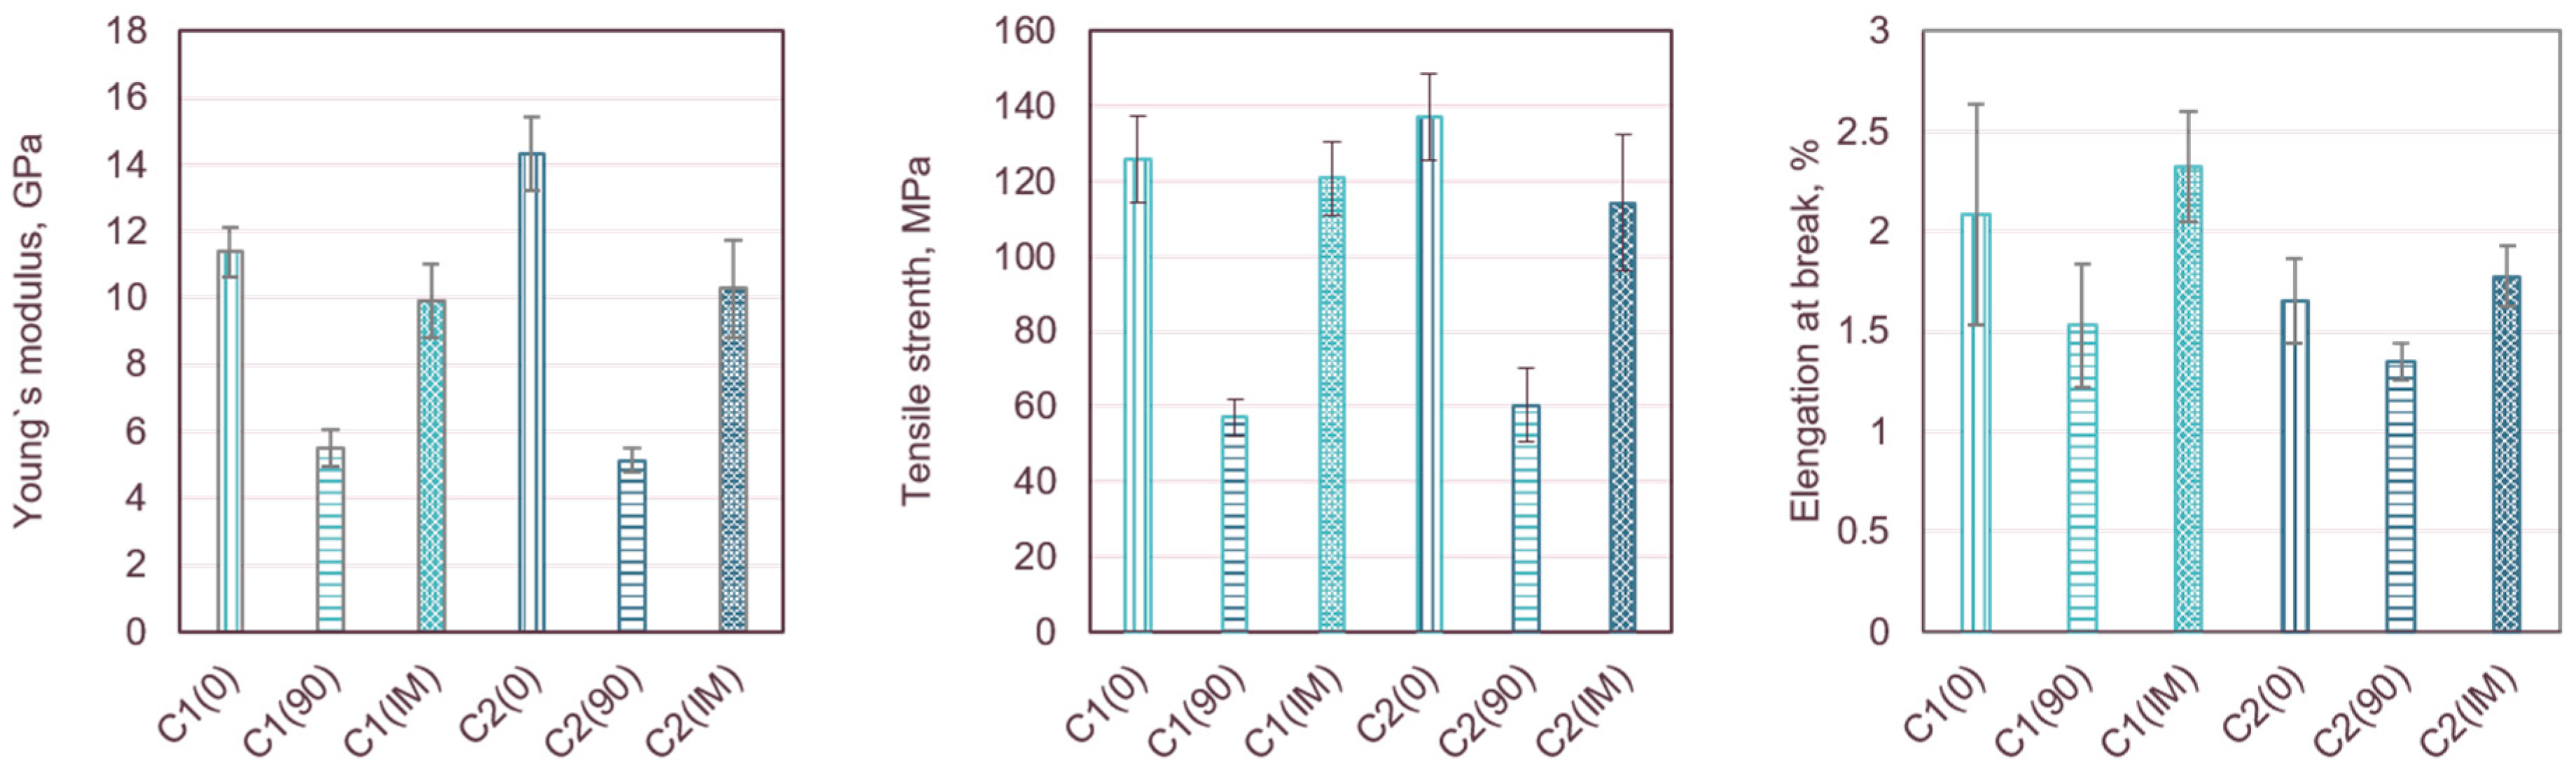
3.2. Mechanical Properties
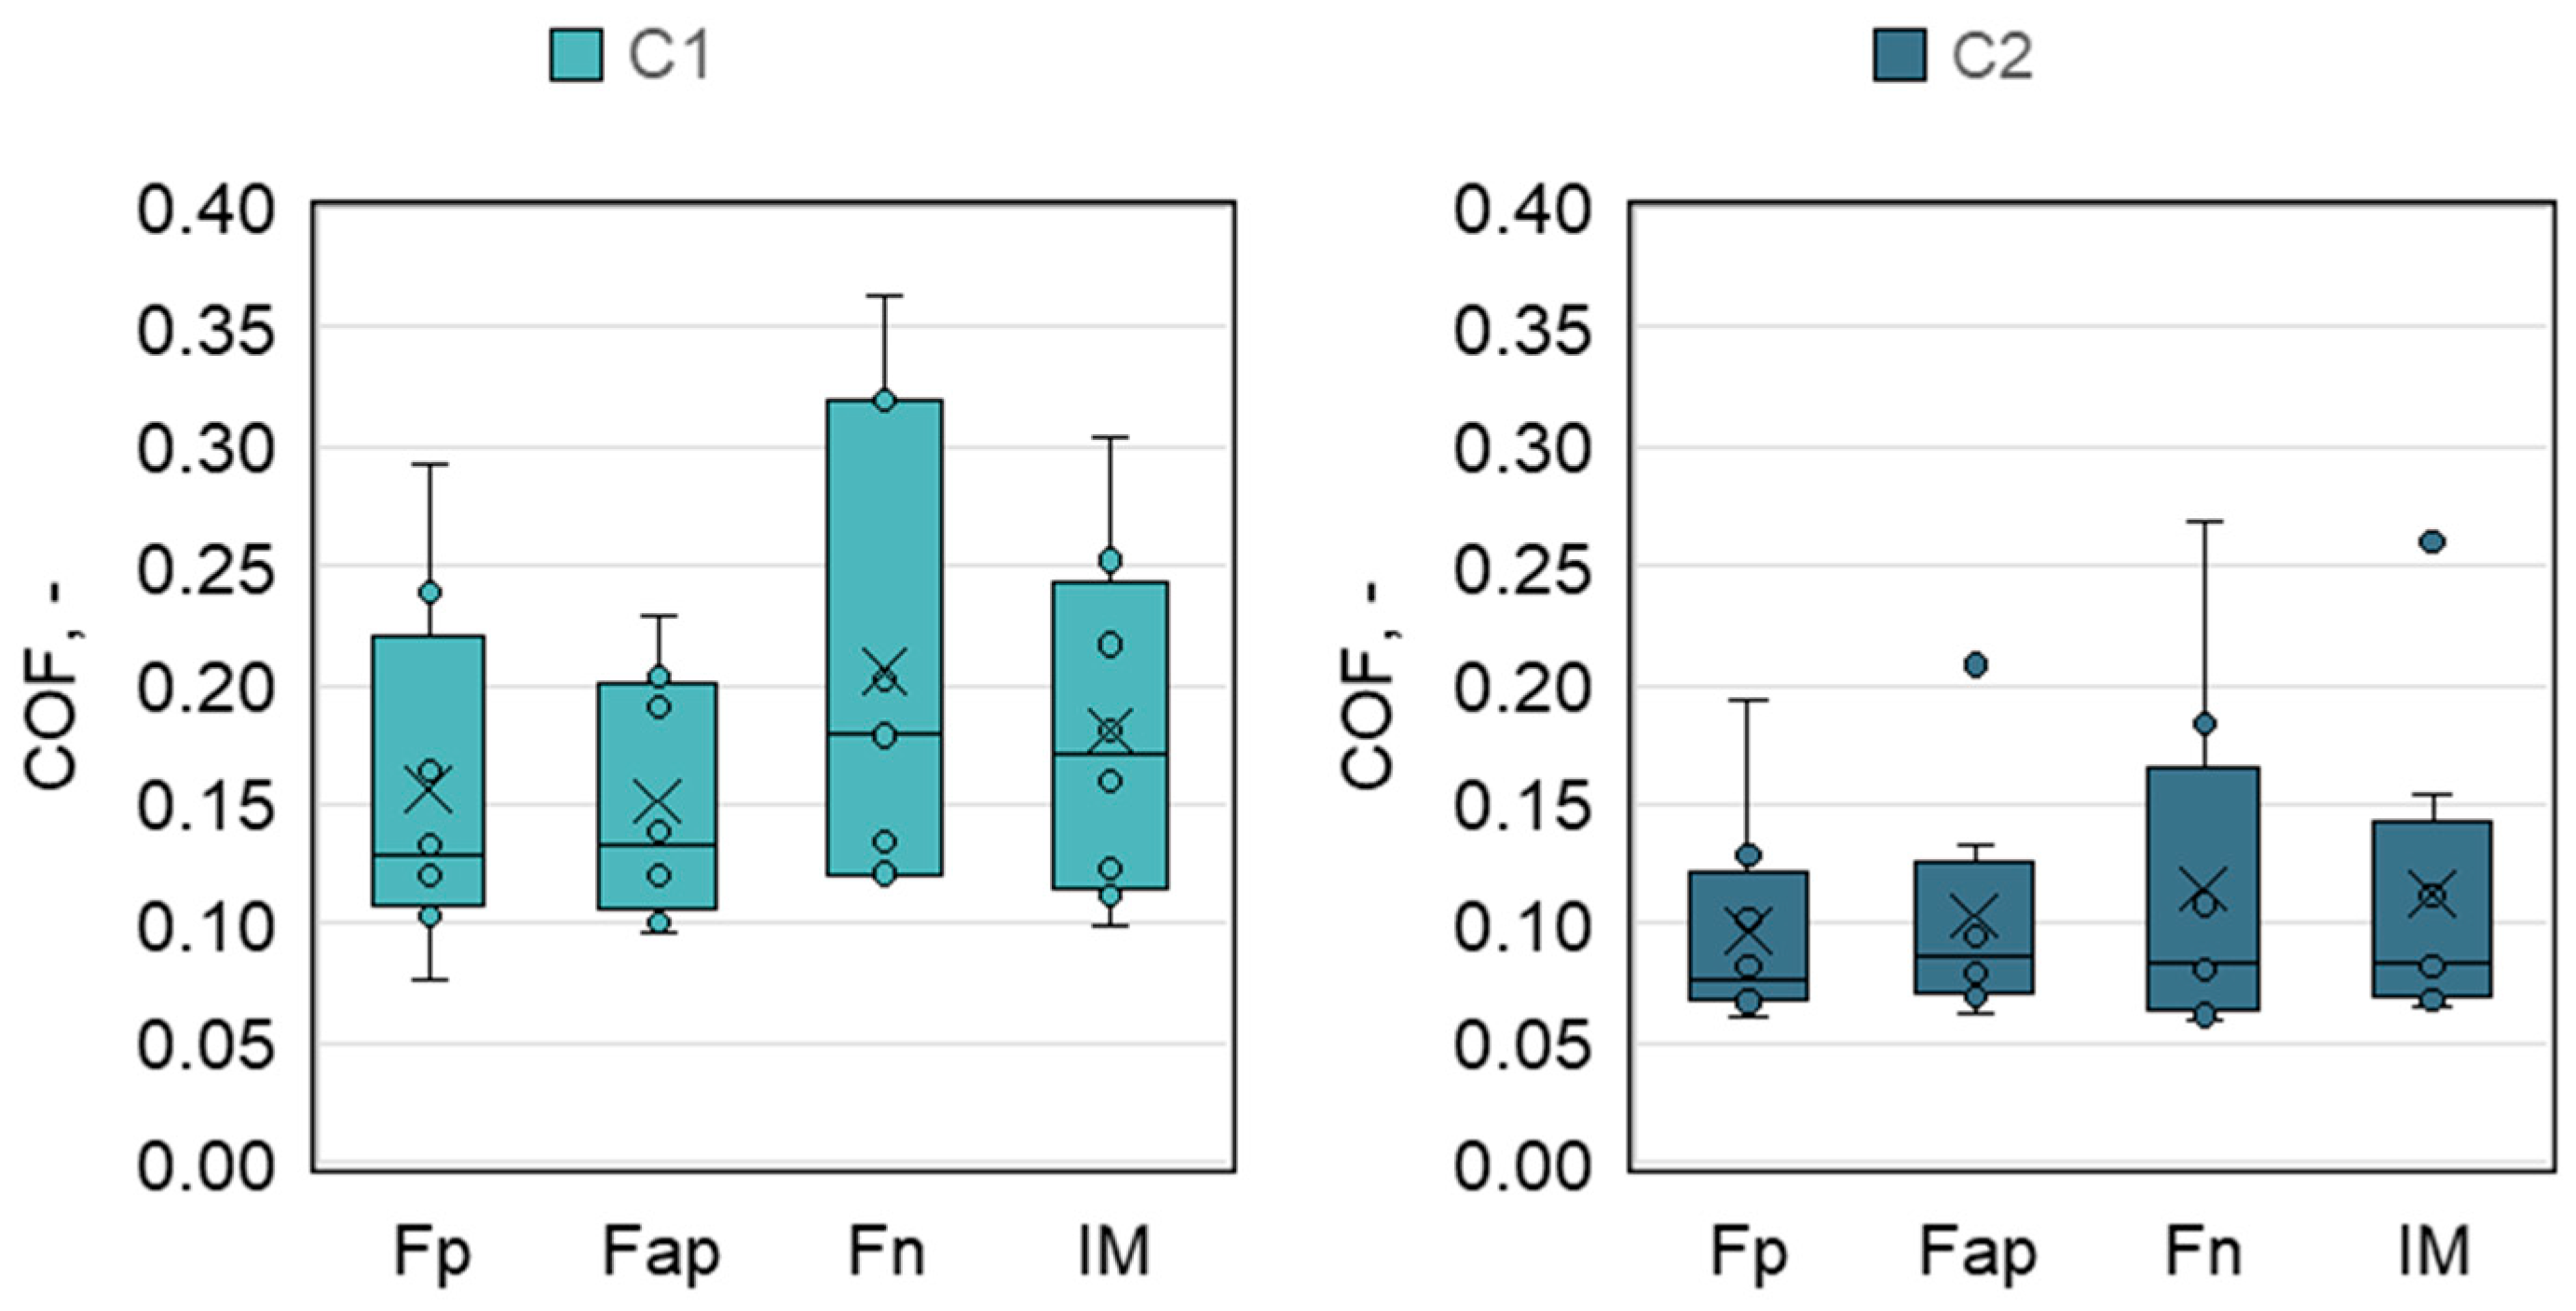
Fiber–plastic composites demonstrate anisotropy, meaning that their mechanical properties significantly differ across various directions. This distinctive characteristic allows for a more optimized utilization of the material’s potential, depending on the direction of the load. This design principle can be effectively applied in 3D printing with fiber-reinforced plastics. Components subjected to loads in the direction of the printing process, or along the fibers, exhibit notably higher mechanical properties compared to those loaded perpendicular to the fibers [32,33].
The influence of the printing direction on the mechanical properties is shown in Figure 4. The Young’s modulus and tensile strength of the materials basically follow the same trends, with C2 generally having slightly higher values. Stiffness and strength parallel to the printing direction (0) are about twice as high as perpendicular to the printing direction (90). In addition, the printed material has a slightly higher Young’s modulus and a slightly higher tensile strength in the 0° direction than the injection molded samples. This behavior reflects the orientation of the fibers in the samples (see Figure 3).

3.3. Tribology

3.3.1. Characteristic Values

Figure 5 displays the raw data Cof = Ff/Fn and displacement Δh from a key experiment under varying surface pressure conditions and sliding speed as a function of time. At the start of the experiment and after each stage change, a run-in phase is clearly recognizable at first. During this phase, the contact surfaces of the tribological system, along with the thermal conditions and the thermomechanical reaction of the pin, specifically, adapt to the new conditions. To assess the tribological properties at the phase change level, only the data collected during the subsequent stationary friction phase were considered. When the pv combination changes, there are immediate jumps in the displacement curves, which can be explained by Hook’s law. Conversely, during the stationary phases, there is a steady increase in displacement, solely caused by wear.
The wear rate was calculated based on these steady phases across various pv values.
Figure 6 shows the coefficient of friction of the two compounds C1 and C2 for different fiber orientations relative to the direction of friction in a pv range of 0.25–32 MPa·m/s.
It is noted that across all scenarios, Cofs exhibit a clear dependence on the pv load, decreasing notably as the pv load increases, suggesting a lower propensity for friction losses. The values for compound C2, with the exception of the antiparallel scenario at pv < 10 MPa·m/s, are generally significantly lower than those of compound C1.
For C1, at pv values below 10 MPa·m/s, the Cofs in the antiparallel (ap) scenario are significantly lower than those in the three other fiber orientation scenarios. This also applies to material C2, although the differences between the fiber orientation scenarios are significantly smaller.
With increasing pv values, the differences between the fiber directions become less pronounced. At high pv values, a remarkably low Cof value of around 0.1 and lower is observed for C1, regardless of fiber orientation relative to the friction. In this case, C2 even reaches values of Cof ≤ 0.05.
A summary over the entire pv range is shown in the boxplots in Figure 7. Since the measured CoFs were not evenly distributed over the pv product, we averaged them at constant intervals of the pv product and used these averages for the boxplots.
If the mean values over the entire pv range and the scatter of the box size (interquartile range) are taken as a quality characteristic and the values of the printed samples of material C1 stressed parallel to the fiber direction are used as a benchmark, the following conclusions can be drawn:
For material C1, the mean values for stress parallel and antiparallel to the fiber direction are approximately at the same level. The mean value for stress perpendicular to the fiber direction is about 31% higher, with the injection-molded specimens falling between these two extremes. The scatter of the data is approximately the same for all loading directions, with the specimens loaded antiparallel to the fiber direction showing the least scatter.
C2 follows a similar pattern, with the differences between the different fiber directions being much smaller on average. The scatter is about the same. However, C2 shows overall friction coefficients about 27–39% lower than C1.
The linear wear rate (see Figure 8) basically shows three different typical curves for the fiber alignment scenarios investigated.
The wear rate progression of C1 always follows the same type of curve: as the pv load increases, the wear rates increase until they peak at about 10 MPa·m/s, after which they decrease and stabilize at an almost constant level. However, the maximum wear values and the wear levels observed at high pv loads vary considerably depending on the direction of fiber loading. The lowest wear values are observed with parallel and antiparallel fiber loading. With normal fiber loading, the wear values are two to three times higher, regardless of the pv product. The wear rates of the injection molded specimens are between those of the parallel/antiparallel loaded specimens and the normal loaded specimens.
The material C2 shows the same typical behavior as a function of the pv product only in the case of the “normally” stressed printed samples and for the injection-molded samples. In contrast, the wear rate of tribologically parallel and antiparallel stressed samples (fibers) increases continuously with the pv product.
This is also clear from the averaging wear rate over the entire pv range in the boxplots (Figure 9). To create these boxplots, we used the averaging method analogous to the friction coefficient plot in Figure 7.
This figure shows only slight differences between the parallel and the anti-parallel scenario, with the parallel scenario showing slight advantages in the mean value and the scatter, especially for material C1, being significantly lower with tribologically parallel loading. Overall, the data give the impression that the tribological behavior of the injection molded samples, which have fibers in both normal and antiparallel positions relative to the direction of friction in the tribological contact surface, lies between these two fiber orientation scenarios. While the wear rates over the entire p·v range for C1 are highly dependent on fiber orientation, the C2 compound is much less sensitive to fiber orientation and shows significantly less wear overall.
The trend observed for C1 is not entirely consistent with previous studies [27] on PEEK/SCF/PTFE composites, which found an advantage for the anti-parallel scenario. However, it should be noted that the earlier investigation was limited to only five pv levels over a relatively narrow range and used a different solid lubricant.

3.3.2. Model for Estimating the Fiber Orientation Effect

With the fiber orientation vectors determined in Table 4 and the measured Cofs of the printed specimens, the theoretical Cofs μ P , μ A P and μ N for a perfect unidirectional fiber alignment can be calculated using Equation (2).
x y z y x z y z x · μ P     μ A P μ N = μ P       μ A P   μ N  
The injection-molded sample’s Cof μ I M can then be calculated using a linear mixing rule:
P · μ P + A P · μ A P + N · μ N = μ I M
The linear wear rates of the injection molded samples can be predicted in the same way. In fact, for both materials C1 and C2, the calculated values for the injection molded parts show a high level of agreement with the actual measurements, as shown in Figure 10.
This observation highlights a significant correlation between fiber orientation and friction and wear behavior, which is essential for analyzing and predicting the tribological performance of components made of fiber-reinforced polymers. The findings underscore the importance of considering fiber orientation during the manufacturing of tribological components. Understanding and adjusting the fiber orientation leads to improved efficiency and reliability in dry-running polymer-based tribological systems.

3.3.3. Analysis of Tribomechanisms

The significant differences in the wear behavior of the two compounds, especially in the medium p·v range, can also be seen in the wear phenomena observed under the scanning electron microscope. While compound C2 (Figure 11, right) shows broken fibers as well as intact filaments, the contact surface of compound C1 shows, almost without exception, fiber fragments (Figure 11, left). Overall, the sliding surface of C1 indicates that fibers are destroyed by roughness peaks of the mating body in sliding contact and fiber fragments are entrained there. These then strike embedded fibers, ultimately leading to further fiber destruction. As a result, the normal forces introduced by the mating body can no longer be carried and transferred to the matrix by intact fibers, resulting in severe wear. In summary, the wear of material C1 is mainly caused by roughness peaks (asperities) of the metallic counterpart (Ra = 0.2 µm), i.e., fiber thinning, ploughing, fiber/matrix delamination, fiber breakout and three-body wear, and is thus a combination of abrasive and fatigue wear. The wear phenomena for material C2 are similar, although the fiber/matrix adhesion appears to be better intact, i.e., the fatigue wear appears to be less pronounced, resulting in less wear. On the one hand, this seems to be due to the attenuation of stress peaks by increasing the stiffness of the matrix, which reduces the stiffness discontinuity between fiber and matrix. In addition, there is a reduction in the introduction of frictional forces due to the so-called “nano-ball bearing effect” caused by the incorporated submicroscopic particles, which improves the fatigue strength in the fiber/matrix interphase [29]. At the same time, these small particles are deposited in front of the fibers, thus mitigating the load introduction due to counter-body roughness peaks [30].
The difference also becomes clear when the fibers are loaded in parallel under the same pv conditions (Figure 12). Fiber thinning and fiber breakage can be observed in both compounds. However, the filaments in compound C2 still appear to be largely well embedded, while the sliding surface of C1 shows strong fiber/matrix debonding and partial levering of the fibers out of the matrix bed, which is also confirmed by the laser-optical measurement of the tribologically stressed surfaces (Figure 13 and Figure 14). In the sliding surface of C2, the particle accumulations protecting the fibers [30] can also be seen in front of the fiber filaments.

4. Conclusions

  • Overall, the results of the study show that the manufacturing of tribological components made of fiber-reinforced plastics has a decisive influence on the fiber orientation in the tribological contact zone and thus ultimately has a significant influence on the tribological properties of components made from these materials.
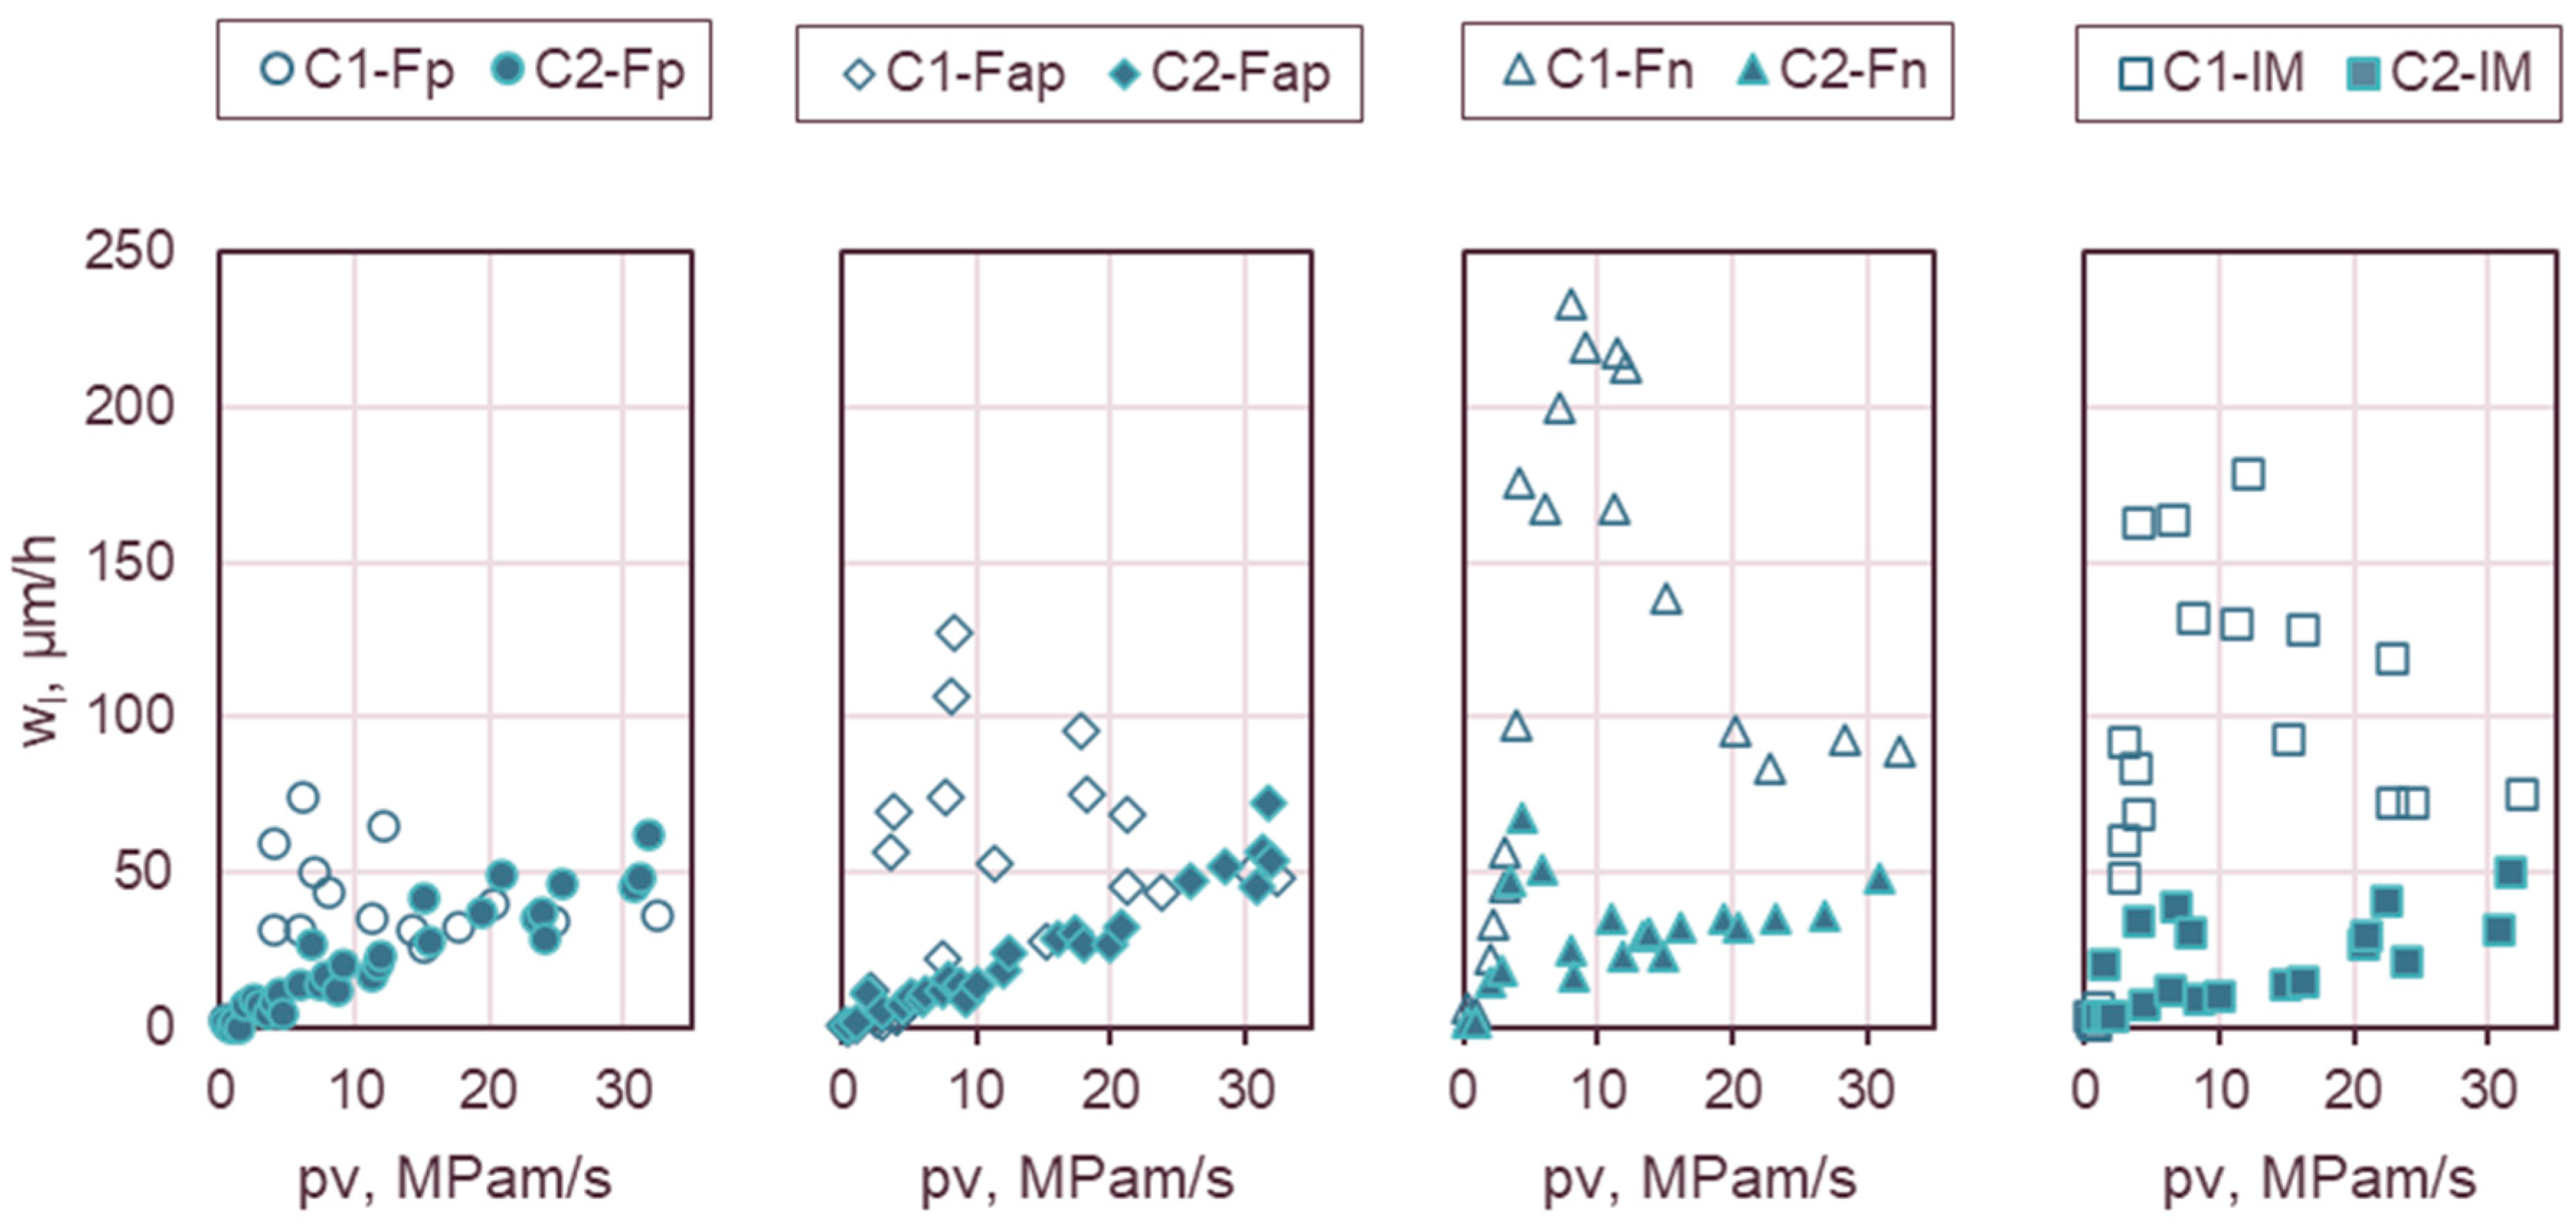
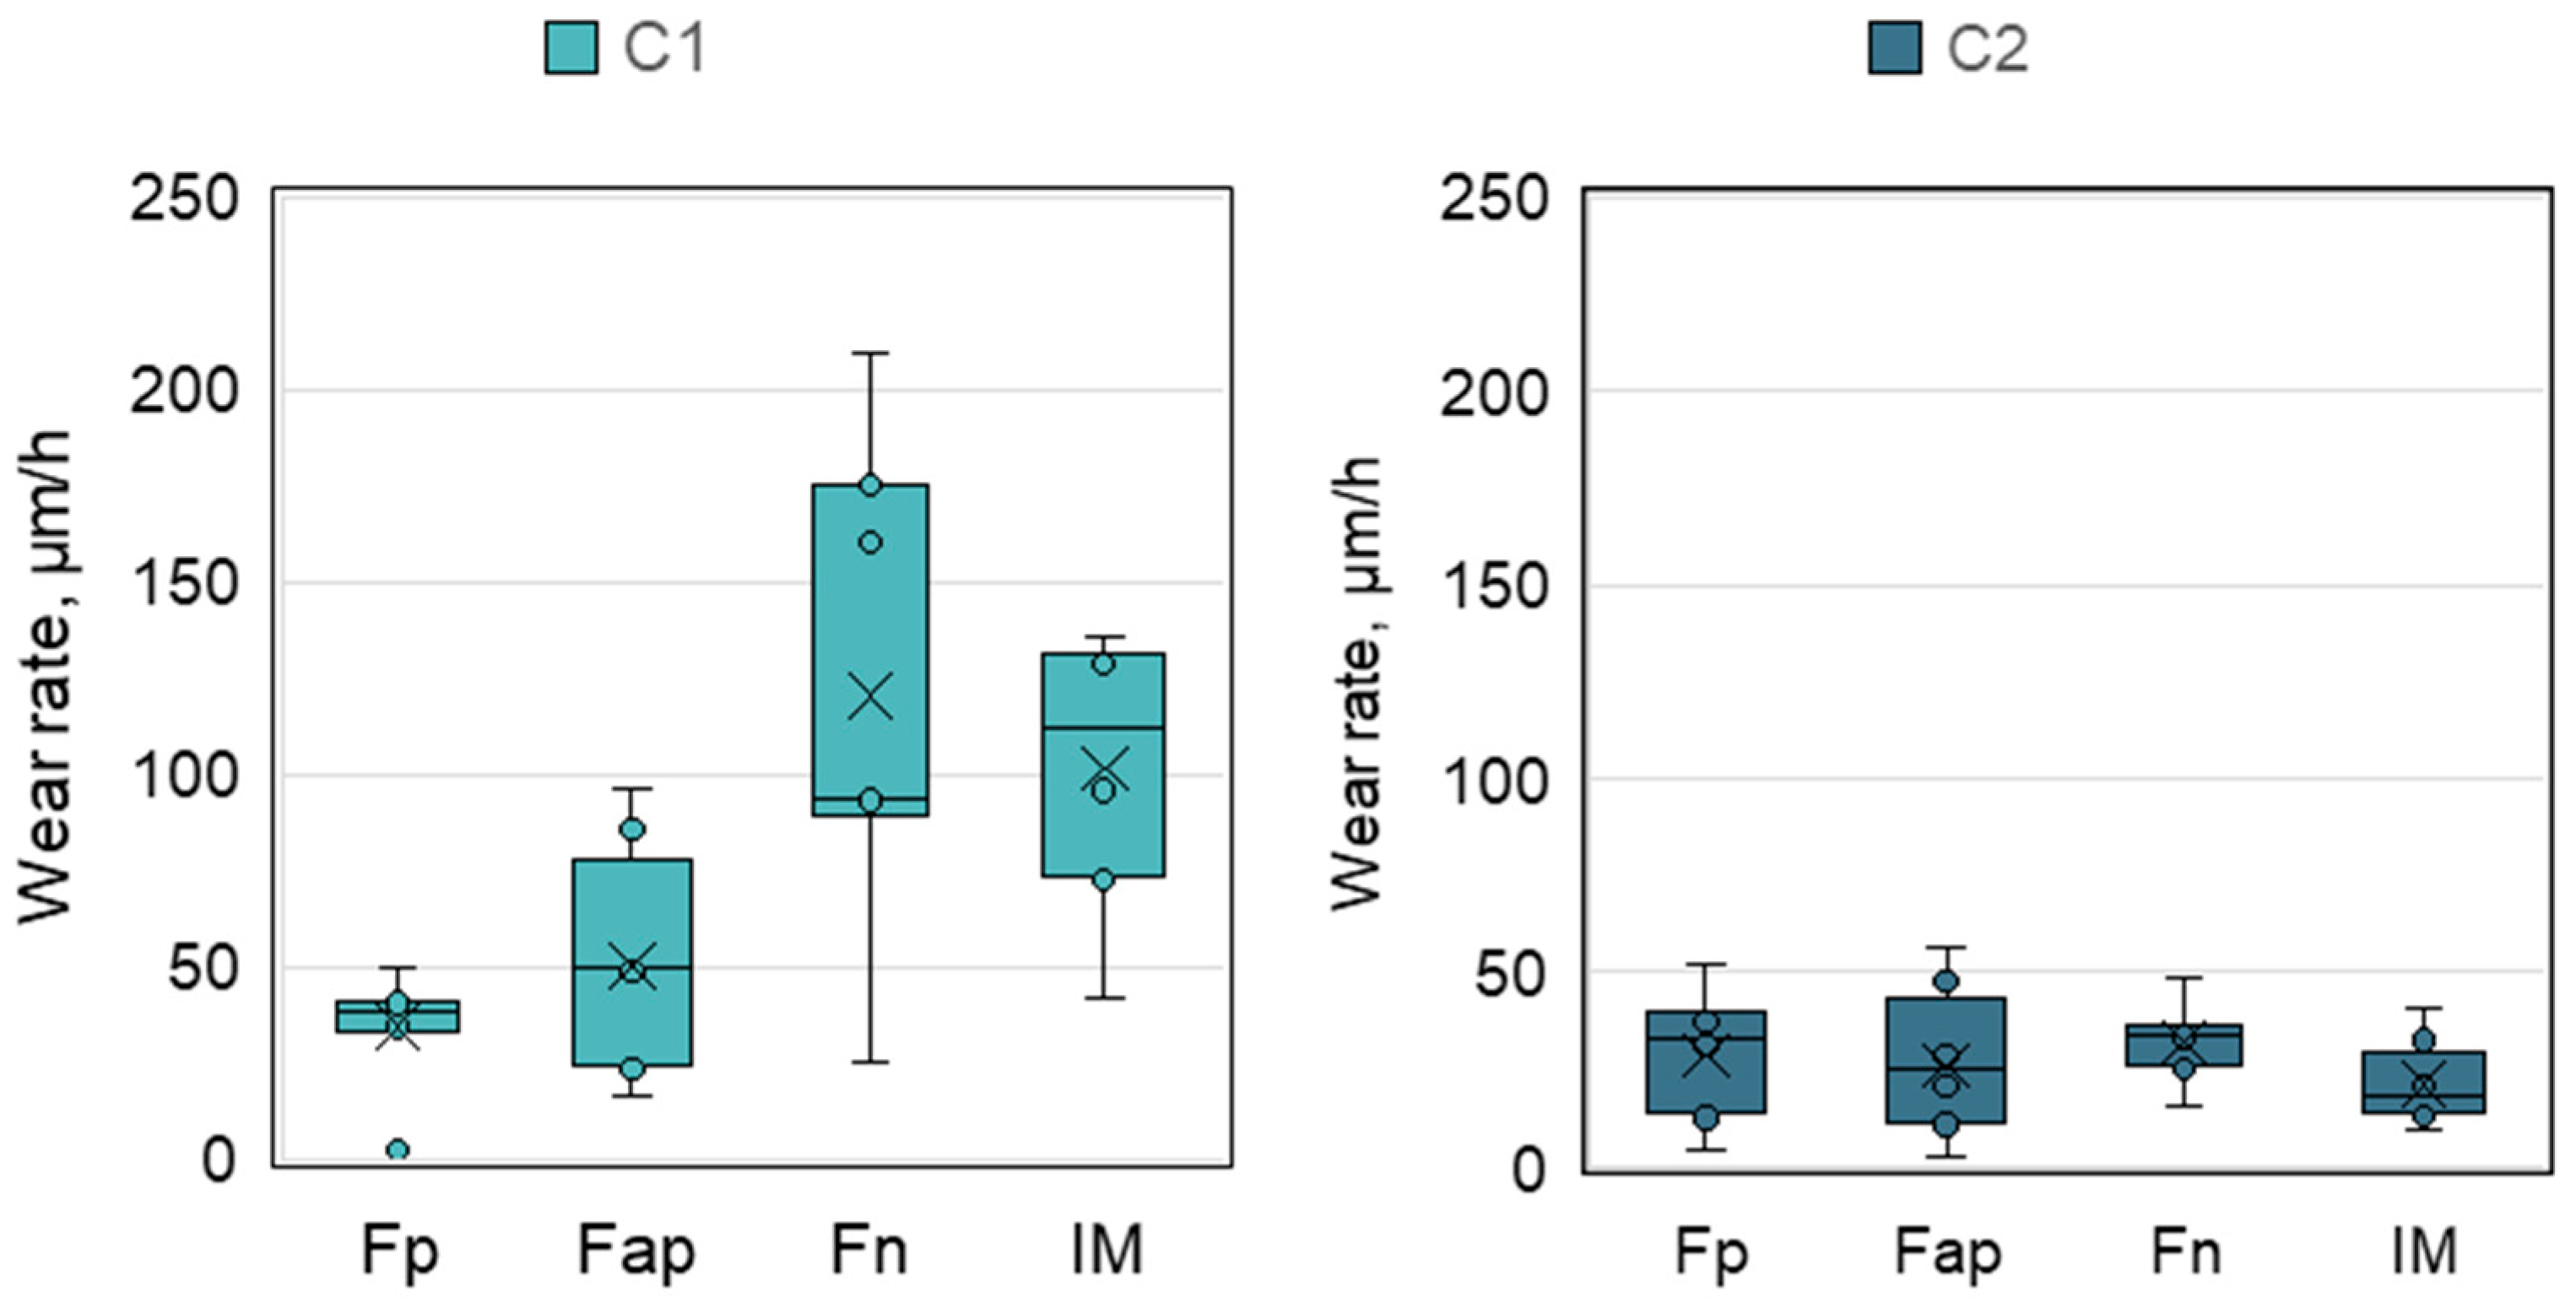
    • In principle, the friction coefficients in both the parallel (p) and antiparallel (ap) scenarios are significantly lower than in the normal (n) scenario.
    • This is analogous to the linear wear rate, where comparatively high wear values are observed at a pv range of p·v = 4–12 MPa·m/s. The lowest wear values are observed with parallel fiber loading. In this case, the wear also has the lowest scatter over the entire p·v range studied.
    • The three-layer structure along the wall thickness, which is typical for fiber-reinforced injection-molded parts, is reflected in the tribological properties of both injection molded compounds.
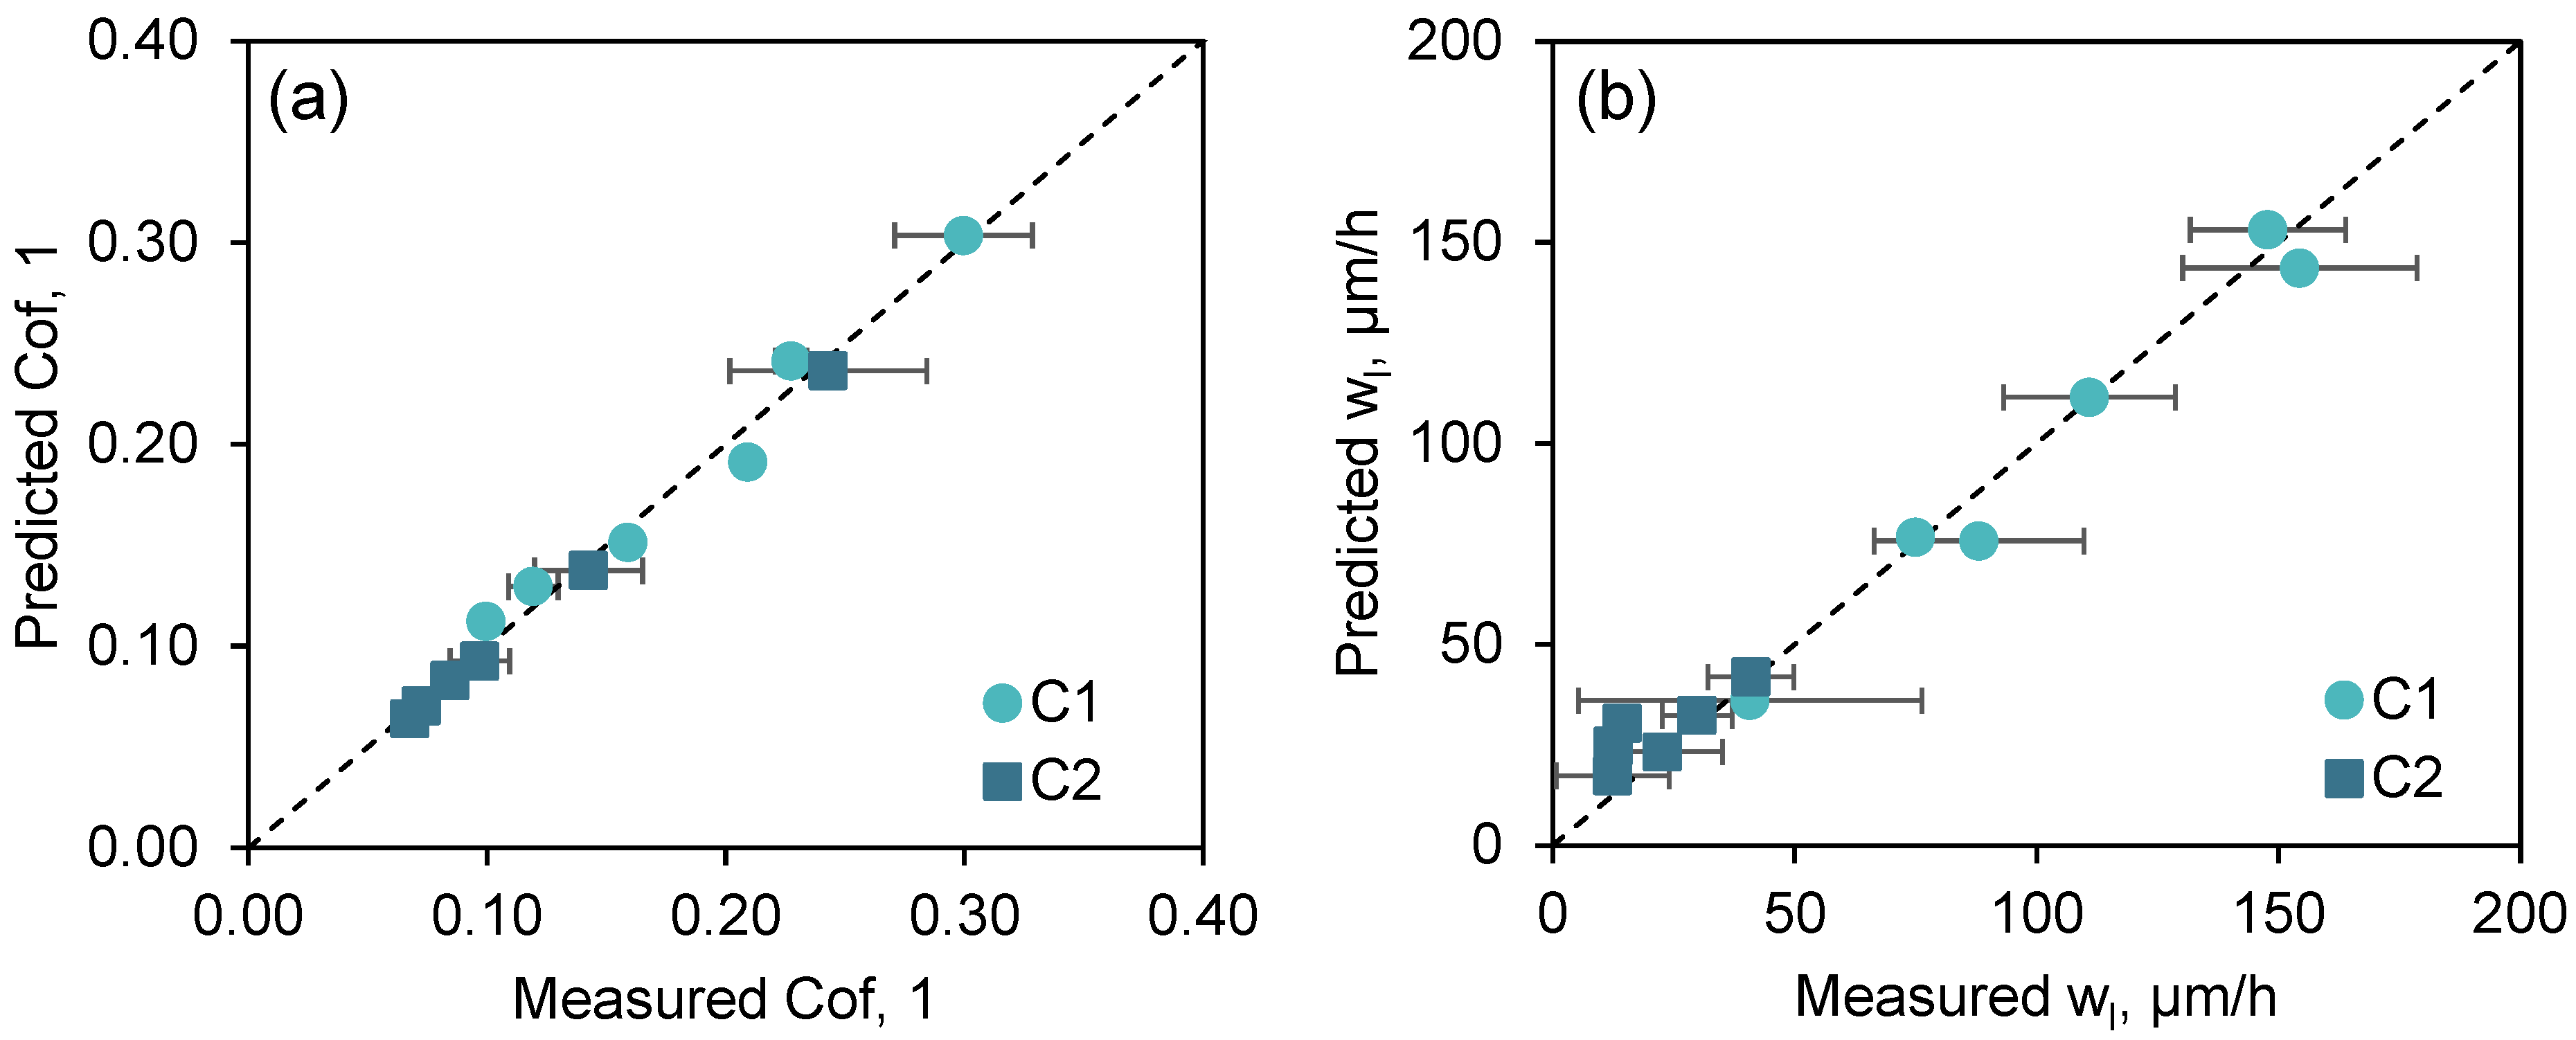
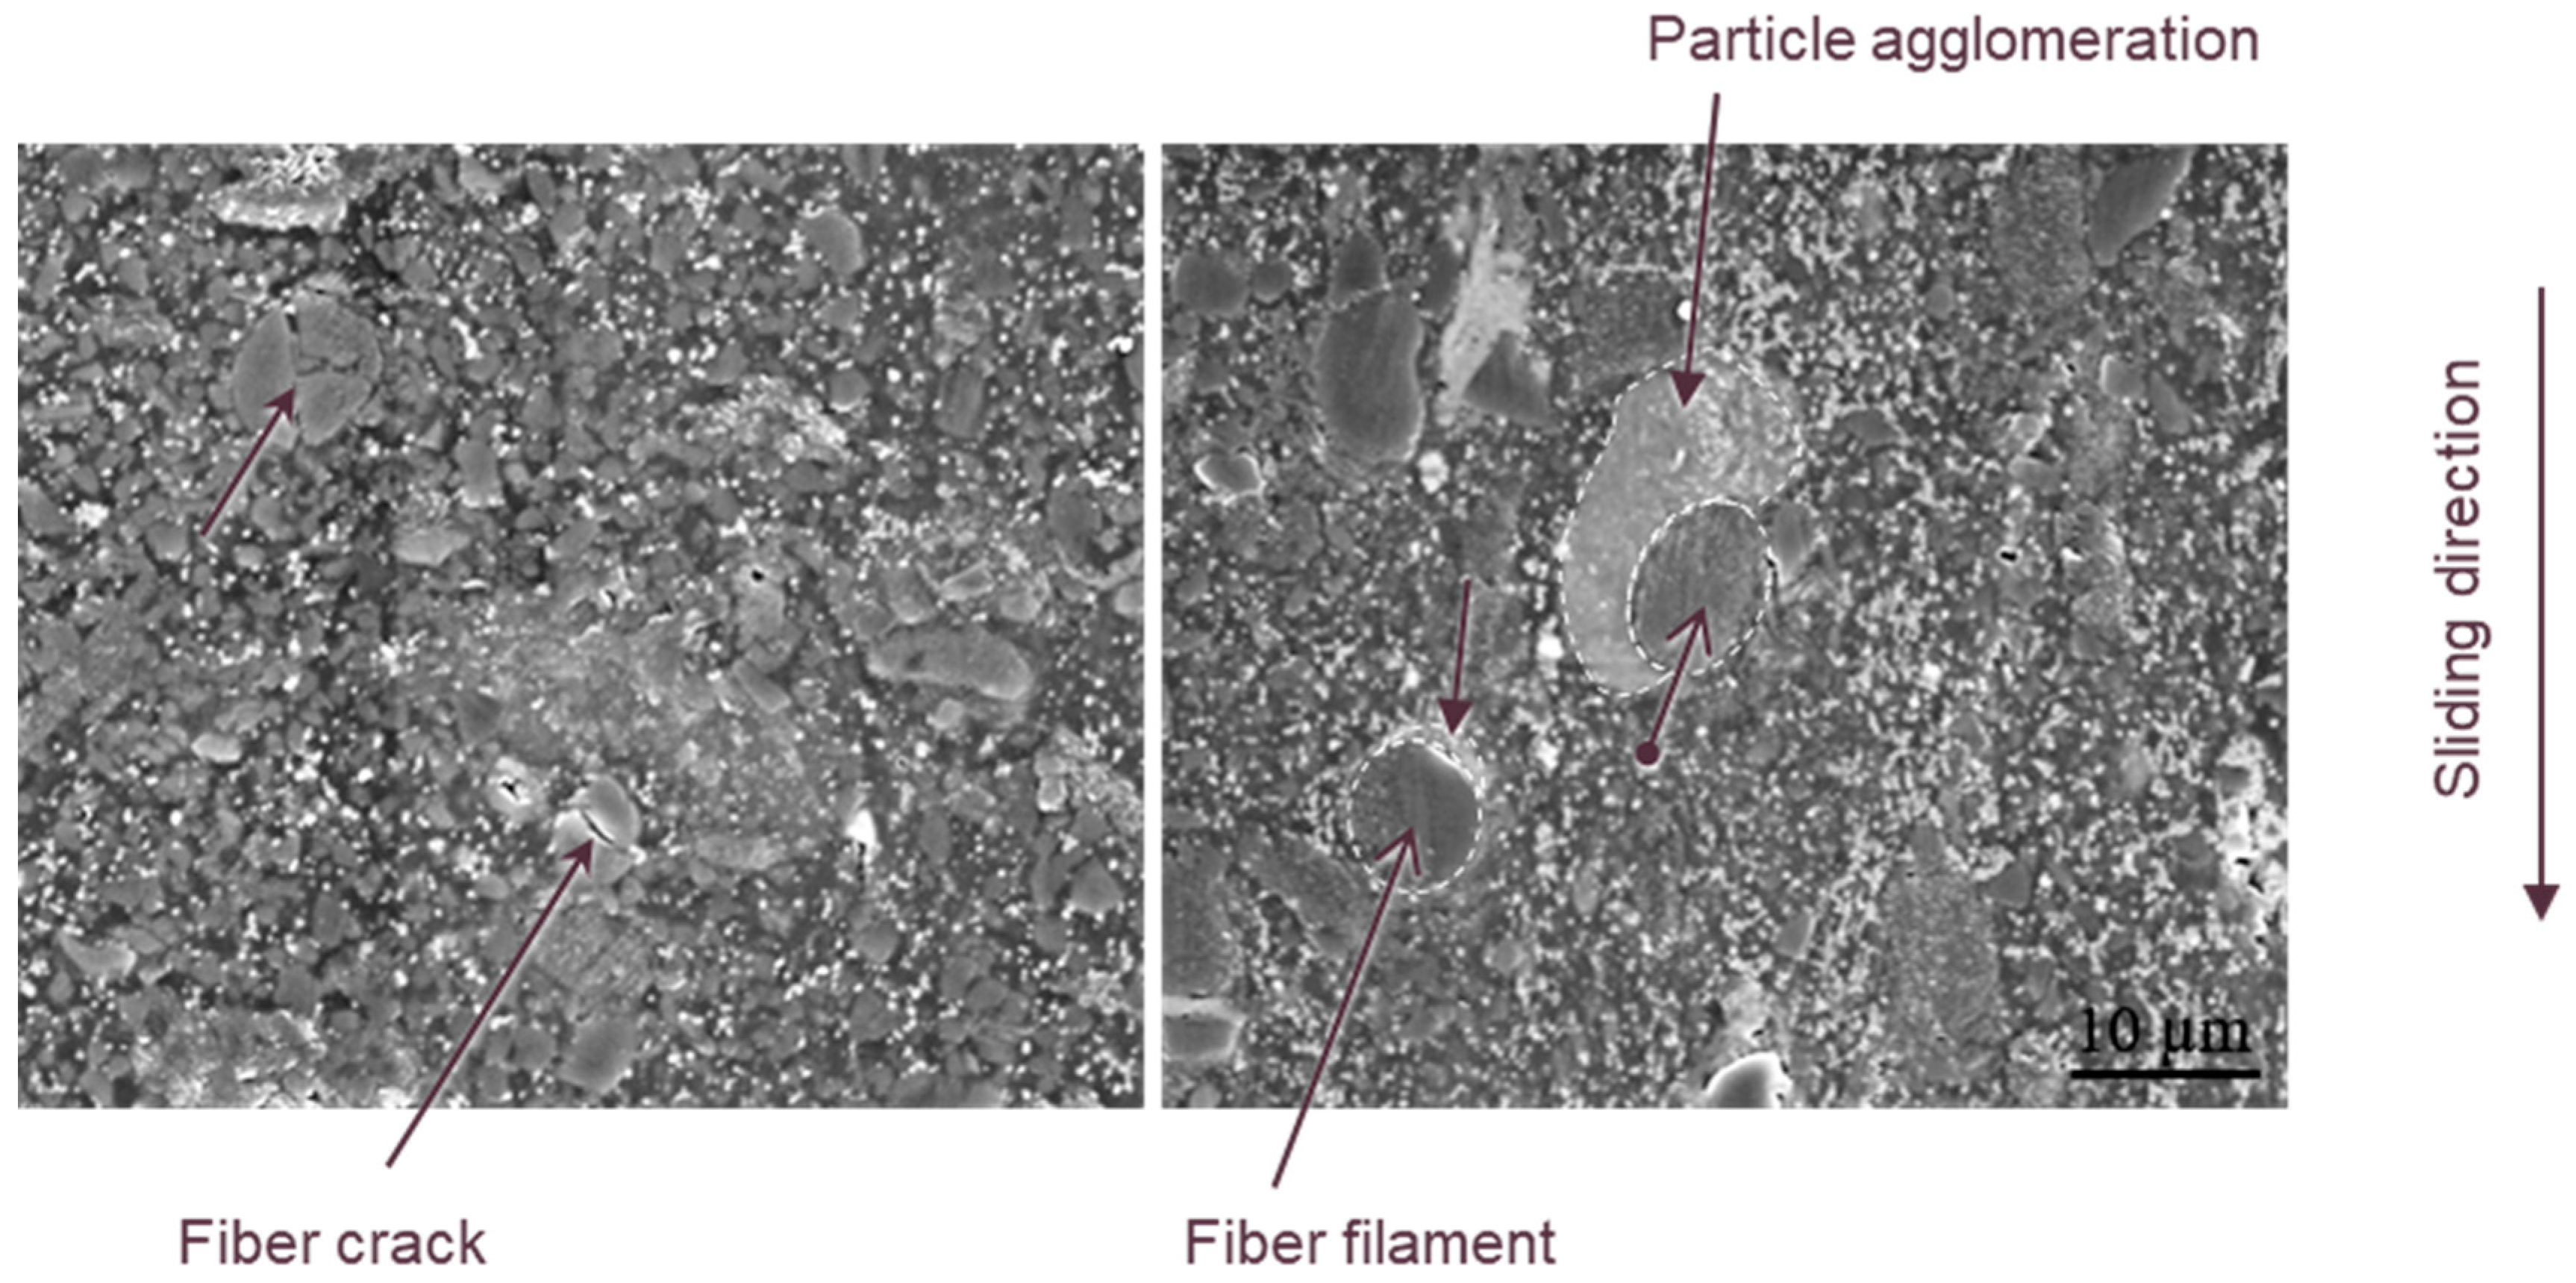
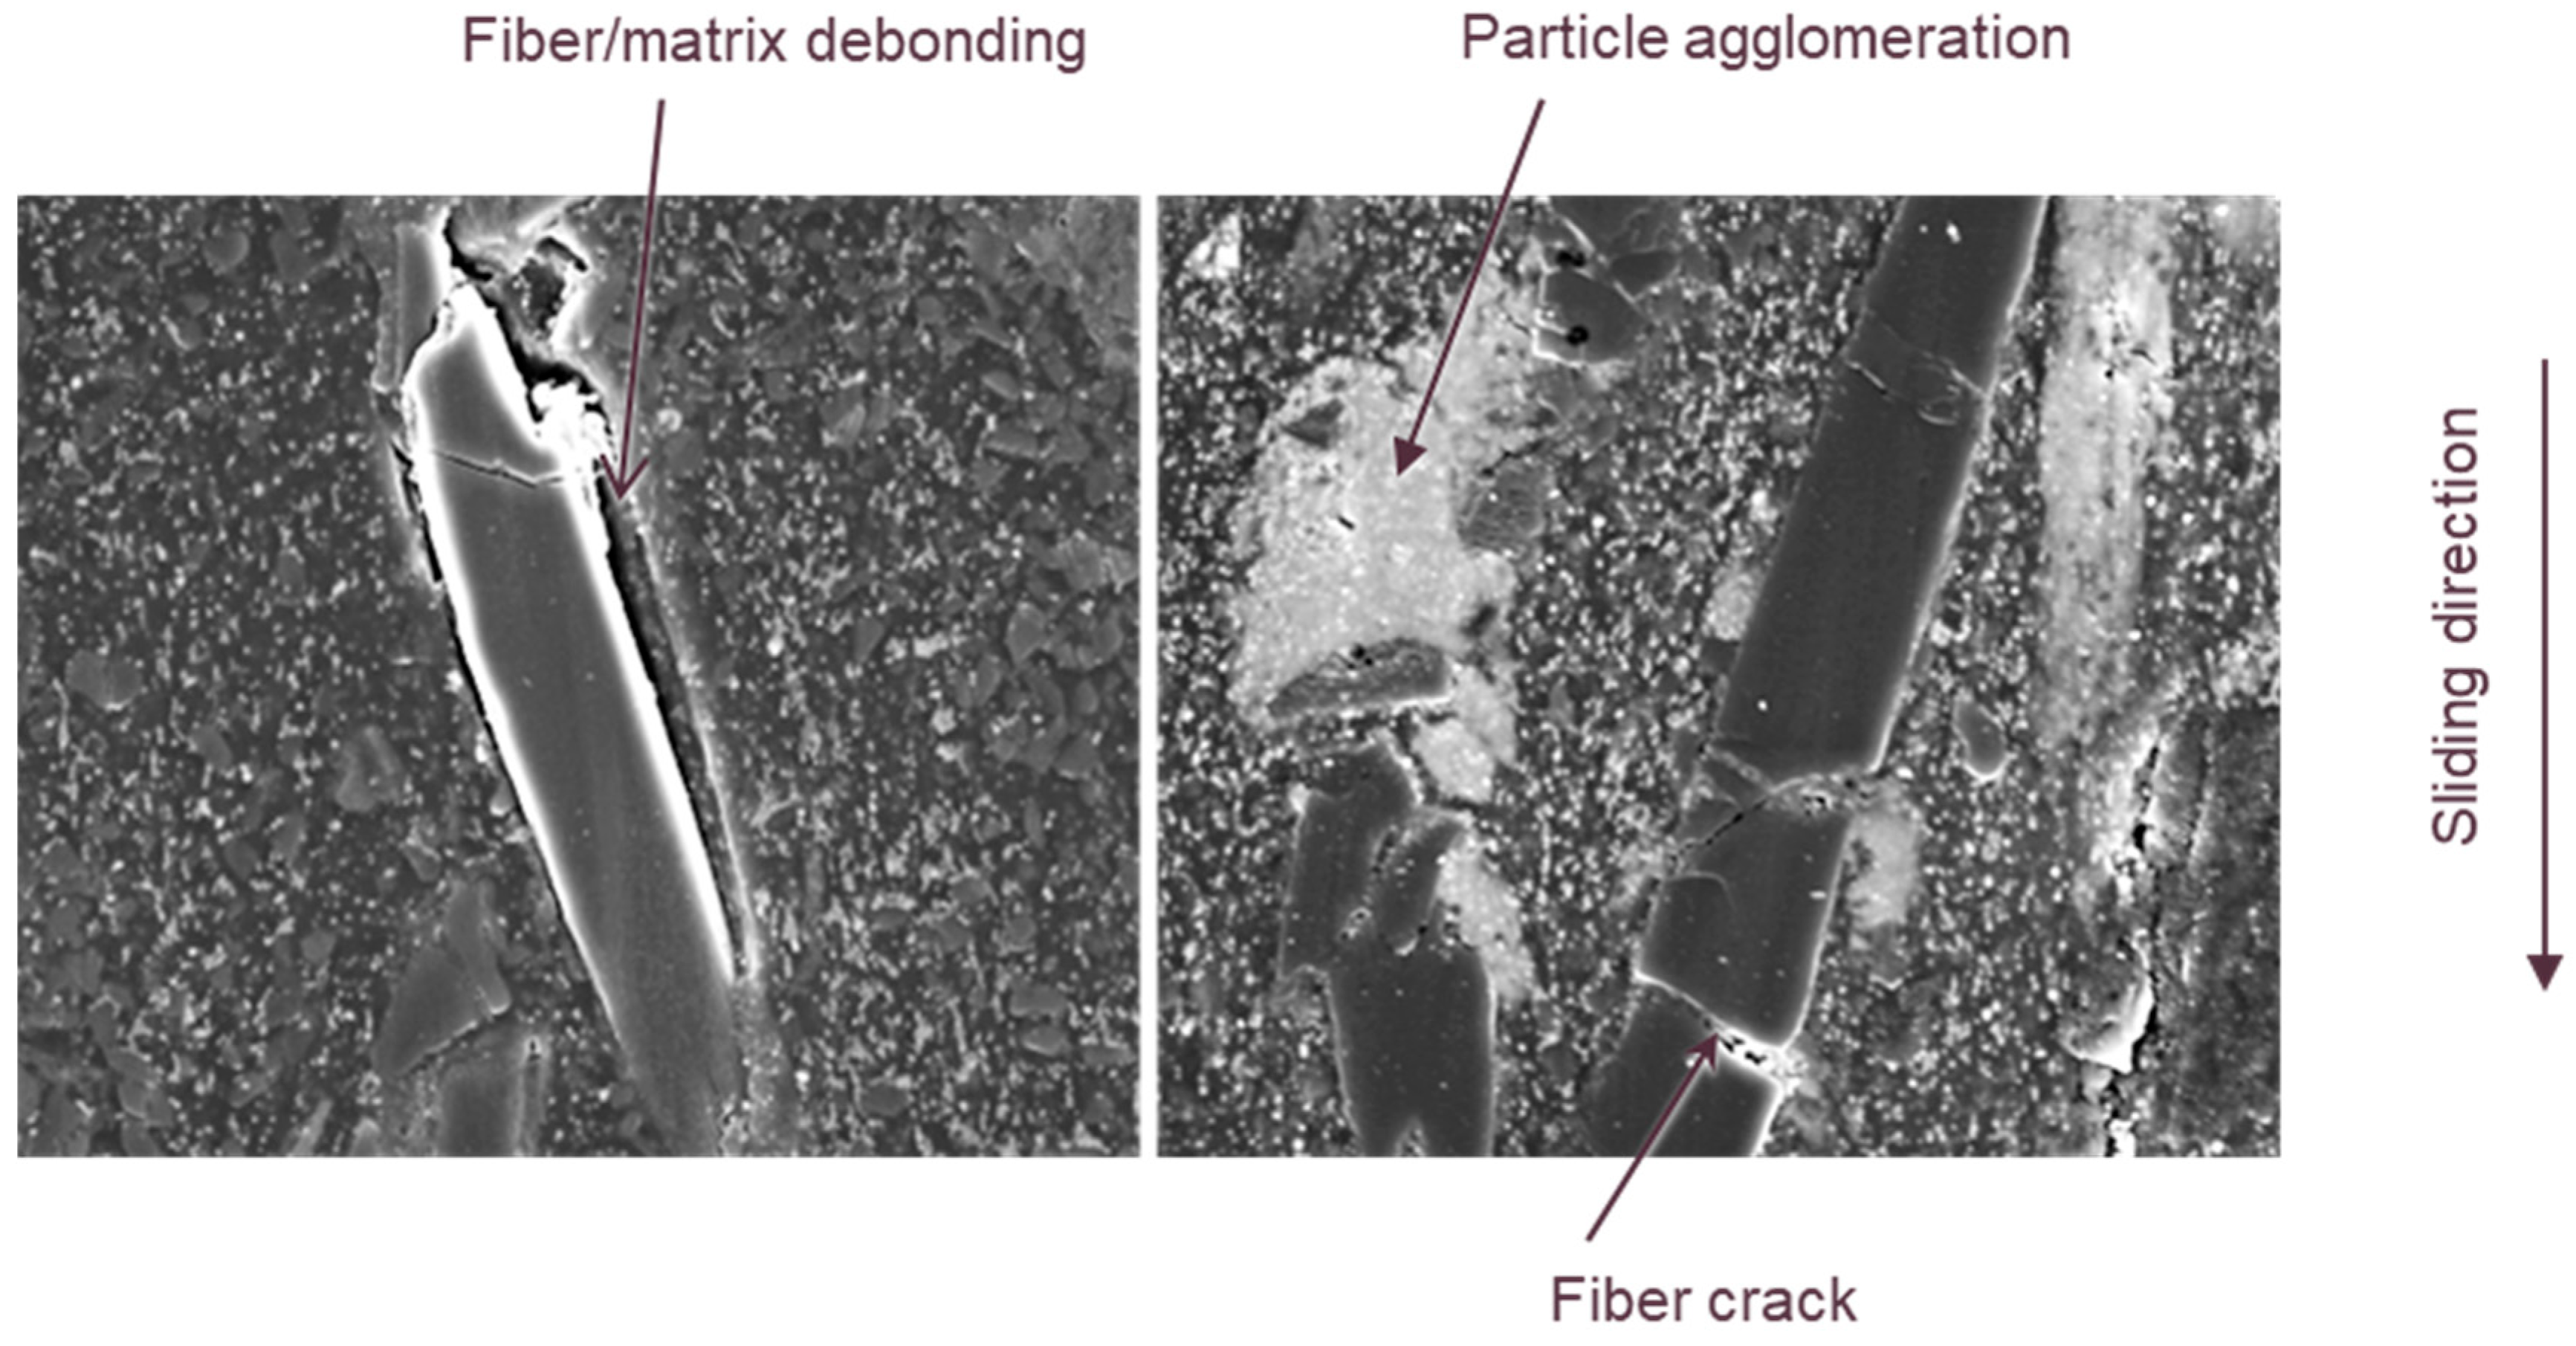
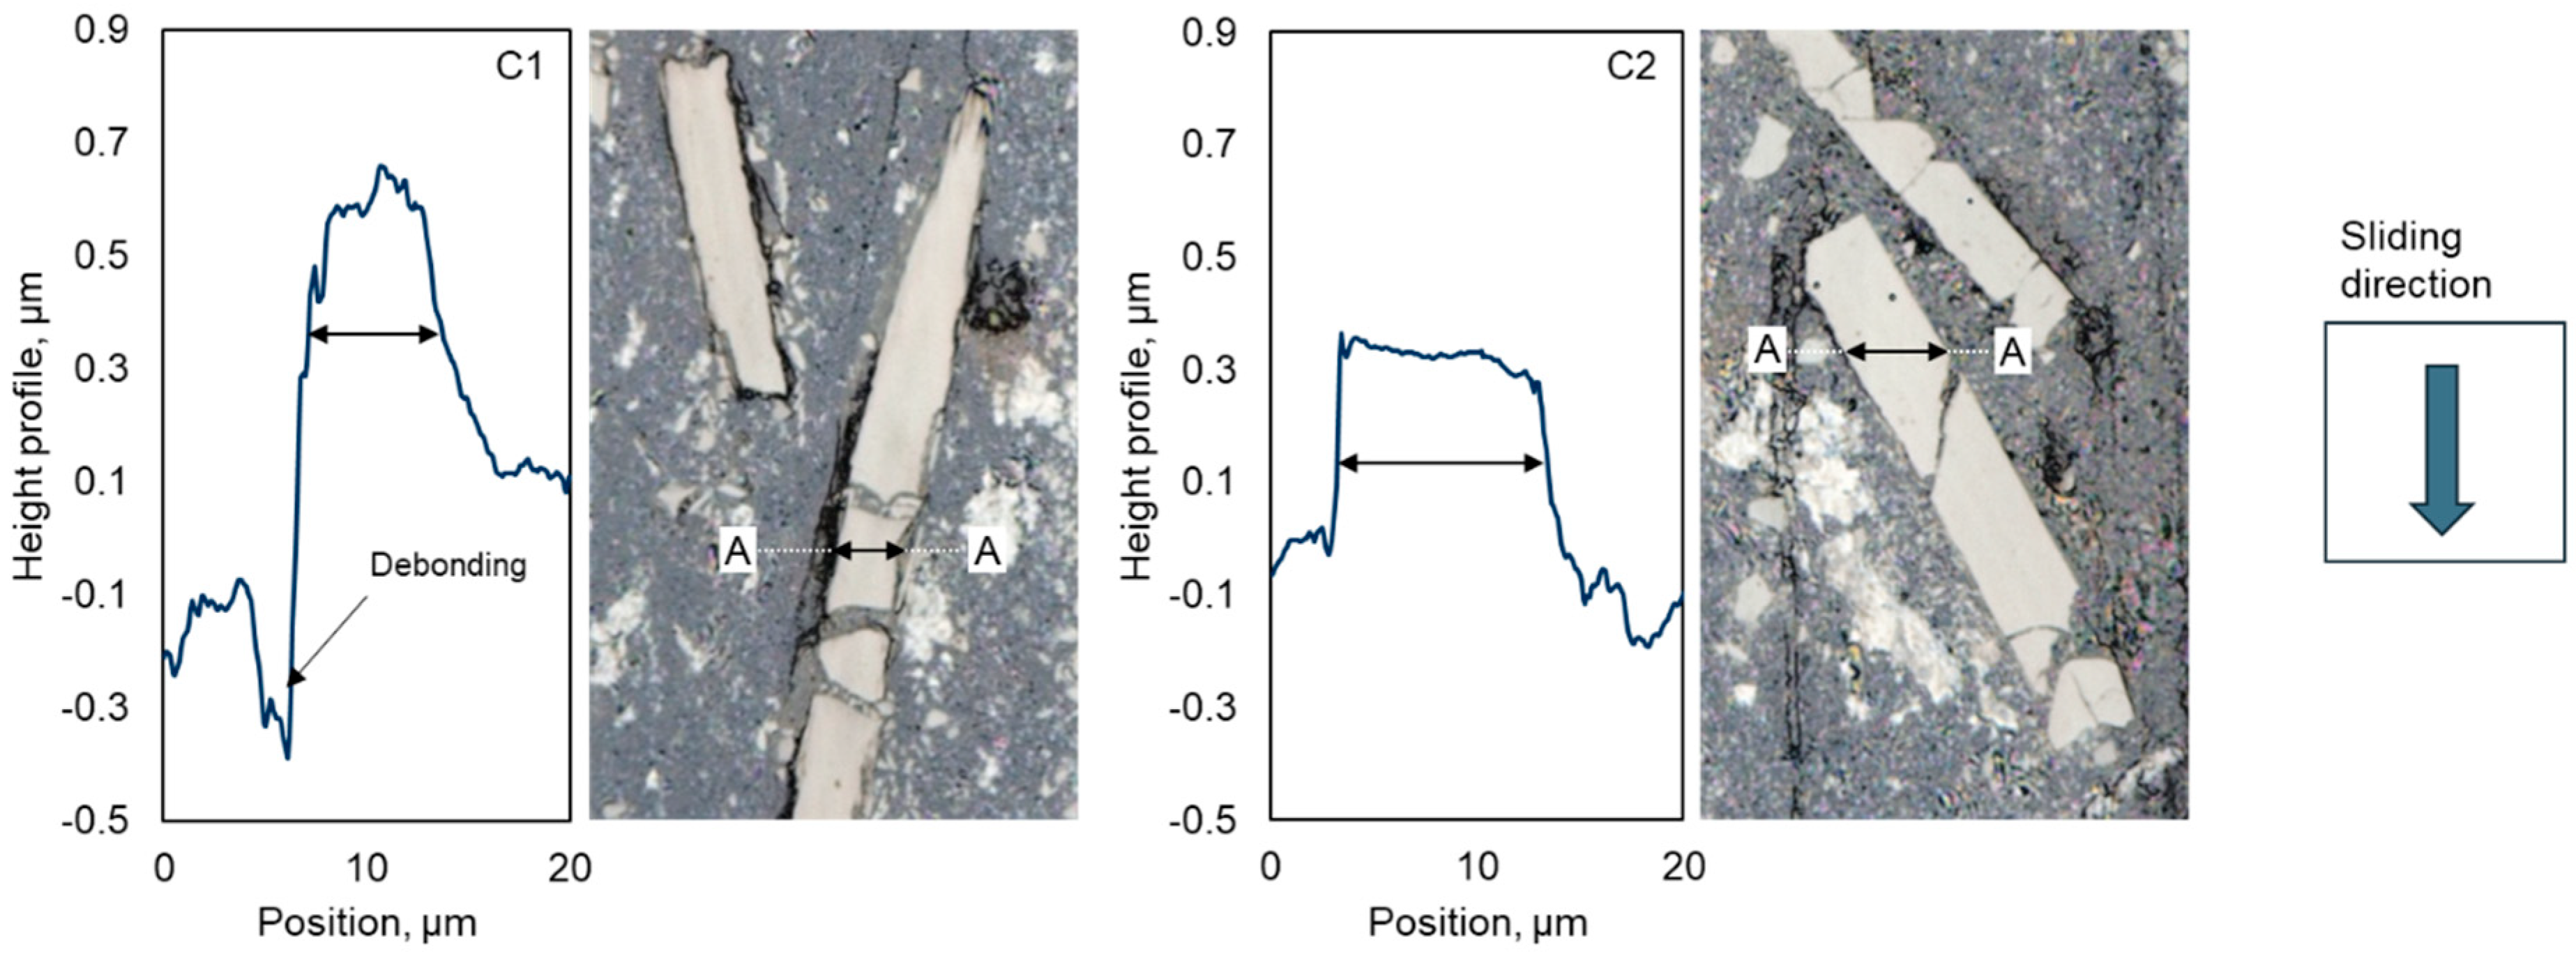
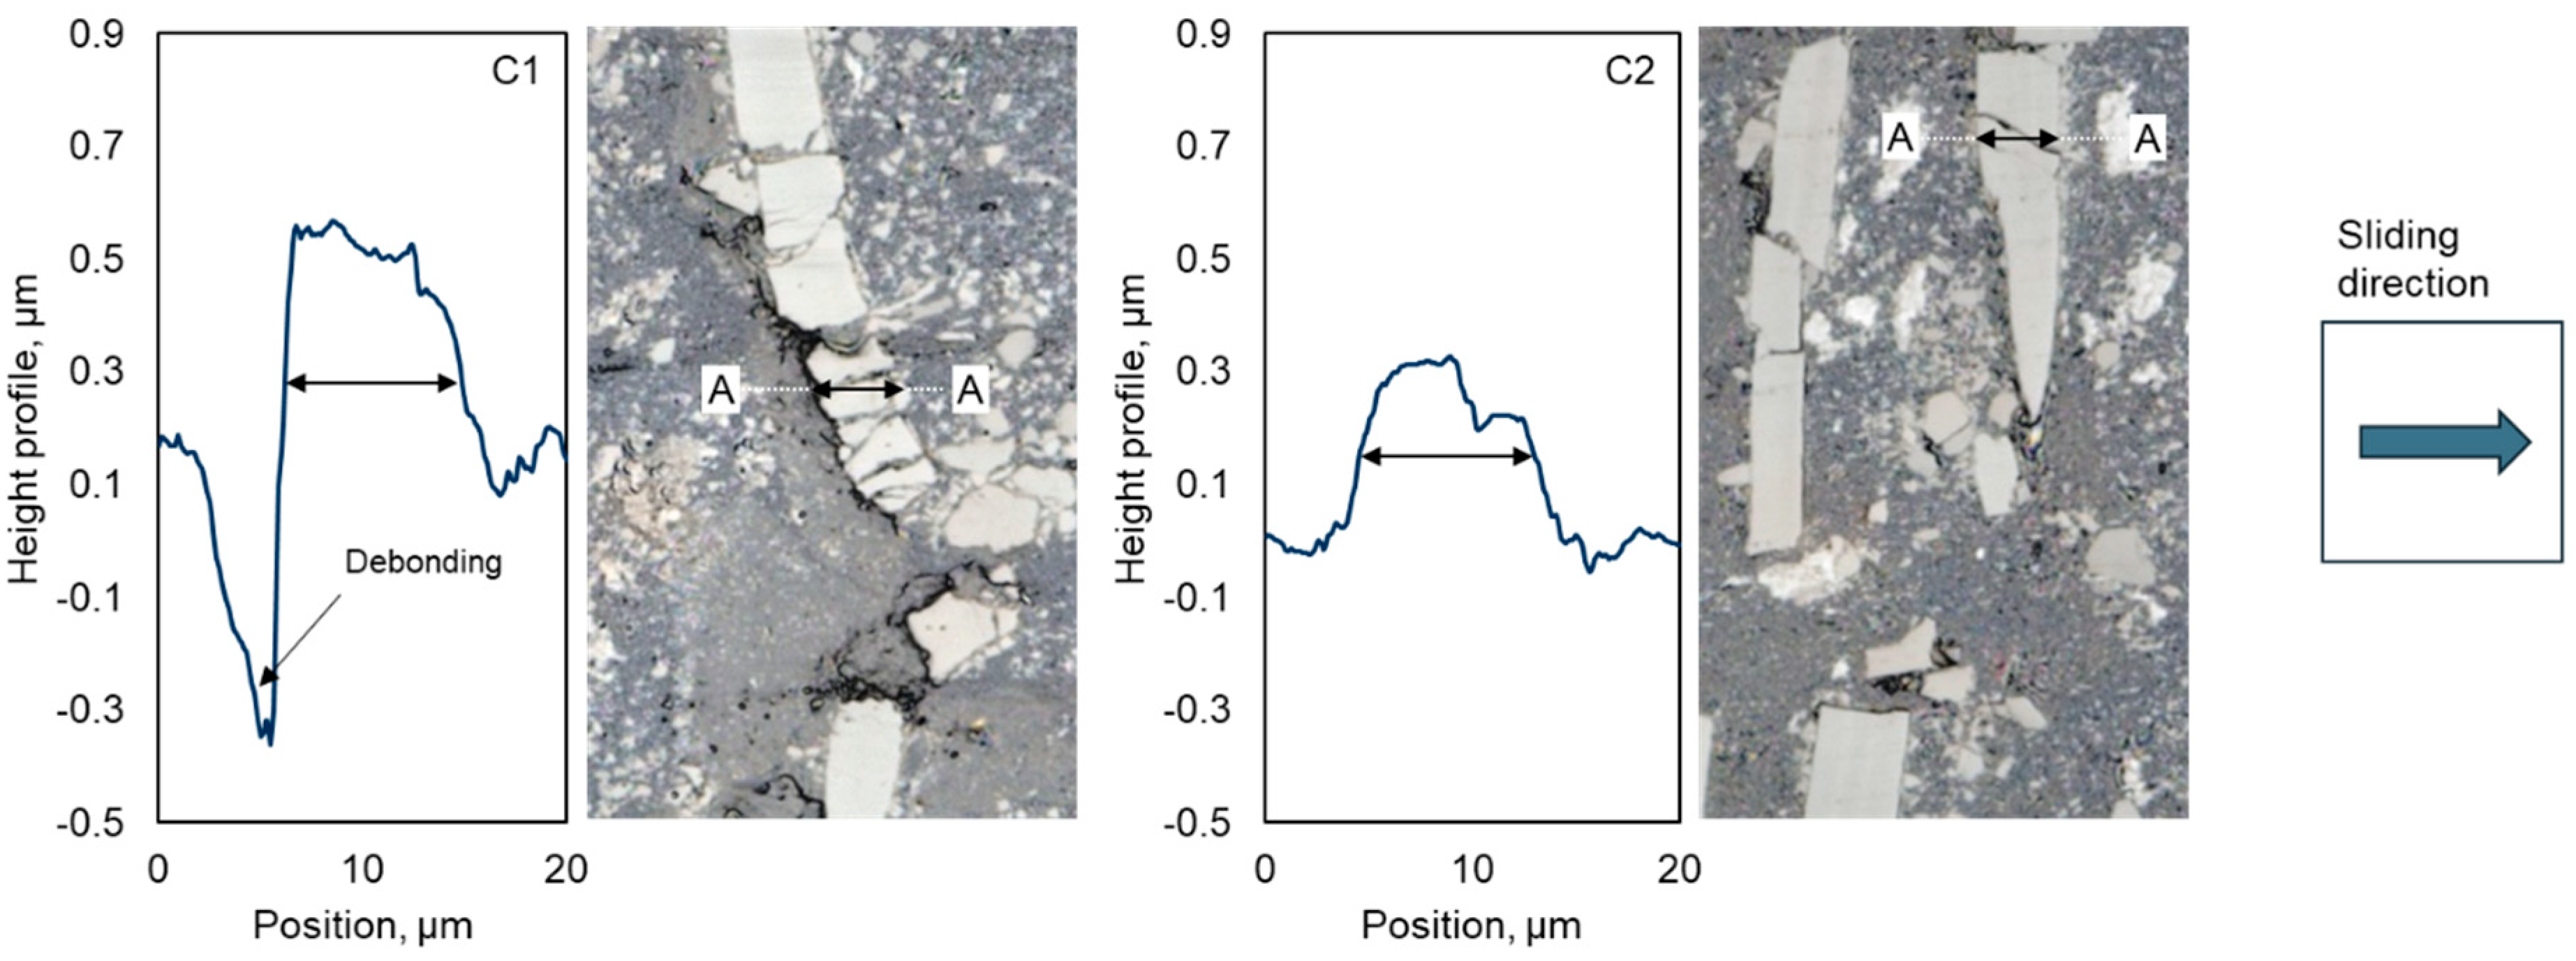
  • The wear phenomena in both materials are essentially characterized by fiber thinning, plowing and fiber breakage. In addition, in the compound without SiO2, fiber/matrix debonding and extreme fiber degradation occur throughout the pv range, especially when the fibers are oriented perpendicular to the sliding direction. The presence of SiO2 appears to protect the fibers and mitigate the stress peaks during load transfer from the counterpart to the base body, allowing the fibers to perform their load carrying role in the composite, ultimately resulting in lower coefficients of friction and significantly more favorable wear behavior. When fibers of different orientations are in frictional contact, the coefficient of friction and wear rate can be estimated using a linear mixing rule. The model allows results from samples with different fiber orientations to be standardized to one orientation, greatly reducing material development effort. The modeling option also appears robust based on the following consideration: with the same external load (frictional force), the shear stresses in the fibers are the same for parallel and antiparallel loading, but significantly higher for normal loading. Furthermore, the carbon fibers do not have an isotropic structure. This also explains the different behavior in the normal scenario. However, the load transfer scenario also applies to the bedding of the fibers. There is a difference between parallel and anti-parallel loading here, as the forces in the parallel situation are mainly transferred from the fiber to the matrix via shear. This means that the shear strength of the fiber/matrix interface has a major influence. In the anti-parallel arrangement, this predominantly takes place via normal stresses, i.e., the compressive strength of the matrix is also important. Since the tribological performance for these two scenarios is hardly different, we assume that there are no significant differences for other fiber orientations in the plane.
  • Sample preparation and its effects on fiber orientation must be considered in the development, qualification, and validation of hybrid polymer-based tribological materials.
  • Ultimately, the quality of the manufactured components is only indirectly related to the manufacturing process. If the manufacturing process aligns the fibers “in plane”, wear is generally lower than with a “normal” alignment of the fibers. However, for tribological systems used at high pv values, the difference decreases. This is because the fibers are more densely embedded at higher temperatures, and the composite material thus offers better damping against dynamic force transmission from the mating body. For robust engineering applications, care should be taken during production to ensure that flow processes avoid fiber orientation normal to the sliding direction. This can be achieved by selecting the sprue and gate positions during the injection molding of plain bearings, for example.

Author Contributions

A.K.S.: writing—original draft, writing—review and editing, supervision, resources, methodology, project administration, funding acquisition, conceptualization; M.H.: writing—original draft, methodology, investigation, formal analysis, data curation, project administration; Y.X.: writing—review and editing, data curation, calculations; C.H.: investigation, writing—review and editing; L.L.: funding acquisition, conceptualization, supervision, writing—review and editing. All authors have read and agreed to the published version of the manuscript.

Funding

This research was funded by the German Research Foundation (DFG) for the financial support of the research through grants no. 428934631 and 516013239.

Data Availability Statement

The raw data supporting the conclusions of this article will be made available by the authors on request.

Acknowledgments

We would also like to thank Evonik Operations GmbH (Germany), Superior Graphite Europe (Sweden), Kronos international Inc. (Germany), and Venator Germany GmbH (Germany) for the donation of raw materials.

Conflicts of Interest

The authors declare no conflicts of interest.

Abbreviations

The following abbreviations are used in this manuscript:
AMAdditive manufacturing
FFFFused filament fabrication
IMInjection molding
ABSAcrylonitrile butadiene styrene
PEEKPolyether ether ketone
PLAPolylactic acid
PoDPin-on-disc
pSurface pressure
vSilding velocity
CofCoefficient of friction
wlLinear wear rate

References

  1. Voss, H.; Friedrich, K. On the Wear Behaviour of Short-Fibre-Reinforced Peek Composites. Wear 1987, 116, 1–18. [Google Scholar] [CrossRef]
  2. Molazemhosseini, A.; Tourani, H.; Khavandi, A.; Eftekhari Yekta, B. Tribological Performance of PEEK Based Hybrid Composites Reinforced with Short Carbon Fibers and Nano-Silica. Wear 2013, 303, 397–404. [Google Scholar] [CrossRef]
  3. Parandoush, P.; Lin, D. A Review on Additive Manufacturing of Polymer-Fiber Composites. Compos. Struct. 2017, 182, 36–53. [Google Scholar] [CrossRef]
  4. Lin, L.; Ecke, N.; Huang, M.; Pei, X.; Schlarb, A.K. Impact of Nanosilica on the Friction and Wear of a PEEK/CF Composite Coating Manufactured by Fused Deposition Modeling (FDM). Compos. Part B Eng. 2019, 177, 107428/1–107428/10. [Google Scholar] [CrossRef]
  5. Zhang, W.; Cotton, C.; Sun, J.; Heider, D.; Gu, B.; Sun, B.; Chou, T.W. Interfacial Bonding Strength of Short Carbon Fiber/Acrylonitrile-Butadiene-Styrene Composites Fabricated by Fused Deposition Modeling. Compos. Part B Eng. 2018, 137, 51–59. [Google Scholar] [CrossRef]
  6. Sodeifian, G.; Ghaseminejad, S.; Yousefi, A.A. Preparation of Polypropylene/Short Glass Fiber Composite as Fused Deposition Modeling (FDM) Filament. Results Phys. 2019, 12, 205–222. [Google Scholar] [CrossRef]
  7. Zhang, Y.; Purssell, C.; Mao, K.; Leigh, S. A Physical Investigation of Wear and Thermal Characteristics of 3D Printed Nylon Spur Gears. Tribol. Int. 2020, 141, 105953. [Google Scholar] [CrossRef]
  8. Amiruddin, H.; Bin Abdollah, M.F.; Norashid, N.A. Comparative Study of the Tribological Behaviour of 3D-Printed and Moulded ABS under Lubricated Condition. Mater. Res. Express 2019, 6, 85328. [Google Scholar] [CrossRef]
  9. Kamonrattanapisud, M.; Tuchinda, K. Experimental Study of Fiber Orientation Effect on Frictional Material Properties and Tribology Performance. Solid State Phenom. 2020, 304, 25–32. [Google Scholar] [CrossRef]
  10. Prusinowski, A.; Kaczyński, R. Investigation of Tribological and Strength Properties of ABS/CF Fibrous Composites Formed in Fused Deposition Modeling. J. Frict. Wear 2020, 41, 318–325. [Google Scholar] [CrossRef]
  11. Norani, M.N.M.; Bin Abdollah, M.F.; Abdullah, M.I.H.C.; Amiruddin, H.; Ramli, F.R.; Tamaldin, N. Correlation of Tribo-Mechanical Properties of Internal Geometry Structures of Fused Filament Fabrication 3D-Printed Acrylonitrile Butadiene Styrene. Ind. Lubr. Tribol. 2020, 72, 1259–1265. [Google Scholar] [CrossRef]
  12. Hanon, M.M.; Alshammas, Y.; Zsidai, L. Effect of Print Orientation and Bronze Existence on Tribological and Mechanical Properties of 3D-Printed Bronze/PLA Composite. Int. J. Adv. Manuf. Technol. 2020, 108, 553–570. [Google Scholar] [CrossRef]
  13. Ertane, E.G.; Dorner-Reisel, A.; Baran, O.; Welzel, T.; Matner, V.; Svoboda, S. Processing and Wear Behaviour of 3D Printed PLA Reinforced with Biogenic Carbon. Adv. Tribol. 2018, 2018, 1763182. [Google Scholar] [CrossRef]
  14. Zhiani Hervan, S.; Altınkaynak, A.; Parlar, Z. Hardness, Friction and Wear Characteristics of 3D-Printed PLA Polymer. Proc. Inst. Mech. Eng. Part J J. Eng. Tribol. 2021, 235, 1590–1598. [Google Scholar] [CrossRef]
  15. Luo, M.; He, Q.; Wang, H.; Chang, L. Tribological Behavior of Surface Textured Short Carbon Fiber-Reinforced Nylon Composites Fabricated by Three-Dimensional Printing Techniques. J. Tribol. 2021, 143, 051105. [Google Scholar] [CrossRef]
  16. Hanon, M.M.; Kovács, M.; Zsidai, L. Tribology Behaviour Investigation of 3D Printed Polymers. Int. Rev. Appl. Sci. Eng. 2019, 10, 173–181. [Google Scholar] [CrossRef]
  17. Sojoodi Farimani, F.; de Rooij, M.; Hekman, E.; Misra, S. Frictional Characteristics of Fusion Deposition Modeling (FDM) Manufactured Surfaces. Rapid Prototyp. J. 2020, 26, 1095–1102. [Google Scholar] [CrossRef]
  18. Ramachandran, M.G.; Rajeswari, N. Influence of Nano Silica on Mechanical and Tribological Properties of Additive Manufactured PLA Bio Nanocomposite. Silicon 2021, 14, 703–709. [Google Scholar] [CrossRef]
  19. Przekop, R.E.; Kujawa, M.; Pawlak, W.; Dobrosielska, M.; Sztorch, B.; Wieleba, W. Graphite Modified Polylactide (PLA) for 3D Printed (FDM/FFF) Sliding Elements. Polymers 2020, 12, 1250. [Google Scholar] [CrossRef]
  20. Norani, M.N.M.; Bin Abdollah, M.F.; Abdullah, M.I.H.C.; Amiruddin, H.; Ramli, F.R.; Tamaldin, N. 3D Printing Parameters of Acrylonitrile Butadiene Styrene Polymer for Friction and Wear Analysis Using Response Surface Methodology. Proc. Inst. Mech. Eng. Part J J. Eng. Tribol. 2021, 235, 468–477. [Google Scholar] [CrossRef]
  21. Zhang, P.; Hu, Z.; Xie, H.; Lee, G.H.; Lee, C.H. Friction and Wear Characteristics of Polylactic Acid (PLA) for 3D Printing under Reciprocating Sliding Condition. Ind. Lubr. Tribol. 2020, 72, 533–539. [Google Scholar] [CrossRef]
  22. Ballesteros, L.M.; Zuluaga, E.; Cuervo, P.; Rudas, J.S.; Toro, A. Tribological Behavior of Polymeric 3D-Printed Surfaces with Deterministic Patterns Inspired in Snake Skin Morphology. Surf. Topogr. Metrol. Prop. 2021, 9, 014002. [Google Scholar] [CrossRef]
  23. Bin Abdollah, M.F.; Norani, M.N.M.; Abdullah, M.I.H.C.; Amiruddin, H.; Ramli, F.R.; Tamaldin, N. Synergistic Effect of Loads and Speeds on the Dry Sliding Behaviour of Fused Filament Fabrication 3D-Printed Acrylonitrile Butadiene Styrene Pins with Different Internal Geometries. Int. J. Adv. Manuf. Technol. 2020, 108, 2525–2539. [Google Scholar] [CrossRef]
  24. Pawlak, W.; Wieleba, W.; Kluczynski, J.; Sniezek, L. The Influence of the Addition of Graphite on the Tribological Properties of Polylactic (PLA) Applied in 3D Printing Technology. Tribologia 2021, 277, 89–93. [Google Scholar] [CrossRef]
  25. Prusinowski, A.; Kaczynski, R. Tribological Behaviour of Additively Manufactured Fiber-Reinforced Thermoplastic Composites in Various Environments. Polymers 2020, 12, 1551. [Google Scholar] [CrossRef]
  26. Lv, X.; Yang, S.; Pei, X.; Zhang, Y.; Wang, Q.; Wang, T. Tribological Anisotropy of PEEK Composites Filled with Highly Oriented Carbon Fibers Manufactured by Fused Deposition Modeling. Polym. Compos. 2024, 45, 2656–2669. [Google Scholar] [CrossRef]
  27. Zhang, G.; Rasheva, Z.; Schlarb, A.K. Friction and Wear Variations of Short Carbon Fiber (SCF)/PTFE/Graphite (10 Vol.%) Filled PEEK: Effects of Fiber Orientation and Nominal Contact Pressure. Wear 2010, 268, 893–899. [Google Scholar] [CrossRef]
  28. Friedrich, K.; Zhang, Z.; Schlarb, A.K. Effects of Various Fillers on the Sliding Wear of Polymer Composites. Compos. Sci. Technol. 2005, 65, 2329–2343. [Google Scholar] [CrossRef]
  29. Zhang, G.; Chang, L.; Schlarb, A.K. The Roles of Nano-SiO2 Particles on the Tribological Behavior of Short Carbon Fiber Reinforced PEEK. Compos. Sci. Technol. 2009, 69, 1029–1035. [Google Scholar] [CrossRef]
  30. Lin, L.; Schlarb, A.K. Effect of the Varied Load Conditions on the Tribological Performance and the Thermal Characteristics of PEEK-Based Hybrid Composites. Tribol. Int. 2016, 101, 218–225. [Google Scholar] [CrossRef]
  31. Bondy, M. Composites Fibre Orientation from One Cross Section, Matlab File Exch. 2016. Available online: https://www.Mathworks.Com/Matlabcentral/Fileexchange/57883-Composites-Fibre-Orientation-from-One-Cross-Section (accessed on 13 July 2020).
  32. Brenken, B.; Barocio, E.; Favaloro, A.; Kunc, V.; Pipes, R.B. Fused Filament Fabrication of Fiber-Reinforced Polymers: A Review. Addit. Manuf. 2018, 21, 1–16. [Google Scholar] [CrossRef]
  33. Goh, G.D.; Yap, Y.L.; Agarwala, S.; Yeong, W.Y. Recent Progress in Additive Manufacturing of Fiber Reinforced Polymer Composite. Adv. Mater. Technol. 2019, 4, 1800271. [Google Scholar] [CrossRef]
Figure 1. Schematic representation of the entire processing chain; x = printing direction.
Lubricants 13 00234 g001
Figure 2. Schematic representation of the pin-on-disc test apparatus and definition of the fiber orientation directions (top view of the contact surface of the pin).
Lubricants 13 00234 g002
Figure 3. Morphology of 3D-printed samples; left: C1, right: C2. (a) xy-plane, (b) yz-plane and (c) injection-molded sample, yz-plane.
Lubricants 13 00234 g003
Figure 4. Tensile properties of the two printed (0 = parallel to the fibers, 90 = perpendicular to the fibers) and injection-molded (IM) tribocompounds.
Lubricants 13 00234 g004
Figure 5. Characteristic progression of Cof and pin height as a function of time; the pv conditions per stage and their order were chosen at random.
Lubricants 13 00234 g005
Figure 6. Coefficient of friction (Cof) of the different fiber orientation scenarios of C1 and C2 as a function of the pv product. Abbreviations: C = compound, F = fused filament fabrication; p = parallel; ap = antiparallel; n = normal; IM = injection molding.
Lubricants 13 00234 g006
Figure 7. Coefficient of friction (Cof) of the different fiber orientation scenarios of C1 and C2 over the entire pv range (pv = 0.25–32 MPa·m/s). Abbreviations: C = compound, F = fused filament fabrication; p = parallel; ap = antiparallel; n = normal; IM = injection molding.
Lubricants 13 00234 g007
Figure 8. Linear wear rate (wl) of the different fiber orientation scenarios of C1 and C2 as a function of the pv product. Abbreviations: C = compound, F = fused filament fabrication; p = parallel; ap = antiparallel; n = normal; IM = injection molding.
Lubricants 13 00234 g008
Figure 9. Linear wear rate of the different fiber orientation scenarios of C1 and C2 over the entire pv range (pv = 0.25–32 MPa·m/s). Abbreviations: C = compound, F = fused filament fabrication; p = parallel; ap = antiparallel; n = normal; IM = injection molding.
Lubricants 13 00234 g009
Figure 10. Model-based simulated mean values for the injection molded samples versus measured data across six pv segments: p∙v ≤ 5 MPa·m/s, 5 < p∙v ≤ 10 MPa·m/s, 10 < p∙v ≤ 15 MPa·m/s, 15 < p∙v ≤ 20 MPa·m/s, 20 < p∙v ≤ 25 MPa·m/s, 25 < p∙v ≤ 30 MPa·m/s. (a) Friction coefficient and (b) linear wear rate.
Lubricants 13 00234 g010
Figure 11. SEM micrographs of worn surfaces tested under p·v = 8 MPa·m/s; fiber orientation relative to the sliding direction: normal; left: C1; right: C2.
Lubricants 13 00234 g011
Figure 12. SEM micrographs of worn surfaces tested under p·v = 8 MPa·m/s; fiber orientation relative to the sliding direction: parallel; left: C1; right: C2.
Lubricants 13 00234 g012
Figure 13. Confocal laser scanning images of worn surfaces and height profiles along path A-A; p·v-product p·v = 8 MPa·m/s; fiber orientation relative to sliding direction: parallel (p); left: C1; right: C2.
Lubricants 13 00234 g013
Figure 14. Confocal laser scanning images of worn surfaces and height profiles along path A-A; p·v-product p·v = 8 MPa·m/s; fiber orientation relative to sliding direction: antiparallel (ap); left: C1; right: C2.
Lubricants 13 00234 g014
Table 1. Material composition.
PEEK, wt.%Carbon Fibers, wt.%Graphite, wt.%Fillerswt.%
C1601010TiO2, ZnS20
C2601010TiO2, ZnS, SiO220
PEEK: Vestakeep 2000 G, Evonik Operations GmbH, Marl, Germany. Carbon fibers: C C6-4.0/240-T190, SGL Carbon SE, Wiesbaden, Germany. Graphite: RGC39A, Superior Graphite, Sundsvall, Sweden. TiO2: Kronos 2310, Kronos Titan GmbH, Leverkusen, Germany. ZnS: Sachtolith HD-S, Venator GmbH, Duisburg, Germany. SiO2: Aerosil R9200, Evonik Operations GmbH, Marl, Germany.
Table 2. Conditions for preparing the filaments.
Rotational SpeedTemperature of the Extruder in Different Zones
Zone 1Zone 2Zone 3Zone 4
rpm°C°C°C°C
870400425425
Table 3. Three-dimensional printing parameters.
Nozzle TemperaturePlatform TemperaturePrinting SpeedLayer
Thickness
Raster
Width
Infill
°C°Cmm/smmmm%
43016080.10.4100
Table 4. Characteristic values of fiber content and fiber orientation.
C1C2
FFFIMFFFIM
Fiber area fraction%8.18.37.98.1
x = 0.87P = 0.09 x = 0.89P = 0.09
Fiber orientation y = 0.10AP = 0.36y = 0.09AP = 0.37
z = 0.03N = 0.55z = 0.02N = 0.54
Disclaimer/Publisher’s Note: The statements, opinions and data contained in all publications are solely those of the individual author(s) and contributor(s) and not of MDPI and/or the editor(s). MDPI and/or the editor(s) disclaim responsibility for any injury to people or property resulting from any ideas, methods, instructions or products referred to in the content.

