Article

A Numerical Investigation of Non-Ideal Gas Effects on the Saturation Pressure of Water Under High Pressure and Temperature

1
Department of Mechanical Engineering, UC Berkeley, Berkeley, CA 94720, USA
2
The CTO Office, Western Digital Technologies, San Jose, CA 95119, USA
*
Author to whom correspondence should be addressed.
Lubricants 2025, 13(5), 197; https://doi.org/10.3390/lubricants13050197
Submission received: 28 February 2025 / Revised: 28 March 2025 / Accepted: 24 April 2025 / Published: 27 April 2025

Abstract

A typical head–disk interface of hard drives can feature pressures exceeding 50 atmospheres, where the non-ideal gas effects can play an important role. One possible consequence is a change in the rate of water evaporation from the disk. This report describes a semi-analytical procedure that employs the concept of fugacity to investigate the non-ideal gas effects on the saturation pressure of water at an elevated temperature and pressure. A vapor–liquid equilibrium equation is solved to derive the saturation pressure. The results show a deviation from the ideal gas law, which is further examined through saturation pressure isotherms. At areas of low temperature and high pressure, lighter gases such as helium show about a 10% deviation from the ideal gas law, whereas heavier gases such as nitrogen deviate by up to 100%. As temperature increases, the differences between the gases decrease.

1. Introduction

For many decades, hard disk drives (HDDs) have been the dominant form of data storage, and they still continue to be. Since conventional HDDs are approaching the theoretical limits of areal density, known as the superparamagnetic limit, HAMR (heat-assisted magnetic recording) promises to be the key to breaking this barrier [1]. In HAMR, a tiny laser is used to heat a nanoscale spot on the disk to its Curie temperature. This enables packing the bits in smaller grains, increasing the areal density. A key design parameter in HDDs is the head–disk interface (HDI), which refers to the area between the head (where the read/write elements are located) and the disk (where the reading and writing occur). The presence of the laser brings additional complexities to the head–disk interface, such as high temperatures, deformations [2], and strong electric fields [3], and its reliability remains a significant challenge [4,5].
A key component for the drive’s performance and longevity is a thin layer of lubricant applied to the disk surface, which endures the laser-induced depletion and has recovery capability. The lubricant is crucial for enhancing the HDI high-speed tribological behavior by reducing friction, protecting the surface from contaminants, and minimizing corrosive processes [1,6]. Therefore, studying the characteristics of the HDI, especially the hydrodynamic lubrication, is essential to building a robust HAMR drive.
A significant factor in the HDI is relative humidity. At the surface of polymers, relatively high humidity leads to the formation of a liquid water layer, which can potentially decrease friction and mitigate mechanical wear, promoting hydrodynamic lubrication and enhancing the tribological properties [7]. Furthermore, much research has been published regarding its effect on the reliability of the head–disk interface. It affects the lubricant transfer in the head–disk interface [8,9], affecting its spreading rate and chemisorption [10] and increasing its evaporation rate [11,12]. It also increases the corrosion of recording layers [13]. A high relative humidity can further enhance the heat transfer between the protrusion of the head and the disk [14] and affects the wear of the slider [15]. As illustrated in Figure 1, one important experimental observation is that a water monolayer is formed on the disk surface [16,17]. Under high temperatures, this water monolayer can evaporate to fill the head–disk interface, which may affect the reliability of the head components and smear formation. The rate of evaporation of thin liquid films is governed by the Hertz–Knudsen–Lagmuir model [18]. For a liquid with molecular weight M at temperature T, the rate of evaporation can be expressed as follows:
m ˙ = M 2 π T p v , t h i n f i l m p
where p v , t h i n f i l m , and p are the thin film vapor and partial pressure of the substance in the gas phase. Thus, when the partial pressure of a substance reaches its thin-film saturation pressure, no more evaporation is possible. The thin-film saturation pressure is proportional to the bulk saturation pressure, given by [19]:
p v , t h i n f i l m = p v , b u l k exp M ρ R T π
where ρ and π are the thin film density and disjoining pressure, respectively. The disjoining pressure term is responsible for taking into account the interaction of the substance with the substrate, and in this case, the disjoining pressure of the water molecules with the disk layers (carbon overcoat and lubricants). The interaction of water molecules, including that with the perfluoropolyether lubricants, has been studied before [20,21,22]. Further from Equation (2), the evaporation rate of a substance is also directly proportional to its bulk saturation pressure. Therefore, the water monolayer’s evaporation is dependent on the saturation pressure of bulk water and is an important factor in determining the amount of water molecules in the head–disk interface. Under ideal gas assumptions, the saturation pressure is independent of the total pressure, and the saturation pressure of water is well documented [23]. However, pressures in the head–disk interface can exceed 50 atmospheres, and real gas effects can become significant. For example, Sechrist found that water evaporates 15–50% more rapidly in an atmosphere of carbon dioxide [24]. Later, Mansfield found a strong correlation between the density (or pressure) of the surrounding gas and the rate of evaporation [25].
Most experimental data and empirical and analytical equations on the saturation pressure of water only consider the temperature dependence [26,27,28]. Real gases under high pressure exhibit deviation from the ideal gas law. This paper describes a novel semi-analytical method to quantify the real gas effects on the saturation pressure of water in conditions typically found in the HAMR head–disk interface.
The results from this study can be used to improve the humidity calibration in the head–disk interface of HAMR drives and improve their reliability. The outline of the paper is as follows. Section 2 introduces the procedure used to calculate the change in saturation pressure in different gases. Then, Section 3 analyzes the saturation pressure of water under various environments and explains the behavior. Finally, Section 4 concludes and describes the scope for future work.

2. Assumptions and Methods

Real gas effects are taken into account by considering the real gas equation of state (EOS). They can be used to calculate the fugacity of water. Introduced by Gilbert Lewis in 1901 [29], fugacity (f) refers to the tendency of a substance to pass from one chemical phase to another. In other words, it quantifies the susceptibility of water to change from its liquid to the gaseous phase and vice versa. It is related to the chemical potential ( μ , molar Gibbs free energy) by the following relation:
μ = μ 0 + R T ln f f 0
where μ 0 and f 0 are the chemical potential and fugacity at a reference state. R and T are the gas constant and temperature of the system. Fugacity has units of pressure and is equal to the hypothetical pressure that a real gas needs to have to satisfy the ideal gas law. In a system with multiple substances in liquid/gas phases, the condition of vapor–liquid equilibrium is that the fugacity of the species i in its gas ( f i g a s ) and the liquid phase ( f i l i q u i d ) are equal.
f i l i q u i d = f i g a s
Therefore, if one can quantify the fugacity of water in its liquid and gas states in a pressurized environment, then the saturation pressure of water can be calculated. The calculation of fugacity is discussed in the following subsections.

2.1. Fugacity in Gas Phase

The fugacity of a species in the gas phase is given by
f i g a s = ϕ i y i P
where ϕ i , y i , and P are the fugacity coefficient, mole fraction of the given species, and the total pressure, respectively. The fugacity coefficient can be derived from an appropriate equation of state given by [30]
R T ln ϕ i = V P n i T , V , n j R T n i v d V R T ln z
where , z = P v R T
where, n i , V, and z are the mole count of species i, molar volume, and the compressibility factor. Solving Equation (6) requires a choice of an appropriate EOS. The Redlich–Kwong (RK) EOS was chosen due to its relative simplicity and accuracy. For a pure gas, the RK equation is
P = R T v b a T v ( v + b )
a = Ω a R 2 T c 2.5 P c
b = Ω b R T c P c
where a and b are parameters related to the intermolecular forces and the finite volume of the gas particles, respectively. T c and T p are the critical temperature and pressure. Ω a / b is a species-dependent constant but roughly equals 0.4227 and 0.0867 [30], respectively. In the case of mixtures, the parameters a and b may be replaced by effective parameters using appropriate mixing rules. Chueh and Prausnitz prescribed a mixing rule that applies to high-pressure cases, given by
a = i = 1 N j = 1 N y i y j a i j
b = i = 1 N y i b i
where the subscript i refers to species i. The term a i j is given by
a i j = Ω a i + Ω a j R 2 T c i j 2.5 2 P c i j
P c i j = z c i j R T c i j v c i j
v c i j = 1 8 v c i 1 / 3 + v c j 1 / 3 3
z c i j = 0.291 0.08 ω i + ω j 2
T c i j = T c i T c j ( 1 k i j )
where ω is the acentric factor and k i j is a deviation from the geometric mean for T c i j . It is characteristic of the i j interaction. Now, inserting Equation (8) in Equation (6) yields
ln ϕ i = ln v v b 2 j y i a i j R T 3 / 2 b ln v + b b + a b i R T 3 / 2 b 2 ln v + b v b v + b + b i v b ln P v R T
where v is the molar volume of the gas mixture, which is obtained by solving Equation (8) and taking the largest real root for v.

2.2. Fugacity of the Liquid Phase

The fugacity of a liquid phase is given by [31]
f i l i q u i d = γ i x i f i o exp Δ P v i l R T
where γ is the activity coefficient, x i is the mole fraction in the liquid phase, and f i 0 is the reference fugacity at a known pressure. The exponential term is the change in fugacity due to the ambient pressure and is known as the Poynting correction [32]. Δ P is the change in pressure, and v i l is the molar volume of the species in its liquid state. Since the operating conditions have temperatures well above the critical temperatures for the air-bearing gases (nitrogen, helium, and oxygen), these gases can be considered to be non-condensable. Further, since the dissolved gases do not significantly change the mole fraction of liquid water, the liquid can be approximated to be made of pure water, which implies x w = 1 and γ w = 1 . Therefore, for liquid water
f w l i q u i d = f w o exp Δ P v w l R T
where the subscript w refers to water. Now, the reference fugacity of liquid water can be readily calculated using Equation (18) and invoking Equation (4) in a vacuum using the known experimental value of the saturation pressure. The molar volume can also be experimentally determined or derived from an appropriate equation of state. In our case, Peng–Robinson EOS was used, which is said to predict the liquid density accurately [33].

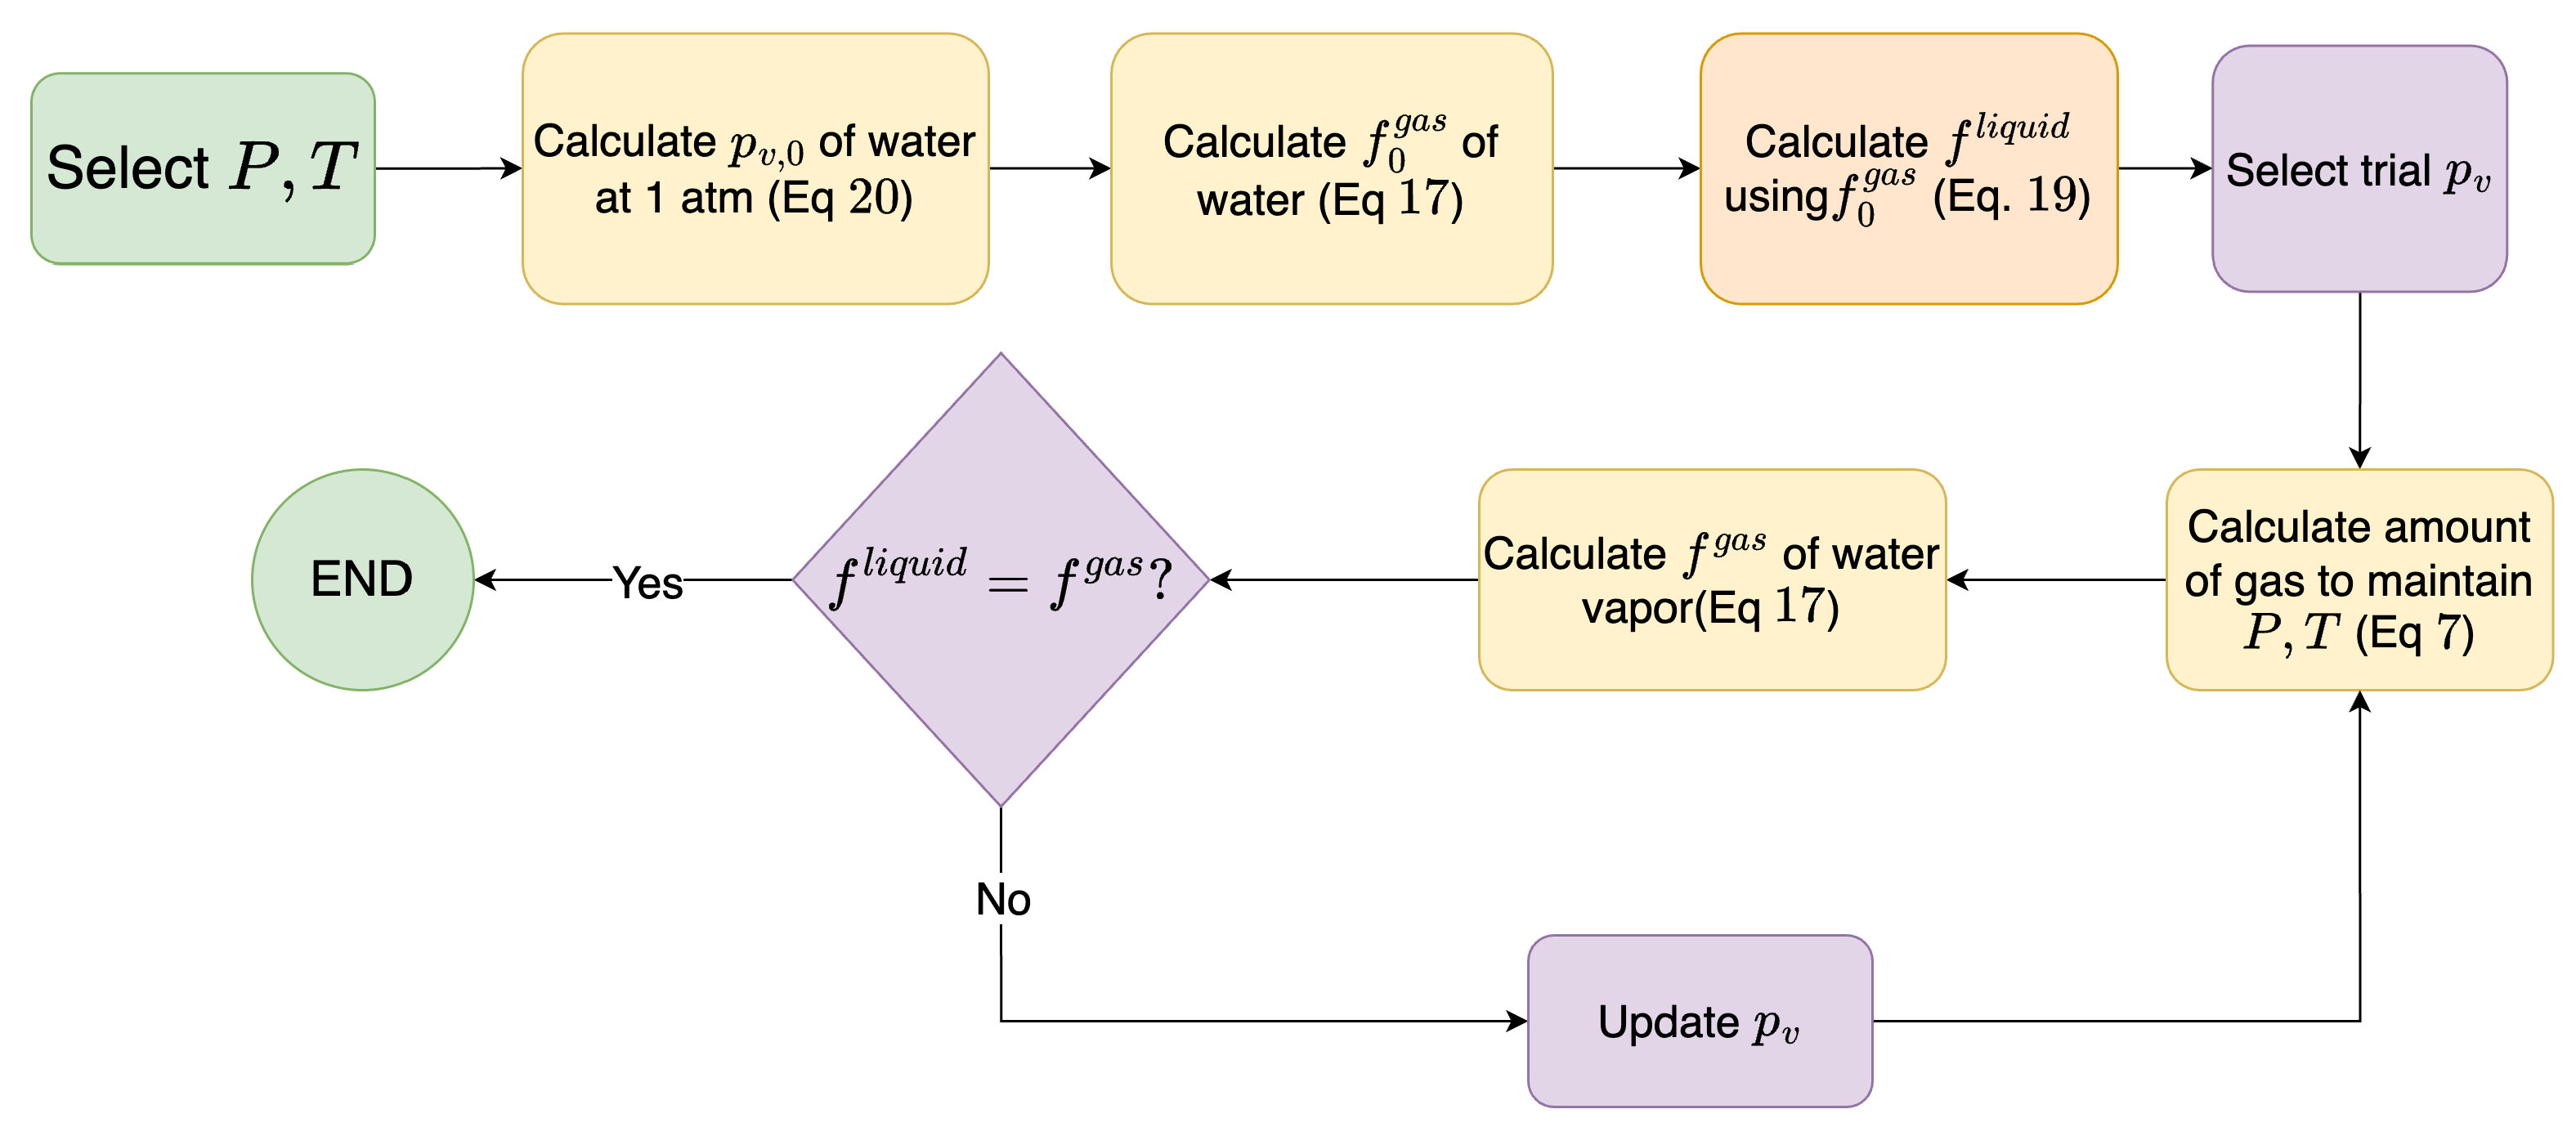
2.3. Calculating Saturation Pressure

As vapor fugacity is a nonlinear function of the gas composition (Equation (18)), an iterative procedure is required to calculate the saturation pressure of water at a given pressure and temperature. The following flow chart (Figure 2) illustrates the required steps.
The first step is to estimate the saturation pressure at an ambient pressure. The Lee–Kesler [34] method is used, which is given by
ln P r = f 0 + ω f 1
f 0 = 5.92714 6.09648 T r 1.28862 log ( T r ) + 0.169347 T r 6 ;
f 1 = 15.2518 15.6875 T r 13.4721 log ( T r ) + 0.43577 T r 6 ;
P r = P v P c , T r = T T c
where T r , T, and T c refer to the reduced, ambient, and critical temperatures, respectively. P v and P c refer to the saturation and critical pressure, respectively. This method is reliable for pressures around 1 atmosphere, where the ideal gas law holds. Then, assuming the gas is purely water vapor, Equation (18) is used to calculate the reference state fugacity of pure water vapor in equilibrium with liquid water. Then, invoking Equation (4), the standard state fugacity of liquid water ( f w 0 ) is obtained. Then, Equation (20) can be used to calculate the fugacity of liquid water at an elevated pressure.
There are two choices of boundary conditions, which, in reality, lead to the same result. The elevated pressure can be either due to the air-bearing gas alone or the sum of both the air-bearing gas and water saturation pressure. This paper assumes the latter in our calculation since it is easier to implement. First, a mixture containing the gas applies the external pressure, P. The RK equation calculates the required number of moles of each air-bearing gas. Then, some of the air-bearing gas is removed in increments, replacing it with water molecules to maintain the total pressure at P. In each iteration, the fugacity of the water vapor is calculated using Equation (18). This process is repeated until the fugacity of the water vapor is equal to the fugacity of liquid water at the elevated pressure calculated earlier (Equation (4)). The partial pressure of water in this new equilibrium is the saturation pressure of water at pressure P and temperature T.

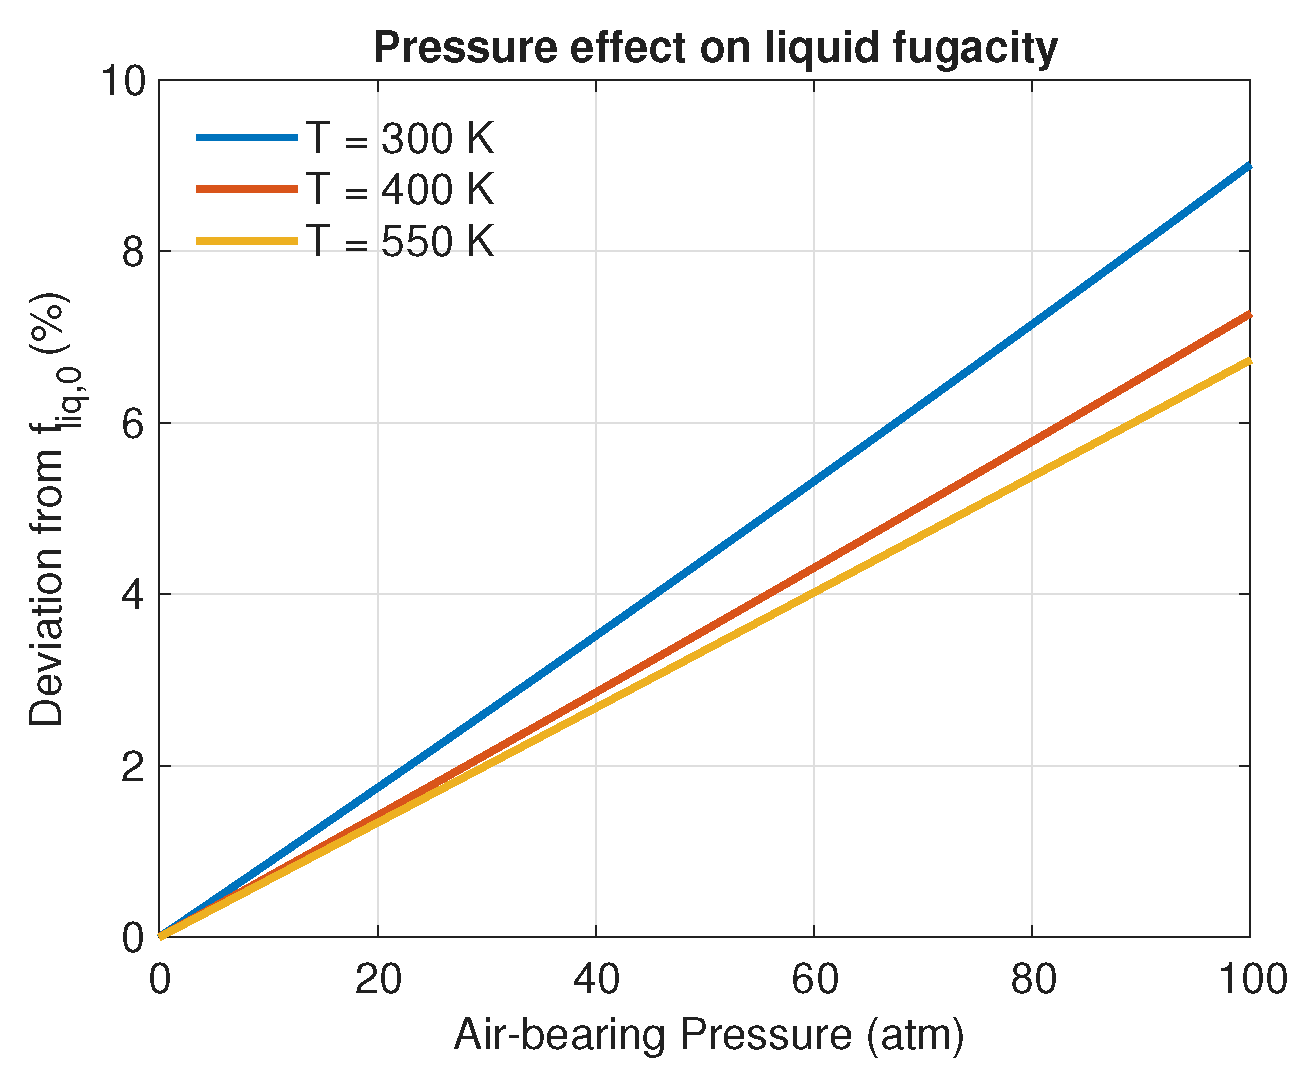
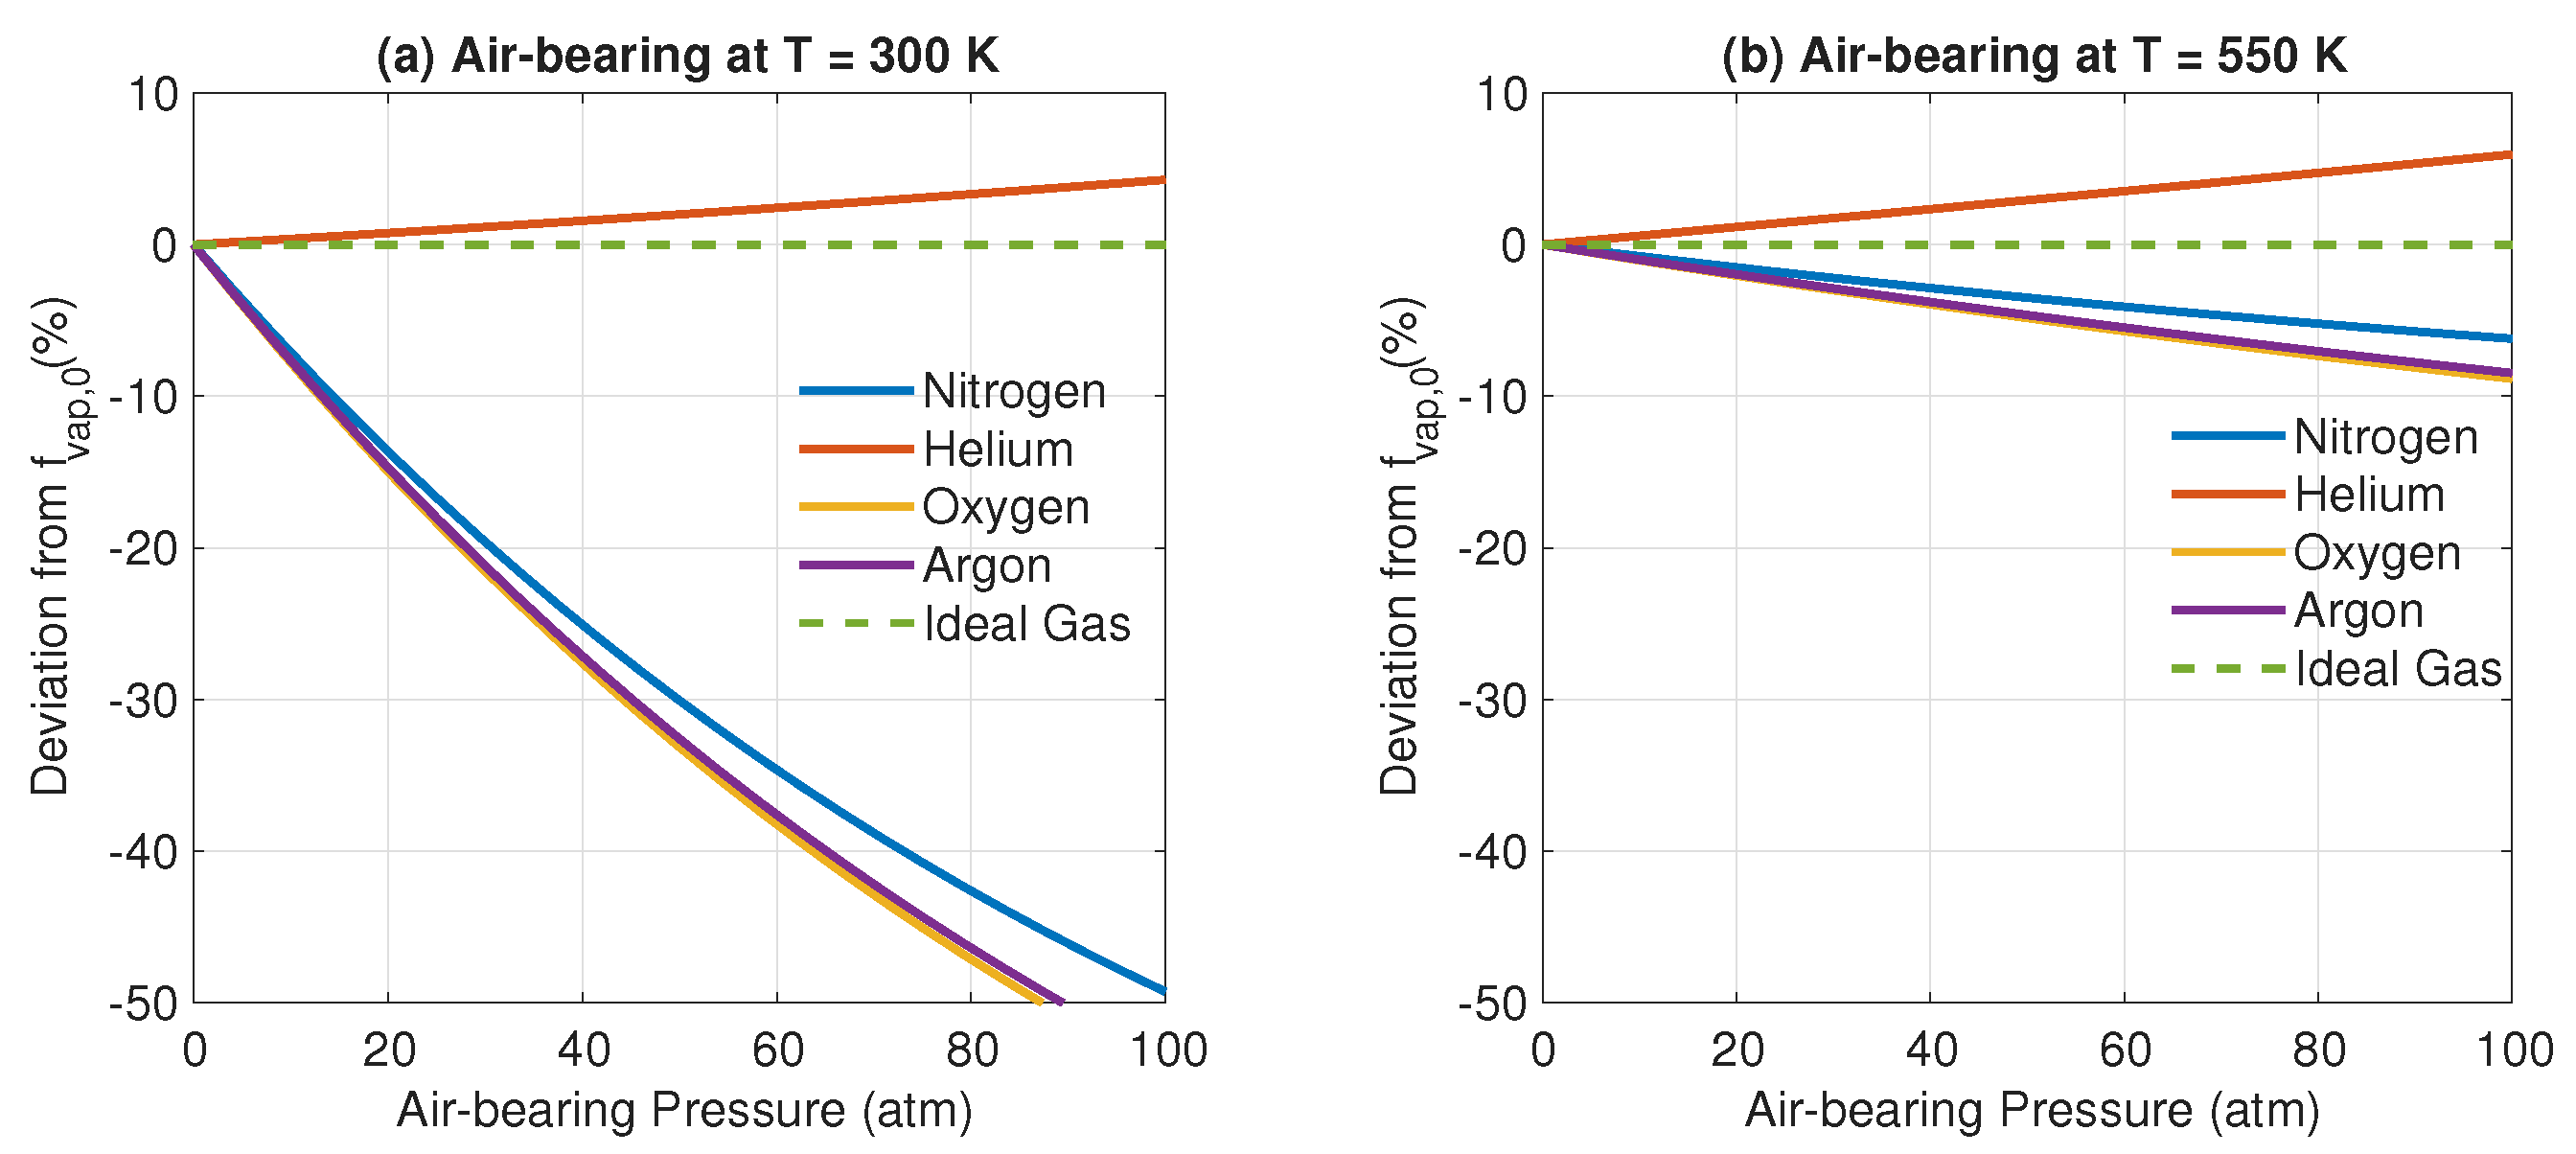
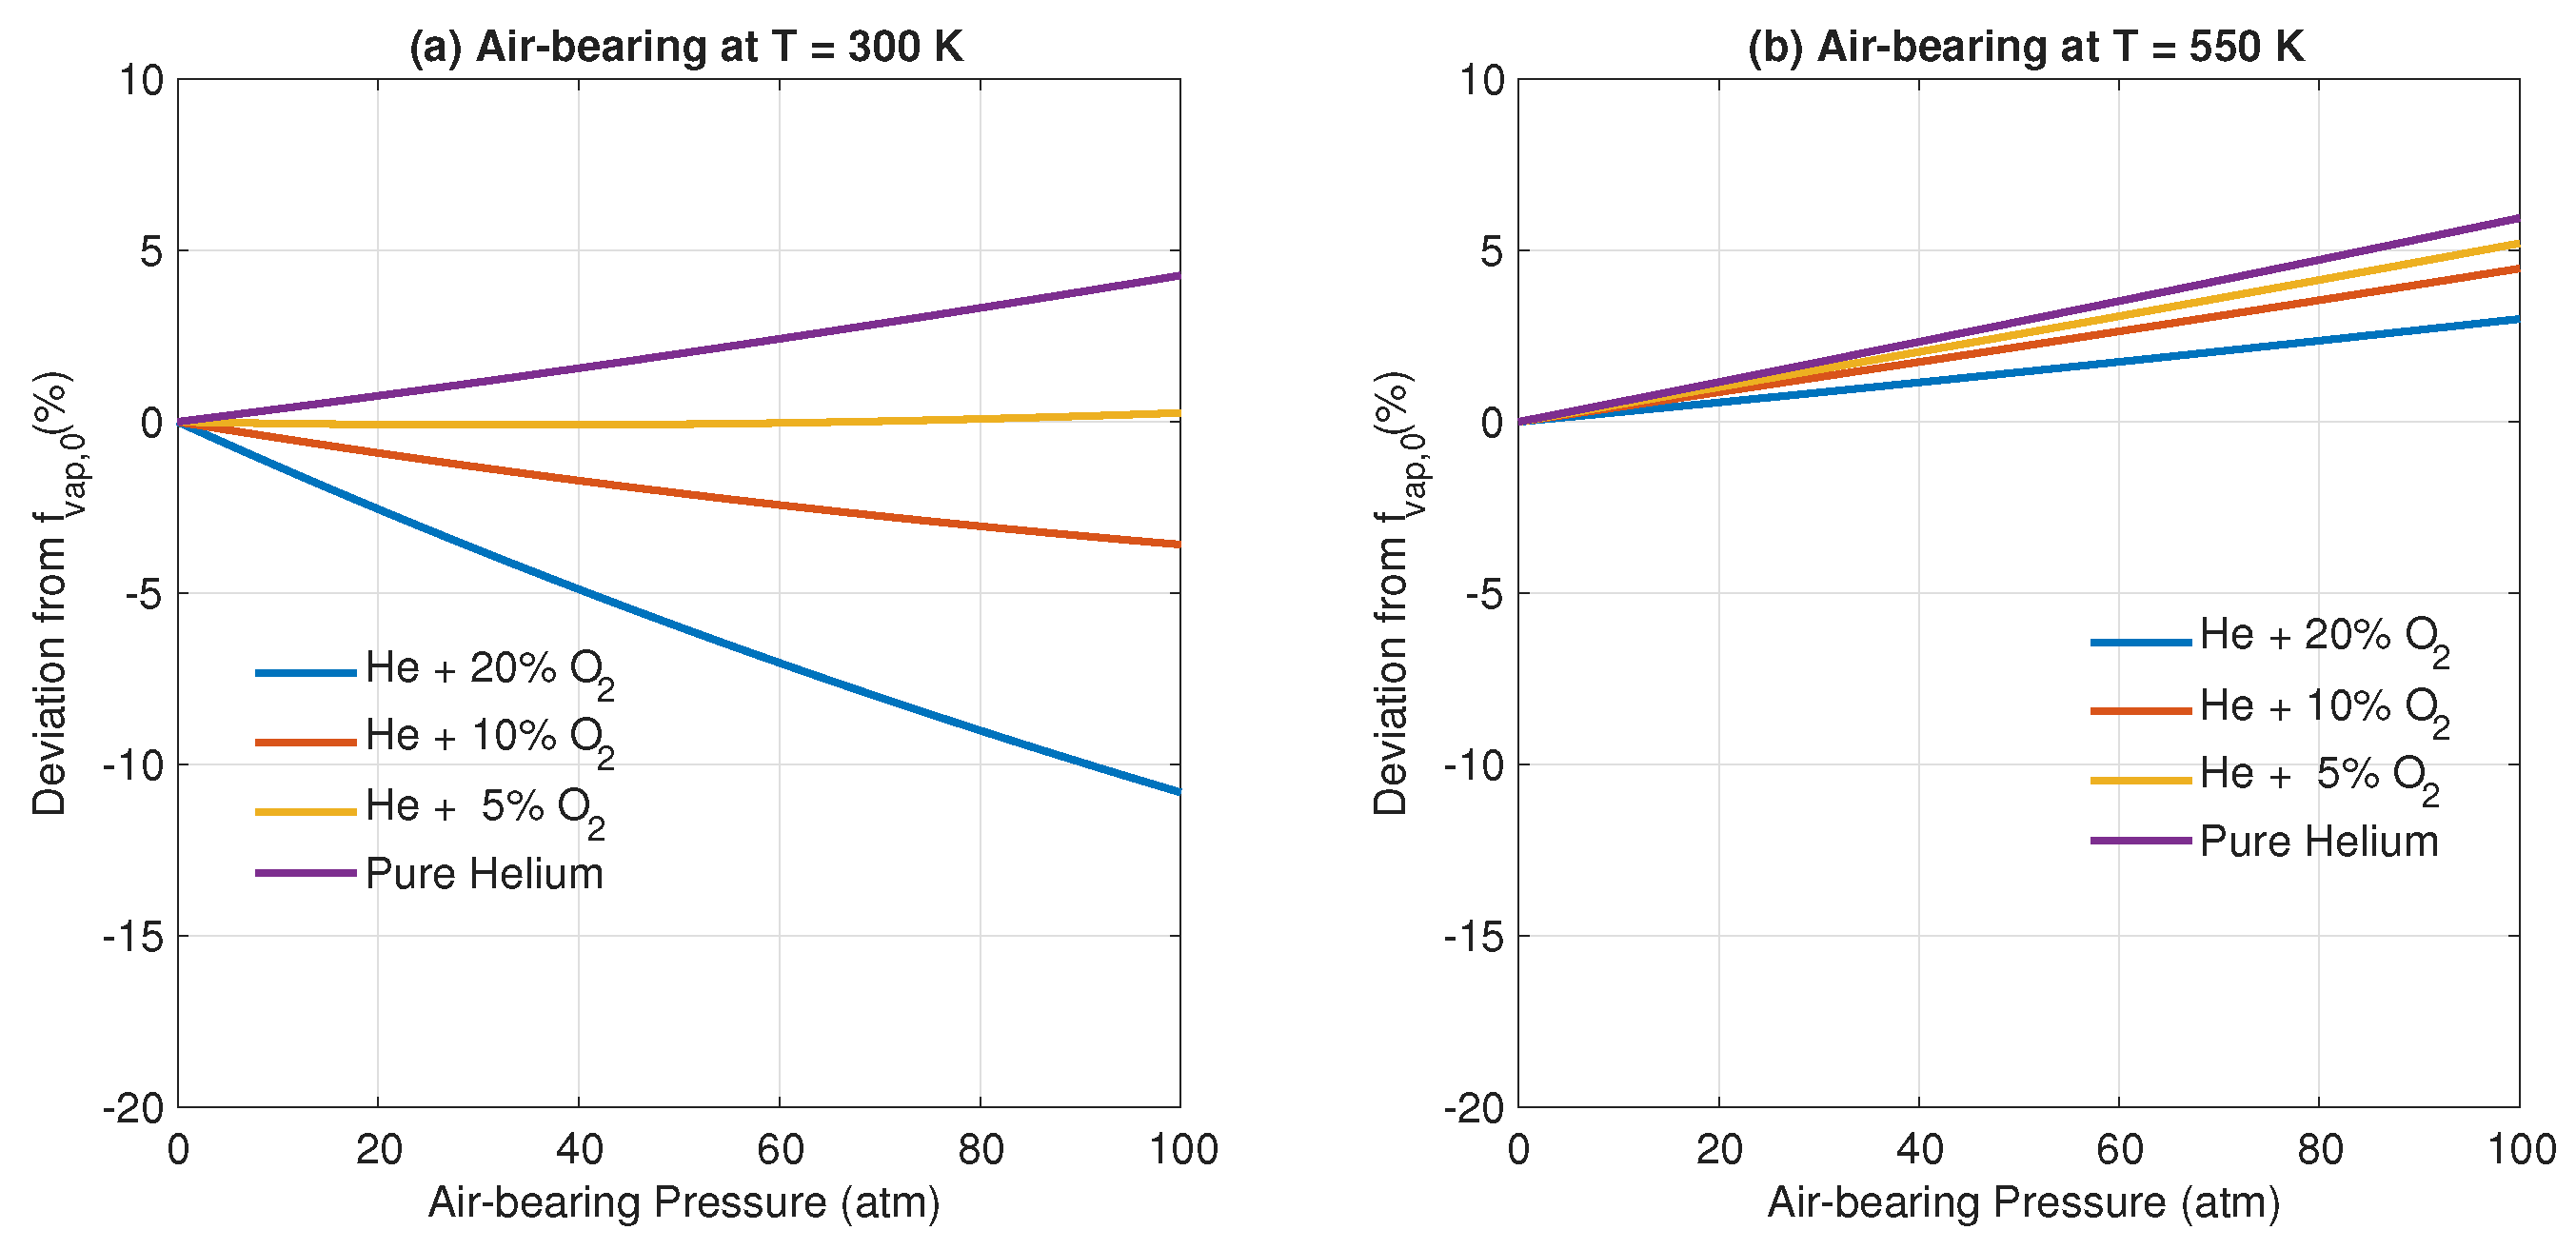
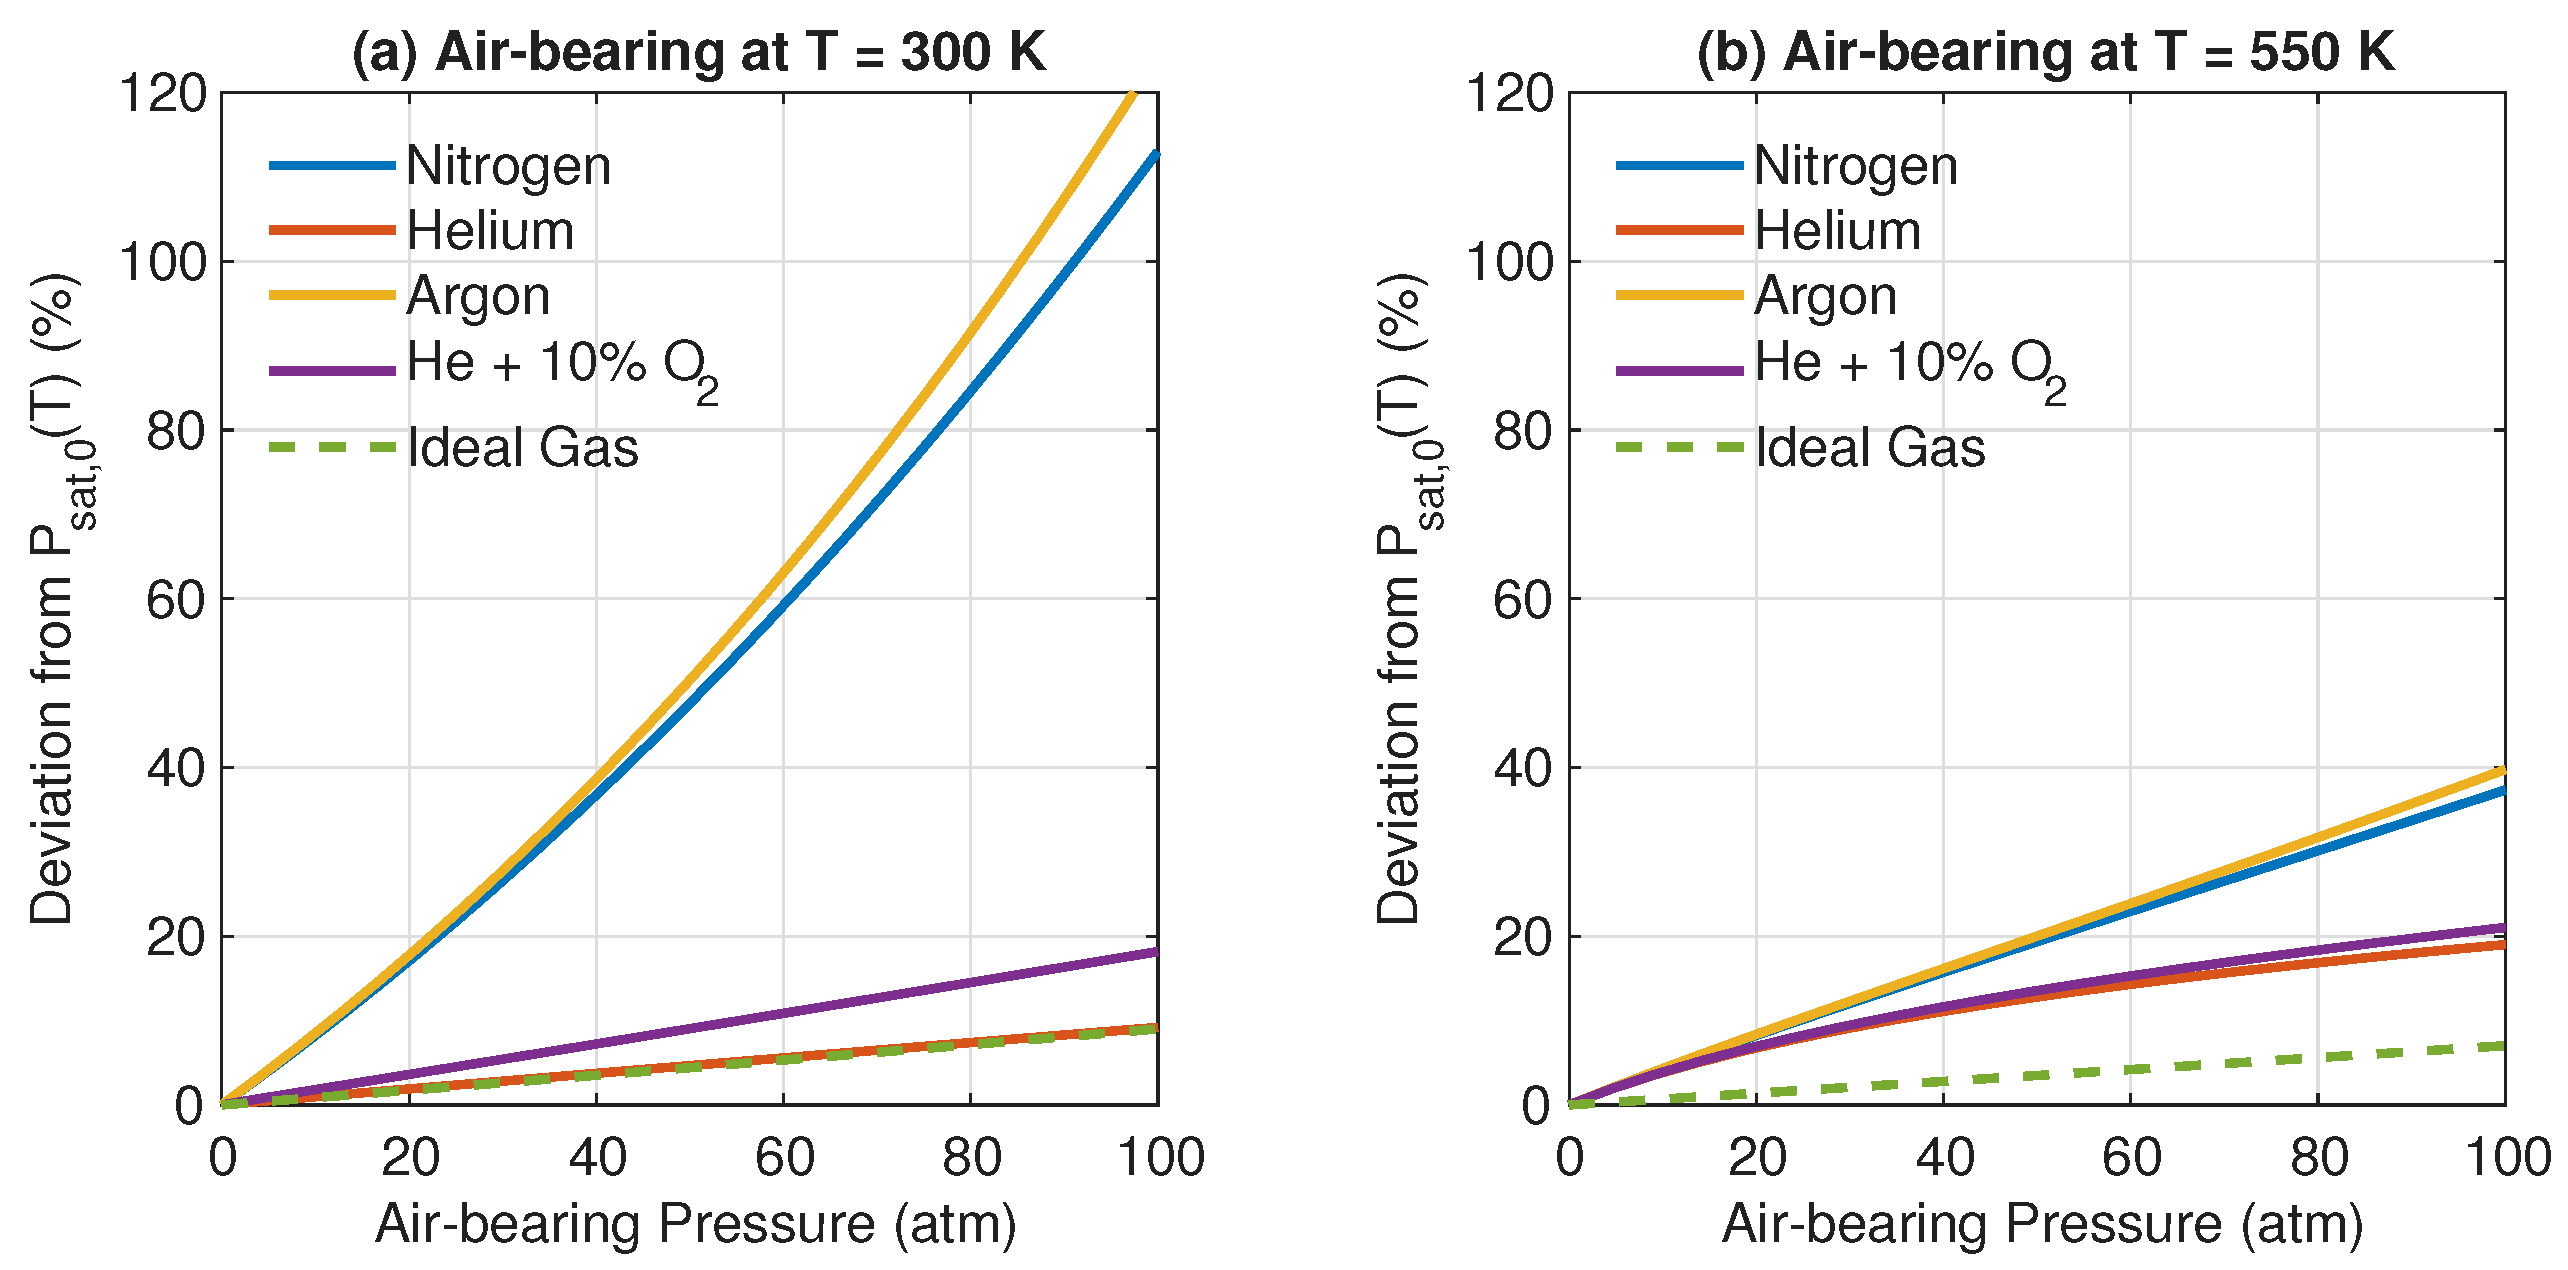
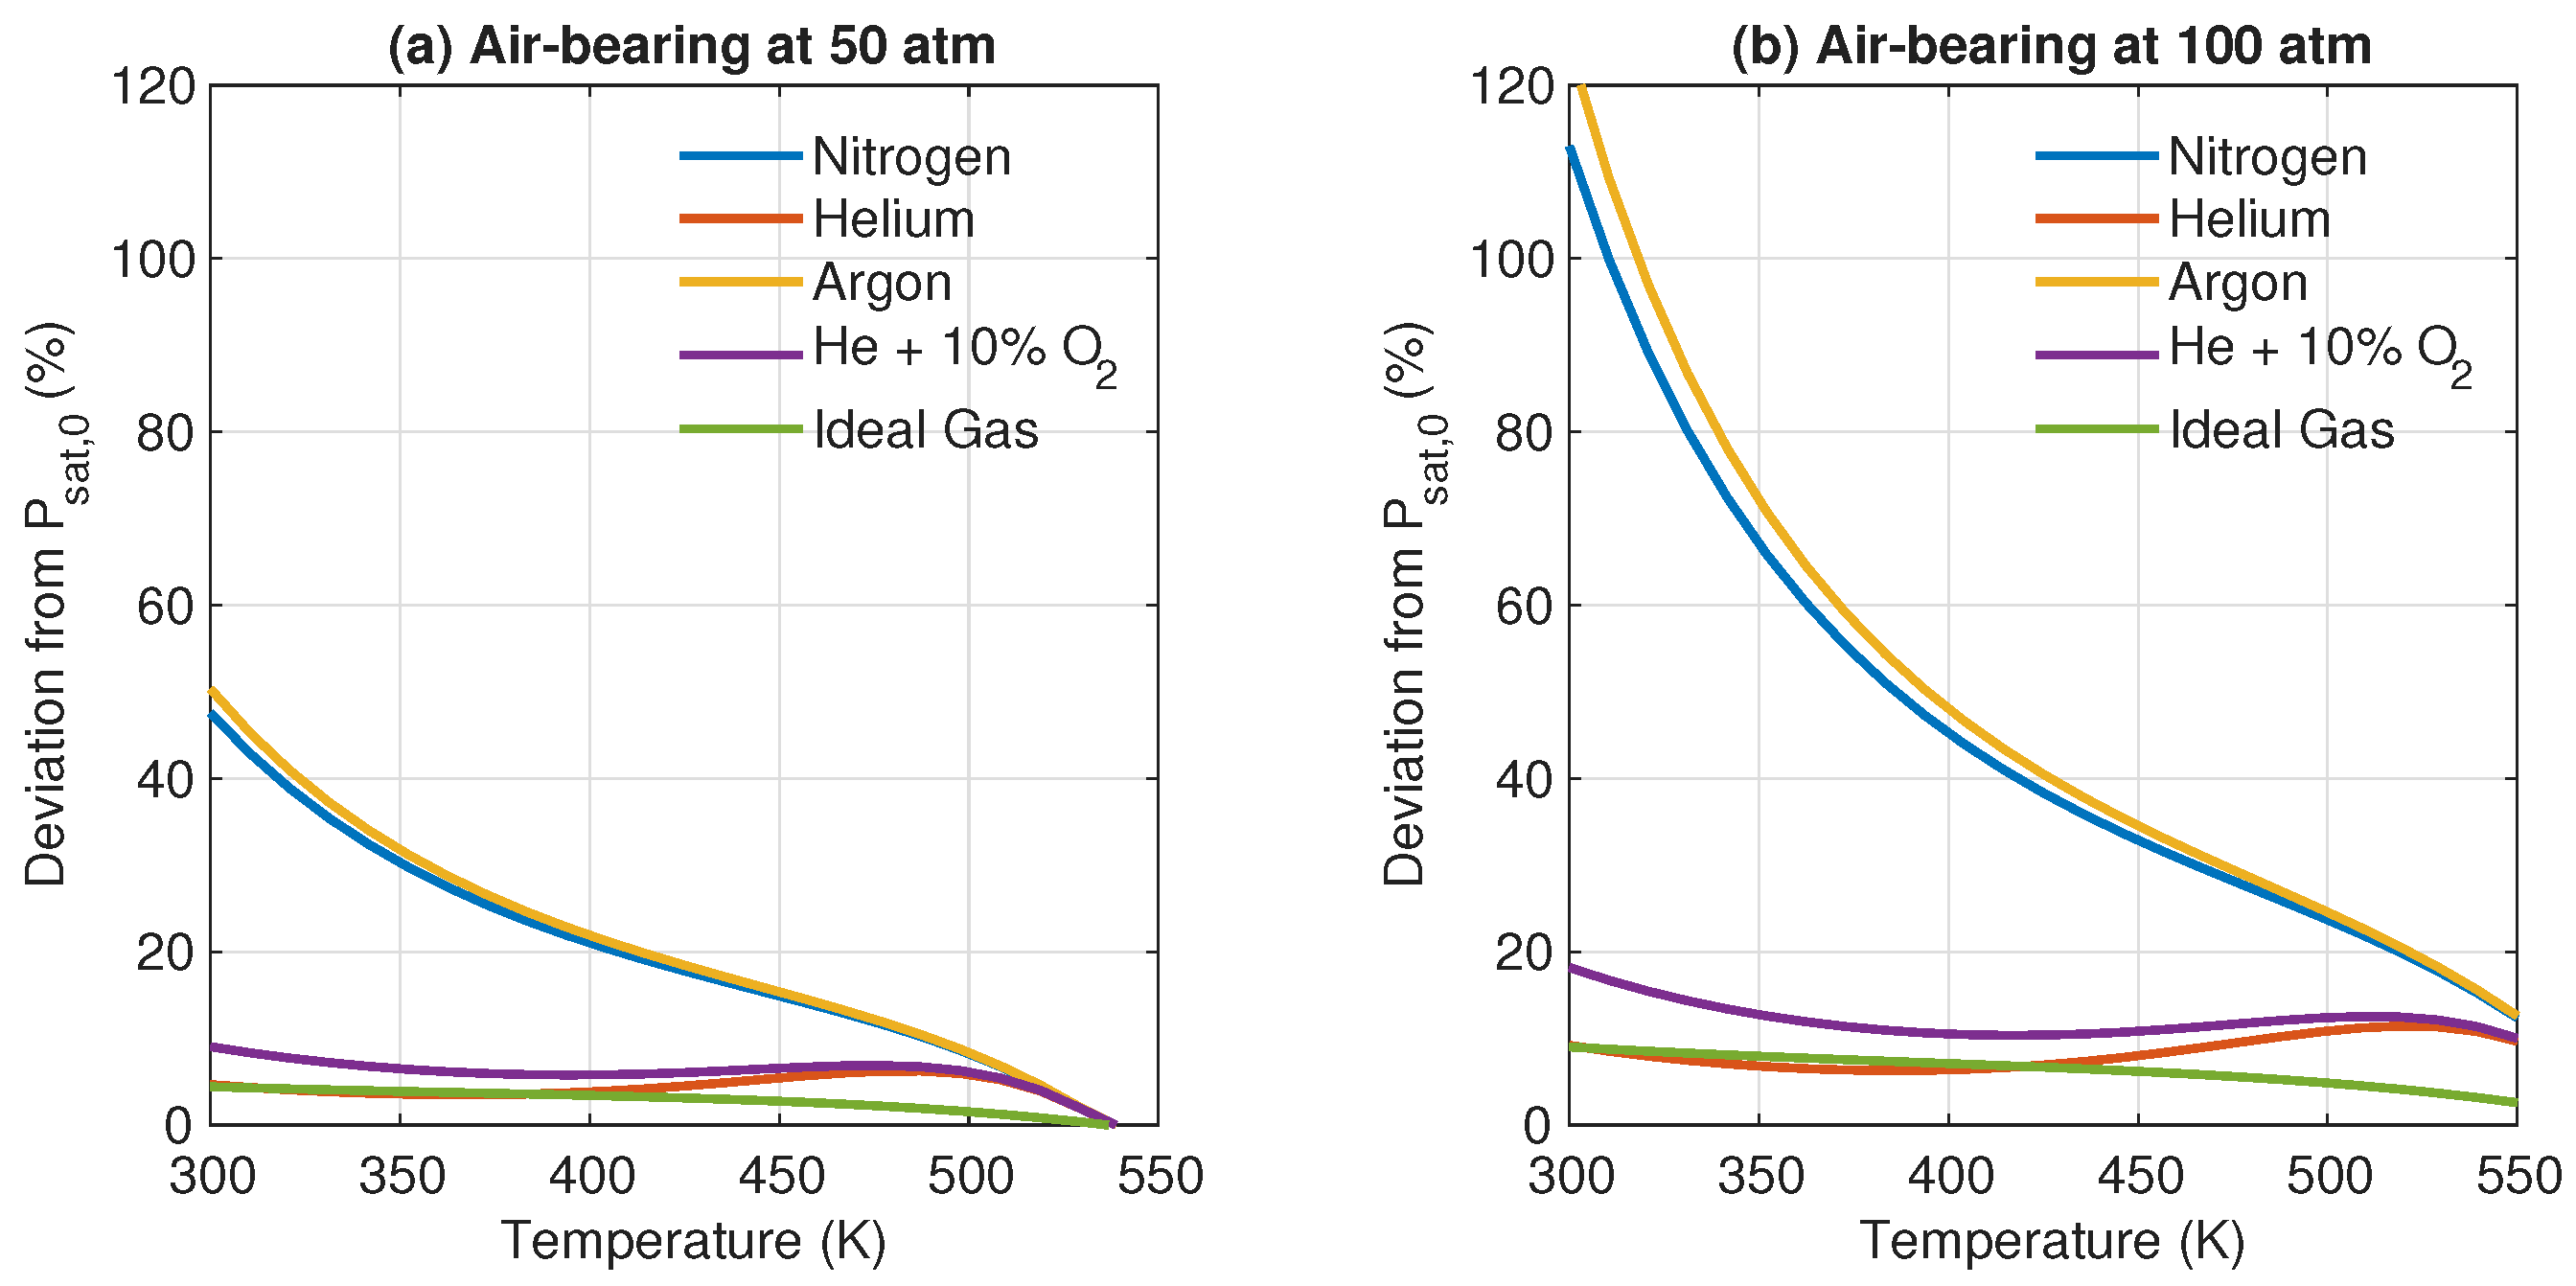
3. Results and Discussion

Although hard disk drives are filled with air or helium, four gases are considered—nitrogen, helium, argon, and oxygen—to understand the characteristics of saturation pressure. They are also compared against a hypothetical ideal gas. Even though the air is mainly a mixture of nitrogen and oxygen, the term air-bearing is used, even if it is composed of other gases, to maintain convention in this field. The critical values and the RK equation parameters for all the gases are shown in Table 1.
First, the influence of temperature and pressure on the fugacity of liquid water is studied. The change in fugacity from Equation (20) is shown in Figure 3. Over the range of pressure and temperatures, there is an increase due to the Poynting correction, which is roughly linear. This increase is independent of the external gas and is present even in ideal gases. The deviation reaches 6–9% with the higher value at lower temperatures. This shows that increasing the external pressure makes the water molecules more susceptible to transition to the gas phase.
Second, the influence of temperature and pressure on the fugacity of water vapor is studied. The deviation in fugacity at room temperature (300 K) and a typical air-bearing temperature (550 K) is plotted in Figure 4. As expected, ideal gas is not influenced by the external air-bearing pressure, and no change is observed. Heavier gases like nitrogen, oxygen, and argon show an over 50% drop in fugacity at room temperature. This drop reduces at higher temperatures to about 10%. Further, lighter gases, such as helium, show a different trend with the fugacity increasing marginally by around 5–10%. Helium behaves differently because it has a low a 11 and a 12 value. This suggests that helium is influenced by intermolecular forces as much as nitrogen and argon. Instead, it is influenced by its size, which causes a positive growth in fugacity. This effect is relatively independent of temperature. Therefore, helium-rich environments can lead to higher rates of condensation as water molecules are more susceptible to transition to the liquid phase.
Motivated by the differences between the heavier gases and helium, the situation with helium-bearing containing various amounts of oxygen is shown in Figure 5. The two temperatures show contrasting trends. In the case of room temperature (T = 300 K), increasing the oxygen level changes the sign of the slope as the intermolecular forces from oxygen have a significant effect on the fugacity of water. At 100 atm, the deviation decreases from +5% in the case of pure helium to −10% in the case of a 20% oxygen mixture. However, at higher temperatures (T = 550 K), similar to the other heavier gases, the intermolecular forces lose their influence, and size effects dominate. As a result, the drop in fugacity is less than 5%.
Finally, using the method described in Section 2.3, the saturation pressure at any temperature and pressure can be studied. Figure 6 plots the deviation of the saturation pressure with the air-bearing pressure. The reference saturation pressure, p sat , 0 is the saturation pressure at 1 atm and a given temperature. p sat , 0 for Figure 6a,b are 300 K and 550 K, respectively. A case when 10% of helium is replaced by oxygen is also shown for comparison. At lower temperatures (Figure 6a), the immediate observation is that in all mixtures; an increase in pressure results in an increase in the saturation pressure of water. Even in the case of an ideal gas, a deviation of 10% at 100 atm pressure is observed. This is because the fugacity of liquid water increases with pressure, as Equation (20) would predict. In the case of nitrogen and argon, an increase of more than 100% over 100 atm is observed. This is because of the intermolecular forces interacting with the water molecules. The relative magnitude of increase closely follows the parameter a 12 in Table 1, which suggests that the air-bearing gases exert an attractive force on the water molecules, enabling the gas bearing to support a higher concentration of water vapor at a given temperature. Other researchers have also experimentally observed these differences [24,25,35], albeit in other mixtures. At higher temperatures (Figure 6b), the deviation is less than 40% at 100 atm for all mixtures. This is likely related to the molecular speed. At higher average speeds, the influence of intermolecular forces is significantly reduced. Further, a difference in the case of helium is observed. At room temperature, pure helium behaves like an ideal gas; however, at higher temperatures, it has almost twice the deviation as the ideal gas. Since the b 1 is the only parameter differentiating helium from an ideal gas, it must also be responsible for this observed deviation. b 1 represents the finite volume, and so, Figure 6b suggests that the finite volume plays a significant role at high temperatures. At 300 K, when pure helium is mixed with 10% oxygen, the net deviation increases from 10% to 20% at 100 atm pressure. The intermolecular forces from oxygen offset the pure helium’s behavior.
Some of the differences are better observed when the deviation of saturation pressure of water is plotted over temperature by keeping the pressure constant, as shown in Figure 7. First, it is noted that the deviation of ideal gas reduces from 10% to 5% by increasing the temperature. This is mainly because at a fixed P, the exponential term in Equation (20) decreases with increasing temperature. In the case of heavier gases (nitrogen and argon), the deviation rapidly decreases to roughly 10%. In contrast, in the case of lighter gases (helium), the deviation somewhat oscillates to roughly 10%. This is due to the interplay between terms a 1 (which corresponds to the intermolecular force), b 1 (corresponding to the size), and the temperature. At lower temperatures, intermolecular forces dominate, as seen by the magnitude of deviation of p sat , 0 , whereas at higher temperatures, the finite volume starts to play a role.

4. Conclusions and Scope for Future Work

Humidity plays a critical role in the reliability of hard disk drives. Experiments have shown that a thin layer of water is formed on the disk surface. This thin layer of water can evaporate due to the high disk temperature and alter the humidity under the NFT, and the saturation pressure of water limits its rate of evaporation. Most studies assume the validity of the ideal gas law and neglect any pressure dependence on the saturation pressure. This report numerically investigates the effects of temperature and high pressure on the saturation pressure of water. Using the concept of fugacity, a procedure to calculate the saturation pressure of water at high-pressure air-bearing using real gas EOS is discussed. The liquid water and water vapor are assumed to follow the Peng–Robinson EOS and the Redlich–Kwong EOS, respectively. An iterative process is utilized to calculate the deviation of the saturation pressure in the presence of a hot and pressurized external gas.
The results show that at lower temperatures, the saturation pressure significantly deviates from the ideal gas law due to intermolecular forces. On the other hand, at higher temperatures, the finite volume of a gas starts to influence the saturation pressure. Nevertheless, the overall significance of the real gas effects reduces at higher temperatures. In HAMR, the temperature directly below the near-field transducer (NFT) features temperatures exceeding 500 K. Based on the trends observed in Figure 7, the deviation is predicted to be around 10 to 20%. However, at locations just outside the NFT, where the temperature drops but high-pressure remains, the non-ideal effects can dominate. Heavy gas bearings, such as nitrogen, can show up to a 100% increase (2×) in the evaporation rate. The increase in evaporation rate is supported by the observations of Mansfield [25] and Sechrist [24].
The validity of the model presented here depends on the accuracy of the underlying equation of state and the Lee–Kessler method, which needs to be verified. A direct experimental measurement of humidity in a HAMR drive is difficult due to the nanoscale spacing. However, a bulk verification is possible using a pressurized chamber that can measure humidity levels using a suitable manometer. Alternatively, numerical techniques such as molecular dynamics can be used to investigate this effect further. Furthermore, since saturation pressure responds differently to helium and nitrogen bearings, experiments on different air bearing gases can be compared to observe the effect of real gases on humidity.

Author Contributions

Formal analysis, R.M.T. and S.R.; investigation, R.M.T., S.R. and Q.D.; methodology, R.M.T.; project administration, Q.D.; supervision, Q.D.; visualization, R.M.T. and Q.C.; writing—original draft, R.M.T.; writing—review and editing, Q.D. and Q.C. All authors have read and agreed to the published version of the manuscript.

Funding

This research received no external funding.

Data Availability Statement

The raw data supporting the conclusions of this article may be made available by the corresponding author on request.

Acknowledgments

The authors thank Daniel Matsuka and Oscar Ruiz of Western Digital for their helpful discussions.

Conflicts of Interest

Authors Sukumar Rajauria and Qing Dai were employed by the company Western Digital Technologies. The remaining authors declare that the research was conducted in the absence of any commercial or financial relationships that could be construed as a potential conflict of interest.

References

  1. Kryder, M.; Gage, E.; McDaniel, T.; Challener, W.; Rottmayer, R.; Ju, G.; Hsia, Y.T.; Erden, M. Heat Assisted Magnetic Recording. Proc. IEEE 2008, 96, 1810–1835. [Google Scholar] [CrossRef]
  2. Cheng, Q.; Wang, H.; Sakhalkar, S.V.; Bogy, D.B. Measurement of angstrom-level laser induced protrusion using touchdown in heat-assisted magnetic recording. Appl. Phys. Lett. 2020, 117, 153105. [Google Scholar] [CrossRef]
  3. Tom, R.M.; Smith, R.; Ruiz, O.; Dai, Q.; Bogy, D.B. Optical forces in heat-assisted magnetic recording head-disk interface. Sci. Rep. 2023, 13, 8451. [Google Scholar] [CrossRef] [PubMed]
  4. Kiely, J.D.; Jones, P.M.; Yang, Y.; Brand, J.L.; Anaya-Dufresne, M.; Fletcher, P.C.; Zavaliche, F.; Toivola, Y.; Duda, J.C.; Johnson, M.T. Write-Induced Head Contamination in Heat-Assisted Magnetic Recording. IEEE Trans. Magn. 2017, 53, 1–7. [Google Scholar] [CrossRef]
  5. Cheng, Q.; Tom, R.M.; Bogy, D.B. Two strategies to mitigate thermally-induced material buildup in heat-assisted magnetic recording. Tribol. Lett. 2023, 71, 50. [Google Scholar] [CrossRef]
  6. Kiely, J.D.; Jones, P.M.; Hoehn, J. Materials challenges for the heat-assisted magnetic recording head–disk interface. MRS Bull. 2018, 43, 119–124. [Google Scholar] [CrossRef]
  7. Lancaster, J. A review of the influence of environmental humidity and water on friction, lubrication and wear. Tribol. Int. 1990, 23, 371–389. [Google Scholar] [CrossRef]
  8. Kim, S.H.; Dai, Q.; Marchon, B.; Flechsig, K. Humidity effects on lubricant transfer in the head-disk interface of a hard disk drive. J. Appl. Phys. 2009, 105, 07B70. [Google Scholar] [CrossRef]
  9. Tani, H.; Kurafuji, H.; Tagawa, N.; Kawada, S.; Lu, R.; Koganezawa, S. Effect of Humidity on Head Smear Generation in Head-Assisted Magnetic Recording. IEEE Trans. Magn. 2023, 59, 1–5. [Google Scholar] [CrossRef]
  10. Karis, T.E. Water Adsorption on Thin Film Media. J. Colloid Interface Sci. 2000, 225, 196–203. [Google Scholar] [CrossRef]
  11. Lei, R.Z.; Gellman, A.J. Humidity Effects on PFPE Lubricant Bonding to a-CHx Overcoats. Langmuir 2000, 16, 6628–6635. [Google Scholar] [CrossRef]
  12. Tyndall, G.W.; Waltman, R.J.; Pacansky, J. Effect of adsorbed water on perfluoropolyether-lubricated magnetic recording disks. J. Appl. Phys. 2001, 90, 6287–6296. [Google Scholar] [CrossRef]
  13. Dubin, R.R.; Winn, K.D.; Davis, L.P.; Cutler, R.A. Degradation of Co-based thin-film recording materials in selected corrosive environments. J. Appl. Phys. 1982, 53, 2579–2581. [Google Scholar] [CrossRef]
  14. Cheng, Q.; Sakhalkar, S.; Ghafari, A.; Ma, Y.; Bogy, D. Dependence of nanoscale heat transfer across a closing gap on the substrate material and ambient humidity. Appl. Phys. Lett. 2020, 116, 213102. [Google Scholar] [CrossRef]
  15. Trinh, T.D.; Schade, C.; Johnson, M.; Talke, F.E. Investigation of Bias Voltage and Relative Humidity on Wear and Pit Formation at the Head–Disk Interface. IEEE Trans. Magn. 2020, 56, 1–7. [Google Scholar] [CrossRef]
  16. Cheng, Q.; Ma, Y.; Bogy, D. Effect of humidity on the nanoscale heat transfer at the head-media interface. In Proceedings of the Information Storage and Processing Systems. American Society of Mechanical Engineers, San Diego, CA, USA, 27–28 June 2019; Volume 59124, p. V001T03A004. [Google Scholar] [CrossRef]
  17. Shukla, N.; Gellman, A.J.; Ma, X.; Gui, J. Effect of Humidity on Lubricated Carbon Overcoats. Tribol. Lett. 2002, 12, 105–109. [Google Scholar] [CrossRef]
  18. Sakhalkar, S.V.; Bogy, D.B. Effect of rheology and slip on lubricant deformation and disk-to-head transfer during heat-assisted magnetic recording (HAMR). Tribol. Lett. 2018, 66, 1–19. [Google Scholar] [CrossRef]
  19. Carey, V.P. Liquid-Vapor Phase-Change Phenomena: An Introduction to the Thermophysics of Vaporization and Condensation Processes in Heat Transfer Equipment; CRC Press: Boca Raton, FL, USA, 2020. [Google Scholar] [CrossRef]
  20. Jung, Y.; Yeo, C. Mechano-Chemical Properties and Tribological Performance of Thin Perfluoropolyether (PFPE) Lubricant Film under Environmental Contaminants. Lubricants 2023, 11, 306. [Google Scholar] [CrossRef]
  21. Zou, A.; Poudel, S.; Gupta, M.; Maroo, S.C. Disjoining pressure of water in nanochannels. Nano Lett. 2021, 21, 7769–7774. [Google Scholar] [CrossRef]
  22. Peng, T.; Peng, K.; Li, Q. Methodology for disjoining pressure of free water nanofilms. J. Phys. Chem. C 2015, 119, 14273–14280. [Google Scholar] [CrossRef]
  23. Kretzschmar, H.J.; Wagner, W. International Steam Tables; Springer: Berlin, Germany, 2019. [Google Scholar]
  24. Sechrist, F. Effect of Carbon Dioxide on Evaporation of Water. Nature 1963, 199, 899–900. [Google Scholar] [CrossRef]
  25. Mansfield, W.W. Influence of Gases on the Rate of Evaporation of Water. Nature 1965, 205, 278. [Google Scholar] [CrossRef]
  26. Factorovich, M.H.; Molinero, V.; Scherlis, D.A. Vapor pressure of water nanodroplets. J. Am. Chem. Soc. 2014, 136, 4508–4514. [Google Scholar] [CrossRef] [PubMed]
  27. Huang, J. A Simple Accurate Formula for Calculating Saturation Vapor Pressure of Water and Ice. J. Appl. Meteorol. Climatol. 2018, 57, 1265–1272. [Google Scholar] [CrossRef]
  28. Chen, L.; Zhou, J.; Chu, H.W.; Zhang, G.; Fan, X. A Review on Water Vapor Pressure Model for Moisture Permeable Materials Subjected to Rapid Heating. Appl. Mech. Rev. 2018, 70, 020803. [Google Scholar] [CrossRef]
  29. Lewis, G.N. The Law of Physico-Chemical Change. Proc. Am. Acad. Arts Sci. 1901, 37, 49. [Google Scholar] [CrossRef]
  30. Chueh, P.L.; Prausnitz, J.M. Vapor-Liquid Equilibria at High Pressures. Vapor-Phase Fugacity Coefficients in Nonpolar and Quantum-Gas Mixtures. Ind. Eng. Chem. Fundam. 1967, 6, 492–498. [Google Scholar] [CrossRef]
  31. Chueh, P.L.; Prausnitz, J. Calculation of high pressure vapor=liquid equilibria. Ind. Eng. Chem. 1968, 60, 34–52. [Google Scholar] [CrossRef]
  32. Klauda, J.B.; Sandler, S.I. A Fugacity Model for Gas Hydrate Phase Equilibria. Ind. Eng. Chem. Res. 2000, 39, 3377–3386. [Google Scholar] [CrossRef]
  33. Mathias, P.M.; Naheiri, T.; Oh, E.M. A density correction for the Peng—Robinson equation of state. Fluid Phase Equilibria 1989, 47, 77–87. [Google Scholar] [CrossRef]
  34. Lee, B.I.; Kesler, M.G. A generalized thermodynamic correlation based on three-parameter corresponding states. AIChE J. 1975, 21, 510–527. [Google Scholar] [CrossRef]
  35. Kingdon, K.H. Enhancement of the evaporation of water by foreign molecules adsorbed on the surface. J. Phys. Chem. 1963, 67, 2732–2737. [Google Scholar] [CrossRef]
Figure 1. Schematic of water evaporation in the head–disk interface.
Lubricants 13 00197 g001
Figure 2. Flowchart to show procedure for calculating saturation pressure at high pressure and temperature.
Lubricants 13 00197 g002
Figure 3. Change in the fugacity of liquid water at various temperatures; f liq , 0 is the fugacity at 1 atm.
Lubricants 13 00197 g003
Figure 4. Deviation of the fugacity of water vapor at higher air-bearing pressures; f vap , 0 is the fugacity at 1 atm. (a) Air-bearing temperature is 300 K and (b) air-bearing temperature is 550 K.
Lubricants 13 00197 g004
Figure 5. Deviation of the fugacity of water vapor in pressurized helium at different oxygen levels.
Lubricants 13 00197 g005
Figure 6. Deviation of saturation pressure of water by increasing the air-bearing pressure. p sat , 0 is the saturation pressure at 1 atm. (a) Air-bearing temperature is 300 K and (b) air-bearing temperature is 550 K.
Lubricants 13 00197 g006
Figure 7. Deviation of saturation pressure of water by increasing the air-bearing pressure to (a) 50 atm and (b) 100 atm. p sat , 0 is the saturation pressure of water at 1 atm and the given temperature on the x-axis.
Lubricants 13 00197 g007
Table 1. The critical values and RK equation parameters for various gases.
Gas T c (K) P c (bar) ω a 11 ( L 2 bar/mol2) b 1 (L/mol) a 12 (with Water)
Helium10.476.75800.01550.011170.4953
Hydrogen3313−0.2200.14230.018301.4530
Water647220.50.34414.280.02115-
Nitrogen126340.041.5500.026714.9062
Oxygen154.450.50.0221.7350.022045.2463
Argon15148.701.70130.022355.1795
Ideal gasN/AN/A0000
Disclaimer/Publisher’s Note: The statements, opinions and data contained in all publications are solely those of the individual author(s) and contributor(s) and not of MDPI and/or the editor(s). MDPI and/or the editor(s) disclaim responsibility for any injury to people or property resulting from any ideas, methods, instructions or products referred to in the content.

