Abstract
The characteristics of pavement texture are key determinants of skid resistance, directly affecting tire-pavement interactions. This study examines the relationship between separated pavement textures and friction coefficients under dry and wet conditions. Using 3D laser scanning, texture data were collected from 40 asphalt pavement sections in Nanchang. The data were processed through Fourier Transform and Butterworth filtering, enabling separation of macro- and micro-textures. Based on ISO 25178-2, 16 parameters—including Sa (Arithmetic Mean Height), Str (Texture Aspect Ratio), Vmc (Core Material Volume), and Ssk (Skewness)—were selected to represent macro- and micro-texture features. These parameters were analyzed against dry and wet friction coefficients, and regression models were developed to predict FDry and FWet. The results show significant effects of both macro- and micro-texture parameters on friction coefficients. Among macro-texture parameters, Sa and Vmc strongly correlate with FDry, suggesting that greater surface roughness and core material volume enhance friction in dry conditions. Conversely, Ssk negatively correlates with FDry, indicating that negatively skewed profiles improve skid resistance. Other macro-texture parameters also influence FDry to varying extents. For micro-texture, Sdc (Material Height Difference), Spd (Peak Density), and Vvv (Valley Void Volume) primarily affect FWet, with all showing significant positive correlations. This indicates that sharp peaks and void structures in micro-texture enhance skid resistance in wet conditions. The regression models effectively predict both friction coefficients, reducing field testing complexity and cost. These models provide an efficient tool for evaluating skid resistance and supporting pavement performance and maintenance management. This study highlights the distinct roles of macro and micro-texture in skid resistance, offering insights for optimizing pavement design and maintenance.
1. Introduction
Asphalt pavement is one of the most widely used pavement structures globally, renowned for its superior driving comfort, shorter construction time, and low noise levels [1,2,3,4]. The surface texture characteristics of asphalt pavement play a critical role in ensuring vehicle safety, providing essential traction and friction for stable vehicular operation. The texture of asphalt pavement, as a critical factor influencing tire-road contact, plays a pivotal role in determining skid resistance. The surface texture condition, whether dry or wet, along with the scale and distribution of the texture, is closely associated with the friction coefficient, a key parameter characterizing skid resistance [5,6]. The studies by Acai and Amadi-Echendu, Davies, et al. [7,8]. demonstrate a clear relationship between friction coefficients, texture depth, and road accident rates. Asphalt pavements with higher friction coefficients are proven to significantly reduce the occurrence of traffic accidents. As the service life of roads increases, the performance of asphalt pavements deteriorates progressively [7,8,9]. Analyzing the changes in pavement texture facilitates the monitoring of skid resistance, enabling early intervention before skid resistance reaches critical levels. Such proactive measures can help prevent accidents caused by insufficient pavement friction. Moreover, this analysis may provide new reference indicators for skid-resistance monitoring in road maintenance [10,11].
The study by Du et al. [12] utilized two-dimensional wavelets to characterize three-dimensional textures, identifying two indicators that effectively evaluate skid resistance and wear resistance. Yu, et al. [13] developed a novel testing system, revealing a strong linear correlation between tire-road contact area and the dynamic friction coefficient (DFC). Additionally, their findings demonstrated a correlation between DFC and the mean profile depth (MPD), highlighting the role of macro-texture in influencing the peak values of pavement friction coefficients. Jiao, et al. [14] conducted quantitative analyses of the relationship between terrain characteristics and wettability using three-dimensional measurement samples based on ISO texture indicators. Their results indicated that Ssk and Sku exhibit superior diffusion behavior, while Str plays a crucial role in promoting diffusion, offering a new analytical perspective on the interaction between surface texture and wettability. Zou, et al. [15] established a neural network prediction model for skid resistance coefficients (SFC) based on ISO feature parameters for macro- and micro-texture. Their research concluded that the model predicts SFC with high accuracy and that micro-texture contributes more significantly to SFC. Deng, et al. [16] divided three-dimensional textures into multilayers of varying wavelengths and areas, investigating the correlation between the power spectral density index C(q) and friction. Furthermore, novel micro-texture parameters such as arithmetic mean height (Sa), kurtosis of height distribution (Sku), peak density (Spd), and arithmetic mean peak curvature (Spc) were employed to explore the influence of micro-texture on friction performance [17,18,19].
With the integration of signal processing techniques into texture data analysis, methods such as wavelet transform, Fourier transform, and Hilbert–Huang transform have become essential tools for processing texture signal data [20]. Zelelew, et al. [21] applied wavelet transforms to objectively analyze pavement macro-texture data. Katicha, et al. [22,23] proposed methods to identify and remove spikes using error discovery rate control or wavelet analysis, demonstrating their effectiveness in measuring pavement macro-texture. Zou, et al. [15] utilized Fourier transform for both macro- and micro-scale analyses of surface texture data.
Extensive research has explored the relationship between texture characteristics and friction coefficients. Most studies focus on characterizing texture features using various methods and establishing their correlation with either dry or wet friction coefficients. However, a comprehensive analysis linking surface texture to both dry and wet friction coefficients remains scarce. This study integrates macro- and micro-texture characteristics, represents them through key parameters, and correlates them separately with dry and wet friction coefficients. The findings provide a novel analytical approach to utilizing pavement texture data for predicting friction coefficients under varying conditions.
The primary objectives of this study are as follows:
- To separate the asphalt pavement surface into macro-texture and micro-texture components;
- To compute surface texture characteristic parameters specified in the ISO standards using three-dimensional point cloud data;
- To analyze the relationship between macro-texture and the dry friction coefficient, as well as between micro-texture and the wet friction coefficient;
- To establish regression relationships between characteristic parameters and both dry and wet friction coefficients based on the analysis results.
2. Materials and Methods
2.1. Pavement Texture Data Collection and Characterization
2.1.1. Collection and Preprocessing Methods
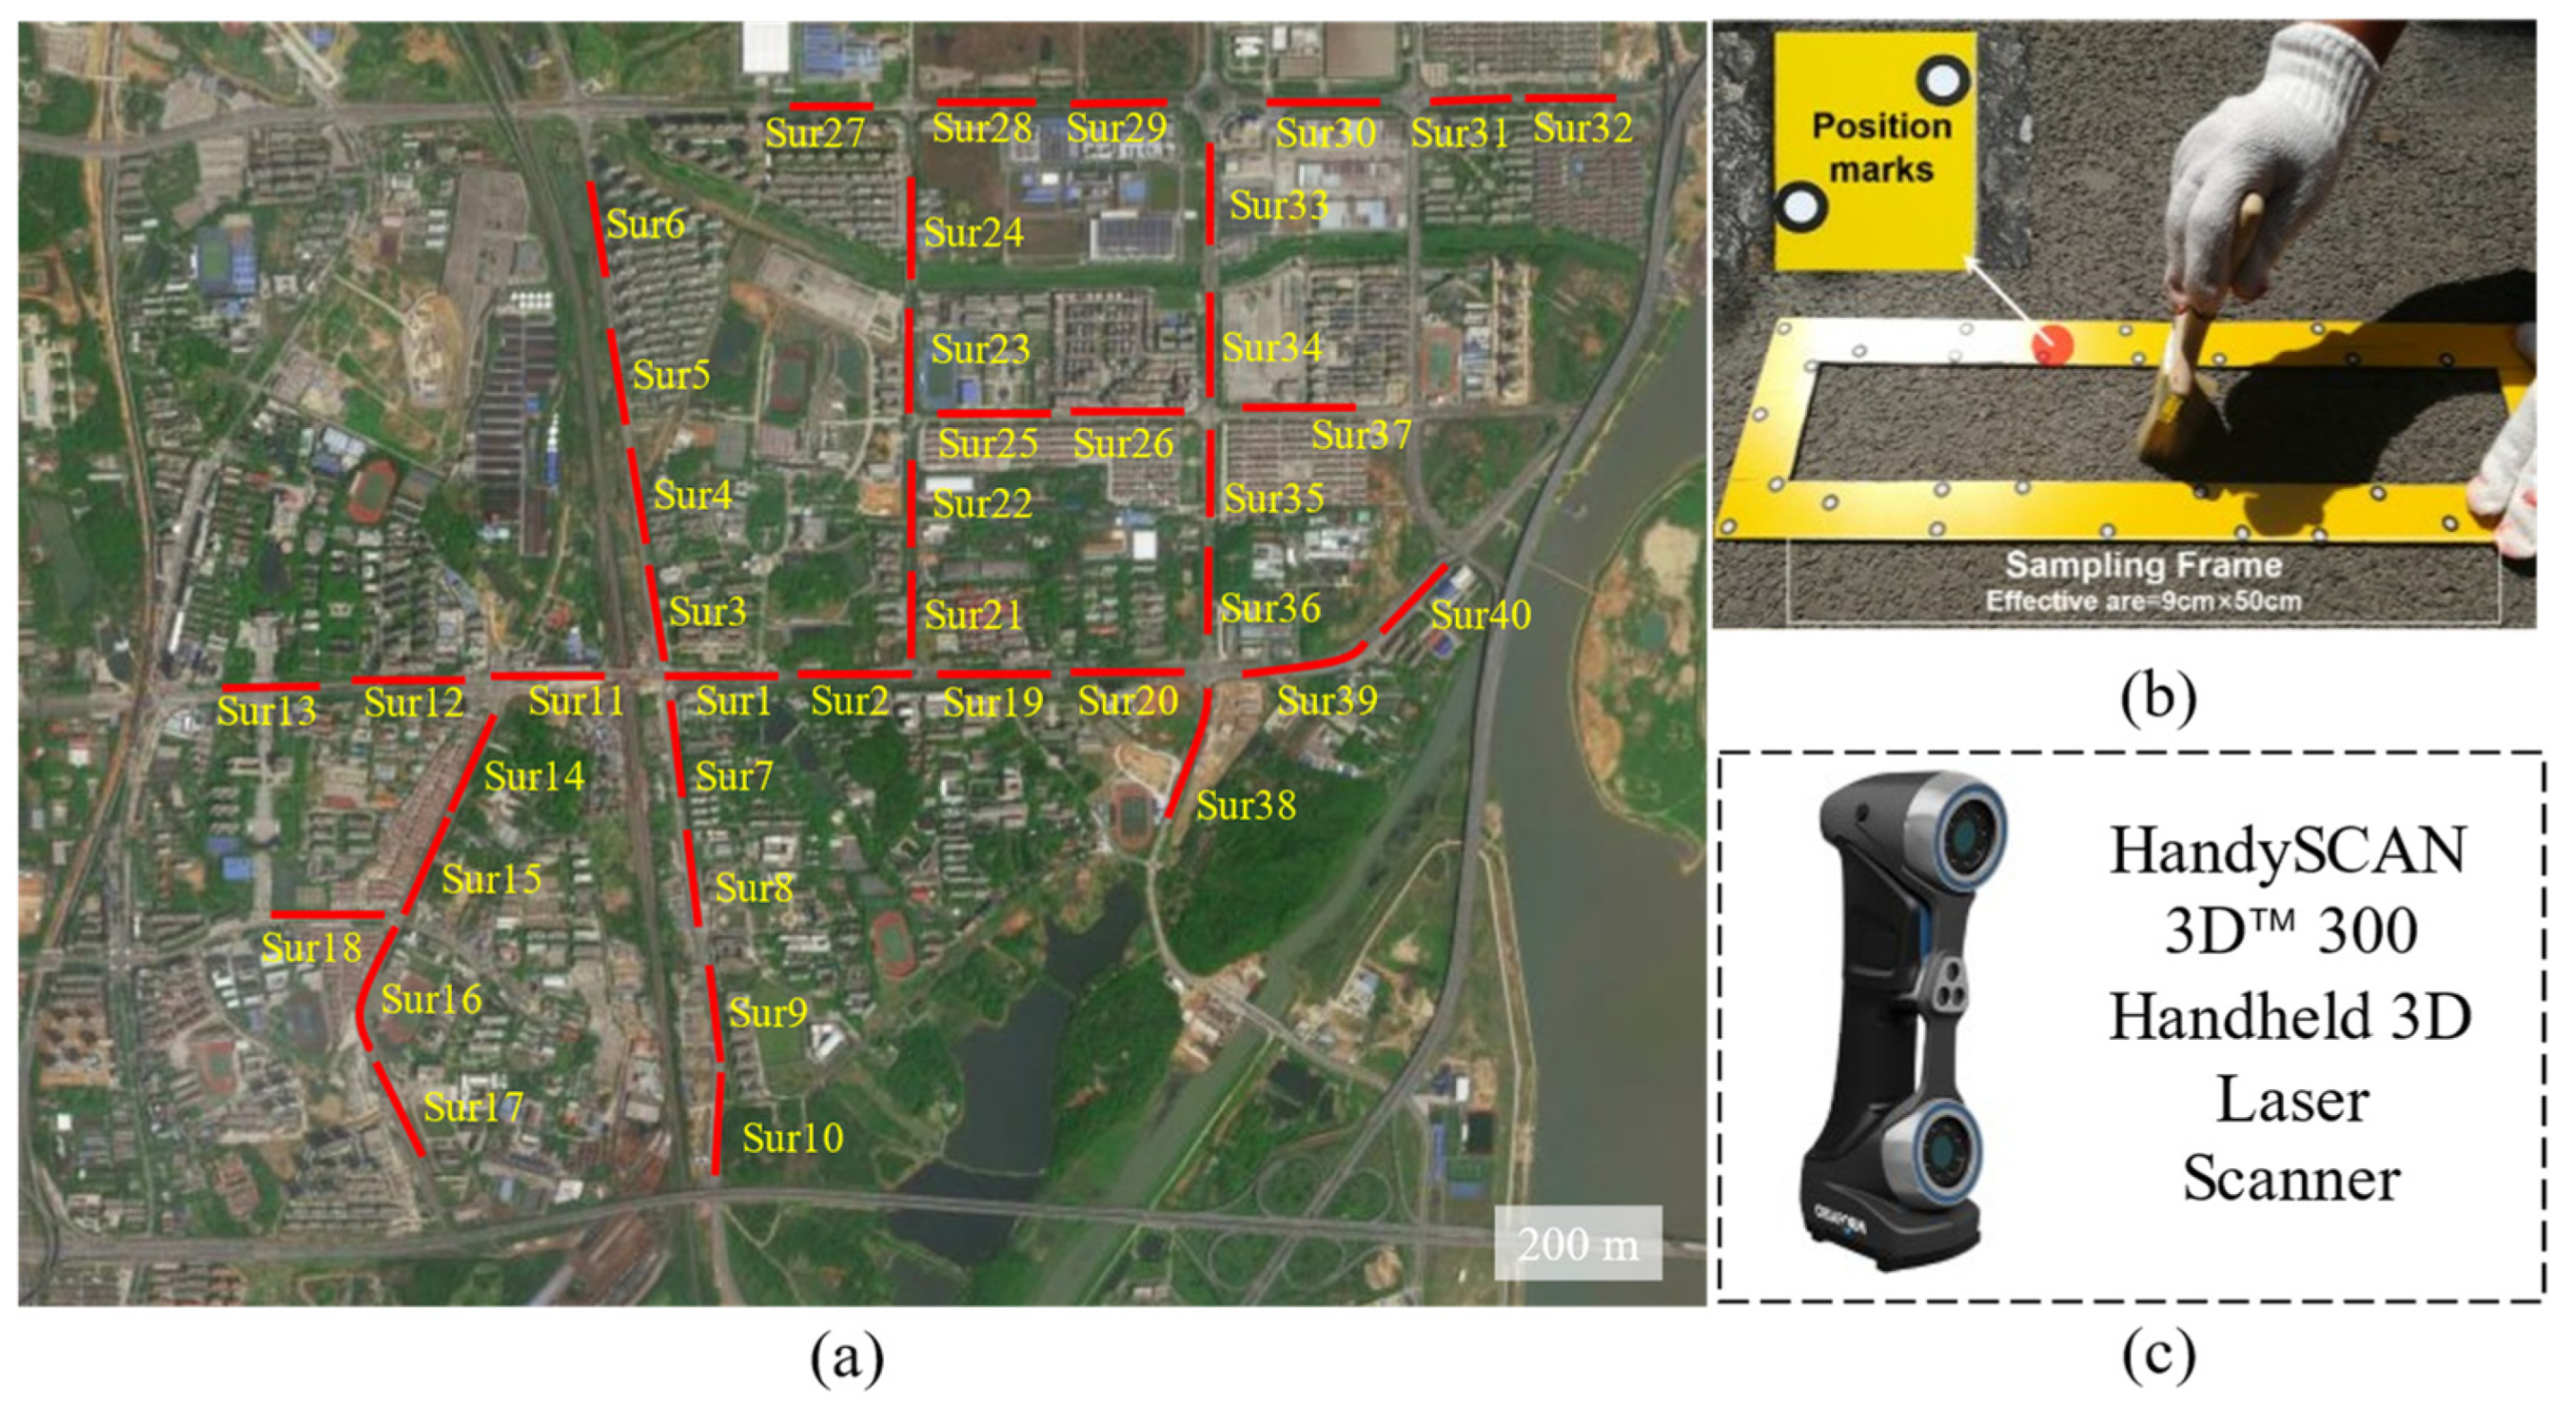
In the preliminary stage of the research, the selection of test road sections was carefully discussed. As this study focuses on evaluating the skid resistance of asphalt pavements, existing urban asphalt roads were chosen as the research subjects to ensure that the experimental results reflect the real-world skid-resistance conditions. To ensure the diversity of the study and the reliability of the analysis, road sections with low vehicular traffic and no visible distresses were selected to maintain operational safety and stable skid resistance. Additionally, sections with varying gradations were chosen to enhance diversity. A total of 20 municipal roads (comprising 40 test sections) were selected, spanning a total length of 11,000 m, as the subjects of this study. Figure 1a presents an approximate topographic map with marking points for pavement texture data collection. The naming of the test sections follows a systematic approach: for horizontal sections, the names are positioned below the corresponding line segments in the schematic diagram, while for vertical and diagonal sections, the names are located to the right of the line segments. The pavement types examined in this study include three widely used asphalt mixtures: dense-graded asphalt (AC), stone mastic asphalt (SMA), and open-graded asphalt (OGFC).
Figure 1.
Marked Points and Profile Positioning Diagram of the Measured Road Section. (a) Marked Points of the Road Section. (b) Scanning Positioning Sampling Frame. (c) Handy SCAN 3D™ 300 Handheld 3D Laser Scanner.
The Handy SCAN 3DTM 300 handheld 3D laser scanner, manufactured by CREAFORM, Canada, was employed to collect pavement texture data. The data files comprise three-dimensional point cloud data representing the pavement surface, with each point defined by its Cartesian coordinates. Figure 1b,c illustrates the actual scanner and a detailed view of the texture data collection process, respectively. To ensure uniformity in the scanned areas across all test sections, positioning markers were attached to sampling frames for scanning. The effective area of each sampling frame was 9 cm × 50 cm, as depicted in Figure 1b. The scanning resolution was set to 0.1 mm to balance the retention of macro- and micro-texture details with computational efficiency. Field scanning operations were conducted using the scanner in conjunction with a laptop and a portable power source. The scanning process for each test section was carried out in three steps. First, the scanning area was marked to facilitate subsequent dry and wet friction coefficient measurements. Second, fine brushes were used to remove dust and debris from the scanning surface. Finally, three adjacent regions within each test section were scanned, with the long axis of the sampling area aligned along the vehicle’s travel direction.
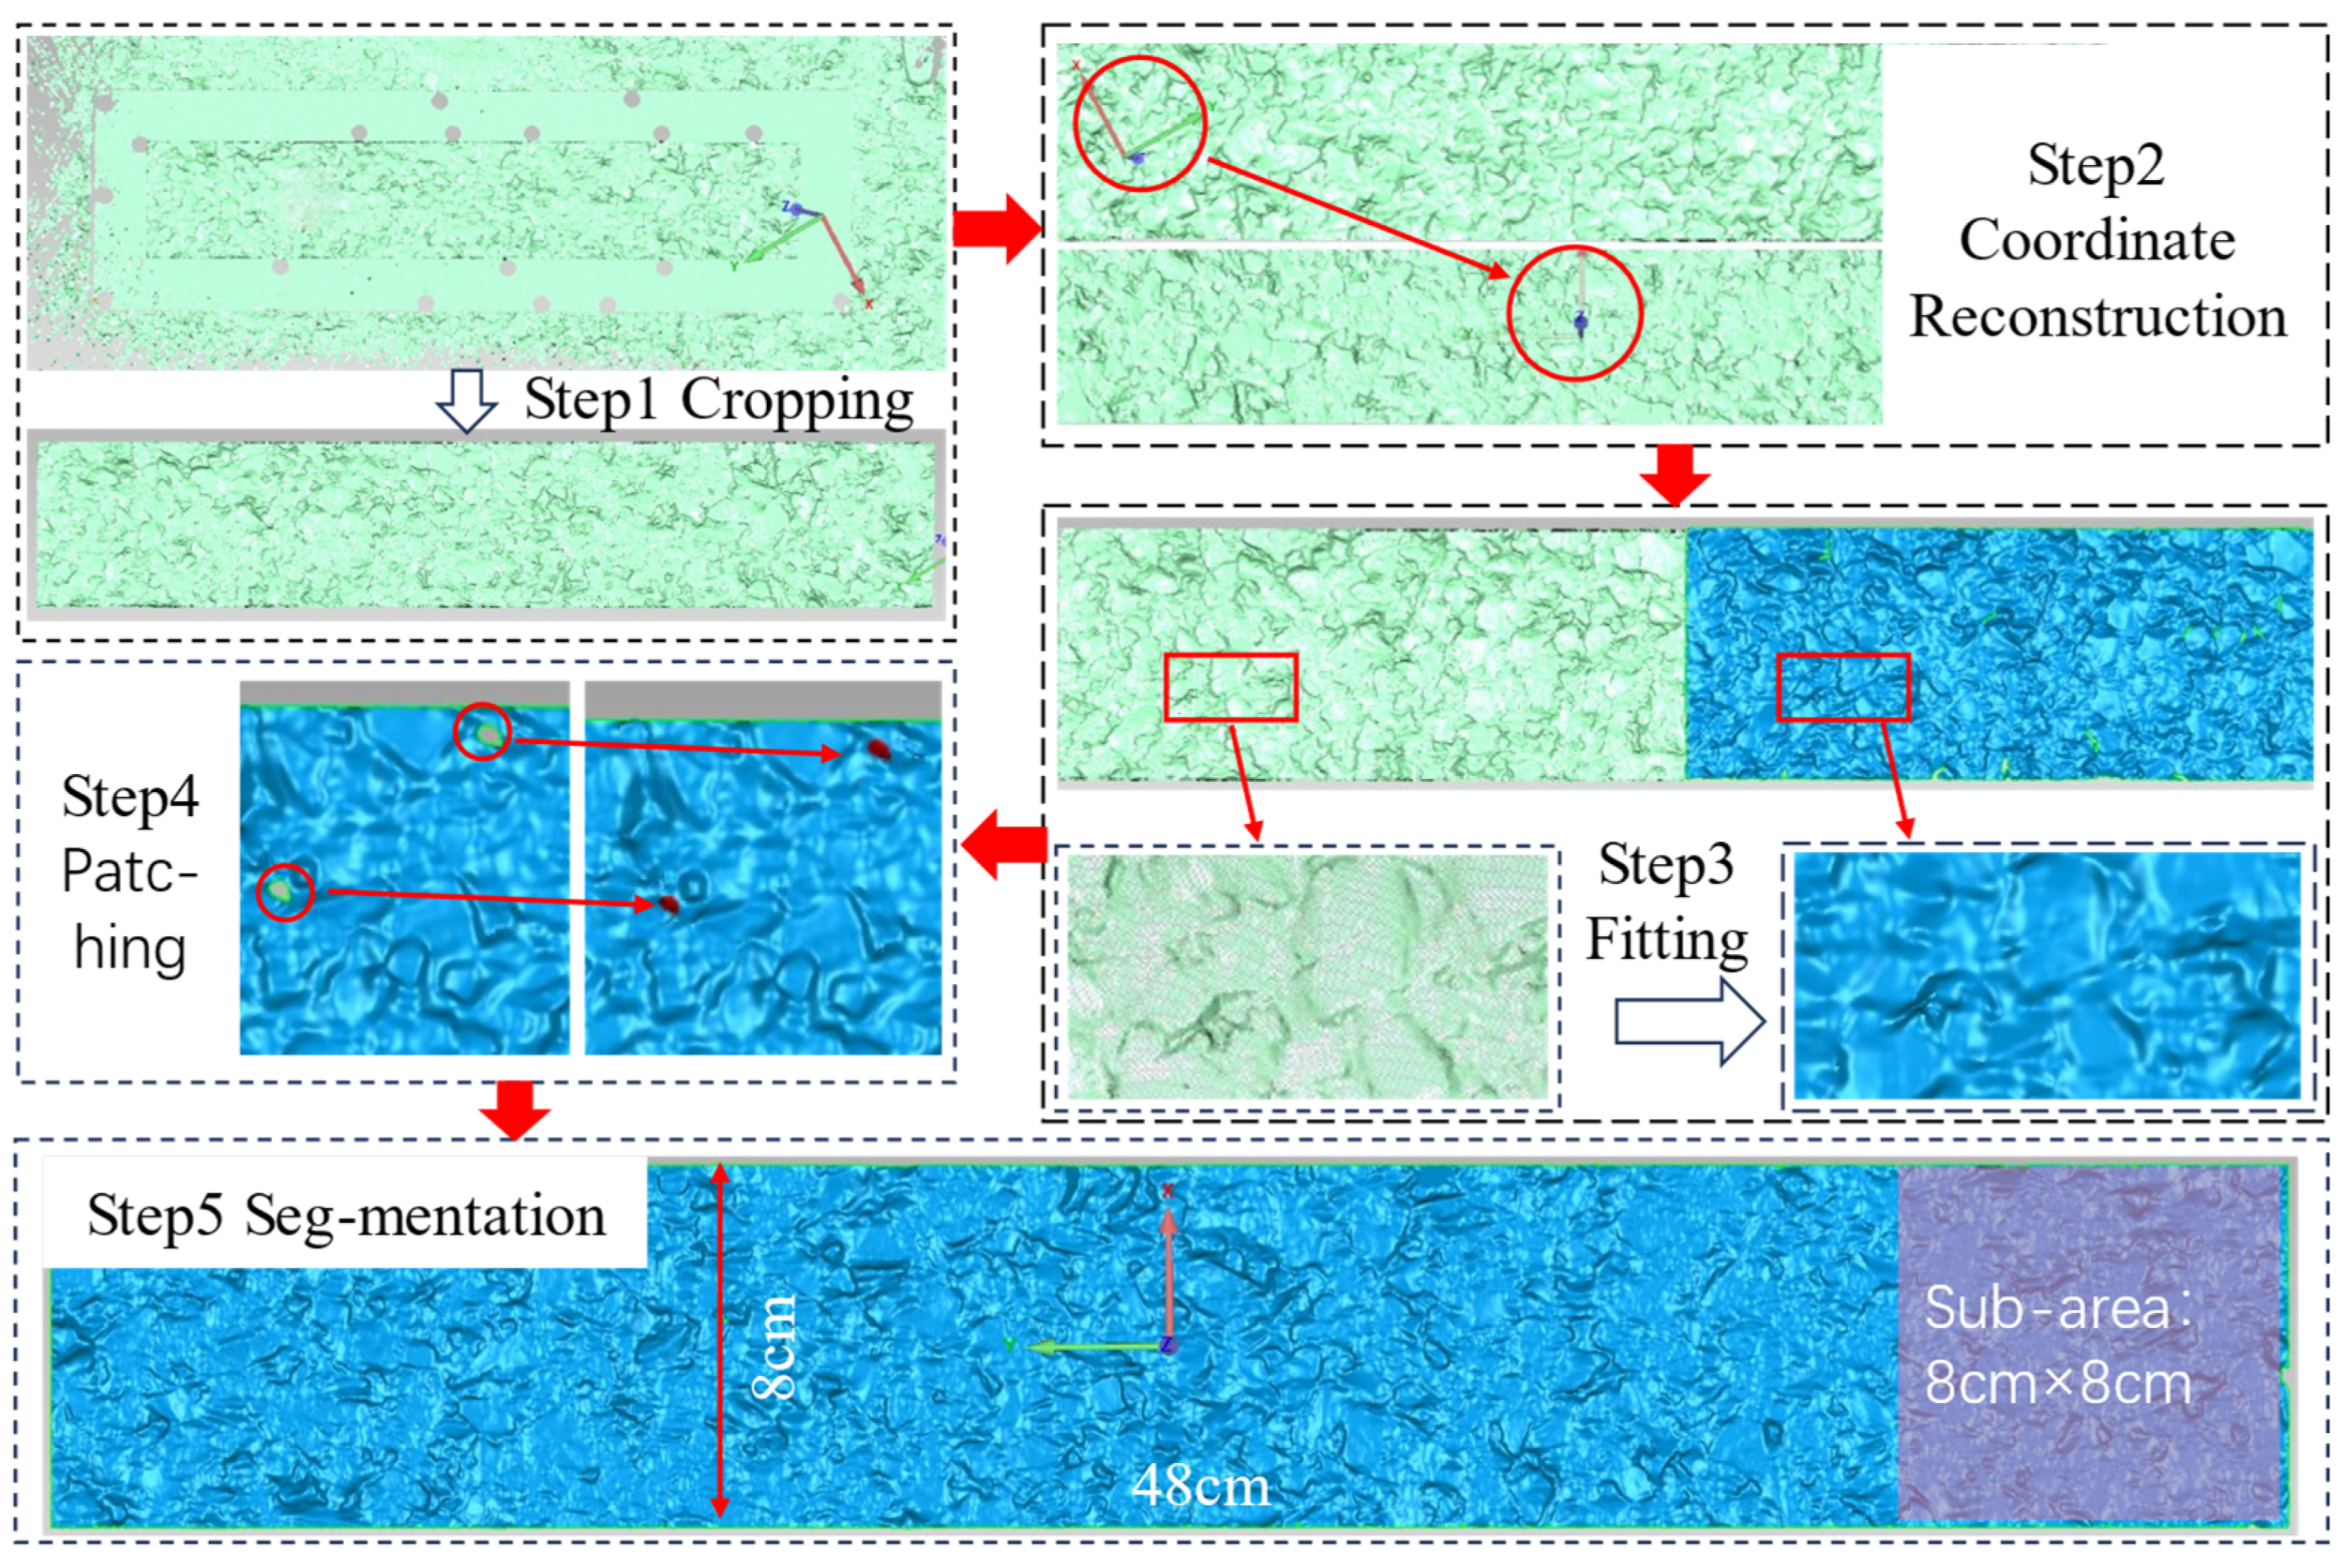
The raw point cloud data collected from pavement texture cannot be directly utilized for subsequent index calculations or three-dimensional model reconstruction. According to the requirements of the study, the original point cloud data must undergo preprocessing steps, including trimming, fitting, patching, coordinate reconstruction, and segmentation. The raw data, collected beyond the boundaries of the sampling frame to ensure sample completeness, is preprocessed using Geomagic software (Geomagic Wrap 2021.0.0: 64-bit version (2021.0.0.3008)). This preprocessing involves basic visualization and data trimming to obtain higher-quality texture data suitable for analysis. The preprocessing workflow consists of five steps, as shown in Figure 2.

Figure 2.
Flowchart of Raw Data Preprocessing.
First, the dimensions of each test section (8 cm × 48 cm) are determined based on the positioning frame and a fixed cropping box. Second, the scanner’s initial coordinate system is transformed into a custom system centered at the test area’s midpoint. Third, triangulation is applied to convert raw point coordinates into a polygonal surface, enabling further experiments like 3D reconstruction. Fourth, the fitted surface is inspected, and missing data or holes are filled using grid interpolation and surface reconstruction. Finally, the repaired model is saved as binary point coordinates and divided into six equal sections using a Python algorithm (Python 3.12.0), aligned with the vehicle’s driving direction, as shown in Figure 2.
2.1.2. Characterization of Texture Features
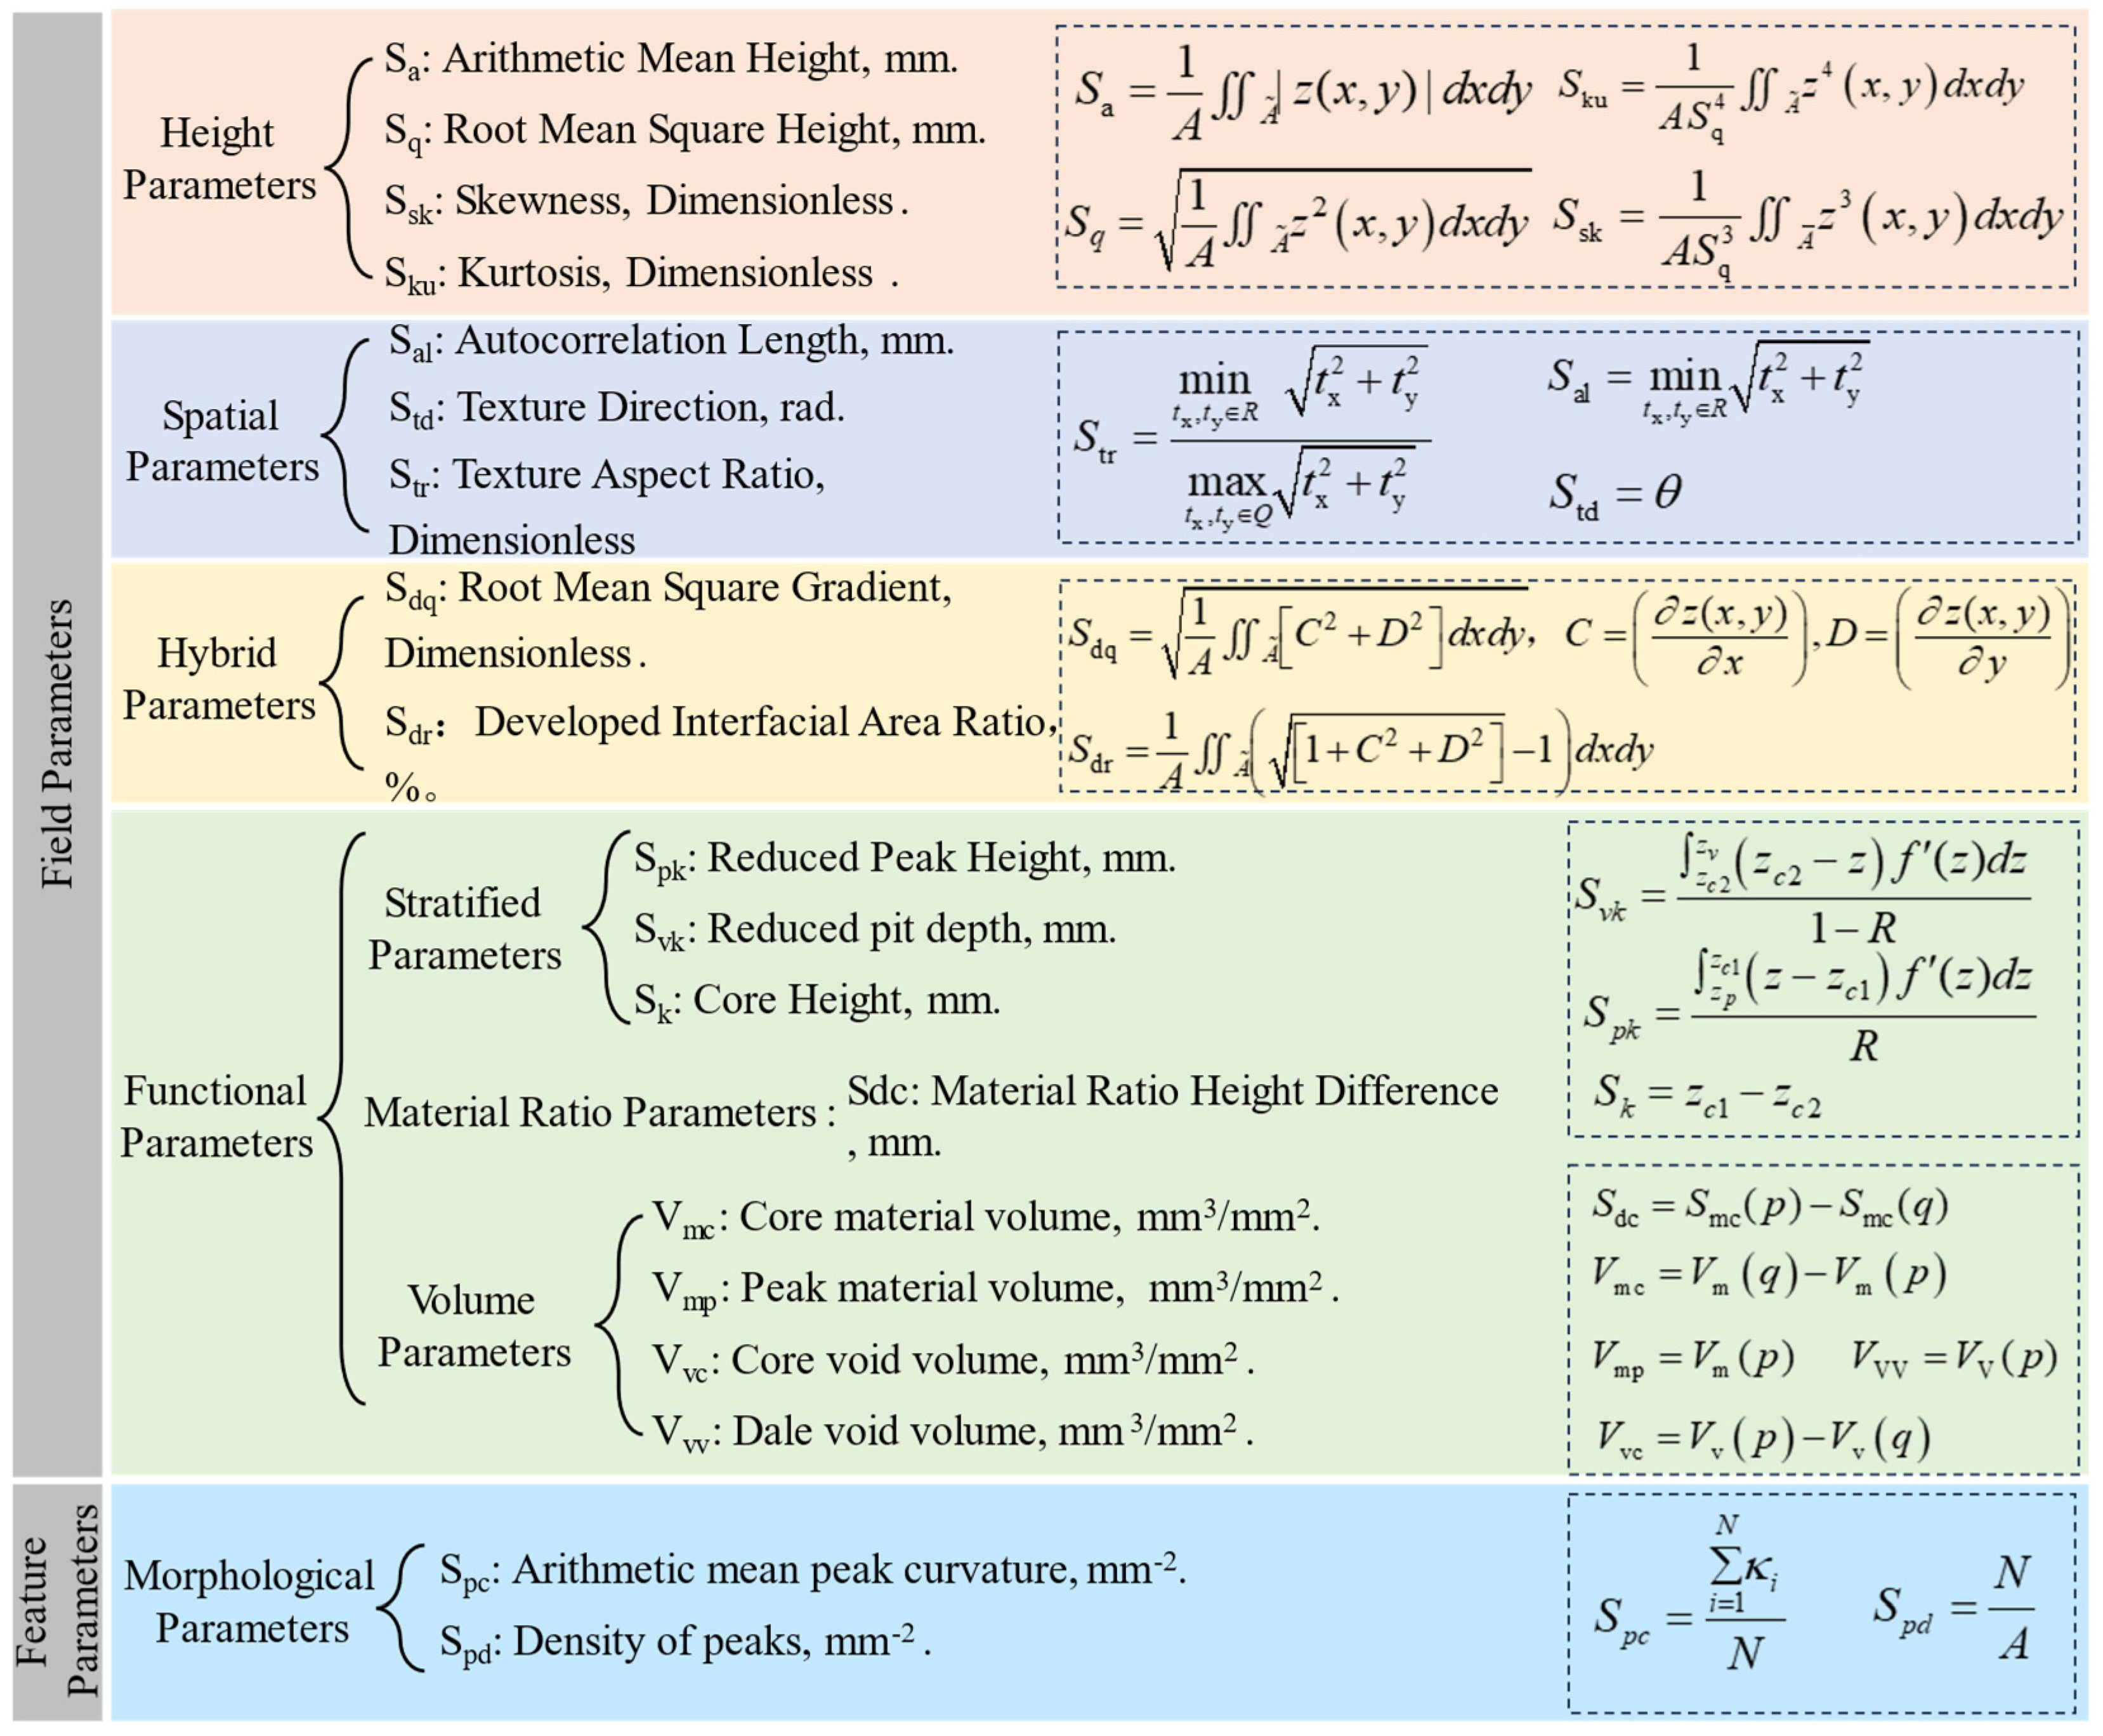
The study utilizes the existing three-dimensional indices defined in the international standard ISO 25178-2 [24] to characterize the texture performance of the measured asphalt pavement. According to the descriptions of texture indices in ISO, the parameters are categorized into two major types. The first type encompasses measurements related to texture size, such as area or volume, and is termed Field Parameters. This category includes eight subcategories comprising a total of 41 individual parameters. The second type, known as Feature Parameters, does not define specific parameters but serves as a technical tool for identifying designated features on scale-limited surfaces based on a defined pattern. This category contains seven parameters. Through preliminary screening, 19 parameters from both categories were selected, as summarized in Figure 3.
Figure 3.
Parameter Summary Chart.
Where: A represents the texture surface area. z(x,y) or z denotes the height at surface coordinates (x,y) relative to the mean plane. tx and ty are the horizontal displacements of the texture in the longitudinal (traffic) and transverse directions, respectively. θ is the angle between the principal direction of the fastest autocorrelation decay (to 0.2) and the traffic direction. C and D quantify the surface height gradient per unit distance along the traffic and transverse directions, respectively. zc1 and zc2 are the upper and lower boundaries of the core material region. zp and zv correspond to the highest peak and deepest valley within the texture profile. R is the material ratio, the cumulative probability function of the surface height distribution. f′(z) is the probability density function of texture height. Smc(p/q) denotes the height at material ratio positions p and q. Vm(p/q) and Vv(p/q) represent the material volume and void volume at these positions, respectively. Ki is the i peak, and N is the total number of peaks across the texture domain.
2.2. Pavement Friction Coefficient Data Collection and Results
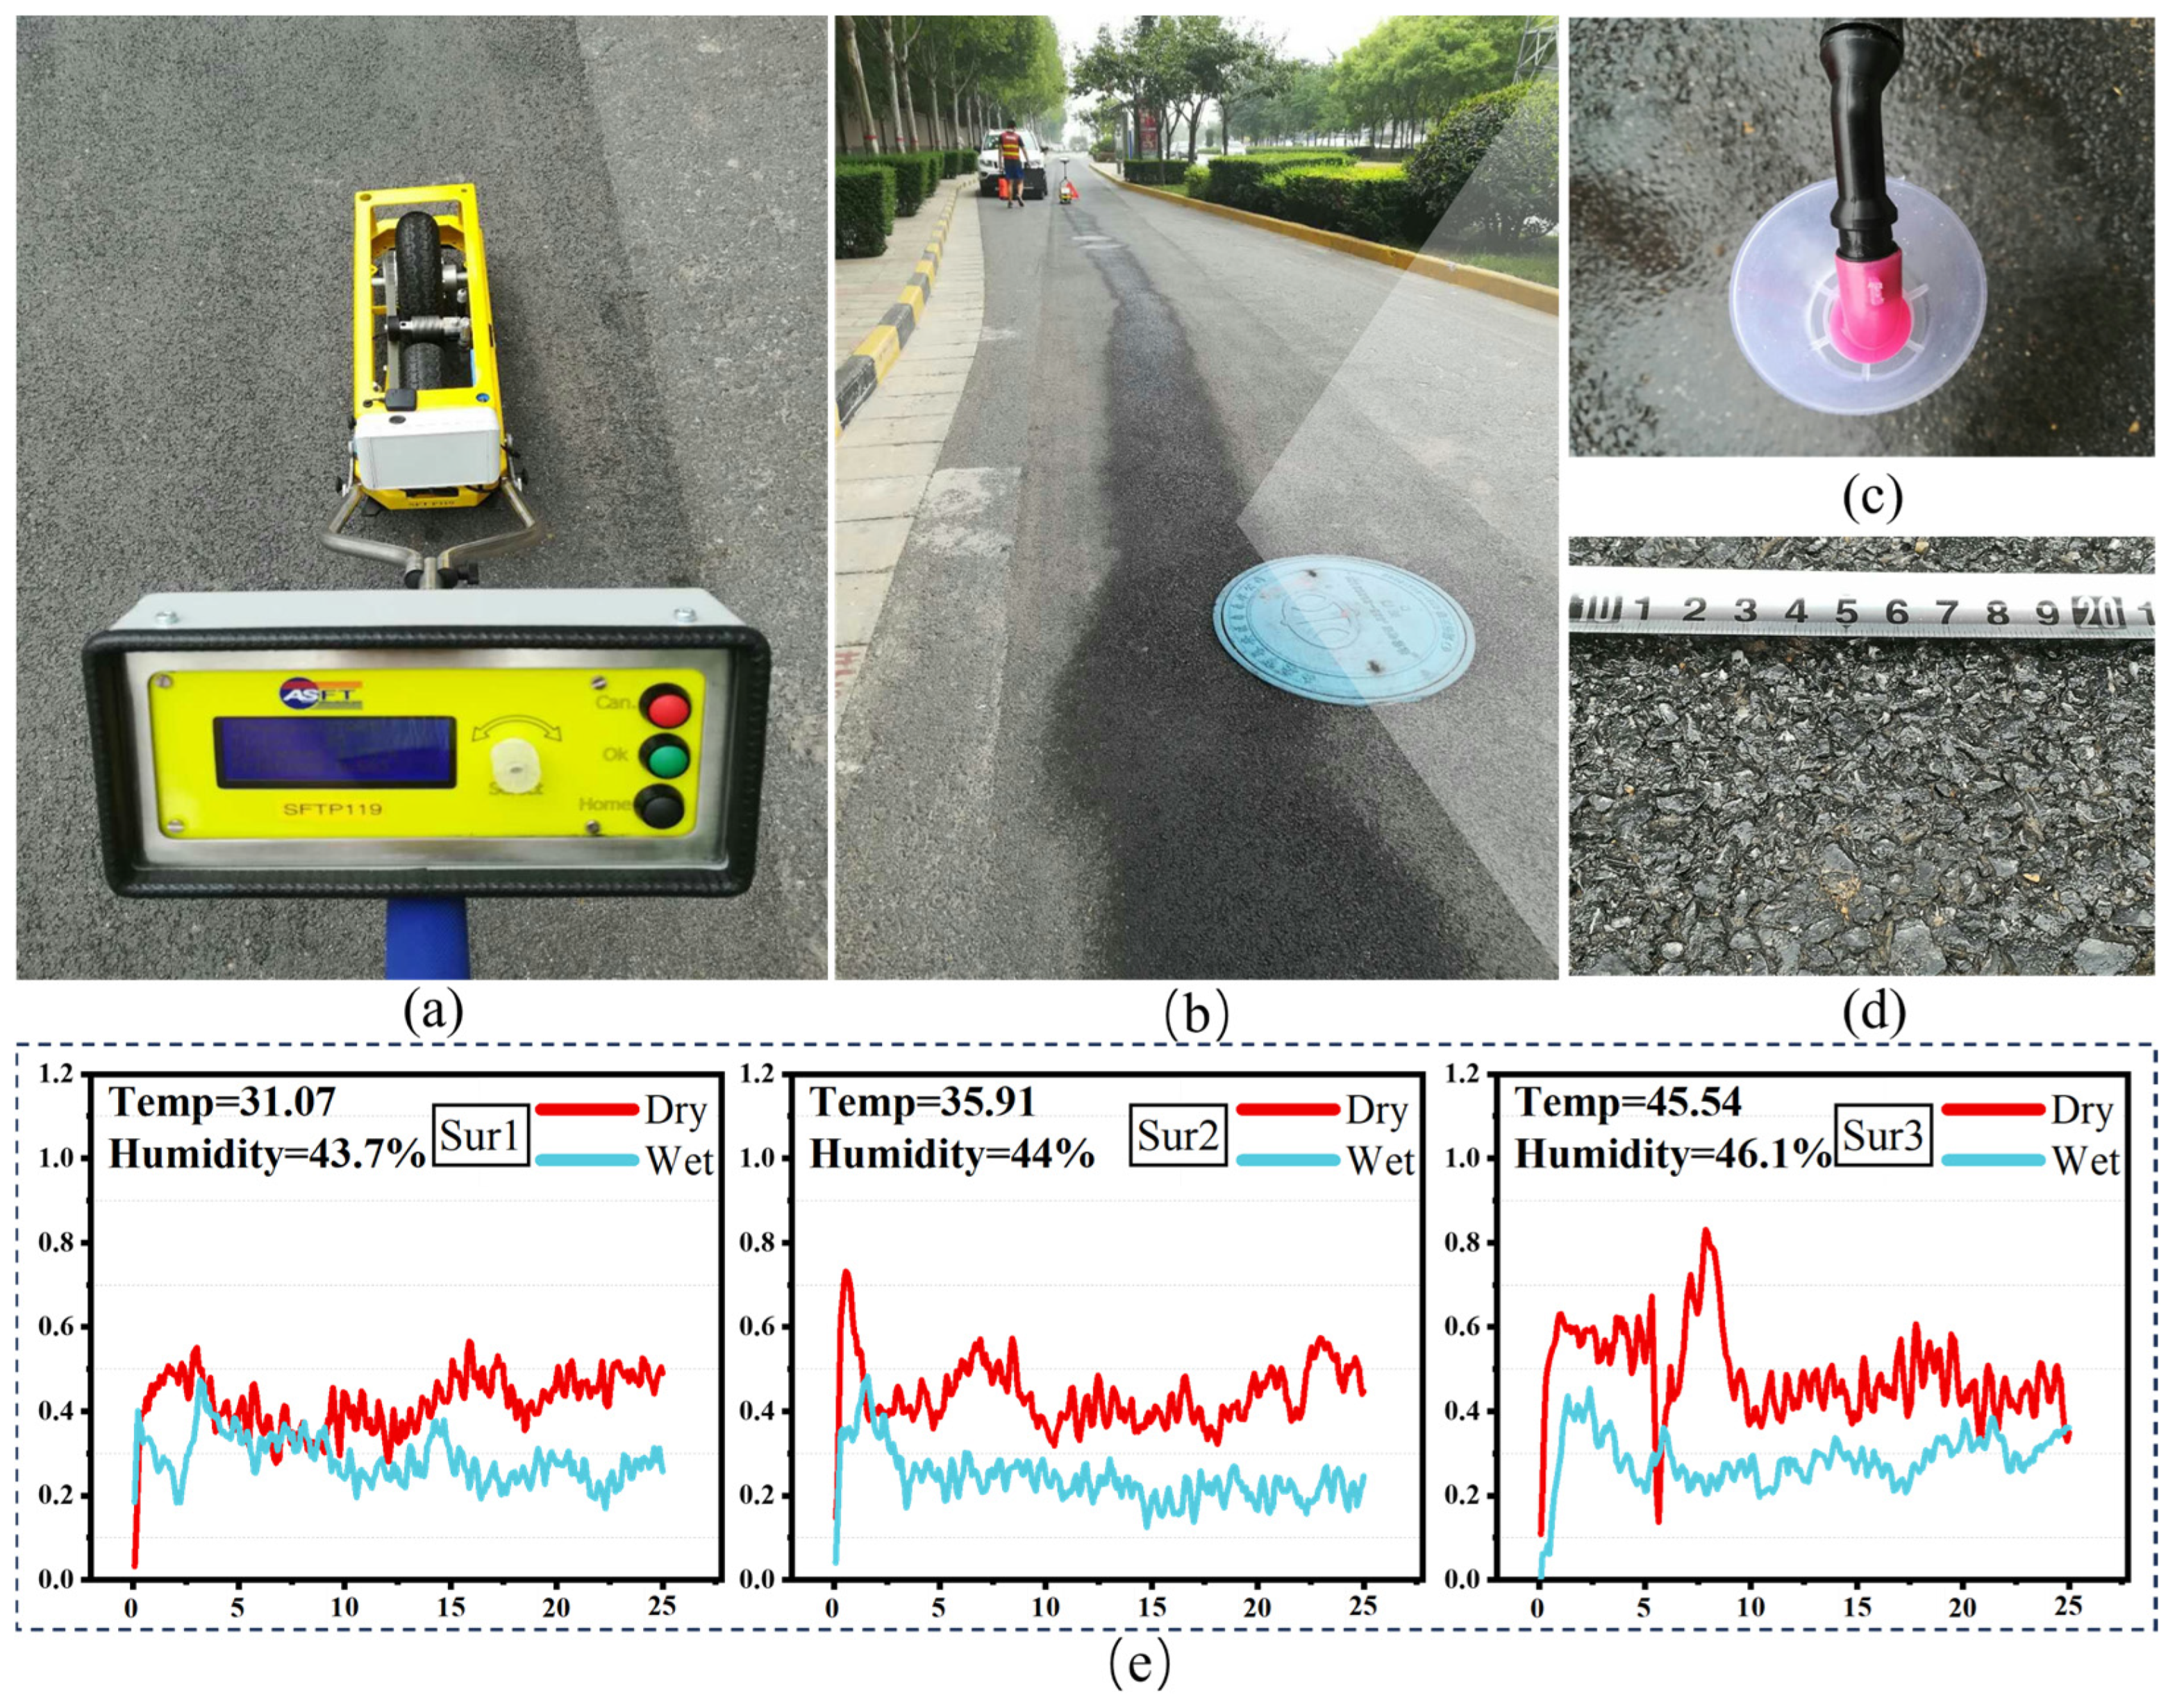
To investigate the relationship between asphalt pavement texture and friction coefficients, the T2GO portable continuous friction measurement device was employed to test the dry and wet friction coefficients of continuous road sections. The test subjects included 20 municipal roads (40 test sections) previously selected and scanned using 3D imaging, with each test section approximately 30 m in length. Figure 4 captures field photographs of the continuous friction measurement process on the test sections, while Figure 4a details the dry friction coefficient collection, and Figure 4c,d depicts the on-site measurement conditions. The continuous friction coefficients along the driving direction are illustrated in Figure 4e, where red and blue curves represent the friction coefficients under dry and wet conditions, respectively. The horizontal axis indicates the travel distance (in meters), and the vertical axis represents the dimensionless friction coefficient. For analysis, the average friction coefficient of each section recorded by the T2GO device during a single pass was calculated, and the mean of three repeated tests was derived for use in subsequent studies.

Figure 4.
Field Photos and Partial Friction Coefficient Results. (a) T2GO Friction Tester in testing. (b) Sprayed test section. (c) Spraying process. (d) Moistened asphalt pavement. (e) Friction coefficient results of three sections.
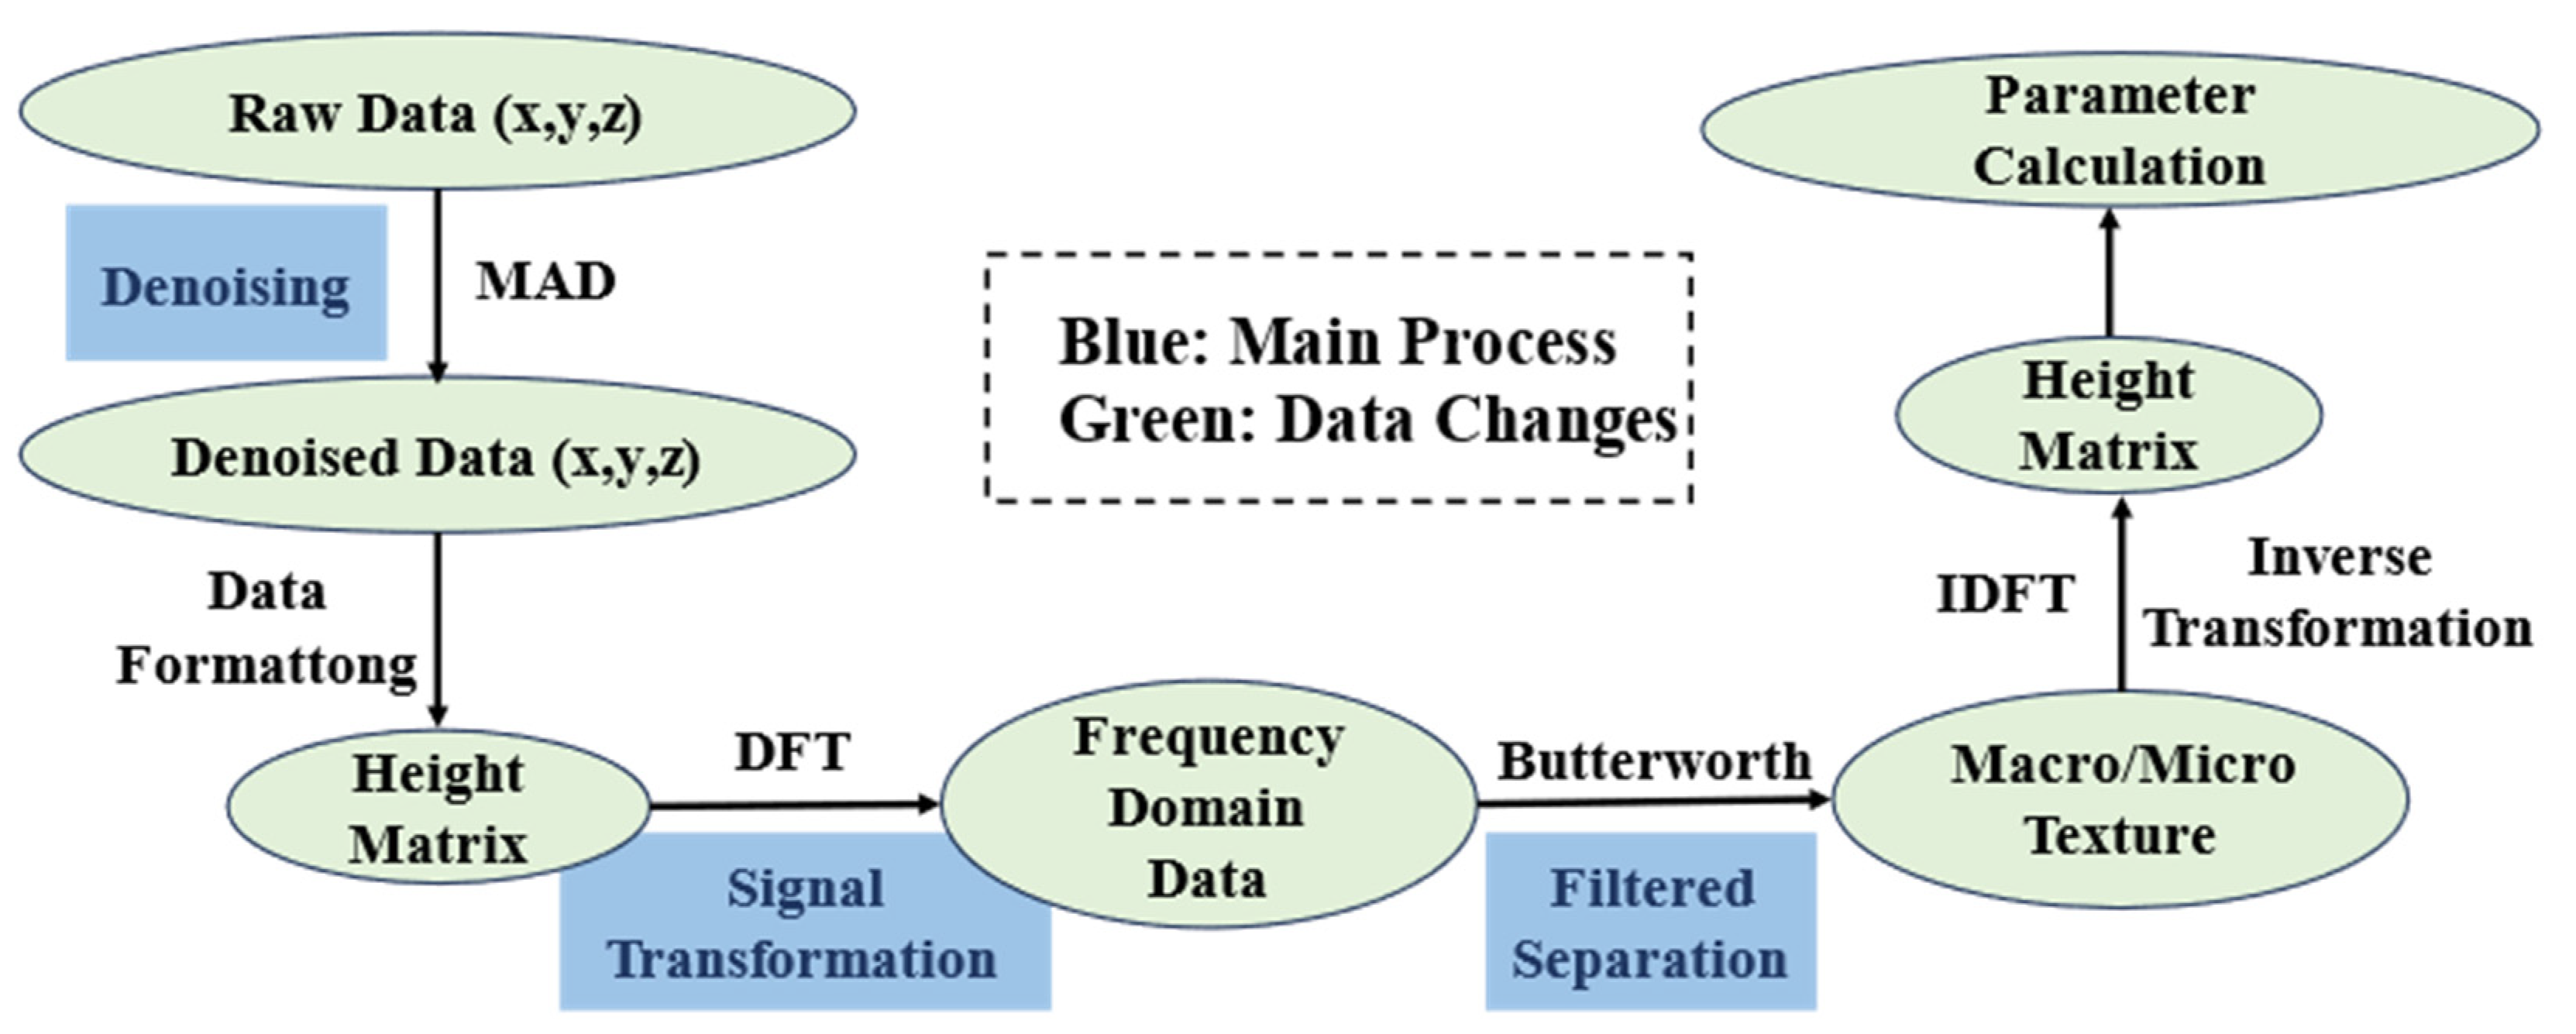
2.3. Separation of Pavement Macro/Micro Texture
The separation process is based on the methodology proposed by Zou, et al. [15], integrating MAD denoising to tailor the data to the specific requirements of this study. The detailed workflow is illustrated in Figure 5.

Figure 5.
Texture Separation Flowchart.
Step 1: Data Denoising.
During the data collection process, various factors such as the precision of measurement equipment, system errors, and variations in ambient light conditions can affect the quality of the raw data. As a result, the collected raw data often exhibit noise, incompleteness, and the presence of outliers. To ensure that the data quality optimally reflects the true skid resistance performance of the tested asphalt surfaces, it is necessary to enhance the raw point cloud data before downstream processing. This study employs the MAD (Median Absolute Deviation) denoising technique, designed to eliminate outliers—commonly referred to as noise points—in three-dimensional point cloud data. Equation (1) represents a widely used decision rule in the MAD method, while Equations (2) and (3) are its modified forms after removing absolute values.
where: Xi represents the data point, Median(X) denotes the median of the dataset, |Xi − Median(X)| indicates the absolute deviation of the dataset, and k is a constant.
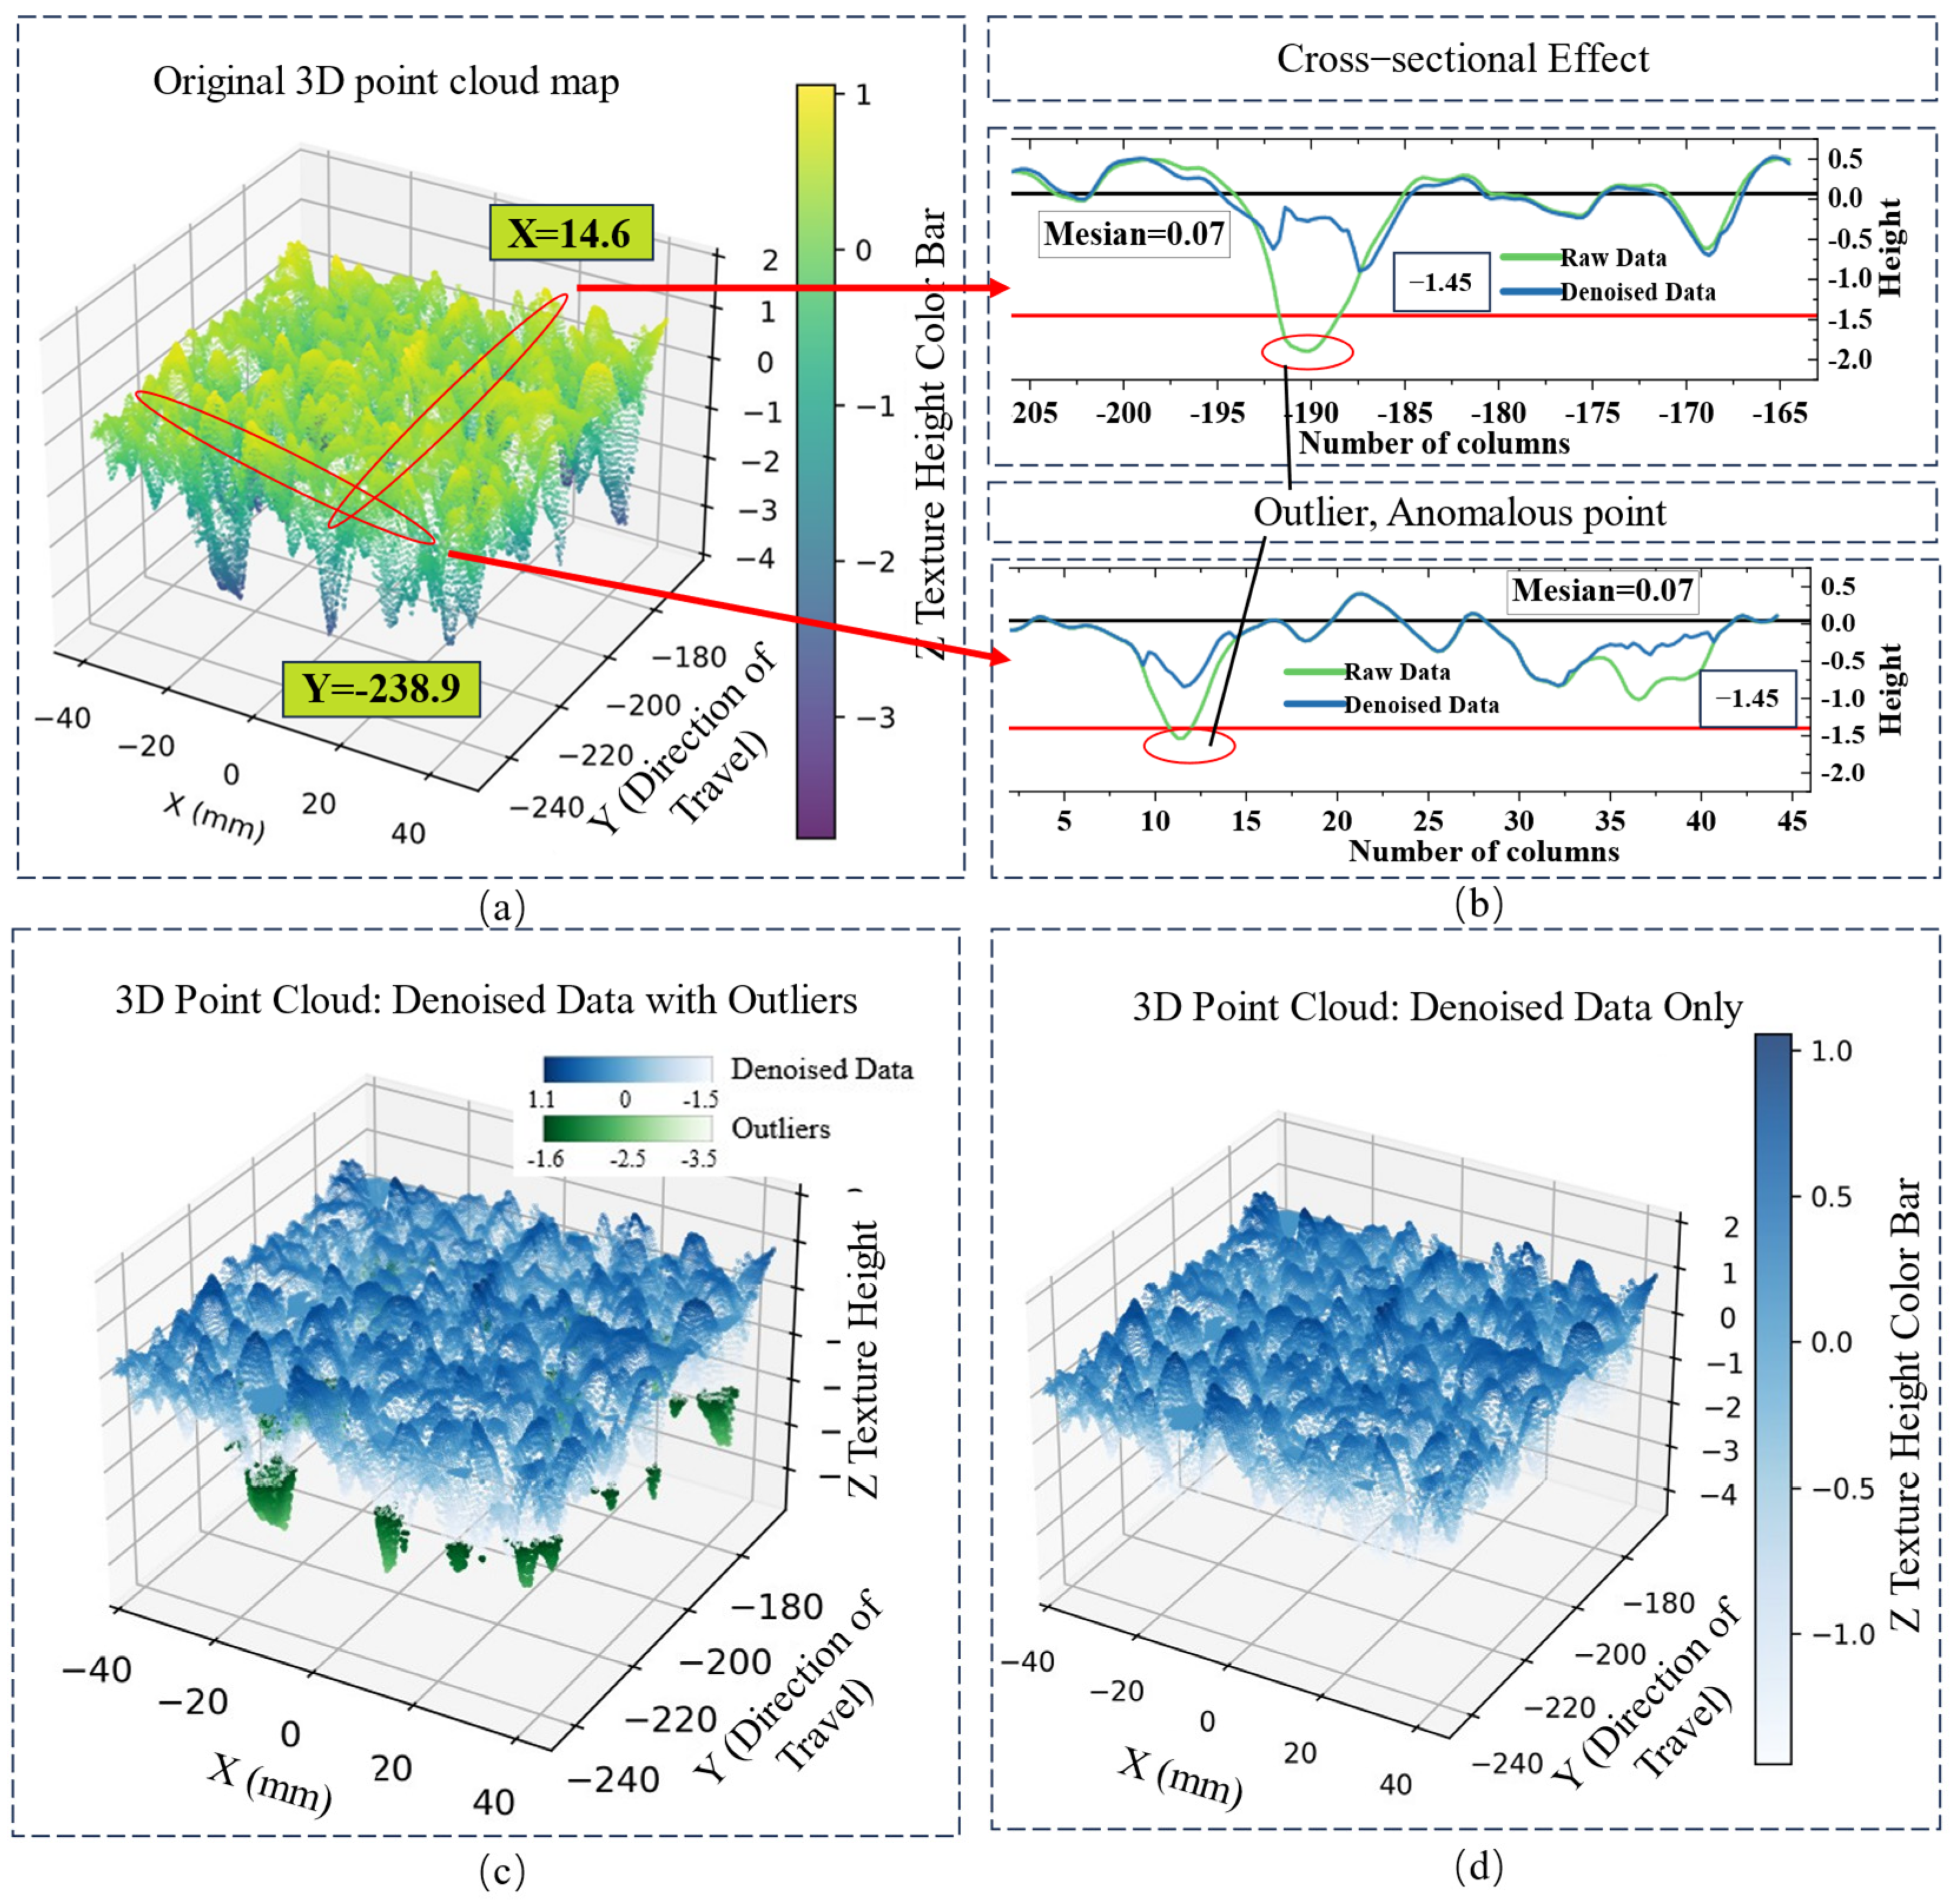
Figure 6 provides a detailed demonstration of the MAD denoising process in both three-dimensional and cross-sectional perspectives. Figure 6a visualizes the raw 3D data from BY1-1_1.asc of the asphalt pavement, where the Z-axis represents texture height values. In the raw data visualization, numerous negative peak height values can be observed. Identifying outliers solely by visual inspection is challenging due to the complexity of the data distribution. Hence, the MAD method was applied to detect outliers within the dataset. In Figure 6c, the green points represent the identified outliers, while the blue points denote the denoised data. Figure 6d presents the asphalt pavement data after outlier removal, revealing a refined surface structure. Figure 6b illustrates a two-dimensional cross-sectional representation of the outliers, focusing on the profile at X = 14.6 (Y = −238.9) from the raw data. The comparison of pre- and post-denoising changes highlights the effectiveness of the MAD method. The red line in the figure corresponds to the right-hand value of the inequality described in Equation (3).

Figure 6.
Comparison of MAD Denoising Before and After. (a) Original point cloud data. (b) Cross−sectional effect diagram. (c) Comparison of denoised data and noise points. (d) Point cloud after denoising.
Step 2: Signal Transformation.
The surface of asphalt pavement exhibits an irregular and uneven profile, often regarded as a stationary random function along the surface distance [25]. Based on this assumption, signal transformation can be performed using Fourier Transform. Signal processing of three-dimensional data predominantly employs three methodologies: Fourier Transform, Wavelet Transform, and Hilbert–Huang Transform [21]. Among these, the Fourier Transform is the most widely utilized technique. In this study, signal transformation leverages Fourier Transform to convert three-dimensional spatial data into frequency domain data, serving as a preparatory step for the subsequent filtering and separation processes. Inverse Fourier Transform is then applied to revert the frequency domain data back to the spatial domain, facilitating parameter calculations and performance characterization after separation. Fourier Transform can be categorized into one-dimensional, two-dimensional, as well as continuous and discrete forms. This study employs the two-dimensional Discrete Fourier Transform (DFT) along with its inverse transform. Equation (4) represents the mathematical expression for the forward transform.
where: F(u,v) represents the frequency domain data obtained through discrete Fourier transformation; (u,v) denotes the horizontal coordinates in the transformed frequency domain; M and N refer to the number of rows and columns of texture data in the x and y directions, respectively; f(x,y) represents the texture data in the spatial domain; and (x,y) denotes the coordinates of the texture data in the spatial domain.
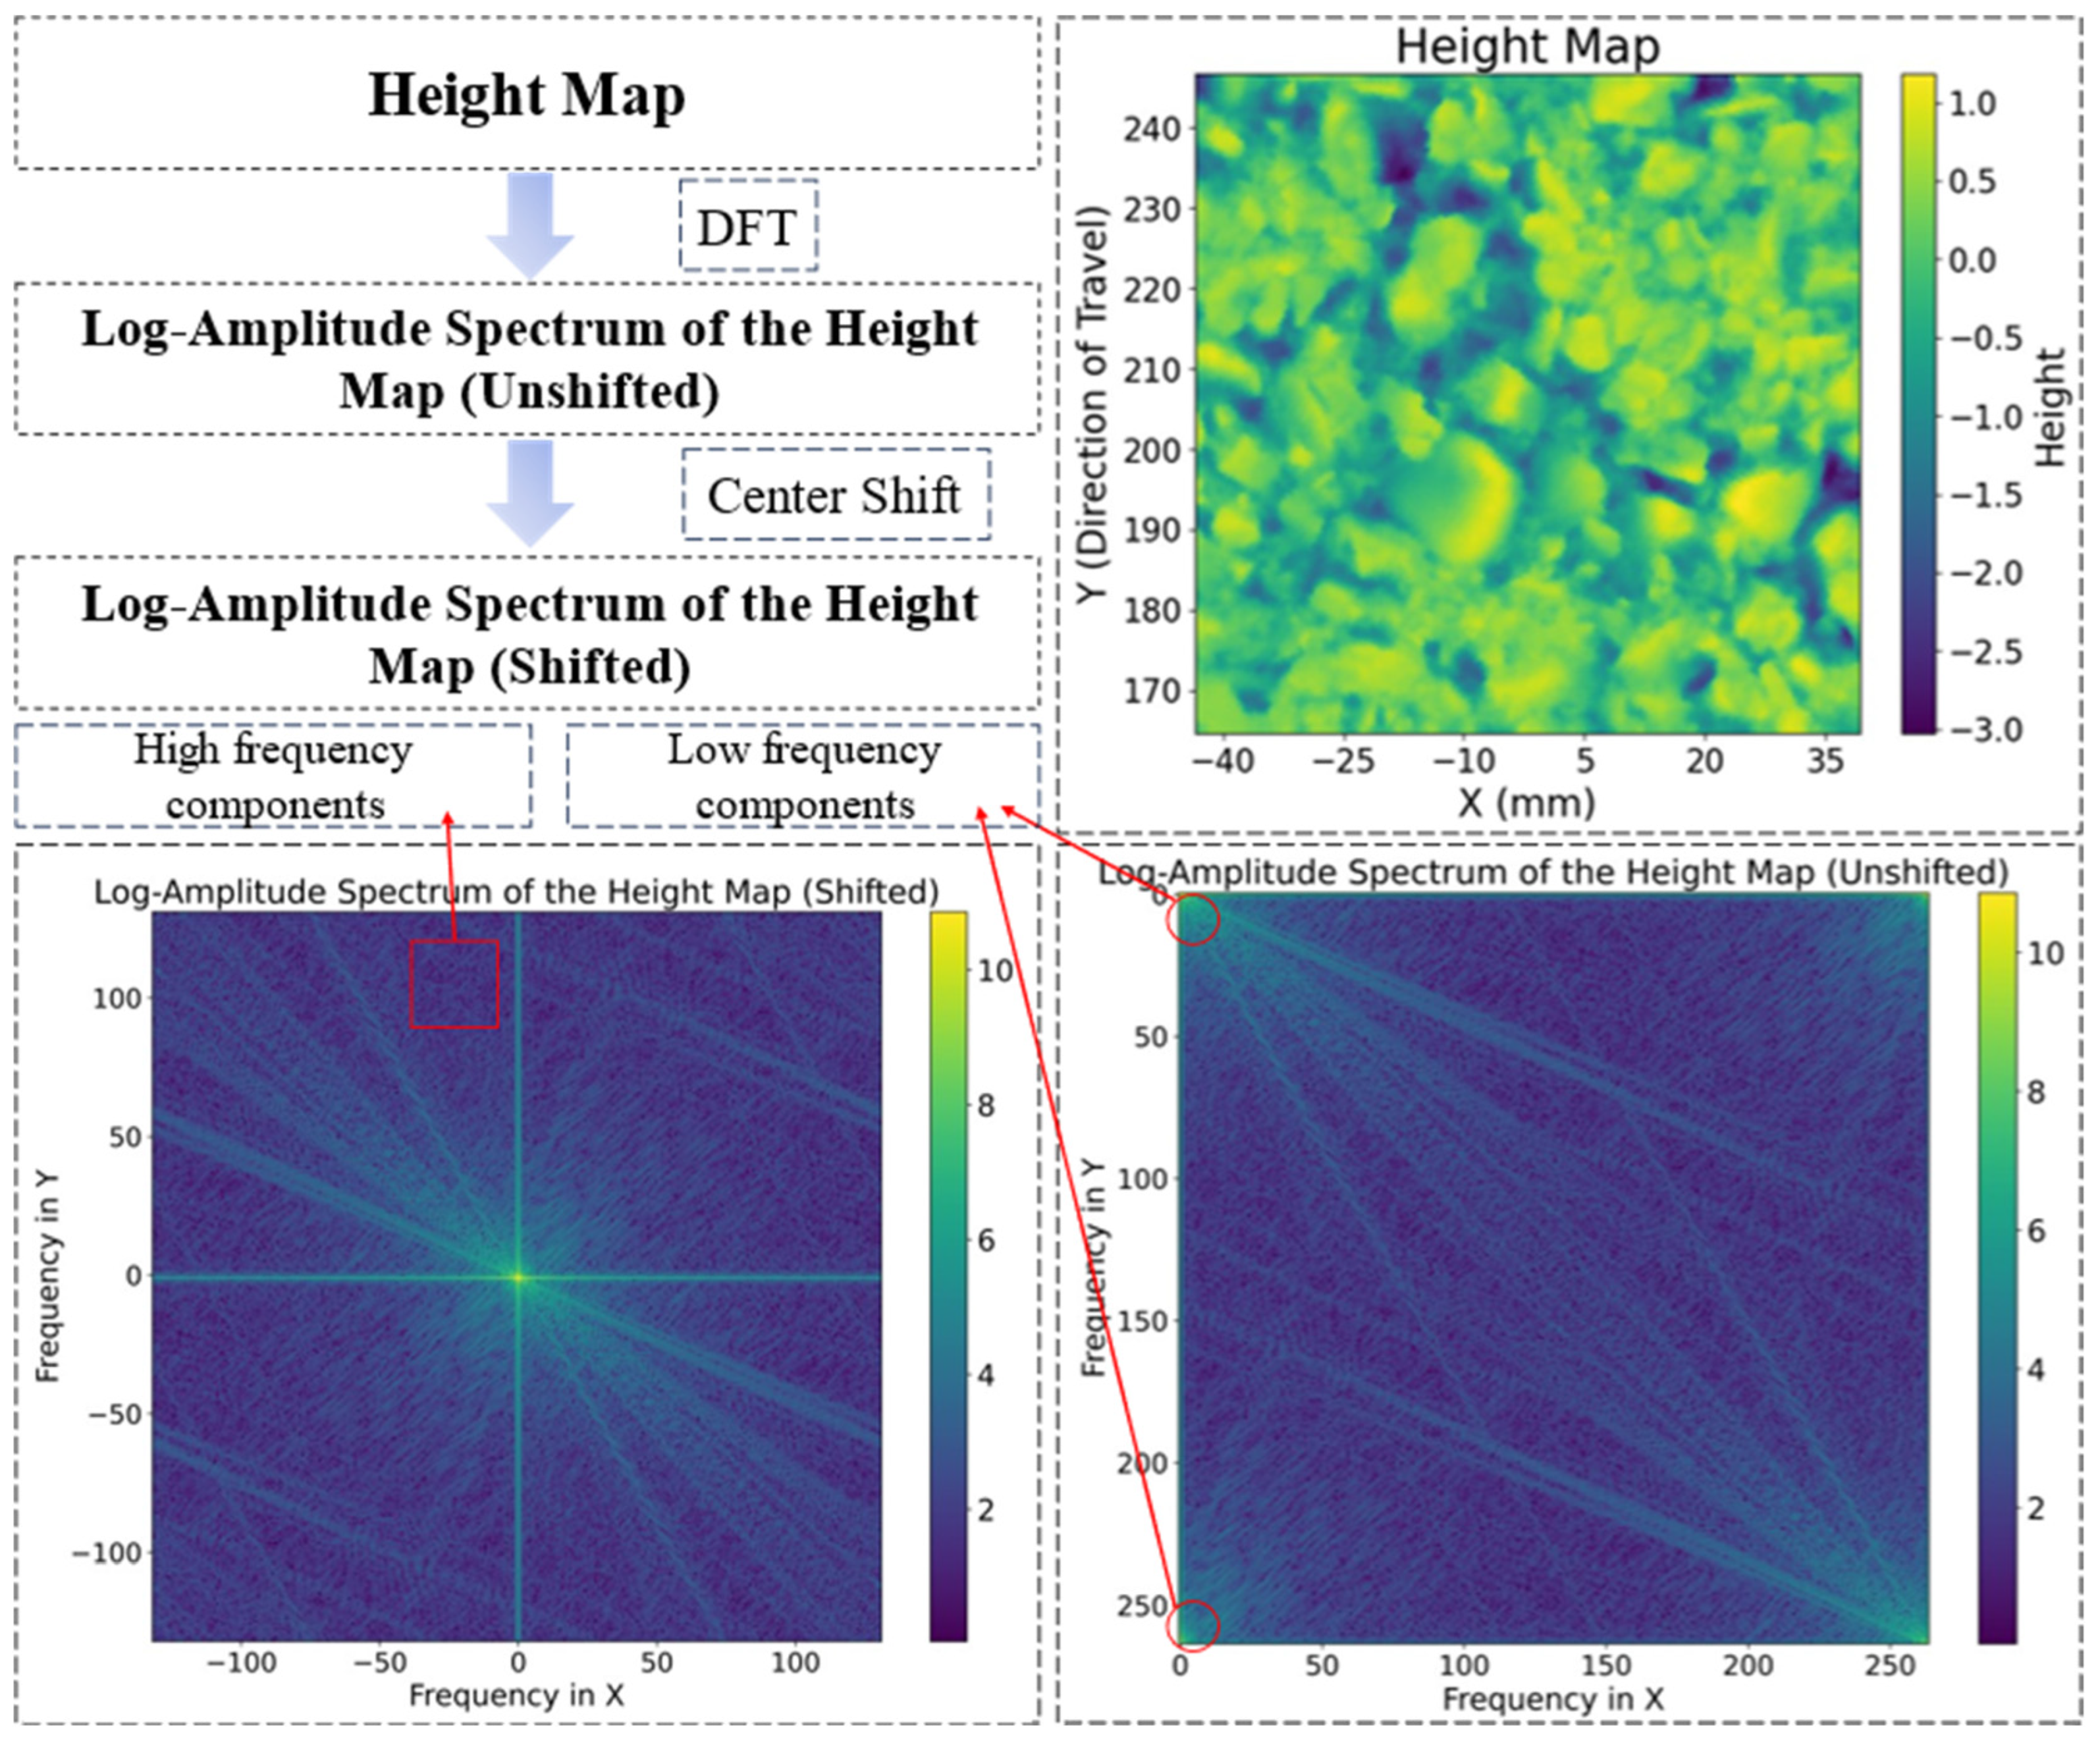
First, the denoised point cloud data must be formatted and converted into an input format suitable for Fourier transformation. Specifically, for irregular point cloud data, interpolation or gridding operations are required. The core steps are illustrated in Figure 7.
Figure 7.
Fourier Signal Transformation Diagram.
In this study, interpolation was employed to obtain a height matrix of the point cloud data, as illustrated in Figure 7 Height Map. Next, the height matrix is input into the discrete Fourier transformation algorithm. After the Fourier transformation, the logarithmic amplitude spectrum of the height matrix data is obtained, as shown in Figure 7 Log-Amplitude Spectrum of the Height Map (Unshifted). In the default layout of the discrete Fourier transformation implemented in computer languages, the direct current (DC) components are distributed at the edges. To enhance visual clarity and facilitate observation of the transformations, a translation operation is applied to reposition the low-frequency components—originally located at the edges—to the center of the M × N spectrum. This adjustment makes the Fourier spectrum more visually interpretable. In the spectrum, the low-frequency components correspond to macro-texture, while the high-frequency components represent micro-texture. From the spectrum, it is evident that the highlighted green macro-textures dominate, a finding corroborated by the height matrix image. Additionally, the clear separation between macro and micro textures facilitates subsequent processing steps for their individual analysis.
Step 3: Filtering and Separation.
The Butterworth filter is a classic filtering method commonly utilized in four configurations: band-pass, band-stop, low-pass, and high-pass. These configurations are particularly effective for separating macro- and micro-textures in the frequency domain, as achieved in preceding work. This study specifically designed Butterworth band-pass and high-pass filters. The band-pass filter allows signals with frequencies below the upper cutoff and above the lower cutoff to pass through, while the high-pass filter permits only signals exceeding the designated cutoff frequency to pass. Using inverse discrete Fourier transformation (IDFT), the filtered frequency-domain signals were transformed back into the spatial domain, resulting in separated spatial matrices for macro- and micro-textures. Equations (5) and (6) represent the transfer functions of the Butterworth band-pass and high-pass filters, respectively, while Equation (7) denotes the formula for the inverse discrete Fourier transformation.
where: D(u,v) represents the distance from point, (u,v) to the center in the frequency domain, D0 is the cutoff frequency, and n denotes the order of the filter.
By appropriately configuring the Butterworth band-pass filter, frequency components within the defined high and low cutoff frequencies are effectively extracted, representing the macro-texture domain. This study employs a 12th-order Butterworth filter with cutoff frequencies set at 1600 and 16, aligning with the typical macro-texture wavelength range of 0.5 mm to 50 mm. The residual high-frequency components, obtained by subtracting the macro-texture signal from the original data, are further processed using a high-pass filter with a cutoff frequency index of 16 to extract micro-texture data. Notably, these cutoff frequencies are not directly derived from physical wavelengths but are expressed as frequency indices in the Fourier transform spectrum. These indices are relative to the input data’s frequency domain and are fundamentally dependent on the spatial resolution of the sampling equipment and the number of data points. To ensure optimal filtering, they are precisely computed. Given the uniform sampling and subsequent square cropping of the test region, the ratio between the number of data points and the measured area remains fixed. The spatial sampling rate is determined by dividing the total number of data points in the X or Y direction by the corresponding measured length, allowing for accurate calculation of the cutoff frequency indices in the Fourier spectrum. Equation (8) provides the mathematical formulation based on the discrete Fourier transform (DFT).
where: f1 represents the frequency index, which denotes the corresponding cutoff frequency position within the Fourier spectrum. L refers to the actual measured length of the sampling region in the respective direction, while λ denotes the wavelength of the texture to be separated.
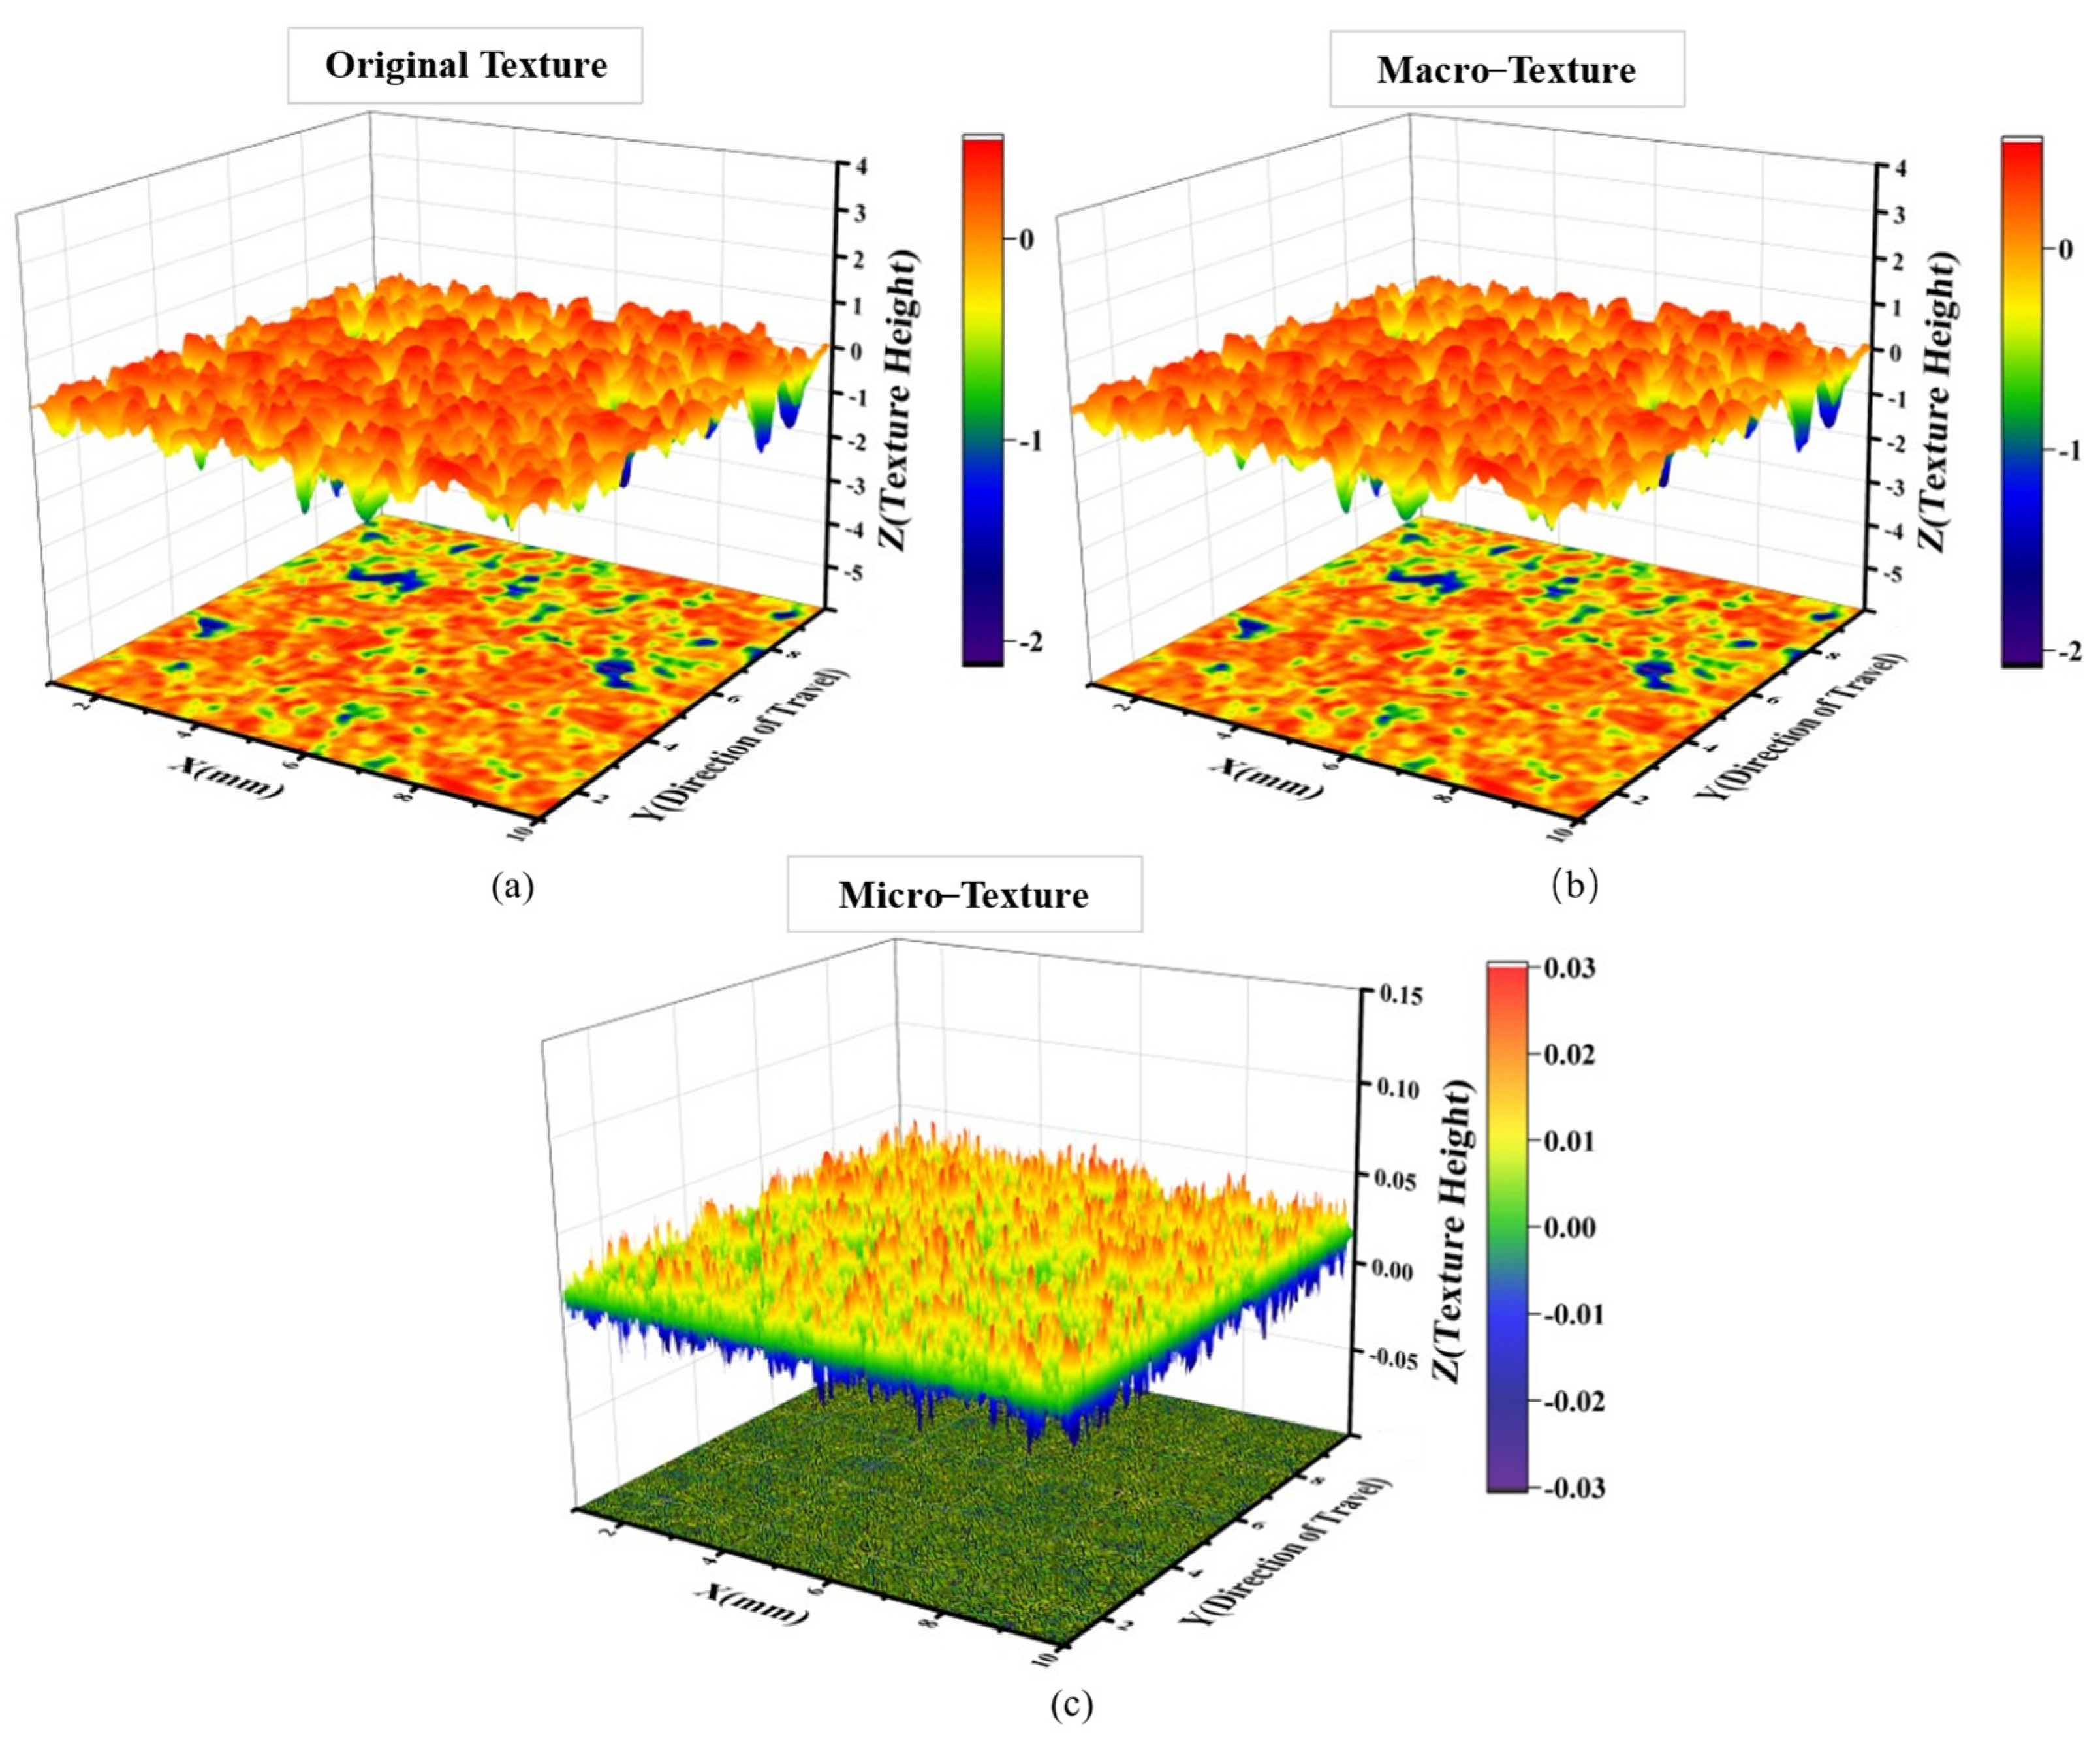
Since the scanning device in this study operates at a fixed spatial resolution and the scanned area dimensions are predetermined, the cutoff frequency indices are derived by converting the physical scanning region to the required texture scale. This ensures the selected indices accurately reflect pavement texture while maintaining dataset consistency. The computed indices of 1600 and 16 correspond to the lower (0.5 mm) and upper (50 mm) bounds of the macro-texture scale, capturing its full range. Setting the cutoff frequencies this way optimizes macro- and micro-texture separation, ensuring accuracy and efficiency. This methodological refinement provides a robust foundation for analyzing texture characteristics and their correlation with pavement skid resistance, offering deeper insights into surface texture’s impact on traction and road safety. Finally, the separated macro- and micro-texture signals are transformed back into the spatial domain via inverse discrete Fourier transformation (IDFT), yielding the extracted textures. Data visualization was performed using Origin software (OriginPro 2025 (Student Version)): Figure 8a presents the original pavement texture, Figure 8b the macro-texture, and Figure 8c the micro-texture.

Figure 8.
Texture Comparison Before and After Separation. (a) Original Texture. (b) Macro Texture. (c) Micro Texture.
3. Results and Discussion
3.1. Pavement Texture Characterization and Separation Outcomes
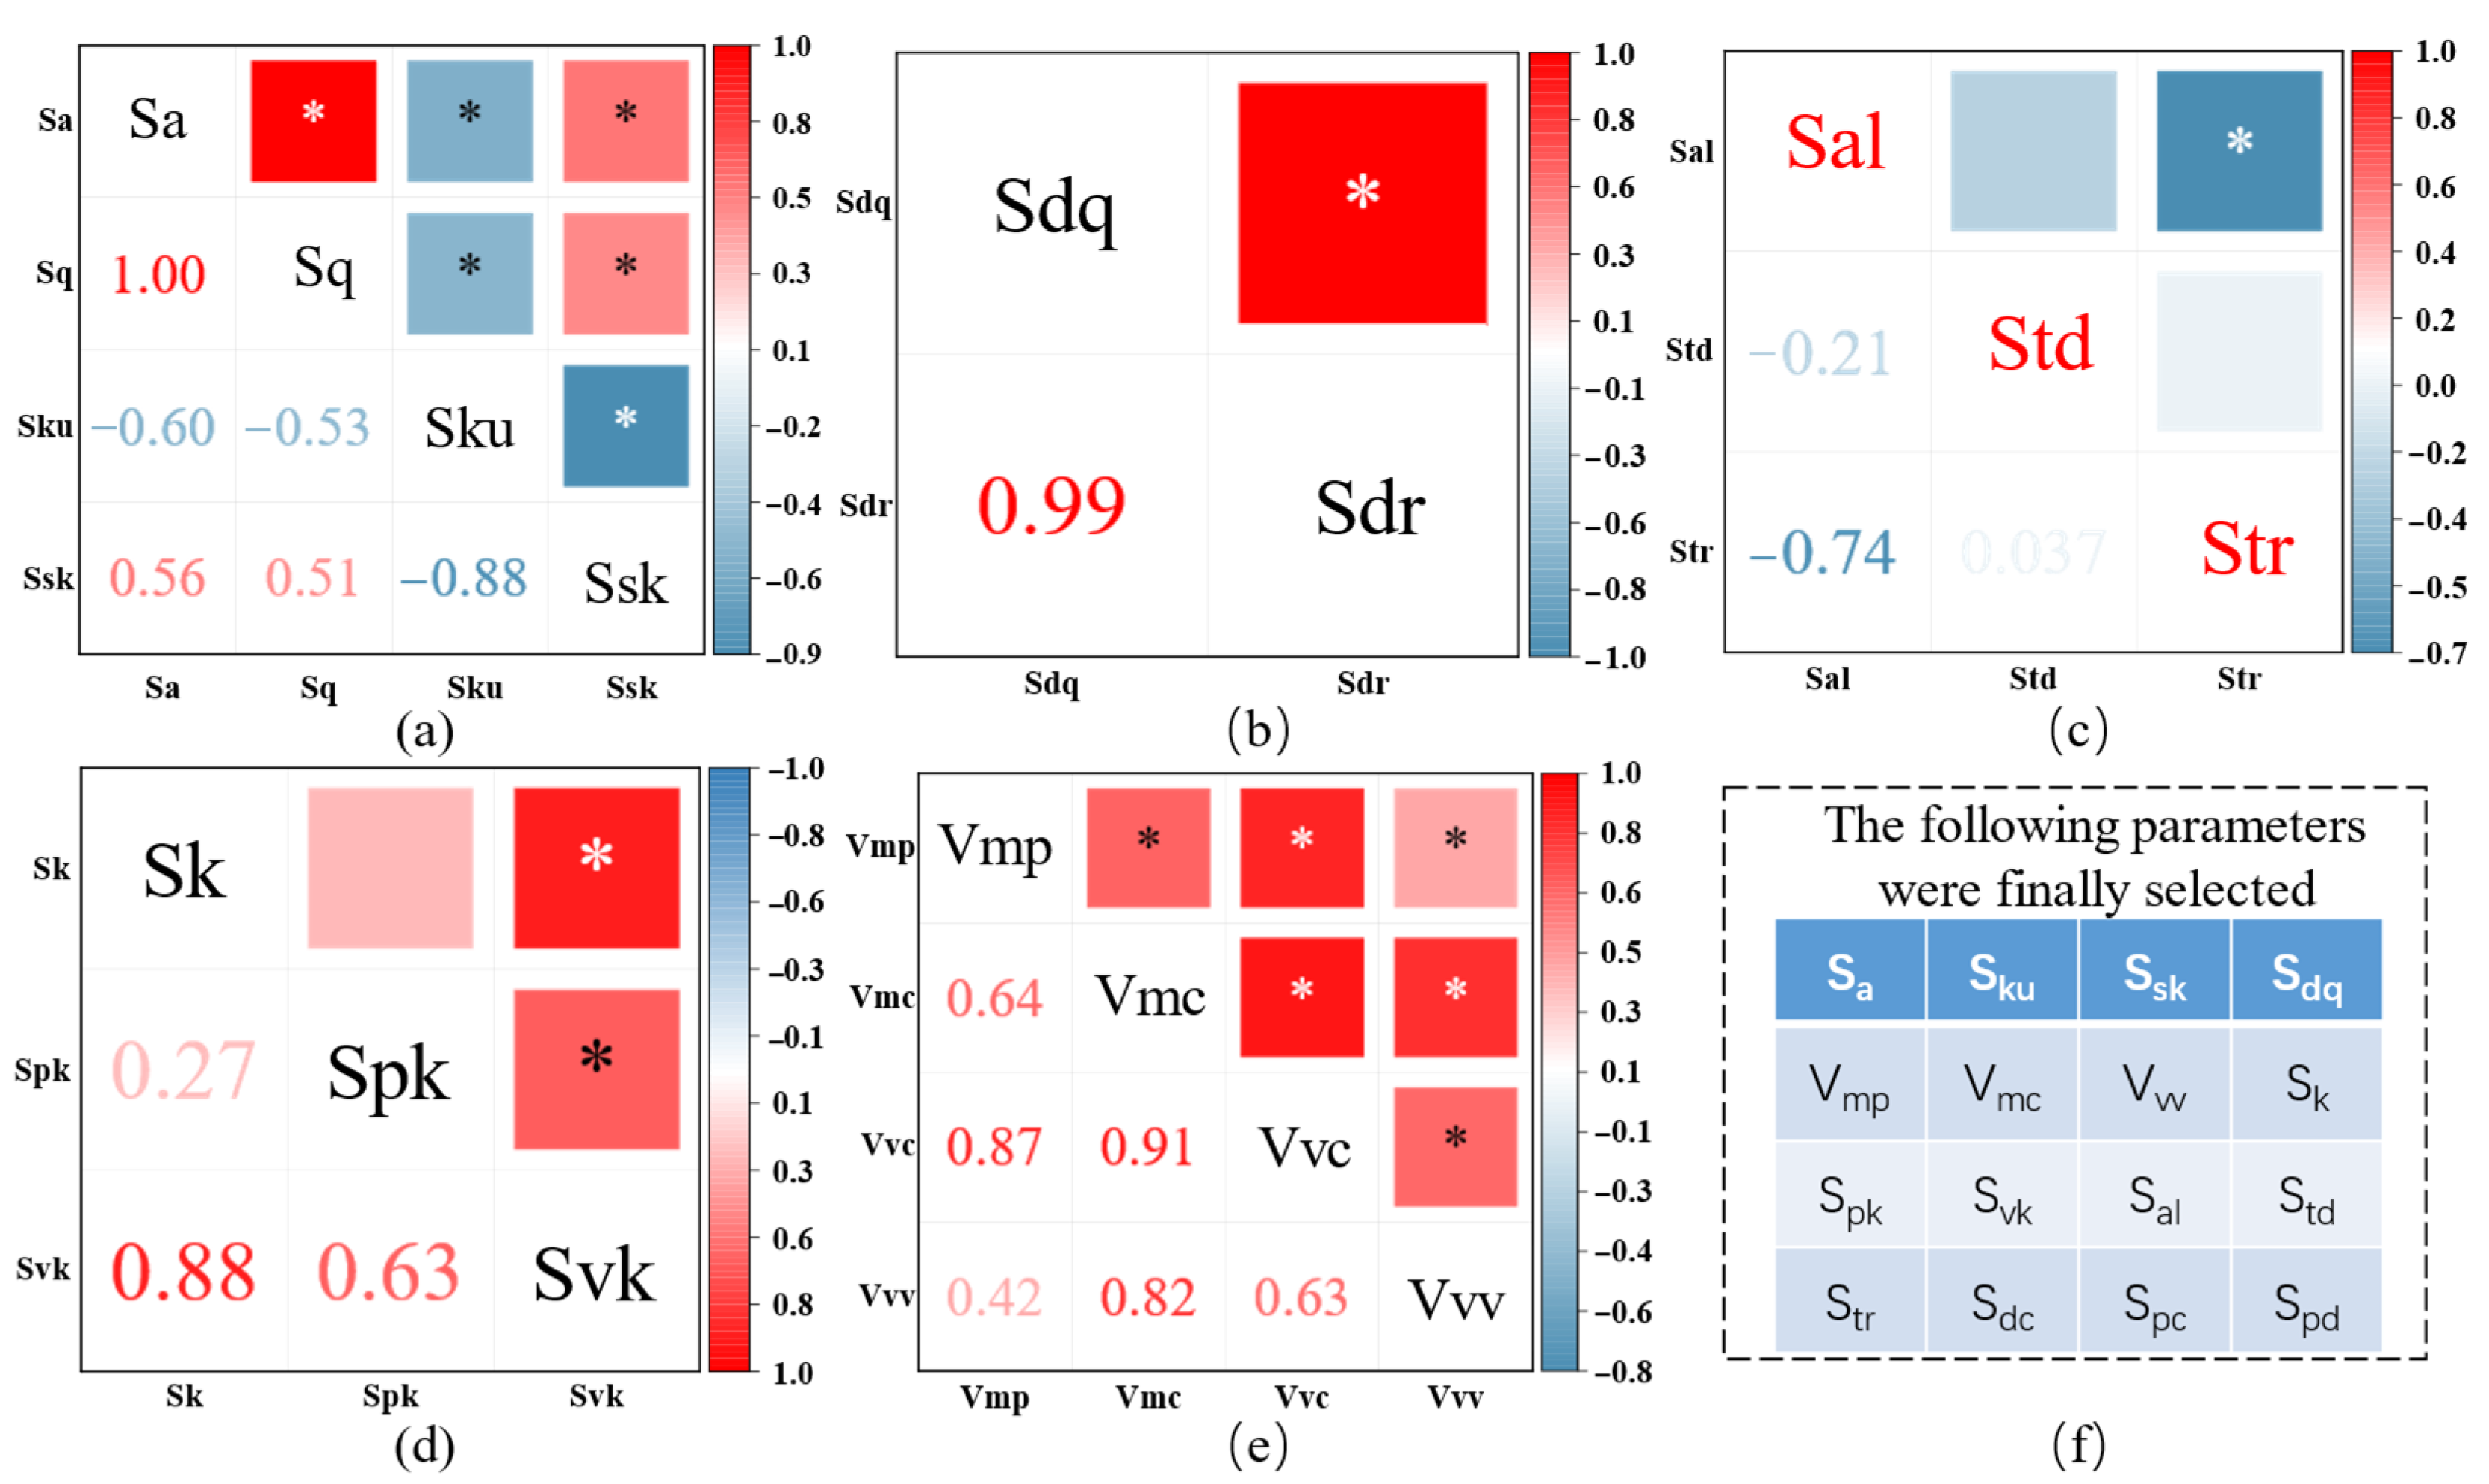
To characterize the surface features and skid resistance of asphalt pavements, the study initially proposed 19 parameters, which were categorized into seven subgroups. To ensure that multiple parameters within the same category do not redundantly represent texture characteristics, collinearity analysis was employed. This method selected one representative parameter from each subgroup to minimize redundancy and enhance parameter effectiveness. The material ratio parameter Sdc was considered an independent parameter and included in the final selection because it is the sole parameter in its category. Additionally, two morphological parameters from the second subgroup were directly included in the final parameter set due to the subjective nature of their definitions and computational methods, which precluded further subdivision.
Figure 9 presents the results of the Pearson correlation analysis conducted on the remaining 16 parameters, grouped by their respective categories, and highlights the final selection of representative parameters. At a 95% confidence level, significant correlations were observed. Among five of the six subgroups (excluding Figure 9f), strong correlations were identified between Sa and Sq, Vmc and Vvc, and Sdq and Sdr, with correlation significance exceeding 90%. Consequently, one parameter from each pair was retained as the representative feature for its category. Figure 9f lists the final set of parameters capable of comprehensively characterizing the texture performance of asphalt pavements. The asterisk (*) indicates a p-value less than 0.05.
Figure 9.
Autocorrelation Screening of Parameters in the Same Category. (a) Screening of Height Parameters. (b) Screening of Volume Parameters. (c) Screening of Hybrid Parameters. (d) Screening of Stratified Parameters. (e) Screening of Mixed Parameters. (f) Final Selected Parameter.
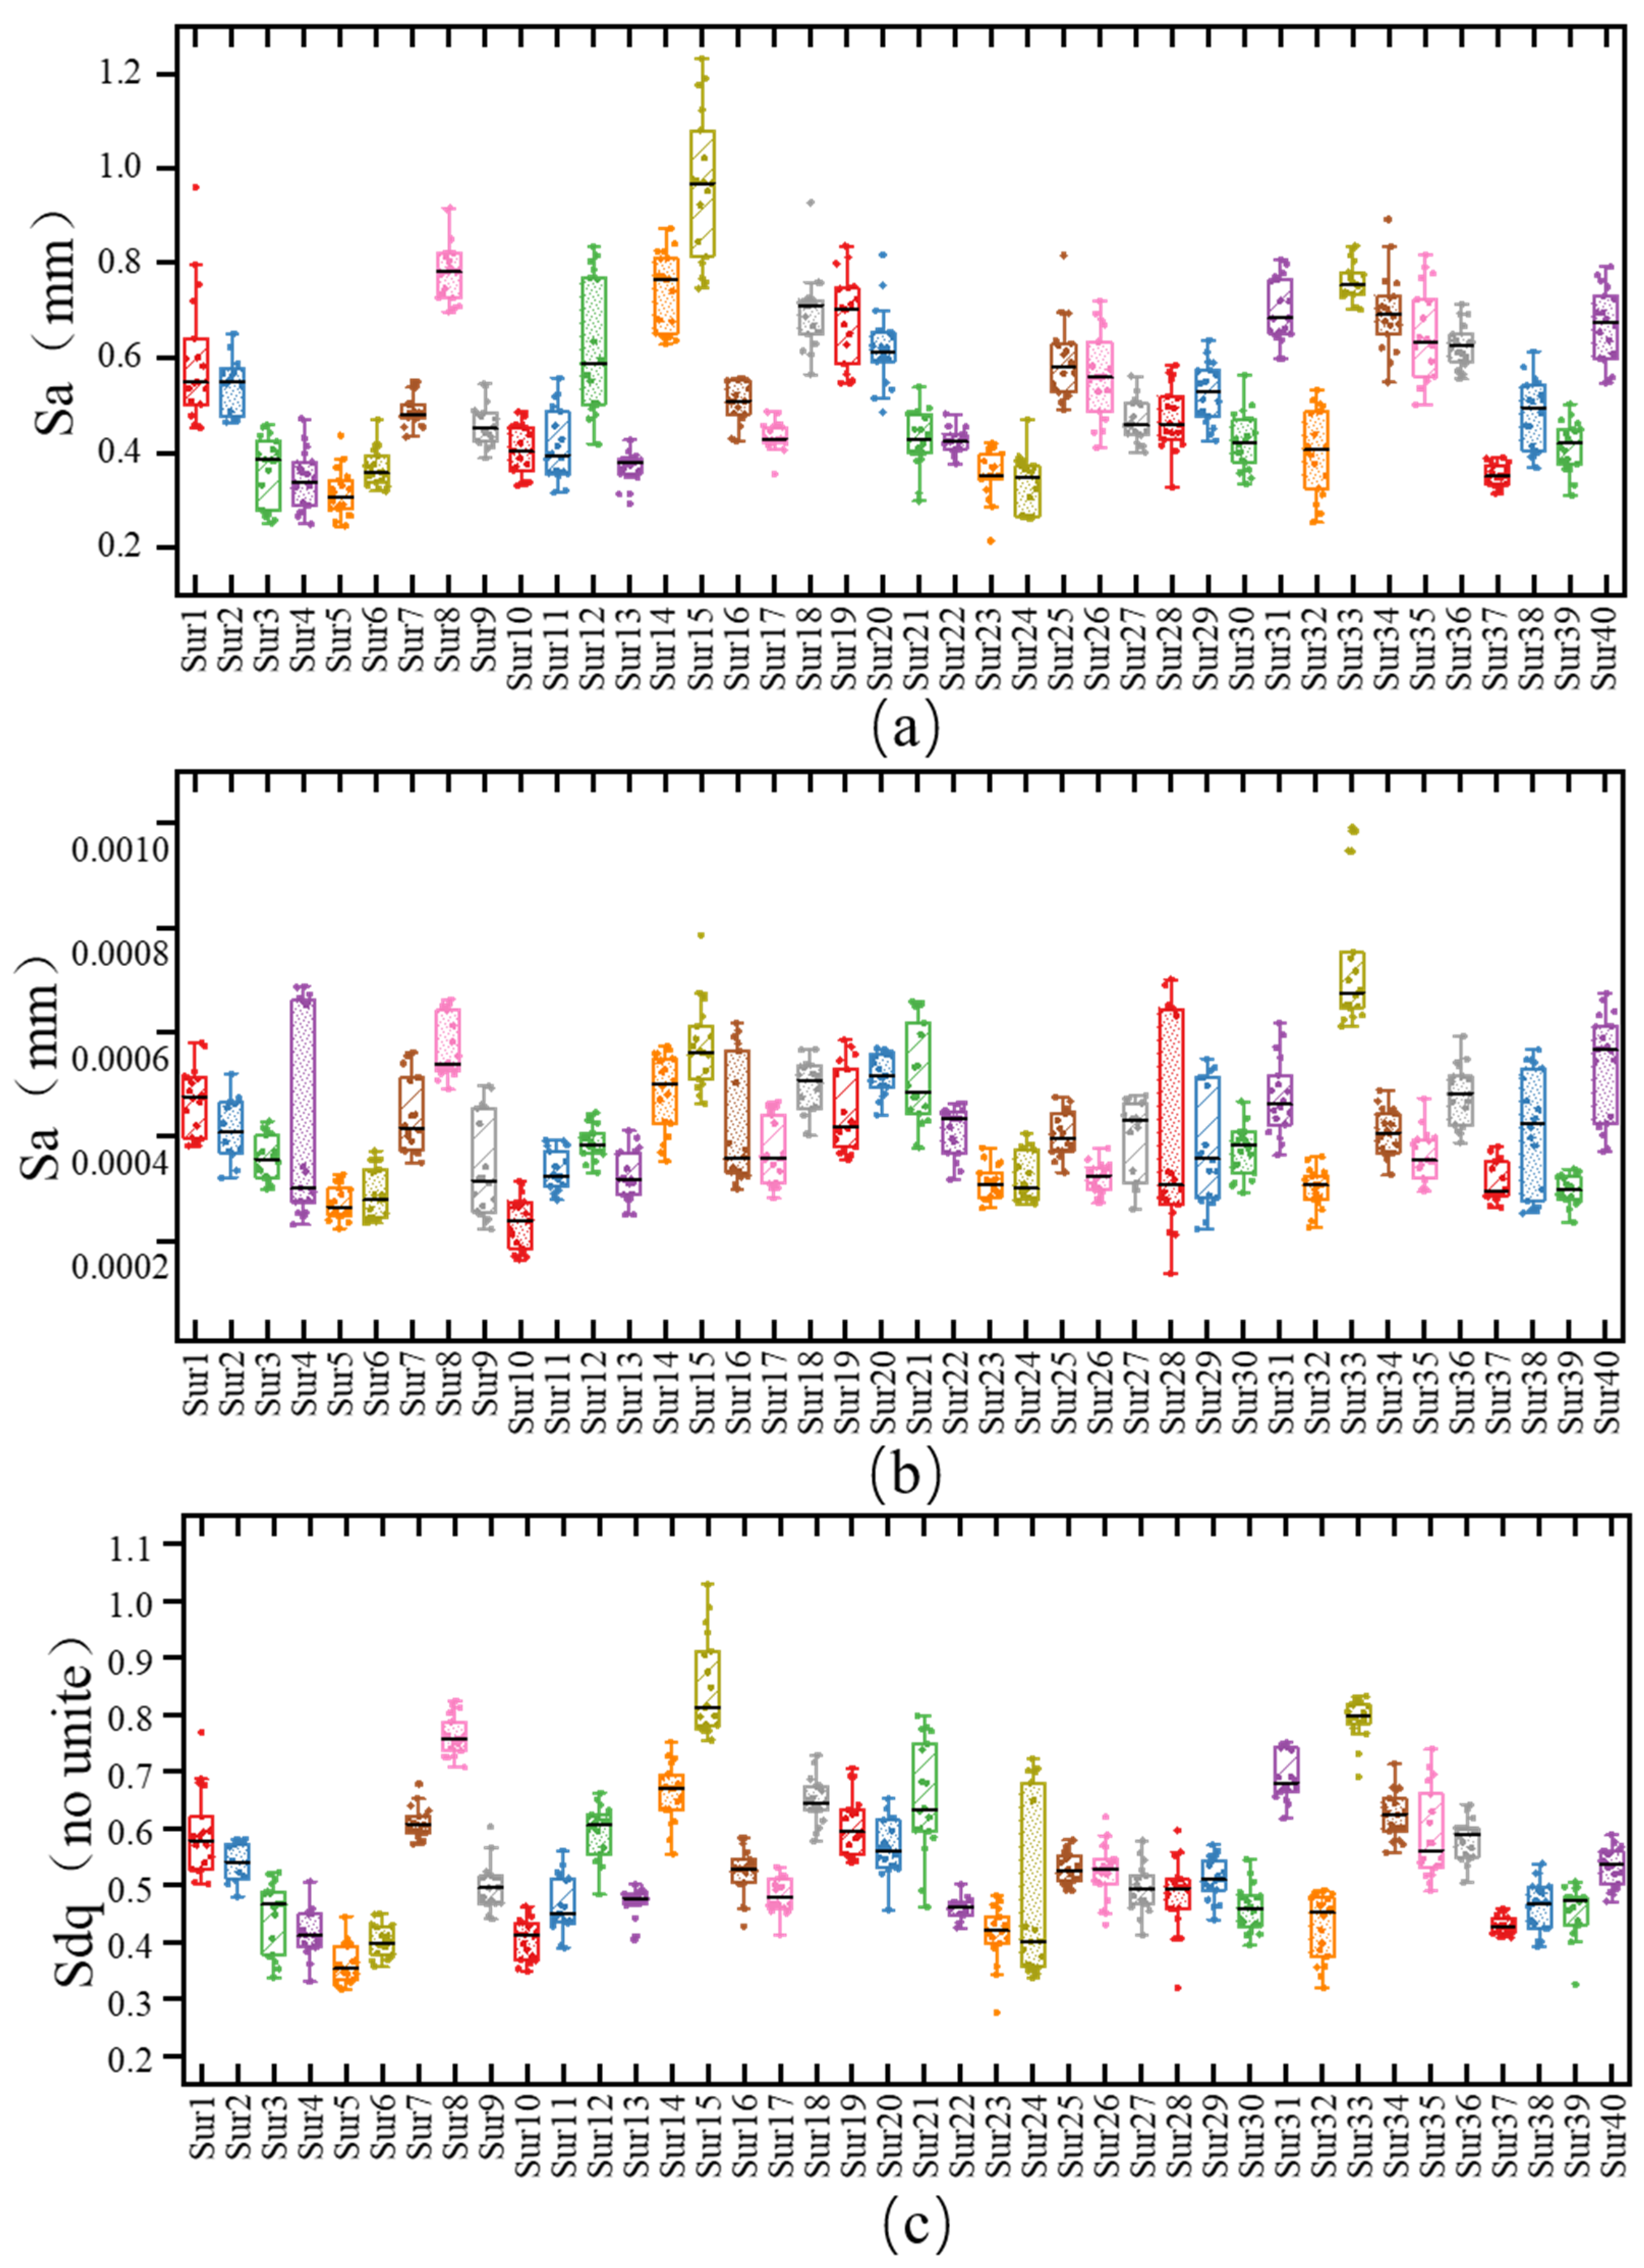
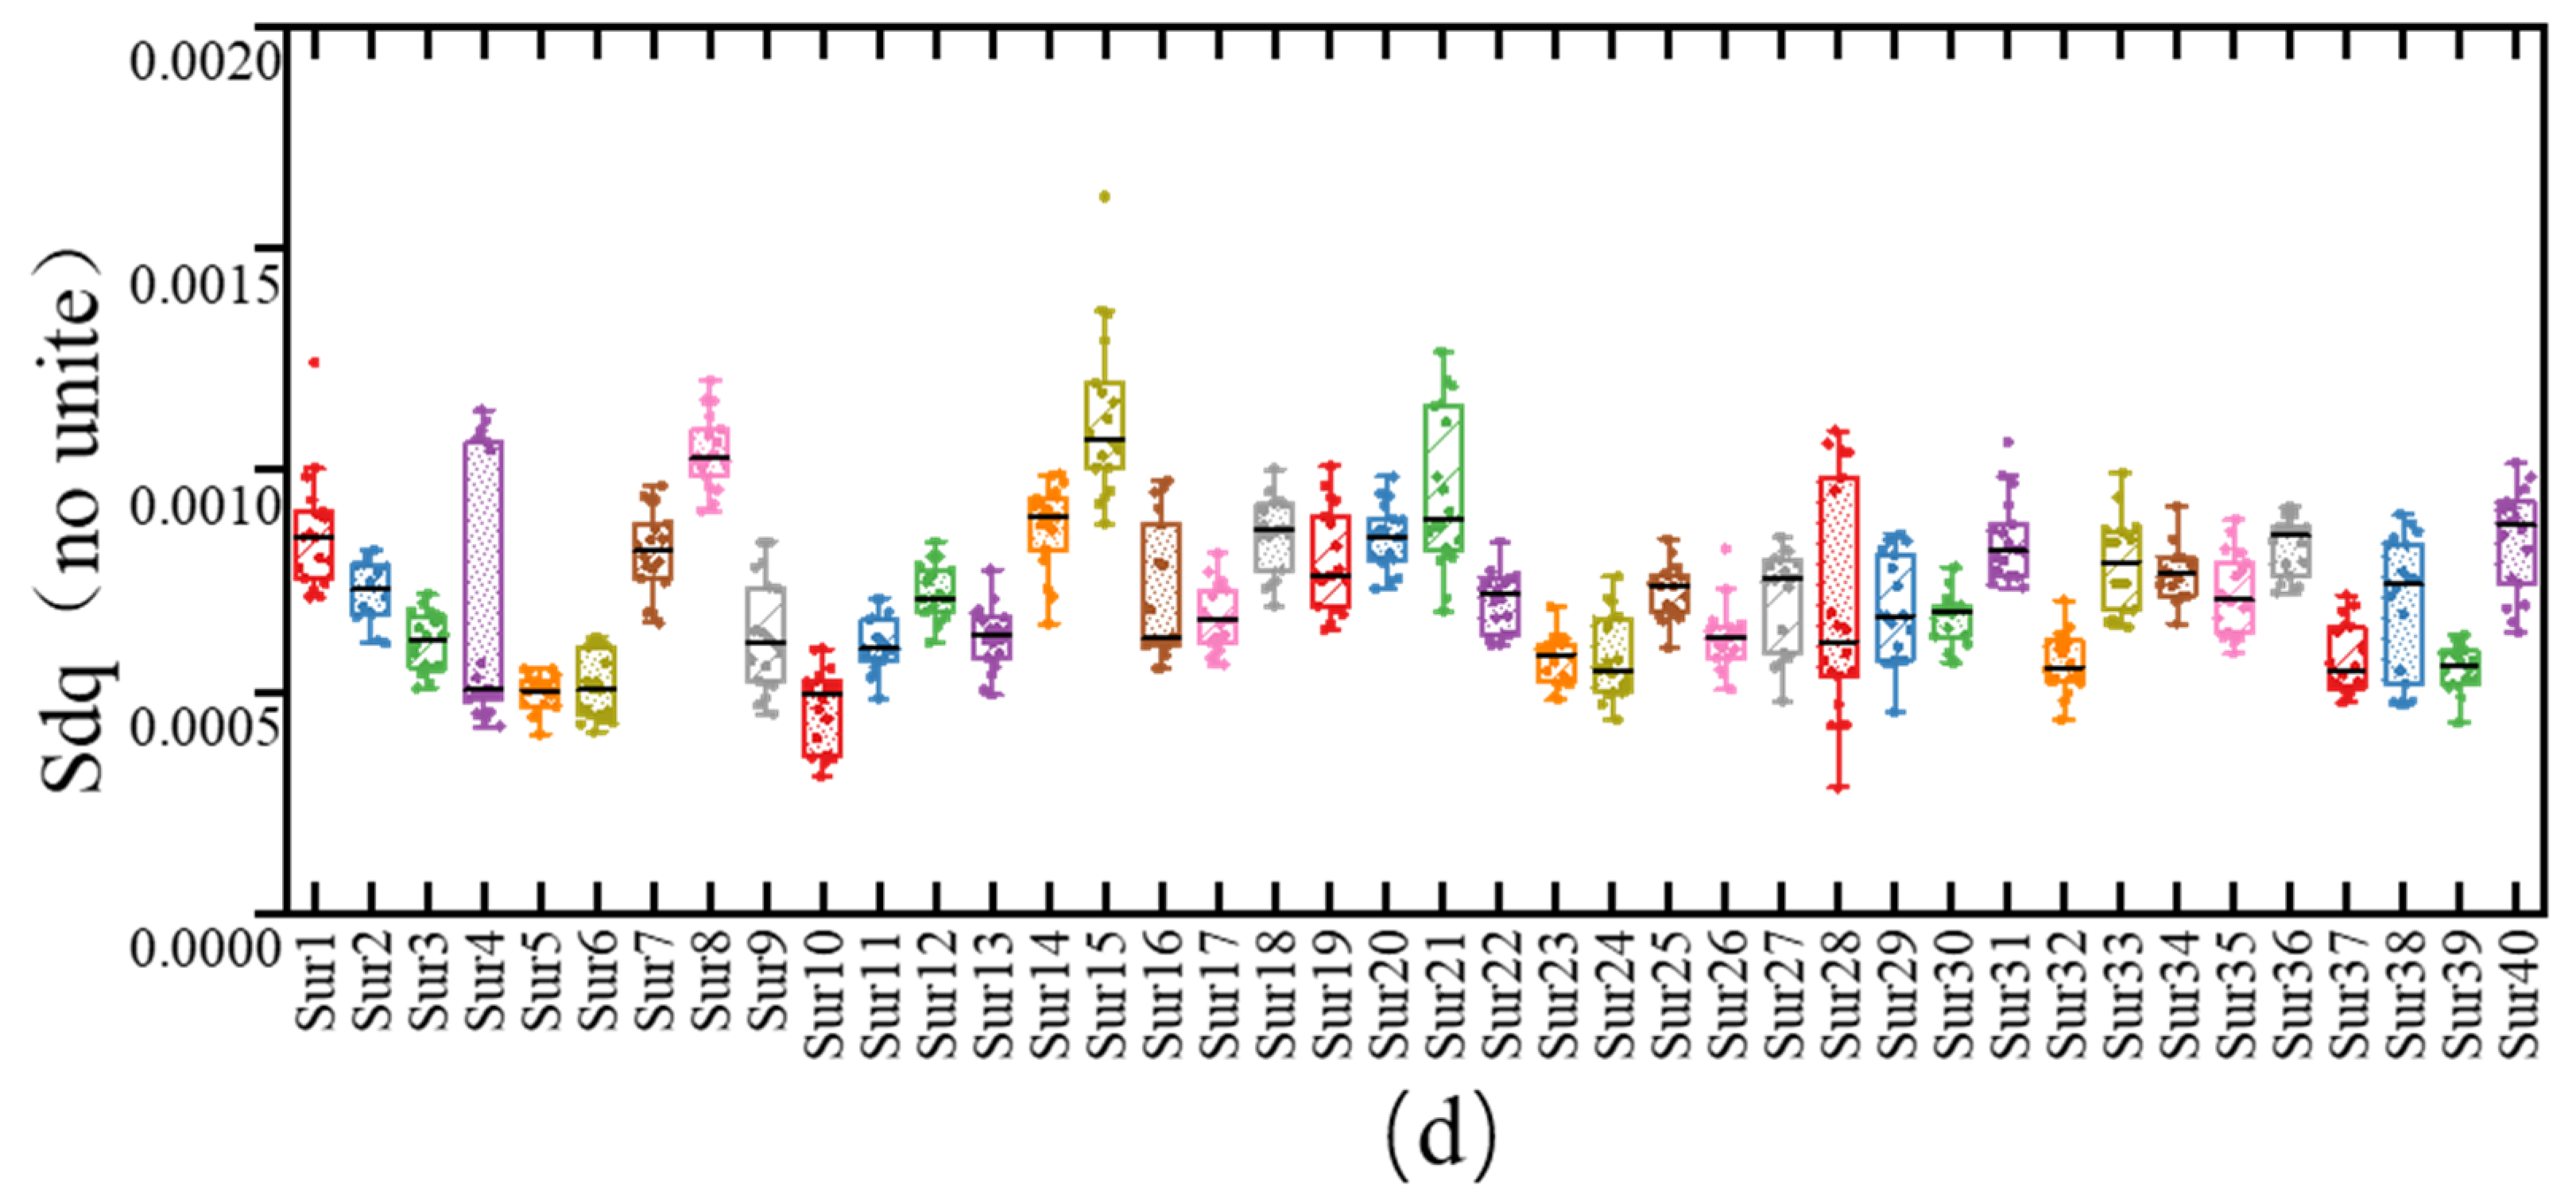
Using the three-dimensional texture data of asphalt pavement obtained from the previous scanning as the research object, this study characterizes the texture features of asphalt pavement based on the aforementioned 16 parameters. The relationship between three-dimensional texture parameters and skid resistance is explored by correlating these parameters with dry and wet friction coefficients. The texture characterization employs data from the separated macro- and micro-texture layers and utilizes the calculation methods outlined in the previous table to compute the three-dimensional parameters for 40 measured road segments. Due to the large number of parameters and extensive sample data, the paper presents the computation results for a selection of representative parameters. Figure 10 compares the calculation results of identical parameters for macro and micro textures. In the figure, (a) and (c) represent the macro-texture parameter results, while (b) and (d) correspond to the micro texture parameter results. However, aside from differences in magnitude, the comparison at these two scales provides limited additional information. To address this, a combined analysis is conducted by correlating macro-texture data and micro-texture data with dry and wet friction coefficients, respectively. This approach facilitates a more comprehensive understanding of pavement skid resistance and enables an effective evaluation of its skid performance.
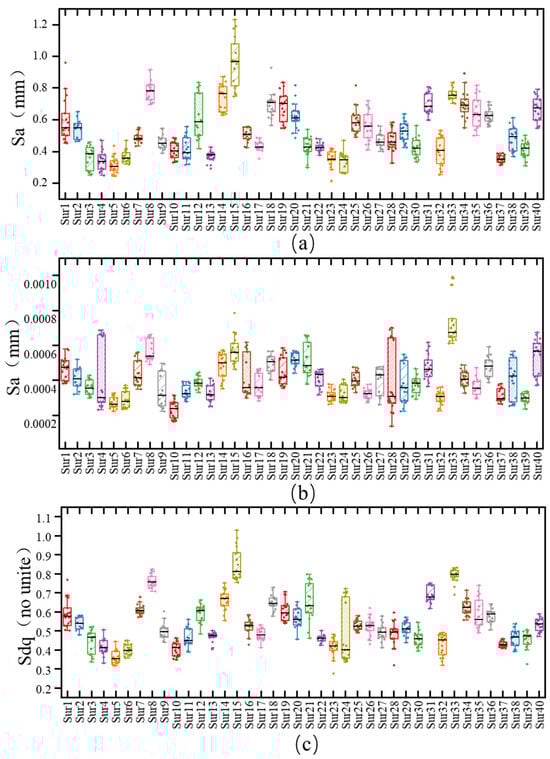

Figure 10.
Calculation Data for Selected Macro- and Micro-Texture Parameters. (a) Macro Sa Data. (b) Micro Sa Data. (c) Macro Sdq Data. (d) Micro Sdq Data.
3.2. Impact of Macro-Texture on Dry and Wet Friction Coefficients
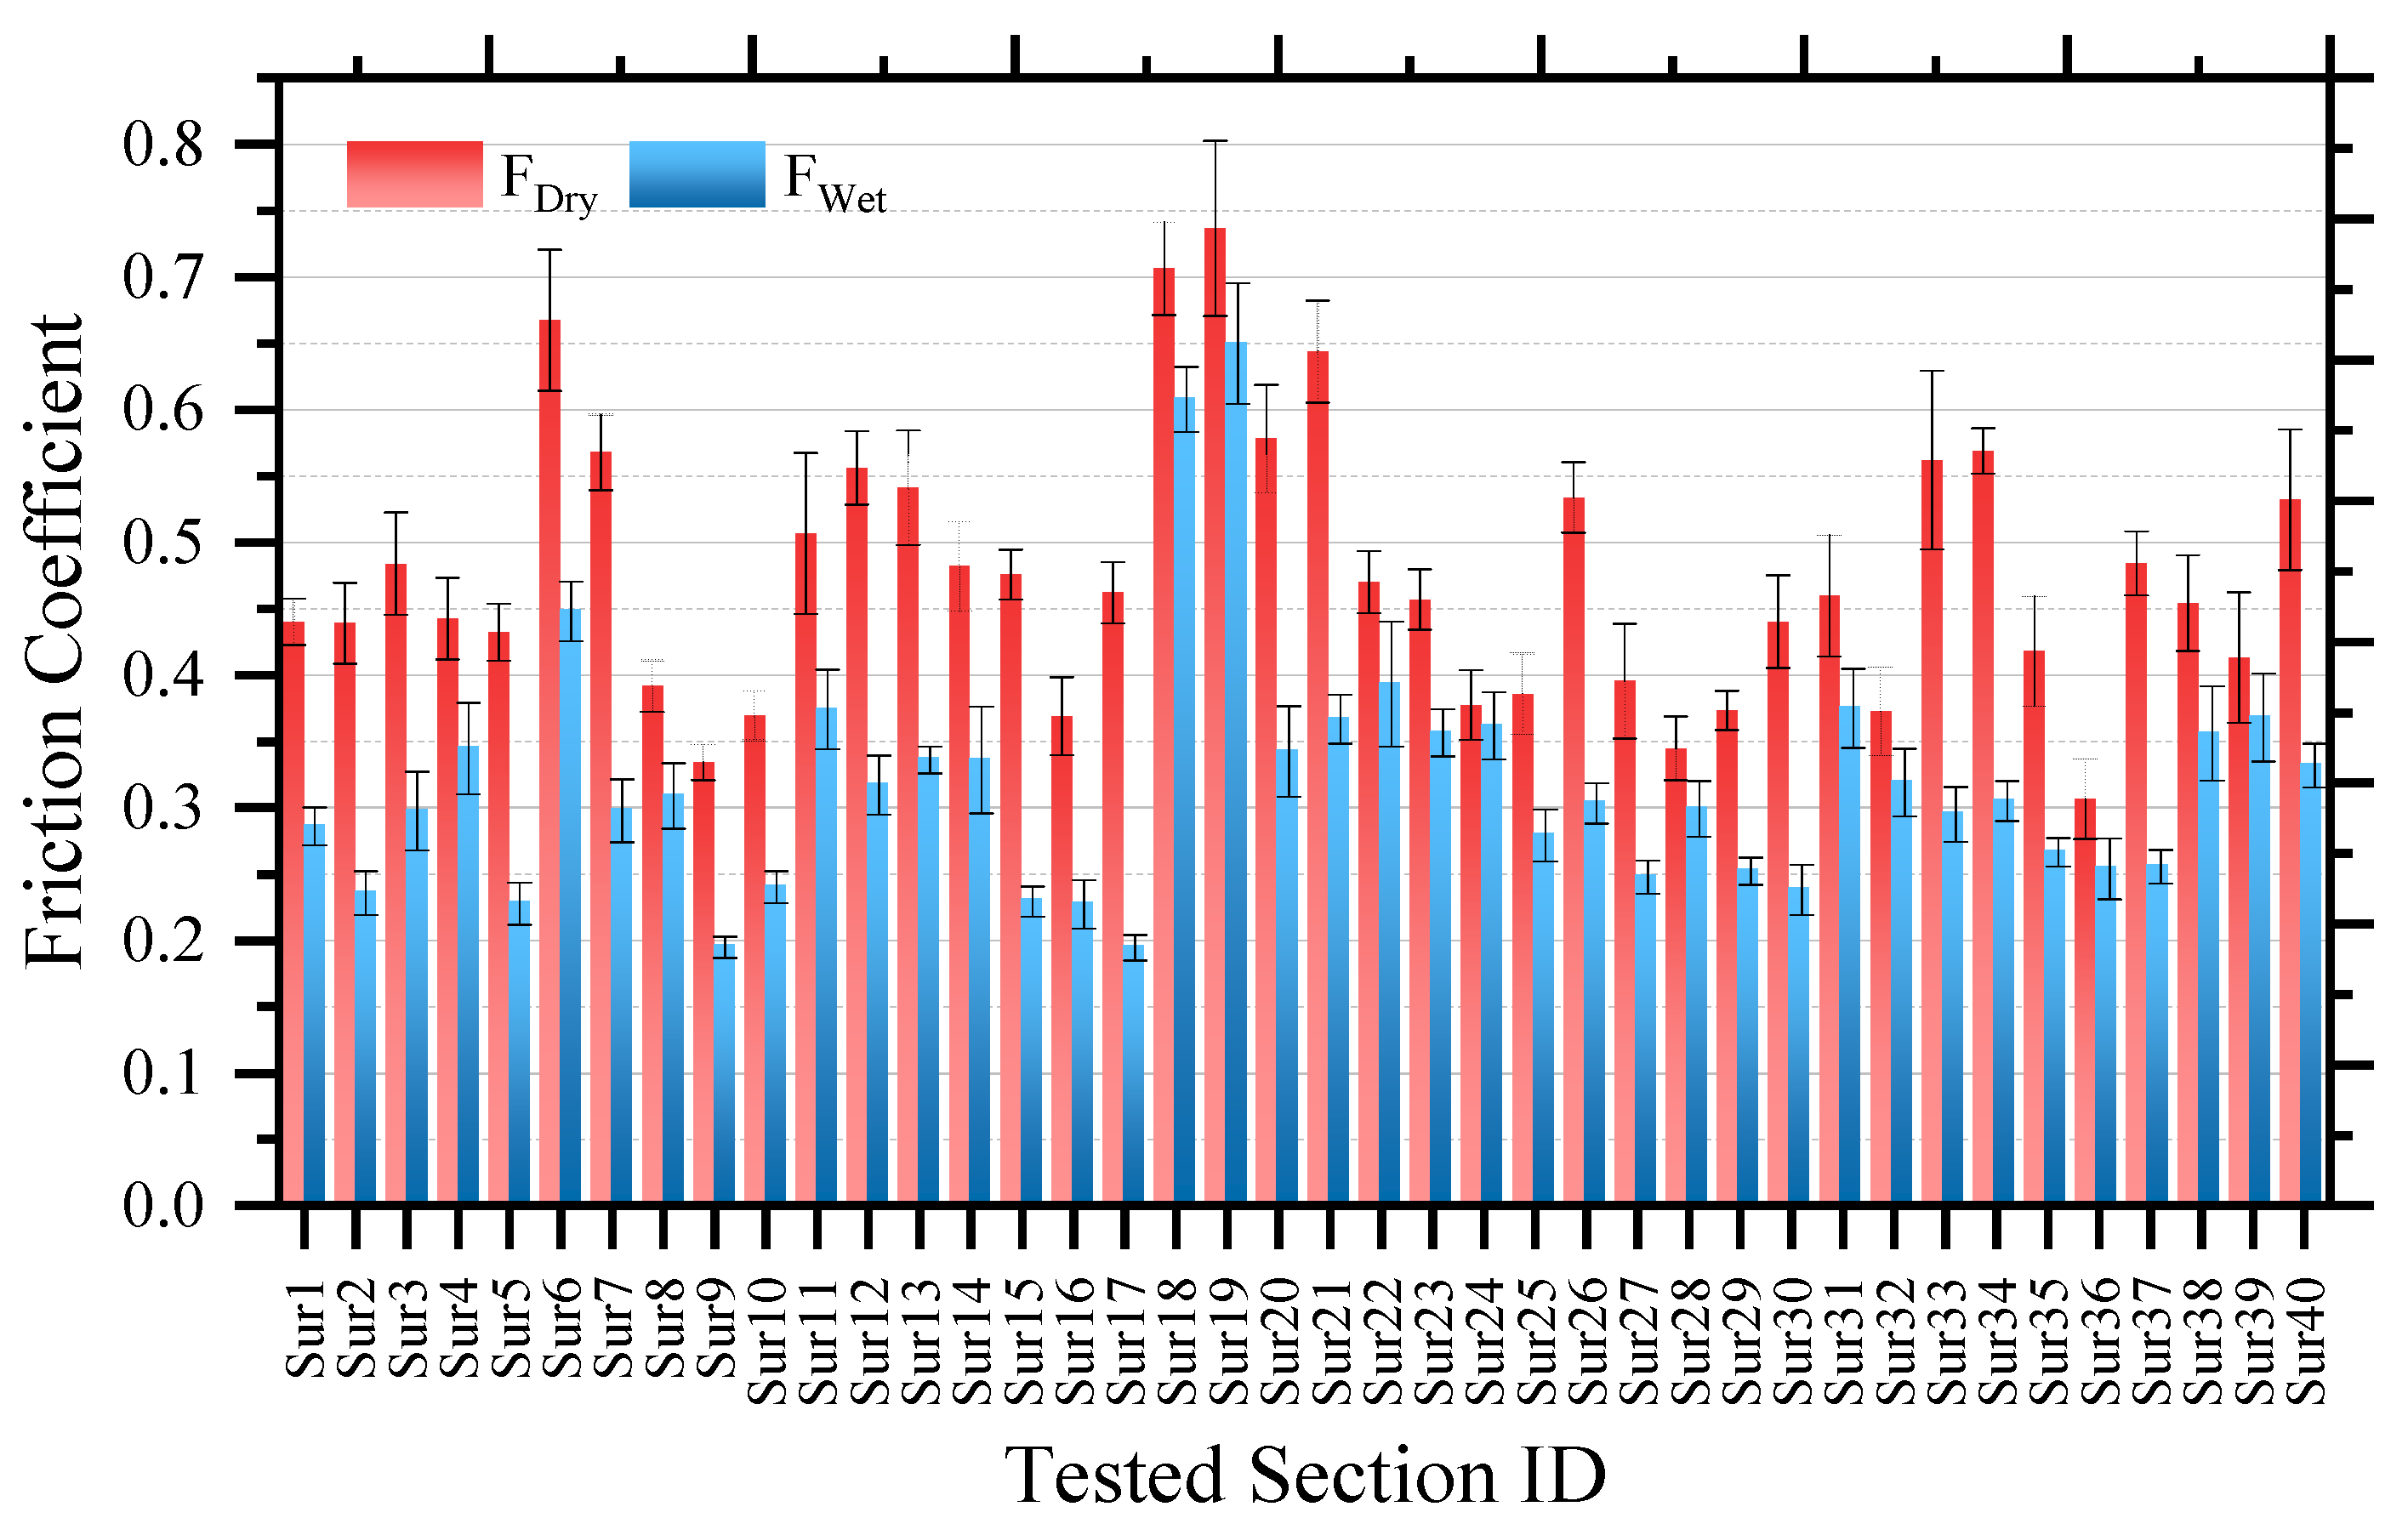
Figure 11 summarizes the friction coefficients of all tested road segments under dry and wet conditions. The X-axis represents the identifiers of the tested segments, while the Y-axis indicates the magnitude of the friction coefficients. The dry and wet friction coefficients are denoted as FDry and FWet, respectively. As observed in Figure 11, the dry friction coefficients of all tested segments consistently exceed their wet counterparts. This trend aligns with the expected relationship between texture size and friction performance: dry friction coefficients typically reflect the skid resistance associated with larger macro-texture features, whereas wet friction coefficients are more indicative of the influence of finer micro-texture features. This outcome is consistent with established knowledge in the field. Additionally, the figure highlights a significant disparity between the dry and wet friction coefficients for the tested segments, revealing that the skid resistance of these pavements is considerably affected by the water film present during wet conditions. This results in a marked reduction in skid resistance under wet conditions compared to dry conditions, corroborating findings from previous studies in the field.
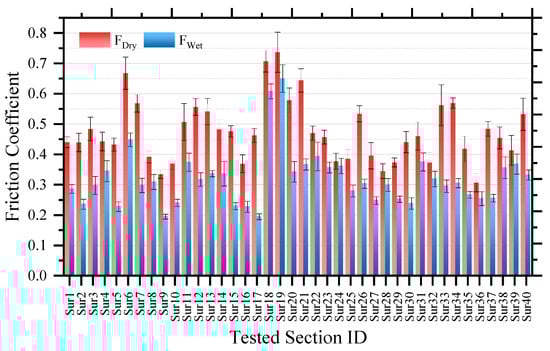
Figure 11.
Friction Coefficients of Tested Sections under FDry and FWet Conditions.
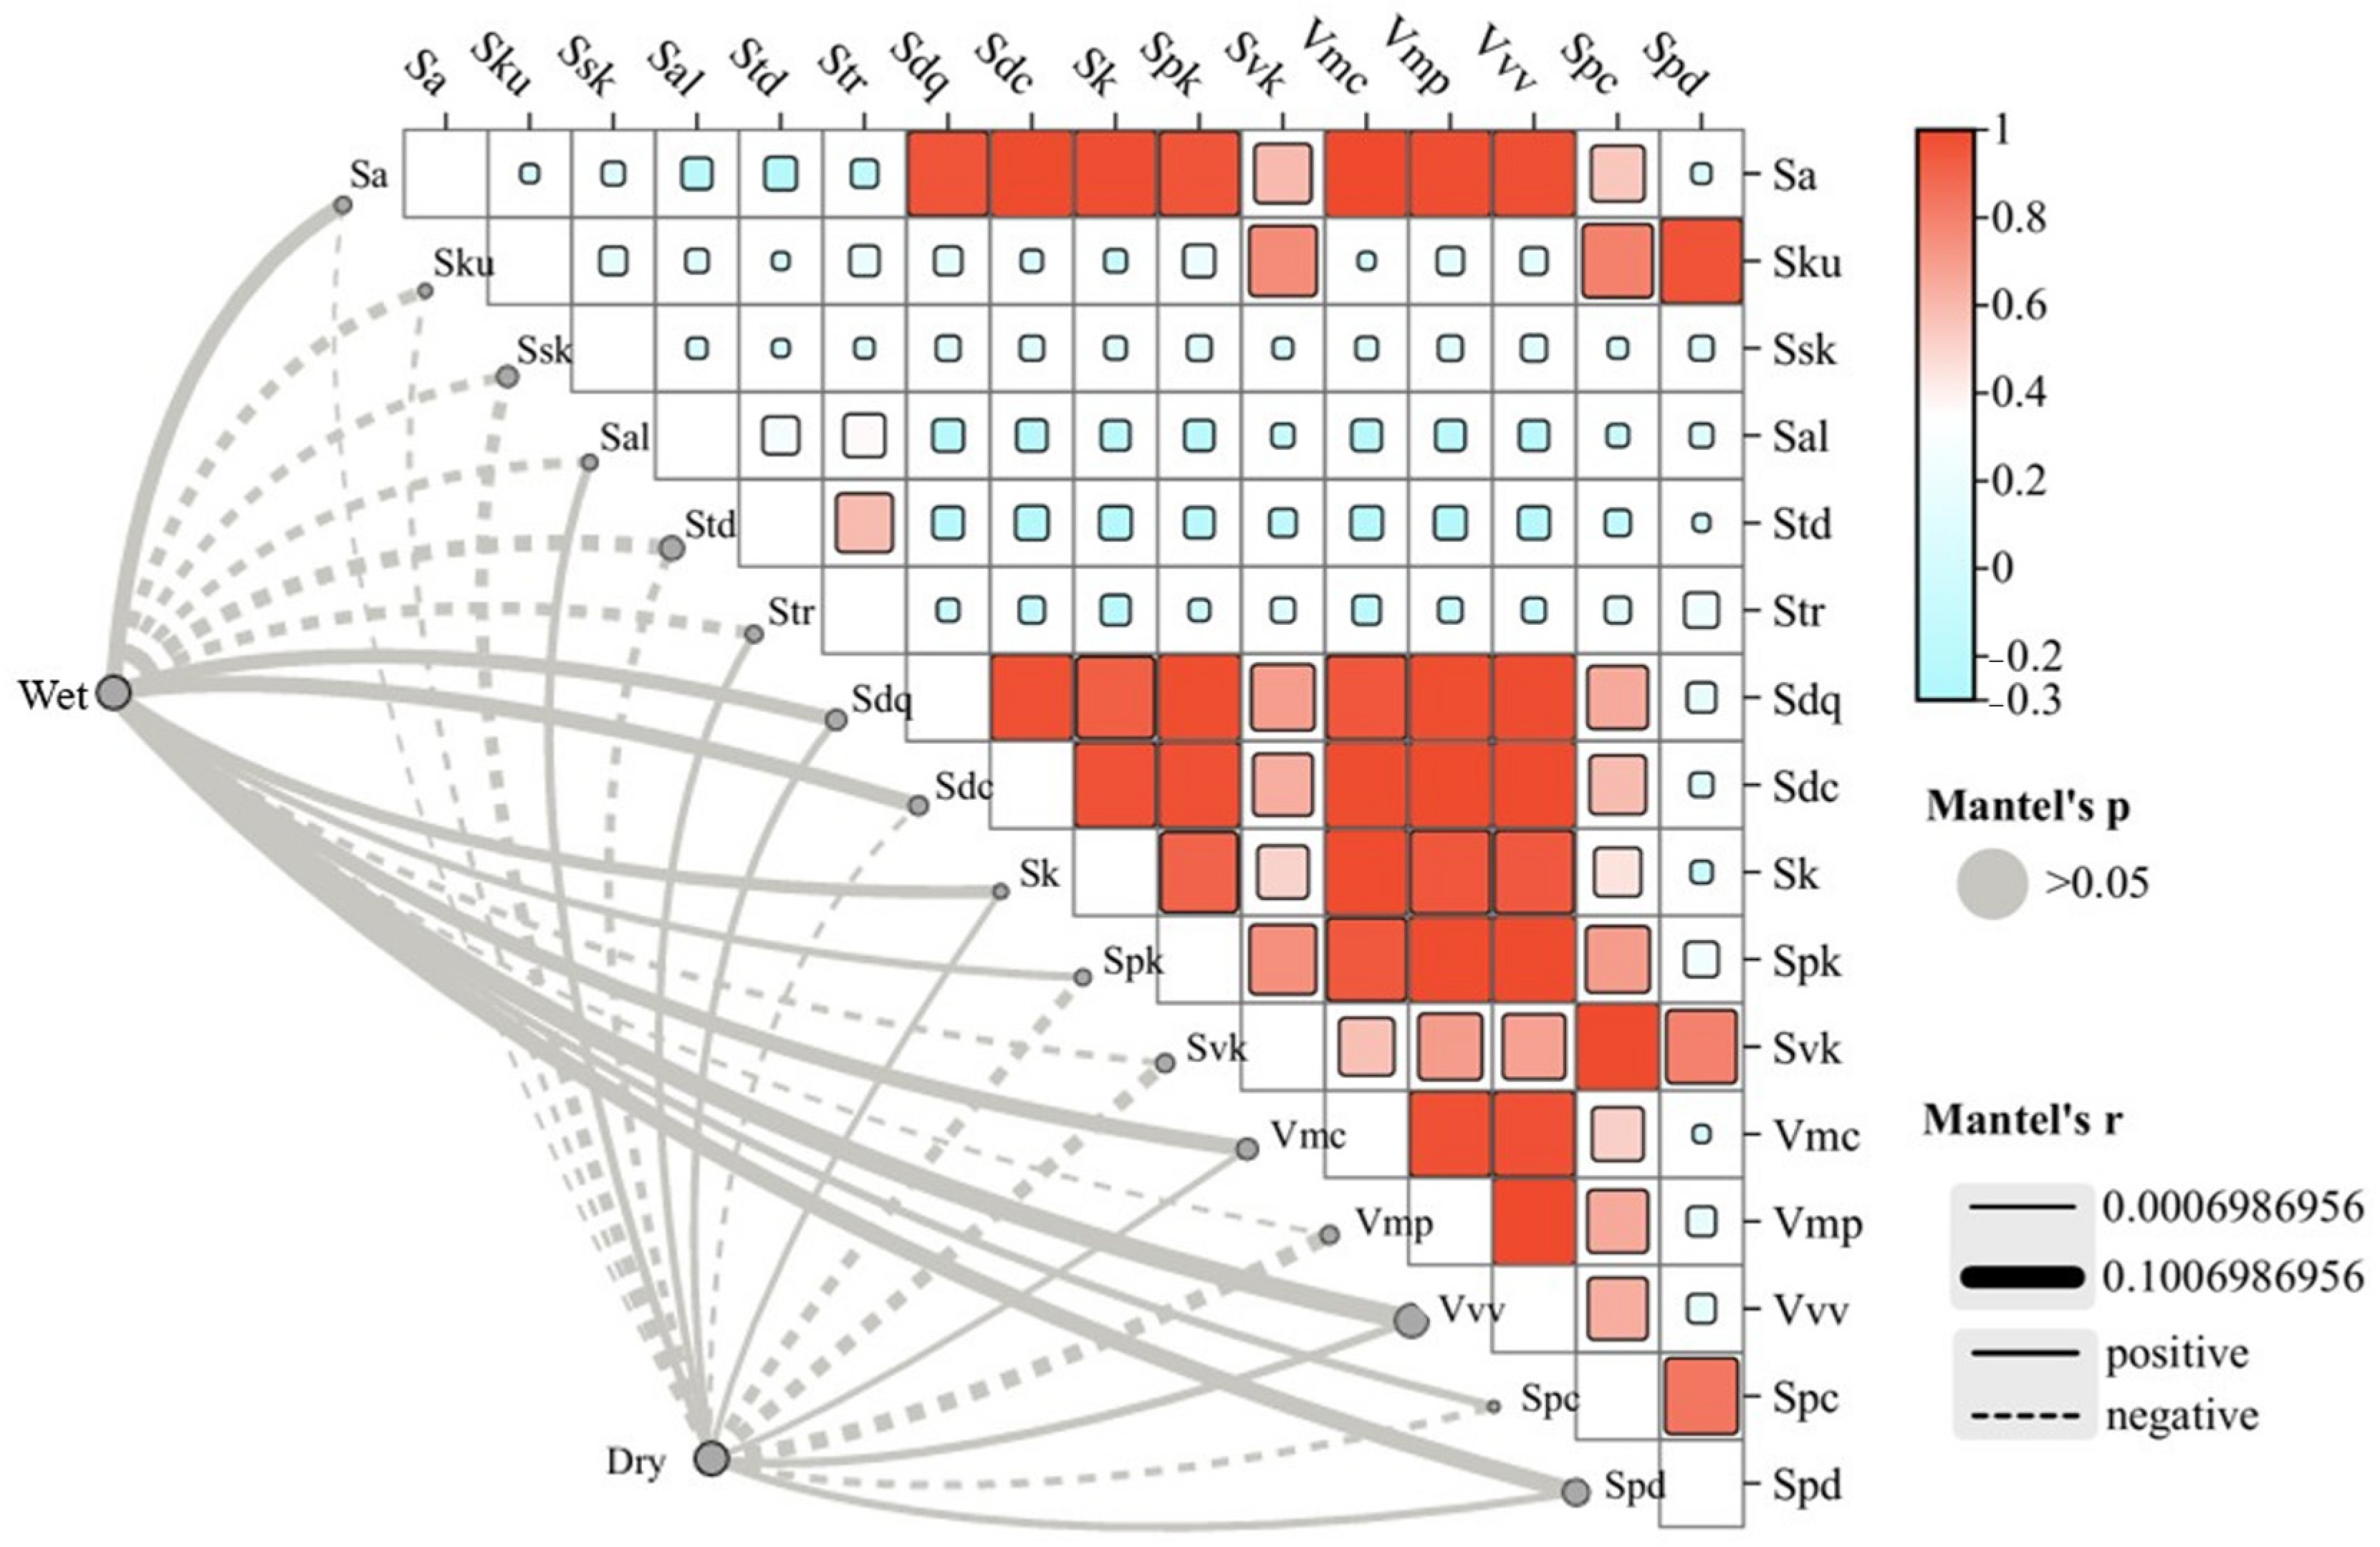
This study employs the Mantel Test to conduct a joint analysis of dry and wet friction coefficient matrices with characteristic parameter matrices. By aligning identical data points across the input matrices, the three components are seamlessly integrated. Spearman correlation analysis is subsequently applied to the characteristic parameters, and the results are generated. Given that the summarized characteristic parameters from the previous sections belong to different categories, Spearman’s rank correlation coefficient is utilized [26,27,28,29]. This non-parametric statistical method evaluates the monotonic relationship between variables without being constrained by linearity. The Mantel Test, in this context, is used to compare the correlations between the dry and wet friction coefficients and the macro-texture characteristic parameter matrices. Further analysis focuses on comparing these coefficients with micro-texture characteristic parameters. In the resulting visualizations, the thickness of the lines represents the strength of the correlation determined by the Mantel Test, with thicker lines indicating higher correlation coefficients and thinner lines representing weaker correlations. The significance of these correlations is depicted through the color of the lines, where variations in hue correspond to varying levels of statistical significance, and the correlation heat map was drawn using ChiPlot (https://www.chiplot.online/ (accessed on 16 January 2025)).
Analysis of Dry and Wet Friction Coefficients and Macro-Texture Characteristic Parameters Figure 12 presents the analysis of dry and wet friction coefficients in relation to macro-texture characteristic parameters.
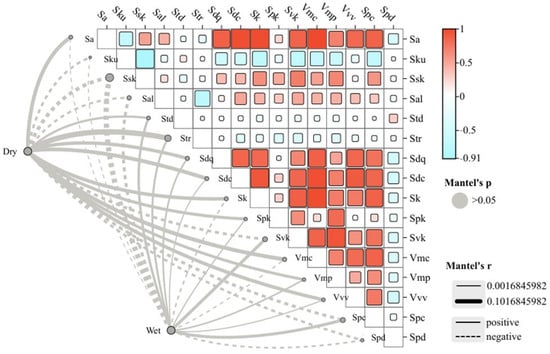
Figure 12.
Analysis of FDry and FWet Friction Coefficients with Macro−Texture Parameters.
The top-right section of the figure illustrates the monotonic relationships among macro-texture parameters. With the exception of Std, a clear monotonic trend is observed between parameters from different categories. The bottom-left section of the figure analyzes the correlations between dry friction coefficients and macro-texture parameters, as well as between wet friction coefficients and macro-texture parameters. The results indicate that dry friction coefficients generally exhibit stronger and predominantly positive correlations with macro-texture parameters compared to wet friction coefficients. This aligns with the broader research trend concerning the relationship between texture characteristics and friction coefficients. Among these parameters, Sa, Str, and Vmc show higher positive correlations with dry friction coefficients compared to other parameters, while Ssk exhibits a negative correlation, with a higher degree of significance than the remaining parameters. The correlation coefficients and significance levels for these four parameters are summarized in Table 1, where larger r-values indicate stronger correlations, and smaller p-values reflect higher significance. The size of the squares represents the correlation between feature parameters; the larger the square, the greater the value.

Table 1.
Mantel’s r and Mantel’s p for Macro-Texture Parameters.
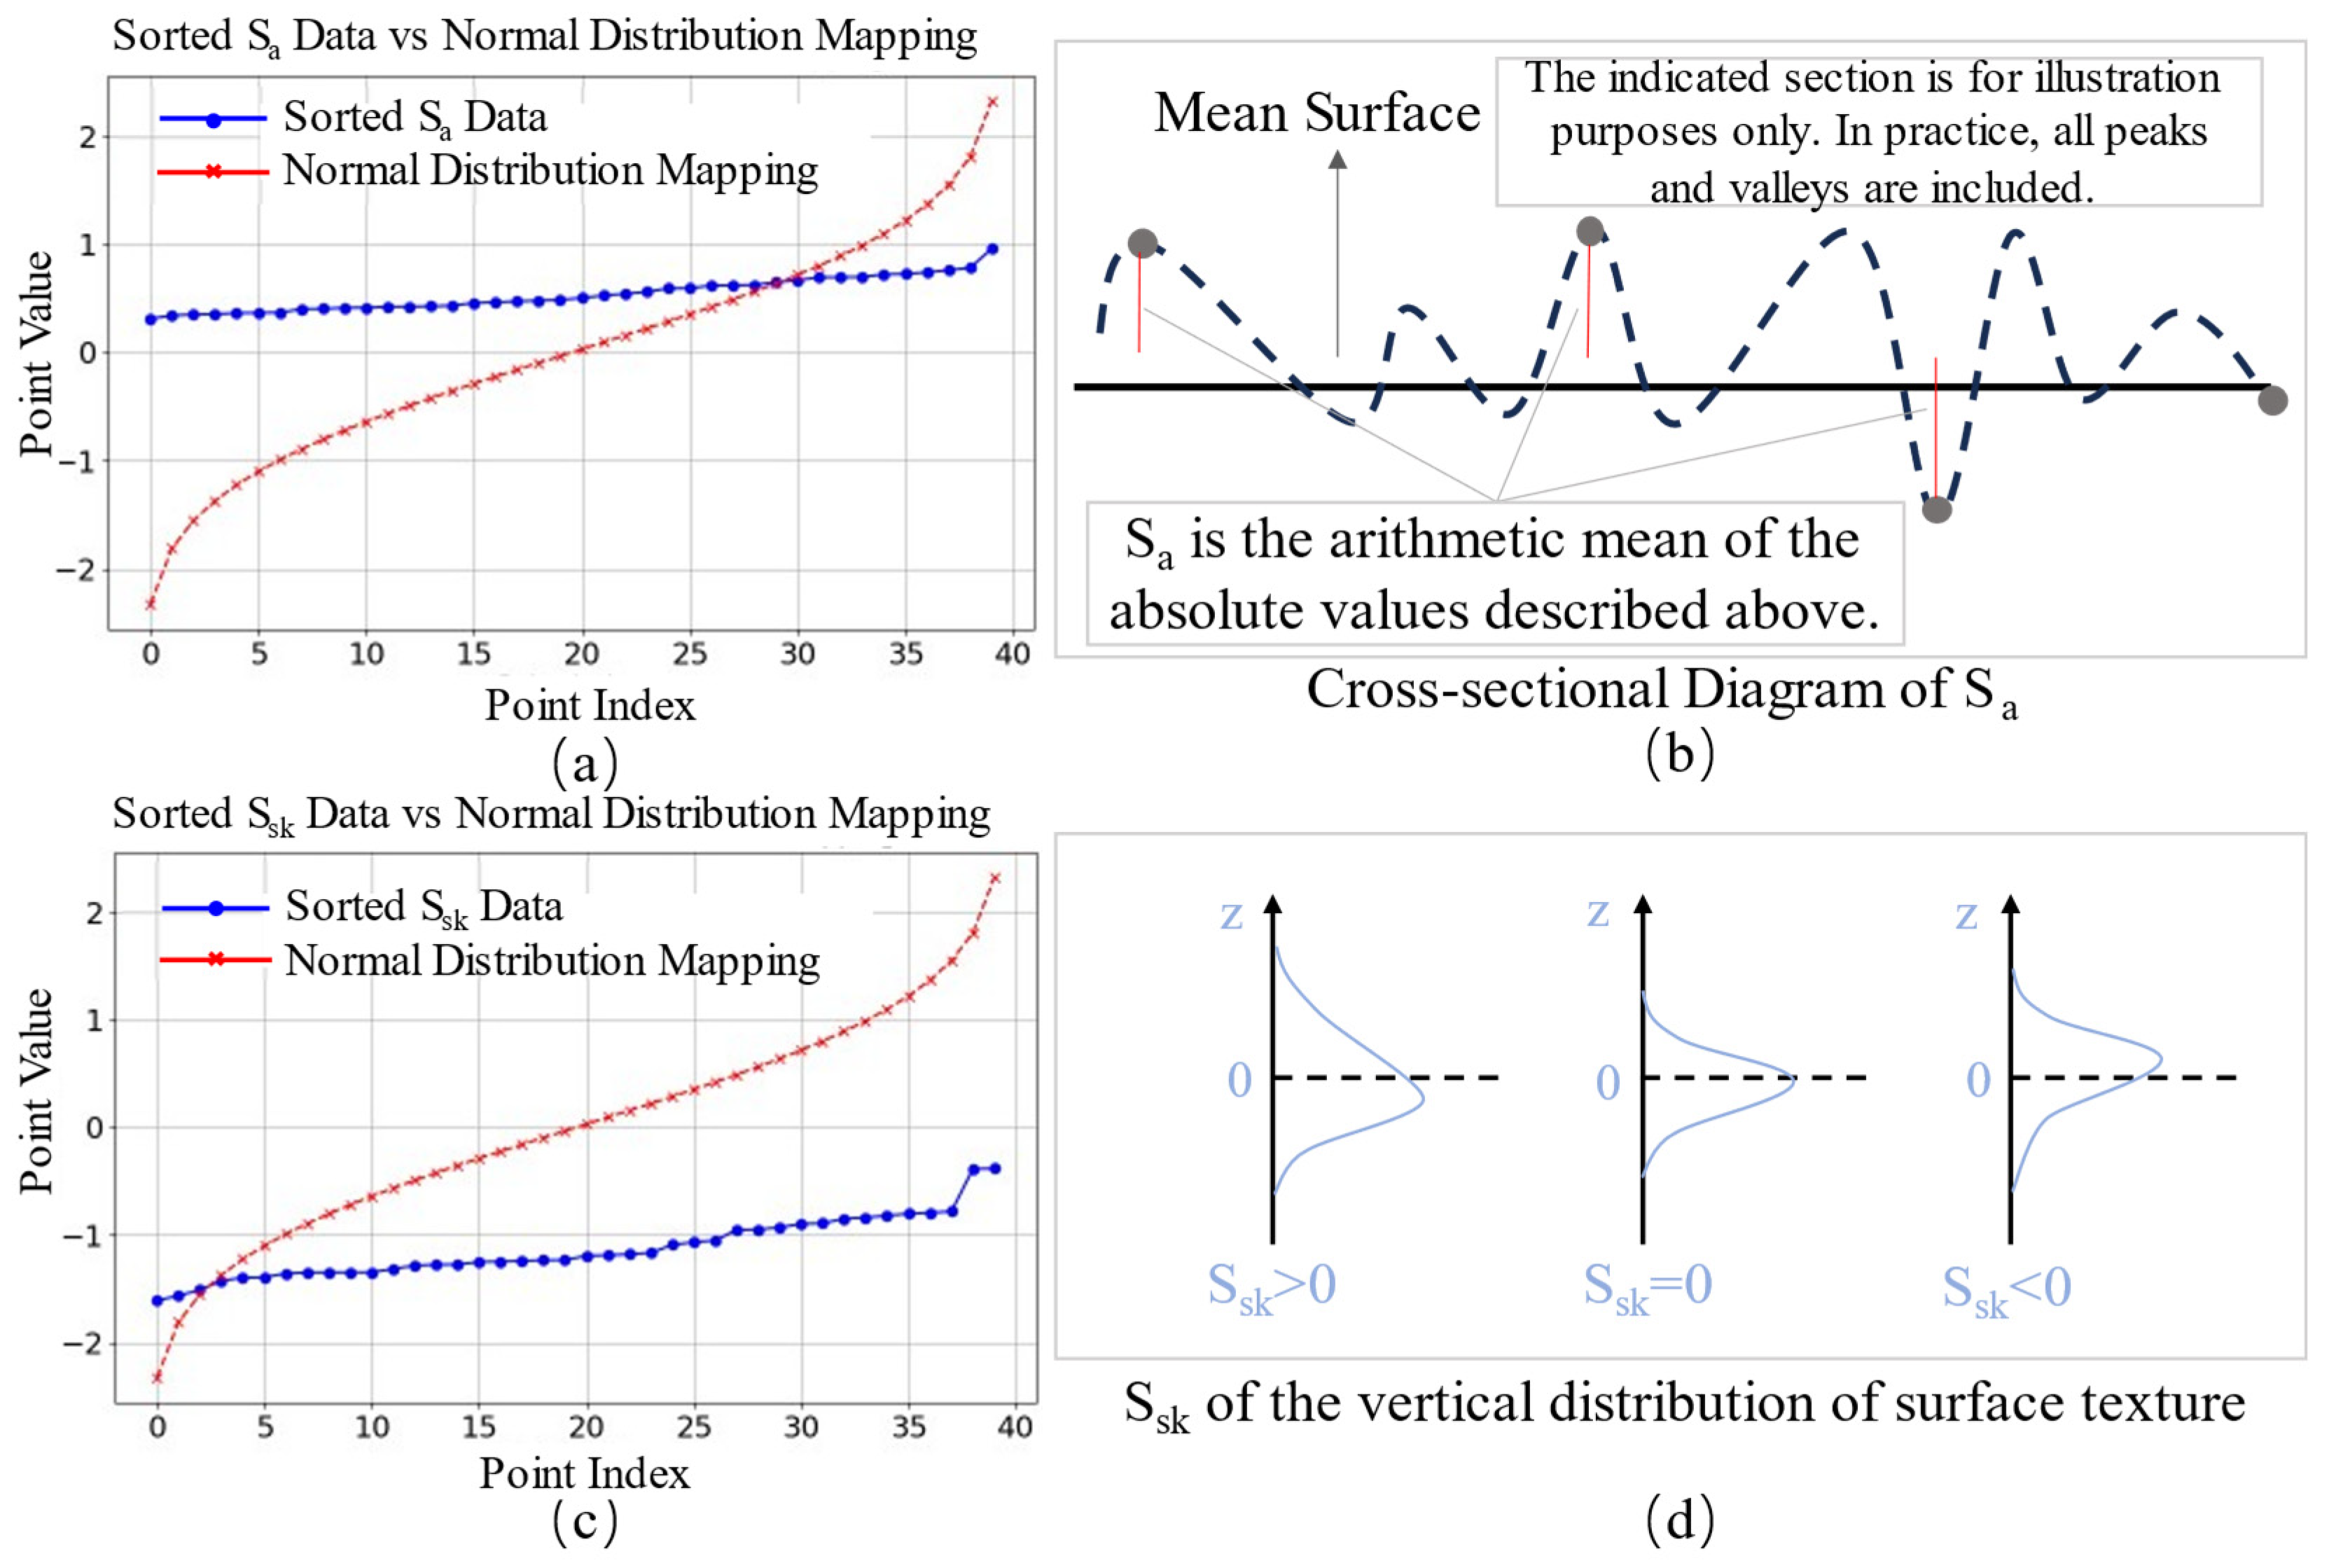
Explaining Skid Resistance Mechanisms from the Perspective of Macro-Texture Characteristic Parameters. The skid resistance mechanism was analyzed by arranging and mapping the data of four highly correlated parameters to a normal distribution. As shown in Figure 13, In these mappings, the blue curve represents the original data distribution across 40 points, while the red curve illustrates the results after mapping the data to normal distribution quantiles. This transformation allows for a clearer understanding of how texture parameters influence skid resistance.
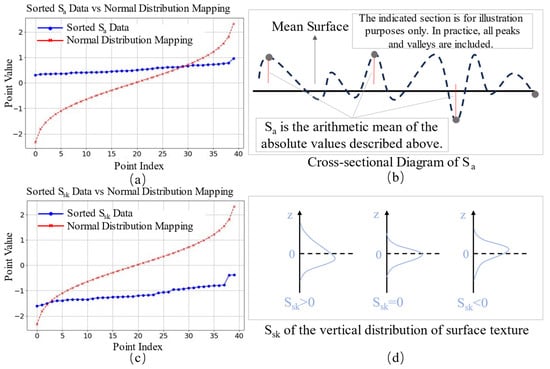
Figure 13.
Skid Resistance Analysis of Sa and Ssk. (a) Sa Data Analysis Diagram. (b) Sa Cross-Section Diagram. (c) Ssk Data Analysis Diagram. (d) Skewness Distribution Illustration.
The parameter Sa, defined as the arithmetic mean height of the surface, quantifies the absolute height differences between individual surface points and the mean surface plane. In Figure 13a, the red curve exhibits a monotonic upward trend rather than the typical bell-shaped curve of a normal distribution, indicating that the original data points are not uniformly distributed but exhibit significant skewness. The blue curve for Sa remains relatively smooth between the 10th and 30th points, suggesting that a majority of the data points fall within this range. The steeper regions on both ends indicate sparser data distributions, signifying a wider spread of values. The corresponding original data range for the smooth region is 0.4–0.8, suggesting that most data points exhibit relatively higher values. This implies a greater absolute height difference between points and the mean surface, reflecting a rougher texture. Such a rough surface enhances skid resistance, as coarser textures contribute to improved frictional performance. Figure 13b presents a cross-sectional calculation diagram of Sa, further demonstrating its positive effect on skid resistance. As surface height differences increase, the roughness of the pavement intensifies, leading to a rise in dry friction coefficients. Another crucial parameter, Ssk, which describes the symmetry of the surface height distribution relative to the mean plane, is analyzed in Figure 13d. The blue curve in Figure 13c predominantly remains below zero, particularly within a narrow negative range from the 0th to the 30th point, indicating a prevalence of high peaks in the surface texture. This characteristic is strongly associated with enhanced skid resistance. In contrast, the final 10 points approach zero, suggesting a smoother surface with diminished skid resistance properties. The red curve follows a smooth and symmetric upward trend, further confirming the significant skewness in the blue data distribution and reinforcing the relationship between surface texture characteristics and skid resistance performance.
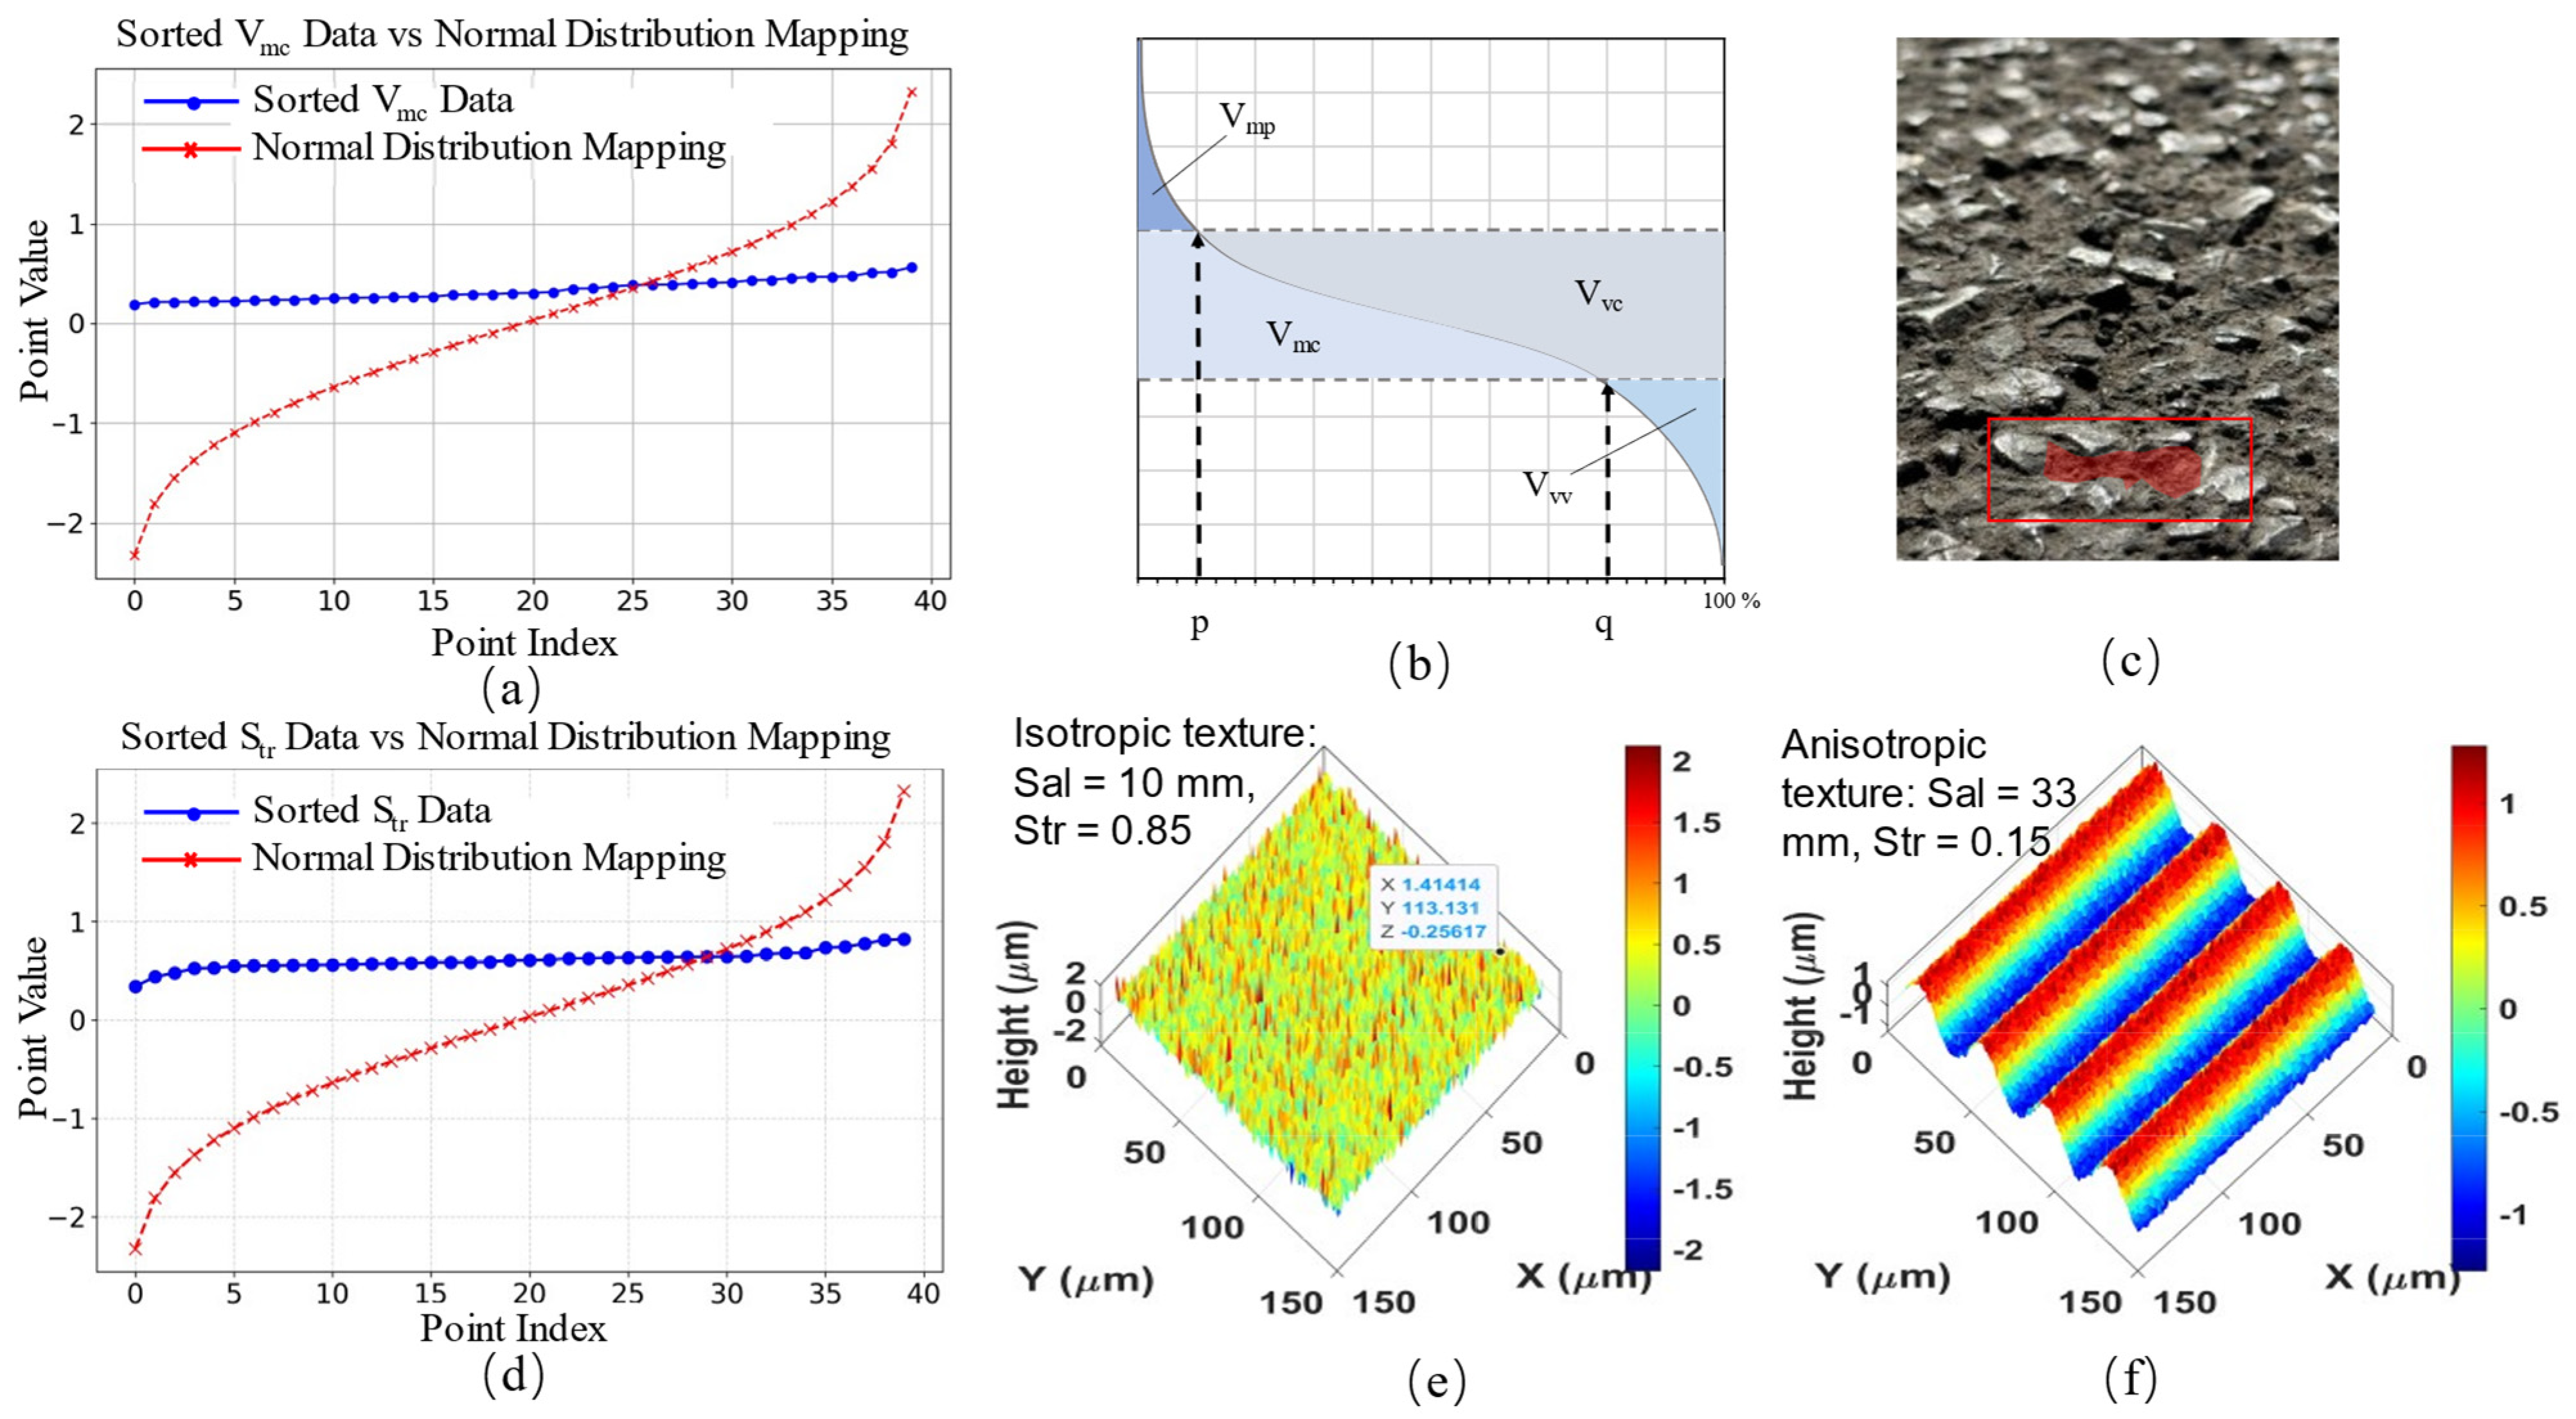
The parameter Vmc represents the solid volume in the central region of the surface texture. Larger Vmc values indicate the potential for greater contact area, thereby enhancing skid resistance. In Figure 14a, the blue curve demonstrates a generally flat trend, suggesting a uniform distribution of Vmc values across data points. This reflects a relatively consistent texture morphology in the central region, contributing to stable friction performance. Minor fluctuations at both ends of the blue curve may result from deviations in specific data points, indicating slight roughness variations in localized areas compared to the central region. The red curve further supports the observation that the Vmc distribution is predominantly uniform.
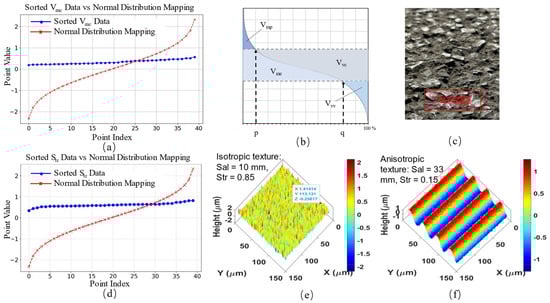
Figure 14.
Vmc and Str Anti-Skid Analysis Diagram. (a) Vmc Data Analysis Diagram. (b) Volume Parameter Illustration. (c) Real Pavement with Vmc Marking. (d) Str Data Analysis Diagram. (e) Micro Texture with High Str Values. (f) Micro Texture with Low Str Values.
In Figure 14b, a schematic representation of four volume parameters is provided based on the material ratio curve, while Figure 14c illustrates an interpretative marking of Vmc on an actual asphalt pavement surface. The bright areas typically correspond to exposed aggregate particles, which may be associated with higher peak values. In contrast, the darker regions represent the filled areas between aggregates, while the finer granular-filled sections consist of a mixture of binder and fine aggregates. These regions align with the definition of Vmc. The parameter Str, which reflects the aspect ratio of surface texture, ranges from 0 to 1. Values approaching 1 indicate isotropic texture distribution, which provides a more uniform texture and consistent frictional performance. In Figure 14d, the blue curve approximates a horizontal line, with overall values closer to 1, indicating minimal directional variation in texture and a relatively uniform surface texture distribution. Compared to the red curve, the blue curve exhibits smaller variations at both ends, demonstrating greater consistency in the data. Figure 14e,f illustrates the simulated distributions of surface texture along longitudinal and transverse directions for high and low Str values, respectively.
As discussed previously, the four macro-texture parameters (Sa, Str, Vmc, and Ssk) exhibit clear correlations with the dry friction coefficient (FDry). To simplify the workload associated with assessing pavement skid resistance during routine road maintenance, this study explored regression analyses between Sa, Str, Vmc, Ssk, and FDry. Ultimately, a regression equation for FDry was developed using Vmc and Sa as predictors. Detailed parameters can be found in Table 2.
Table 2.
Parameters of the Regression Equation for FDry Friction Coefficient.
3.3. The Influence of Micro-Texture on Dry and Wet Friction Coefficients
Figure 15 illustrates the analysis of dry and wet friction coefficients in relation to micro-texture characteristic parameters. In the upper-right corner, Spearman correlation analysis of micro-texture parameters is presented. All micro-texture parameters exhibit monotonic relationships, with red indicating positive correlations and blue representing negative correlations. The figure reveals a negative correlation between height and spatial parameters. The subsequent four parameter groups demonstrate a clear positive correlation, while the remaining height and spatial parameters, excluding Sa, show significant positive correlations with the latter four categories of parameters. In the lower-left corner, the analysis of micro-texture parameters with dry and wet friction coefficients is displayed. The correlation with wet friction coefficients is generally higher than that with dry friction coefficients. Specifically, Sa, Sdc, Vvv, and Spd exhibit significant positive correlations with wet friction coefficients. The corresponding coefficients are provided in Table 3.
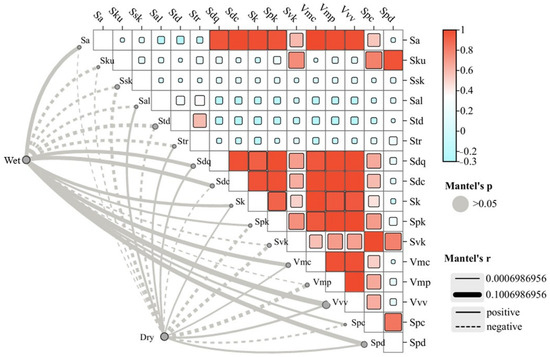
Figure 15.
Analysis of FDry and FWet Friction Coefficients with Micro−Texture Parameters.
Table 3.
Mantel’s r and Mantel’s p for Micro−Texture Parameters.
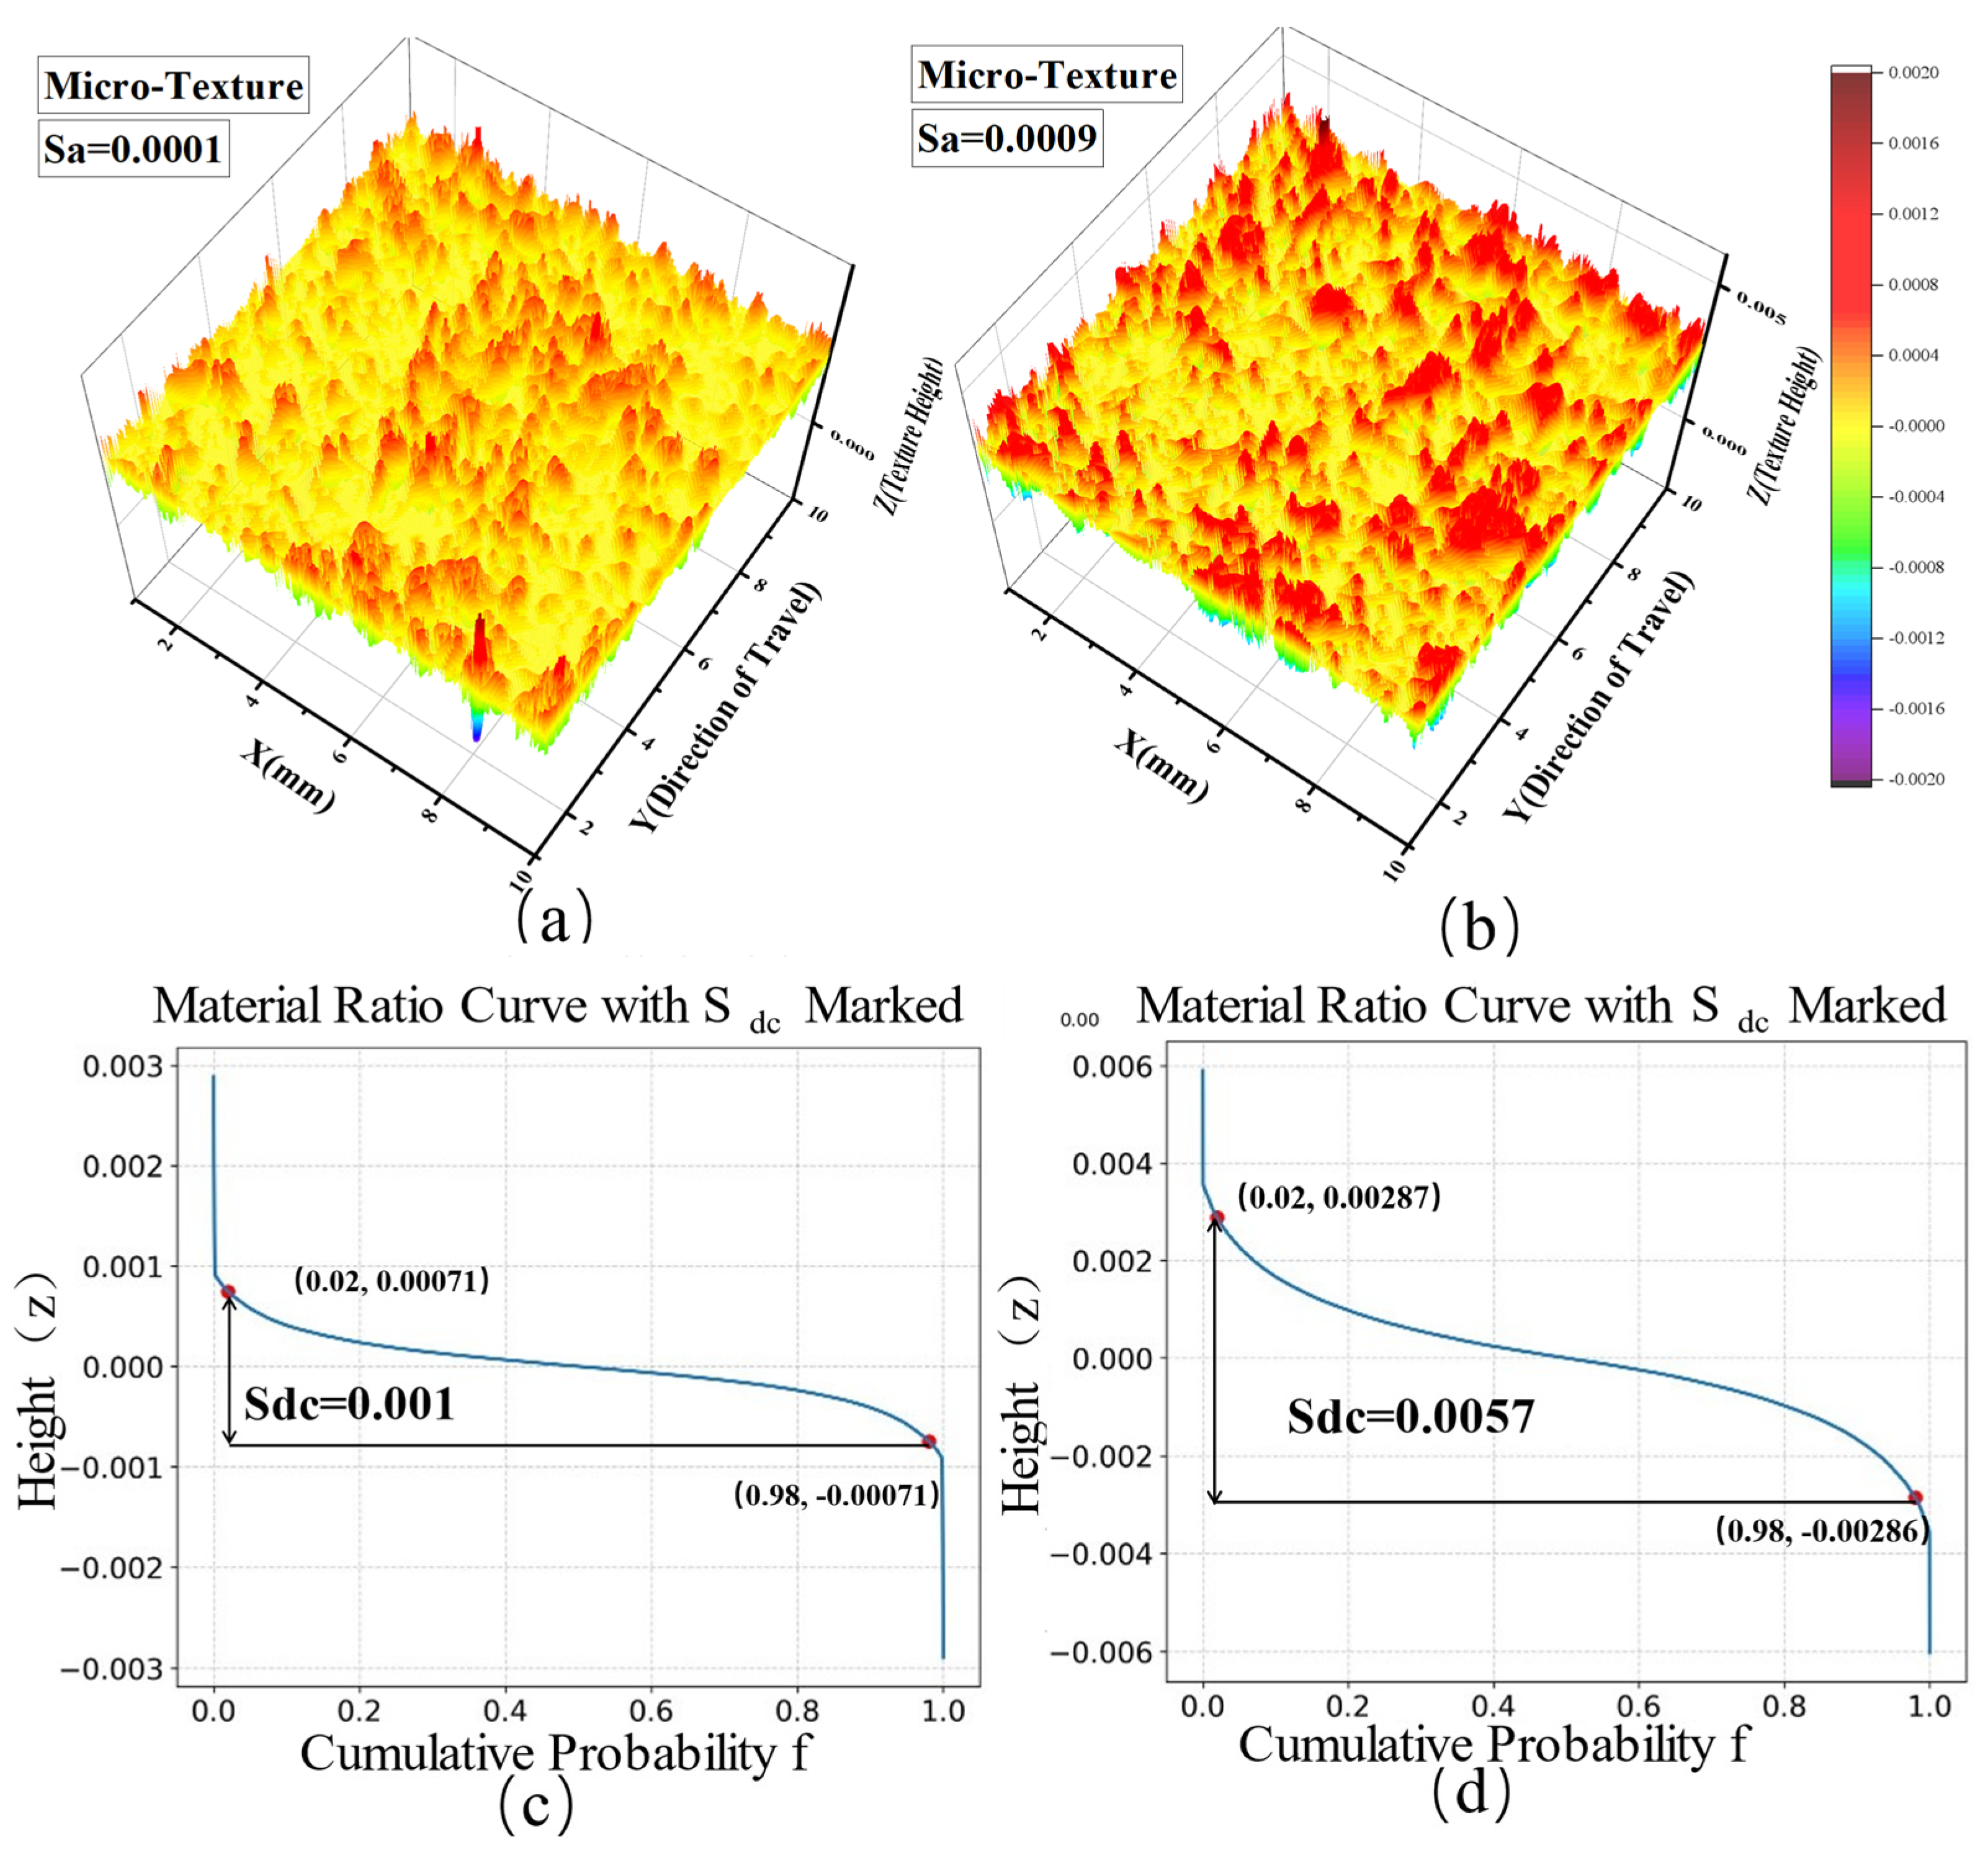
The skid-resistance mechanism was analyzed through micro-texture characteristic parameters. Figure 16a,b illustrates the surface morphology corresponding to different Sa values. These figures prominently highlight the positive influence of Sa on texture, demonstrating that greater surface height differences and increased roughness significantly enhance skid resistance under wet conditions. Figure 16c,d depicts material ratio curves for two samples with substantial differences, along with annotated Sdc values. Sdc quantifies the distribution variability of surface heights under different material bearing ratios and serves as a critical parameter for describing surface morphology. Sdc represents the height difference between two material bearing ratios (p < q), with larger values indicating sharper surface peaks, smaller contact areas, and an increased ability to penetrate the lubrication film, thereby enhancing friction. From a numerical perspective, higher Sdc values signify more pronounced surface height variations, greater peak-to-valley differences, and sharper peaks. These sharp peaks effectively pierce the water film, enabling direct contact between the tire and the pavement, thereby improving skid resistance. Conversely, lower Sdc values indicate a smoother and more evenly distributed surface, reflecting less pronounced height variations.
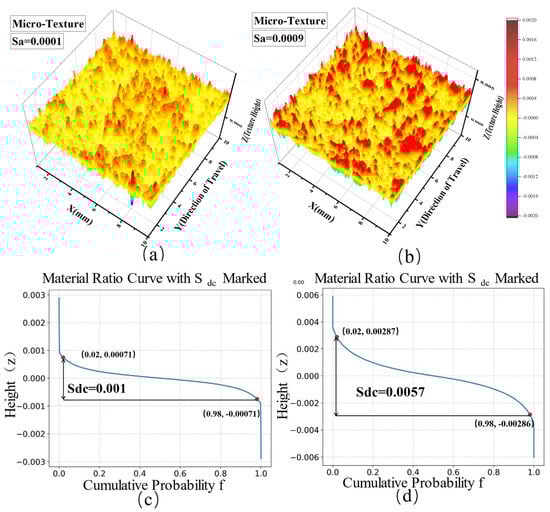
Figure 16.
Micro Texture Anti-Slip Illustration of Sa and Sdc. (a) Micro texture with smaller Sa. (b) Micro-texture with larger Sa. (c) Smaller Sdc. (d) Larger Sdc.
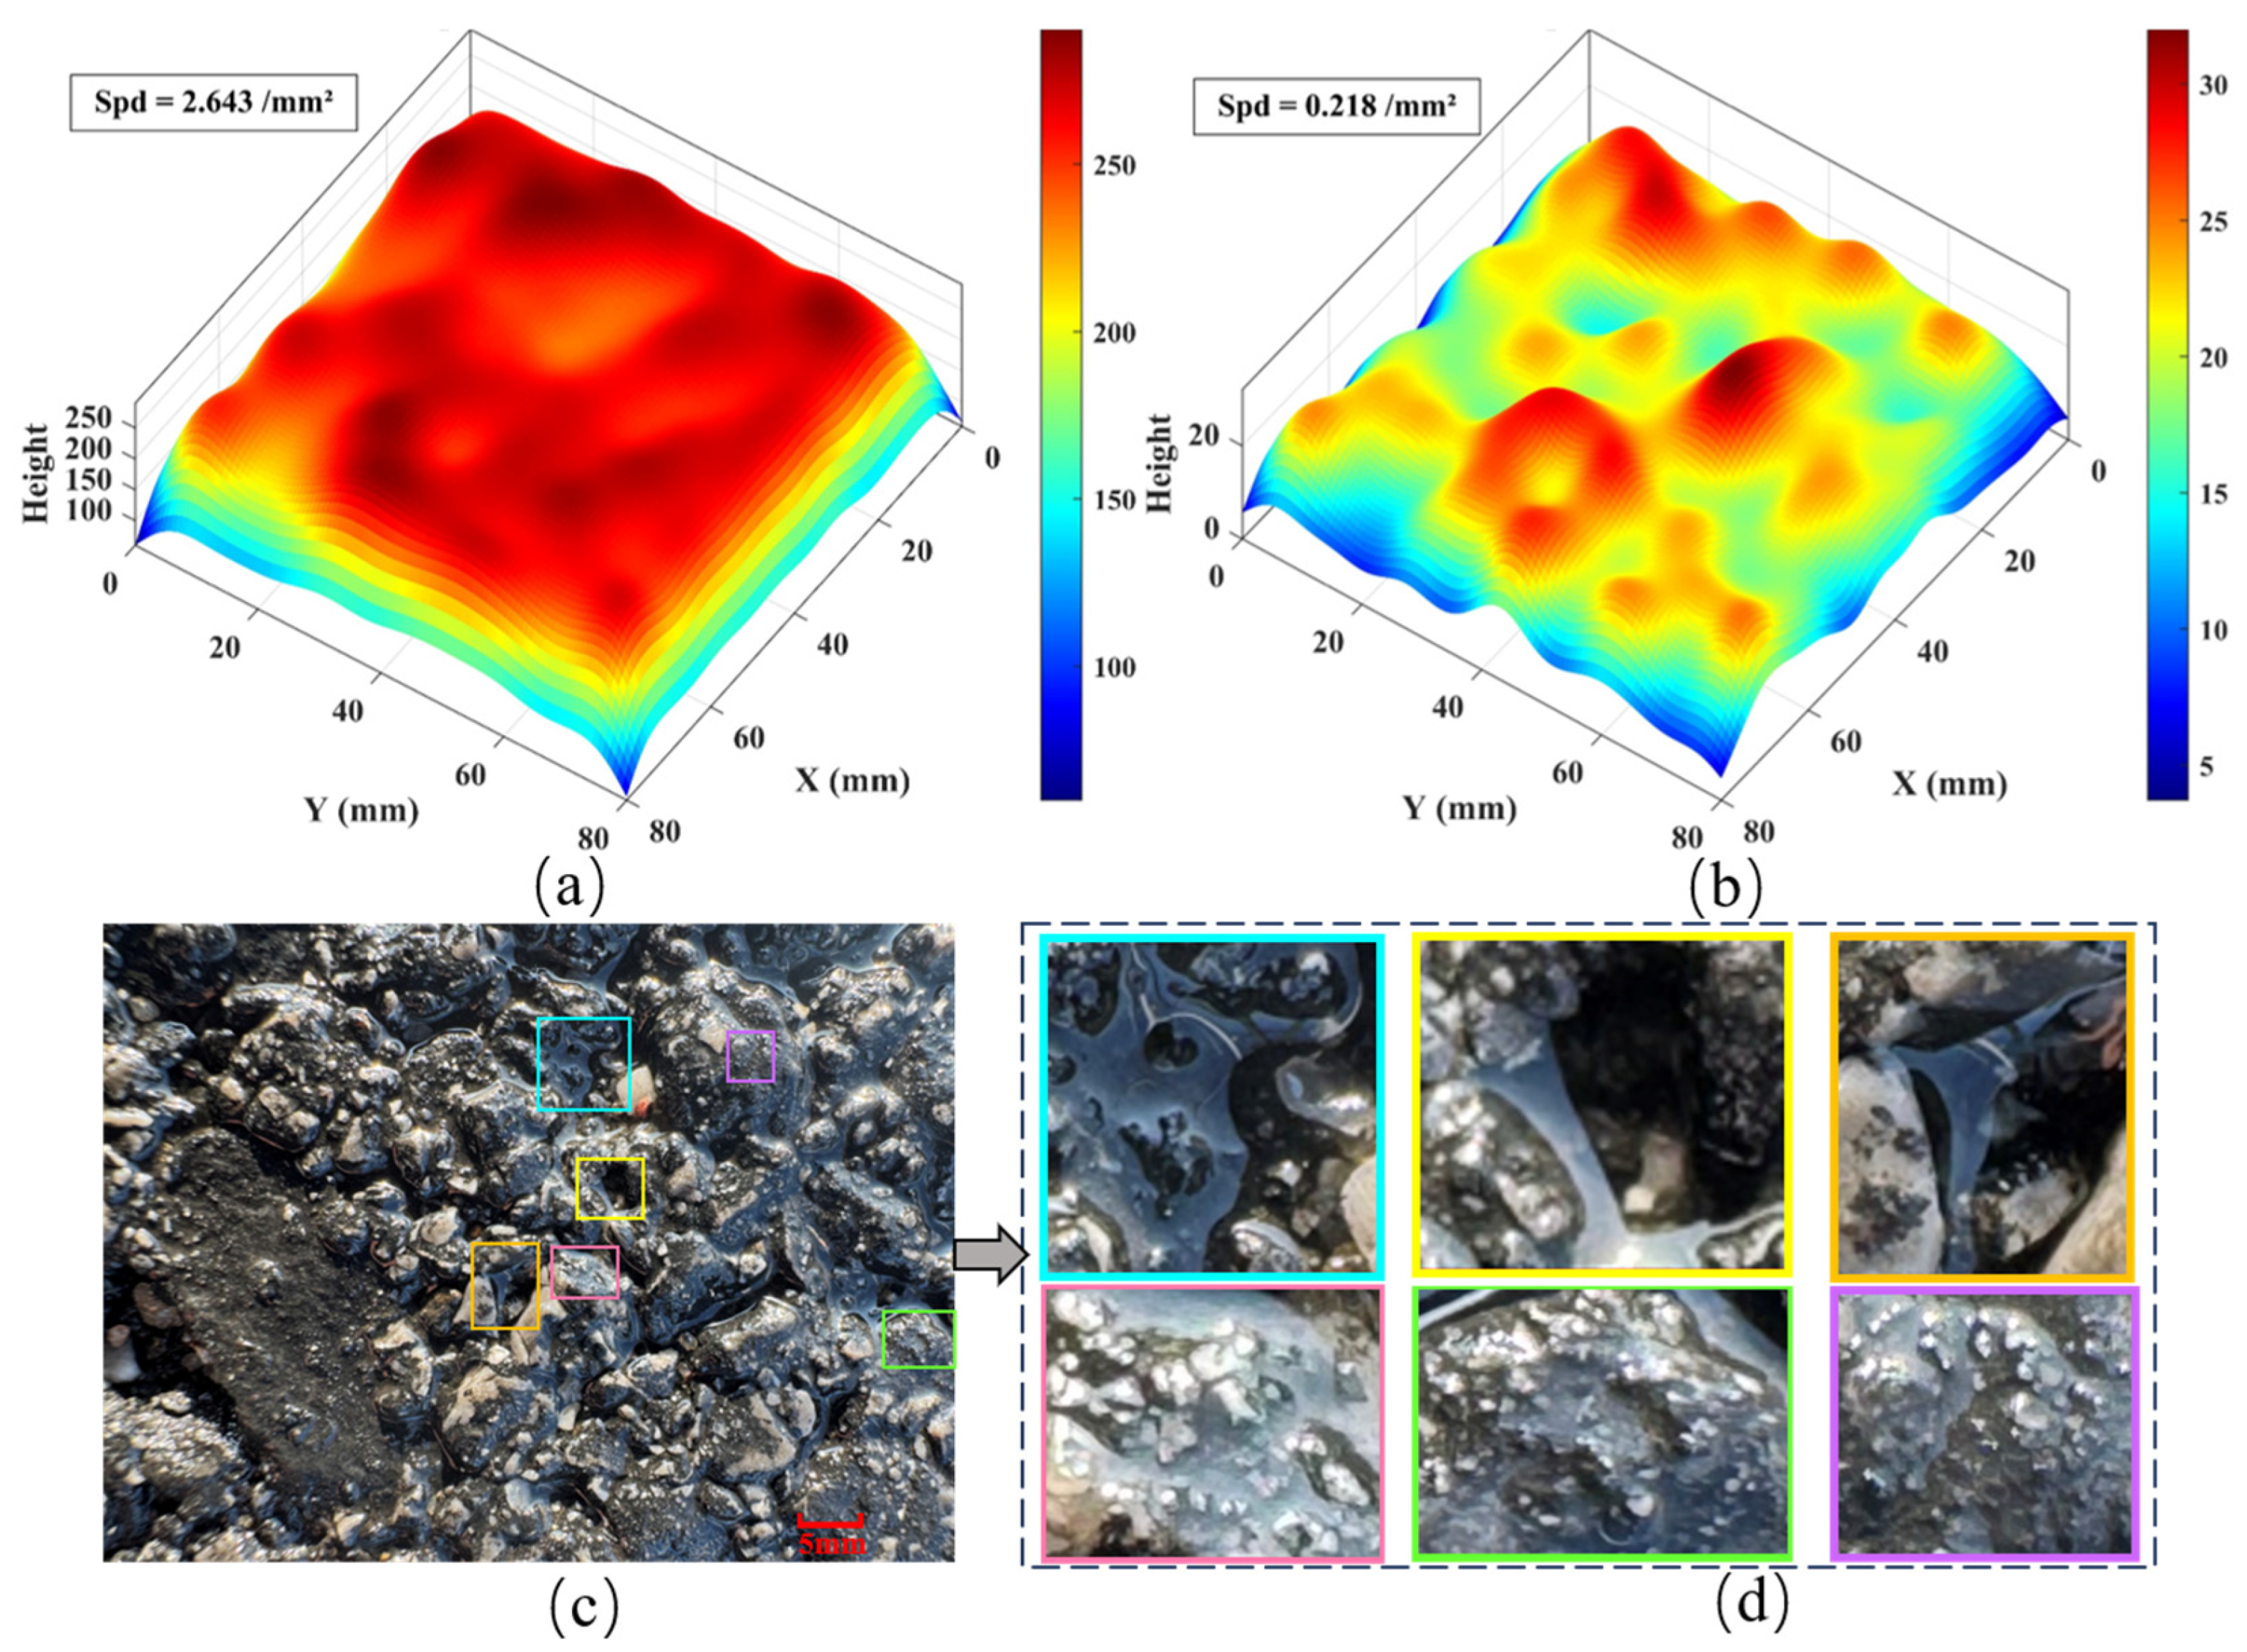
Figure 17a,b illustrates 80 mm × 80 mm micro-texture models simulated in MATLAB (MATLAB Version: 9.10.0.1602886 (R2021a)) providing a three-dimensional visualization of surface morphology with varying peak densities. The parameter Spd, representing the number of surface peaks per unit area, directly reflects the density of surface textures. In Figure 17a, a higher peak density is observed, characterized by numerous closely spaced peaks with significant height variations and pronounced texture protrusions. This indicates a rougher surface morphology. In contrast, Figure 17b shows a lower peak density with fewer surface protrusions, larger spacing between peaks, and smaller height variations, resulting in a relatively smoother surface. For asphalt pavements, surfaces with higher peak densities not only exhibit more micro-texture protrusions but also significantly enhance tire grip and skid resistance after penetrating the surface water film. Figure 17c,d depicts photographs of dry asphalt pavement after water spraying. In Figure 17c, multiple valley regions containing water are outlined, while Figure 17d provides a magnified view of water retention in these valleys. The upper images highlight water retention in large valley areas formed by prominent textures, while the lower images illustrate micro-level water retention on coarse aggregate particles. The parameter Vvv, describing the pore volume in valley regions of surface height distributions, reflects the drainage capacity of these valleys in asphalt pavements. Larger Vvv values indicate an improved ability to remove water films, thereby reducing tire slippage and enhancing skid resistance.
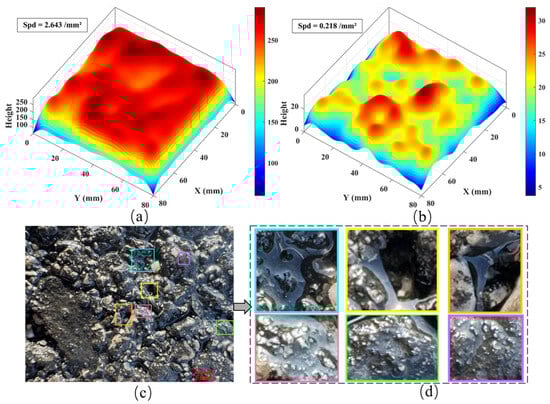
Figure 17.
Illustrations of Spd and Vvv. (a) Micro-texture with larger Spd. (b) Micro-texture with smaller Spd. (c) Pavement texture after water spraying. (d) Water retention phenomenon in valley areas.
As previously discussed, a clear correlation exists between the four macro-texture characteristic parameters and the dry friction coefficient, highlighting their significant role in pavement skid resistance. To streamline the monitoring process and reduce the workload involved in evaluating skid resistance during routine road maintenance, this study explores the regression relationships between Sa, Str, Vmc, Ssk, and the dry friction coefficient FDry.
By analyzing these correlations, a more efficient and practical approach to assessing pavement friction properties can be established. Ultimately, through regression analysis, predictive equations for the dry friction coefficient were developed using Vmc and Sa, as detailed in Table 4, providing a robust tool for pavement performance evaluation and maintenance planning.
Table 4.
Parameters of the Regression Equation for FWet Friction Coefficient.
4. Conclusions
Based on the results and analysis presented above, the following conclusions can be drawn:
- Data Collection Issues and Rectification. Gaps in the collected data were identified. This phenomenon primarily arises from the irregular distribution of pavement texture, which creates blind spots that cannot be captured during the scanning process. Additionally, poor operational quality during repeated data collection can adversely affect data accuracy. To address this, specialized software was employed to convert the 3D point cloud data into a surface model, supplement the missing points, and subsequently reconvert it into point data.
- Separation and Characterization of Macro- and Micro-Textures. The actual pavement texture was successfully separated into macro- and micro-textures, and 16 characteristic parameters were calculated for each. By applying a combination of Fourier transform and Butterworth high-pass and band-pass filters, the separation process was completed and visualized in three dimensions. The presented images allow for a clear observation of overall texture changes and parameter comparisons between the two texture types. These characteristic parameters were further utilized to estimate pavement surface texture conditions and interpret the role of each parameter in influencing skid resistance.
- Correlation and Regression Analysis of Texture Parameters. The relationships between macro- and micro-textures and their characteristic parameters were analyzed, and regression equations linking these parameters to dry and wet friction coefficients were developed. The results for macro-texture indicate significant correlations between Sa, Str, Vmc, Ssk, and FDry, with Ssk showing a negative correlation, while Sa, Str, and Vmc exhibit positive correlations. All four parameters were found to be highly significant. For micro-texture, Sa, Sdc, Vvv, and Spd all demonstrate significant positive correlations with FWet. The regression equations derived can be used to calculate dry and wet friction coefficients based on the characteristic parameters of the three-dimensional texture.
Author Contributions
Conceptualization, J.G. and J.F.; Data curation, C.G. and J.G.; Writing—original draft preparation, J.F.; Writing—review and editing, J.G. and L.S.; Funding acquisition, J.F. All authors have read and agreed to the published version of the manuscript.
Funding
This research was supported by the National Natural Science Foundation of China, grant number 52268068. It was also funded by the Tianshan Leading Talents in Scientific and Technological Innovation, under grant number 2022TSYCLJ0045, and by the Natural Science Foundation of Jiangxi Province, grant number 20232BAB204085.
Data Availability Statement
The original contributions presented in the study are included in the article, further inquiries can be directed to the corresponding author.
Conflicts of Interest
Author Liang Song was employed by Xinjiang Transportation Investment Construction Management Co., Ltd. The remaining authors declare that the research was conducted in the absence of any commercial or financial relationships that could be construed as a potential conflict of interest.
References
- Guo, W.; Li, J.; Luo, W.; Yang, J.; Zhu, X.; Yan, J. A new method for solving parameter mutation analysis in periodic structure bandgap calculation. Eur. J. Mech.-A/Solids 2025, 111, 105572. [Google Scholar]
- Yao, Y.; Yang, J.; Gao, J.; Zheng, M.; Song, L.; Xu, J.; Sun, C. RAP chunks produced in cold milling operation of asphalt pavement: Evaluation, mechanism, and engineering investigation in China. J. Traffic Transp. Eng. (Engl. Ed.) 2024, 11, 972–1000. [Google Scholar]
- Liu, Z.; Feng, T.; Zhu, X.; Gao, J.; Hu, K.; Guo, M.; Gu, F.; Li, F. Bird’s-eye view of recycled solid wastes in road engineering. J. Road Eng. 2024, 4, 93–150. [Google Scholar] [CrossRef]
- Yao, Y.; Yang, J.; Gao, J.; Xu, J.; Zhang, Y.; Yu, S.; Muhammad, N.S. Blending behavior of reclaimed asphalt and virgin asphalt in recycled asphalt mixtures: A comprehensive analysis on material composition and mixing process. Constr. Build. Mater. 2025, 465, 140229. [Google Scholar]
- Vélez Rodríguez, K.X.; Katicha, S.W.; Flintsch, G.W. Enhanced Methodology for the Identification of Locations with High Risk of Wet Crashes. Transp. Res. Rec. J. Transp. Res. Board 2019, 2673, 29–37. [Google Scholar]
- Bitelli, G.; Simone, A.; Girardi, F.; Lantieri, C. Laser Scanning on Road Pavements: A New Approach for Characterizing Surface Texture. Sensors 2012, 12, 9110–9128. [Google Scholar] [CrossRef]
- Acai, J.; Amadi-Echendu, J. Pavement Infrastructure Sustainability Assessment: A Systematic Review. In Proceedings of the 2018 Portland International Conference on Management of Engineering and Technology Inc. (PICMET), Honolulu, HI, USA, 19–23 August 2018. [Google Scholar]
- Davies, R.B.; Cenek, P.D.; Henderson, R.J. The effect of skid resistance and texture on crash risk. In Proceedings of the Surface Friction Roads and Runways, Christchurch, New Zealand, 1–4 May 2005. [Google Scholar]
- Ghaffarpour Jahromi, S. Investigation of damage and deterioration hazard in asphalt mixtures due to moisture. Proc. Inst. Civ. Eng.-Transp. 2018, 171, 98–105. [Google Scholar]
- Du, Y.; Weng, Z.; Liu, C.; Wu, D. Dynamic Pavement Distress Image Stitching Based on Fine-Grained Feature Matching. J. Adv. Transp. 2020, 2020, 1–15. [Google Scholar] [CrossRef]
- Amarasiri, S.; Muhunthan, B. Evaluating the effectiveness of pavement preventive-maintenance treatments in mitigating longitudinal cracks in wet-freeze climatic zones. J. Transp. Eng. Part B Pavements 2020, 146, 4020014. [Google Scholar]
- Du, Y.; Weng, Z.; Li, F.; Ablat, G.; Wu, D.; Liu, C. A novel approach for pavement texture characterisation using 2D-wavelet decomposition. Int. J. Pavement Eng. 2022, 23, 1851–1866. [Google Scholar]
- Yu, M.; Xiao, B.; You, Z.; Wu, G.; Li, X.; Ding, Y. Dynamic friction coefficient between tire and compacted asphalt mixtures using tire-pavement dynamic friction analyzer. Constr. Build. Mater. 2020, 258, 119492. [Google Scholar]
- Jiao, Y.; Liu, X.; Liu, K. Wettability of laser textured surface: A parametric study based on numerical simulation and experimentation. Ind. Lubr. Tribol. 2018, 70, 977–983. [Google Scholar]
- Zou, Y.; Yang, G.; Cao, M. Neural network-based prediction of sideway force coefficient for asphalt pavement using high-resolution 3D texture data. Int. J. Pavement Eng. 2022, 23, 3157–3166. [Google Scholar]
- Deng, Q.; Zhan, Y.; Liu, C.; Qiu, Y.; Zhang, A. Multiscale power spectrum analysis of 3D surface texture for prediction of asphalt pavement friction. Constr. Build. Mater. 2021, 293, 123506. [Google Scholar]
- Hu, L.; Yun, D.; Liu, Z.; Du, S.; Zhang, Z.; Bao, Y. Effect of three-dimensional macrotexture characteristics on dynamic frictional coefficient of asphalt pavement surface. Constr. Build. Mater. 2016, 126, 720–729. [Google Scholar]
- Li, Q.J.; Yang, G.; Wang, K.C.P.; Zhan, Y.J.; Wang, C. Novel Macro- and Microtexture Indicators for Pavement Friction by Using High-Resolution Three-Dimensional Surface Data. Transp. Res. Rec. J. Transp. Res. Board 2017, 2641, 164–176. [Google Scholar]
- Li, Q.J.; Zhan, Y.; Yang, G.; Wang, K.C.P. Pavement skid resistance as a function of pavement surface and aggregate texture properties. Int. J. Pavement Eng. 2020, 21, 1159–1169. [Google Scholar]
- Ayenu-Prah, A.Y.; Attoh-Okine, N.O. Comparative study of Hilbert-Huang transform, Fourier transform and wavelet transform in pavement profile analysis. Veh. Syst. Dyn. 2009, 47, 437–456. [Google Scholar]
- Zelelew, H.M.; Papagiannakis, A.T.; de León Izeppi, E.D. Pavement macro-texture analysis using wavelets. Int. J. Pavement Eng. 2013, 14, 725–735. [Google Scholar]
- Katicha, S.W.; Mogrovejo, D.E.; Flintsch, G.W.; de León Izeppi, E.D. Adaptive Spike Removal Method for High-Speed Pavement Macrotexture Measurements by Controlling the False Discovery Rate. Transp. Res. Rec. J. Transp. Res. Board 2015, 2525, 100–110. [Google Scholar]
- Katicha, S.W.; Mogrovejo, D.E.; Flintsch, G.W.; de León Izeppi, E.; Carrasco, D.M. Latest Development in the Processing of Pavement Macrotexture Measurements of High Speed Laser Devices. In Proceedings of the 9th International Conference on Managing, Alexandria, VA, USA, 18–21 May 2015. [Google Scholar]
- ISO 25178-2 2021; Geometrical Product Specifications (GPS)—Surface Texture: Areal—Part 2: Terms, Definitions and Surface Texture Parameters. ISO: Geneva, Switzerland, 2021.
- Zuñiga Garcia, N. Predicting Friction with Improved Texture Characterization. Ph.D. Dissertation, The University of Texas at Austin, Austin, TX, USA, 2017. [Google Scholar]
- Saltelli, A.; Ratto, M.; Andres, T.; Campolongo, F.; Cariboni, J.; Gatelli, D.; Saisana, M.; Tarantola, S. Global Sensitivity Analysis: The Primer; Wiley & Sons: New York, NY, USA, 2008. [Google Scholar]
- Corder, G.W.; Foreman, D.I. Nonparametric Statistics: A Step-by-Step Approach; Wiley & Sons: New York, NY, USA, 2014. [Google Scholar]
- Yu, B.; Kong, L.; Sun, Y.; Yao, B.; Gao, Z. A bi-level programming for bus lane network design. Transp. Res. Part C Emerg. Technol. 2015, 55, 310–327. [Google Scholar] [CrossRef]
- Ding, S.; Wang, K.C.; Yang, E.; Zhan, Y. Influence of effective texture depth on pavement friction based on 3D texture area. Constr. Build. Mater. 2021, 287, 123002. [Google Scholar]

Disclaimer/Publisher’s Note: The statements, opinions and data contained in all publications are solely those of the individual author(s) and contributor(s) and not of MDPI and/or the editor(s). MDPI and/or the editor(s) disclaim responsibility for any injury to people or property resulting from any ideas, methods, instructions or products referred to in the content. |
© 2025 by the authors. Licensee MDPI, Basel, Switzerland. This article is an open access article distributed under the terms and conditions of the Creative Commons Attribution (CC BY) license (https://creativecommons.org/licenses/by/4.0/).