Article

Engine Lubricant Impact in Light-Vehicle Fuel Economy: A Combined Numerical Simulation and Experimental Validation

1
VW do Brasil—Way to Zero Center, São Bernardo do Campo 09823-901, Brazil
2
Department of Mechanical Engineering, Centro Universitário FEI, São Bernardo do Campo 09850-901, Brazil
3
Idemitsu Lube South America Ltda., São Paulo 01419-001, Brazil
4
Idemitsu Lubricants America Corp., Jeffersonville, IN 47130, USA
*
Author to whom correspondence should be addressed.
Lubricants 2025, 13(4), 137; https://doi.org/10.3390/lubricants13040137
Submission received: 26 February 2025 / Revised: 17 March 2025 / Accepted: 19 March 2025 / Published: 22 March 2025

Abstract

:
The optimization of passenger car efficiency is an important contribution to GHG emissions mitigation. This global warming concern is pushing technological solutions to reduce vehicle fuel consumption and consequently CO2 emissions. In this work, the impacts of engine lubricants with lower viscosity and friction modifier additive in a light-vehicle with a spark ignition engine were numerically simulated and experimentally validated. The substitution of a baseline 5W40 lubricant by a lower viscosity 5W20 proposal resulted in 2.9% lower fuel consumption in a combined cycle. This fuel consumption improvement is enhanced to 6.1% with a 0W16 lubricant with friction modifier. A 1D simulation model based on lubricant temperature and viscosity impact on engine friction was developed and presented good experimental correlation in combined cycle for 5W20, showing a 7% lower fuel consumption advantage than the experimental results. The numerical simulation advantage was 38% lower than experimental results for 0W16 that contains friction modifier, as the additive impact was not considered in this mathematical model.

1. Introduction

The engine friction reduction through low viscosity lubricants, viscous modifiers (VM), anti-wear (AW), and friction modifier (FM) additives is a significant way to improve fuel efficiency of the vehicles equipped with internal combustion engines (ICE), both in a conventional and hybrid topology.
Friction losses are a significant share on car fuel consumption. On urban conditions, ICE friction losses are around 10% of fuel energy. As the losses occur after combustion, they represent as much as 25% of fuel consumption and CO2 emissions [1,2]. The ICE friction losses are composed of different tribological systems in which the lubrication regime: boundary, mixed or hydrodynamic, depends on lubricant film thickness and combined surface roughness ratio. Lower lubricant viscosity reduces hydrodynamic but increases boundary and, in lower magnitude, mixed regime friction of moving surfaces [2,3,4,5,6]. The higher engine friction with low viscosity lubricant in boundary and mixed regimes can be reduced by FM additives. Taylor et al. [3] investigated the effect of two 0W12 oils, with and without FM, in comparison to a baseline 15W40 in motored test, see Figure 1. Due to the lower viscosity, the 0W12 without FM (Figure 1a) caused more boundary friction than 15W40, represented by an increase on the engine friction mean effective pressure (FMEP) in lower engine speeds, values in red in Figure 1. The use of a FM in the 0W12 oil practically annulated the lower viscosity disadvantage below 1000 rpm (Figure 1b).
Devlin [7] points vehicle mileage and test procedure as significant variables that difficulties to measure the improvement of low viscosity lubricants in fuel economy. In addition, the lubricant impact on fuel economy cannot be defined simply by lubricant viscosity but by FM and AW additives that, respectively, improve lubricant behavior in boundary and mixed lubrication regimes and influences on friction coefficient in low film thickness.
De Carvalho et al. [8] measured the lubricant viscosity impact in a dyno bench with the efficiency of a single-cylinder diesel engine. The 0W20 lubricant resulted in about 0.8% improvement in engine brake specific fuel consumption (BSFC) compared to a 5W40 lubricant in three steady speed and load conditions.
According to Cui et al. [9] vehicle fuel economy improvement is closely related to engine oil viscosity and FM. They investigated the impact of drive cycle, vehicle type and VM chemistry on vehicle fuel economy in three different standard drive cycles [10]. The proposed 0W20 lubricant reduced fuel consumption in about 2.6 and 2.7% on NEDC and on FTP75, respectively, compared to a 15W40 baseline lubricant. Three different spark ignition (SI) vehicles were compared in NEDC resulting in 1.6 to 3.2% better fuel economy with the proposed lubricant with about 1% variation between vehicles with the same naturally aspirated engine displacement. The better results were observed in a vehicle equipped with a 1.4 L turbocharged engine.
Macián et al. [11] simulated a NEDC [10] in a dyno bench with a light-duty diesel engine and observed 1.7% enhancement in engine efficiency with a 5W20 lubricant compared to a baseline 5W30. The lubricant low viscosity advantage was more pronounced in urban conditions, with lower engine load and speed, reaching 2.7% better fuel economy while 0.5% in extra urban use.
Tormos et al. [12] studied the fuel economy impact of lubricant specs: viscosity, FM and sulphated ash, phosphorus and sulfur (SAPS) content that is important for diesel (DPF) or gasoline (GPF) particulate filter compatibility. The lubricant impact in fuel economy was estimated for a medium-duty diesel engine in steady-state conditions and simulated real drive emissions (RDE), two urban and one rural, in a dyno bench. The 5W20 resulted in up to 5.3%, and kept around 4% at low loads, lower fuel consumption compared to a baseline 10W30, both lubricants without FM. RDE enhanced the fuel economy improvement up to 8.84% in urban use and to 5.19% in rural route. Other 5W30 lubricants with molybdenum-based FM and different SAPS content resulted in opposite and unexpected results.
Blanco-Rodríguez et al. [13] proposed a mathematical model to estimate the impact of lubricant viscosity on fuel economy of a passenger car. A semi-predictive model based on lubricant experimental characterization: viscosity, shear rate and heat transfer, was implemented on GT-SUITE platform. The replacement of a 5W40 by a 0W20 lubricant was simulated for a spark ignition sport-utility vehicle (SUV), important to notice quite like the vehicle analyzed and tested in this article. The simulations resulted 3.5% fuel savings in WLTC [10] and confirmed the more pronounced advantage of low viscosity lubricant in urban conditions.
The clear low viscosity lubricant frictional losses reduction in the hydrodynamic regime must be balanced with the concern of its potential higher engine wear in mixed and boundary lubrication regimes affected by asperity friction, as pointed by Blanco-Rodríguez et al. [13], Cui et al. [9], Zhang et al. [14], Lee and Zhmud [15] and Barnhill et al. [16].
Zhang et al. [14] performed simulation based on input data from six-cylinder diesel engine dynamometer bench test, e.g., measured cylinder pressure, to conclude the replacement of a baseline 15W40 oil by a low viscosity 0W20 could reduce 24% the hydrodynamic friction losses at 2150 rpm, and higher engine speeds are benefited by hydrodynamic phenomenon. The asperity friction increases with low viscosity lubricant in lower engine speeds which could lead to heavy wear, risk of engine failure, and fully neutralize the low viscosity hydrodynamic advantages.
According to Lee and Zhmud [15] the ultralow viscosity lubricants stress the engine beyond the limits considered in the engineering design, leading to wear problems, more pronounced in low engine speeds and high engine loads. Engine friction losses, from lubricant viscous and frictional losses due to boundary contact, can be reduced with low viscosity oils, FM and anti-friction coatings on critical parts. The 0W16 with FM and 1000 ppm Mo significantly reduces engine friction at low engine speeds, below 2000 rpm. Experimental tests on ASTM dynamometer procedures, which correlate with in-vehicle tests, indicated up to 3.8% better fuel economy with 5W20 in VIE procedure [17], and up to 4.1% with 0W16 in VIF procedure [18] compared to a 20W30 baseline mineral oil. Vehicle tests can result in average 3 to 4% better fuel economy with 0W20 instead of 15W40 in NEDC. The more aggressive WLTC results reduce the advantages in NEDC in about 0.3 to 0.6% but the less aggressive cycle JC08 [10] can improve the low viscosity advantage to 5%. The NEDC results are improved in 2 to 3% more fuel economy with 0W8 lubricant viscosity index.
The challenge of low-viscosity lubricants for engine wear protection were investigated by Barnhill et al. [16] in terms of anti-wear additives (AW) that allow the low viscosity benefits while remaining engine durability. The combination of an oil-miscible phosphorous-organophosphate ionic liquid (IL) and zinc diakyl dithiophosphate (ZDDP) provided effective wear protection through boundary lubrication of ball-on-flat reciprocation wear tests, and 2.12% improvement in fuel economy in VIE test, ASTM dynamometer procedure [17] that correlated with in-vehicle results.
The experimental challenge to measure and confirm the effective lubricant impact on vehicle’s fuel economy can be made plausible by comparing the experimental with vehicle numerical simulation results.
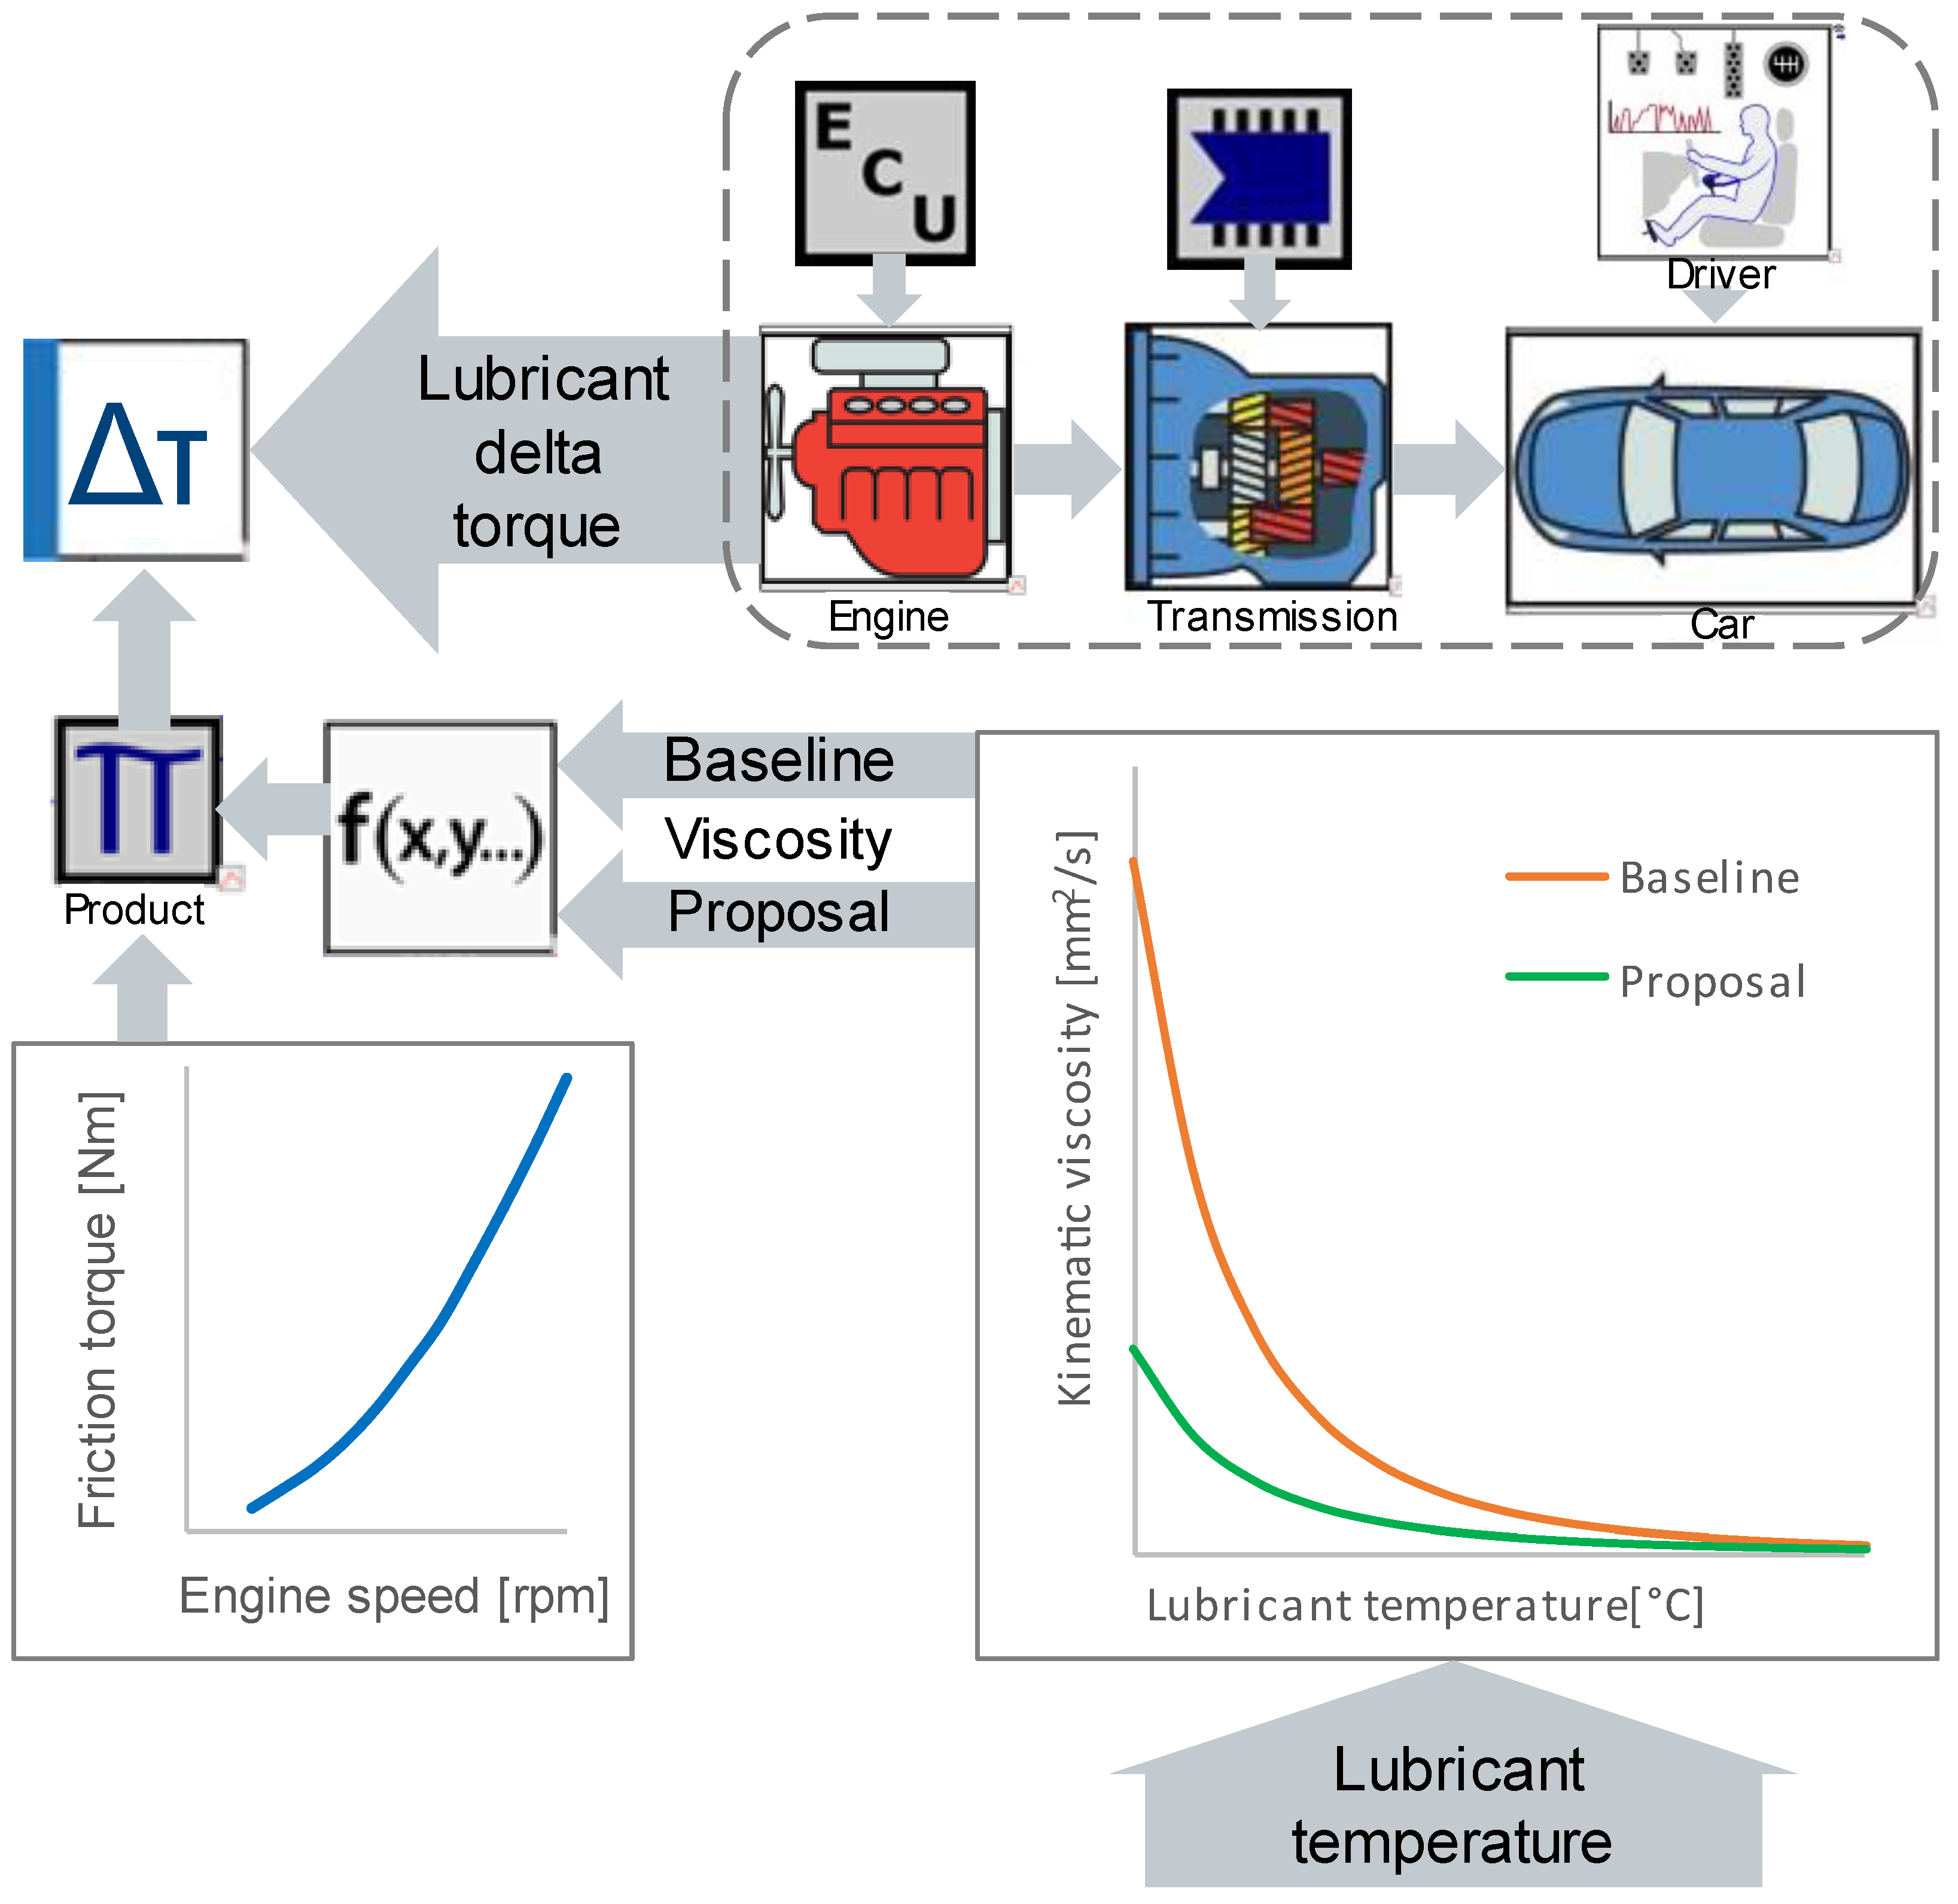
The lubricant’s impact on engine friction can be mathematically estimated by a viscosity ratio powered by an engine specific index that accounts for the lubricant viscosity influence on the lubrication regime of each engine tribological system (Equation (1), in Section 2.3). This method was adopted by Shayler et al. [19], Taylor [20], Sandoval and Heywood [21].
The lubricant higher viscosity in low temperatures, studied by Seeton [22], and its influence on engine friction and consequently on higher fuel consumption during cold conditions, e.g., cold start and warm-up, were also investigated by Roberts, Brooks and Shipway [23], Liu et al. [24], Lim et al. [25] and Rovai and Mady [26]. Jehlik and Rask [27] adjusted the engine efficiency map for engine cold conditions to be interpolated with the stabilized map through the vehicle test cycle.
This study investigates the effect of a lower viscosity engine oil and FM additive on engine friction reduction and vehicle fuel economy. A baseline 5W40 was compared with two low viscosity engine oil proposals, 5W20 without FM and 0W16 with FM [28]. The experimental in-cycle tests were performed on a chassis dyno in an OEM certified emissions laboratory. A numerical simulation model based on lubricant viscosity impact in engine friction was built and compared with experimental results.

2. Materials and Methods

2.1. Tested Engine Lubricants

Three fully-formulated engine lubricants were tested, with main characteristics shown in Table 1. The 5W40 is lubricant OEM-certified for the tested engine and all the energy savings granted by low viscosity proposals should be compared to this baseline. The 5W40 and the 5W20 do not contain FM. The 0W16 is a proposal with FM containing 900 ppm Molybdenum (Mo). The 5W20 is a low viscosity lubricant proposal close to baseline 5W40, that would demand lower experimental validation efforts to be released. The 0W16 is the lowest viable commercial viscosity oil supported by American Petroleum Institute (API) and there is the additional concern of engine damage going lower than that in viscosity.
Lubricant viscosity behavior at lower temperatures is an important variable improving vehicle fuel economy at cold start and warm-up phases according to Roberts, Brooks and Shipway [23]. Lubricant VI is important for engine cold start and high temperature protection. The higher the VI the more stable is the lubricant film across the engine operating temperatures for a given viscosity. But, once we are comparing three oils with totally different viscosities, VI will not play a big role in the analysis for efficiency. The viscosity profile of the lubricants is more helpful in this case. The kinematic viscosity behavior with the temperature of the tested lubricant was plotted in Figure 2. The lower viscosity of 5W20 and 0W16 proposals compared to a baseline 5W40 are more pronounced in lower temperatures but a significant viscosity reduction is still observed in steady temperatures that represents most of the measurements in the vehicle, magnified in the detail of Figure 2. According to Brazilian standards, homologation cold start temperature must range between 20 and 30 °C in urban FTP75 in-cycle emissions test performed in a chassis dyno in emissions laboratory (NBR6601, [29]) and must be higher than 10 °C in Real Drive Emissions (RDE) tests (NBR 17011, [30]).

2.2. Experimental Measurements in Vehicle

A large SUV, powered only by an ICE, was tested in an OEM-certified emissions laboratory. The vehicle in-cycle tests were performed in a combined cycle on a chassis dyno, according to NBR7024 [31], with fuel consumption result balanced by 55% of an urban cycle (FTP75) and 45% of a highway cycle. The urban and highway speed profiles are defined by the United States Environmental Protection Agency (EPA) [32]. The FTP75 (urban cycle) comprises three test phases (Ph1, Ph2 and Ph3, in Figure 3). The first (Ph1) and third (Ph3) phases has the same vehicle speed profile, but Ph1 starts with engine cold start between 20 and 30 °C, while Ph3 has an engine hot start after a 9 min soak time. The engine warm-up extends through Ph1 and Ph2 and a comprehensive analysis dividing the FTP75 in each phase allows a better investigation regarding lubricant temperature and viscosity impact on fuel economy. Most of the tailpipe pollutants are emitted before catalytic converter light-off, after cold start, at the first 30 s of Ph1.
The vehicle powertrain comprises a 4-stroke, 4-cylinder, turbocharged, direct injection, SI, flex fuel ICE, coupled by a torque converter to a conventional 6-gear automatic transmission. This engine is equipped with a variable oil pump and validated with 5W40 and 0W20, adopted according to application. Two emissions tests were performed with each lubricant, with engine running always on E22 (Brazilian reference gasoline with 22% v/v of anhydrous ethanol, [33]).
The vehicle fuel consumption was experimentally determined by carbon balance method. The measurement uncertainties are minimized considering the tests were performed in an OEM certified emissions laboratory equipped with a single 48 inches dyno roll, which assures a single tire contact point and better repeatability, with tailpipe gases collected by a constant volume sampling (CVS) system. Test repeatability was improved keeping the same vehicle, driven by the same expert driver, with the same fuel at the same laboratory test cell.
Additional care was taken on testing procedure. The vehicle start-stop system, which could represent a risk of test variability due to different behavior at vehicle stops, was manually turned-off. The actual vehicle speed and the 12V battery voltage were recorded from ECU. A K-type thermocouple was installed through engine dipstick to measure oil sump temperature. The measurements were recorded by ETAS Inca equipment at 100 ms sample rate. These measured data were input in a 1D mathematical model of this vehicle built in a GT-SUITE v.2024 from Gamma Technologies to compensate test results of vehicle speed and battery recharging impacts, following the procedure detailed by Rovai and Tomanik [34].
The fuel economy uncertainty, lower than 2% from carbon balance method according to EPA [32], is expected to be significantly reduced by the improved experimental procedure adopted in this study.
The baseline 5W40 lubricant replacement by the proposals, 5W20 and 0W16, was carefully carried out in two steps to minimize test uncertainty from any lubricant contamination by the different lubricant tested before. In the first step, the tested lubricant was drained, a new lubricant filter was installed, and the engine was filled out with the new proposed lubricant, used to run the engine and flush it by about 10 min. In the second step, the lubricant used to flush the engine is drained, a new lubricant filter was installed, and the engine was filled with the proposed lubricant to be tested. Note that the engine flush was performed with the same lubricant sample that will be tested, and the lubricant filter was changed twice between lubricant proposals. The same lubricant volumes were used on each lubricant variants to avoid lubricant temperature or churning losses uncertainties, and the lubricant volume was confirmed by the engine dipstick.

2.3. Numerical Simulation

Numerical simulations of vehicle fuel economy, based on lubricant viscosity impact on engine friction, were performed with a mathematical model built on a GT-SUITE v. 2024 from Gamma Technologies. The lubricant impact on engine friction is applied on the engine crankshaft through the dynamic driving cycles, FTP75 and highway. The vehicle drag forces, determined by vehicle horizontal dynamic equations, according to Brunetti [35] and Gillespie [36], were determined to calculate the instantaneous vehicle fuel consumption and the total fuel consumed into a driving cycle. The instantaneous fuel consumed considers the engine efficiency mapping in a dyno bench. Comparing the simulations performed with the same vehicle, in a same driving cycle, with only engine friction variation from lubricant, is a reliable tool to estimate the impact of lubricant viscosity on vehicle fuel economy. Despite the absolute simulation results uncertainties compared to experimental tests, this comparative simulation has significantly lower uncertainty.
The lubricant viscosity impact on engine friction mean effective pressure (FMEP) can be determined by Equation (1), according to Shayler et al. [19] and Taylor [20]. Equation (1) can consider either kinematic or dynamic lubricant viscosity for negligible specific mass variations, adopted by Sandoval and Heywood [21] and by Heywood [37]. The lubricant properties and its impacts on engine friction is defined by the power index (i) in Equation (1). This power index (i) varies from 0.19 to 0.30, with usual 0.25 value adopted by Taylor [20]. According to Shayler et al. [19], the power index (i) shows linear behavior from 0.29 to 0.35. The power index (i) was experimentally determined in an engine from same engine family, following the procedure performed by Rovai and Mady [26], reaching a plausible value between 0.25 and 0.30.
F M E P p r o p o s a l F M E P b a s e l i n e = v p r o p o s a l v b a s e l i n e i
The FMEP is calculated by Equation (2) [35,37], with k = 2 for a 4-stroke engine, engine friction torque (τfriction), and engine displacement (Vd).
F M E P = 2 k τ f r i c t i o n V d
Substituting the FMEP by engine friction torque (τfriction) in Equation (1), the lubricant delta torque (Δτlubricant) of a baseline lubricant, compared to a low viscosity proposal, can be calculated by Equation (3), in which the baseline engine friction torque (τfriction) is experimentally measured in function of engine speed in an engine motoring test, performed on an active dyno bench with baseline 5W40 lubricant at steady conditions.
τ l u b r i c a n t = v b a s e l i n e v p r o p o s a l i 1 · τ f r i c t i o n
The lubricant delta torque (Δτlubricant) determined by Equation (3) is applied in the engine crankshaft of simulation model, detailed in Figure 4 (Δτ), to calculate the impact of lubricant on vehicle fuel consumption. Considering the low viscosity lubricant proposal results in lower engine friction than the baseline, this delta torque would result in lower engine friction and consequently lower vehicle fuel consumption to follow the vehicle test cycle speed profile.
In Figure 4, the lubricant temperature input is considered to estimate baseline (υbaseline) and proposal (υproposal) lubricant kinematic viscosities. The baseline engine friction torque (τfriction) is determined by the calculated engine speed and the experimentally determined engine friction curve. The instantaneous lubricant delta torque (Δτlubricant), calculated with Equation (3), is applied in engine crankshaft of vehicle mathematical model.
The simulated vehicle fuel consumption reduction with 5W20 or with 0W16 proposed lubricants, instead of the baseline 5W40, were performed for constant lubricant temperatures from 20 to 120 °C, in FTP75, highway and combined cycles. Each phase of FTP75 were individually simulated, but Ph1 and Ph3, with the same speed profile, resulted in the same results for the lubricant temperature (Figure 5).
Both 5W20 and 0W16 proposals in Figure 5 resulted in better fuel economy simulated in Ph2 of FTP75, a low vehicle speed cycle. Of the simulations in the highway cycle, the higher speed among the considered cycles resulted in lower lubricant, low viscosity, and fuel economy advantages. These simulations confirm the better advantages of low viscosity lubricants observed by Macián et al. [11], Tormos et al. [12] and Blanco-Rodríguez et al. [13].
According to Figure 5, the 5W20 fuel consumption reduction in combined cycle ranges from 2.4 to 3.1% while the 0W16 raises this benefit to a range from 3.4 to 6.1%. Both lubricant proposals increase fuel consumption reduction for lower temperatures, with more pronounced improvement with 0W16, as expected by the viscosity behavior shown in Figure 2. The advantage in fuel consumption of 0W16 from 5W20 can be estimated subtracting the values in Figure 5, resulting in about 1 to 3% in a combined cycle, depending on the lubricant temperature.

3. Results

3.1. Experimental Results

The vehicle fuel consumption measurements were performed in a certified emissions laboratory, with the same vehicle, the same fuel, keeping the same test cell, the same experienced driver and turned-off start-stop to minimize experimental uncertainties. Although the tests were conducted under these controlled conditions, the experimental raw results were additionally compensated in terms of measured vehicle speed and the average battery recharging compensation factor calculated with battery voltage measurements along tests, following the procedure developed by Rovai and Tomanik [34].
The percentual fuel consumption variations are shown in Table 2. The first test with the baseline lubricant (5W40_1) is considered the reference value to be compared with the second test with baseline lubricant (5W40_2) and the other two tests with each lubricant proposal (5W20_1, 5W20_2, 0W16_1 and 0W16_2). From Table 2 it can be concluded that the higher variations between tests were observed in Ph2 but the FTP75 and the combined resulted in variations below 2%, compatible with the total experimental uncertainties of fuel economy determined by the carbon balance method on the chassis dynamometer, investigated by Di Russo, Stutenberg and Hall [38]. The test variations with the same lubricant were below 1% in the highway cycle.
The average value of the two tests with baseline lubricant (Avg 5W40) in Table 2 is the average reference value to be compared with the average results with 5W20 (Avg 5W20) and 0W16 (Avg 0W16). The 5W20 reduced baseline fuel consumption from 2.0 to 4.8% with the higher results observed in low-speed tests, Ph2, and the lower reductions in highway cycle, road condition with higher engine speeds and loads, aligned with the behavior observed by Macián et al. [11] and Tormos et al. [12]. The 3.5% lower fuel consumed in combined cycle with 5W20 instead of 5W40 is close to expected by Blanco-Rodríguez et al. [13] in a WLTC with 0W20 instead of 5W40 lubricant. The fuel economy achieved with 0W16 varies from 5.1 to 8.1%, considerably higher than the observed with 5W20, with higher improvements observed in Ph2.
The lower lubricant viscosity could theoretically lead to a higher lubricant consumption due to higher contact friction considering the power cell engine parts and the blow-by system were designed for the baseline lubricant, and not necessarily adequate for the tested low viscosity lubricant proposals. The observed NMOG percentual variations, below 4% with 5W20 and below 6% with 0W16 in Table 3, can be considered small compared the NMOG magnitude below 50 mg/km. The average values below 2% in Table 3 and with slightly higher NMOG emissions with 5W20 and slightly lower with 0W16 soften the concern regarding negative impacts on lubricant fuel consumption with low viscosity oil but demands more extensive tests, outside the objective of this study.
The lubricant temperature measurements in engine oil sump performed through experimental tests are shown in Figure 6. These data would be used as numerical simulation input (Figure 4) to better represent the experimental tests and to understand the correlation between the numerical simulation predictions and the experimental results.
It can be observed in Figure 6 that the temperature profiles of 5W40 and 5W20 are similar in FTP75 (Figure 6a) with 5W20 about 1 °C lower through highway cycle (Figure 6b). The 0W16 presented slightly lower temperature profile during Ph1 of FTP75 with lower temperature tendency from Ph2. The 0W16 temperature in Ph3 is about 3 °C lower than the observed with 5W40 and 5W20. Another significant difference between 0W16 and the other lubricants can be observed during the soak period, between Ph2 and Ph3 of FTP75, which could be explained by the lubricant thermal conductivity, and lubricant properties not measured in this study. The measurements in highway (Figure 6b) resulted in about 3 °C lower temperature of 0W16 compared to a baseline 5W40. Lower temperatures are expected in the highway cycle with low viscosity lubricants, which runs in higher vehicle and engine speeds, condition in which the engine hydrodynamic friction reduction is more pronounced with lower viscosity. The lower engine speeds in FTP75, urban cycle, are less favorable to lower viscosity but can be compensated with FM, as observed by Taylor et al. [3]. In this same direction, the lower lubricant temperature for lower viscosity proposal was simulated by Blanco-Rodríguez et al. [13] to be between 5 and 10 °C lower lubricant temperature of 0W20 than with a 5W40 on WLTC, which is expected and explained by the lower friction losses and the higher specific heat of the low viscosity lubricant considered.

3.2. Numerical Simulation Results

The 1D numerical simulations considered the measured lubricant temperature profiles (Figure 6) as GT-SUITE model (Figure 4) input to estimate the lower viscosity lubricant friction torque reduction from engine crankshaft and consequently the reduction in fuel consumption through each phase of the drive cycles.
The engine delta torque from baseline 5W40 lubricant is shown in Figure 7 in blue lines for 5W20 and in green lines for 0W16 proposals in the three phases of FTP75 and in the highway cycle. The negative values in Figure 7 represents lower engine friction from lower lubricant viscosity.
In general, both 5W20 and 0W16 proposals result in engine torque reduction from lubricant lower viscosity compared to baseline 5W40 in any considered test cycles (Figure 7), with higher advantage for 0W16. The lubricant delta torque is more pronounced in the beginning of Ph1 revealing the lower viscosity sensitiveness of 0W16 between 20 and 30 °C (Figure 7a), the cold start test temperature, an effect which is less pronounced with 5W20. This lower lubricant delta torque is still observed in the beginning of Ph2 (Figure 7b) but in lower magnitude than observed in Ph1 because the higher lubricant temperature in Ph2 than in Ph1. Although the higher lubricant temperature in Ph2, this phase results in high delta torque values from lower engine speed and load conditions, as observed by Macián et al. [11], Tormos et al. [12] and Lee and Zhmud [15]. Despite the same vehicle speed profile, the lubricant delta torque advantage in Ph3 (Figure 7c) is lower than in Ph1 (Figure 7a) explained by the higher lubricant temperature in Ph3, compared to Ph1, that approximates the lubricant viscosities. The delta lubricant torque values are higher with 0W16 than with 5W20 even though the lower 0W16 temperature, shown in Figure 6, through the highway cycle (Figure 7d).
The average values of lubricant delta torque, calculated from results shown in Figure 7, are presented to each considered test cycle in Table 4. For the three lubricants considered the improvements in engine friction are more pronounced for lower lubricant viscosity and in lower lubricant temperature.
The average delta power from low viscosity lubricant is calculated to each considered test cycle and shown in Table 5. These values allow the comparison of vehicle fuel economy improvement from lower engine friction power with other engine technologies, e.g., mild hybrid (mHEV) solutions that reduces engine fuel consumption by positive torque input in crankshaft in higher peak power, about 2 kW, but not as continuously as lubricant.
The simulation results for the percentual fuel economy expected with 5W20 or 0W16 instead of reference baseline 5W40 are shown in Table 6. Fuel economy improvements are more pronounced in low speed and load conditions required in Ph2 which can be confirmed comparing the simulation of the average delta torque (Table 4) with fuel consumption variation (Table 6), as an example, the delta torque of 2.2 Nm is the same for Ph2 and Ph3 with 5W20 and results in 3.7% fuel economy in Ph2 and 2.4% in Ph3, respectively.

4. Discussion

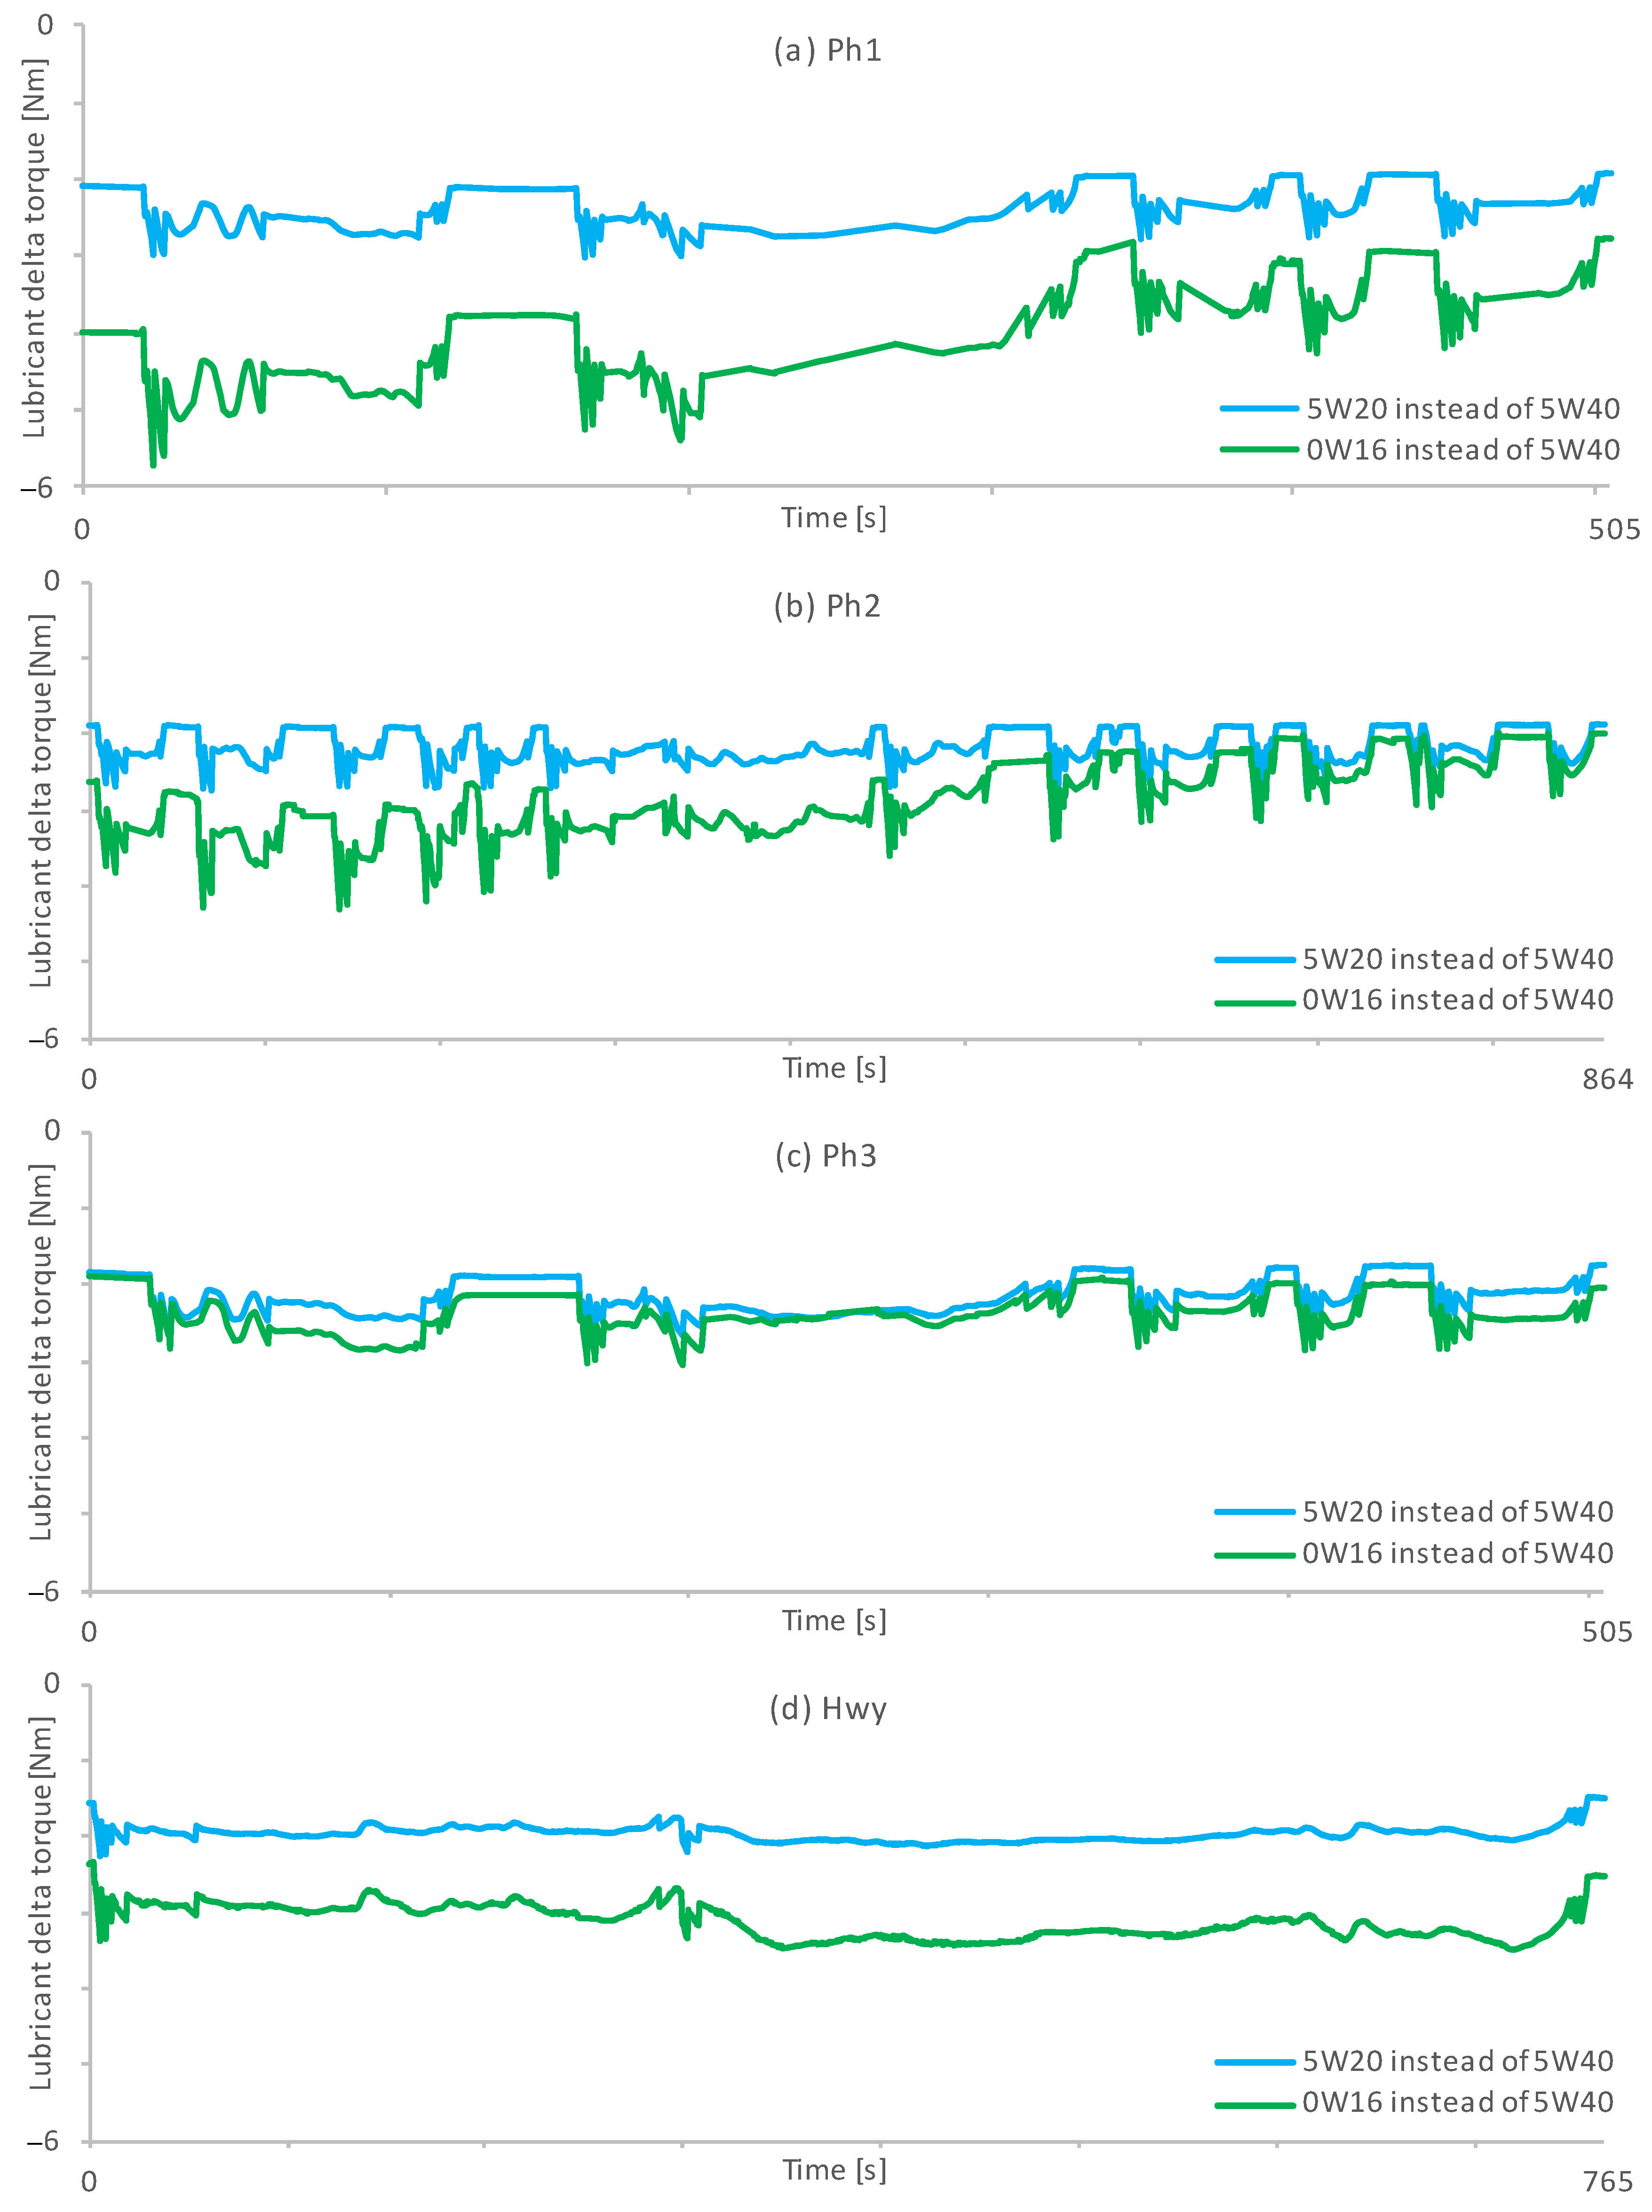
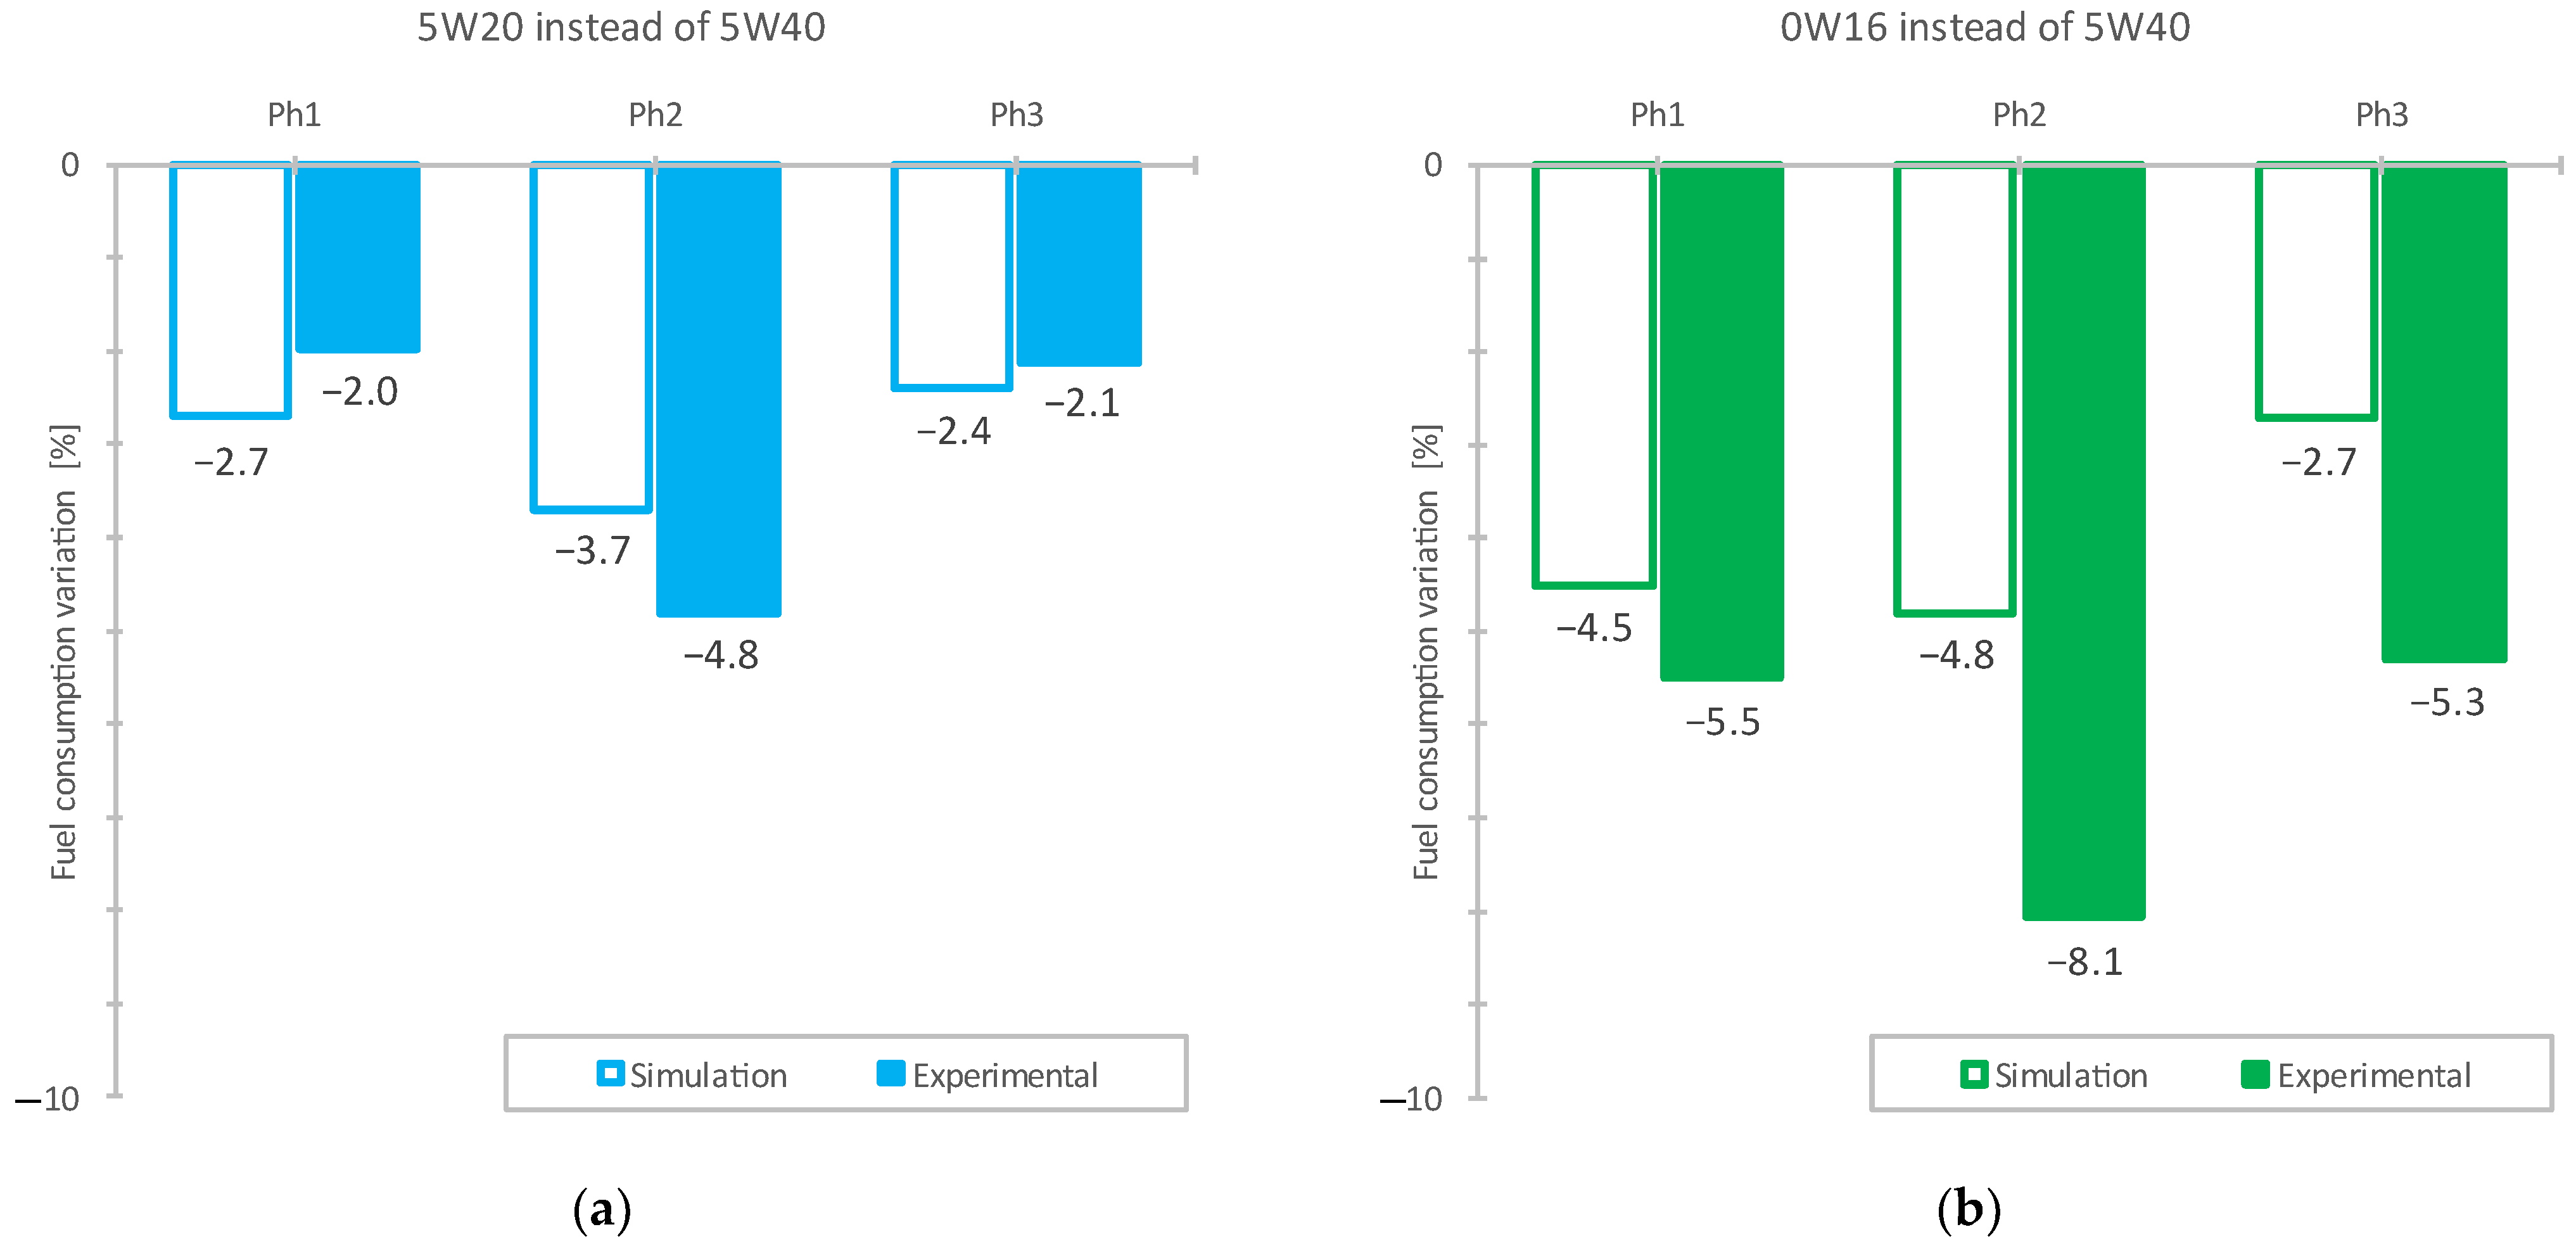
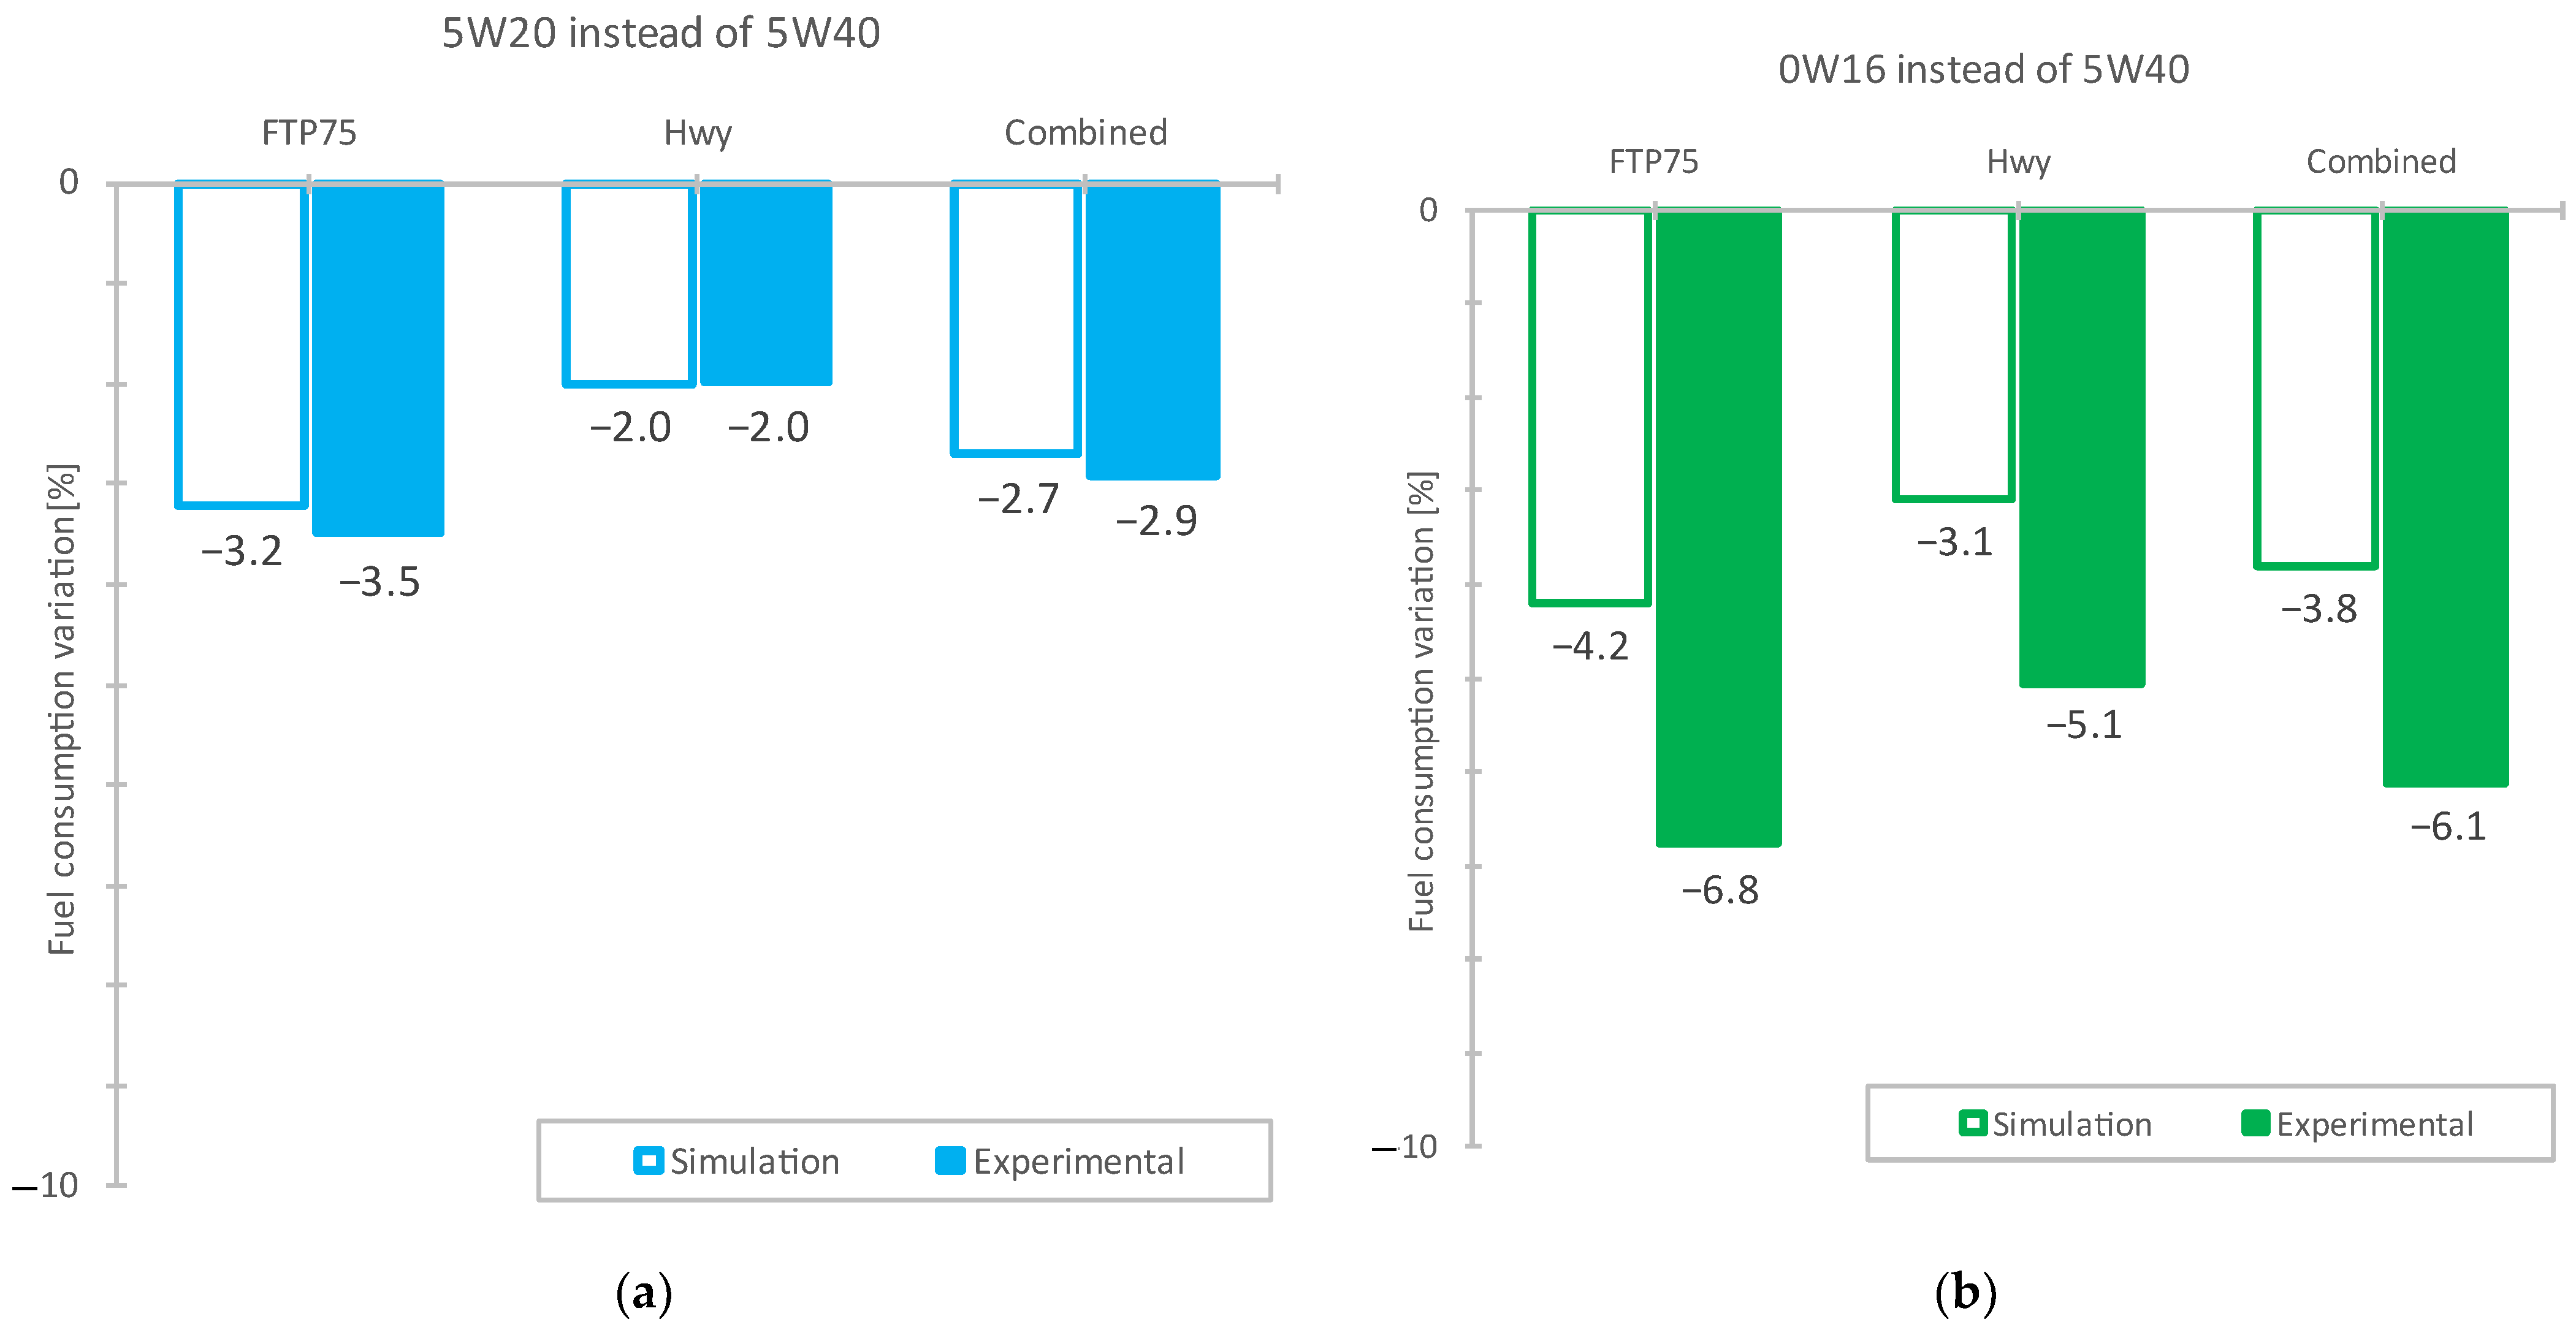
The fuel consumption variation with 5W20 or 0W16 lubricants instead of the baseline 5W40 expected by 1D numerical simulation (Table 6) are plotted with experimental results (
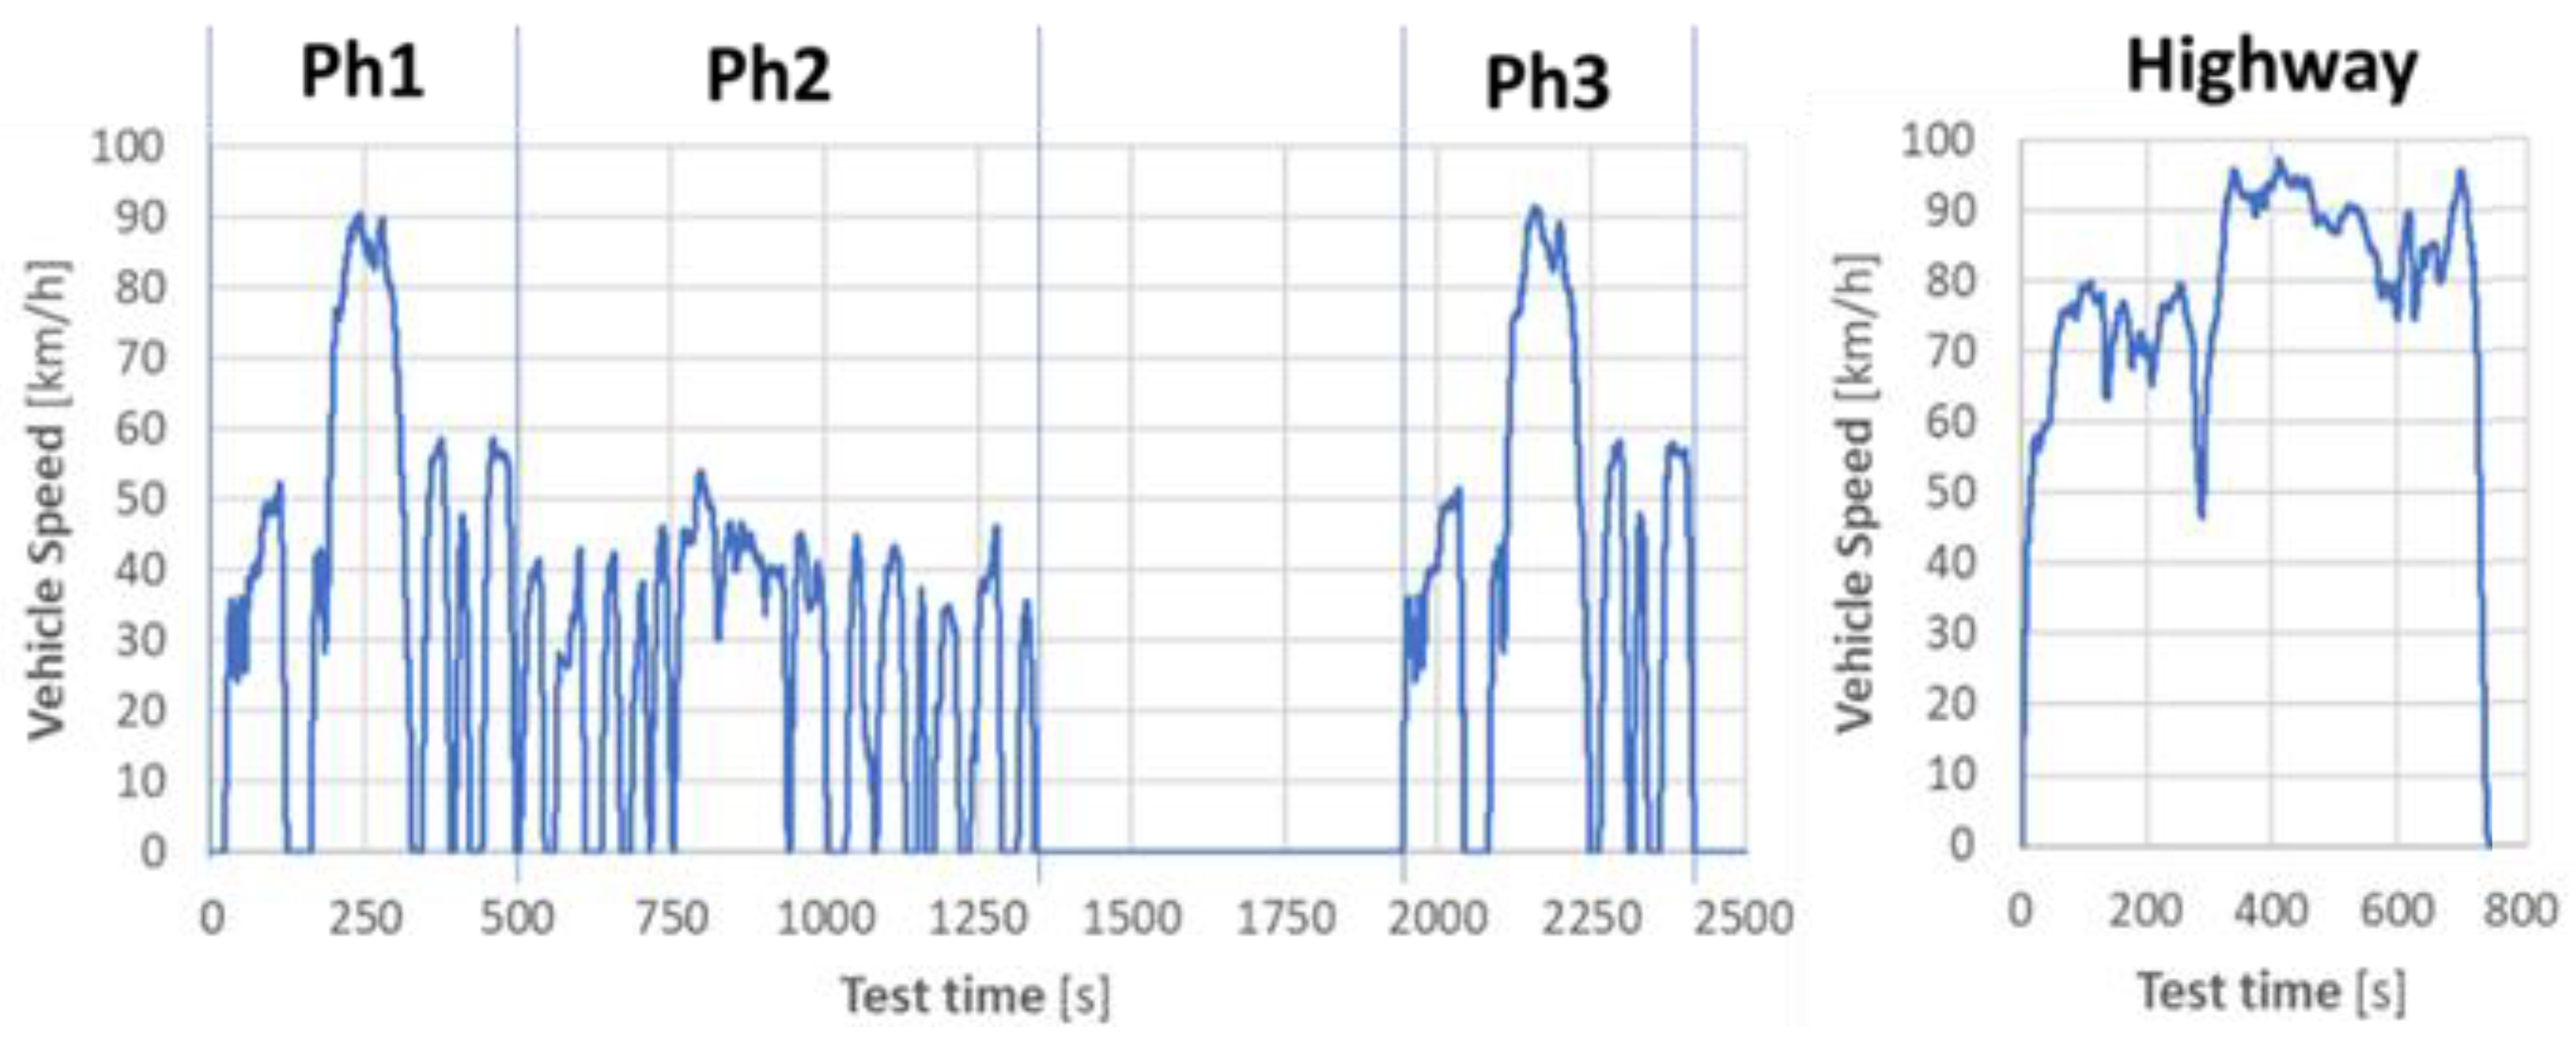
Table 2) for the three FTP75 phases, Ph1, Ph2 and Ph3, in Figure 8 and Figure 9, showing the results for FTP75 (urban cycle), highway (road cycle) and combined [31] cycle that comprises 55% of urban and 45% of road cycles.
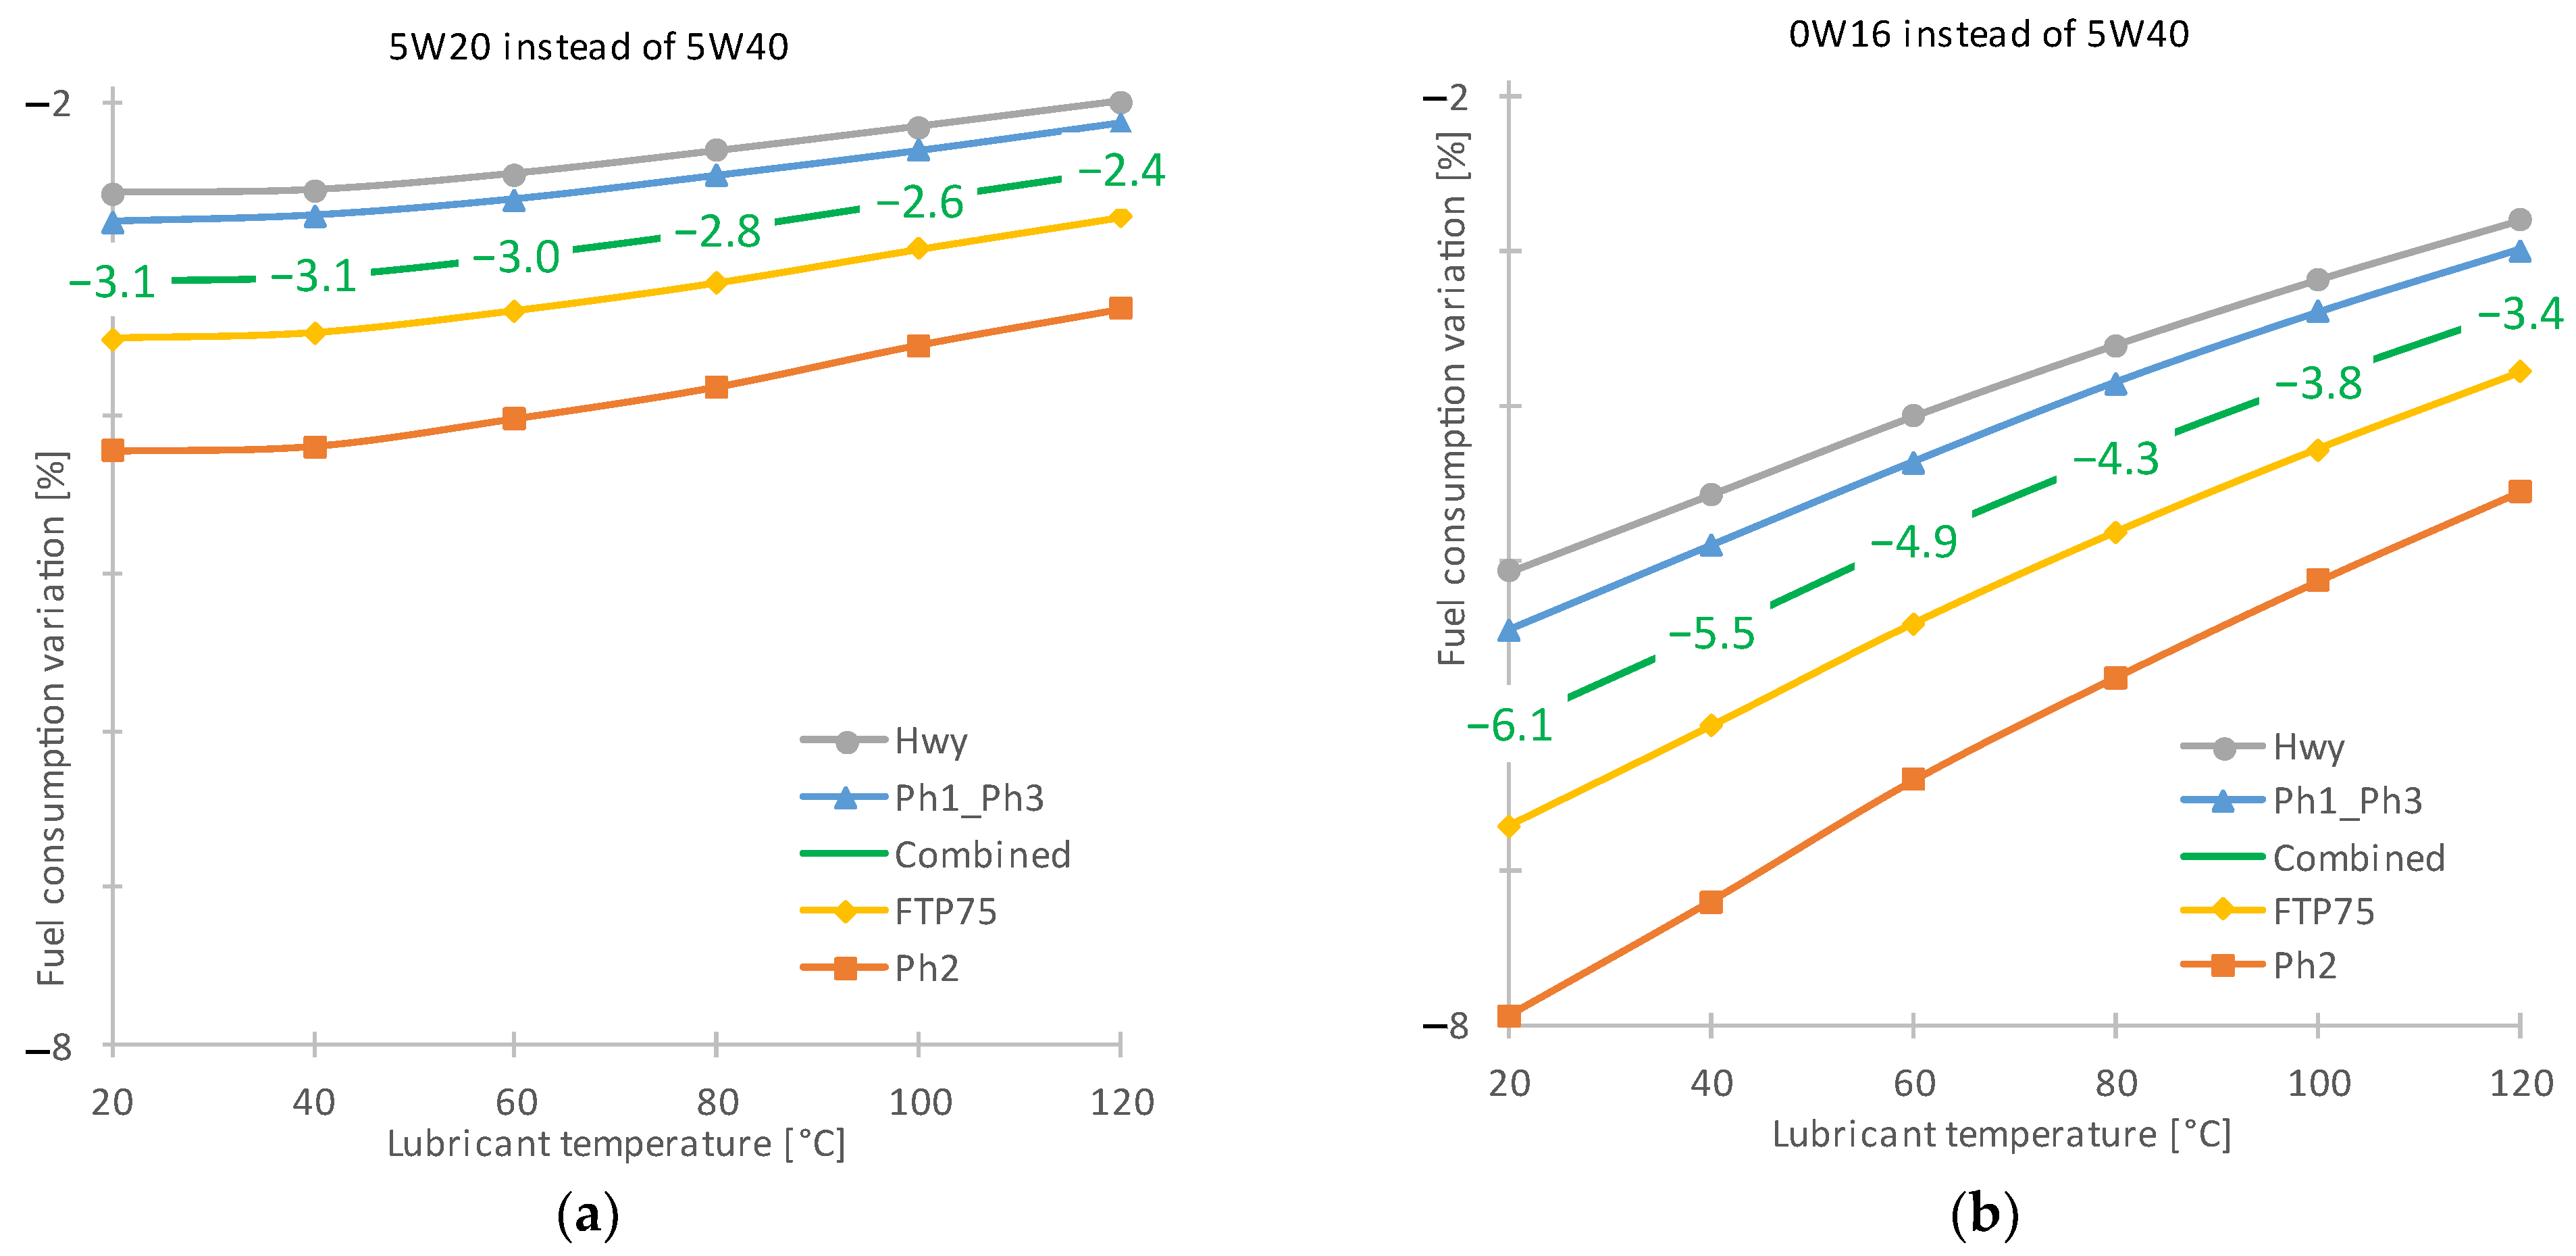
In general, the results in Figure 8 and Figure 9 shows clear reduction tendency in fuel consumption with lower viscosity lubricants, expressed by negative fuel consumption variation values. The measured fuel savings, between 2.0 and 4.8% with 5W20, and between 5.1 and 8.1% with 0W16, are significant to be compared with other technologies, e.g., engine downsizing or low voltage electrification. In addition, engine friction reduction by low viscosity lubricants can be implemented in parallel with these technologies, potentializing its results.
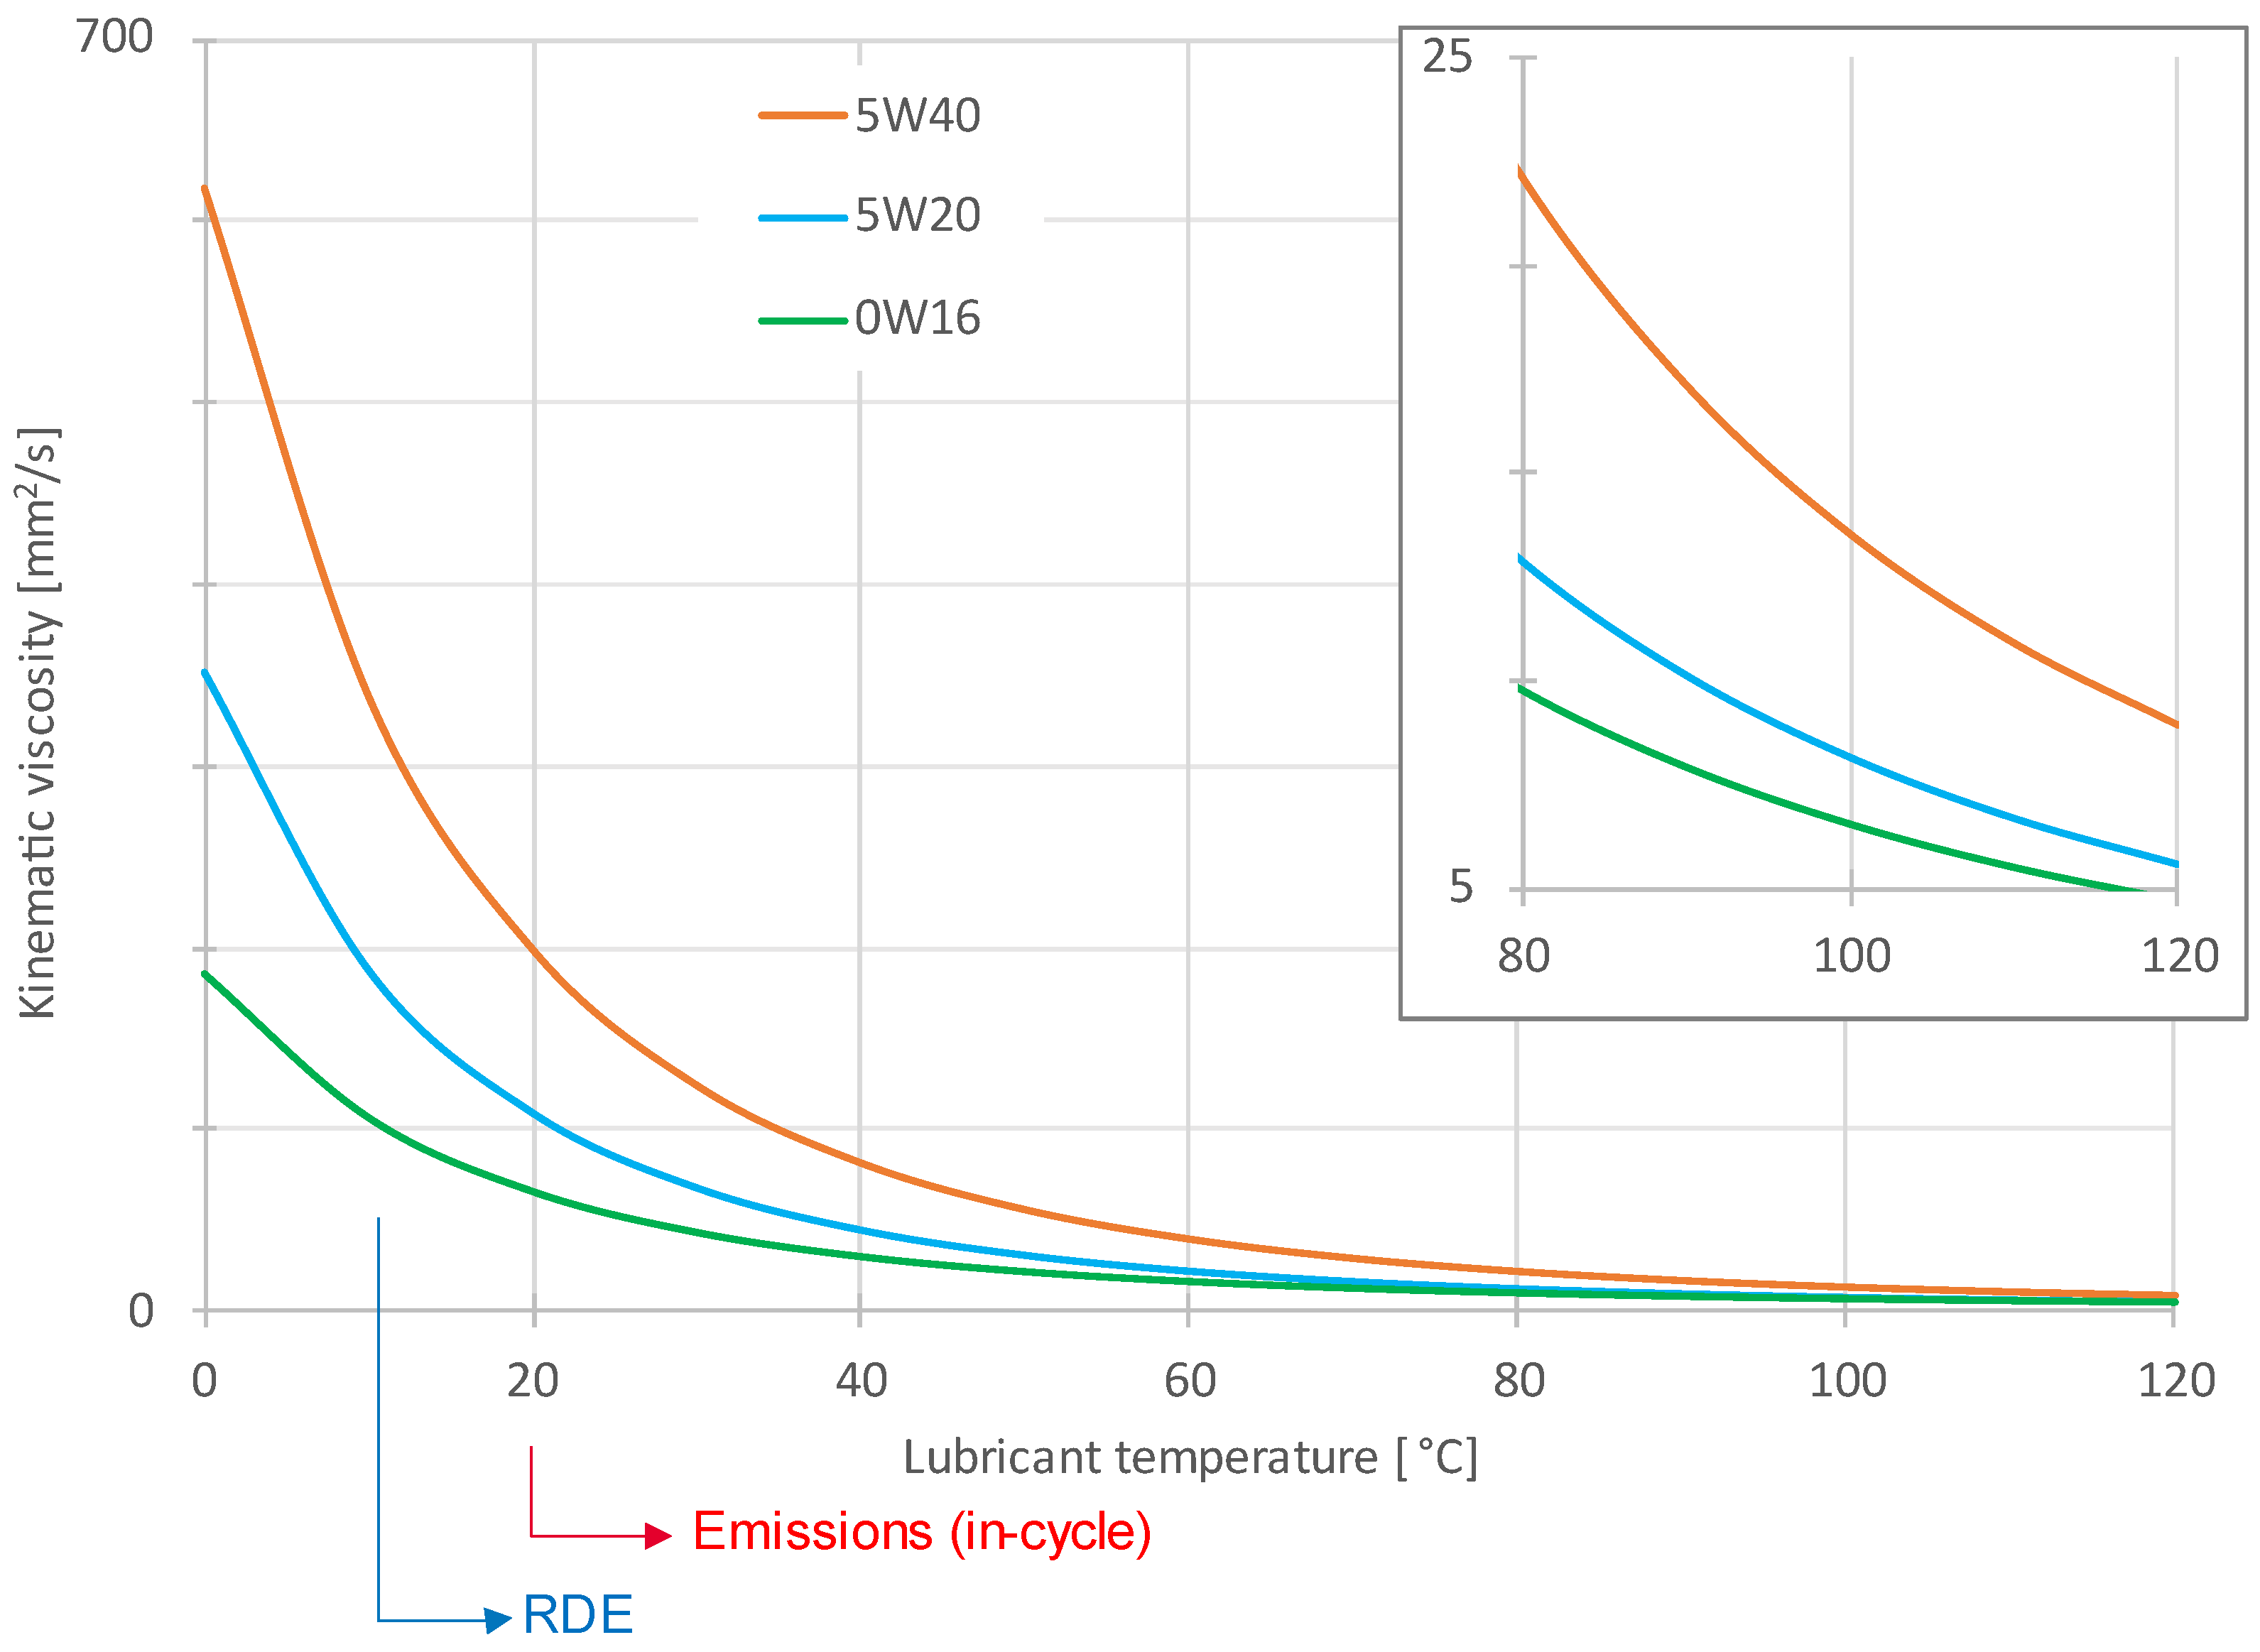
The simulation results with 5W20 conservatively follows the experimental results, with the higher deviation observed in Ph2. Simulation results for 0W16 are significantly lower than the experimental keeping the same tendency of fuel consumption reduction in each phase, with Ph2 with higher deviations. The higher fuel economy in cold phase (Ph1) compared to hot phase (Ph3), numerically calculated from lubricant viscosity variation with temperature (Figure 2), was experimentally confirmed.
The delta fuel consumption deviation between simulation and experimental results (DFC) when replacing the baseline lubricant (5W40) with the proposed low viscosity lubricants (5W20 or 0W16), plotted in Figure 8 and Figure 9, is calculated in absolute values (DFCabs_dev) by Equation (4), and in percentual values (DFCpct_dev) by Equation (5), in which DFCsim is the simulated fuel consumption reduction and DFCexp is the experimental result.
D F C a b s _ d e v = D F C e x p D F C s i m
D F C p c t _ d e v = 100 · ( D F C s i m D F C e x p ) D F C e x p
The results obtained by Equations (4) and (5) for phases 1, 2 and 3, FTP75, highway and combined cycles are shown in Table 7, in which positive values mean the simulation is optimistic and resulted in higher fuel consumption reduction than the experimentally observed, and vice versa.
The absolute deviation results are the uncertainty to be expected in vehicle fuel economy, and the percentual deviation values are helpful to understand the simulation model consistency within test conditions.
Table 7 shows the simulation results are close to experimental validation for FTP75, highway and combined cycles, with less than 0.3% absolute deviation (DFCabs_dev) and percentual deviation (DFCpct_dev) below 8%. Closer simulation results for 5W20 demonstrates good correlation between the mathematical model, based on lubricant viscosity, and the experimental results. It is important to emphasize that both 5W40 (baseline) and 5W20 proposal do not have FM.
Simulation results for 0W16 with FM instead of 5W40 resulted in more pronounced deviations from experimental measurements. For FTP75, highway and combined cycles, the absolute deviation (DFCabs_dev) was around 2%, and the percentual deviation (DFCpct_dev) was about 38% lower for fuel economy than experimentally observed, concluding the simulation results are very conservative for 0W16. The lower fuel consumption reduction from simulations with 0W16 against 5W40 probably cover the impact of lubricant lower viscosity but do not account for FM additional improvements. The tested 0W16 has 900 ppm of Molybdenum, in Table 1. The mathematical model improvement to consider FM is an important next step, which could be performed with a 0W16 sample without FM, not available in this study. Additionally, motoring FMEP and power index (i), from Equation (3), were experimentally determined only for 5W40 and should be investigated with low viscosity lubricant, desirable with and without FM.
Even conservative simulation results indicated at least 1% additional fuel saving with 0W16 compared to 5W20, except in Ph3, value that rises to about 3% based on experimental tests, see Figure 8 and Figure 9.
The NMOG measurements in Table 3 do not indicate higher lubricant consumption with lower viscosity tested proposals. Even though the lubricant temperature profiles (Figure 6) did not show lubricant temperature increase with low viscosity tested proposals, which could eventually be an indicative of poor lubricant efficiency and higher friction, the reliable engine durability should demand additional bench tests or a durability test in vehicle. Also, a concern should be applied to potentially higher low viscosity lubricants with a sensitivity to fuel dilution, observed by Taylor et al. [3]. Lubricant dilution is a relevant condition for flex fuel vehicles, especially running on ethanol in cold conditions.

5. Conclusions

Two low viscosity lubricant proposals resulted in significant in-cycle fuel economy measured on a large sport-utility SI vehicle.
The inherent experimental uncertainties, most of the time close to the fuel consumption reduction expected from low viscosity lubricant, were reduced by well-controlled experimental variables. Besides experimental validation, a 1D mathematical model of the tested vehicle were built, based on lubricant temperature and viscosity, to simulate the delta engine friction with low viscosity lubricants and its impact on fuel economy. The simulated and experimental results were compared and considered plausible.
The use of a 5W20 lubricant instead of baseline 5W40 resulted in 2.9% fuel economy measured in combined cycle, while simulation predicted 2.7%. The 5W20 good correlation between experimental and simulation results points this methodology is appropriate to predict lubricant viscosity impact in fuel economy.
The replacement of the baseline 5W40 by a 0W16 lubricant with FM resulted in 6.1% fuel economy measured in combined cycle, with 3.8% fuel economy expected by simulation. The simulation with 0W16 considered only the lubricant viscosity impact but the FM additive in this lubricant can explain the considerably higher simulation deviation, which demand mathematical model improvement to be performed in the future.
Despite these in-cycle tests performed without abnormal engine noise or irregular engine running, a deep investigation is required, in all of the vehicle environmental boundary conditions, regarding engine wear and durability, especially with 0W16.

Author Contributions

Conceptualization, F.F.R., E.S., J.C. and S.R.; methodology, F.F.R.; simulations, F.F.R.; experimental validation, F.F.R.; formal analysis, F.F.R., E.S. and J.C.; investigation, F.F.R., E.S. and J.C.; writing—original draft preparation, F.F.R.; writing—review and editing, F.F.R., E.S., J.C. and S.R. All authors have read and agreed to the published version of the manuscript.

Funding

This research received no external funding.

Data Availability Statement

The original contributions presented in the study are included in the article, further inquiries can be sent to authors.

Conflicts of Interest

Author Fernando Fusco Rovai was employed by the company VW do Brasil—Way to Zero Center. Author Eduardo Sartori was employed by the company Idemitsu Lube South America Ltda. Authors Jesuel Crepaldi and Scott Rajala were employed by the company Idemitsu Lubricants America Corp. The companies were not involved in the study design, collection, analysis, interpretation of data, the writing of this article or the decision to submit it for publication.

References

  1. Schommers, J.; Scheib, H.; Hartweg, M.; Bosler, A. Minimizing friction in combustion engines. MTZ Worldw. 2013, 74, 28–35. [Google Scholar] [CrossRef]
  2. Tomanik, E.; Profito, F.; Sheets, B.; Souza, R. Combined lubricant–surface system approach for potential passenger car CO2 reduction on piston-ring-cylinder bore assembly. Tribol. Int. 2020, 149, 105514. [Google Scholar] [CrossRef]
  3. Taylor, R.I.; Morgan, N.; Mainwaring, R.; Davenport, T. How much mixed/boundary friction is there in an engine—And where is it? Proc. Inst. Mech. Eng. Part J J. Eng. Tribol. 2020, 234, 1563–1579. [Google Scholar] [CrossRef]
  4. Tomanik, E.; Profito, F.J.; Tormos, B.; Jiménez, A.J.; Zhmud, B. Powertrain Friction Reduction by Synergistic Optimization of the Cylinder Bore Surface and Lubricant Part 1: Basic Modelling; SAE Technical Paper; SAE International: Warrendale, PA, USA, 2021. [Google Scholar]
  5. Zhmud, B.; Tomanik, E.; Jiménez, A.J.; Profito, F.; Tormos, B. Powertrain Friction Reduction by Synergistic Optimization of Cylinder Bore Surface and Lubricant-Part 2: Engine Tribology Simulations and Tests; SAE Technical Paper; SAE International: Warrendale, PA, USA, 2021. [Google Scholar]
  6. Tormos, B.; Jiménez, A.J.; Fang, T.; Mainwaring, R.; Lizarraga-Garcia, E. Numerical assessment of tribological performance of different low viscosity engine oils in a 4-stroke CI light-duty ICE. SAE Int. J. Adv. Cur. Pract. Mobil. 2022, 4, 1524–1536. [Google Scholar] [CrossRef]
  7. Devlin, M.T. Common properties of lubricants that affect vehicle fuel efficiency: A North American historical perspective. Lubricants 2018, 6, 68. [Google Scholar] [CrossRef]
  8. De Carvalho, M.J.S.; Seidl, P.R.; Belchior, C.R.P.; Sodré, J.R. Lubricant viscosity and viscosity improver additive effects on diesel fuel economy. Tribol. Int. 2010, 43, 2298–2302. [Google Scholar] [CrossRef]
  9. Cui, J.; Oberoi, S.; Briggs, S.P.; Goldmints, I.; Baxter, D. Measuring Fuel Efficiency in Various Driving Cycles: How to Get Maximum Fuel Economy Improvement from the Lubricant; SAE Technical Paper; SAE International: Warrendale, PA, USA, 2015. [Google Scholar]
  10. Kühlwein, J.; German, J.; Bandivadekar, A. Development of Test Cycle Conversion Factors among Worldwide Light-Duty Vehicle CO2 Emission Standards. 2014. Available online: https://theicct.org/sites/default/files/publications/ICCT_LDV-test-cycle-conversion-factors_sept2014.pdf (accessed on 14 December 2024).
  11. Macián, V.; Tormos, B.; Bermúdez, V.; Ramírez, L. Assessment of the effect of low viscosity oils usage on a light duty diesel engine fuel consumption in stationary and transient conditions. Tribol. Int. 2014, 79, 132–139. [Google Scholar] [CrossRef]
  12. Tormos, B.; Pla, B.; Bastidas, S.; Ramirez, L.; Perez, T. Fuel economy optimization from the interaction between engine oil and driving conditions. Tribol. Int. 2019, 138, 263–270. [Google Scholar] [CrossRef]
  13. Blanco-Rodríguez, J.; Simón-Montero, X.; Cortada-García, M.; Maroto, S.; Porteiro, J. Modelling the impact of reducing lubricant viscosity on a conventional passenger car fuel economy and wear protection. Results Eng. 2024, 24, 103159. [Google Scholar] [CrossRef]
  14. Zhang, Y.; Ma, Z.; Feng, Y.; Diao, Z.; Liu, Z. The effects of ultra-low viscosity engine oil on mechanical efficiency and fuel economy. Energies 2021, 14, 2320. [Google Scholar] [CrossRef]
  15. Lee, P.; Zhmud, B. Low friction powertrains: Current advances in lubricants and coatings. Lubricants 2021, 9, 74. [Google Scholar] [CrossRef]
  16. Barnhill, W.C.; Gao, H.; Kheireddin, B.; Papke, B.L.; Luo, H.; West, B.H.; Qu, J. Tribological bench and engine dynamometer tests of a low viscosity SAE 0W-16 engine oil using a combination of ionic liquid and ZDDP as anti-wear additives. Front. Mech. Eng. 2015, 1, 12. [Google Scholar]
  17. D8114-22; Standard Test Method for Measurement of Effects of Automotive Oils on Fuel Economy of Passenger Cars and Light-Duty Trucks in Sequence VIE Spark Ignition. ASTM International: West Conshohocken, PA, USA, 2022.
  18. D8226-21a; Standard Test Method for Measurement of Effects of Automotive Oils on Fuel Economy of Passenger Cars and Light-Duty Trucks in Sequence VIF Spark Ignition Engine. ASTM International: West Conshohocken, PA, USA, 2022.
  19. Shayler, P.J.; Leong, D.K.; Murphy, M. Contributions to Engine Friction During Cold, Low Speed Running and the Dependence on Oil Viscosity. SAE Trans. 2005, 114, 1191–1201. [Google Scholar]
  20. Taylor, R.I. Tribology and energy efficiency: From molecules to lubricated contacts to complete machines. Faraday Discuss. 2012, 156, 361–382. [Google Scholar]
  21. Sandoval, D.; Heywood, J.B. An improved friction model for spark-ignition engines. SAE Trans. 2003, 112, 1041–1052. [Google Scholar]
  22. Seeton, C.J. Viscosity-temperature correlation for liquids. In Proceedings of the International Joint Tribology Conference, San Antonio, TX, USA, 23–25 October 2006; pp. 131–142. [Google Scholar]
  23. Roberts, A.; Brooks, R.; Shipway, P. Internal combustion engine cold-start efficiency: A review of the problem, causes and potential solutions. Energy Convers. Manag. 2014, 82, 327–350. [Google Scholar]
  24. Liu, Q.; Liu, J.; Fu, J.; Li, Y.; Luo, B.; Zhan, Z.; Deng, B. Comparative study on combustion and thermodynamics performance of gasoline direct injection (GDI) engine under cold start and warm-up NEDC. Energy Convers. Manag. 2019, 181, 663–673. [Google Scholar]
  25. Lim, G.B.; Wi, H.S.; Park, J.I.; Lee, J.H.; Park, K.S. Effect of engine friction on vehicle fuel economy during warm-up. Trans. Korean Soc. Automot. Eng. 2008, 16, 109–114. [Google Scholar]
  26. Rovai, F.F.; Mady, C.E.K. Thermodynamic Model for Cold-Phase Influence on Light Vehicles’ Fuel Consumption. Energies 2024, 17, 4093. [Google Scholar] [CrossRef]
  27. Jehlik, F.; Rask, E. Development of Variable Temperature Brake Specific Fuel Consumption Engine Maps; SAE Technical Paper; SAE International: Warrendale, PA, USA, 2010. [Google Scholar]
  28. SAE Standard J300_202405; SAE International Recommended Practice, Engine Oil Viscosity Classification. SAE International: Warrendale, PA, USA, 2024.
  29. NBR6601; Light Motor Vehicles—Determination of Hydrocarbons, Carbon Monoxide, Nitrogen Oxides, Carbon Dioxide and Particulate Matter in Exhaust Gas. ABNT: Rio de Janeiro, Brazil, 2021.
  30. NBR17011; Light Duty Road Vehicles—Determination of Non-Methane Organic Gases, Hydrocarbon, Carbon Monoxide, Nitrogen Oxide and Carbon Dioxide on Exhaust Gas in Real Driving. ABNT: Rio de Janeiro, Brazil, 2022.
  31. NBR7024; Light Motor Vehicles—Measurement of the Fuel Consumption—Test Method. ABNT: Rio de Janeiro, Brazil, 2010.
  32. United States Environmental Protection Agency (EPA). Dynamometer Drive Schedules. Available online: https://www.epa.gov/vehicle-and-fuel-emissions-testing/dynamometer-drive-schedules#vehicleDDS (accessed on 8 January 2025).
  33. Brazilian National Institute of Metrology, Quality and Technology (INMETRO)-Ordinance n◦ 15; Brazil. 2016. Available online: http://sistema-sil.inmetro.gov.br/rtac/RTAC002358.pdf (accessed on 21 January 2025).
  34. Rovai, F.F.; Tomanik, E. Lubricant viscosity impact in fuel economy: Experimental uncertainties compensation. Lubricants 2025, 13, 49. [Google Scholar] [CrossRef]
  35. Brunetti, F. Motores de Combustão Interna; Editora Blucher: Sao Paulo, Brazil, 2018; Volume 1. [Google Scholar]
  36. Gillespie, T. (Ed.) Fundamentals of Vehicle Dynamics; SAE International: Warrendale, PA, USA, 2021. [Google Scholar]
  37. Heywood, J.B. Combustion Engine Fundamentals; McGraw-Hill Education: New York, NY, USA, 2018. [Google Scholar]
  38. Di Russo, M.; Stutenberg, K.; Hall, C.M. Analysis of uncertainty impacts on emissions and fuel economy evaluation for chassis dynamometer testing. IEEE Trans. Veh. Technol. 2022, 72, 4236–4251. [Google Scholar]
Figure 1. Delta engine FMEP in a 4-cylinder spark ignition (SI) engine. (a) 0W12 without FM compared to 15W40. (b) 0W12 with FM compared to 15W40. Adapted from Taylor et al. [3].
Lubricants 13 00137 g001
Figure 2. Lubricant viscosity variation with temperature.
Lubricants 13 00137 g002
Figure 3. NBR7024 chassis emissions test. Ph1 and Ph3 has same speed profile in the FTP75 test.
Lubricants 13 00137 g003
Figure 4. Lubricant delta torque on engine crankshaft implemented in GT-SUITE (v.2024).
Lubricants 13 00137 g004
Figure 5. Simulated percentual delta fuel consumption based on oil sump temperature. (a) 5W20 instead of 5W40 (baseline). (b) 0W16 instead of 5W40 (baseline).
Lubricants 13 00137 g005
Figure 6. Engine lubricant temperature measured in oil sump. (a) Lubricant temperature in urban (FTP75) test cycle. (b) Lubricant temperature in highway cycle.
Lubricants 13 00137 g006
Figure 7. Simulated lubricant delta torque on engine crankshaft. (a) Ph1 of FTP75. (b) Ph2 of FTP75. (c) Ph3 of FTP75. (d) Highway.
Lubricants 13 00137 g007
Figure 8. Simulated and experimental percentual fuel consumption variation in each urban (FTP75) phase: (a) 5W20 instead of 5W40 (baseline); (b) 0W16 instead of 5W40 (baseline).
Lubricants 13 00137 g008
Figure 9. Simulated and experimental percentual fuel consumption variation in urban (FTP75), highway (Hwy) and combined cycles: (a) 5W20 instead of 5W40 (baseline); (b) 0W16 instead of 5W40 (baseline).
Lubricants 13 00137 g009
Table 1. Tested engine lubricant characteristics.
Unit5W405W200W16
Kv 40mm2/s81.7545.0435.94
Kv 100mm2/s13.528.156.53
HTHSmPa.s3.5 min.2.6 min.2.3 min.
Low Temp. Cranking Visc. @−30 °CmPa.s6600 max.6600 max.6200 max.
Viscosity index (VI)-169156136
API-SNSNSP
Evaporative Loss (NOACK)mass%13 max.13 max.13 max.
Total Base Number (TBN)mg KOH/g11 min.11 min.7.6–9.0
Phosphorousmass%0.8–1.50.07–0.090.08 max.
Sulfated ashmass%1.0–1.51.2 max.0.89 typical
Chlorinemg/kgreport50 max.NA
Molybdenum (Mo)ppm--900
Friction modifier (FM)-nonoyes
Table 2. Experimental percentual fuel consumption variation.
LubricantTestPh1Ph2Ph3FTP75HwyCombined
[%][%][%][%][%][%]
5W405W40_1RefRefRefRefRefRef
5W40_2−0.2−3.5−0.1−1.9−0.8−1.5
Avg 5W40RefRefRefRefRefRef
5W205W20_1−2.6−7.5−2.4−5.1−2.3−4.0
5W20_2−1.6−5.4−1.9−3.7−2.4−3.2
Avg 5W20−2.0−4.8−2.1−3.5−2.0−2.9
0W160W16_1−5.3−9.6−5.4−7.6−5.5−6.8
0W16_2−5.9−9.7−5.3−7.7−5.4−6.8
Avg 0W16−5.5−8.1−5.3−6.8−5.1−6.1
Table 3. Experimental percentual non-methane organic gases (NMOG) variation in FTP75.
LubricantFTP75NMOG
Test[%]
5W405W40_1Ref
5W40_2+0.1
Avg 5W40Ref
5W205W20_1+3.9
5W20_2−0.3
Avg 5W20+1.7
0W160W16_1−5.9
0W16_2+3.5
Avg 0W16−1.3
Table 4. Simulated lubricant average delta torque on engine crankshaft.
LubricantPh1Ph2Ph3Hwy
[Nm][Nm][Nm][Nm]
5W40RefRefRefRef
5W20−2.4−2.2−2.2−2.0
0W16−4.0−2.9−2.4−3.1
Table 5. Simulated lubricant average delta power on engine crankshaft.
LubricantPh1Ph2Ph3Hwy
[W][W][W][W]
5W40RefRefRefRef
5W20−326−276−293−310
0W16−543−362−321−494
Table 6. Simulated percentual fuel consumption variation.
LubricantPh1Ph2Ph3FTP75HwyCombined
[%][%][%][%][%][%]
5W40RefRefRefRefRefRef
5W20−2.7−3.7−2.4−3.2−2.0−2.7
0W16−4.5−4.8−2.7−4.2−3.1−3.8
Table 7. Simulation percentual deviation from experimental results.
LubricantDeviationPh1Ph2Ph3FTP75HwyCombined
[%][%][%][%][%][%]
5W20DFCabs_dev+0.7−1.1+0.3−0.30.0−0.2
0W16DFCabs_dev−1.0−3.3−2.6−2.6−2.0−2.3
5W20DFCpct_dev+36−23+13−8+1−7
0W16DFCpct_dev−18−40−49−38−39−38
Disclaimer/Publisher’s Note: The statements, opinions and data contained in all publications are solely those of the individual author(s) and contributor(s) and not of MDPI and/or the editor(s). MDPI and/or the editor(s) disclaim responsibility for any injury to people or property resulting from any ideas, methods, instructions or products referred to in the content.

