Effect of Pipe Wall Wear Defects on the Flow Characteristics of Slurry Shield Discharge Pipe


Abstract
1. Introduction
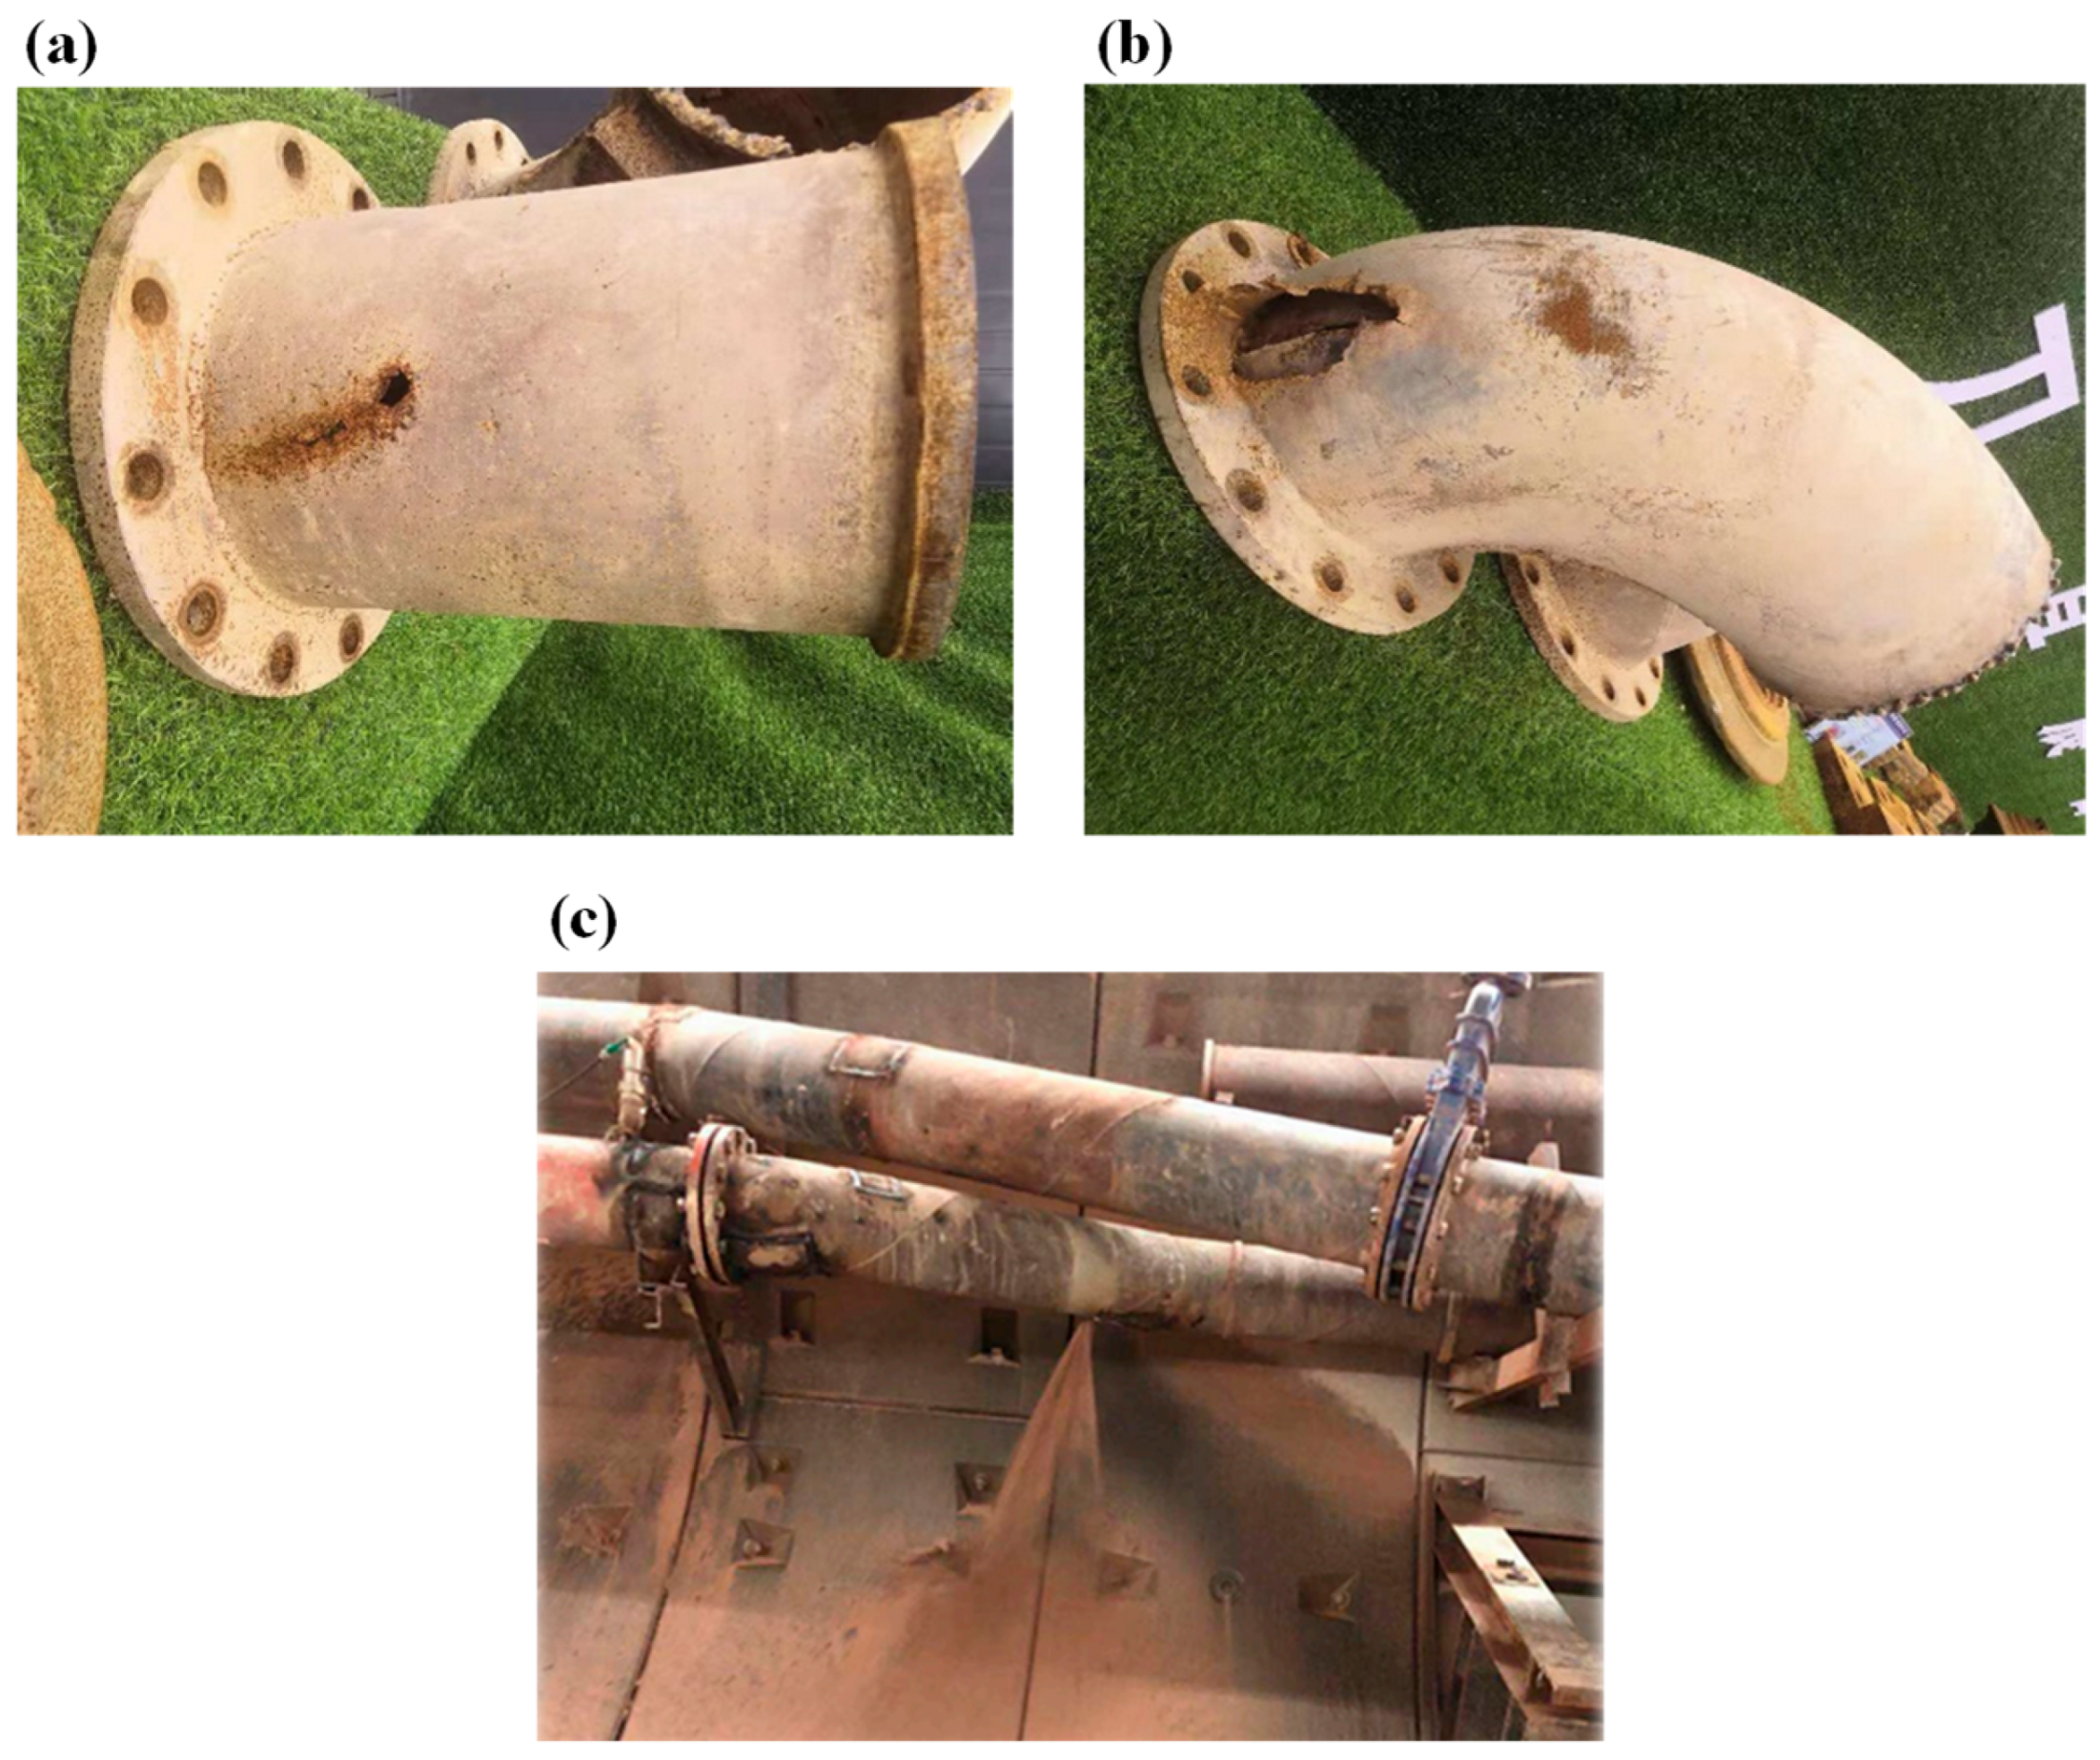
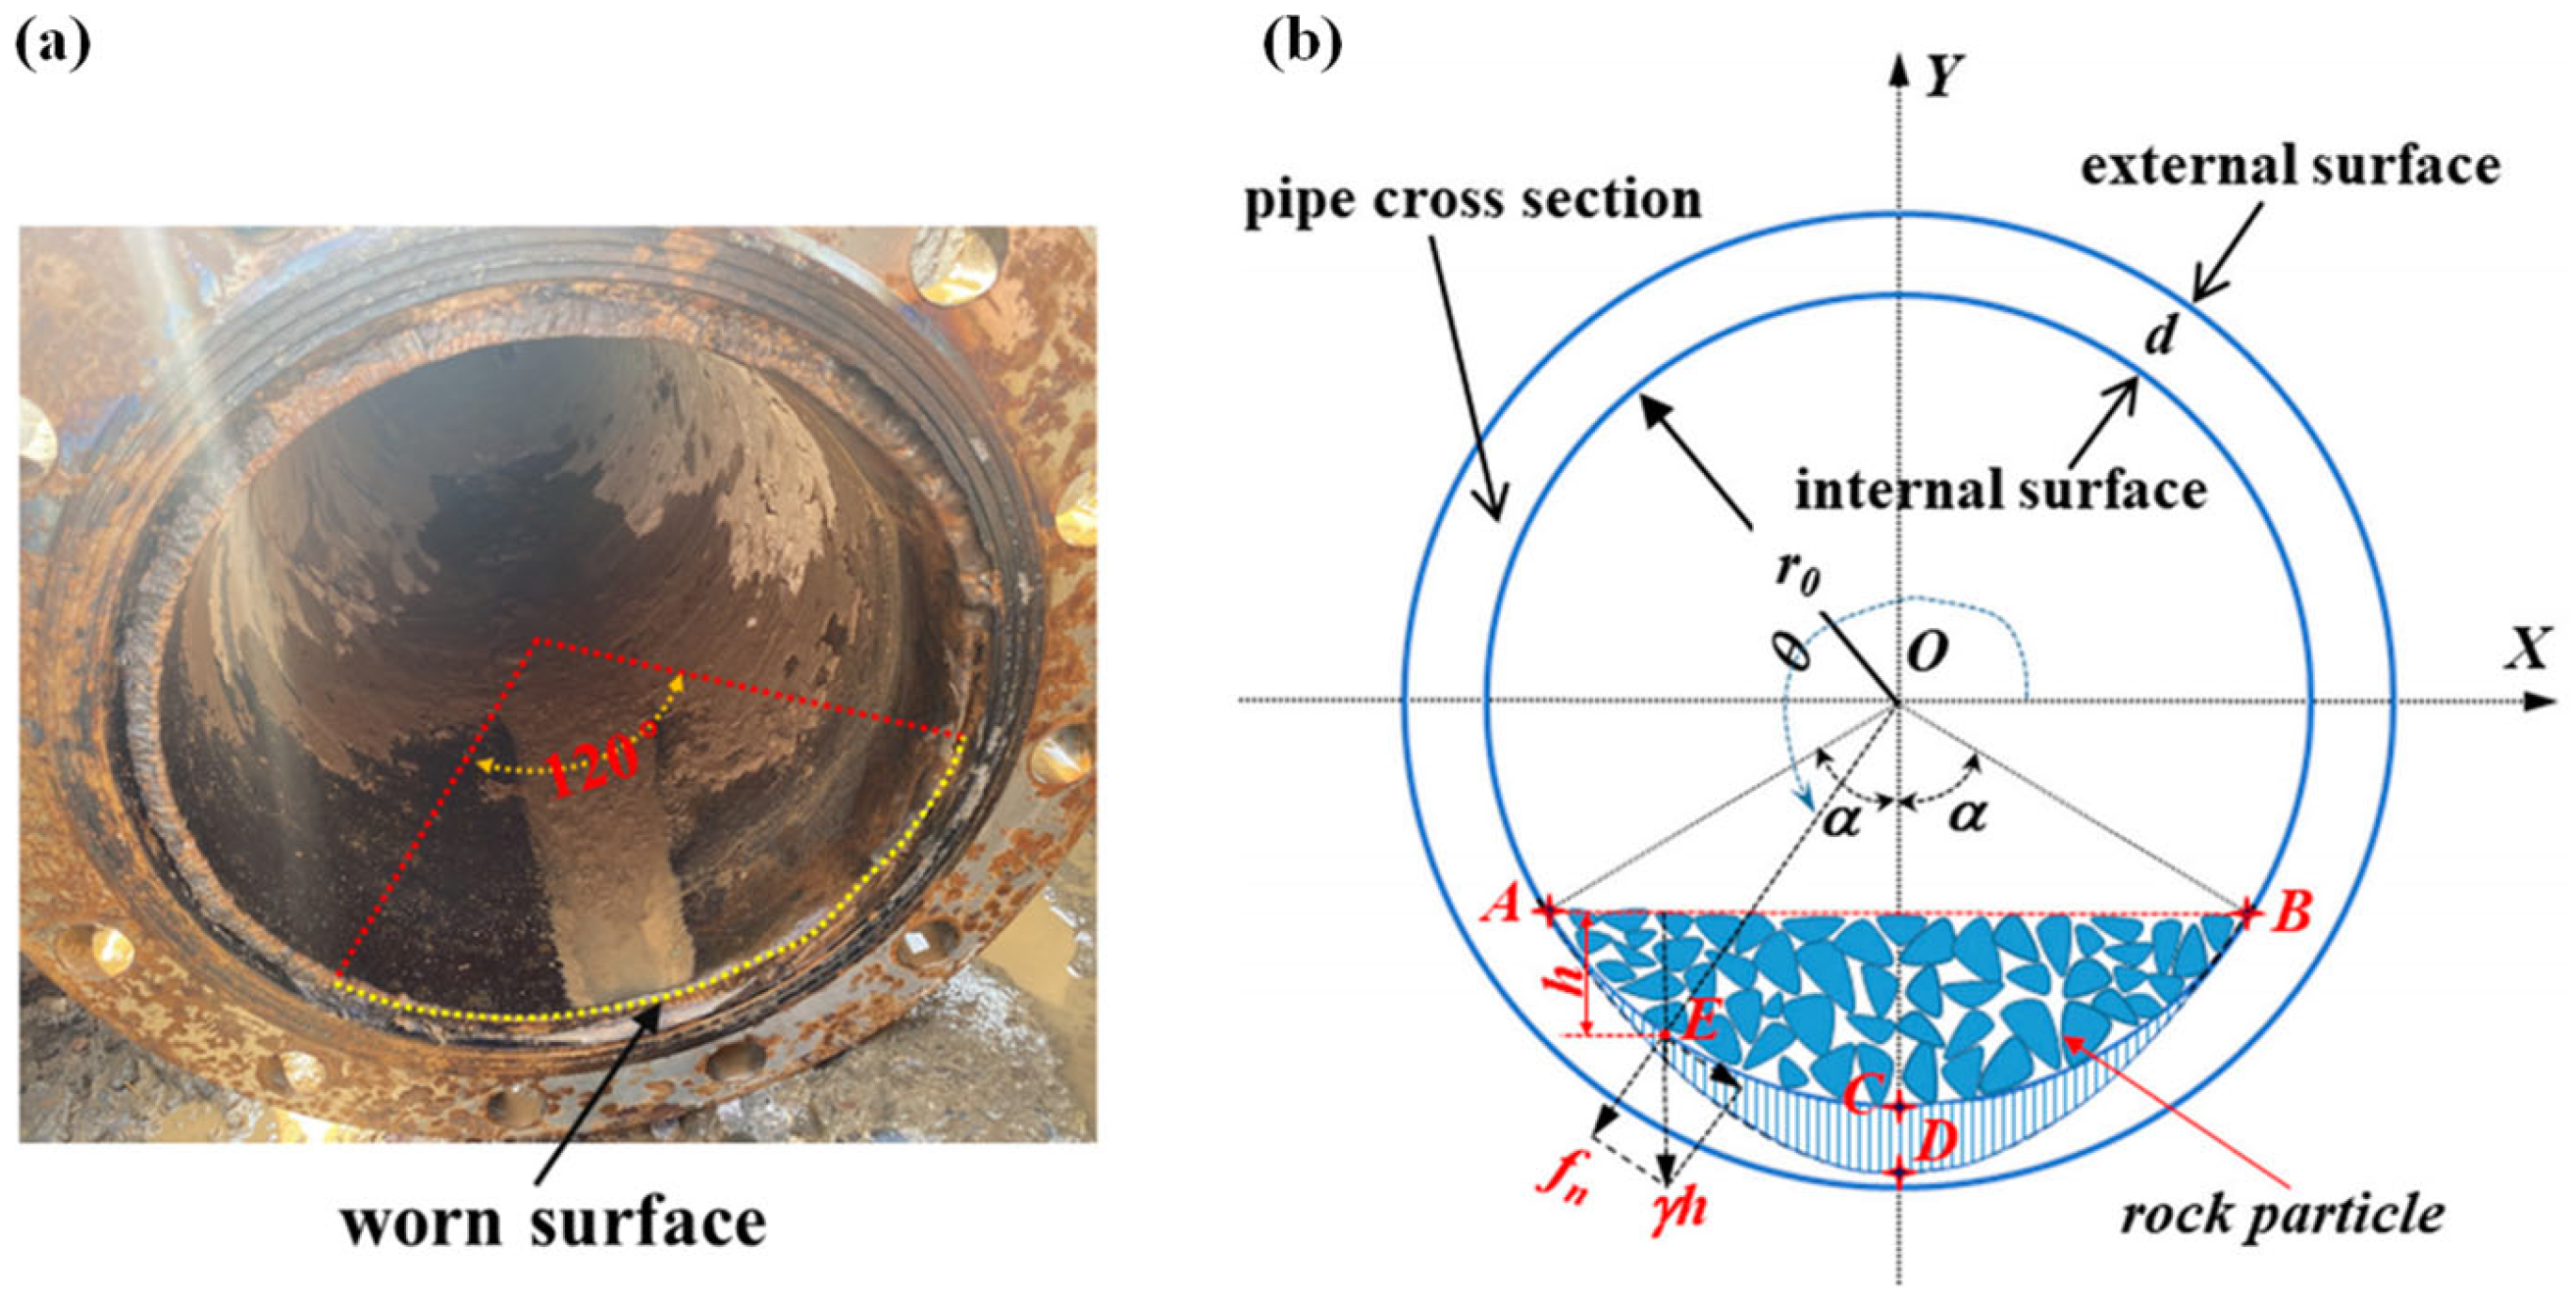
2. Description of the Wear Pattern of Pipes
2.1. Wear Pattern of Straight Pipe
2.2. Wear Pattern of 90° Elbow Pipe
3. CFD-DEM Modeling
- (1)
- Initializing fluid domain (including velocities, pressures, etc.) via CFD solver;
- (2)
- Initializing particle domain (including interaction forces, mass flow rate, and volume fraction) via DEM solver;
- (3)
- Particle domain volume fraction and initial interaction information on the DEM solver and transferred to the CFD solver;
- (4)
- CFD solver time step correction to obtain an integral multiple of the DEM solver time step;
- (5)
- One CFD solution time step and n DEM solution time steps are executed in parallel;
- (6)
- Interaction information (DEM cell-averaged values), such as interaction forces, solid phase volume fraction, solid phase velocity transfer from the DEM solver to the CFD solver;
- (7)
- Velocity, pressure, and physical properties for each mesh cell (CFD primary phase values) are transferred from the CFD solver to the DEM solver;
- (8)
- Repeating the process until the total simulation time is terminated. It was noted that when any of the modules (CFD or DEM) reaches a set termination condition (CFD is the same as DEM), the whole coupled simulation terminates. This means that after CFD reaches tfinal, the DEM computation also stops, although it has not yet reached tfinal.
3.1. CFD Simulation
3.2. DEM Simulation
3.3. Fluid-Particle Interaction
3.4. Boundary Conditions
4. Results and Analysis
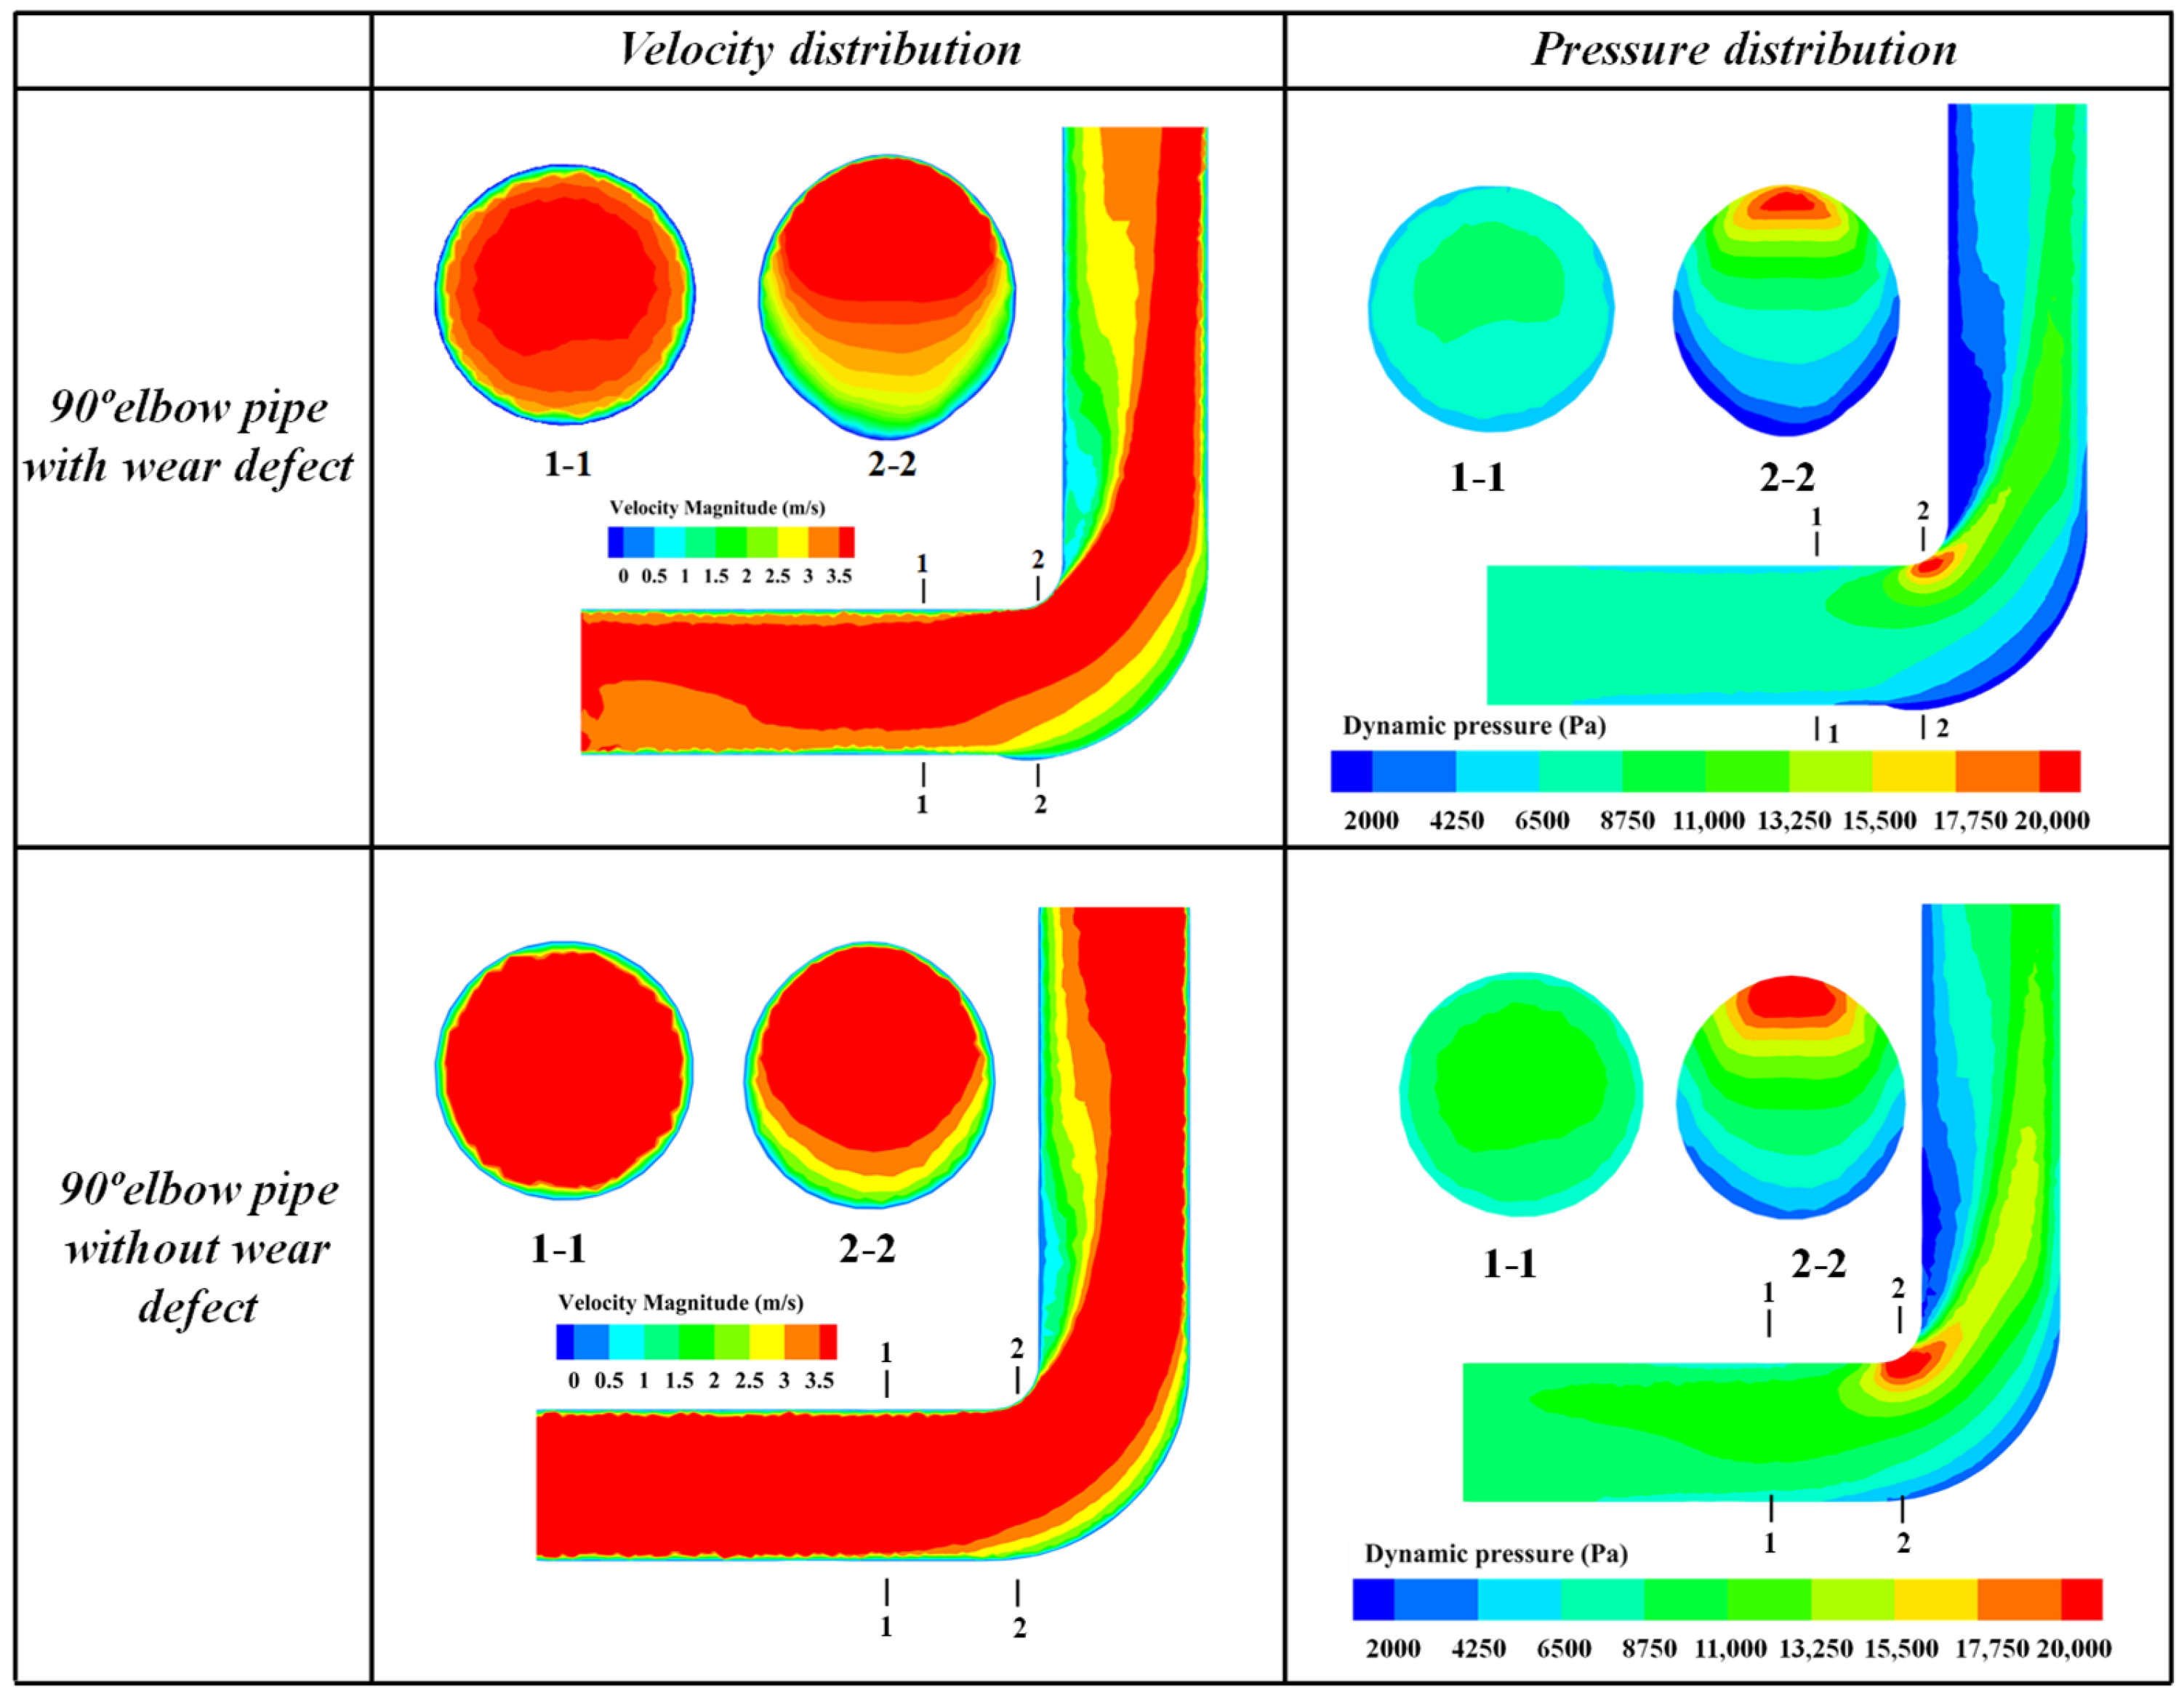
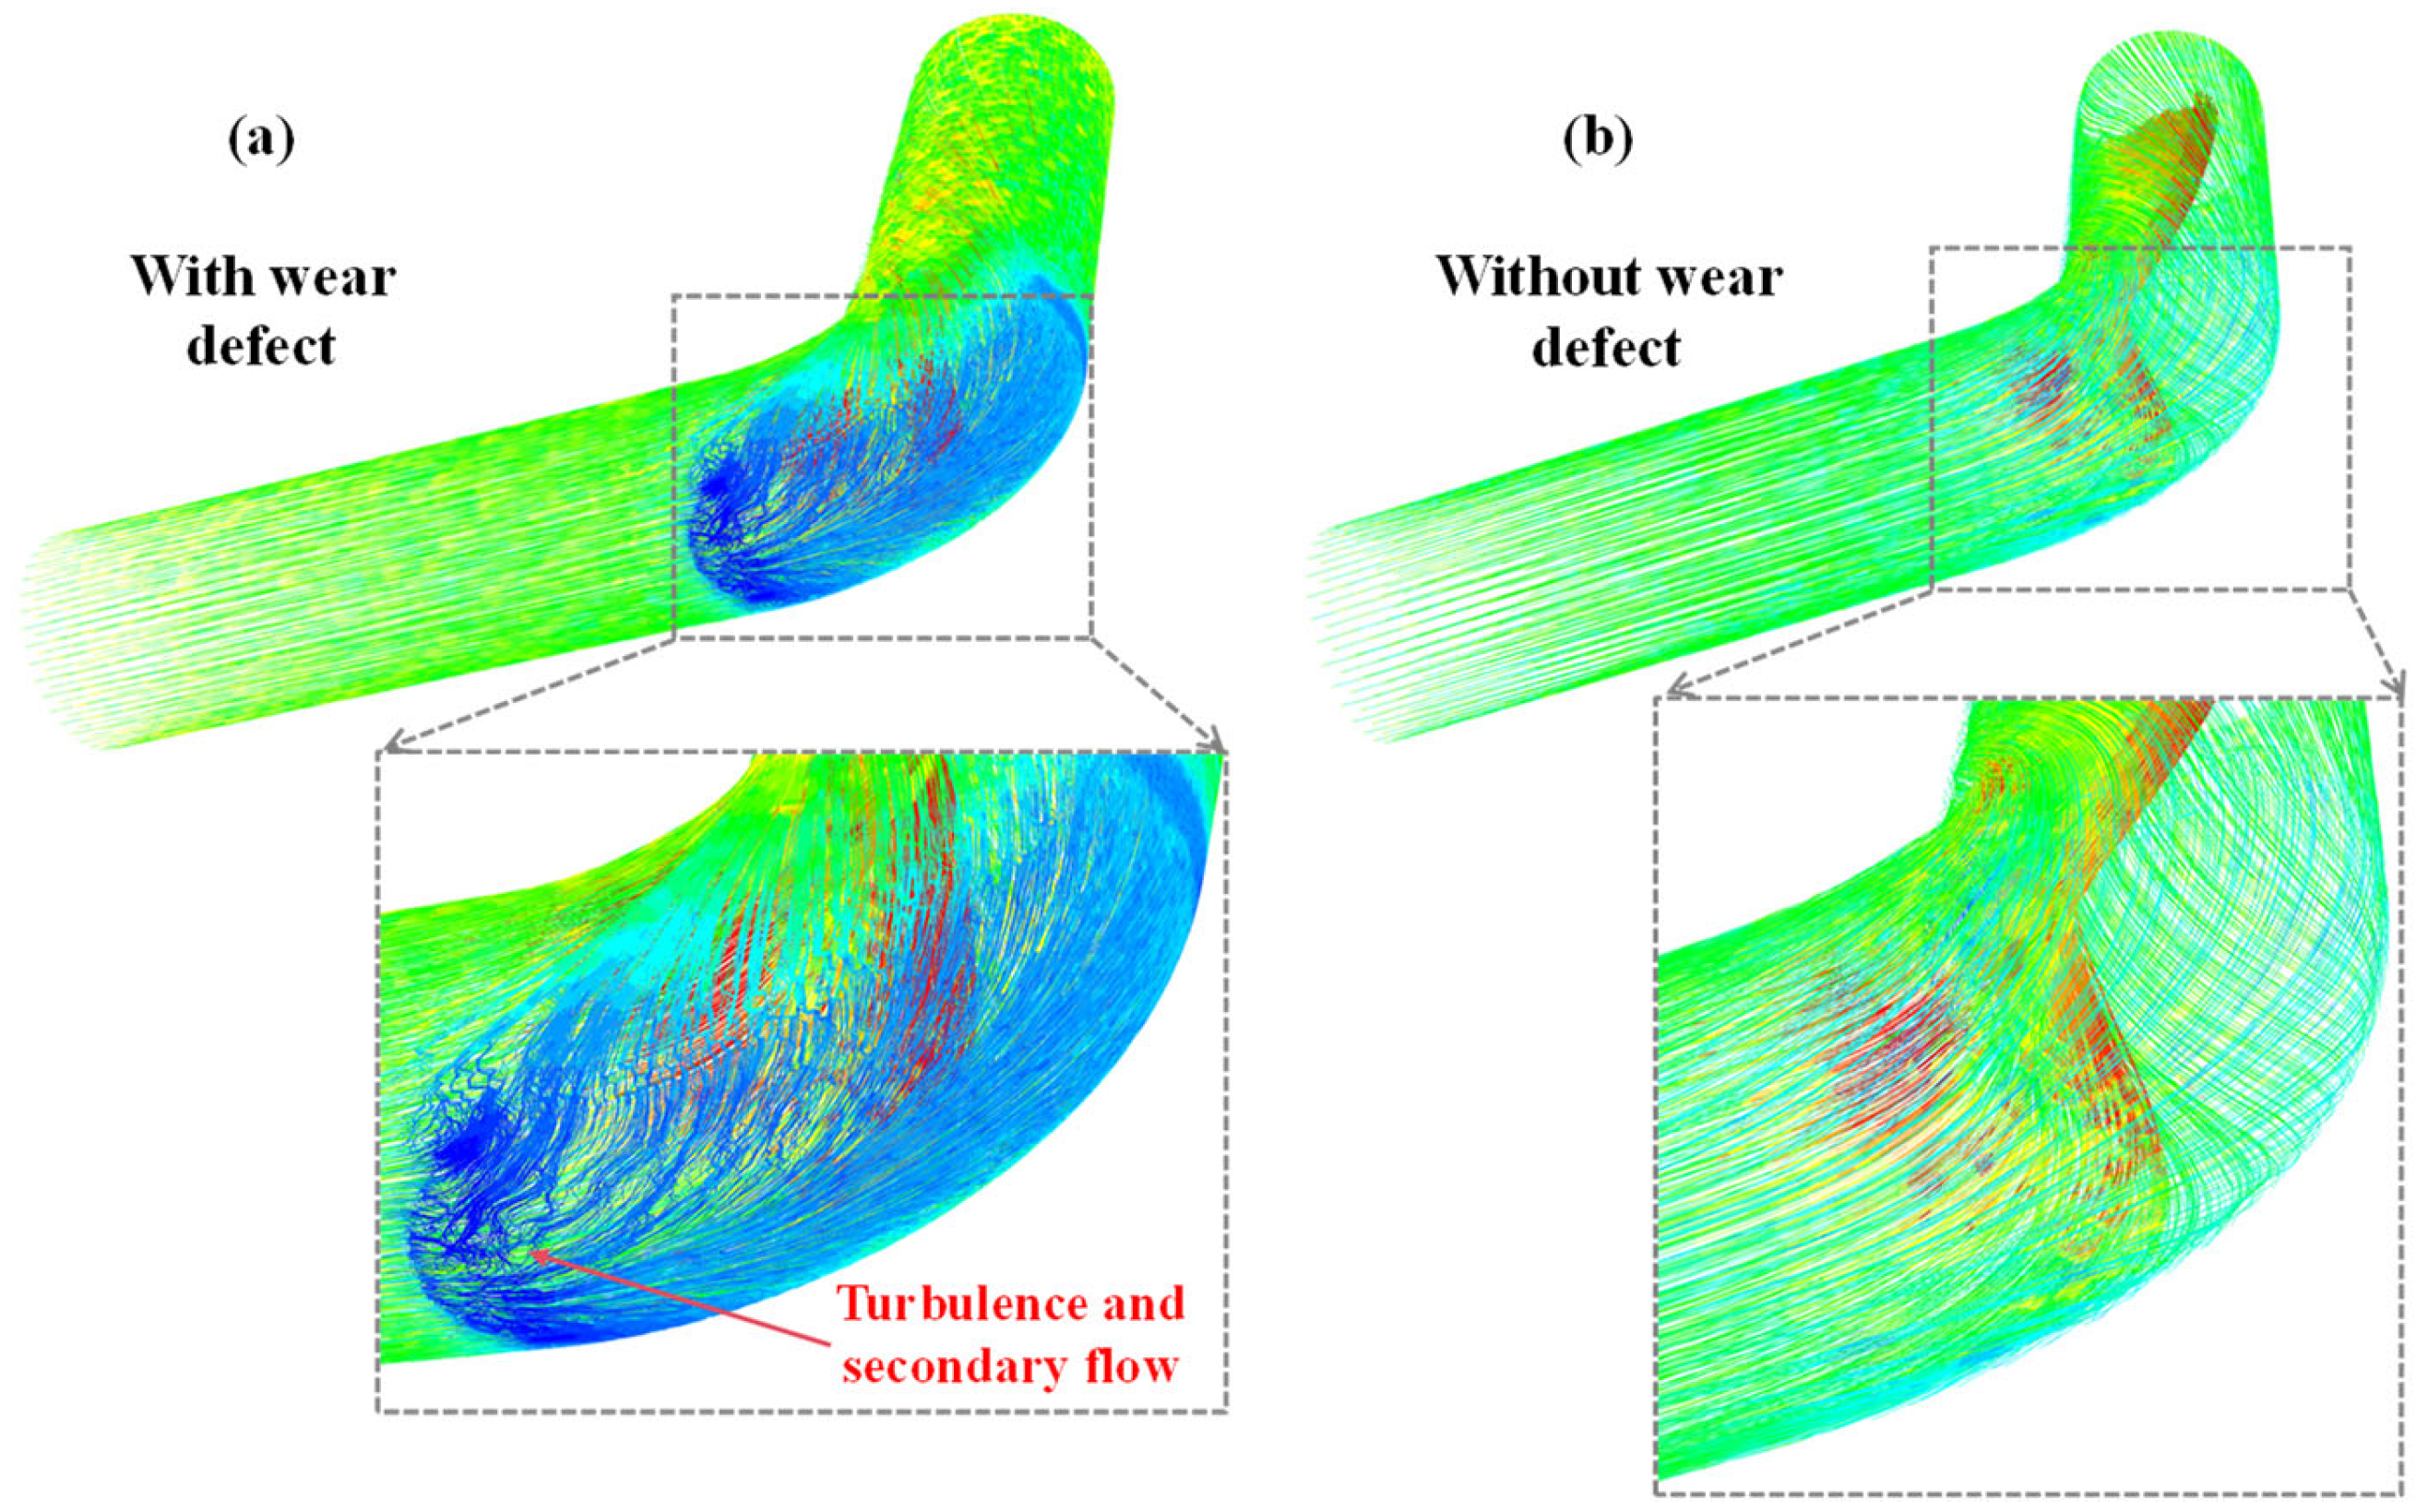
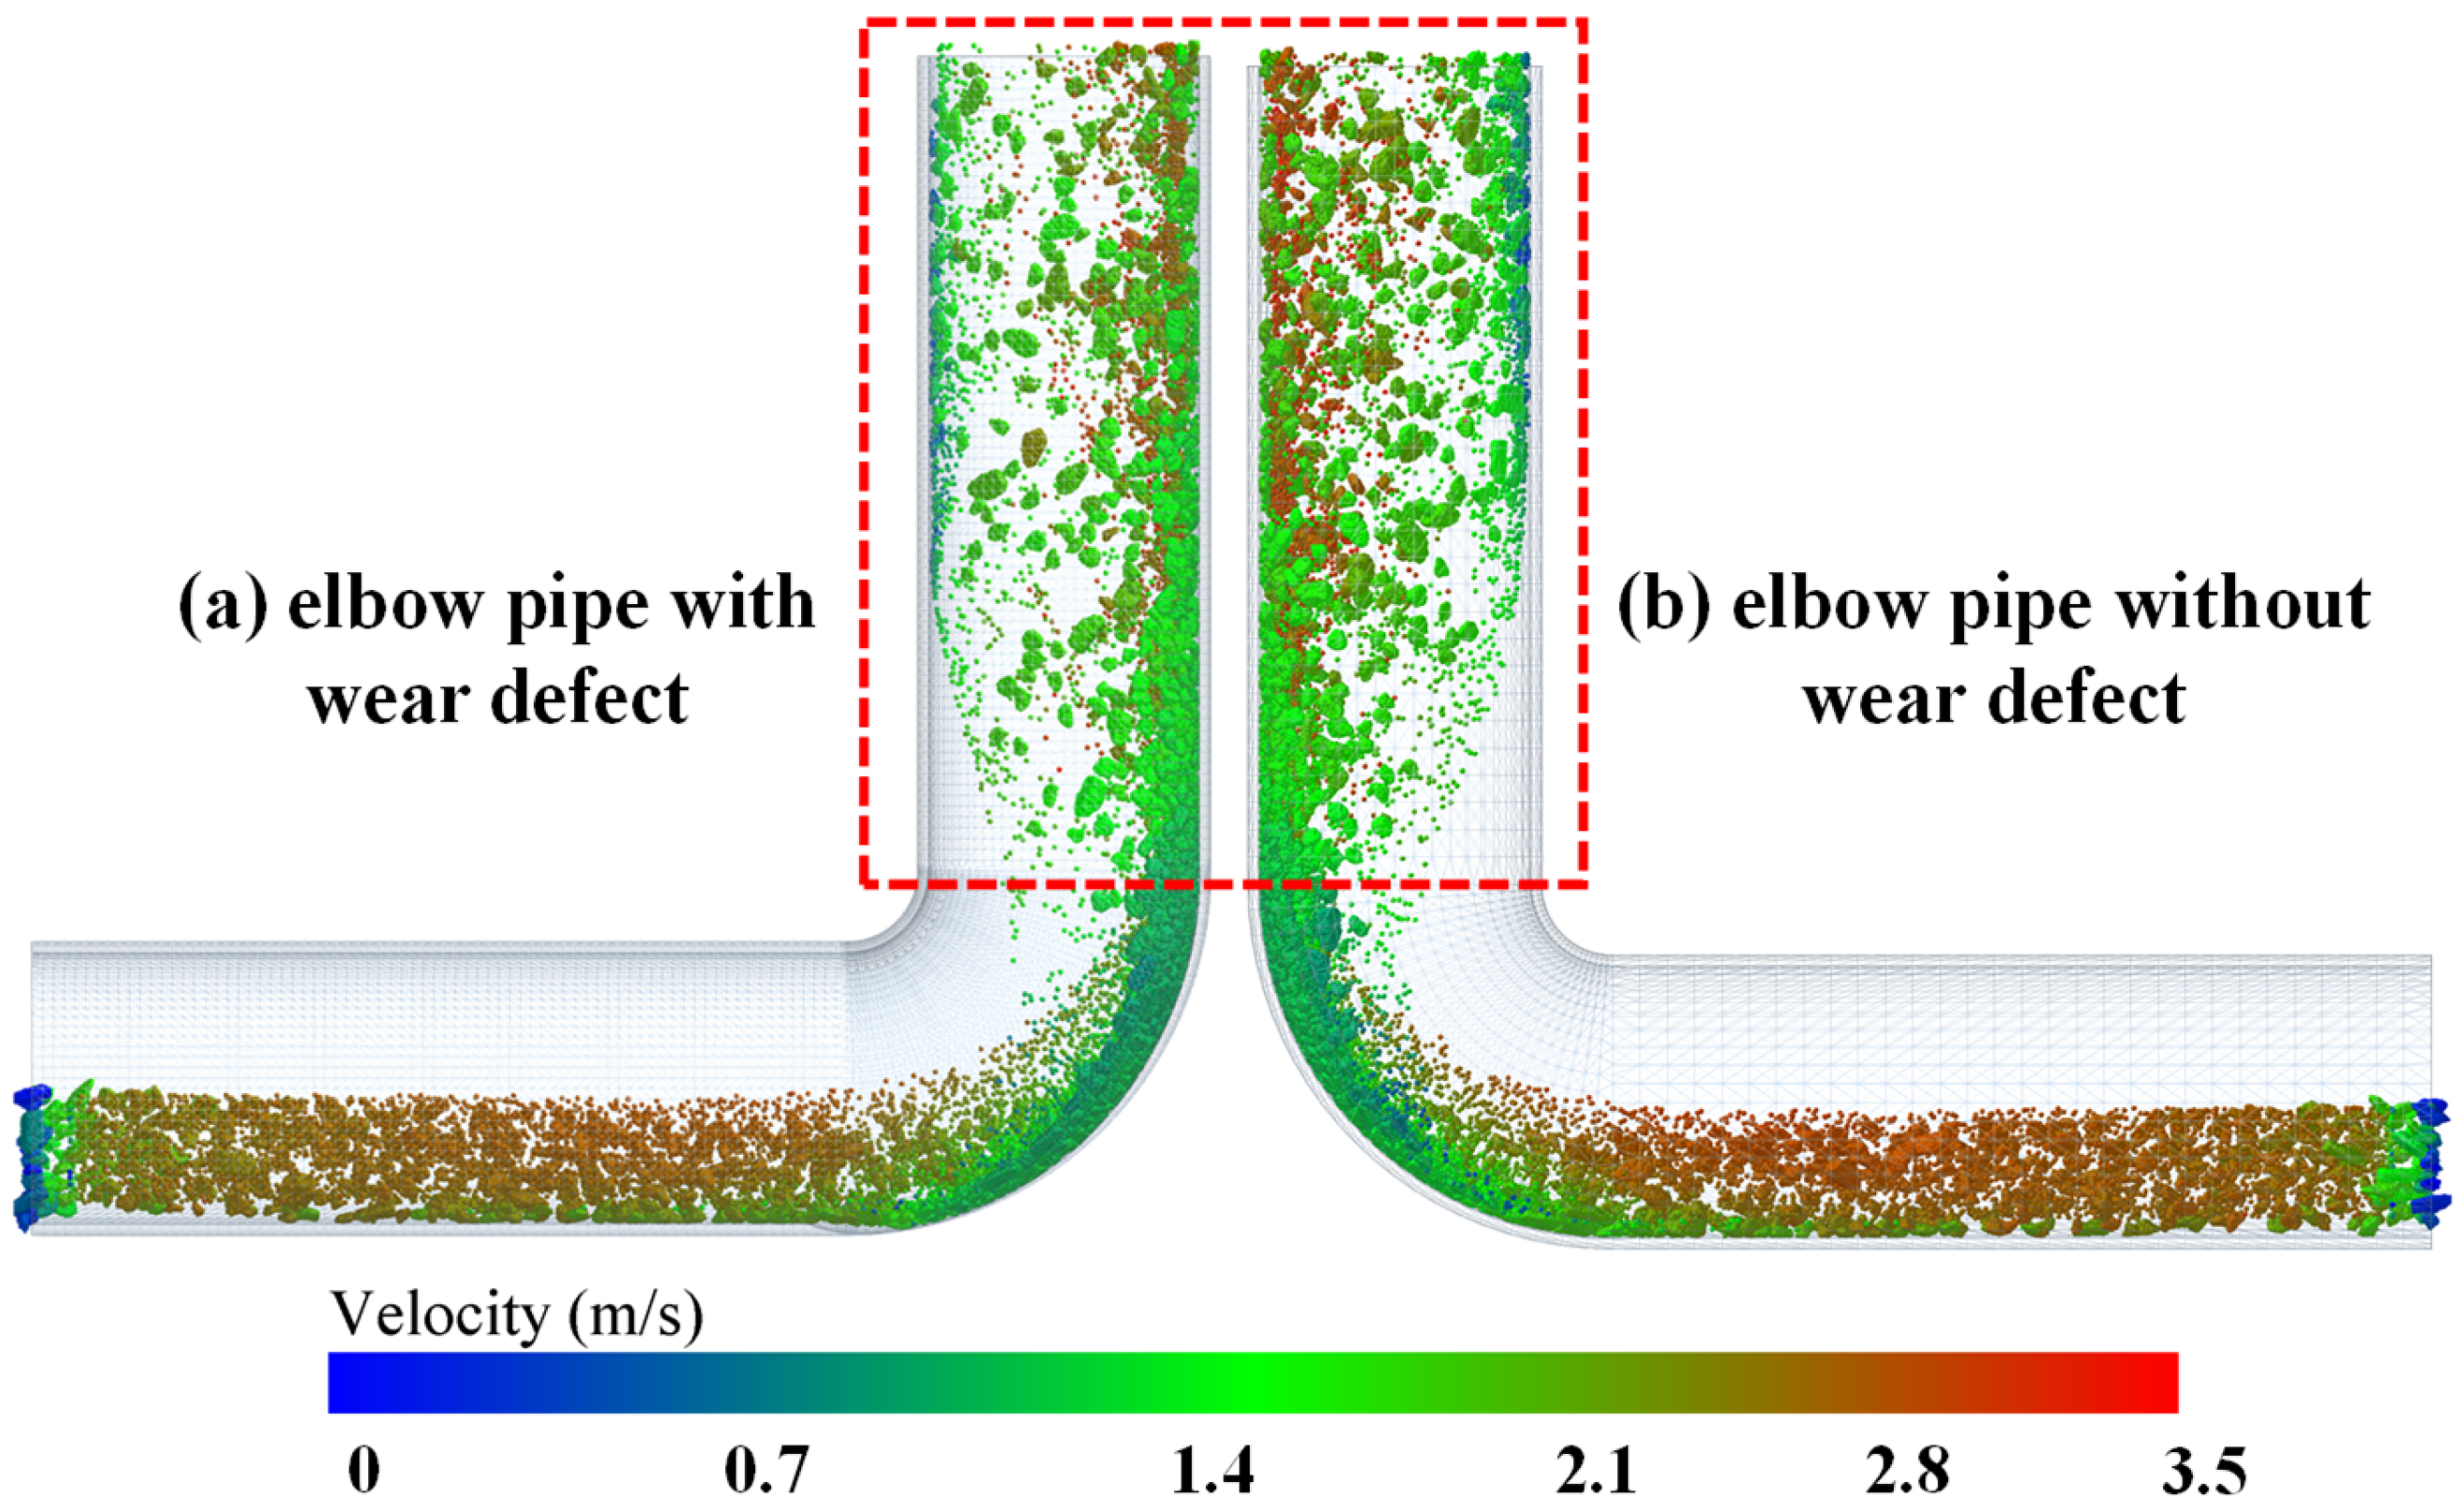
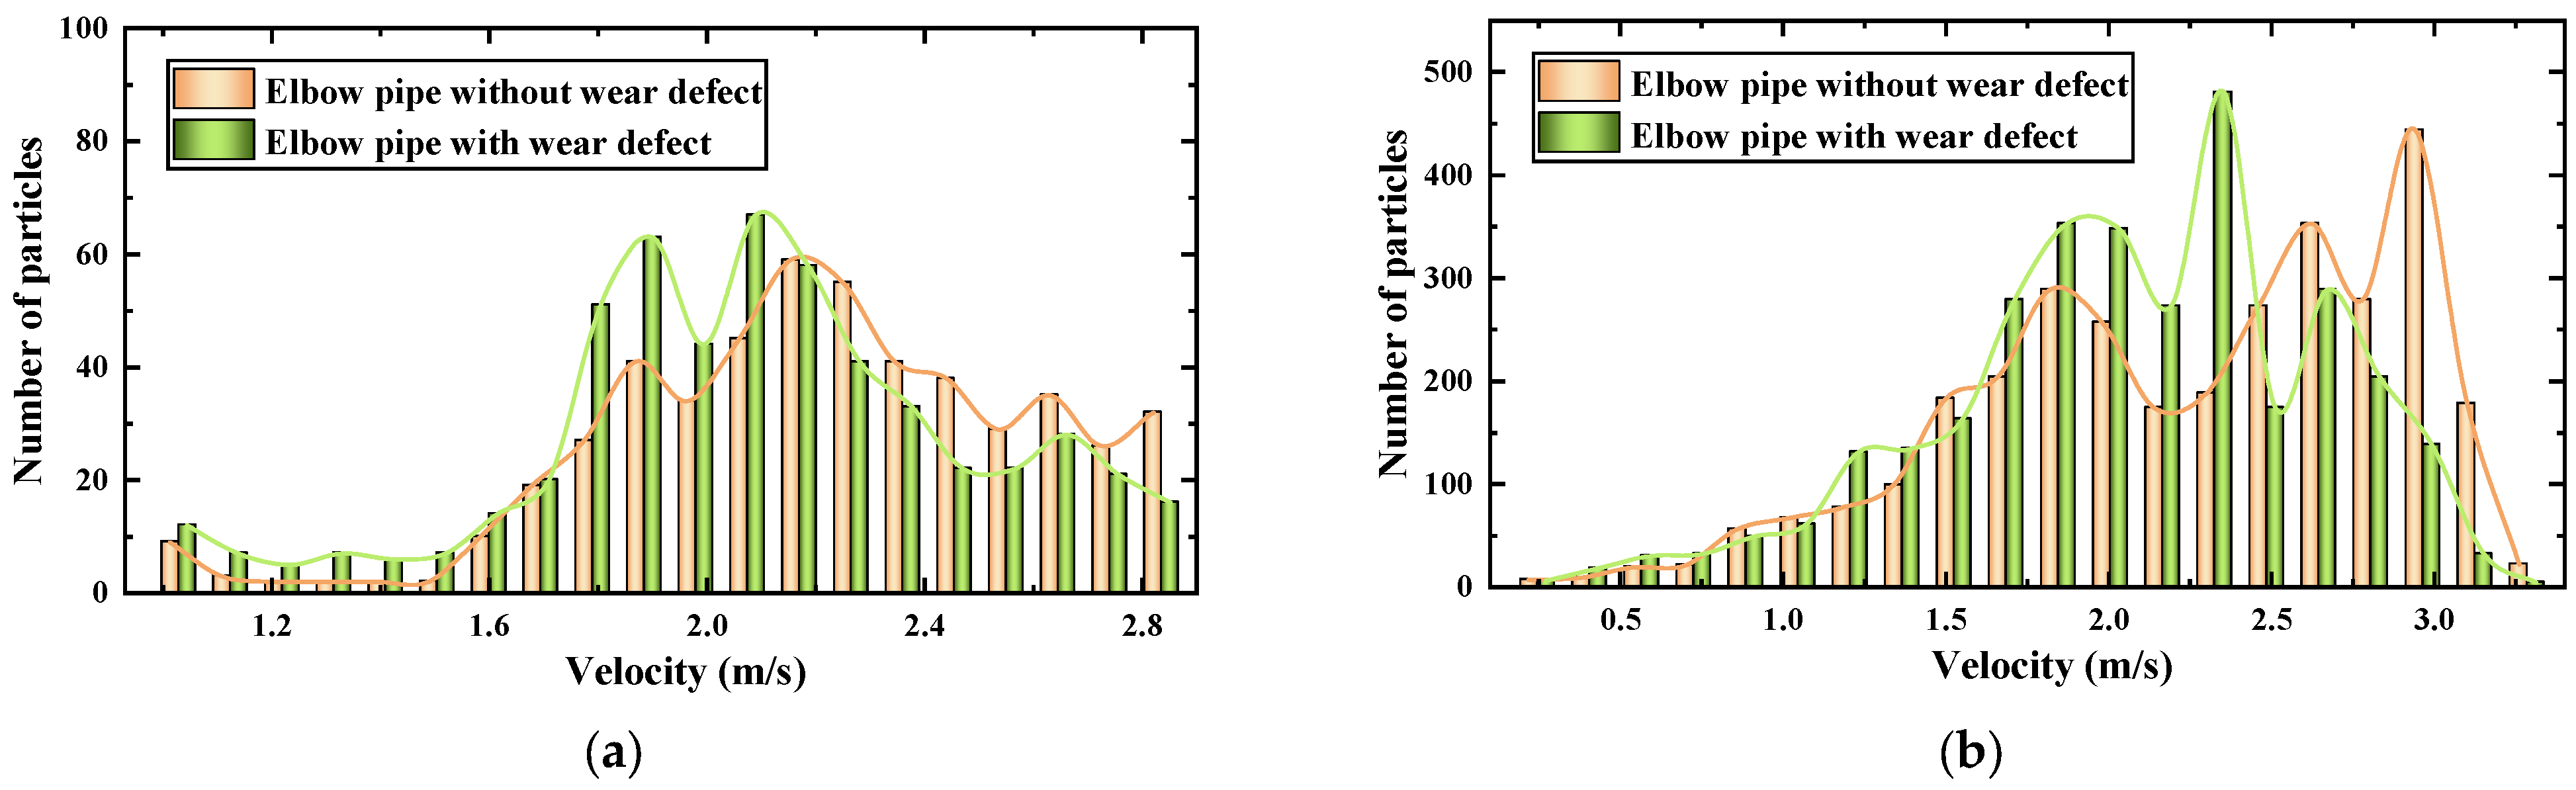
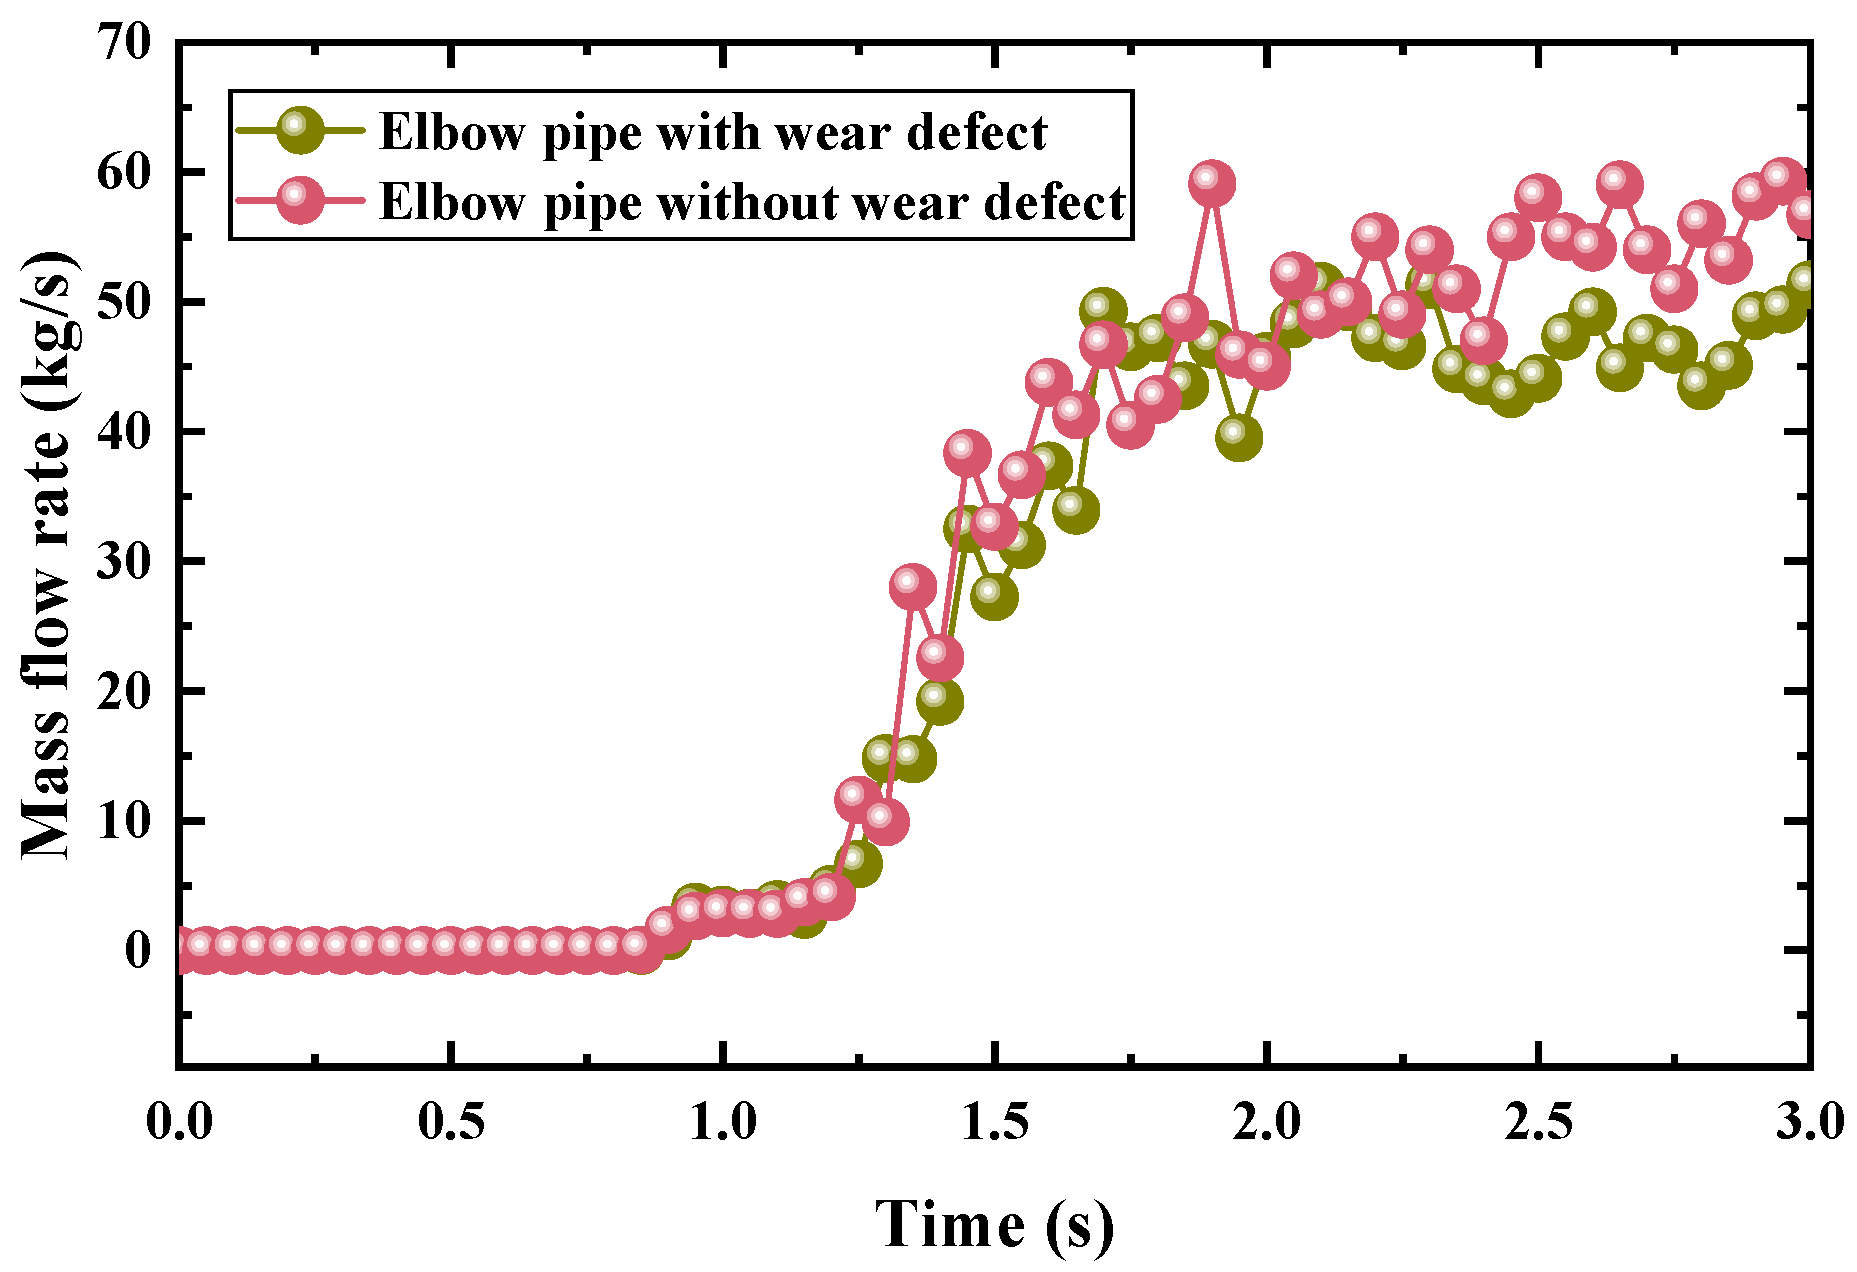
4.1. Effect of Wear Defect on the Flow Characteristics of 90° Elbow Pipe
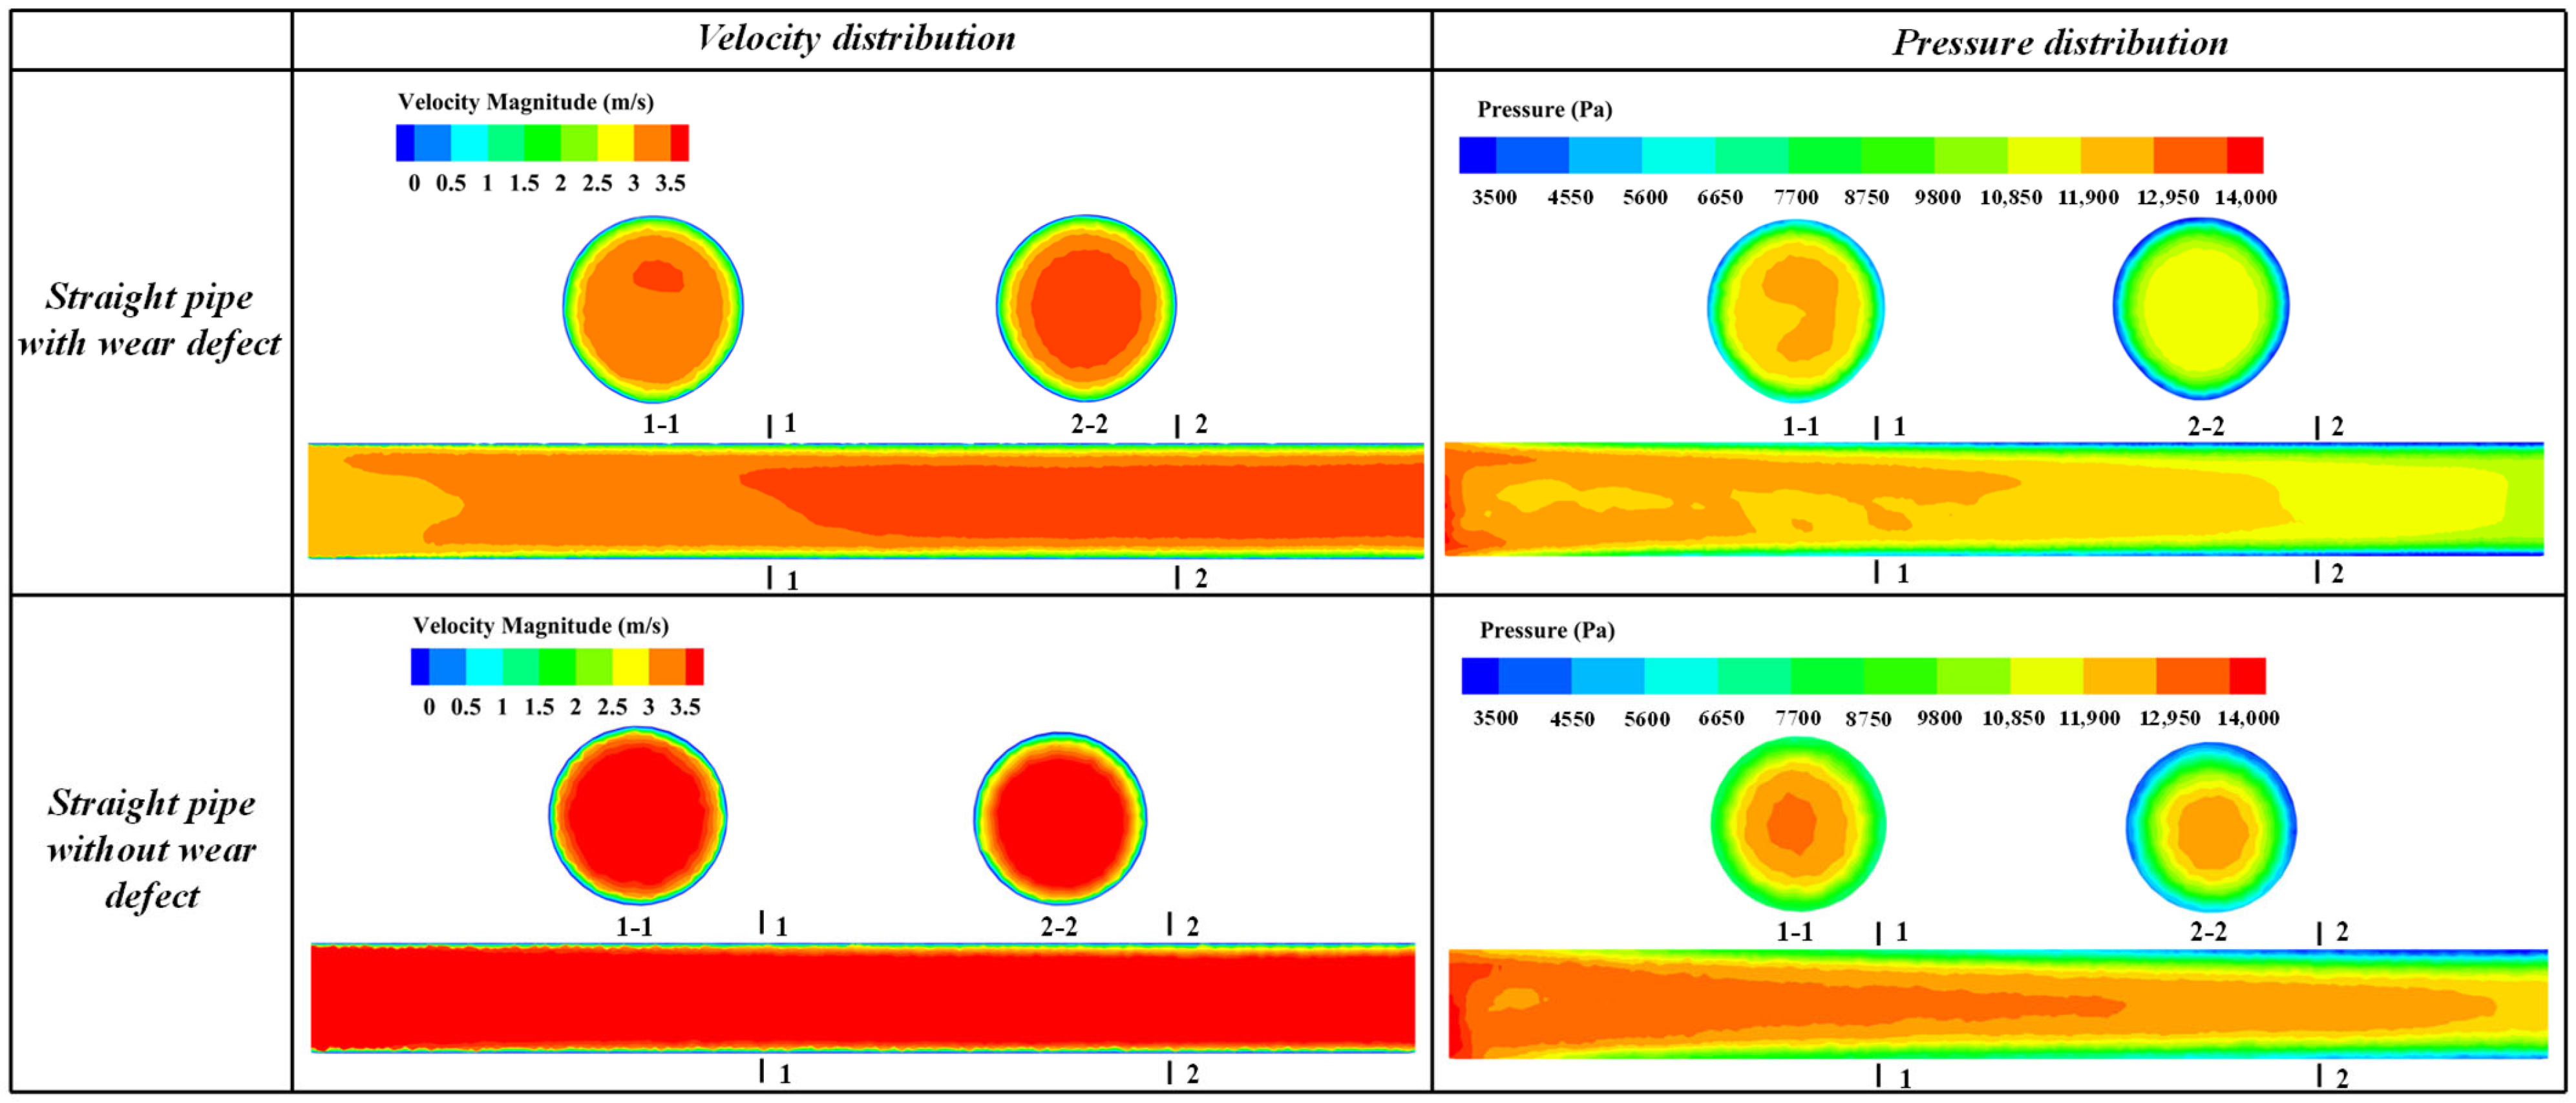
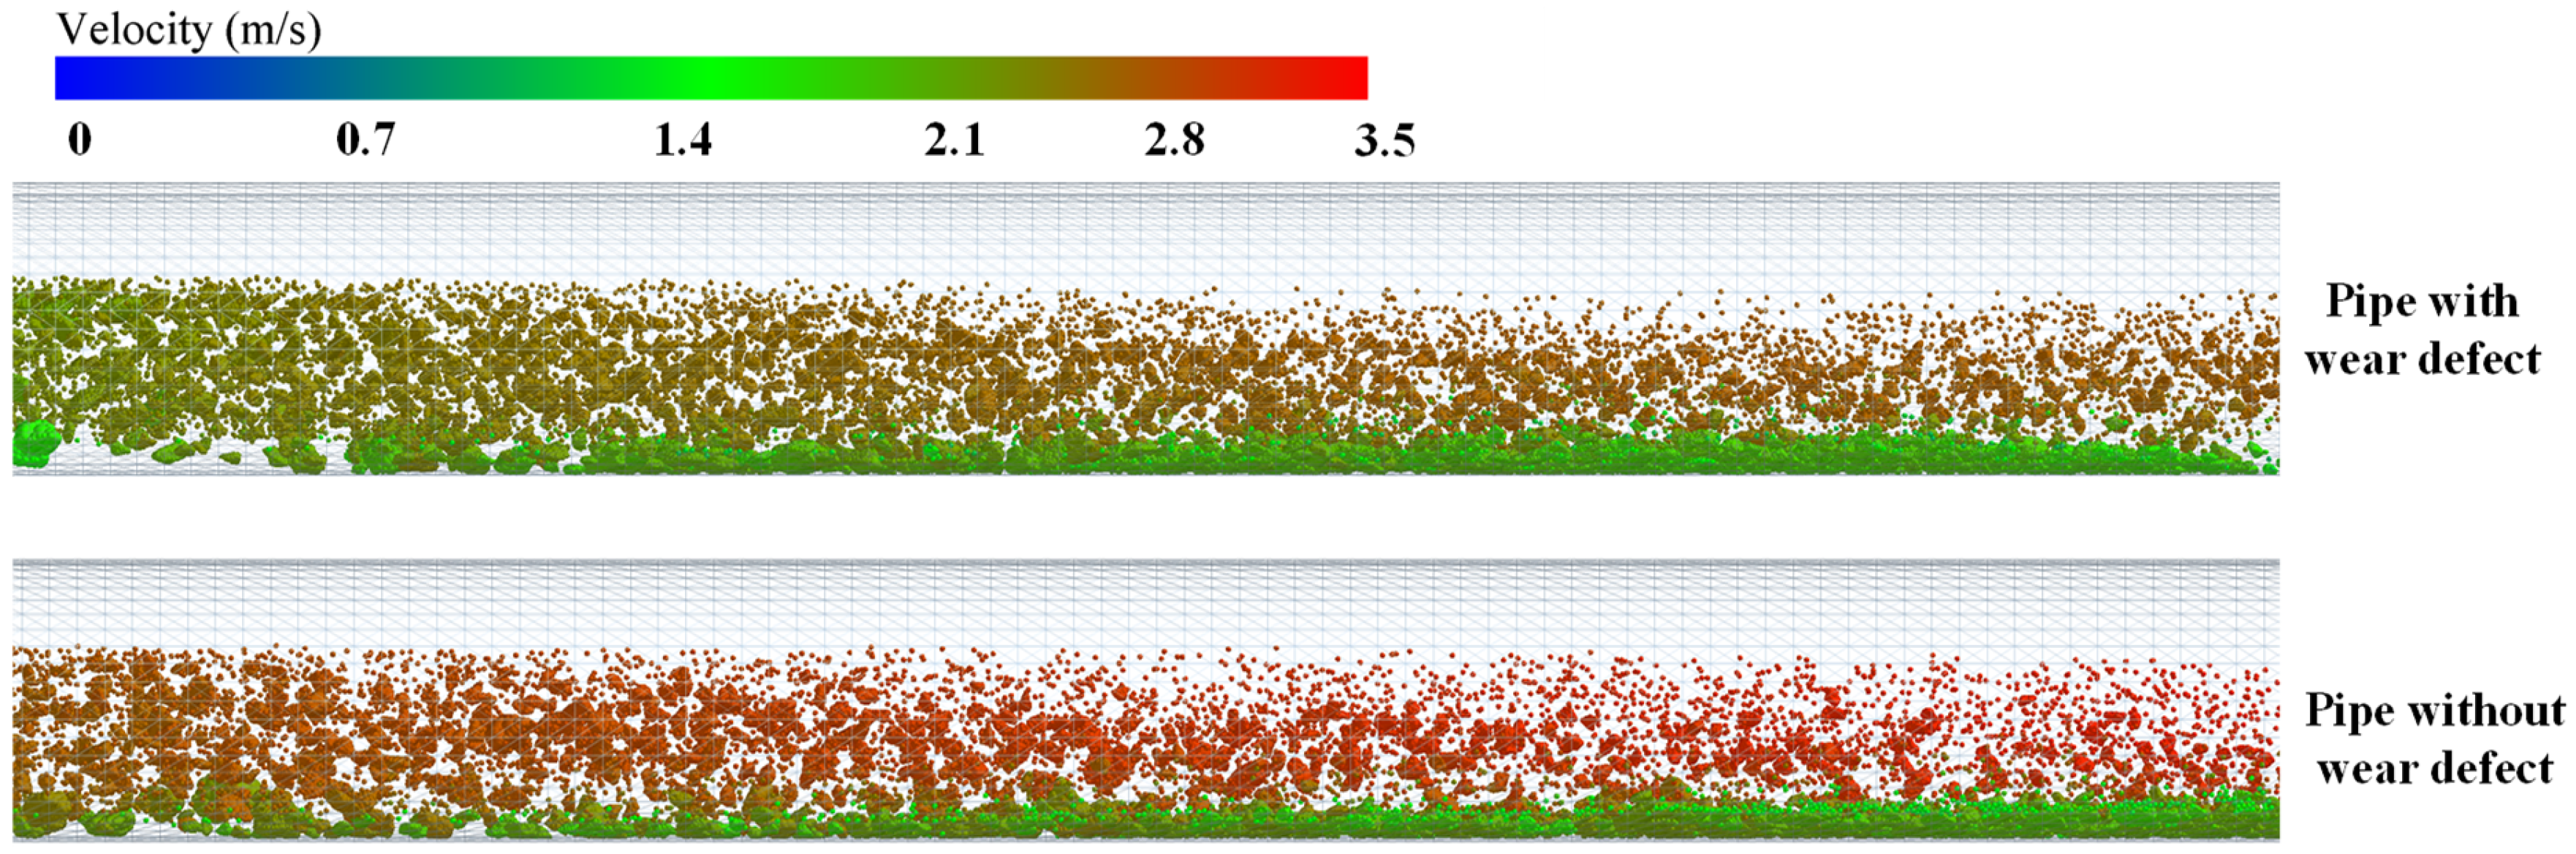
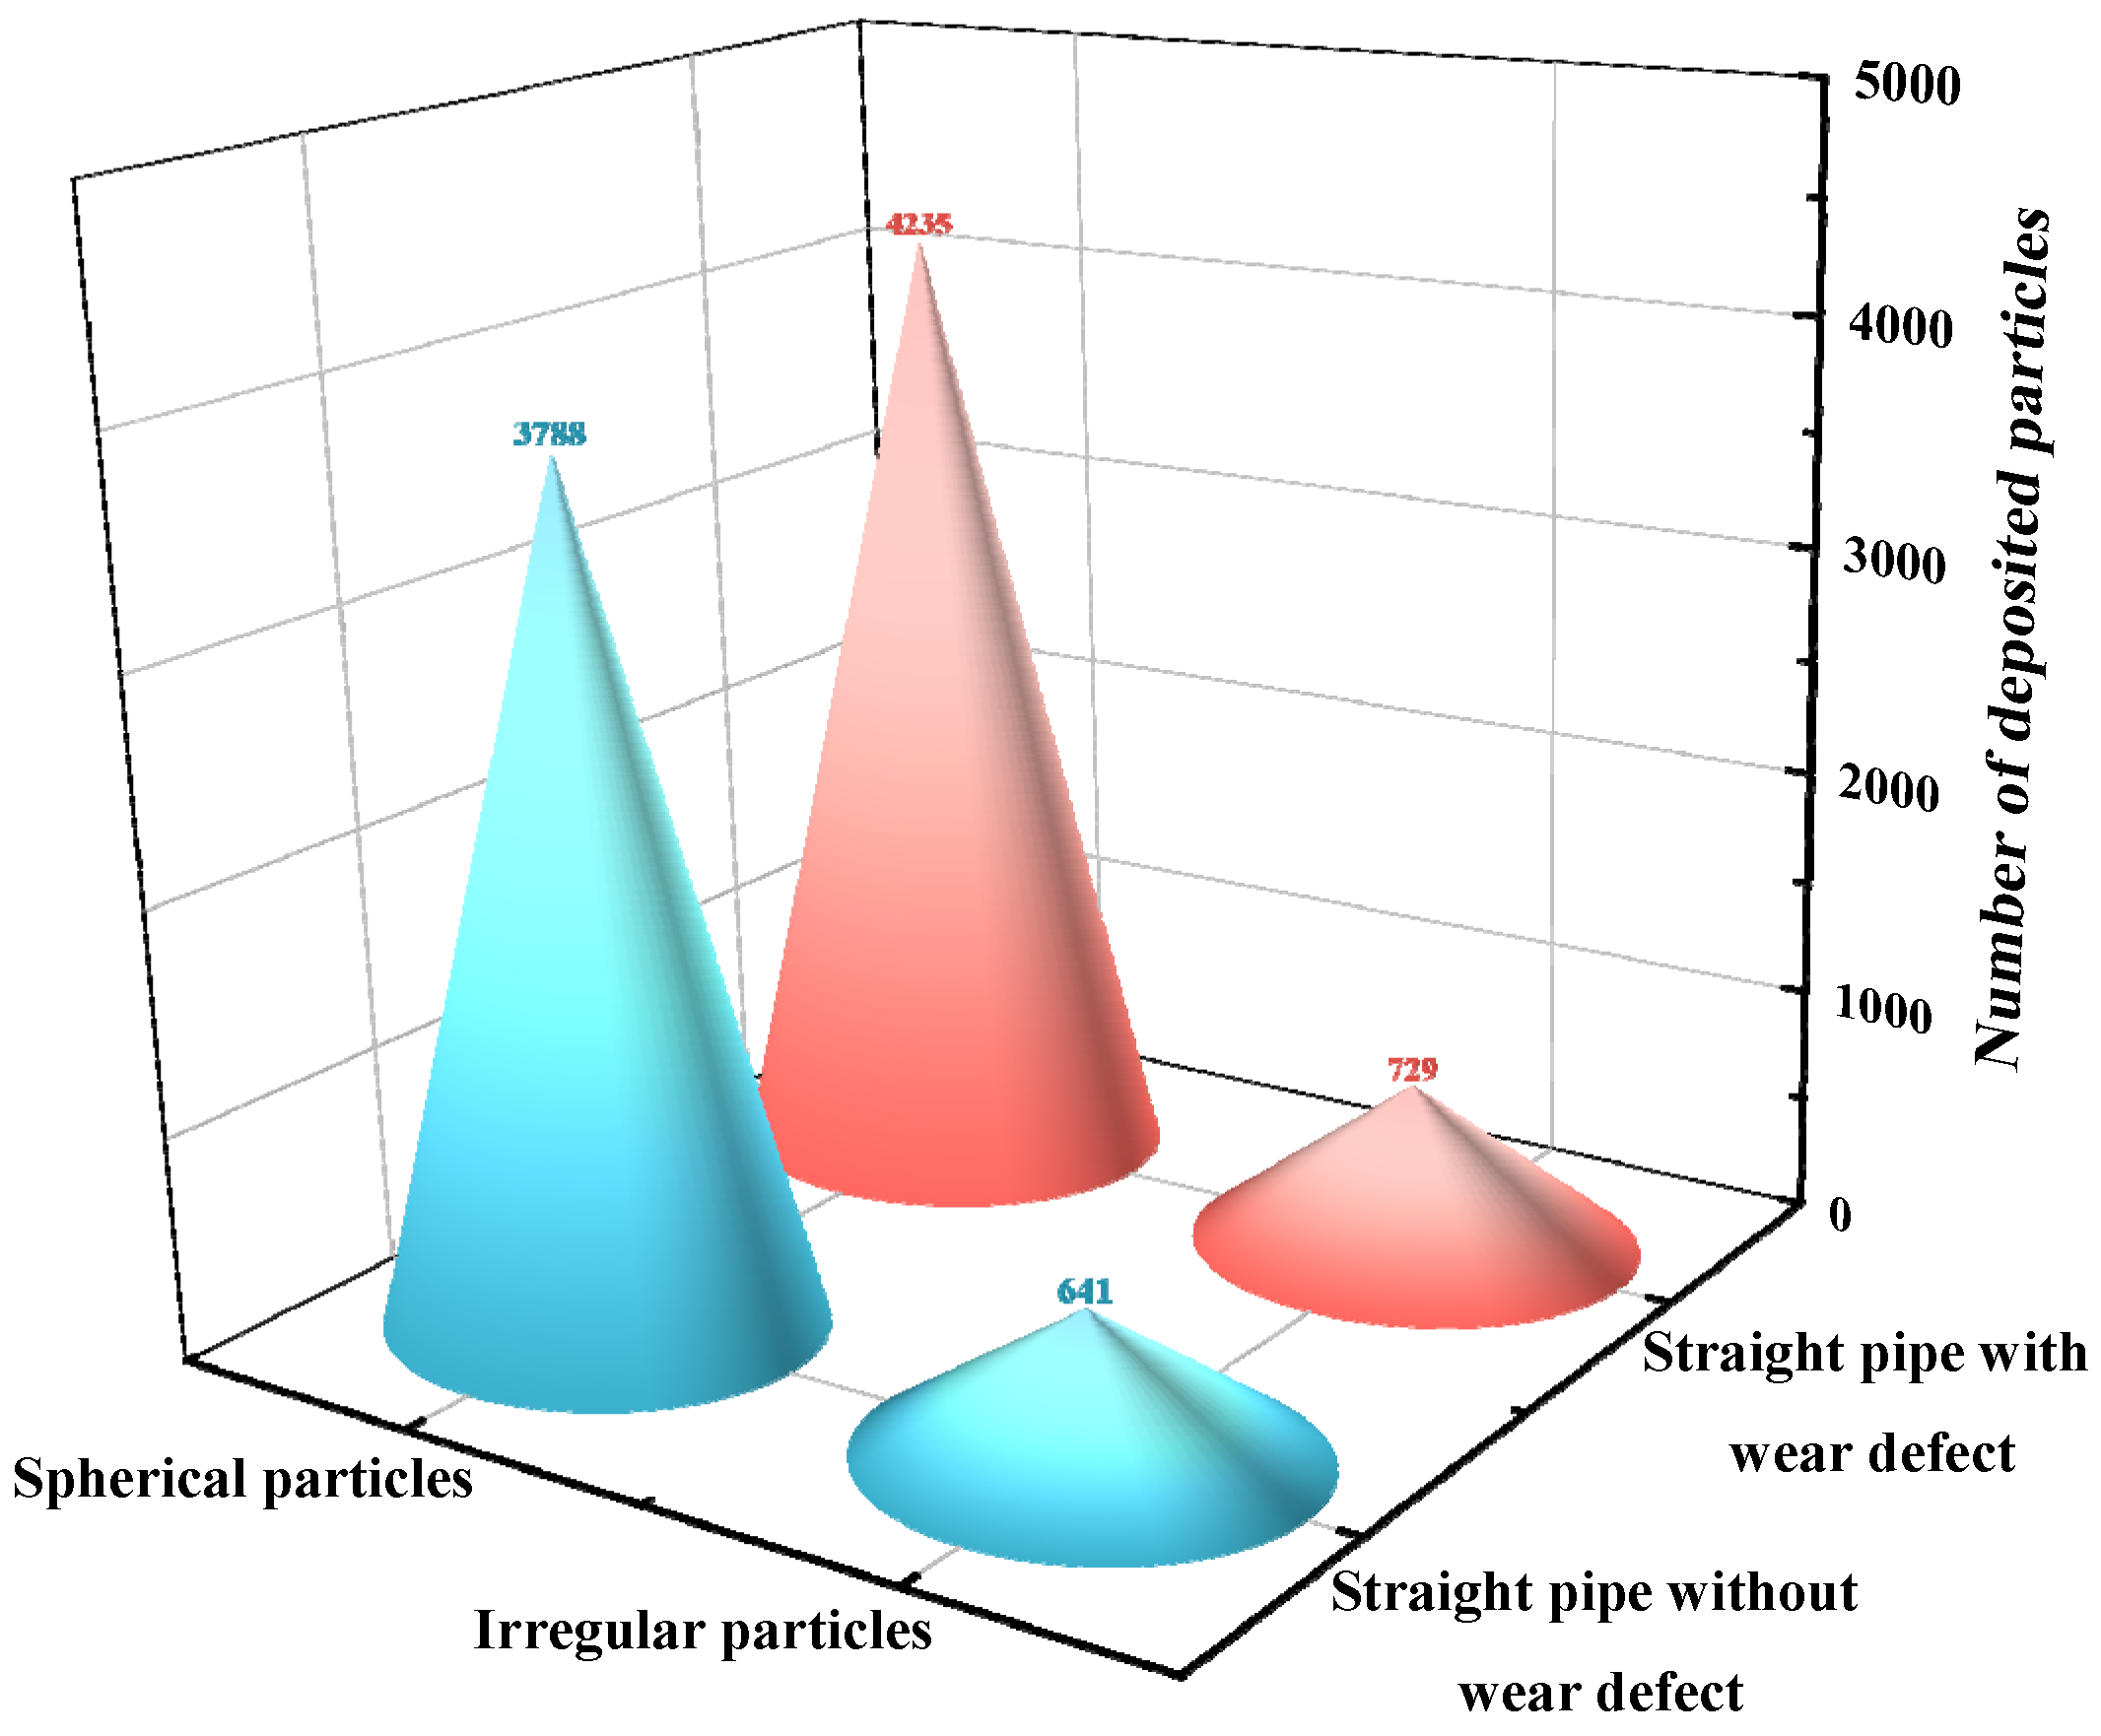
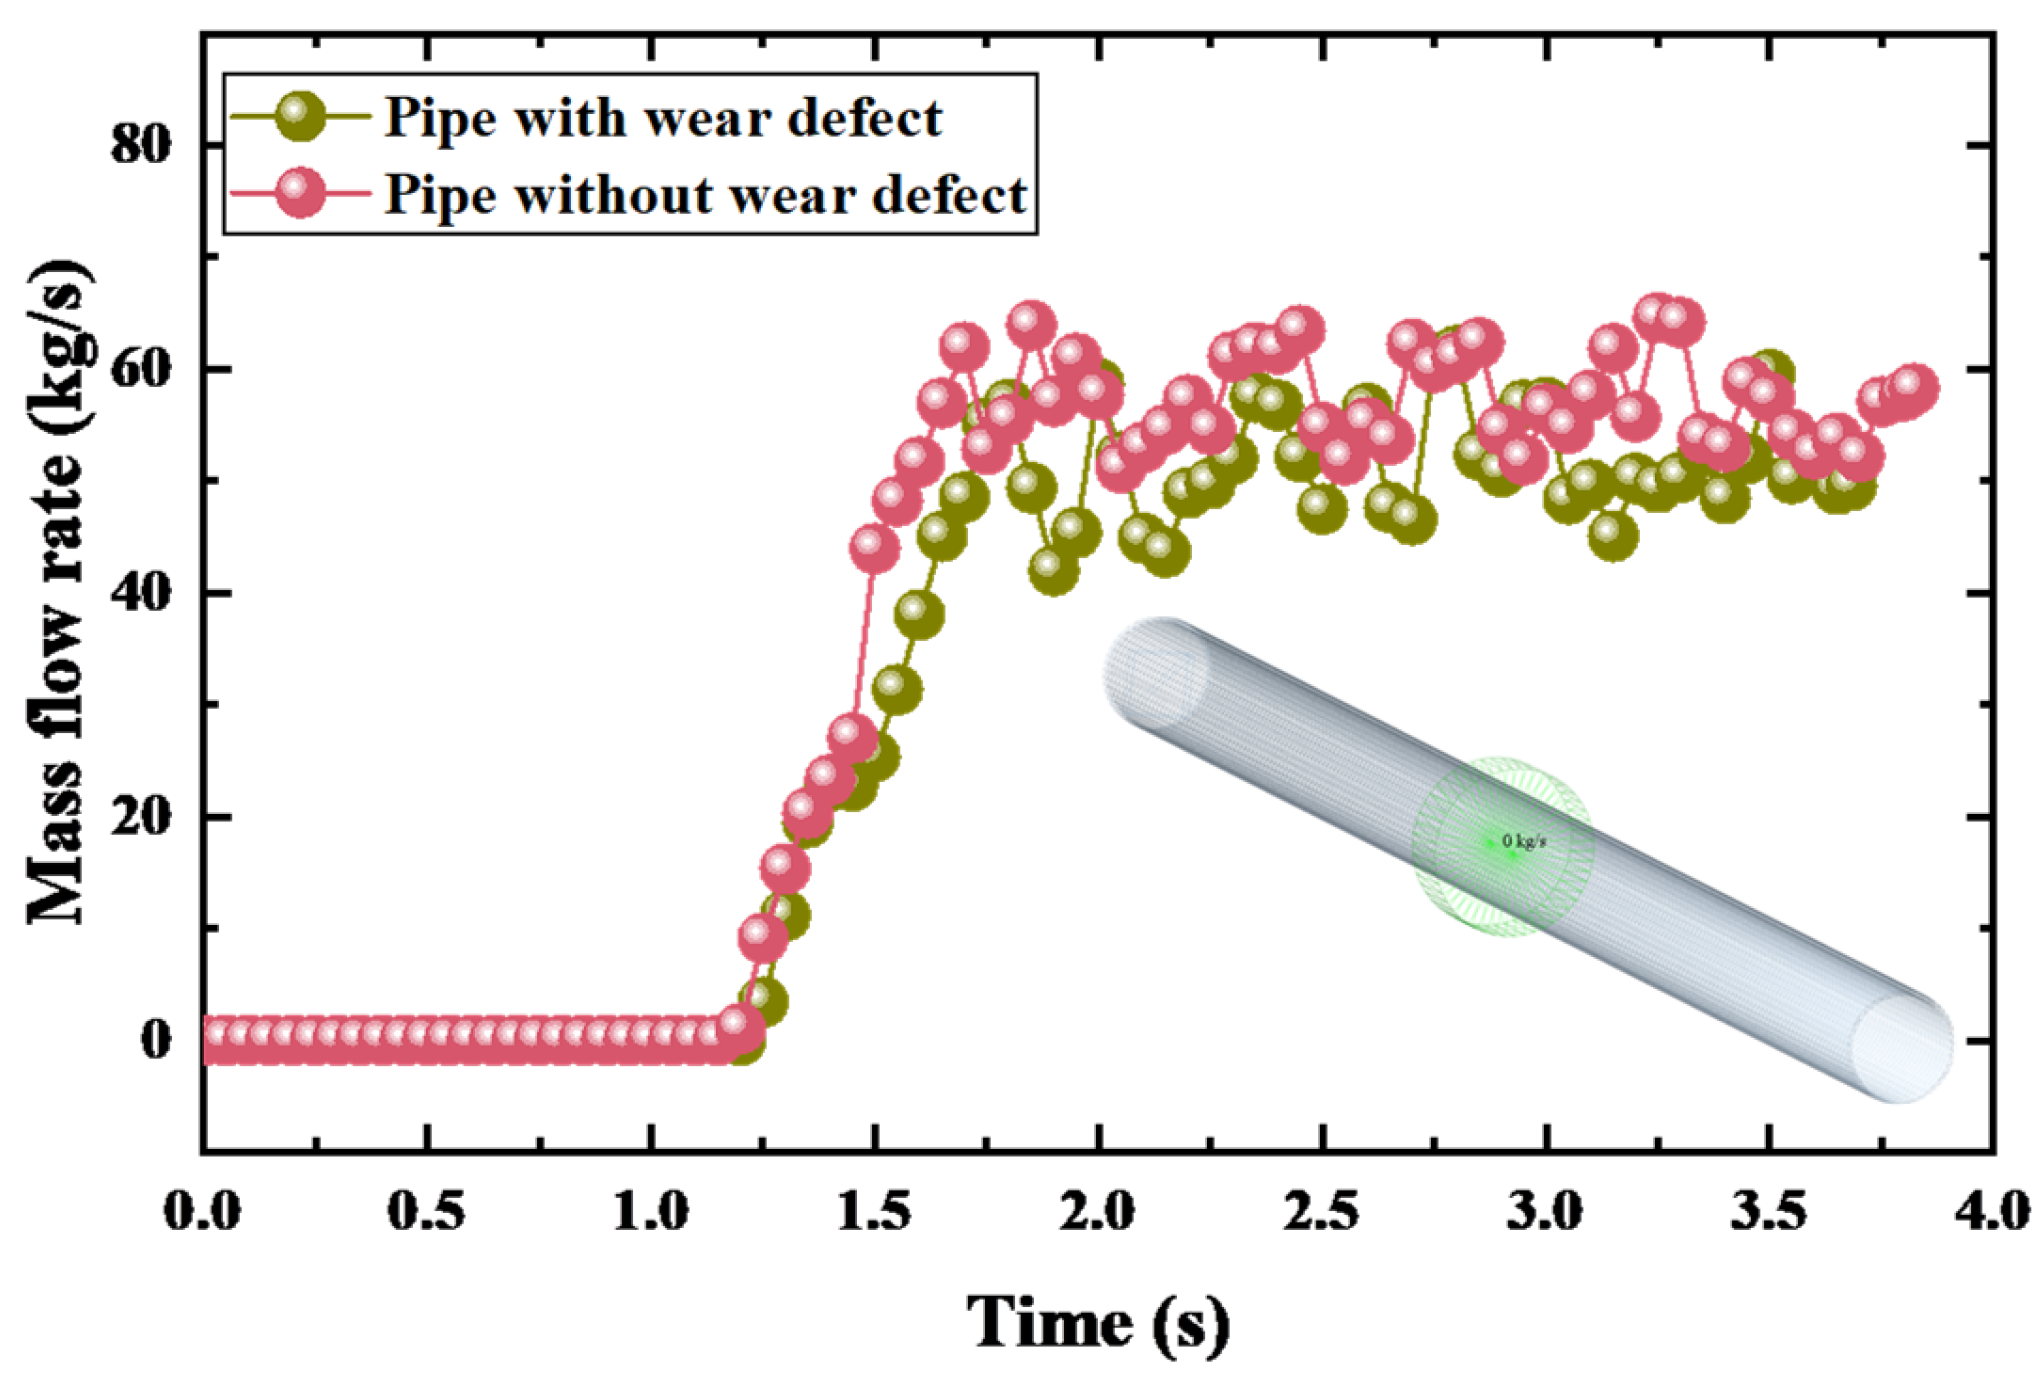
4.2. Effect of Wear Defect on the Flow Characteristics of Straight Pipe
5. Discussion
6. Conclusions
- The wear defect of pipe can lead to increased inhomogeneity in the velocity distribution, generating localized low-flow zones, and resulting in a reduced flow rate or stagnancy in parts of the pipe. Meanwhile, the wear defect of the pipe leads to local shape change, causing more turbulence, where increased vortex promotes localized kinetic energy reduction and creates larger pressure losses at the elbow.
- Pipe wear defect causes a decrease in the velocity of particles passing through the pipes, and the reduced velocity makes it easier for large particles to be deposited and accumulated, further increasing the potential risk of clogging and blockage.
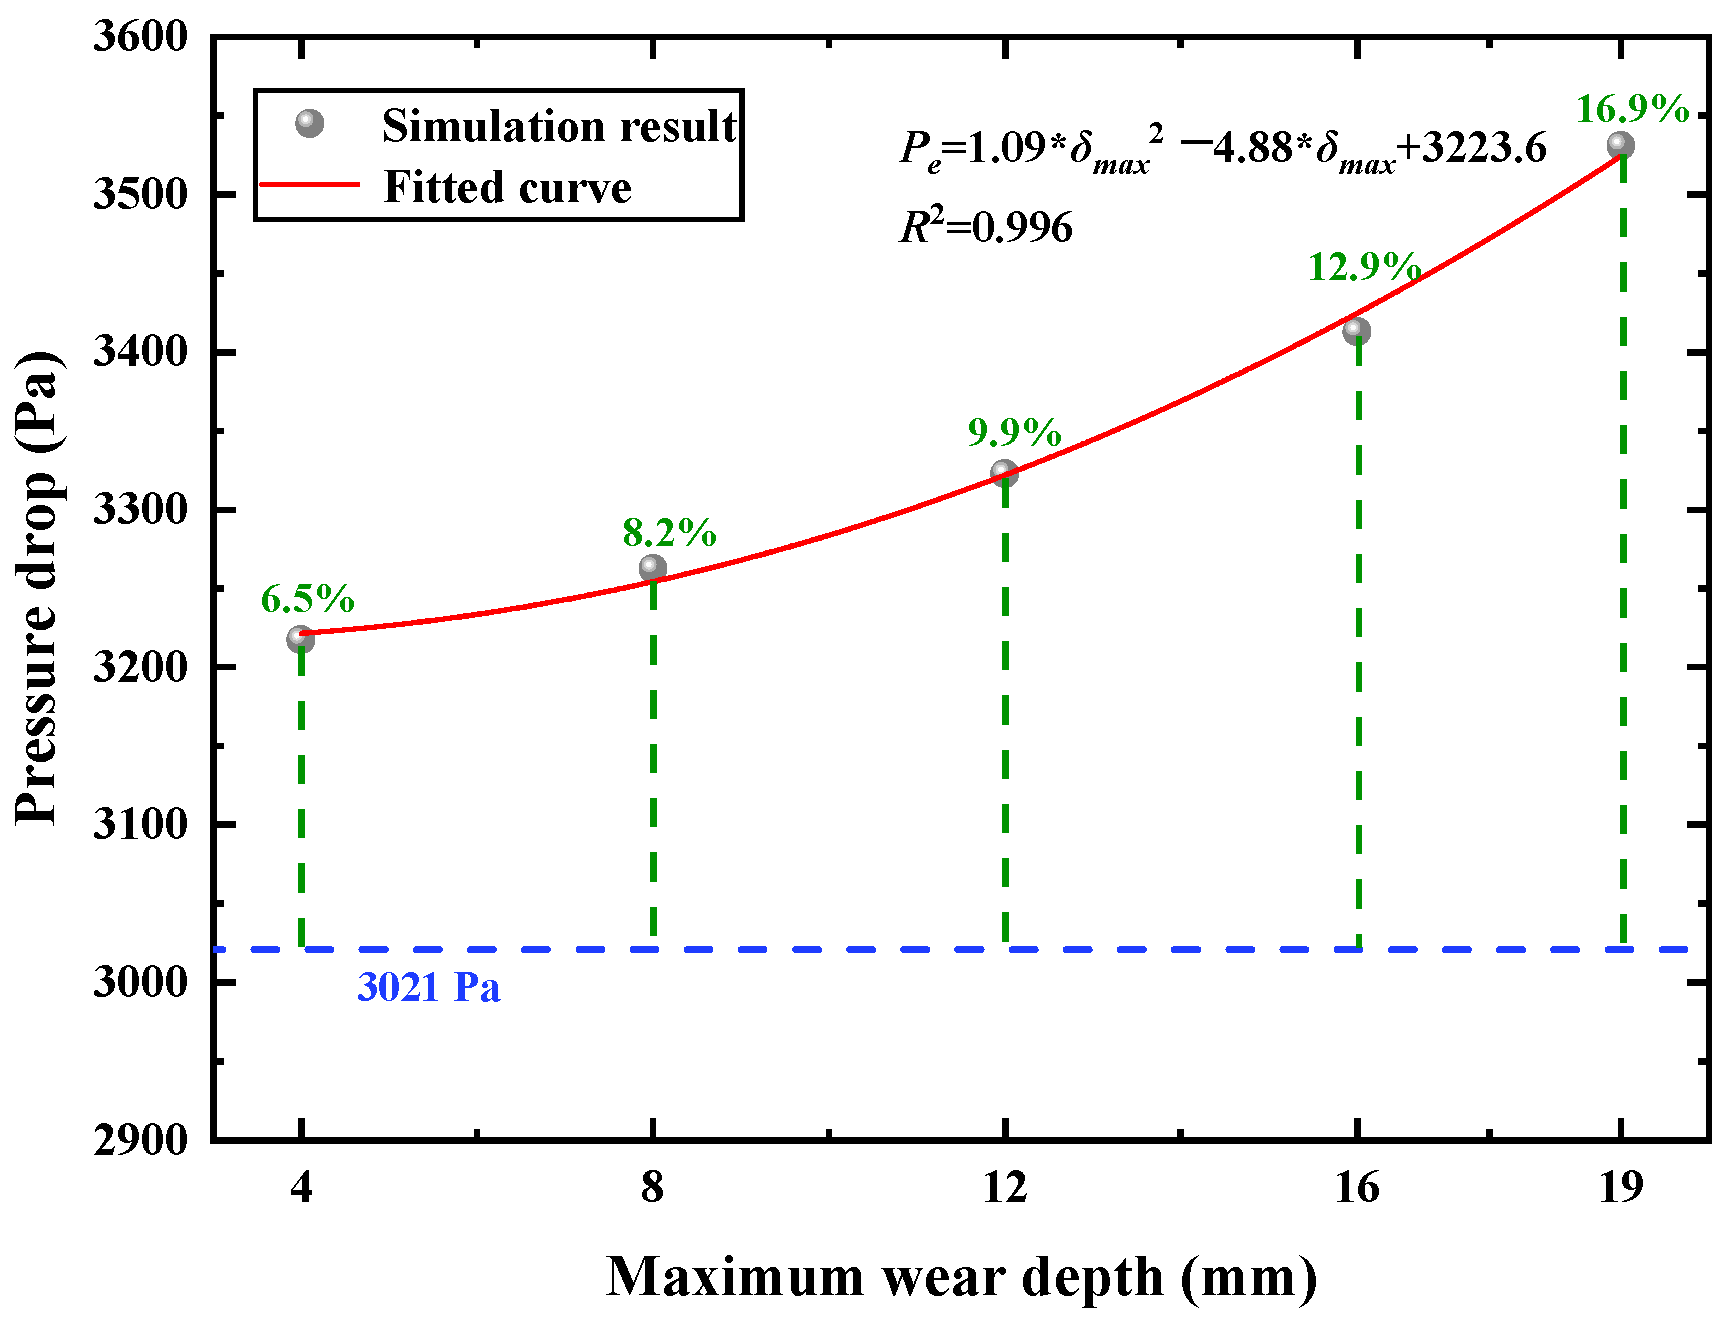
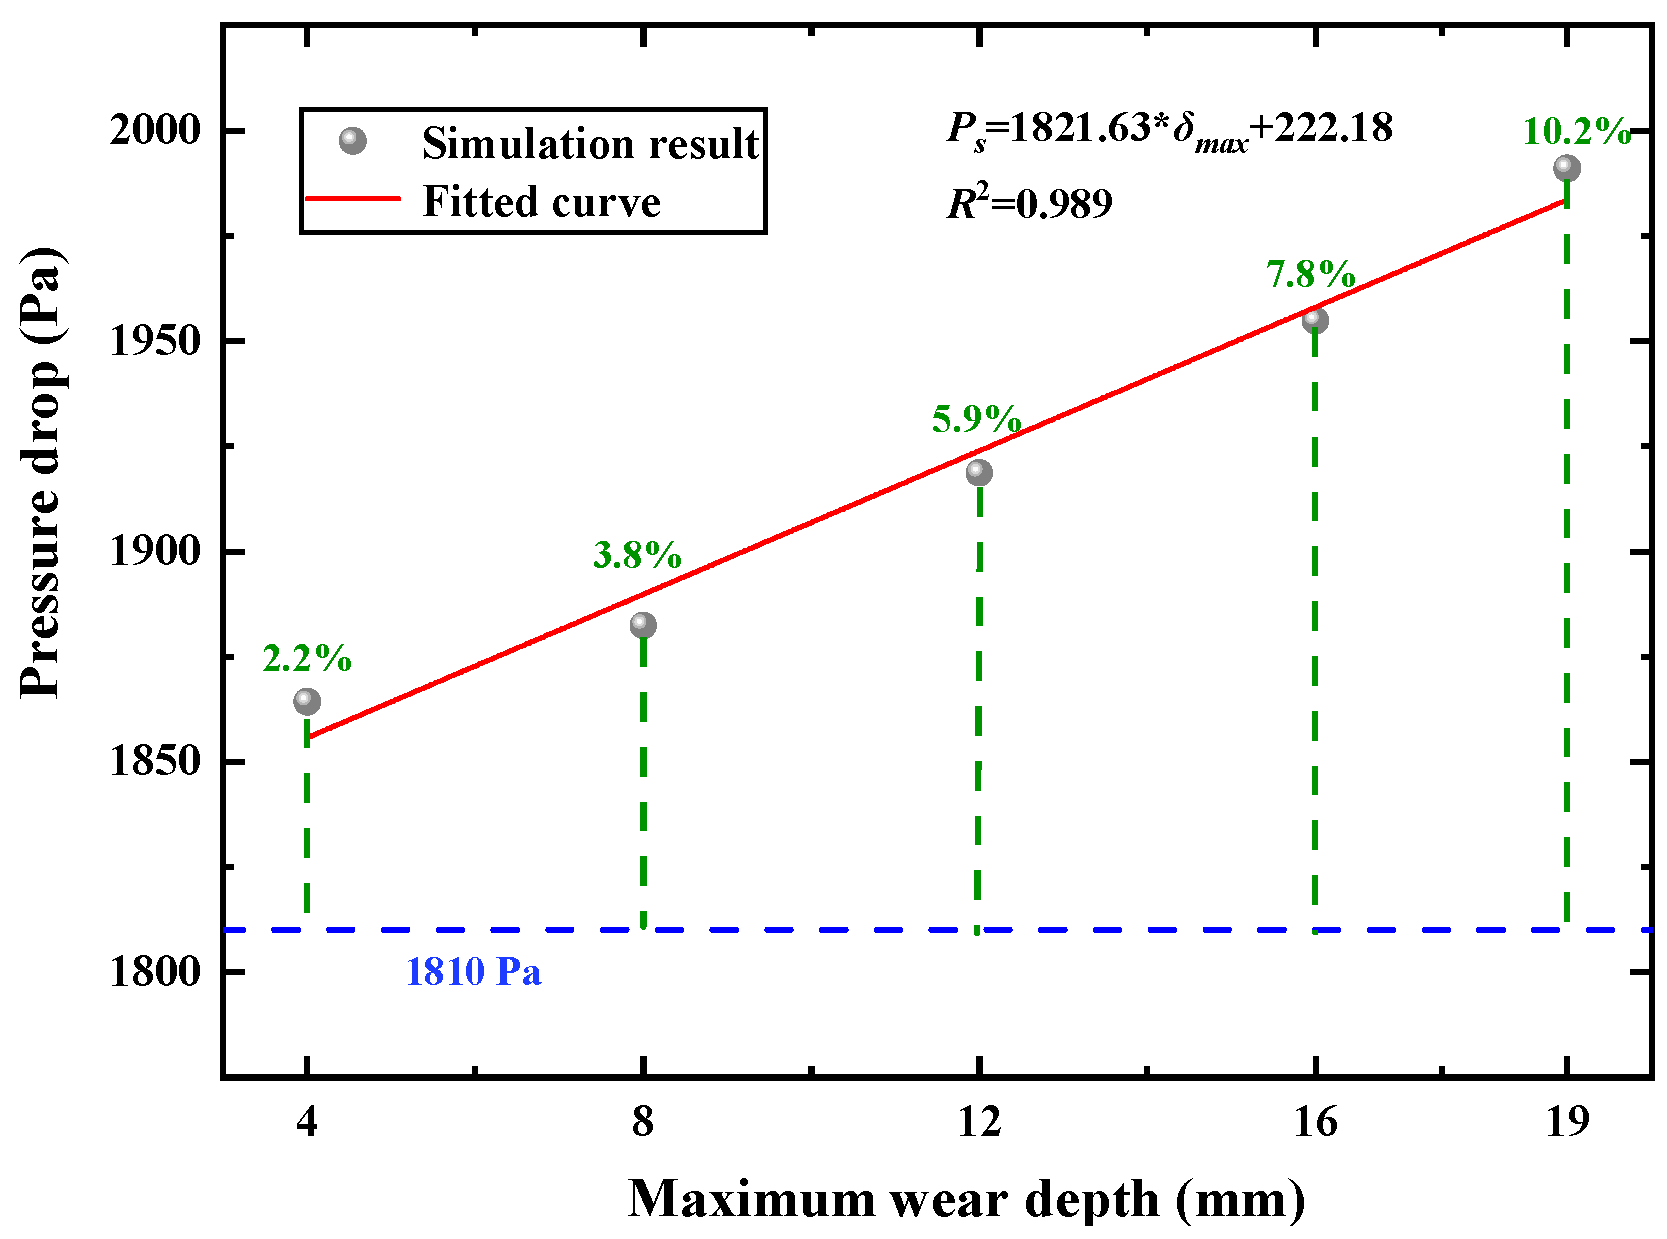
- For the elbow pipe with wear defect, the pressure drop of the elbow increases quadratically, from an increase of 6.5% to an increase of 16.9% with the maximum wear depth increasing from 4 mm to 19 mm. For the straight pipe with wear defect, the pressure drop of the elbow increases linearly, from an increase of 2.2% to an increase of 10.2% with the maximum wear depth increasing from 4 mm to 19 mm.
Author Contributions
Funding
Data Availability Statement
Conflicts of Interest
References
- Qin, Y.; Lai, J.; Gao, G.; Yang, T.; Zan, W.; Feng, Z.; Liu, T. Failure analysis and countermeasures of a tunnel constructed in loose granular stratum by shallow tunnelling method. Eng. Fail. Anal. 2022, 141, 106667. [Google Scholar] [CrossRef]
- Xu, S.; Ma, E.; Lai, J.; Yang, Y.; Liu, H.; Yang, C.; Hu, Q. Diseases failures characteristics and countermeasures of expressway tunnel of water-rich strata: A case study. Eng. Fail. Anal. 2022, 134, 106056. [Google Scholar] [CrossRef]
- Ma, E.; Lai, J.; Xu, S.; Shi, X.; Zhang, J.; Zhong, Y. Failure analysis and treatments of a loess tunnel being constructed in ground fissure area. Eng. Fail. Anal. 2022, 134, 106034. [Google Scholar] [CrossRef]
- Liu, M.B.; Liao, S.M.; Shi, Z.H.; Liu, H.K.; Chen, L.S. Analytical study and field investigation on the effects of clogging in slurry shield tunneling. Tunn. Undergr. Space Technol. 2023, 133, 104957. [Google Scholar] [CrossRef]
- Guo, Y.; Fang, Y.; Li, X.; Jin, D.; Liu, H. Simulation of screening characterization of double-deck vibrating screen of slurry TBM tunnelling using integrated CFD-DEM-FEM. Tunn. Undergr. Space Technol. 2025, 158, 106399. [Google Scholar] [CrossRef]
- Pak, Y.T.; Kim, T.K.; Ko, T.Y. A study on the discharge pipes wear of slurry shield TBM in rock strata. J. Korean Tunn. Undergr. Space Assoc. 2017, 19, 57–70. [Google Scholar] [CrossRef]
- Zhu, X.; Liu, S.; Tong, H.; Huang, X.; Li, J. Experimental and numerical study of drill pipe erosion wear in gas drilling. Eng. Fail. Anal. 2012, 26, 370–380. [Google Scholar] [CrossRef]
- Sinha, S.L.; Dewangan, S.K.; Sharma, A. A review on particulate slurry erosive wear of industrial materials: In context with pipeline transportation of mineral–slurry. Part. Sci. Technol. 2017, 35, 103–118. [Google Scholar] [CrossRef]
- Fang, Y.; Li, X.; Hao, S.; Liu, H.; Yang, Y.; Guo, Y. Failure analysis of slurry TBM discharge pipe in complex strata combined with wear and vibration characteristics. Eng. Fail. Anal. 2023, 150, 107307. [Google Scholar] [CrossRef]
- Li, X.; Guo, Y.; Li, X.; Liu, H.; Yang, Y.; Fang, Y. A Phenomenological Model for Estimating the Wear of Horizontally Straight Slurry Discharge Pipes: A Case Study. Lubricants 2024, 12, 228. [Google Scholar] [CrossRef]
- Su, G.; Zhang, J. Failure analysis of erosion wear of the pipeline after 30° elbow by adsorbent particles. Eng. Fail. Anal. 2024, 166, 108883. [Google Scholar] [CrossRef]
- Wang, X.; Guo, J.; Wu, A.; Wang, H.; Jiang, H.; Li, Z.; Qiu, Z. Wear characteristics of the pipeline transporting cemented paste backfill containing coarse aggregate. Constr. Build. Mater. 2024, 410, 134170. [Google Scholar] [CrossRef]
- Yu, H.; Liu, H.; Zhang, S.; Zhang, J.; Han, Z. Prediction of gas–solid erosion wear of bionic surfaces based on machine learning and unimodal intelligent optimization algorithm. Eng. Fail. Anal. 2024, 163, 108453. [Google Scholar] [CrossRef]
- Hafsa, N.; Rushd, S.; Alzoubi, H.; Al-Faiad, M. Accurate prediction of pressure losses using machine learning for the pipeline transportation of emulsions. Heliyon 2024, 10, e23591. [Google Scholar] [CrossRef] [PubMed]
- Vlasak, P.; Kysela, B.; Chara, Z. Fully stratified particle-ladenflow in horizontal circular pipe. Part. Sci. Technol. 2014, 32, 179–185. [Google Scholar] [CrossRef]
- Xu, J.; Yao, Y.; Yan, H.; Zhou, N.; Su, H.; Li, M.; Liu, S.; Wang, H. Experimental study of pipeline pressure loss laws with large-size gangue slurry during the process of industrial-grade annular pipe transportation. Constr. Build. Mater. 2024, 436, 136993. [Google Scholar] [CrossRef]
- Li, Z.; Chen, H.; Wu, Y.; Xu, Z.; Shi, H.; Zhang, P. CFD-DEM analysis of hydraulic conveying of non-spherical particles through a vertical-bend-horizontal pipeline. Powder Technol. 2024, 434, 119361. [Google Scholar] [CrossRef]
- Qiu, Z.; Xiao, Q.; Yuan, H.; Han, X.; Li, C. Particle shape and clogging in fluid-driven flow: A coupled CFD-DEM study. Powder Technol. 2024, 437, 119566. [Google Scholar] [CrossRef]
- Wan, C.; Zhu, H.; Xiao, S.; Zhou, D.; Bao, Y.; Liu, X.; Han, Z. Prediction of pressure drop in solid-liquid two-phase pipe flow for deep-sea mining based on machine learning. Ocean Eng. 2024, 304, 117880. [Google Scholar] [CrossRef]
- Versteeg, H.K.; Malaskekera, W. An Introduction to Computational Fluid Dynamics: The Finite Volume Method, Fluid Flow Handbook; McGraw-Hill: New York, NY, USA, 1995. [Google Scholar]
- Min, F.; Song, H.; Zhang, N. Experimental study on fluid properties of slurry and its influence on slurry infiltration in sand stratum. Appl. Clay Sci. 2018, 161, 64–69. [Google Scholar] [CrossRef]
- Launder, B.E.; Spalding, D.B. The numerical computation of turbulent flows. Comput. Methods Appl. Mech. Eng. 1974, 3, 269–289. [Google Scholar] [CrossRef]
- Yang, D.; Xia, Y.; Wu, D.; Chen, P.; Zeng, G.; Zhao, X. Numerical investigation of pipeline transport characteristics of slurry shield under gravel stratum. Tunn. Undergr. Space Technol. 2018, 71, 223–230. [Google Scholar] [CrossRef]
- Cundall, P.A.; Strack, O.D.L. A discrete numerical model for granular assemblies. Géotechnique 1979, 29, 47–65. [Google Scholar] [CrossRef]
- Mindlin, R.D.; Deresiewicz, H. Elastic spheres in contact under varying oblique forces. J. Appl. Mech. 1953, 20, 327–344. [Google Scholar] [CrossRef]
- Haider, A.; Levenspiel, O. Drag coefficient and terminal velocity of spherical and nonspherical particles. Powder Technol. 1989, 58, 63–70. [Google Scholar] [CrossRef]
- Morsi, S.A.J.; Alexander, A.J. An investigation of particle trajectories in two-phase flow systems. J. Fluid Mech. 1972, 55, 193–208. [Google Scholar] [CrossRef]
- Yan, Z.; Yin, S.; Chen, X.; Wang, L. Rheological properties and wall-slip behavior of cemented tailing-waste rock backfill (CTWB) paste. Constr. Build. Mater. 2022, 324, 126723. [Google Scholar] [CrossRef]
- Tsuji, Y.; Kawaguchi, T.; Tanaka, T. Discrete particle simulation of two-dimensional fluidized bed. Powder Technol. 1993, 77, 79–87. [Google Scholar] [CrossRef]


| Pipe Type | Elements Number | Nodes Number |
|---|---|---|
| Straight pipe with wear defect | 35,743 | 190,567 |
| 90° elbow pipe with wear defect | 33,480 | 177,886 |
| Straight pipe without wear defect | 9349 | 48,920 |
| 90° elbow pipe without wear defect | 6155 | 32,045 |
| Parameters | Value |
|---|---|
| Fluid density (kg/m3) | 1150 |
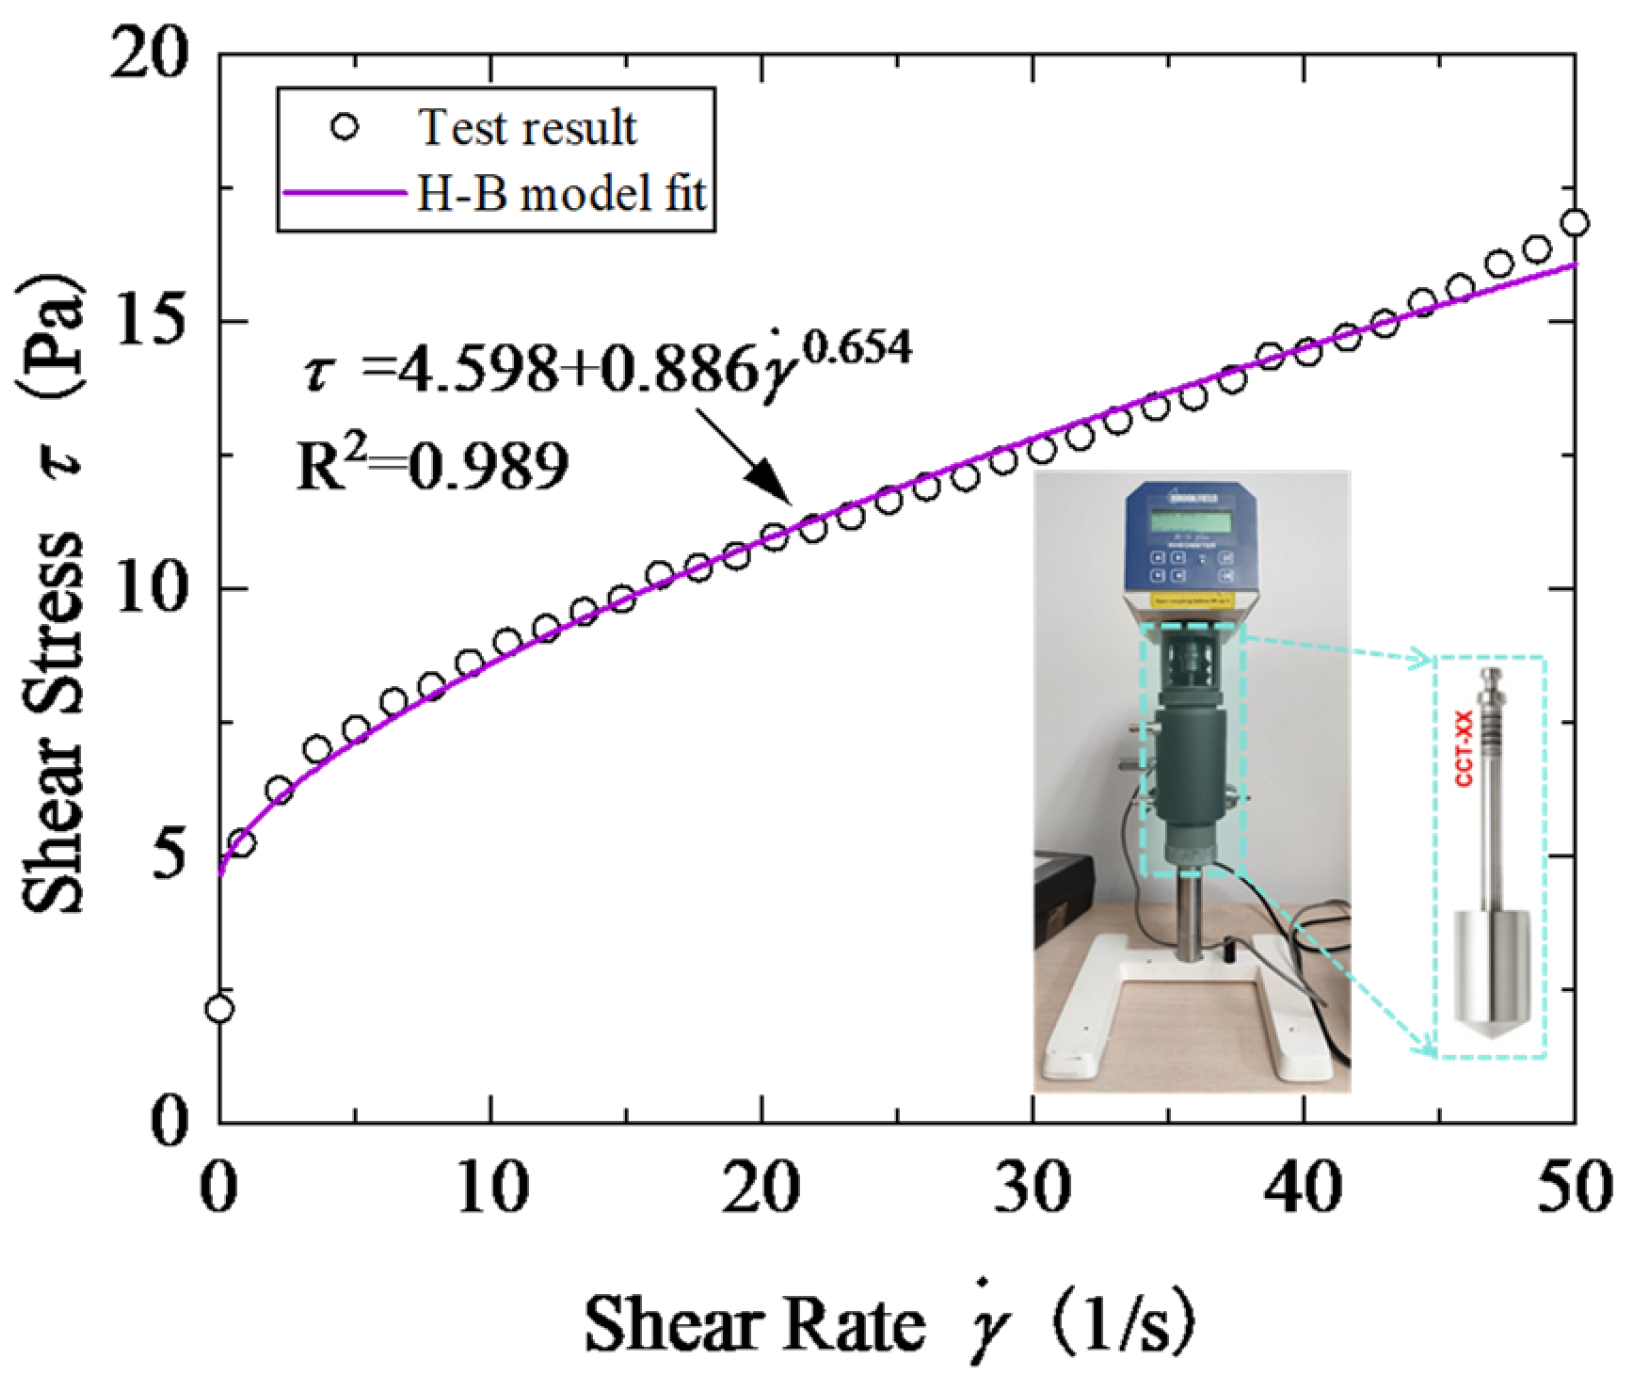
| Yield stress of fluid (Pa) | 4.598 |
| Viscosity coefficient of fluid (Pa·sn) | 0.886 |
| Power law index of fluid | 0.654 |
| Particle density (kg/m3) | 2500 |
| Poisson ratio of particle | 0.13 |
| Shear modulus of particle (Pa) | 2.212 × 10¹⁰ |
| Pipe wall density (kg/m3) | 7800 |
| Poisson ratio of pipe wall | 0.25 |
| Shear modulus of pipe wall (Pa) | 8 × 10¹⁰ |
| Particle–particle static friction coefficient | 0.35 |
| Particle–particle rolling friction coefficient | 0.01 |
| Particle–pipe wall static friction coefficient | 0.35 |
| Particle–pipe wall rolling friction coefficient | 0.01 |
| Coefficient of restitution | 0.05 |
Disclaimer/Publisher’s Note: The statements, opinions and data contained in all publications are solely those of the individual author(s) and contributor(s) and not of MDPI and/or the editor(s). MDPI and/or the editor(s) disclaim responsibility for any injury to people or property resulting from any ideas, methods, instructions or products referred to in the content. |
© 2025 by the authors. Licensee MDPI, Basel, Switzerland. This article is an open access article distributed under the terms and conditions of the Creative Commons Attribution (CC BY) license (https://creativecommons.org/licenses/by/4.0/).
Share and Cite
Fang, Y.; Li, X.; Li, X.; Guo, Y.; Liu, H. Effect of Pipe Wall Wear Defects on the Flow Characteristics of Slurry Shield Discharge Pipe. Lubricants 2025, 13, 68. https://doi.org/10.3390/lubricants13020068
Fang Y, Li X, Li X, Guo Y, Liu H. Effect of Pipe Wall Wear Defects on the Flow Characteristics of Slurry Shield Discharge Pipe. Lubricants. 2025; 13(2):68. https://doi.org/10.3390/lubricants13020068
Chicago/Turabian StyleFang, Yingran, Xinggao Li, Xingchun Li, Yidong Guo, and Hongzhi Liu. 2025. "Effect of Pipe Wall Wear Defects on the Flow Characteristics of Slurry Shield Discharge Pipe" Lubricants 13, no. 2: 68. https://doi.org/10.3390/lubricants13020068
APA StyleFang, Y., Li, X., Li, X., Guo, Y., & Liu, H. (2025). Effect of Pipe Wall Wear Defects on the Flow Characteristics of Slurry Shield Discharge Pipe. Lubricants, 13(2), 68. https://doi.org/10.3390/lubricants13020068