3.1. Friction
The friction characteristics of wire ropes are intricately linked to the operational stability of the rope transportation system. This study investigates the COF and temperature rise due to friction for the wire rope under various friction pair conditions.
Figure 4 shows the variation curve of the COF as a function of sliding distance. Under the condition of rope–sheave sliding contact (see
Figure 4a), the COF reaches the maximum at the moment of relative motion of the contact pair and then decreases rapidly. The COF is gradually stable when the sliding distance is more than 60 m. Furthermore, after approximately 140 m of relative sliding, the COF becomes relatively stable. It is approximately 0.72. The higher initial COF observed in the wire rope during the early stages of testing can be attributed to several factors. Firstly, the contact surface being curved increases the complexity of the contact mechanics. Secondly, the relatively high sliding velocity between the friction pair leads to increased dynamic effects. Additionally, the presence of inertial impacts further exacerbates the frictional resistance, resulting in a higher COF at the onset of the test. However, as the friction pair is rope–rope contact, the COF increases rapidly during the experiment (approximately 9 m), reaching a relatively stable state after a short fluctuation. The mean COF during the stable phase is approximately 0.75. In the relevant research literature, Cruzado et al. [
30] found that the COF between the wires inside a steel wire rope is stable at around 0.7. Additionally, Wang et al. [
31] investigated the bending friction fatigue behavior between the steel wire rope and the sheave groove material in offshore platform winches, revealing that the COF between these components is approximately 0.6. This indicates that the friction coefficients of steel wire ropes exhibit significant variations under different working conditions. Comparing the variation patterns of the COF for the two distinct contact pairs of the wire rope, it can be found that the COF during the stable phase is very close, while there is a big difference in the evolution of the COF during the initial sliding phase. This phenomenon can be attributed to the significant variations in the contact surface characteristics of the wire rope when subjected to two distinct friction pairs. Under the condition of rope–sheave sliding contact (see
Figure 4a), the surface of the contact pair is curved. Considering that the relative sliding speed of the friction pair is relatively fast, the friction resistance is large under the influence of inertial impact, resulting in a large COF of the wire rope at the onset of the test. Additionally, the sliding contact area of the rope sample is long. Considering the complex irregular spiral structure of the rope surface, the rope–sheave contact pair is mainly point contact and line contact. As the sliding distance increases, the surface of the wire rope wears at an accelerated rate under the influence of large contact stress, and the real contact area of the rope–sheave contact pair increases quickly. Therefore, the COF decreases quickly in the early stage of the test. Considering the wire rope and its constituent steel wires exhibit a cylindrical geometry, the contact region does not expand rapidly in the process of the sliding wear experiment. The contact surface of the friction pair gradually becomes stable. Consequently, the COF also reaches a relatively stable condition. Moreover, when the friction pair transitions to rope–rope contact (see
Figure 4b), the contact area of the wire rope that undergoes sliding motion is relatively limited, and there is direct contact between multiple steel wires. The surface of the friction pair gradually progresses to rough from smooth during sliding wear. Furthermore, the relative sliding speed of the rope–rope contact pair is generally slow. Thus, the COF of wire rope in the running-in wear stage shows an increasing trend. Comparing the COF curves of two kinds of friction contact pairs for the wire rope, it can be found that the impact of contact type on the COF is mainly concentrated in the early stage of the friction experiment.
Figure 5 presents the infrared thermal imaging of the friction area for the wire rope under various contact pairs. The infrared thermal imager can visually monitor the dynamic contact characteristics and friction heat changes in different wire rope friction pairs. With the increase in sliding distance, the color intensity in the sliding contact region progressively becomes more pronounced. At the same time, the bright area becomes larger and larger. This indicates that the friction heat continues accumulating during the experiment, and the contact region between the friction pair components expands. Under the condition of rope–sheave contact (
Figure 5a), the heat generated is transferred from the contact surface to both the wire rope and the sheave during the friction experiment. The surface temperature increased significantly, but the temperature of the wire rope increased faster. This is because the volume of the sheave is larger. Additionally, it is in a continuous rotation state, and the absorbed heat is transferred outward faster. Compared with the experimental results of the rope–sheave contact pair, the temperature rise in the rope–rope contact pair during the experiment is milder (see
Figure 5b). The thermal energy resulting from friction is predominantly localized at the interface of the contact pair, thereby preventing a significant rise in the temperature of the entire wire rope. This is because the sliding speed of the wire rope is slow and the contact area is small, resulting in little temperature rise during the friction experiment. Therefore, the evolution of friction-induced temperature rise in the wire rope exhibits markedly different behaviors when subjected to two distinct contact pair configurations. The temperature rise caused by the rope–sheave contact pair is more intense.
The curves of friction temperature rise under different contact conditions are shown in
Figure 6. It is apparent that the temperature rise resulting from friction in the wire rope, when interacting with different sliding contact pairs, demonstrates consistent patterns of variation. The temperature rise increases rapidly during the early phase of the friction experiment, then the curves gradually stabilize and ultimately reach a comparatively stable phase. Additionally, the three stages of change correspond to the evolution of the COF, as shown in
Figure 4. However, the influence of different friction pairs on the curve characteristics of various stages is also obvious. Under the condition of rope–sheave contact, the temperature rise rate of the friction pair is faster. When the sliding distance reaches 60 m, the temperature rises to approximately 20 °C. This is because friction heat generation is closely related to friction and wear. During the early phase of the sliding friction experiment, the COF is small but increases rapidly. At the same time, the surface characteristics of the friction contact area also change greatly. Thus, the increased rate of temperature rise is larger in the first 60 m of the sliding process. As the COF and wear state tend to be stable, the thermal energy produced by sliding friction progressively reaches equilibrium with the heat exchange and dissipation characteristics of the contacting surfaces. The friction temperature rise is stable at approximately 25 °C (the actual temperature of the wire rope is about 50 °C). Furthermore, compared with the experimental results in
Figure 6a, the rapid increase stage of the temperature curve in the rope–rope contact state is slower, and the stable stage is more stable (see
Figure 6b). This is because the heat dissipation conditions of the two wire rope friction pairs are quite different. The sliding contact area of the wire rope is small, and the heat dissipation is mainly through air. Moreover, when the sliding speed is slow and the load is light, the total heat generated by sliding friction is less. The temperature rise finally stabilizes at approximately 4 °C (the actual temperature of the wire rope is about 29 °C). Compared with the braking condition, the temperature rise generated by the friction pair of the transportation wire rope is relatively low. Lu et al. [
32] investigated the friction behavior and wear evolution of railway friction blocks under extreme braking conditions. During the test, the temperature of the friction pair gradually increased from approximately 100 °C to 500 °C, and the friction coefficient also changed accordingly. Although the temperature rise in the friction pair studied in this paper was not very obvious during the experiment, it still had an impact on the tribological behavior of the wire ropes. Through this part of the analysis, it is observed that the contact pair between the rope and sheave typically results in a higher temperature rise in the process of engineering application, which can be used as an important parameter for monitoring the friction state of the transmission wire rope.
3.2. Wear
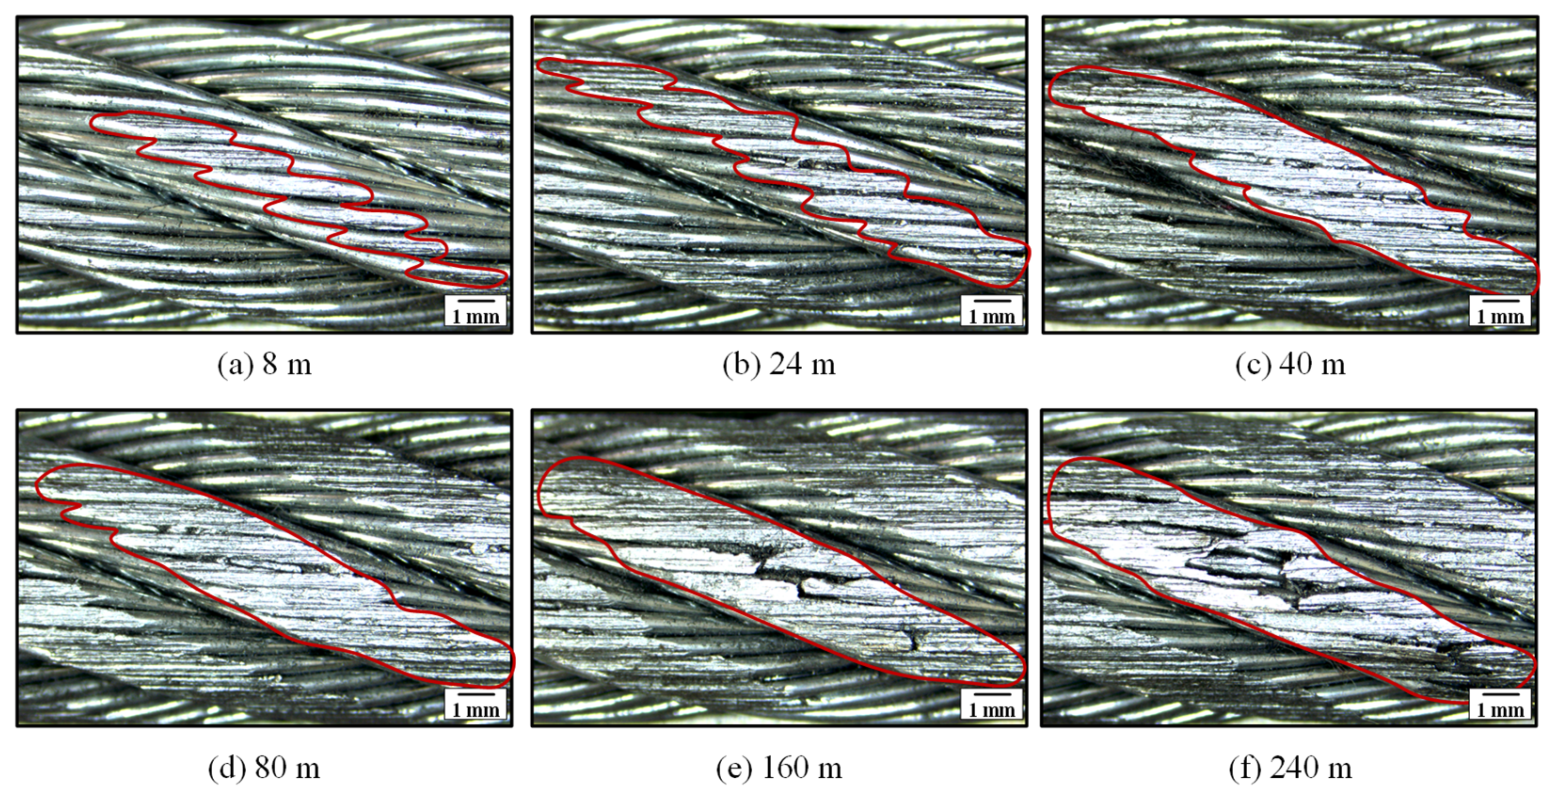
The wear scars of the wire rope subjected to rope–sheave sliding wear are presented in
Figure 7. As the sliding wear distance increases, the evolution of surface wear on the wire rope is obtained. The extensive contact surface between the wire rope and the sheave, which is about 100 mm, results in wear scars appearing across several strands on the surface of the wire rope. In this paper, the wear scars on the middle strand of the sliding wear area of the wire rope are selected for comparative analysis. It can be seen that when the distance of sliding is under 40 m, wear scars on the surface of the strand are irregularly oval. Additionally, affected by the twist direction of the rope strand and the steel wire, the wear scars generated by the rope–sheave friction pair are distributed along the axis direction of the surface steel wires. Due to the light wear degree during the preliminary phase of the sliding wear experiment, the wear depth at the wear scar is small, and the distance between the wires is visible, leading to a jagged appearance of the wear scar on the surface of the wire rope. This process corresponds to the rapid change stage of the COF and the temperature rise. This is because the wear area increases while the surface becomes smoother and more complete. Furthermore, as the sliding distance extends from 80 m to 240 m, the contour of the wear scar becomes more regular, and the wear is more severe. Large amounts of wear debris and surface extrusion deformation are generated during the wear process, and the wear depth increases, resulting in the gap between the wires being filled, the surface of the wear scars being more complete, and the contour being smoother (see
Figure 7d). However, as the wear distance increases, the surface steel wire has serious material loss, and the bearing capacity degrades greatly. Wang et al. [
31] studied similar issues. They found that the center position of the contact area between the steel wire rope and the rope groove was the most severely damaged, and the bending stress and friction coupling effect in this area were the most obvious. In addition, as the number of wear cycles increased, the degree of wear became more and more severe. This is consistent with the wear evolution trend of the steel wire rope under the working conditions studied in this paper. Therefore, the wire, which exhibits significant damage in the central region of the wear scar, experiences failure as a result of frictional forces and dynamic contact stresses.
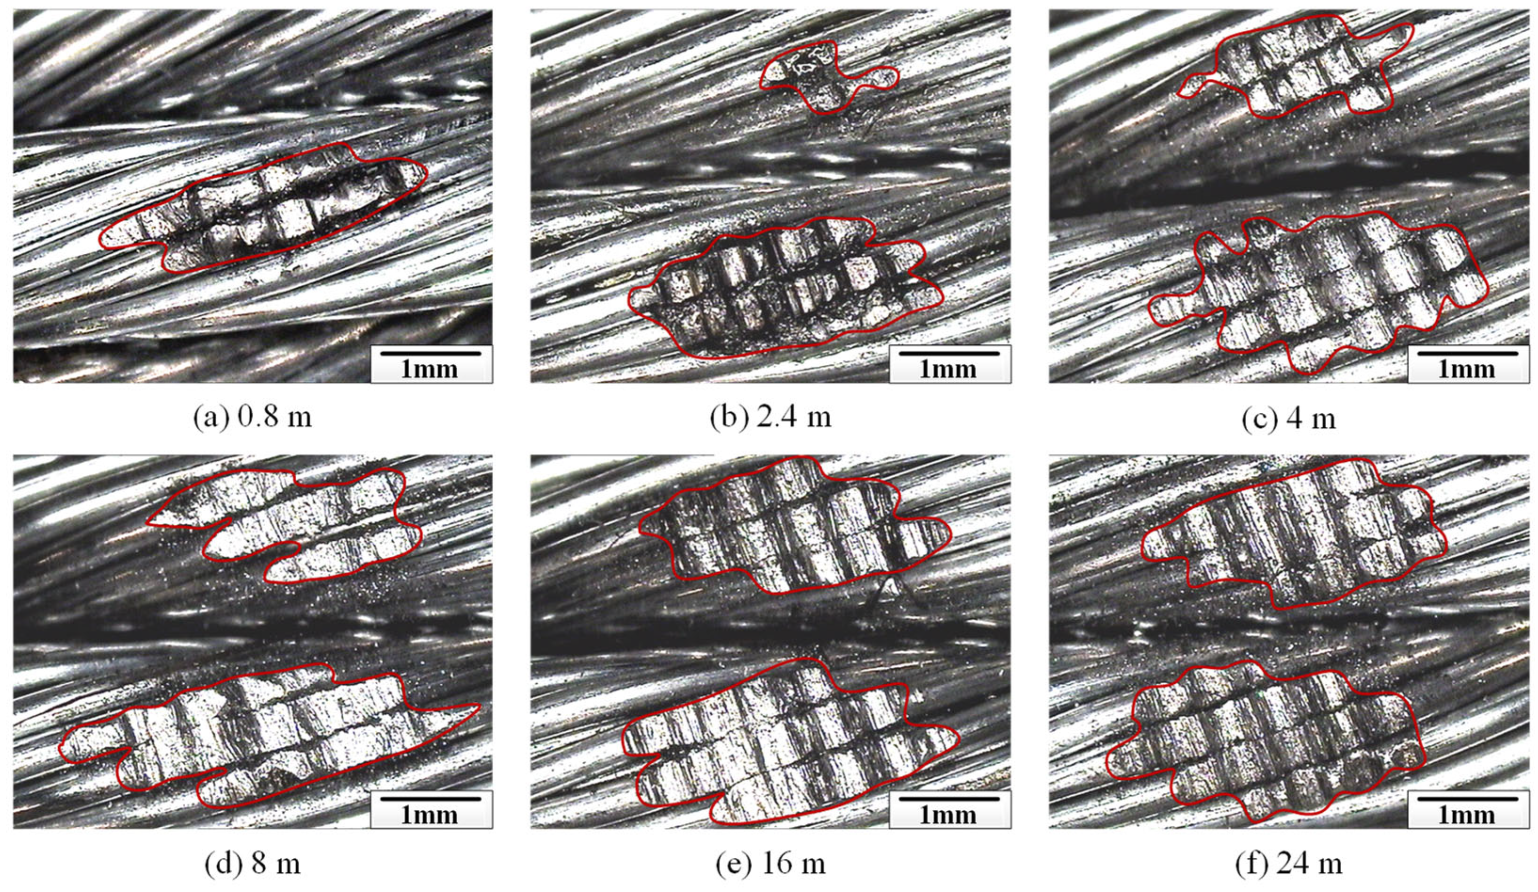
Under the condition of the rope–rope sliding friction test,
Figure 8 illustrates how wear scars on the surface of the loading rope develop as the sliding distance increases. The contour characteristics and distribution of the wear scar differ from the experimental results under the condition of rope–sheave contact. Because the length of the sliding contact area is only about 10 mm, the surface wear of the wire rope is very concentrated. Although the profile of the wear scar is still nearly elliptical on the surface of the rope strand, the overall size is significantly smaller. When the sliding distance is short, the wear area is small and concentrated on the rope strand (see
Figure 8a). Only two steel wires are damaged. As the sliding distance increases, the wear area gradually distributes across the surfaces of both strands (see
Figure 8b,c). This is because the surface structure of the wire rope is complex. The unevenness of the friction pair’s surface is a result of the space between the wires and strands. Additionally, the increasing wear depth during the wear process reduces the influence of irregular surface pairs and increases the contact area of the rope–rope friction pair. As the sliding distance increases, the wear scars become progressively and uniformly spread across the surfaces of both strands due to relative sliding action, as illustrated in
Figure 8d–f. Furthermore, due to the multi-wire spiral structure of the friction pair, multiple grooves caused by the sliding wear of the steel wires appear on the wear surface under the condition of the rope–rope contact pair. Moreover, there is also a big difference in the wear degree in the wear scar area. The wear depth in the middle of the wear area is the largest. Thus, the damage is the most serious in the middle position of the ellipse, and the wear observed at both ends is comparatively slight. The primary reason for this is the circular arc configuration of the wire rope friction pair. Compared with the wear evolution between the internal wires of the steel wire rope, the external wear of the steel wire rope is more complex. The damage profile caused by the inter-wire wear is also an irregular ellipse, mainly due to the accumulation of wear debris and plastic flow [
12]. Therefore, through the surface damage features of the transport wire ropes, the contact form that causes its damage can be distinguished, and targeted protection and maintenance can be carried out during the use and maintenance process.
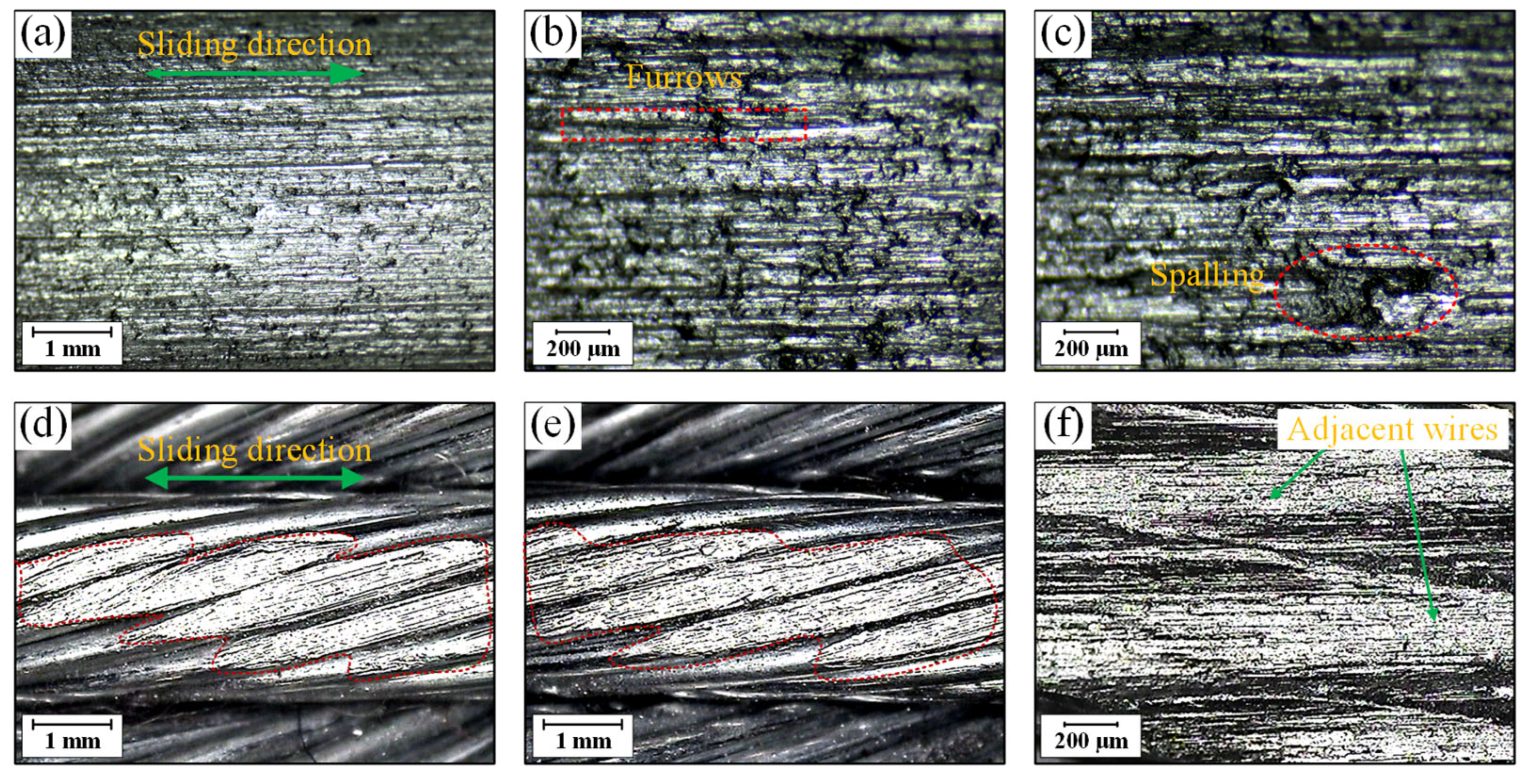
The wear appearances of the counter bodies under different friction pairs are presented in
Figure 9. Because the surface characteristics of the counter pair of the wire rope change relatively little in the wear evolution, the typical wear morphology of the moving friction pair was analyzed. In the context of the rope–sheave friction experiment, the wear appearances of the rope groove are shown in
Figure 9a–c. The furrows along the sliding direction are distributed on the surface of the rope groove. Additionally, the surface is relatively rough, and obvious plastic deformation and spalling can be seen. This indicates that the wear mechanism of the rope groove is mainly abrasive wear and adhesive wear. Because the surface structure of the loading wire rope is irregular, the surface material of the rope groove easily produces extrusion deformation and adhesion under the influence of friction heat. Moreover, under the condition of the rope–rope friction pair, the wear scars of the sliding wire rope are shown in
Figure 9d–f. During the wear test, the wear scars of the sliding wire rope change little and the surface is smooth. The wear morphology is similar to that of the loading wire rope. Due to the obvious gap between adjacent steel wires, different grooves appear in the wear region of the loading rope samples.
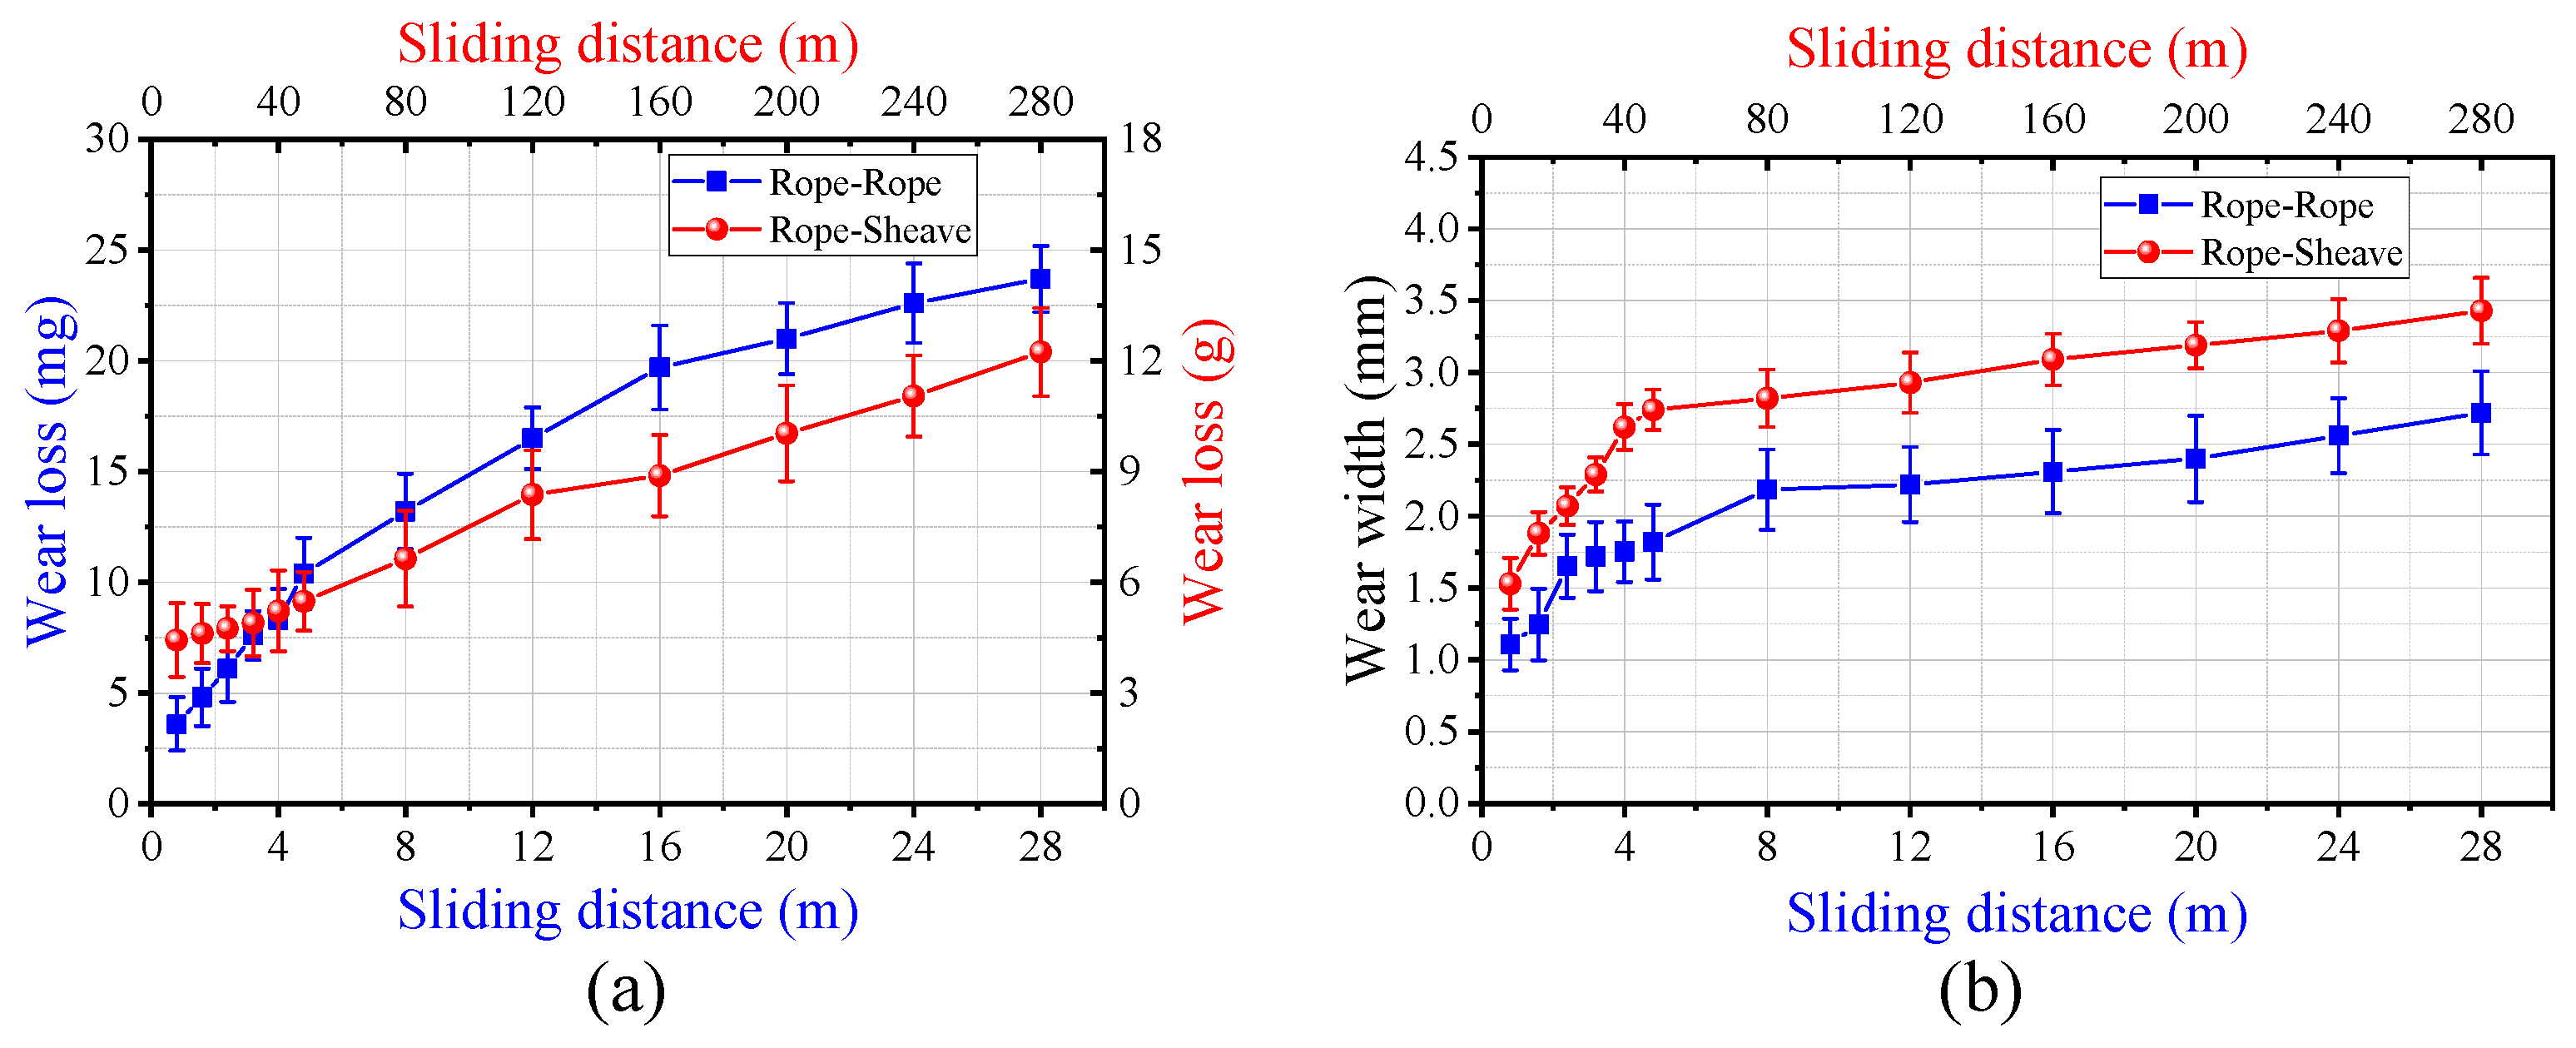
To quantitatively investigate the variation in the wear extent of the wire rope under various contact forms, this study calculates both the wear loss and the width of the wear scar, as depicted in
Figure 10. As the sliding distance increases from 8 m to 280 m, the wear loss increases from approximately 4.5 g to 12.2 g, and the wear width increases from approximately 1.5 mm to 3.4 mm under the condition of a rope–sheave contact pair. Moreover, when the contact form changes to a rope–rope friction pair, the wear loss increases from approximately 3.8 mg to 23.7 mg, and as the sliding distance varies from 0.8 m to 28 m, the wear width expands from roughly 1.1 mm to 2.7 mm. The degree of surface wear under the condition of rope–sheave contact is greater than that under the condition of rope–rope contact. In particular, the difference between the two is one order of magnitude for the experimental results of wear loss (see
Figure 10a). This occurs due to the surface wear of the wire rope being a cumulative and progressive evolution, and the contact area of the rope–sheave friction pair is larger. The wire rope and the sheave groove will produce large wear debris during the experiment. The wear width analyzed in this paper refers to the maximum wear width observed on a single-strand surface (see
Figure 7). However, there is a big difference in the overall wear degree of the wire rope under the two contact states, and the difference in wear width is not as obvious as the result of wear loss (see
Figure 10b). Additionally, the wear characteristic parameters showed a rapid growth trend at the beginning of the experiment, and then the growth rate slowed down. This is closely related to the variation in the above-mentioned wear scar distribution. Furthermore, influenced by the intricate circular arc structure of wire ropes, the increase in the wear depth will not lead to the rapid increase in the wear scar area in the later stage of the experiment, but the wear loss still shows a significant growth trend. Therefore, the degree of wear of the rope–sheave contact pair under similar working conditions is more serious. The change in wear loss can better reflect the wear evolution characteristics of the transmission wire rope.
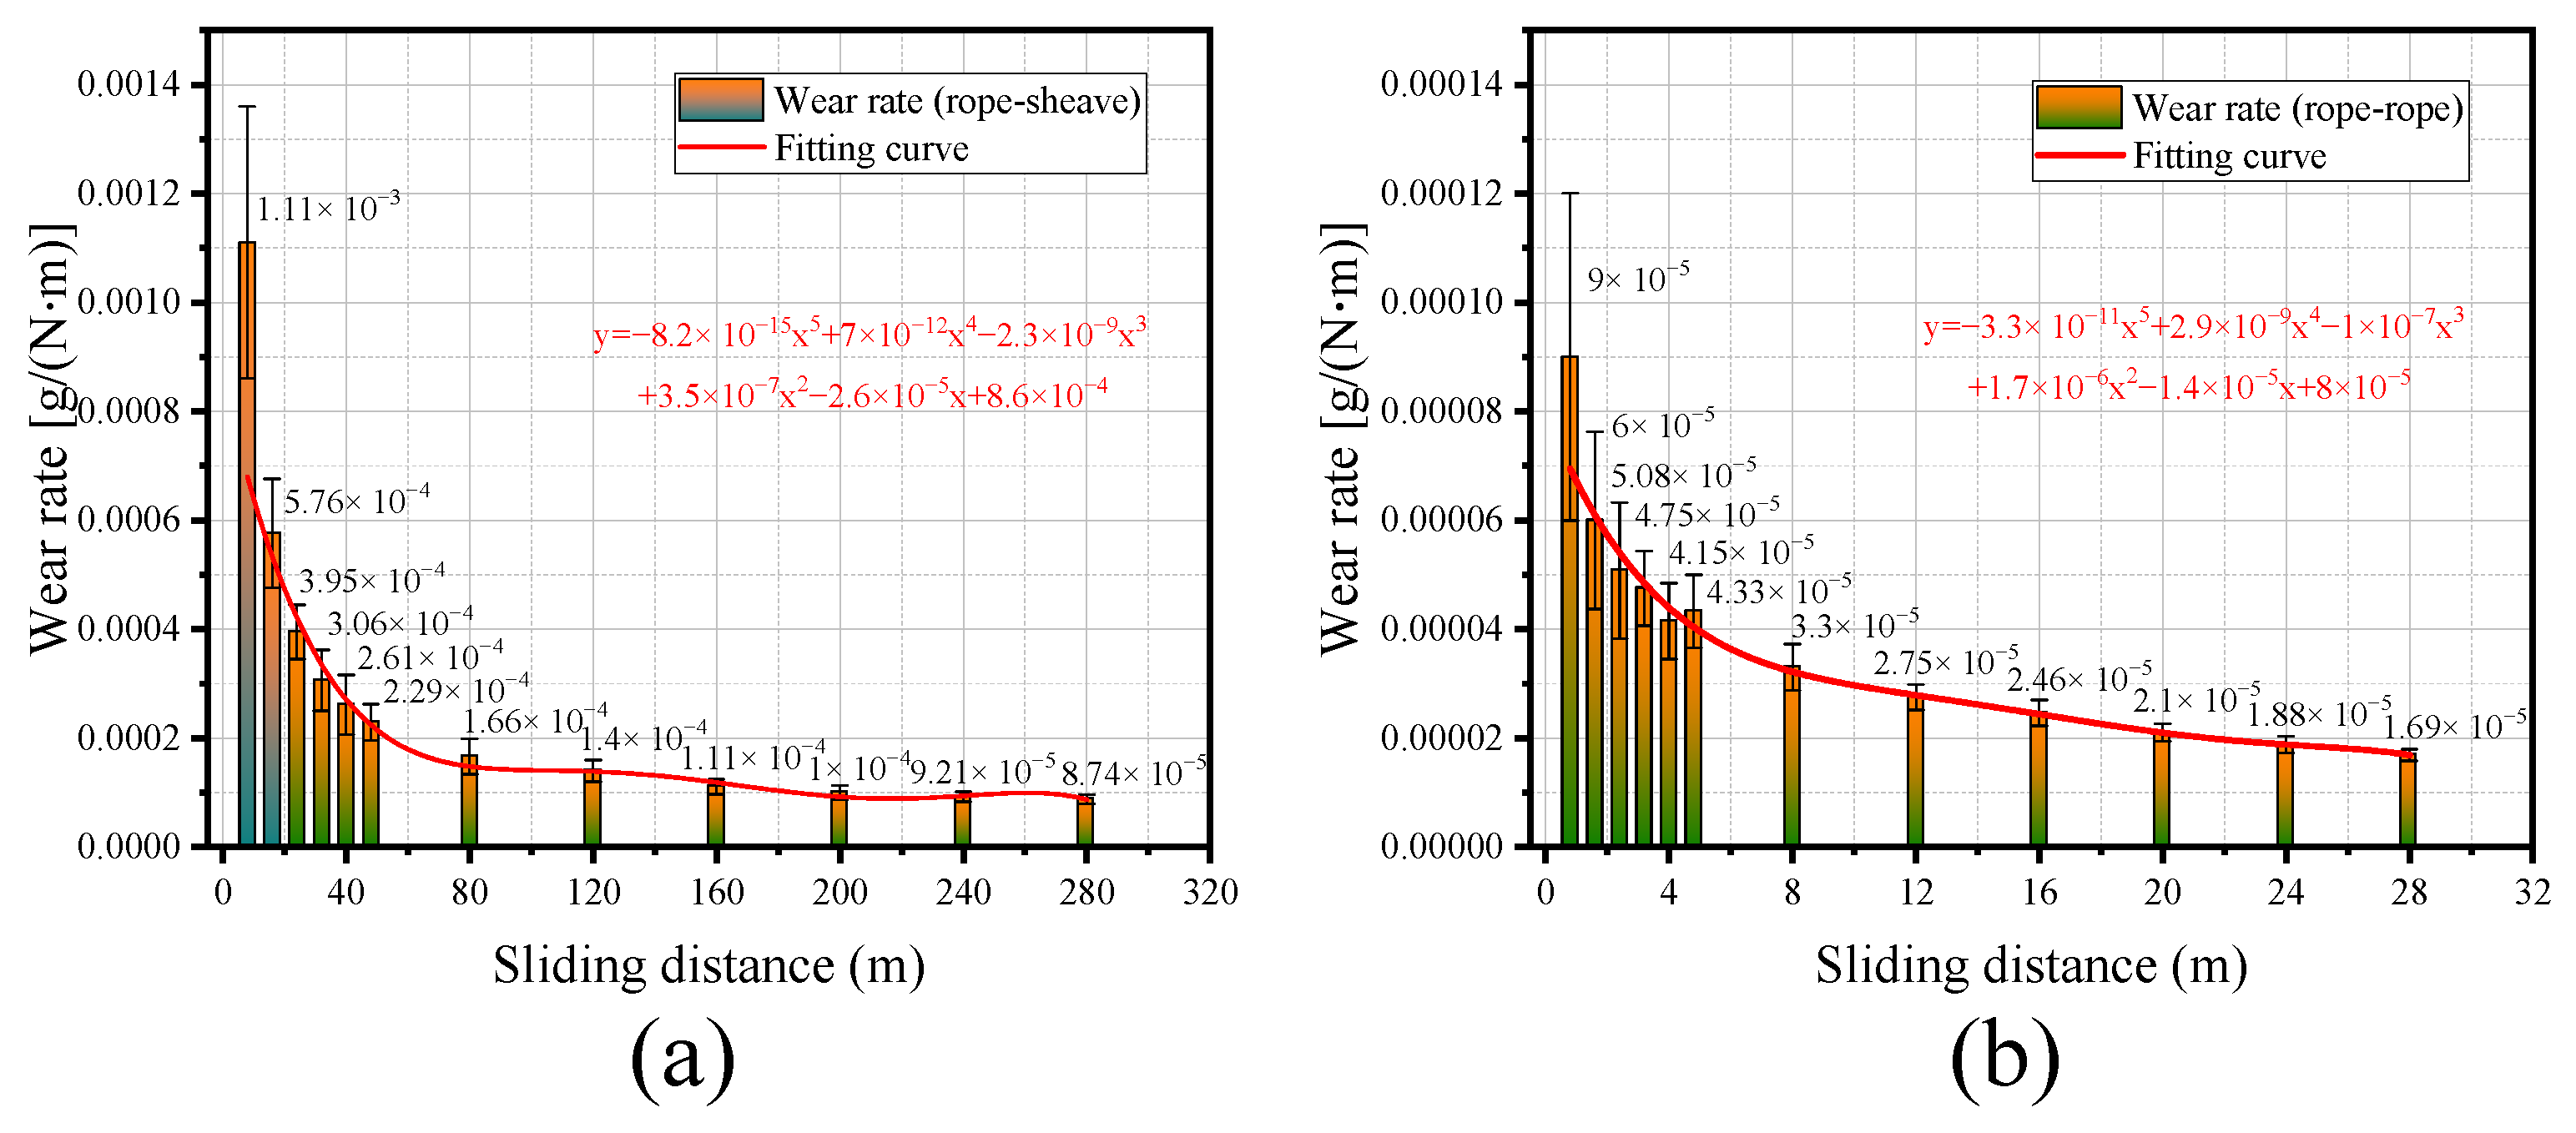
The wear area on the rope surface exhibits significant irregularity, which poses a considerable challenge in accurately quantifying the wear volume. The complexity of these factors complicates the development of a consistent and reliable method for directly measuring wear. Therefore, this paper relies on the observed wear loss in the experiment to estimate the wear rate.
Figure 11 provides a detailed illustration of the variation characteristics of the wear rate for both the rope–sheave and rope–rope friction pairs throughout the wear evolution process. As evident from the figure, the wear rate of the rope–sheave friction pair is substantially higher than that of the rope–rope friction pair. This disparity can be attributed to the distinct contact mechanics involved in each type of interaction. Specifically, in rope–sheave contact, the sheave’s surface exerts a more concentrated and localized force on the rope, leading to greater wear per unit area. In contrast, rope–rope contact involves a more distributed load, resulting in less severe wear. Despite the difference in wear rates between the two types of friction pairs, the trend in the change in wear rate as a function of sliding distance remains similar for both. Under rope–sheave contact conditions, the wear rate experiences a rapid decrease in the initial stage of sliding wear. This initial phase is characterized by high levels of surface roughness and microstructural changes, contributing to accelerated wear. However, as the sliding distance exceeds 80 m, the wear rate tends to stabilize. This stabilization can be attributed to the formation of a stable wear layer on the rope surface, which mitigates further material loss.
When the friction pair changes to rope–rope contact (as shown in
Figure 11b), the wear rate also exhibits a relatively higher value at smaller sliding distances. Initially, the ropes’ surfaces are relatively rough and unconditioned, leading to increased wear. As the sliding distance increases, the wear rate decreases gradually and eventually stabilizes after surpassing 8 m. This behavior can be explained by gradually conditioning the rope surfaces, where the initial roughness is smoothed out, establishing a more uniform wear pattern. This phenomenon can be further understood by examining the expansion process of the wear scars on the rope surface, as depicted in
Figure 7 and
Figure 8. During the initial stages of sliding wear, the wear scars on the wire rope exhibit a significantly accelerated expansion. This rapid expansion is driven by the high levels of stress and strain experienced by the material at the contact points. Over time, however, the expansion slows down due to the influence of the structural shape of the rope. The inherent geometry and material properties of the rope play a crucial role in determining how the wear scars evolve, ultimately leading to a more predictable and stable wear behavior. In summary, the wear characteristics of wire ropes under different friction scenarios provide valuable insights into the mechanisms governing material loss and surface degradation. Understanding these mechanisms is essential for developing effective maintenance strategies and improving the longevity of wire ropes in various applications.
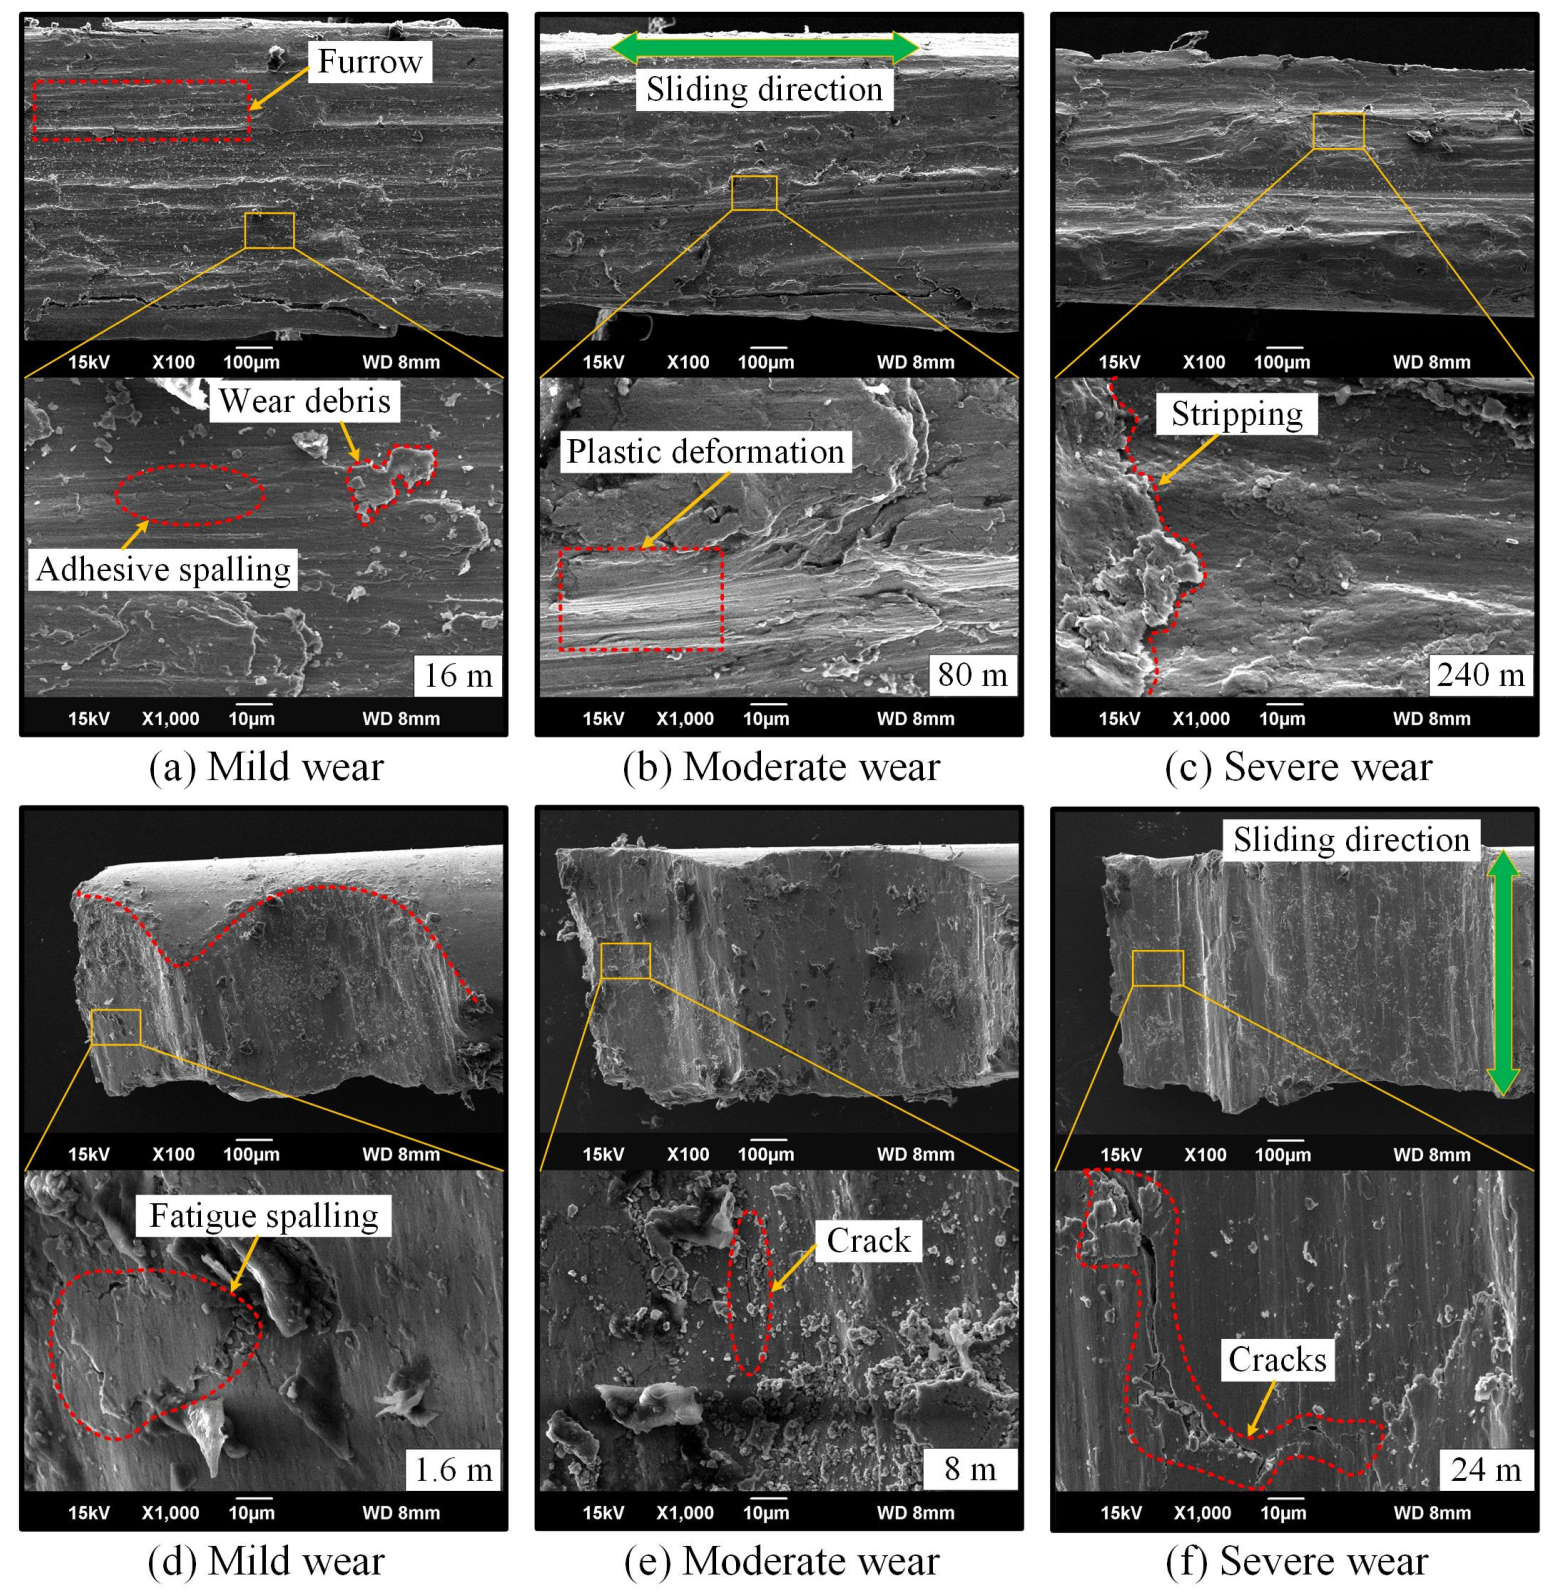
Figure 12 illustrates the representative microstructure of the wire rope’s wear surface under various friction pair conditions. Under the condition of rope–sheave contact, the sliding wear is relatively severe, and the furrows distributed along the sliding wear direction are obvious, accompanied by obvious plastic deformation, as shown in
Figure 12a–c. The degree of wear can be roughly divided into three types. When the wear is mild, the furrows are small. The adhesive wear and fatigue wear characteristics are obvious, and the spalling of wear debris in the wear area is mainly caused by adhesion. With the evolution of wear, the surface damage becomes more and more severe (see
Figure 12b,c). It can be seen that the number of furrows on the wear surface becomes less, while their size increases, and the features of plastic deformation become more pronounced. This is because the temperature rises rapidly during the friction test, resulting in the softening of the rope–wheel friction pair material. Although the temperature rise due to friction detected by the infrared thermal imager does not reach the melting point of the surface material of the steel wire rope, a relatively high instantaneous high temperature will occur at the sliding contact surface. Under the action of sliding impact load, this high temperature will induce the shear and plastic deformation of the steel wire rope material [
33,
34]. Additionally, metal materials are more prone to extrusion deformation during plowing. In the wear area of the wire rope, the fatigue spalling of the material is caused by continuous sliding extrusion deformation at the same position. Thus, the typical wear features include furrows and plastic deformation, and the wear mechanism is mainly adhesive wear and fatigue wear under the condition of a rope–sheave friction pair.
When the friction pair is rope–rope sliding contact, the wear characteristics have changed greatly, as illustrated in
Figure 12d–f. Because the surfaces of the friction pair are irregular multi-wire spiral structures, the damaged area of the steel wire is mostly an uneven wavy surface. Additionally, the material spalling of the sliding wear surface is mainly caused by micro-cutting and stress fatigue. With the cumulative evolution of surface wear, the damage degree of wire rope becomes more severe. While the worn surface tends to be flat, different degrees of fatigue cracks appear. Therefore, under the condition of a rope–rope friction pair, there is a big difference in the wear degree of steel wire at the same wear region. The primary wear mechanisms involve adhesive wear and fatigue wear. Furthermore, the wear mechanism of steel wire ropes is closely related to influencing factors such as the material of the friction pair, the contact form, and environmental conditions. For the wear mechanism between internal steel wires, it is mainly fretting fatigue wear [
17], while the damage of the steel wire rope directly in contact with the drum is mainly rolling fatigue wear, which subsequently induces crack propagation [
14,
15]. When affected by an acidic environment, the internal friction coefficient of the steel wire rope will decrease, but the wear will intensify, and the corrosion wear mechanism becomes more prominent [
35].
3.3. Degradation Characteristics of Mechanical Properties
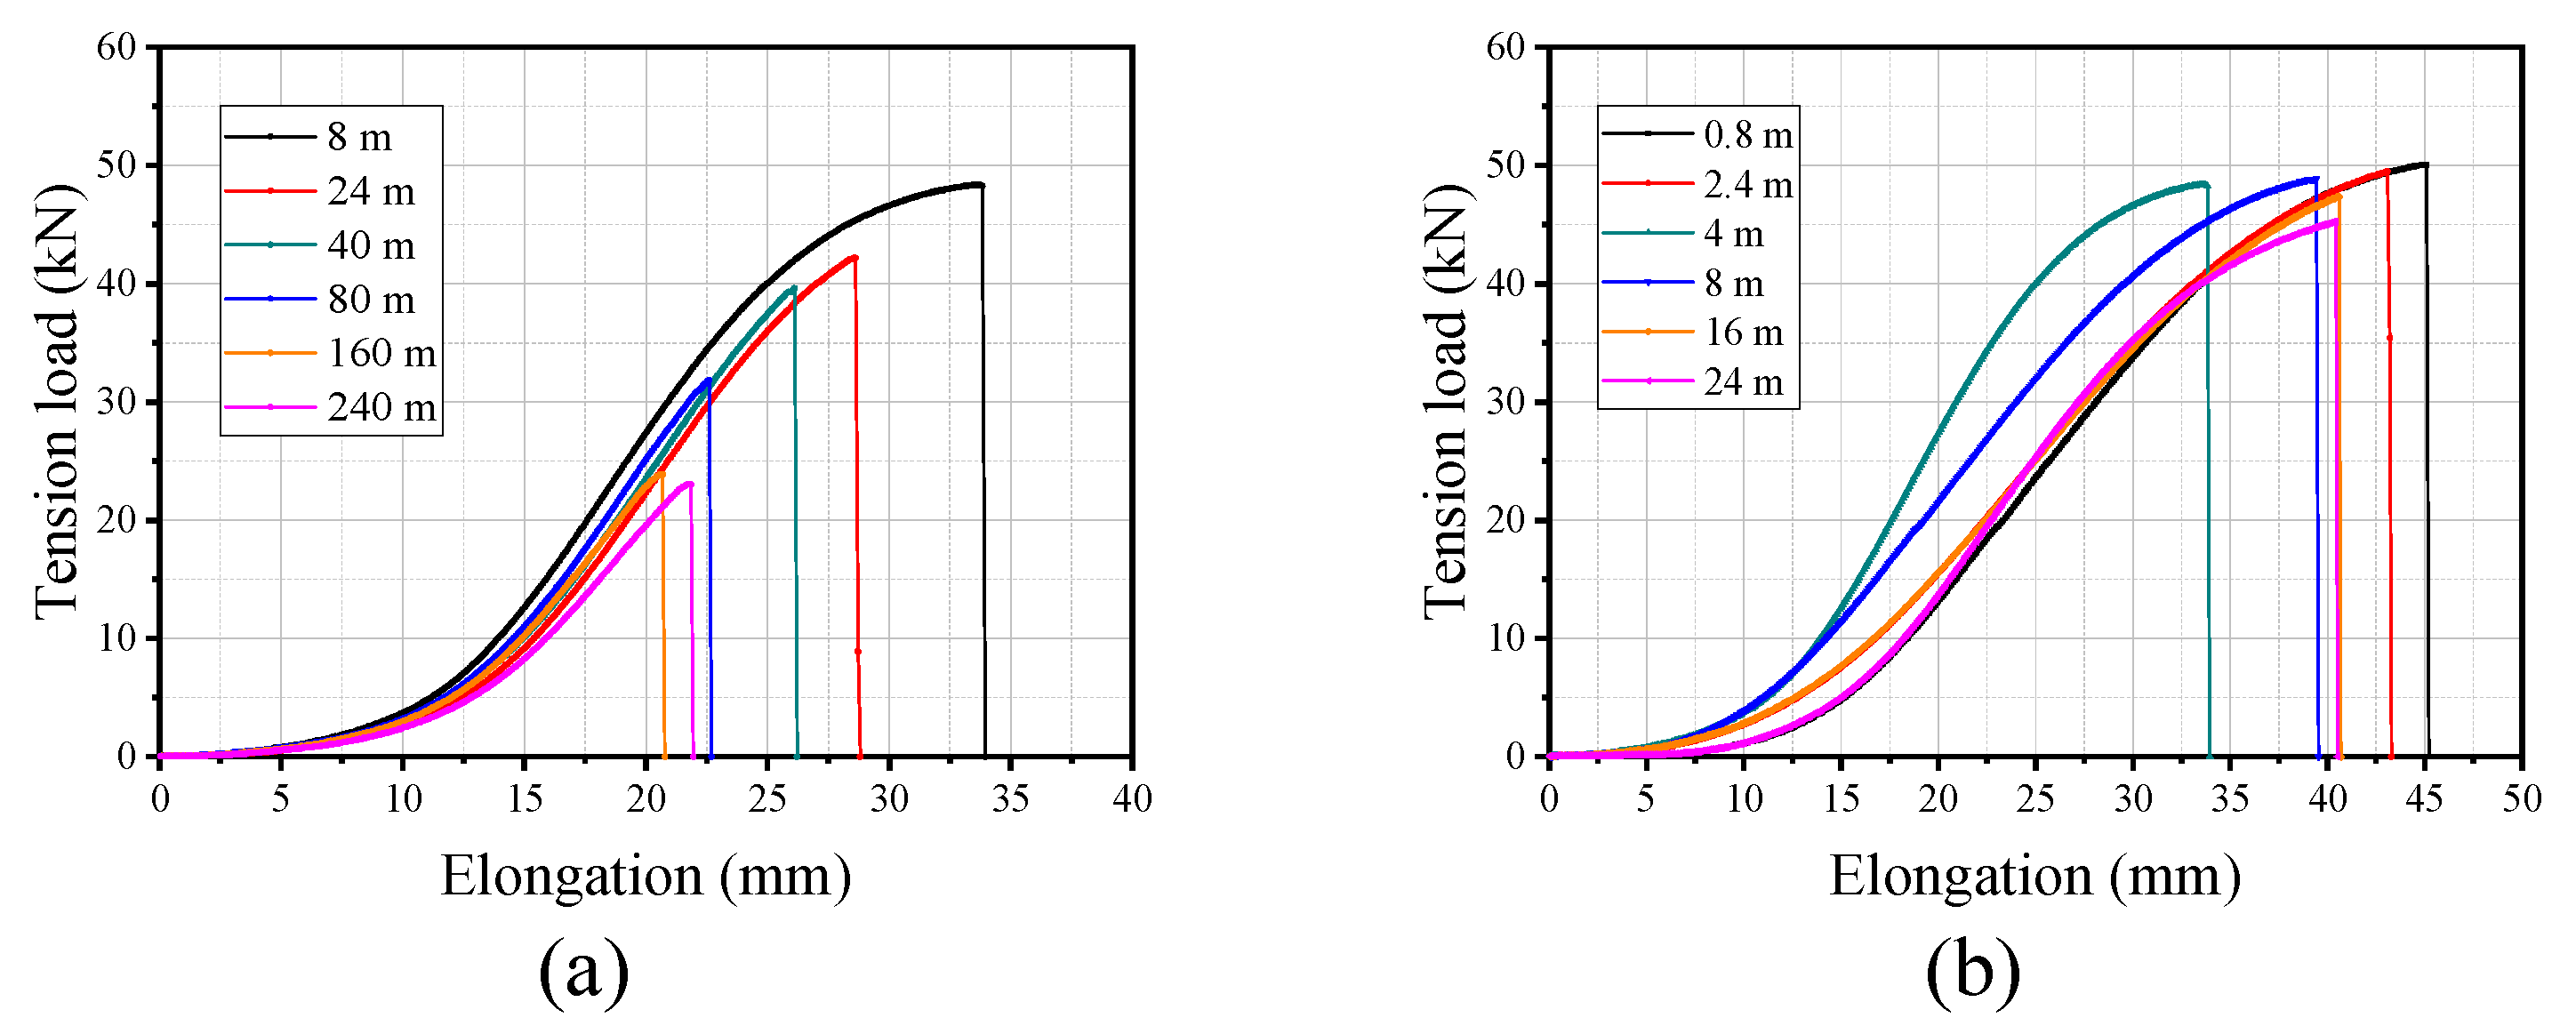
After the wear evolution tests, the force–elongation curves reflecting the degradation of mechanical properties are obtained by breaking the tensile test of different damaged wire ropes, as shown in
Figure 13. In the process of uniform tension, the tension increases very slowly at the beginning of the test. After the elongation exceeds approximately 10 mm, the tensile load begins to increase rapidly. This phenomenon can be attributed to the complex structure of the wire rope, which leads to the contraction of internal wires and the elongation of the spiral structure during the tensile test. This stage is caused by the structural deformation of the wire rope, which increases the twist of the rope samples. Thus, the tensile load of the wire rope does not increase linearly with the axial displacement. As the elongation continues to increase, the structural deformation of the rope sample gradually reaches the limit, and the curve then enters the elastic deformation stage. Additionally, the surface wear evolution causes the maximum breaking force and elongation of the wire rope to decrease. This performance decay characteristic of the force–elongation curve is more obvious under the condition of rope–sheave contact friction (see
Figure 13a). This indicates that the wear degree of the rope samples is severe and the difference is large. Because of the large damaged area of the wire rope in the rope–sheave contact state, a steel wire has multiple damages in different twist pitches, and the strength is greatly reduced. In the rope–rope contact state, the surface wear is local damage, and the quantity of damaged steel wires is minimal. Therefore, the maximum breaking force and elongation of the corresponding force–elongation curve change little, as shown in
Figure 13b. Moreover, under rope–rope contact conditions, the change stage of the damaged rope samples in the tensile process is more complete, and the yield change before breaking is more obvious. This indicates that local damage has a relatively small effect on the tensile mechanical properties of the wire rope.
To quantitatively evaluate the influence of wear evolution on tensile strength degradation under two contact friction pairs, the maximum breaking force and elongation of the rope samples are further analyzed, as shown in
Figure 14. With the increase in wear loss and wear width, the maximum breaking force of the damaged rope samples decreases from approximately 50 kN to 46 kN under the condition of rope–rope contact. However, when the contact form is a rope–sheave friction pair, the breaking force decreases from approximately 48 kN to 23 kN. Thus, the rope–sheave sliding friction pair has a greater influence on the tensile strength of the transmission wire rope, and the harm is more serious. Additionally, when the sliding distance is below 80 m, the degradation rate of the breaking force is the fastest, and the decrease is about 17 kN. This corresponds to the variation law of wear scar distribution and the wear characteristic parameters of the wire rope. Moreover, the maximum elongation of the damaged wire rope decreases from approximately 45 mm to 34 mm under the condition of rope–rope contact. In comparison, it decreases from approximately 33 mm to 21 mm when the friction pair is rope–sheave contact (see
Figure 14b). The tensile strength of the steel wire rope decreases obviously under this condition, and the fracture of the steel wire rope happens earlier in the experimental process. Thus, all the elongations of the rope sample are relatively smaller.
The bending fatigue test outcomes of the wire rope with varying damages are presented in
Figure 15. In the bending fatigue test, as the number of bending cycles increases, the number of broken wires in the steel wire rope gradually increases. The bending fatigue testing machine records the number of bending cycles for each test and simultaneously observes and records the broken wire situation of the steel wire rope, thereby establishing the corresponding relationship between the number of bending cycles and the number of broken wires. Additionally, when broken wires reach 10, the steel wire rope is considered scrapped. Therefore, the termination criterion for a single fatigue test is the appearance of 10 broken wires in the steel wire rope. By examining the correlation between the number of broken wires and the bending fatigue cycles, it can be found that there are great differences in bending fatigue performance at different stages of the wear evolution. As shown in
Figure 15a, under the condition of the rope–sheave friction pair, the first four broken wires of the wire rope sample often require more bending fatigue times when the surface wear is mild. It is about 3000 to 5700 times. As the number of broken wires increases from 5 to 10, the change in bending fatigue times is relatively small. The bending times concentrate around 6000. This is because the number of steel wires with severe damage inside the wire rope is small, and the steel wires with relatively severe surface wear are first broken during the test. The fracture occurs almost simultaneously for the steel wires with uniform and mild wear, and the number of bending fatigue times required to achieve a fracture is also more. Moreover, with the increase in sliding distance, the number of severely worn steel wires becomes higher, and its bending fatigue resistance decreases. Less bending fatigue times will lead to the fracture of the steel wire. Especially when the sliding distance exceeds 120 m, the number of broken wires in the rope samples reaches 10 after approximately 500 times of experiencing bending fatigue. However, the bending fatigue test results of rope samples with local wear caused by rope–sheave friction pairs are quite different, as shown in
Figure 15b. As the number of broken wires increases, the bending fatigue cycles of the rope samples initially rise rapidly and subsequently stabilize gradually. This is because the damage degree of the worn steel wires on the rope surface is quite different under this condition, but the overall damage is not severe, and the number of worn steel wires is small. In bending fatigue, the severely worn steel wire breaks first. With the decrease in the wear degree of the steel wire, the number of bending fatigues increases gradually. Therefore, the most important impact of wear on the bending fatigue performance of transmission wire ropes is the steel wires with more severe damage. Furthermore, the larger wear area on the rope surface will greatly reduce its bending fatigue resistance.
The variation pattern of bending fatigue cycles corresponding to the first and tenth broken wires in a damaged wire rope under various contact forms is illustrated in
Figure 16. As the wire rope undergoes wear progression, the bending fatigue cycles associated with the first broken wire decrease from approximately 3000 times to 9 times (rope–sheave contact), and from approximately 5000 times to 50 times (rope–rope contact). This suggests that the fatigue life of the severely worn wires is progressively diminishing, and the wear caused by the rope–sheave friction pair is more harmful to the fracture of wires. Because the first broken wire in the bending fatigue process is the most seriously worn steel wire, the impact of the two contact forms on the experimental outcomes is not significant. However, when the number of broken wires accumulates to 10, the difference in the influence of wear evolution on bending fatigue life under the two friction pairs is relatively large. It decreases from approximately 6200 times to 200 times (rope–sheave contact), and from approximately 9780 times to 4160 times (rope–rope contact). The wear evolution caused by the rope–sheave contact condition leads to a rapid decrease in the bending fatigue life of the wire rope (
Figure 16a). The surface wear under the condition of rope–rope contact also decreases bending fatigue life, but the decrease is smaller. The whole rope still has good bending fatigue resistance (
Figure 16b). Furthermore, fatigue damage is a cumulative evolution process, and the location of the broken wire often has a certain randomness. The surface wear greatly reduces this randomness. Once the first broken wire appears in the wear area, it is easy to trigger the rapid fracture of other steel wires. Therefore, in the process of the safety inspection and maintenance of the transmission wire rope, more attention should be paid to the degradation of mechanical characteristics in the wear area, especially the surface wear caused by rope–sheave contact.
The friction and wear of steel wire ropes used in coal mine transportation and their hazards constitute a complex and multi-dimensional systemic issue. Current research is still in its infancy, and further in-depth studies are needed on the variation laws of the tribological properties of steel wire ropes under different lubrication states, harsh environments, and corrosive conditions. Additionally, the effects of different damages on the strength, service life, and multi-axial fatigue fracture failure mechanism of steel wire ropes also require more thorough exploration. In the next step, we will conduct systematic research on the above-mentioned related issues, aiming to fully understand the friction and wear characteristics and failure mechanisms of steel wire ropes to ensure their safe and reliable operation.

 ,
, 


