Article

Generation and Reproduction of Random Rough Surfaces

by
Arthur Francisco
1,* and
Noël Brunetière
2
1
Institut Pprime, CNRS, Université de Poitiers, ISAE-ENSMA, 16021 Angoulême, France
2
Institut Pprime, CNRS, Université de Poitiers, ISAE-ENSMA, 86962 Futuroscope Chasseneuil, France
*
Author to whom correspondence should be addressed.
Lubricants 2025, 13(11), 506; https://doi.org/10.3390/lubricants13110506
Submission received: 18 September 2025 / Revised: 10 November 2025 / Accepted: 12 November 2025 / Published: 19 November 2025
(This article belongs to the Special Issue Intelligent Algorithms for Triboinformatics)

Abstract

In both mixed lubrication and dry contact studies, statistically meaningful conclusions often require a large set of numerical rough surfaces. While such surfaces can be acquired through metrological tools such as interferometers, they rarely exhibit the exact height or spatial parameters of interest, and the available datasets are typically limited. Although the numerical generation of rough surfaces is not a new subject, its relevance has grown, and important challenges remain. Building on our earlier work, in which a new generation method was introduced, the authors extend its scope to produce surfaces with prescribed height and spatial parameters, under non-periodicity constraints and arbitrary orientation anisotropy. In addition, we propose the reproduction of existing rough surfaces for future AI training applications and highlight topographic patterning as the next major challenge to address.

1. Introduction

Whatever the real surface under study, as long as it is examined at a sufficiently small scale, irregularities will appear. This provides an intuitive approach to roughness: microscopic deviations from a macroscopic mean line. Accordingly, to characterize the roughness level of a surface, several parameters have been defined, addressing the height distribution, the spatial arrangement of heights, the material ratio curve, and so forth. The reader may refer to Leach [1] for a comprehensive overview of rough surface characterization, particularly the ISO 25178 [2] parameters, some of which are used in the present study. The most obvious source of surface generation is the mechanical industry. Depending on the requirements, the desired surface finish may involve more or fewer numerous and complex processes. These processes consist of successive material removals, followed by finishing operations. It is easy to understand that the final surface results from the cumulative effect of material removal, large at the beginning and small at the end of the process. The final surface, in the mathematical sense, is therefore a collection of heights, as a superposition of wavelengths of decreasing length.
The layered topography of common industrial surfaces can be numerically approximated by a simple mathematical tool, in order to recreate such surfaces. In this operation, fidelity to the mean line is crucial, since the long wavelengths that compose it contribute the most to the load-carrying capacity of nearly conformal lubricated surfaces. The shortest wavelengths, i.e., roughness, are less involved in load support. However, when lubricated surfaces in relative motion approach each other, the occurrence of asperity contact on both sides of the film increases. As long as the event remains globally rare, the debris and thermal energy produced are “absorbed”: this is the situation of mixed lubrication. When surfaces approach further, occurrences multiply until degradation occurs, sometimes rendering the mechanism inoperative. It is therefore clear that the finishing quality of surfaces depends on their intended use, since systematically pushing it to a higher level would represent a prohibitive cost. It becomes evident that being able to generate a numerical surface with controlled topography represents a major challenge for accurate simulations.
To characterize a rough surface, we generally need two sets of information: one to describe the statistical profile of the heights themselves and another to describe their spatial layout. The four statistical moments handle the profile—the mean μ , the squared standard deviation σ 2 , the skewness coefficient S s k , and the kurtosis coefficient S k u —while the autocorrelation function— a c f —defines the layout.
In mixed lubrication, the parameters S s k and S k u have a clear influence on the load capacity and maximum pressure [3]. It is even advisable to increase S k u in order to reduce friction [4], provided that the values of the roughness parameter S s q , the height standard deviation σ , and the skewness coefficient S s k remain small. Sedlacek et al. [4] concluded that surfaces should be machined with these parameters in mind.
More recently, Ba et al. [5] confirmed the importance of these parameters as well as the influence of the manufacturing process, through the shape of textures imprinted on the surface. This conclusion—ultimately long integrated—led He et al. [6] to propose a type of topography for frictional surfaces. Finally, Pawlus et al. [7] suggested extending the range of parameters influencing lubrication to the category of spatial parameters. However, this is not really new, since more than forty years have passed since the first proposals in this direction.
Since the mean μ and the standard deviation σ of the heights are additive and multiplicative coefficients, respectively, the tribological behavior of a surface would thus be governed by four parameters: S s k , S k u , l ξ , and l η —respectively, skewness, kurtosis, and larger and smaller correlation lengths. The reality, however, is somewhat different, which is common sense: how could there exist a bijection between the space of heights and a four-dimensional space? Technically, the relation is surjective but not injective: for identical parameters, several possible surfaces exist. Even if one could establish a perfect correspondence between a surface and a reduced set of parameters, the processes themselves have intrinsic variability that affects both the distribution of heights and their spatial arrangement. Yang et al. [8] examined the relevance of rough surface parameters as defined in ISO 25178. Based on the correlation level among parameters from a dataset of one thousand surfaces, they identified a set of 13 independent parameters: S a , S s k , S k u , S p , S v , and V v v , from Abbott curve-related parameters, and S t r , S p k , S m r 1 , S x p , S p d , S p c , and S d q , from spatial height arrangement parameters. Among the latter, only S t r is controlled by convolution, and interestingly, S a l appears to be linked to S t r although these two parameters are theoretically independent. In any case, the authors address a crucial issue, namely determining the minimal set of parameters capable of fully characterizing a rough surface. In their study, Chen et al. [9] enhance a random switching system by introducing constraints for spatial features in the height set, enabling the precise control of ISO 25178 roughness parameters ( S p d , S p c , S d q , S d r ) while preserving surface topography characteristics. This approach also compensates for one of the drawbacks of convolution-based methods, namely the absence of control over spatial parameters other than the correlation lengths. Chen et al. [10] provide a comprehensive overview of the context of rough surface generation. Building on the method of Francisco and Brunetière [11], with several improvements, they show that the statistical parameters of the generated surfaces adequately cover the requirements of industrial surfaces. They also emphasize—importantly—that convolution-based methods cannot directly reproduce special structures, such as those observed on worn surfaces, which has also been confirmed by Borodich et al. [12]. Both aspects will be addressed in the present work.
Another source of rough surfaces is biological in origin: dental surfaces. Indeed, nature often creates surface patterns to meet functional needs such as hydrophobicity, adhesion, abrasion, and so forth. In the present case, the patterns are related to the way the tooth has grown, and more specifically to the enamel. Finally, the different types of abrasion—attrition, scratches, chipping, chemical attacks, etc.—further add to the complexity of the surface. The study of dental microwear allows solid hypotheses to be made about the diet of the species concerned—at least its last meals. Many paleontologists use dental microwear patterns to classify herbivorous species into categories: grazers, browsers, frugivores, or mixed feeders. Dental surfaces exhibit such variability in terms of roughness that classifications are often difficult and only weakly reproducible from one group of individuals to another, see Francisco et al. [13] for details. Since the acquisition of dental surfaces is a rather time-consuming process, and machine learning—particularly convolutional methods—requires large volumes of data, the ability to generate realistic dental surfaces for each dietary group would make it possible to build an accurate classification tool.
The generation of numerical surfaces poses a significant challenge, driven by its importance in two distinct fields: the development of predictive models for lubrication and the creation of comprehensive dental datasets for training machine learning algorithms. We will, therefore, first focus on making our method for generating rough digital surfaces more robust and more general. In a second step, we will experiment with ways in which the algorithm can reproduce existing surfaces in terms of both height and spatial parameters.

2. Materials and Methods

2.1. Modified Hu and Tonder Method

There are several methods for generating rough surfaces, as discussed by Pawlus et al. [14] and Wang et al. [15], and we have chosen the one proposed by Hu and Tonder [16] as the working basis, which can be summarized in five steps, with steps 3 and 5 being modified.

2.1.1. Step 1: Choice of Parameters

Let us denote by z i a height, the realization of a random variable z, and n as the sample size. The four statistical moments μ , v a = σ 2 , S s k , and S k u are considered representative of a height unimodal distribution. Since S s k and S k u are obtained after centering and normalizing the distribution, we can choose μ = 0 and v a = 1 ; recall that
μ = 1 n i = 1 n z i ; v a = σ 2 = 1 n i = 1 n ( z i μ ) 2 ; S s k = 1 n i = 1 n z i μ σ 3 ; S k u = 1 n i = 1 n z i μ σ 4 .
The reader will not be surprised by the use of biased statistical estimators, since for a numerical surface, we typically have n > 512 × 512 , thus making the bias entirely negligible.

2.1.2. Step 2: Determination of the Digital Filter H

Analytical Surface Generation
Before addressing the numerical surface generation, let us start with the analytical form of a surface z ( x , y ) , obtained by filtering h ( x , y ) of a white noise η ( x , y ) :
z ( x , y ) = h ( x , y ) η ( x , y ) , where denotes the convolution operator .
The autocorrelation function a c f ( z ) can be written, omitting spatial variables:
a c f ( z ) = z z = ( h η ) ( h η ) = ( h η ) ( η h ) , by commutativity of convolution ,
where, with z being real, a c f ( z ) is real and even.
Let F ( f ) ( ω x , ω y ) denote the Fourier transform of a function f ( x , y ) , and define
  • Z ( ω x , ω y ) = F ( z ) ;
  • A ( ω x , ω y ) = F ( η ) ;
  • H ( ω x , ω y ) = F ( h ) ;
  • P S D ( η ) = | A | 2 ;
  • P S D ( z ) = | Z | 2 .
Using Fourier transform properties regarding convolution and correlation products, we obtain
P S D ( z ) = Z Z ¯ = H × P S D ( η ) × H ¯ where . ¯ denotes complex conjugation .
Since η is chosen as white noise, P S D ( η ) is a constant c. An intuitive way to see this is through the Wiener–Khinchin theorem, which states that P S D ( z ) = F ( a c f ( z ) ) . η autocorrelation is a Dirac peak centered at ( 0 , 0 ) , implying the presence of all frequencies with equal contributions in its Fourier series expansion.
Consequently, there exists a simple relation between the Fourier transform of the autocorrelation of z and the squared modulus of the digital filter H: F ( a c f ( z ) ) = c | H | 2 . This relation is fundamental, since the knowledge of a c f ( z ) directly yields | H | 2 , because the constant c is absorbed into the variance of z, which will be standardized anyway.
Thus,
F ( a c f ( z ) ) = | H | 2 H = F ( a c f ( z ) ) e i ϕ ( ω x , ω y ) .
We may choose a nonzero phase function ϕ . However, a linear function is of little practical interest, while a nonlinear function makes the convergence of the process described later, in Step 5, more difficult. Moreover, we do not fully control the effect of a nonlinear function in creating patterns through distortion. For all these reasons, ϕ is set to zero. Since P S D ( z ) is real and even, H is real and even as well, which garantees that h is real and even—symmetric about to the origin.
h ( x , y ) = F 1 F ( a c f ( z ) )
Numerical Surface Generation
Transposing the above derivation to the numerical case requires some adjustments, particularly concerning the quality of the random signal, which is not strictly white noise. More precisely, since solving the system Z 2 = H A 2 H ¯ is not computationally feasible, we retain the expression of H but correct A:
H = F ( a c f ( z ) ) and A A | A | .

2.1.3. Step 3: Determination of Initial Statistical Parameters

After filtering the initial random signal η , the statistical moments are modified as follows:
v a z = σ z 2 i = 1 n h i 2 , S s k z i = 1 n h i 3 i = 1 n h i 2 3 2 S s k η , S k u z 3 i = 1 n h i 4 i = 1 n h i 2 2 ( S k u η 3 ) .
The formulas in Equation (4) are approximations that assume all multiple and weighted correlations of η to be strictly zero. In practice, for large correlation lengths and a non-Gaussian surface, this assumption may even lead to a violation of Pearson’s inequality. As an illustrative example, we consider the generation of a surface whose parameters are listed in Table 1.
Table 2 shows the results obtained using the relations of system (4). Pearson’s inequality is clearly incompatible with the values of S s k η and S k u η , and to proceed with the process, S s k η and S k u η must be corrected according to S k u η = S s k η 2 + 1 .
The expressions, Equation (4), as used in the literature, notably by Bakolas [17], do not exploit the fact that μ h can be set to 0:
z = h η = ( h ˜ + μ h ) η = h ˜ η ,
because μ η = 0 . As proved in Appendix A.2, Appendix A.3 and Appendix A.4, we have the following approximations:
σ z 2 n σ h 2 , S s k z 1 n S s k h S s k η , S k u z 3 1 n S k u h ( S k u η 3 ) ,
instead of the classical ones, Equation (4).
These relations allow us to determine the statistical parameters after filtering, given the initial ones. One can deduce from these relations that a Gaussian signal is transformed into a Gaussian-filtered signal: S s k z remains zero, as does the excess kurtosis S k u z 3 . An interesting effect is the division by n or n of the moments of z: unless the initial moments are very large, the moments of z will be close to 0. In other words, convolution makes the initial signal “more Gaussian”, which suggests numerical challenges.
This convergence toward the normal distribution was predictable since, by virtue of the Central Limit Theorem (CLT), a sum of random variables tends toward a normal distribution. Since z k = i h i η i + k , the CLT applies. One can even conjecture that, starting from a given signal η , repeated convolutions will yield a distribution arbitrarily close to the normal law.
Finally, the reader, perhaps a future user, must be warned that these are approximations: any nonzero autocorrelation of η , however small, will move these relations away from exact equality.

2.1.4. Step 4: Transformation of the Initial Random Surface

Since the target parameters are S s k and S k u , the distribution η must be transformed so that it exhibits the desired statistical properties. The conventional approach is to use Johnson’s system of transformations [18], originally designed to normalize a distribution. Since the transformations are strictly monotonic, they can be inverted.
As shown by Francisco and Brunetière [11], it is sometimes difficult, or even impossible, to reach certain values of S s k and S k u using Johnson’s system of transformations following Hill’s algorithm. The improvement proposed by the authors consists in using analytical functions—the tangent and exponential functions—to generate a series η with the correct statistical moments.

2.1.5. Step 5: Computation of z by Filtering

Once the initial distribution η has been determined, it is filtered by h, as follows:
Z = H A hence z = F 1 ( H A ) .
When applying the filter h to the resulting random series η , by construction of h, the obtained autocorrelation function is strictly identical to the target one. The issue is that we did not start from a perfectly white noise but only from an approximation of it. Consequently, the filtering process—which is a form of smoothing—does not yield the correct S s k and S k u values for the series z.
The idea, presented Francisco and Brunetière, is then to identify the permutation O z that transforms the obtained series z into a sorted series: the heights may not be exactly correct, but their arrangement is. It then suffices to substitute these approximate heights z with a series z of correct heights by applying the inverse permutation O z 1 .
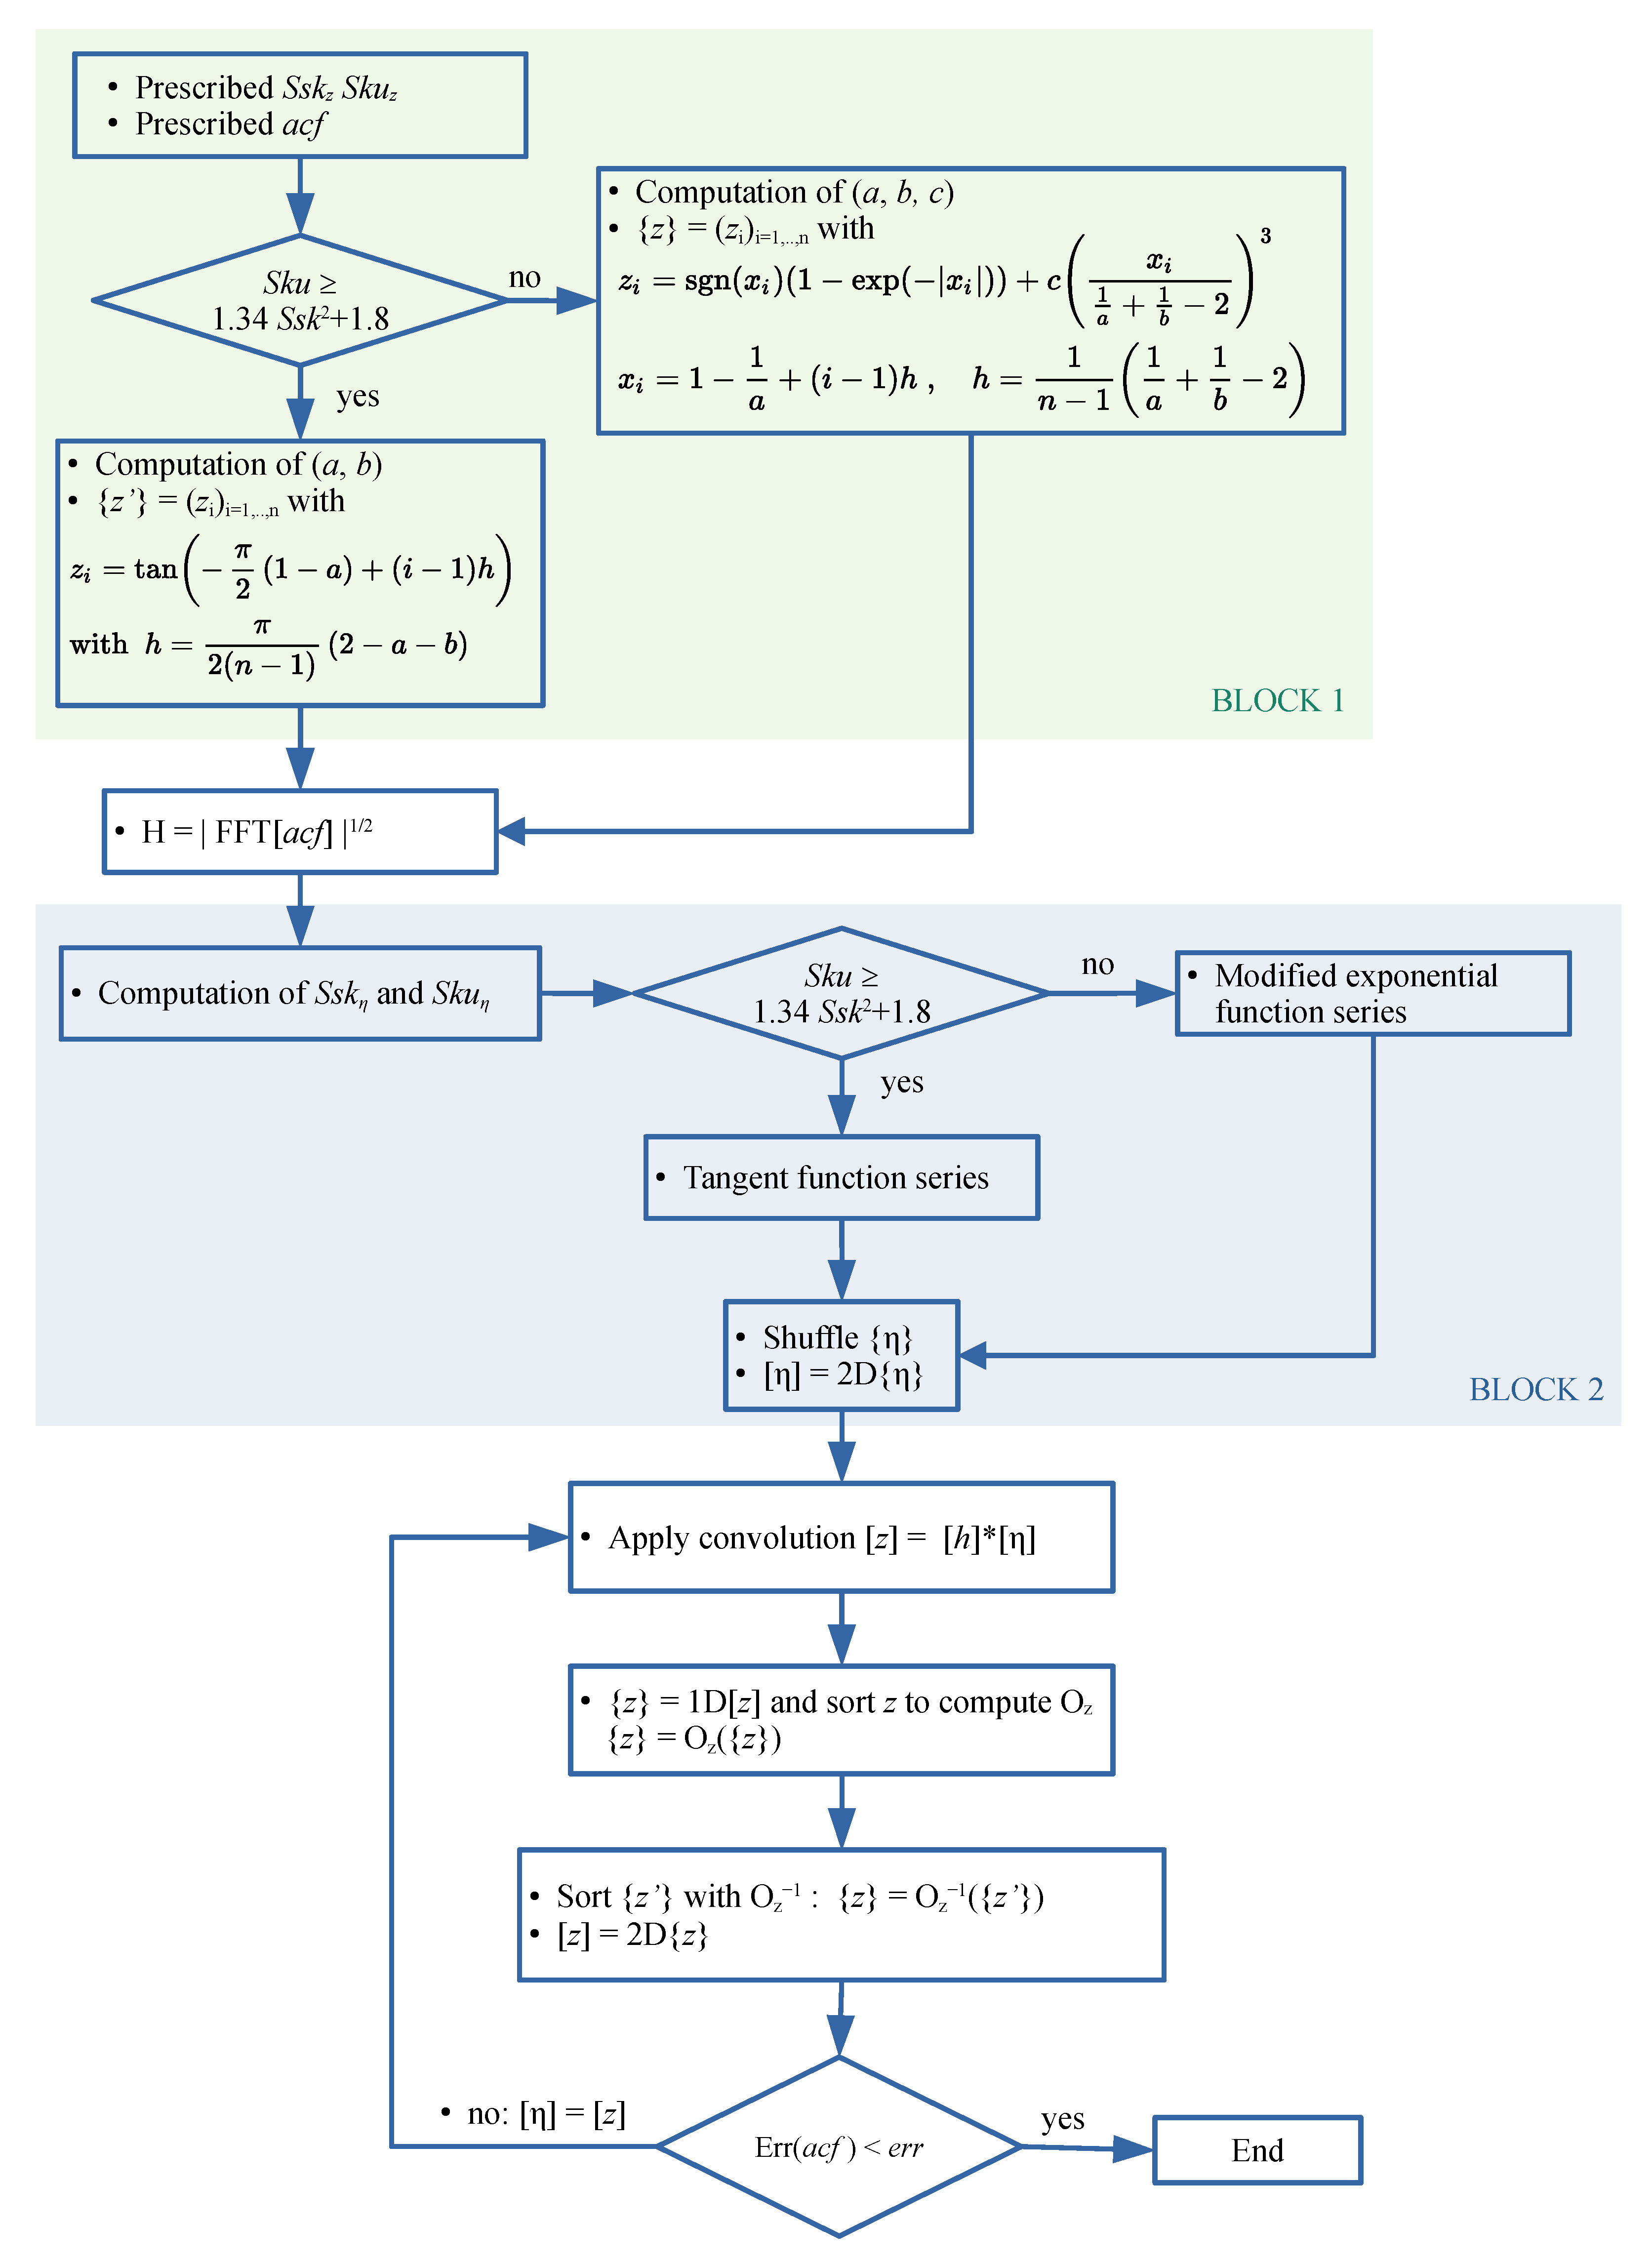
As a result, the autocorrelation function is somewhat modified, but the heights themselves are exact. For a non-Gaussian resulting series z, the larger the correlation lengths, the stronger the required smoothing, and the farther the initial series will deviate from normality. It is therefore sufficient to embed these actions within an iterative scheme: after replacing z with z , the filter is reapplied, and so on. When the initial series η has been properly generated, z is close enough to z , and after only a few iterations the resulting autocorrelation function matches the expected one; Figure 1 illustrates the general structure of the algorithm.
By following the modified algorithm proposed by Hu and Tonder, it is possible to generate a rough surface from virtually any set of height or spatial parameters. However, some realizations exhibit a lack of realism, as will be discussed in the Results section, where corrective strategies will also be introduced. Moreover, the use of an antisymmetric exponential function imposes an additional constraint, which can in fact be removed in order to simplify the algorithm, as we shall see immediately.

2.2. No Magic Universal Function

Francisco and Brunetière [11], have shown that two analytical expressions are sufficient to generate all pairs ( S s k , S k u ) , provided they do not fall below Pearson’s limit. The functions used to generate n points are the tangent function in Equation (8) and an antisymmetric exponential function, Equation (9).
y i = tan π 2 ( 1 a ) + ( i 1 ) h , with h = π 2 ( n 1 ) ( 2 a b )
y i = sgn ( x i ) ( 1 exp ( | x i | ) ) , with x i = 1 1 a + ( i 1 ) h , and h = 1 n 1 1 a + 1 b 2 ,
with i [ 1 , n ] and a , b ( 0 , 1 ] .
The dimensionless parameters a and b are determined using a genetic algorithm, as will be discussed later, so that { y i } i = 1 , n exhibits the desired statistical moments, namely skewness ( S s k ) and kurtosis ( S k u ). The function in Equation (8) is used in the case S k u 1.34 S s k 2 + 1 , and the function in Equation (9) in the case S k u < 1.1 S s k 2 + 1 . The authors have shown that these two functions must be combined within the limits 1.1 S s k 2 + 1 < S k u < 1.34 S s k 2 + 1 in order to obtain optimal results.
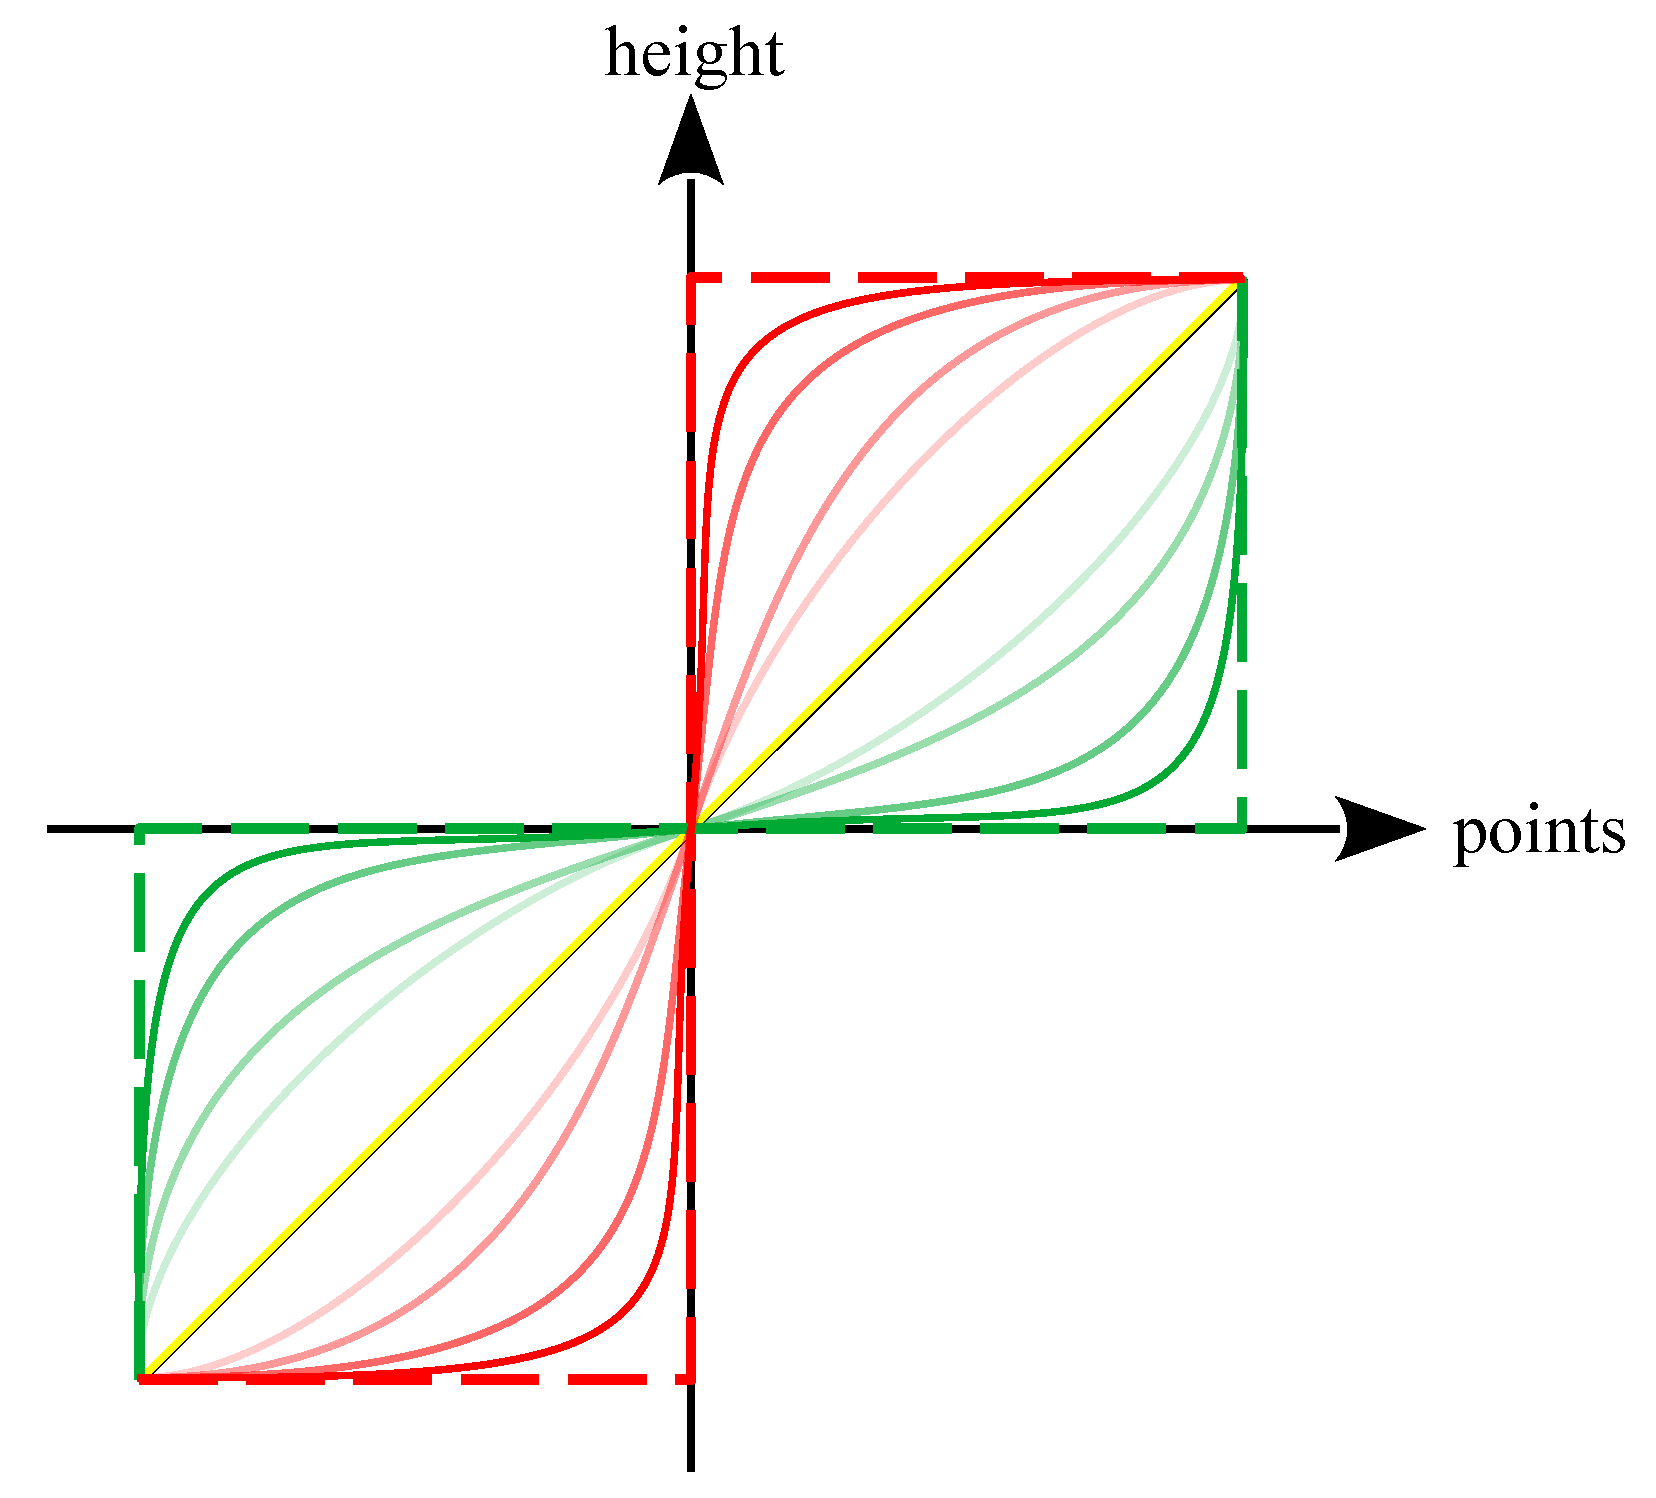
To avoid dealing with subdomains, one may ask whether a universal function exists that would allow generating a dataset of n points for any admissible ( S s k , S k u ) pair. Unfortunately, to the best of our knowledge, no such parametric function exists. Indeed, as illustrated in Figure 2, this function would need to approximate both a binary dataset—dashed red line—and extreme cases of S s k , S k u —dashed green line. It can be noted that the functions represented by solid red lines have their reciprocal functions in solid green lines. Thus, the universal function h ( x ) would be written as h ( x ) = ( 1 u ) f ( x ) + u f 1 ( x ) , with u [ 0 , 1 ] as a partition parameter, but it significantly complicates the integration of powers 2, 3, and 4 required for the statistical moments.
Thus, a more general function than the antisymetric exponential should be sought, so as to eliminate the need to handle the intermediate region.

2.3. Choice of a More Versatile Function Than exp

Francisco and Brunetière have shown that the exponential function f ( x ) = sgn ( x ) ( 1 exp ( | x | ) ) is a relevant choice for approximating Pearson’s limit; however, it becomes less suitable when moving away from it— S k u > 1.1 S s k 2 + 1 .
The idea is to complement it with a function g ( x ) that can exhibit peaks at the integration bounds, while still ensuring that the resulting function h ( x ) = f ( x ) + g ( x ) is analytically integrable up to the 4th power. The simplest function that meets this requirement is the cubic function g ( x ) = x 3 . To provide flexibility to h ( x ) , a parameter c must be added to a and b. Thus,
h ( x ) = sgn ( x ) ( 1 exp ( | x | ) ) + c x 3 ,
with x [ 1 1 a , 1 + 1 b ] and a , b ( 0 , 1 ] . The issue is that the size of the interval will have a strong influence on g ( x ) , which must be compensated by the value of c. To avoid this phenomenon, g ( x ) is restricted to the interval [ 1 , 1 ] , and, as with a and b, c ( 0 , 1 ] . We then can write
h ( x ) = sgn ( x ) ( 1 exp ( | x | ) ) + c x 1 a + 1 b 2 3 ,
and it is obvious that ( a , b ) = ( 1 , 1 ) must be prevented.
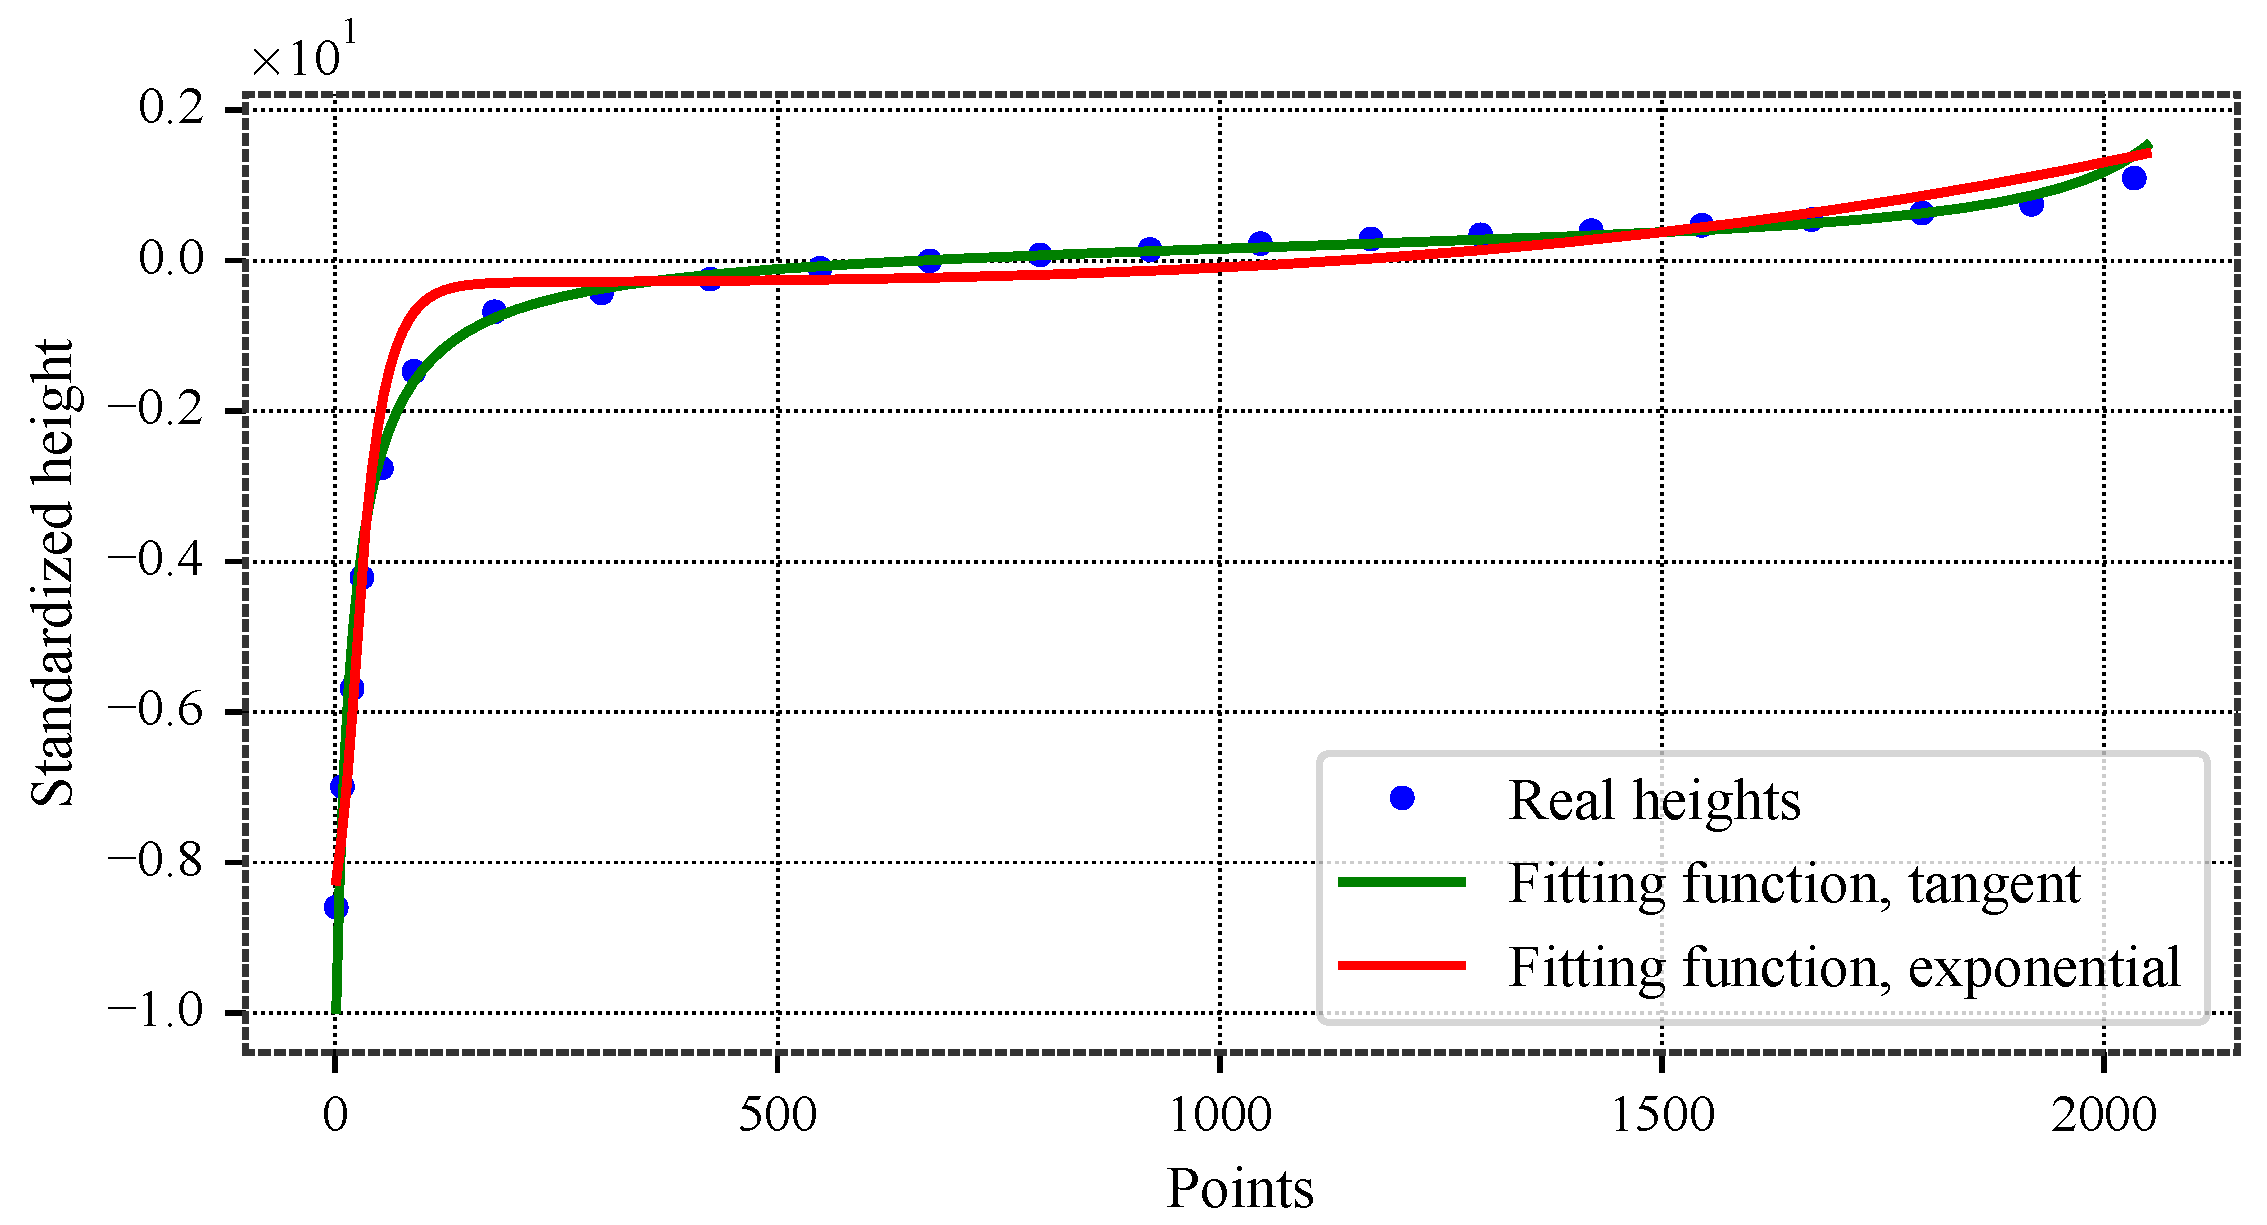
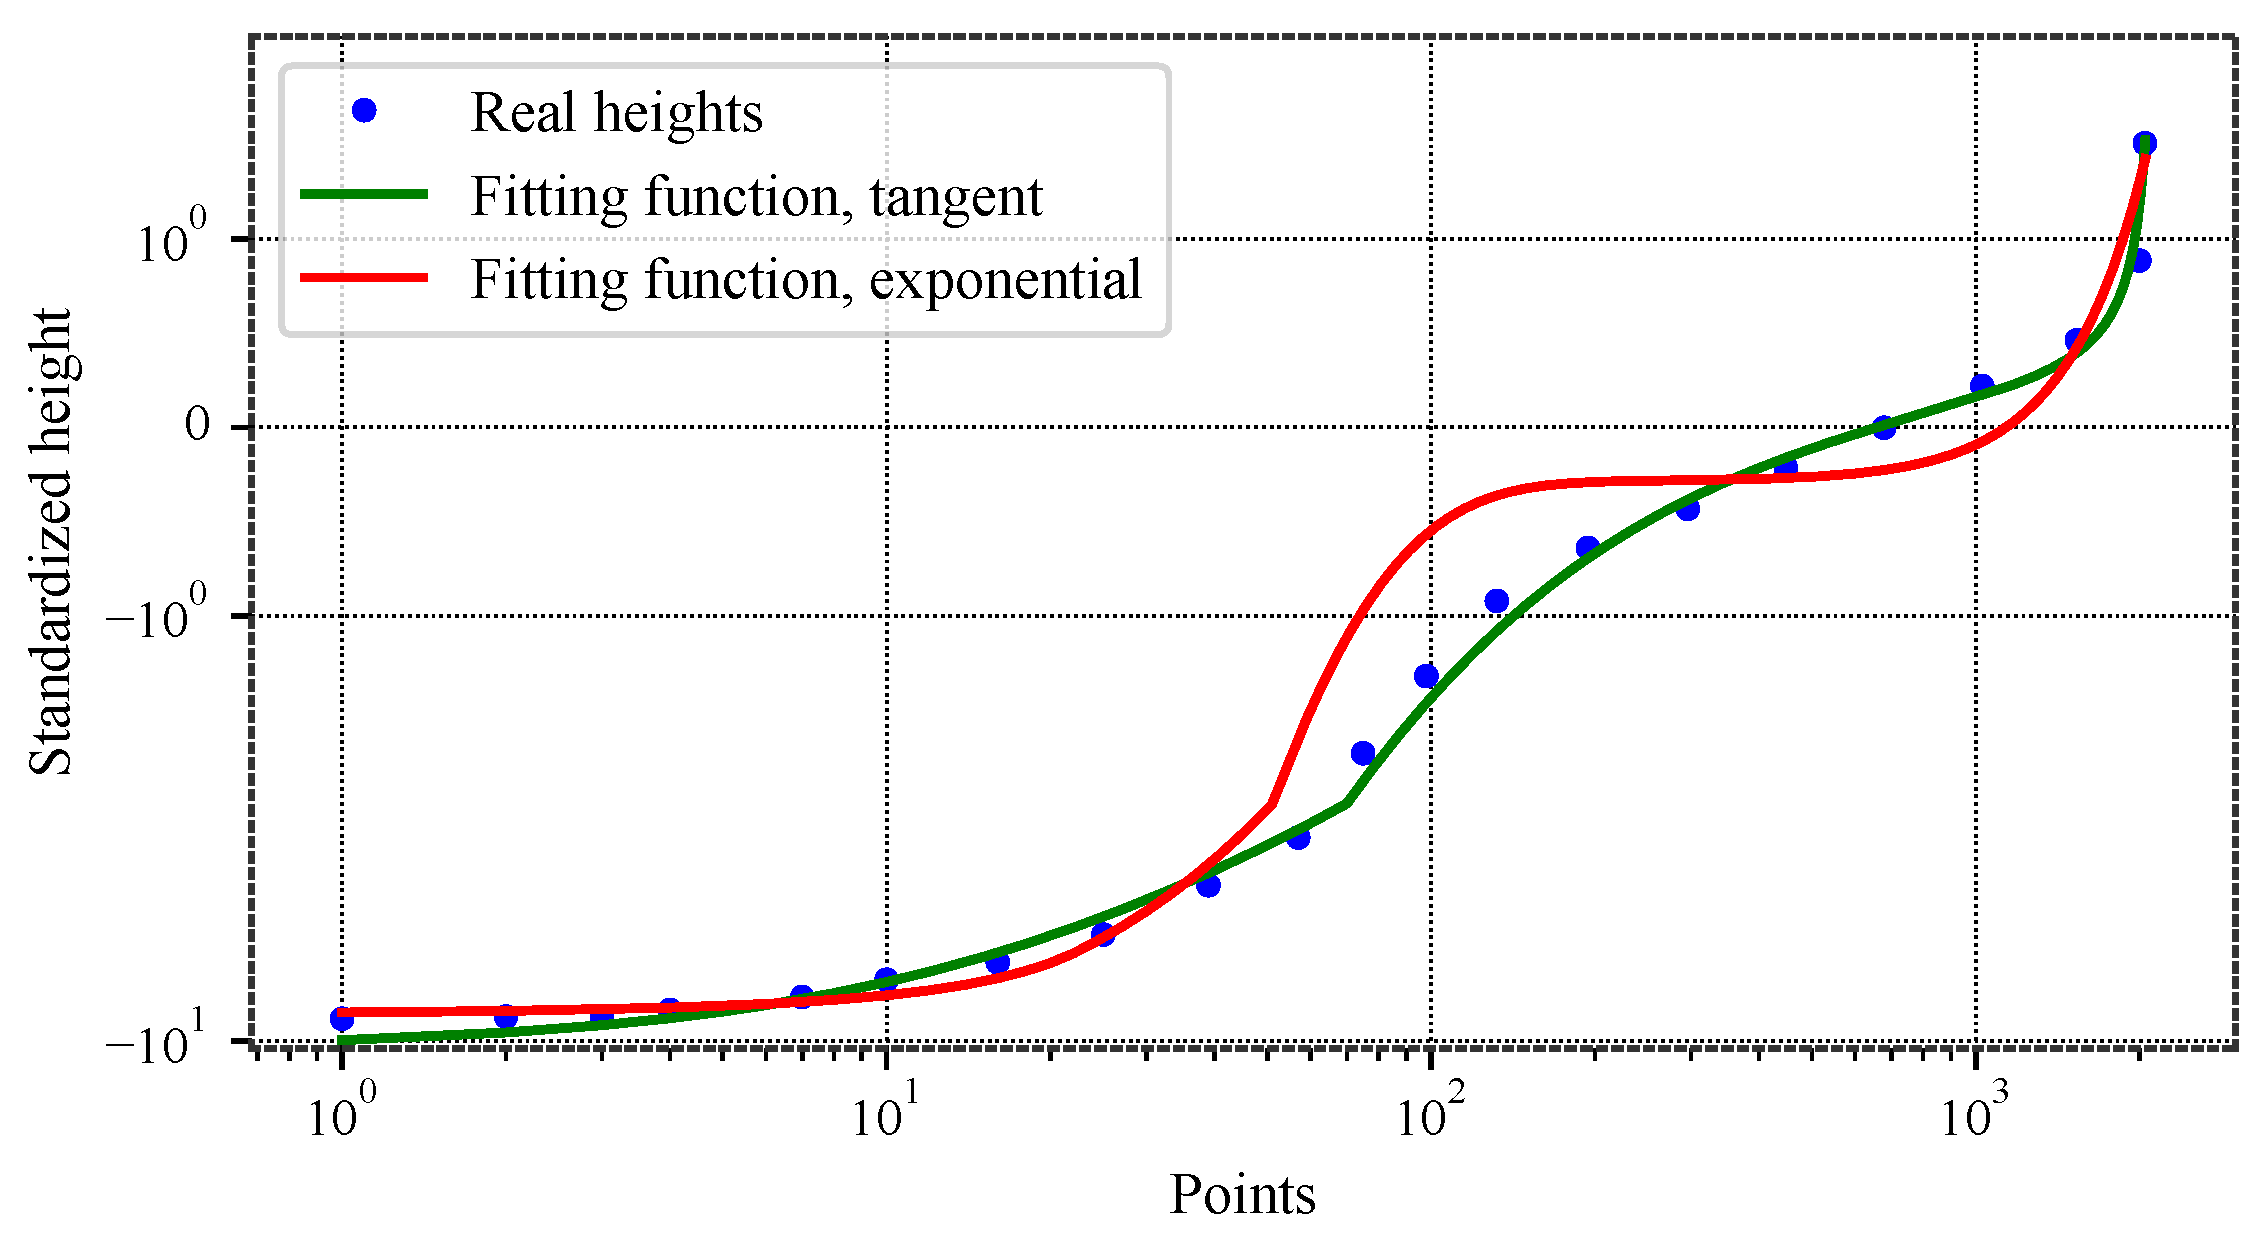
The next question is as follows: why restrict the use of the modified exponential to the domain S s k 2 + 1 S k u 1.34 S s k 2 + 1.8 ? Based on the material curve of a rotor worn surface, Figure 3 shows that the tangent function is more realistic than the modified exponential, and to confirm this, it suffices to switch to logarithmic scales, as shown in Figure 4.
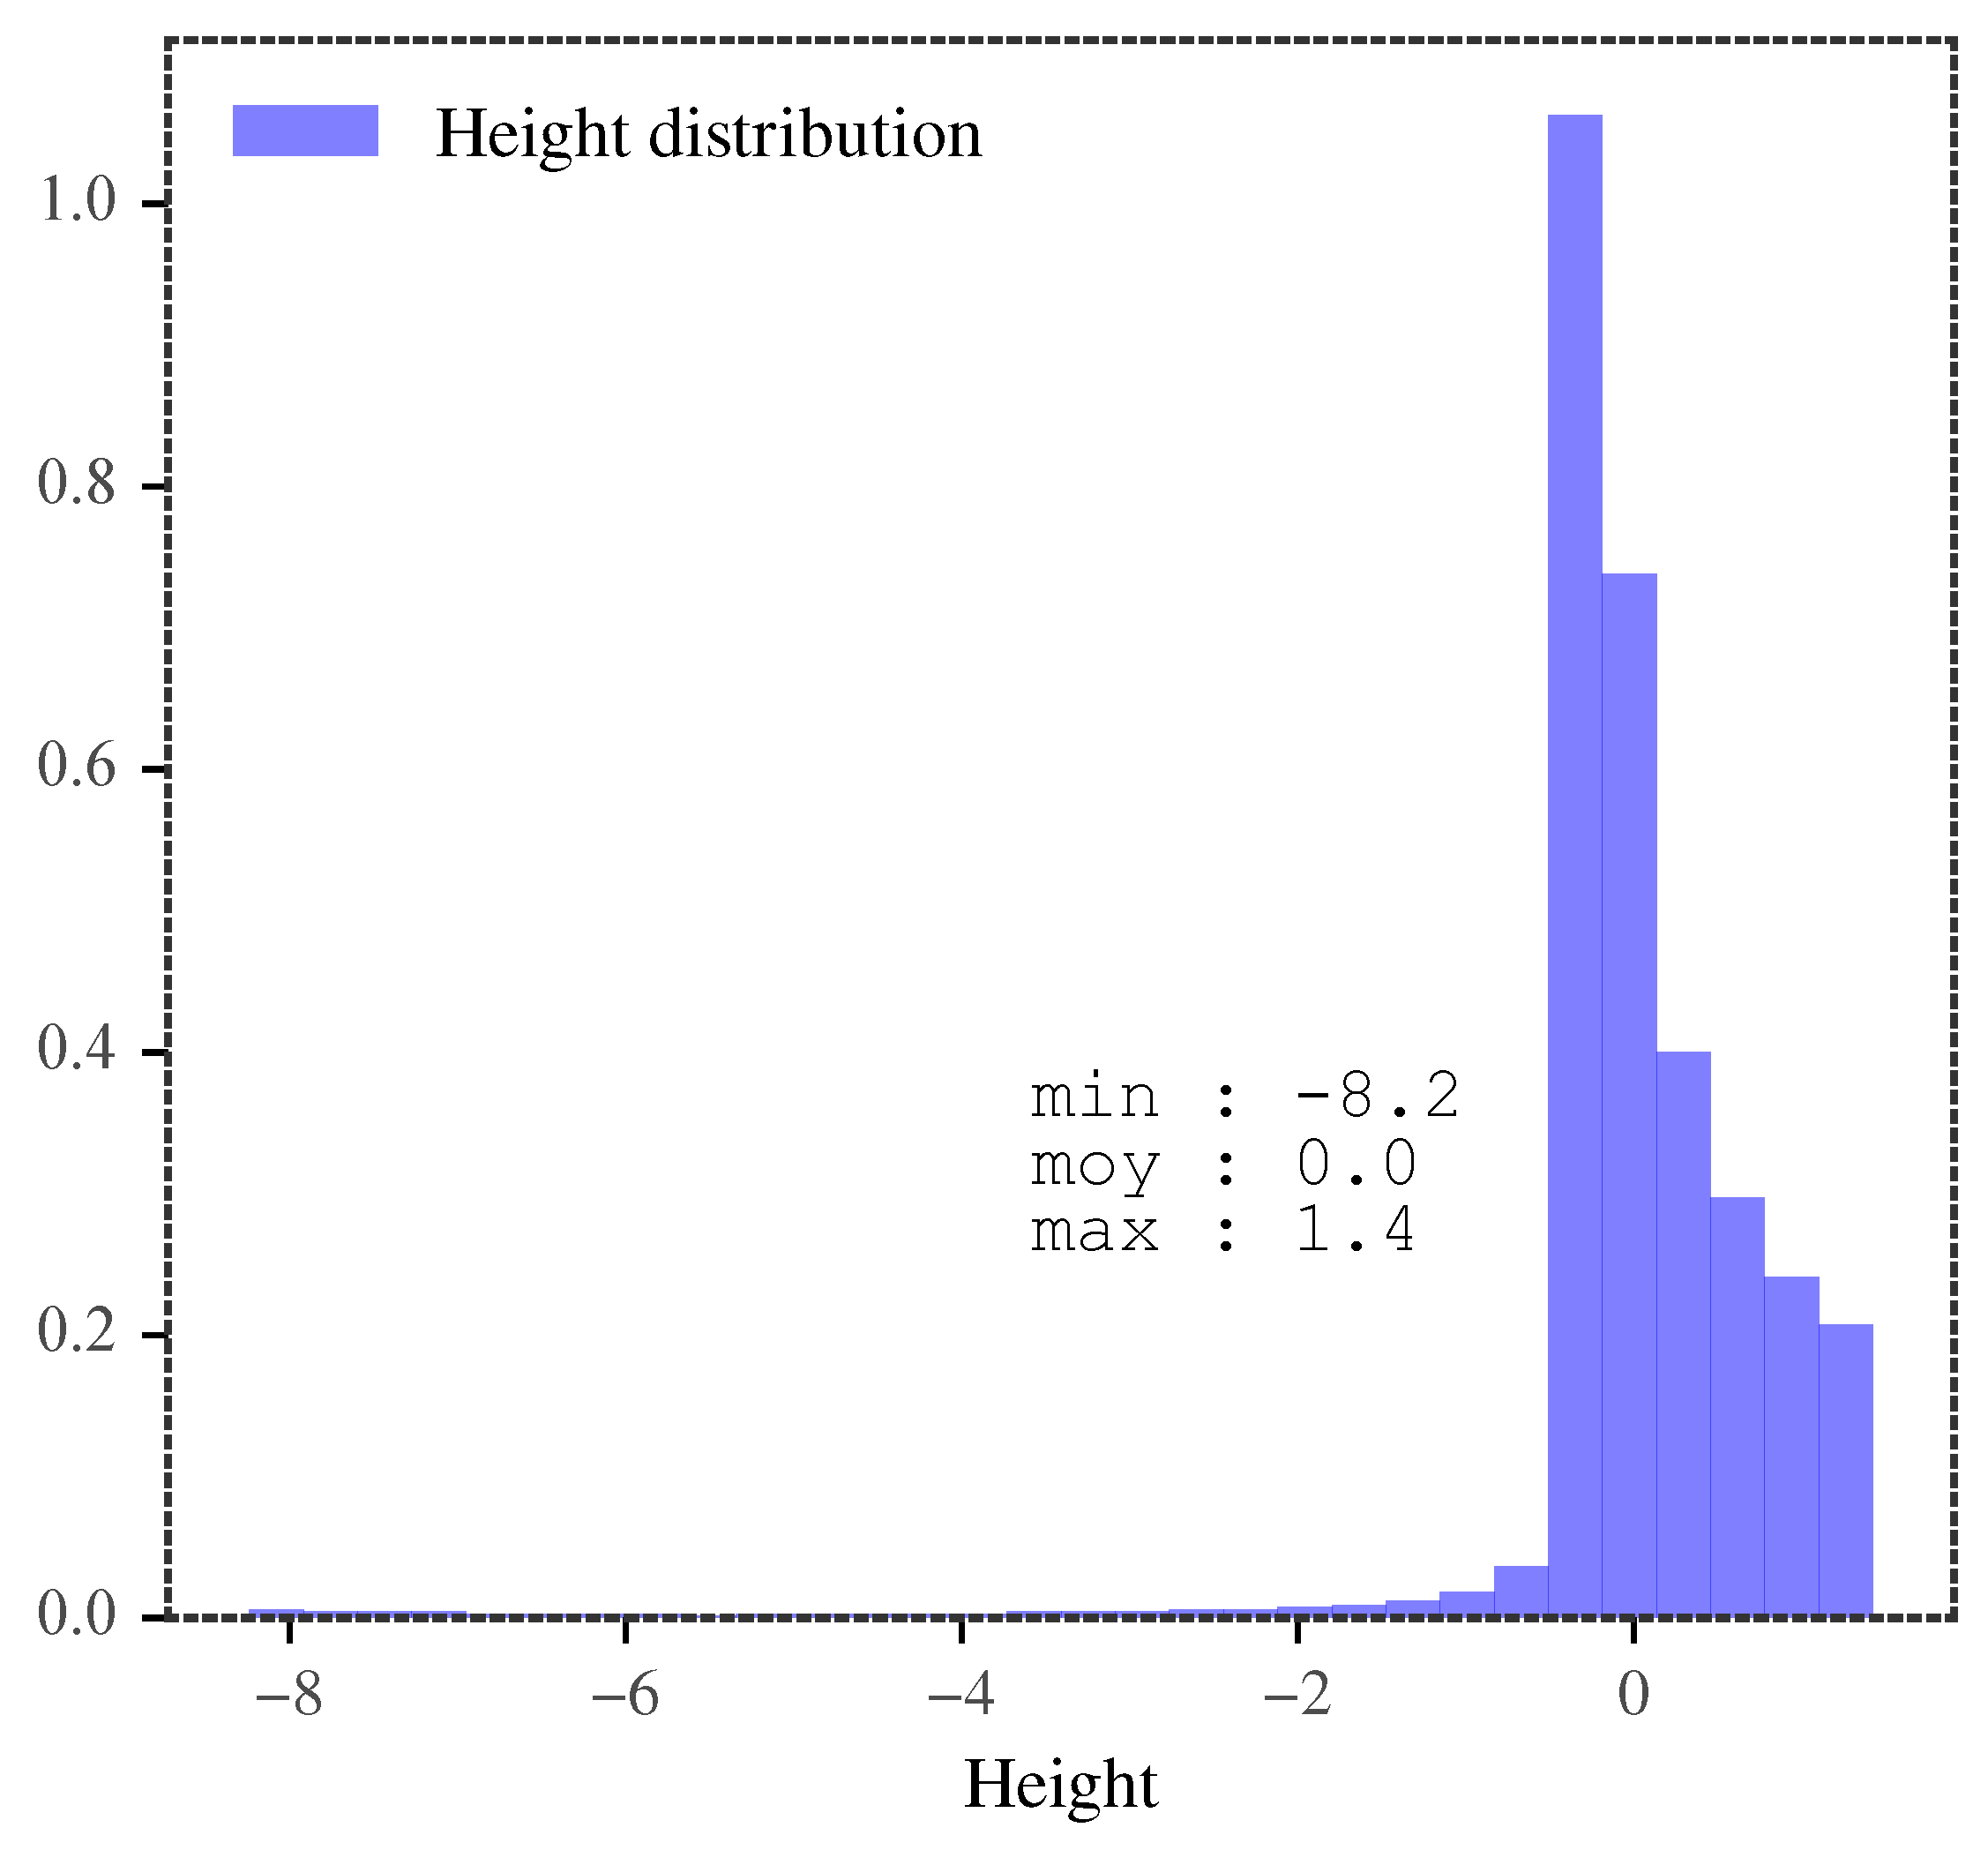
Finally, it can be easily verified that the distributions obtained with modified exponentials are unimodal when moving away from Pearson’s limit, as shown in Figure 5 for the previous case. In the previous version of the algorithm, a mixture of two distributions was used, which could introduce undesired bimodality, see Chen et al. [10].

2.4. On the Relevance of the Modified Exponential Function

To ensure that the tangent and modified exponential functions are capable of covering the entire range of S s k , S k u values, it is necessary to determine the boundaries S k u m i n , S k u m a x for S s k [ 0 , n ] .
To explain the maximum value S s k m a x = n , one must recall that S s k is a measure of the asymmetry of a distribution.
If we take n points, such that y 1 = n 1 1 and y 2 . . n = n 1 , we automatically obtain μ = 1 and σ = 1 . Consequently,
S s k = 1 n n 1 3 + ( n 1 ) n 1 3 n 3 n .
To determine the boundaries of the ( S s k , S k u ) domain, one could scan the entire set of values by varying a, b, and c. However, most of the computations would be unnecessary, since they fall within the interior of the domain. An interesting alternative is then to explore only the boundary points.

2.4.1. The Pareto Front

Suppose we have two conflicting objectives to optimize, for example the comfort of a vehicle—to be maximized—and its price—to be minimized. It is easy to imagine that when one improves one of the two objectives, the other deteriorates. One can then compile a list of pairs (comfort, price) that result from the best trade-offs.
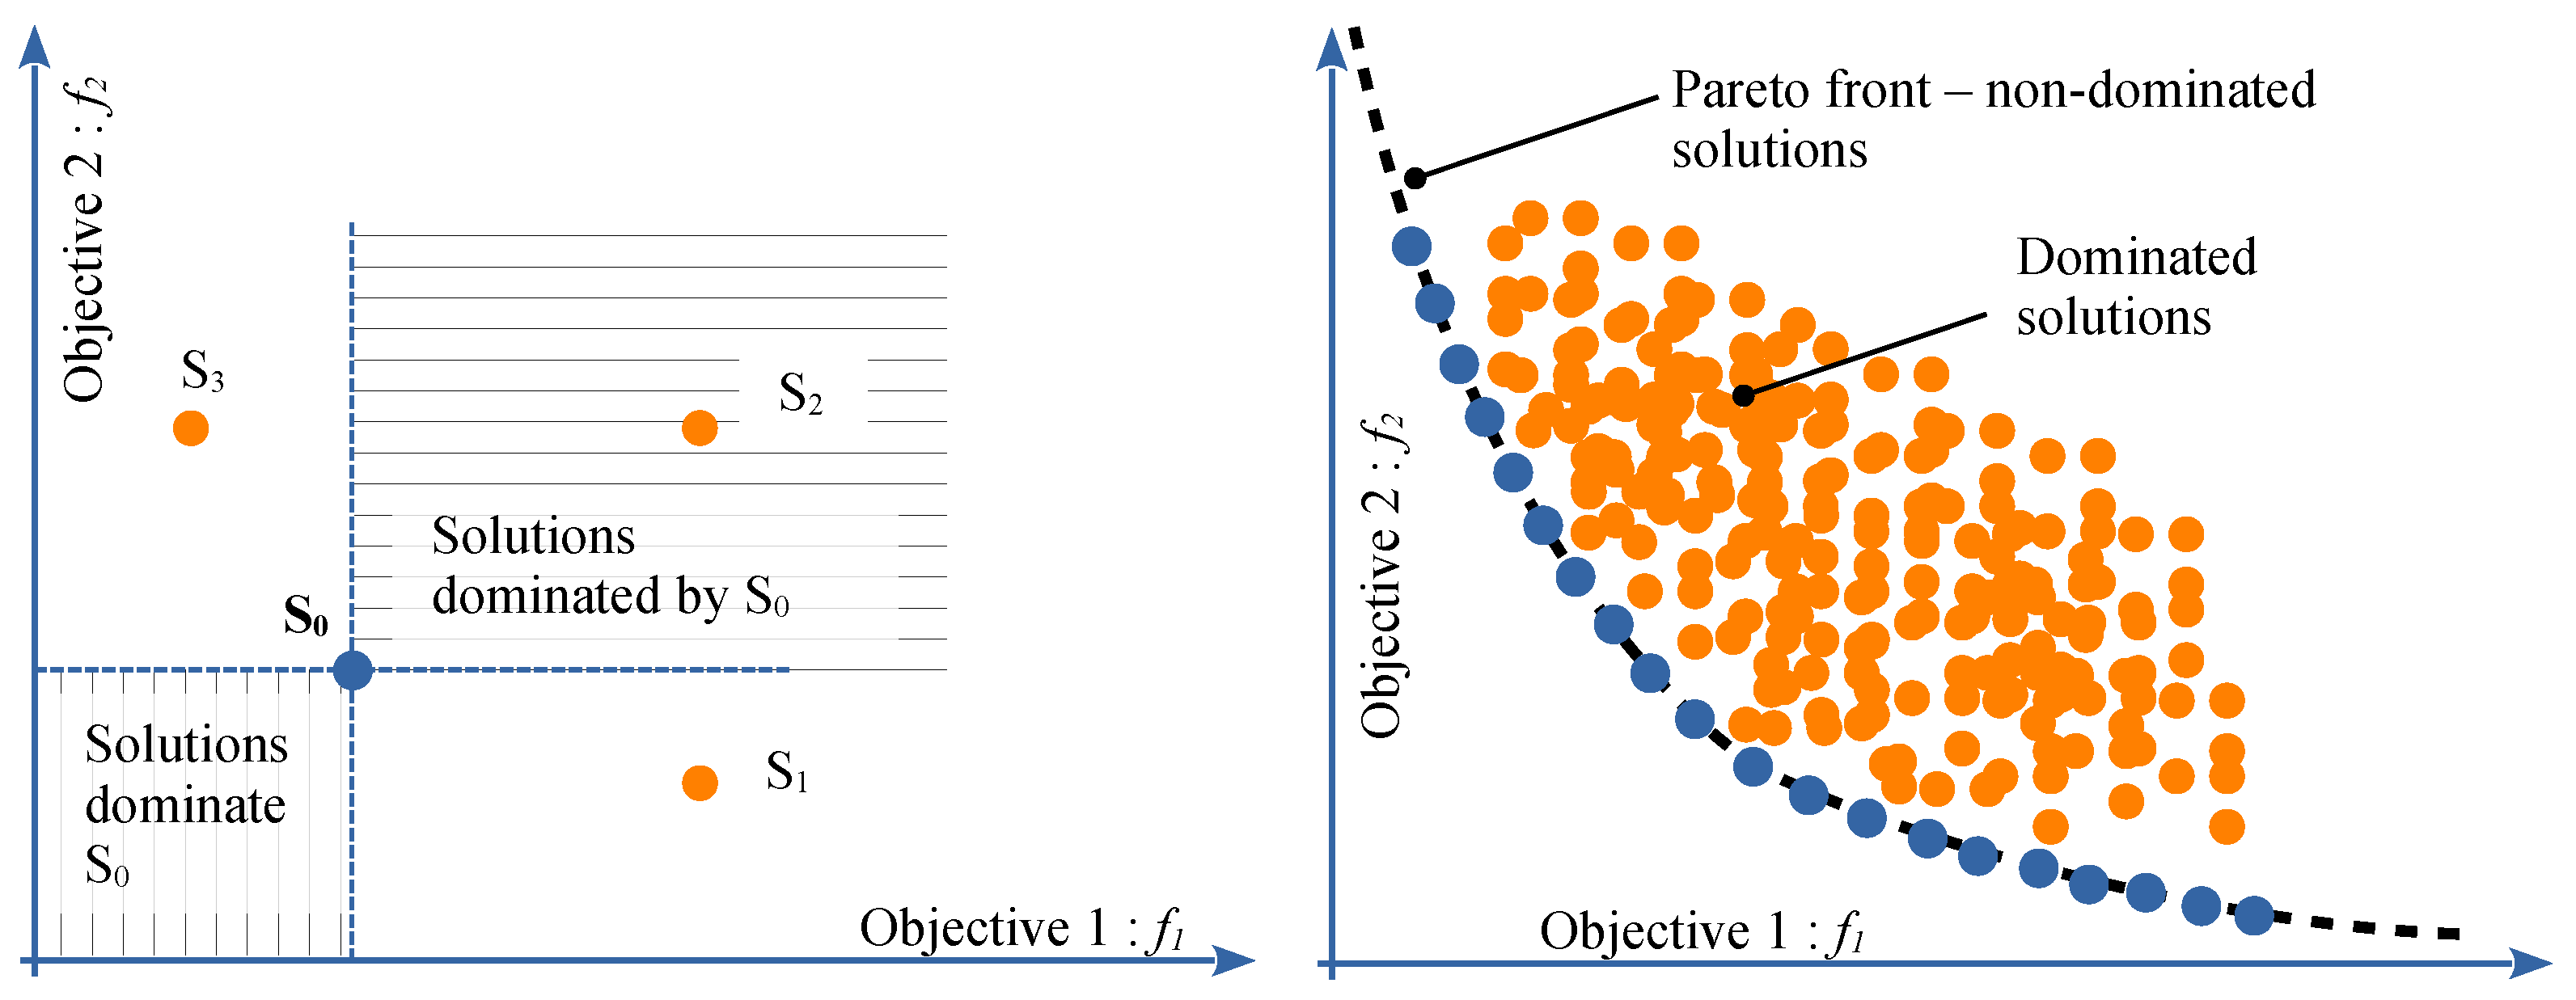
Let the two objectives be f 1 = 1 c o m f o r t and f 2 = p r i c e , both of which must be minimized. In a graph ( f 1 , f 2 ) , one obtains a convex curve, where each point is non-dominated. A point is said to be dominated when both objectives are simultaneously improved by another point, as explained in Figure 6.
How, then, can we directly determine the Pareto front?
The first intuitive approach is to fix a value of k, say k = 1 , and minimize f 0 ( x i ) = f 1 ( x i ) + k f 2 ( x i ) . Once the x i are determined, they are reused as initial values to minimize f 1 ( x i ) with k = k ± Δ k , and so on. The drawback of this method is that it does not guarantee a homogeneous distribution of solutions along the front: one may end up in a situation where particular points of the front aggregate most of the nearby solutions. We therefore need to choose a minimization algorithm that is robust against local minima and ensures a sufficient and homogeneous density of the front.
Among the major families of optimization methods are metaheuristics. These are generally iterative stochastic algorithms: the random component of the search helps to avoid pitfalls such as local optima, while successive iterations build solutions that rely heavily on the search history. A comprehensive presentation of multi-objective methods—and more generally metaheuristics—can be found in Collette and Siarry [19]. Most metaheuristics implement natural paradigms such as
  • The evolution of species (evolutionary algorithms);
  • The cooling of crystalline structures (simulated annealing);
  • Ant colonies.
Unlike gradient-descent methods, metaheuristics are essentially combinatorial approaches that do not rely, for example, on derivative computations. Nevertheless, they all suffer from a high number of calculations, cost function evaluations, and in some cases, from the need to tune a large number of parameters (as in simulated annealing).
Evolutionary algorithms are not exempt from the computational burden; however, the analytical determination of statistical moments accommodates this very well. Moreover, there are relatively few parameters to tune. In fact, one could even say that no real tuning is required, since the adjustable parameters have default values that already yield very good results.

2.4.2. General Principles of Evolutionary Algorithms

For a problem of minimizing a function f ( x i ) , the idea is as follows:
  • Starting from a set of size p of parameter sets x i —or equivalently a set of p individuals—one generates a set of p solutions f.
  • The p solutions are ranked in ascending order, and the best individuals are set aside.
  • The x i thus identified are recombined with others, forming a new set.
  • Randomly, some of the x i are perturbed.
After iterating this process many times, the x i obtained are those for which f is minimal. One may then ask: how are the x i “recombined”, and how are they “perturbed”? Inspired by genetic coding, one works with the binary representation of the parameters. Thus, if an x i is encoded on 32 bits, and the parameter set consists of p such x i , then the chromosome of f ( x i ) will consist of 32 genes, i.e., 32 p bits. To combine two chromosomes, one simply takes a portion of one and completes it with the other.

2.4.3. The NSGA-II Algorithm

It would add little value here to provide a complete inventory of the various multi-objective evolutionary techniques. To convince the reader of the abundance of options, one may refer to the non-exhaustive list compiled by Coello et al. [20]. In this list, the NSGA-II technique of Deb et al. [21] is highlighted; this is the one we adopt. This choice is based on two pragmatic considerations. The first is its reputation for efficiency, as the Pareto front is determined “quickly“ and is uniformly populated. The second is the Python code made freely available in the Pymoo library [22]. Although the program for computing statistical moments is written in Fortran, Pymoo can use it via the free library Fmodpy [23]. Finally, the computation can be easily parallelized using the free multiprocessing library [24].

2.4.4. Analytical Expressions of the Lower Boundaries

The NSGA-II algorithm was used to determine the following boundaries:
  • f e , m i n ( S s k ) = min ( S k u ) , modified exponential basis, lower bound
  • f t , m i n ( S s k ) = min ( S k u ) , tangent basis, lower bound
  • f e , m a x ( S s k ) = max ( S k u ) , modified exponential basis, upper bound
  • f t , m a x ( S s k ) = max ( S k u ) , tangent basis, upper bound
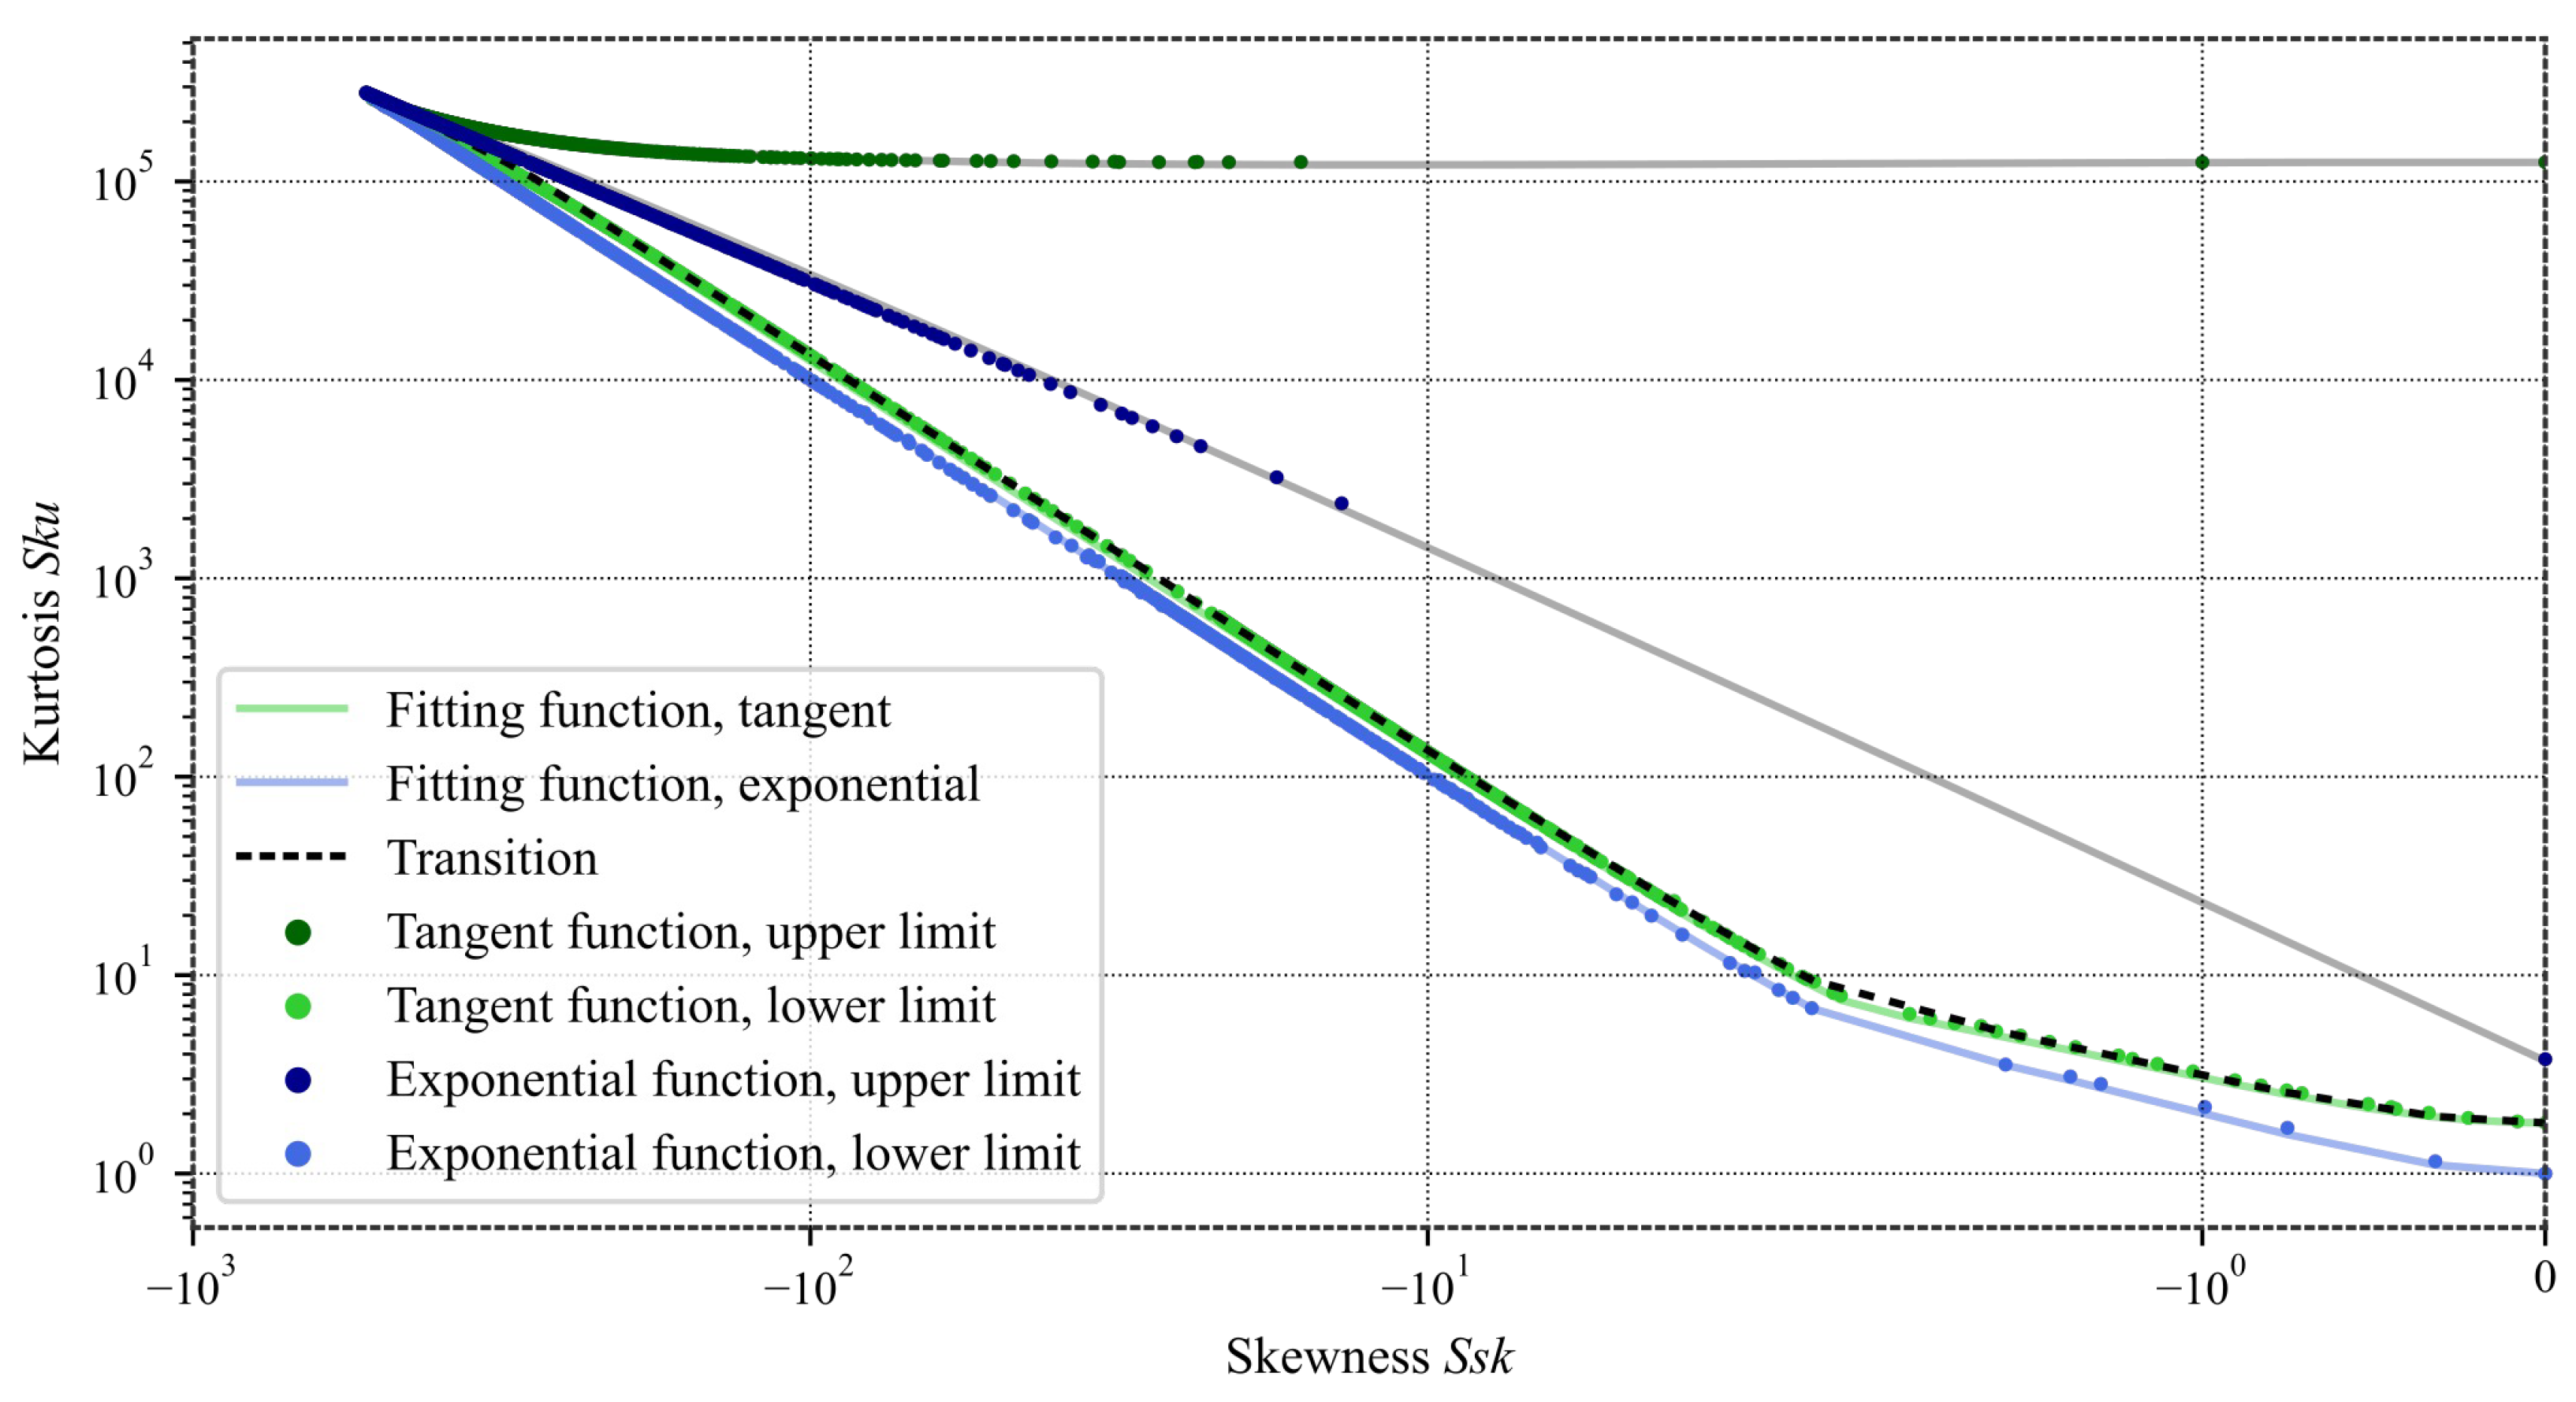
From the results of Figure 7, in logarithmic scales to visualize the entire domain, several essential elements can be identified:
1.
The function that best approximates f e , m i n ( S s k ) is S k u = 1.017 S s k 2 + 1 , which is very close to Pearson’s limit. This also shows that the multi-objective optimization works very well.
2.
The function that best approximates f t , m i n ( S s k ) is S k u = 1.24 S s k 2 + 1.8 , at least up to S s k = n 2 ; we shall return to this point later, in Appendix B. In Francisco and Brunetière [11], the boundary for using the tangent function was set to S k u = 1.34 S s k 2 + 1 , which is consistent, since, near the boundary, the transition from analytic to numerical results suffers from some inaccuracies.
3.
As a consequence of the previous point, the tangent/exponential transition is set at S k u = 1.34 S s k 2 + 1.8 to ensure the value of S k u at S s k = 0 .
4.
The theoretical limit of f t , m a x is approximately n, as previously observed. However, it has also been shown that this limit depends on the size of the integration interval [ 1 1 a , 1 + 1 b ] , which explains why it does not form a horizontal line.
5.
The upper bound of the exponential f e , m a x lies well above the transition curve, unlike in previous works [11], thanks to the introduction of the cubic function x 3 . Thus, there is no longer a transition zone, and the weakness of the previous algorithm, pointed out by Chen et al. [10], no longer exists.
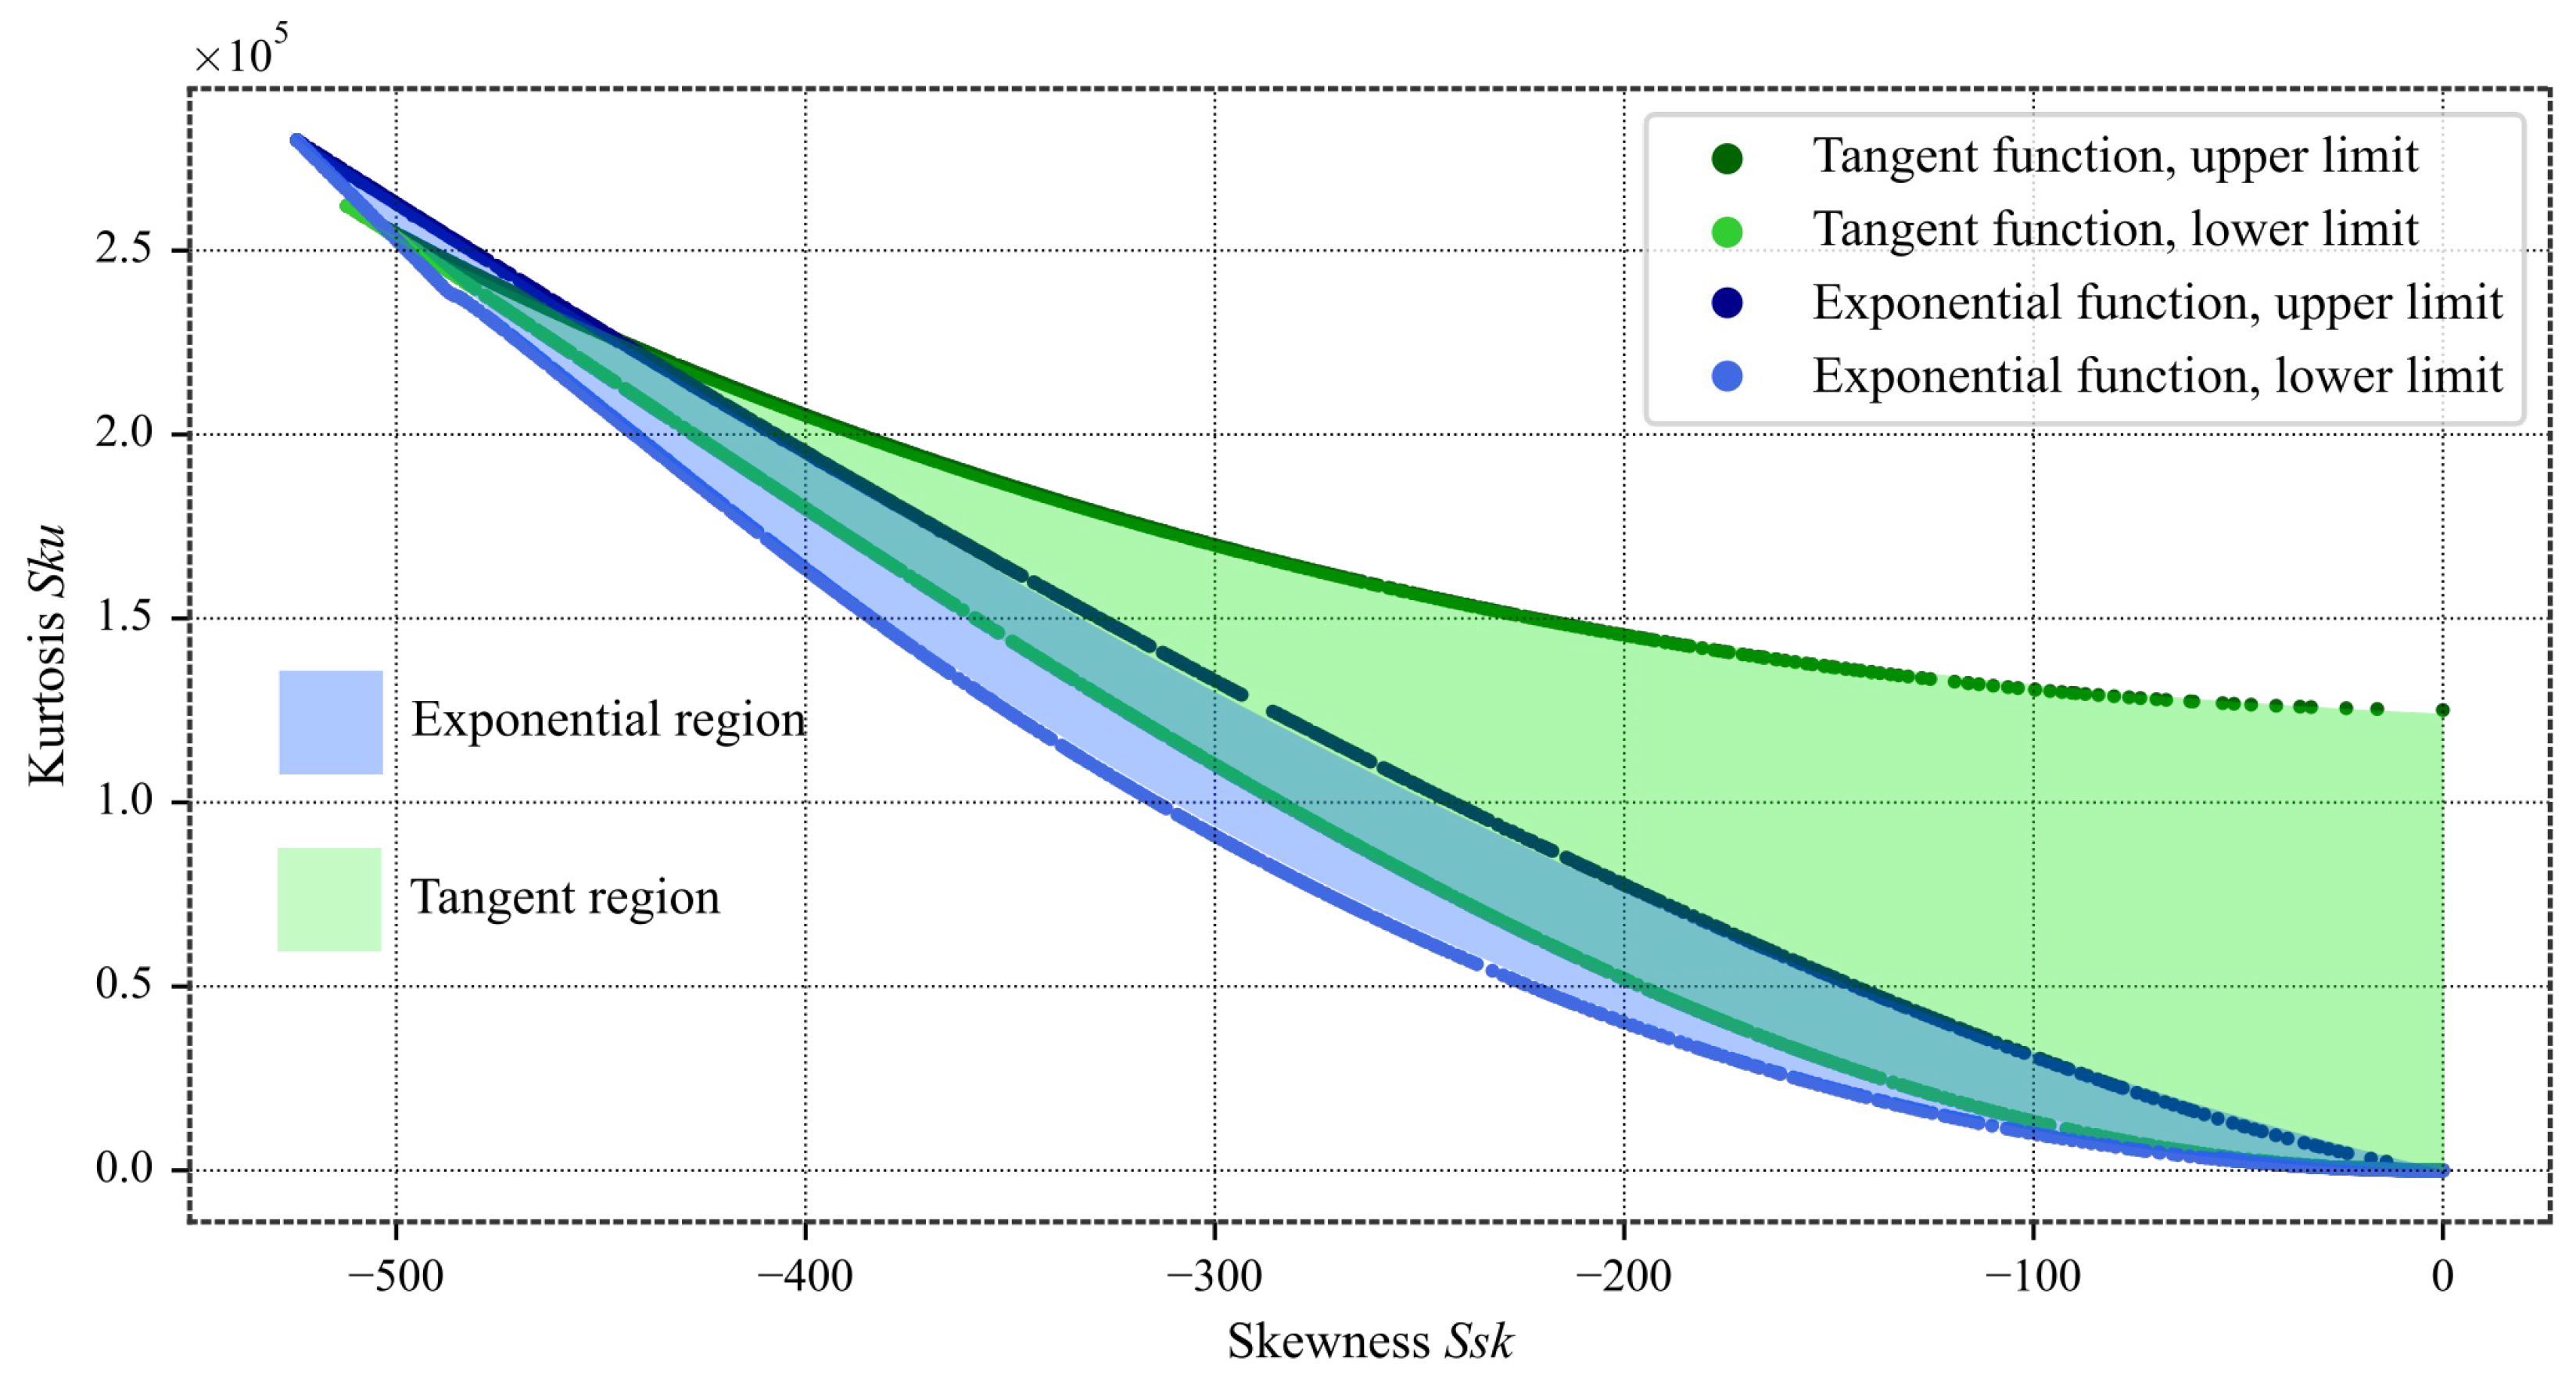
We can now define two working regions, depending on the position of a point ( S s k , S k u ) relative to the transition, see Figure 8. If the point lies above, the tangent function is used; otherwise, the exponential basis is applied.
The pair of tangent and modified exponential functions adequately covers the required values ( S s k , S k u ) compatible with the Pearson limit and the number n of heights.

2.5. Reference Surfaces for Reproduction

As mentioned in the Introduction, dental surfaces pose a challenge for algorithms dedicated to the generation or reproduction of numerical surfaces, due to the spatial arrangement of heights. The unworn surface exhibits smooth patterns and resembles skin. Additional features may include deep striations left by the friction of silica grains, or even pits caused by ingested hard particles.
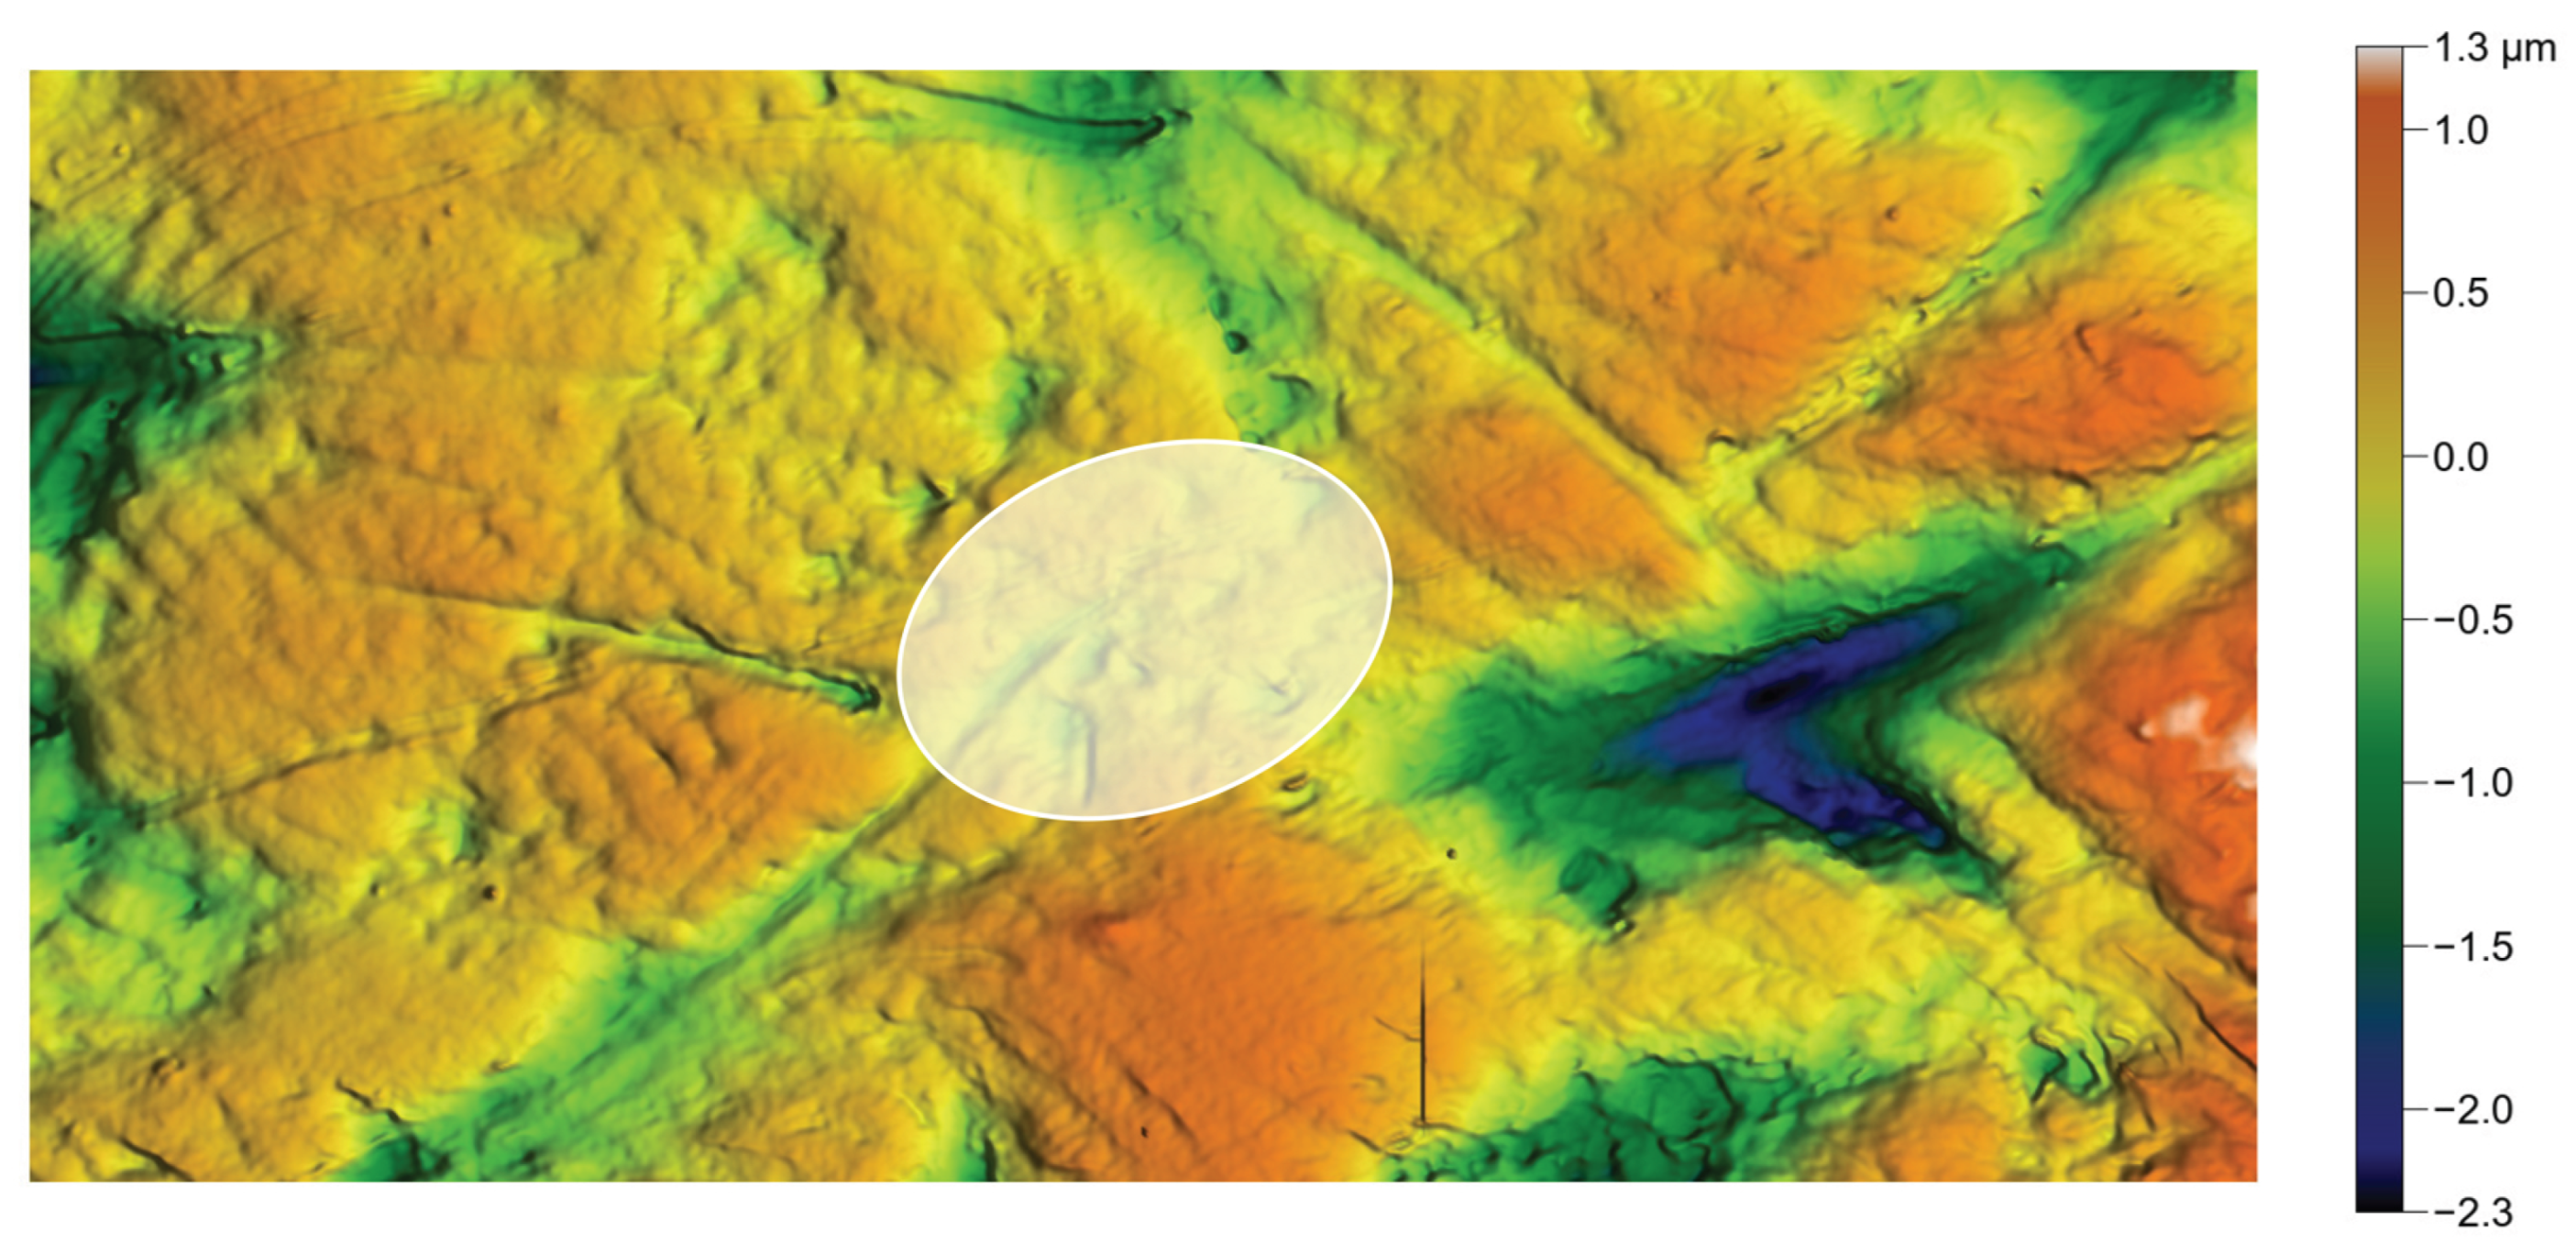
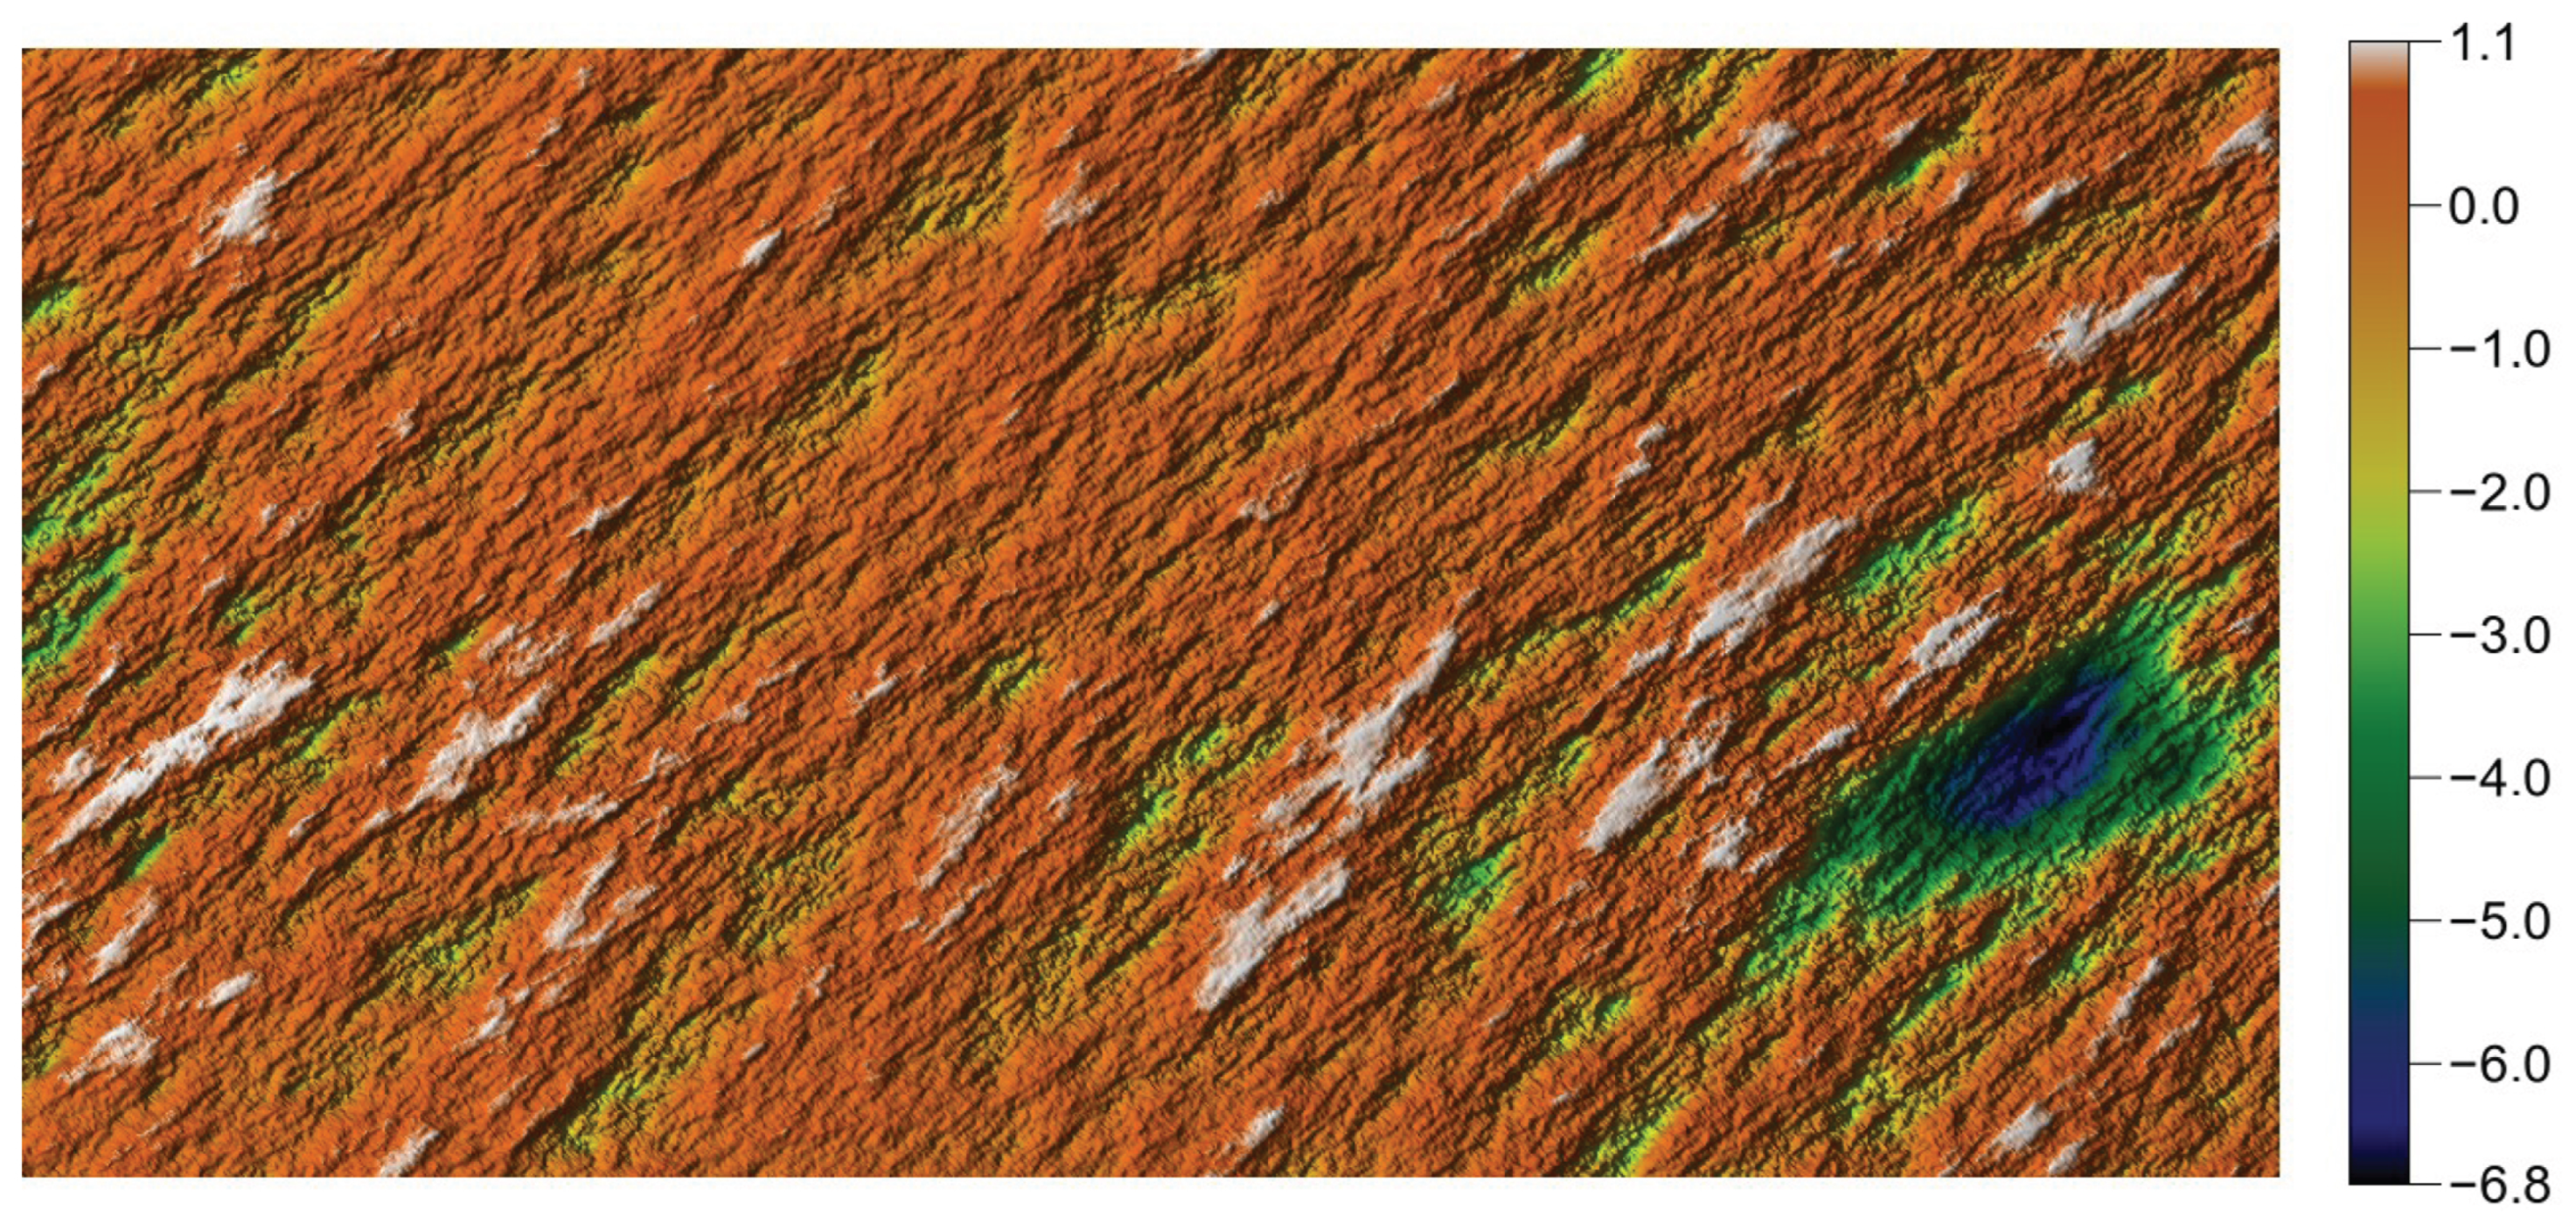
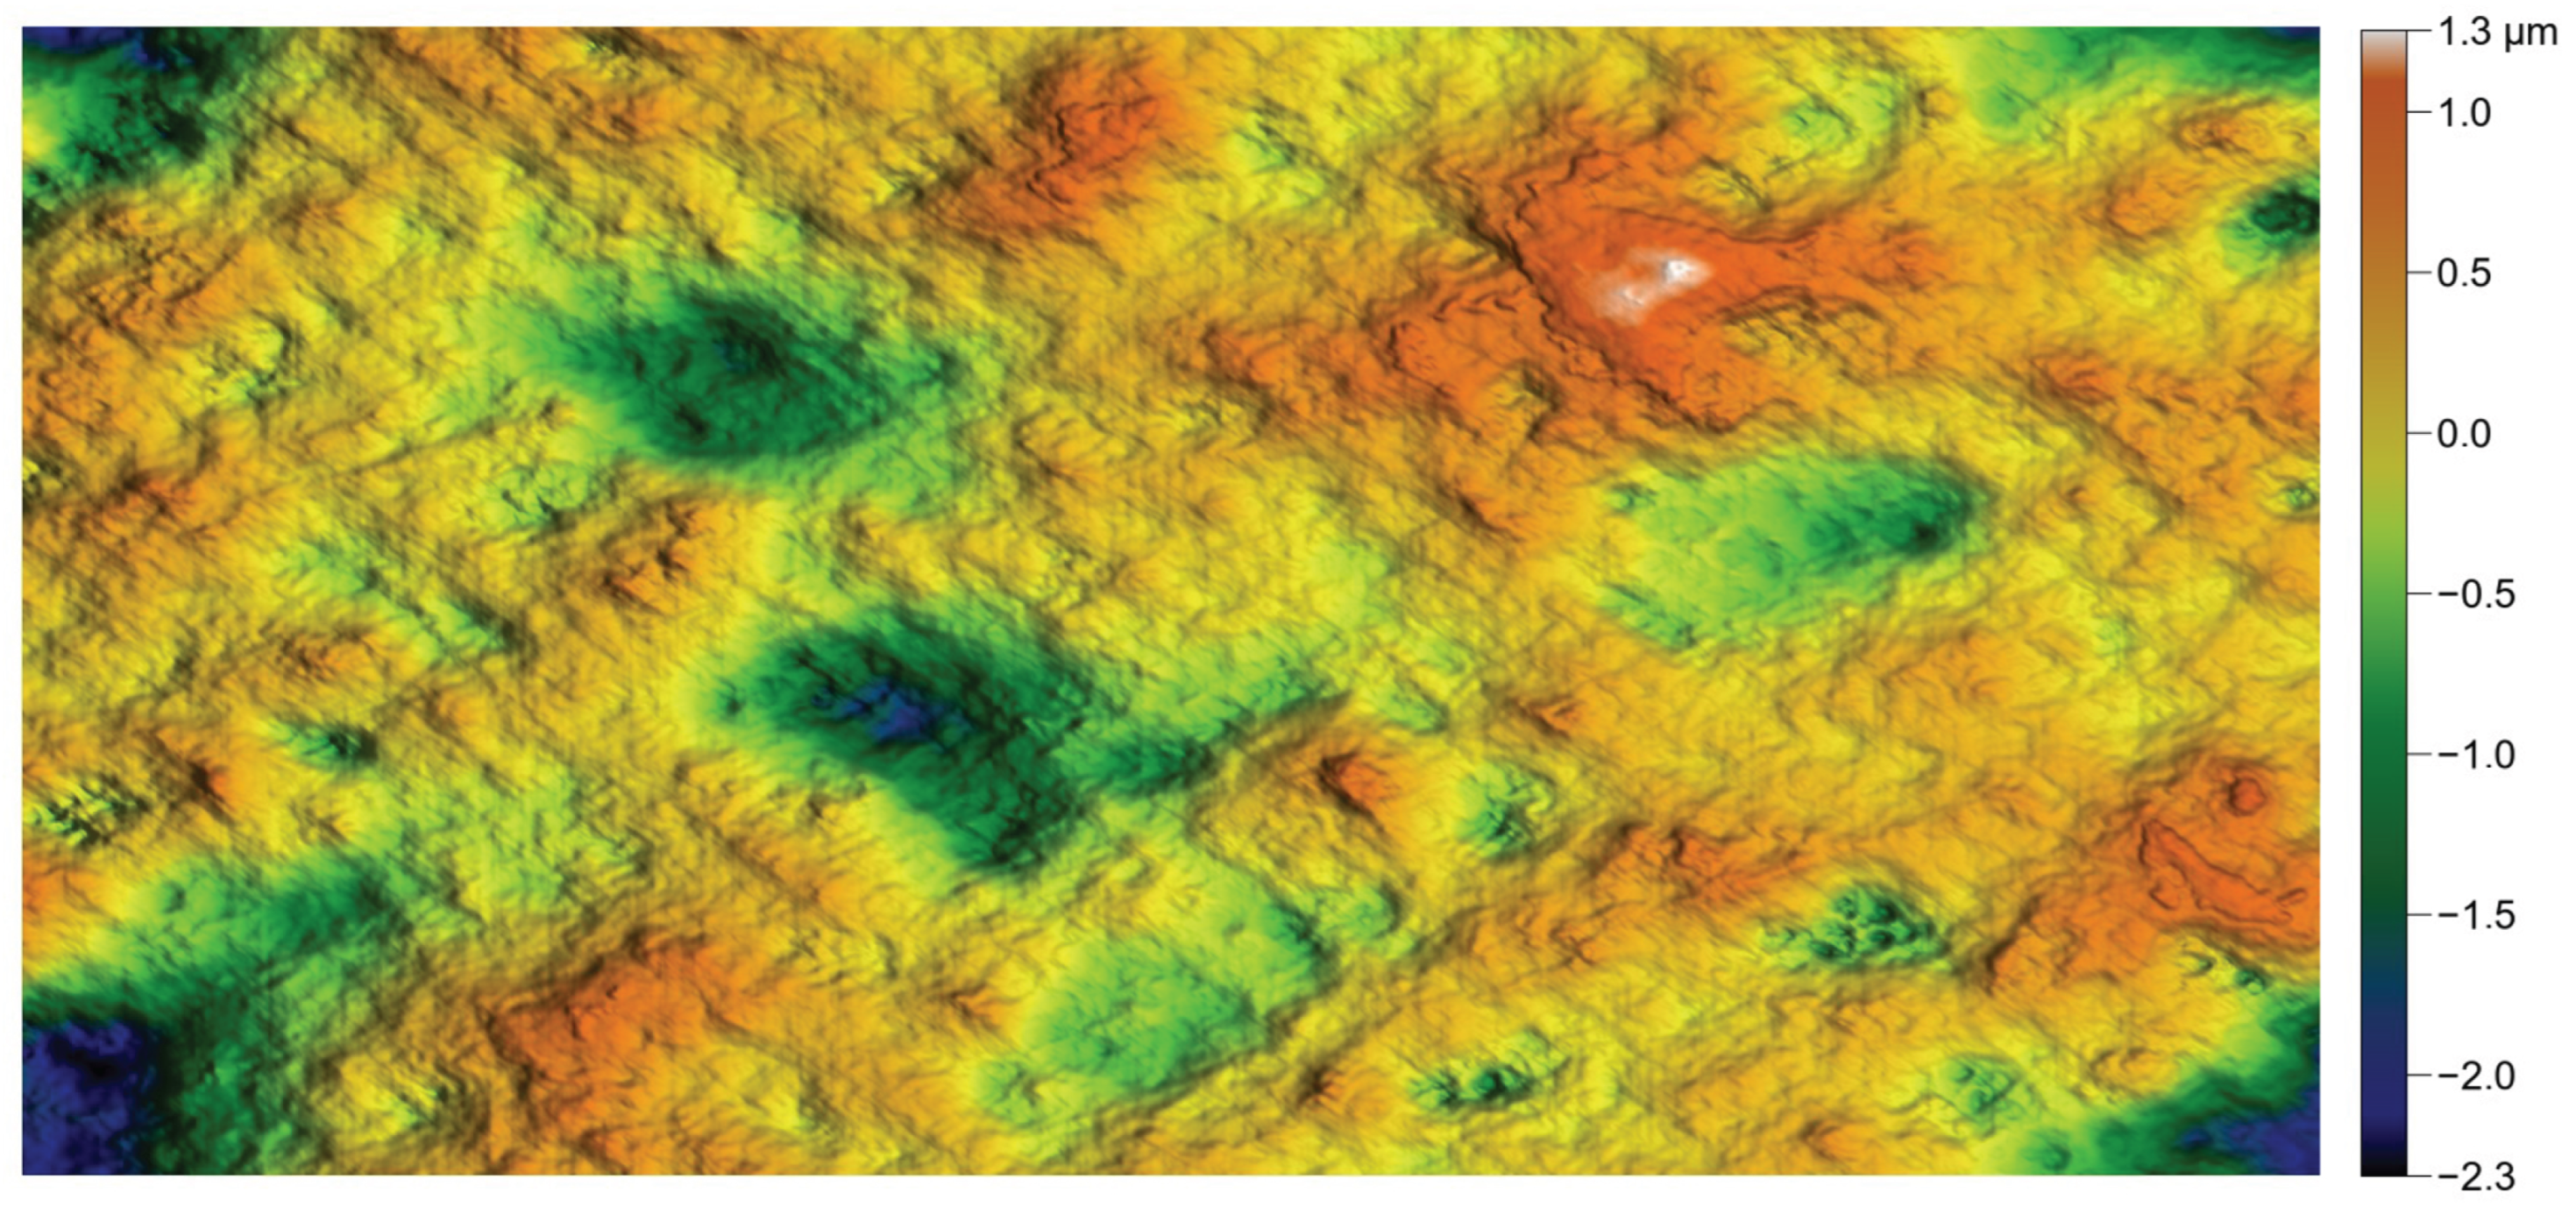
The reference surface used throughout the reproduction process was selected from herbivore dental surfaces. It was extracted from an original surface and reshaped into a rectangular size, in order to demonstrate the versatility of the generation program, as shown in Figure 9.
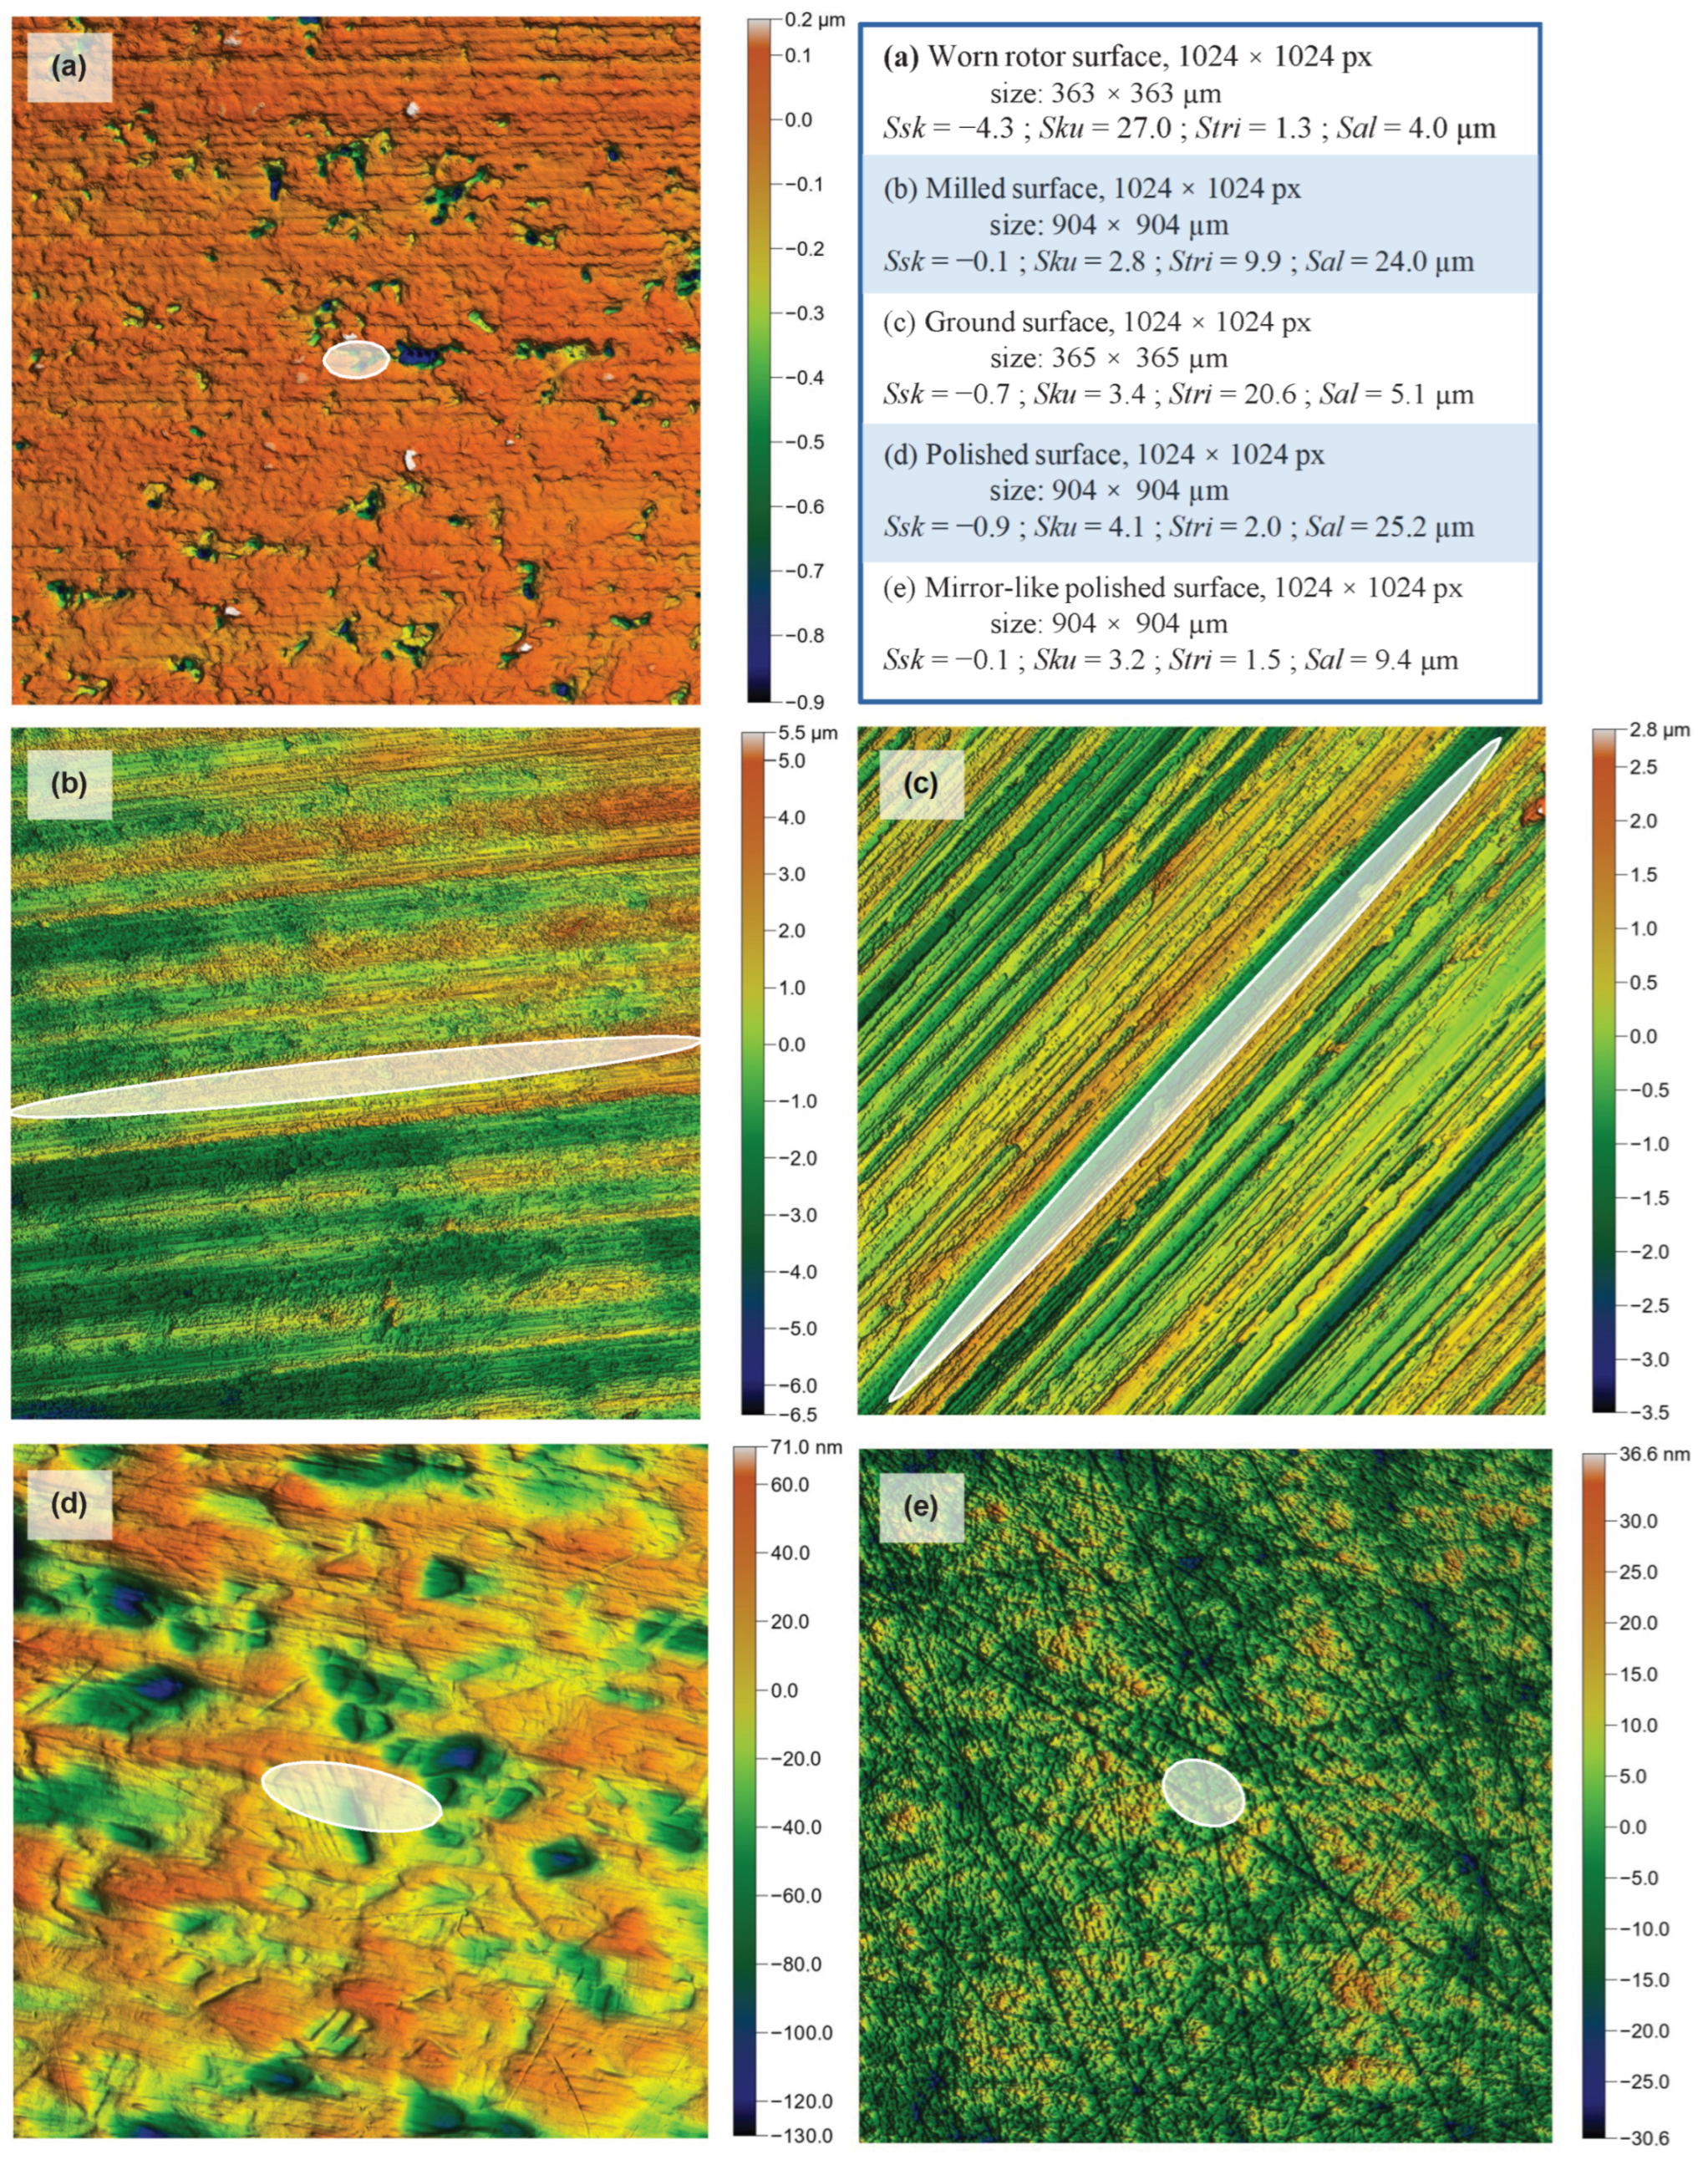
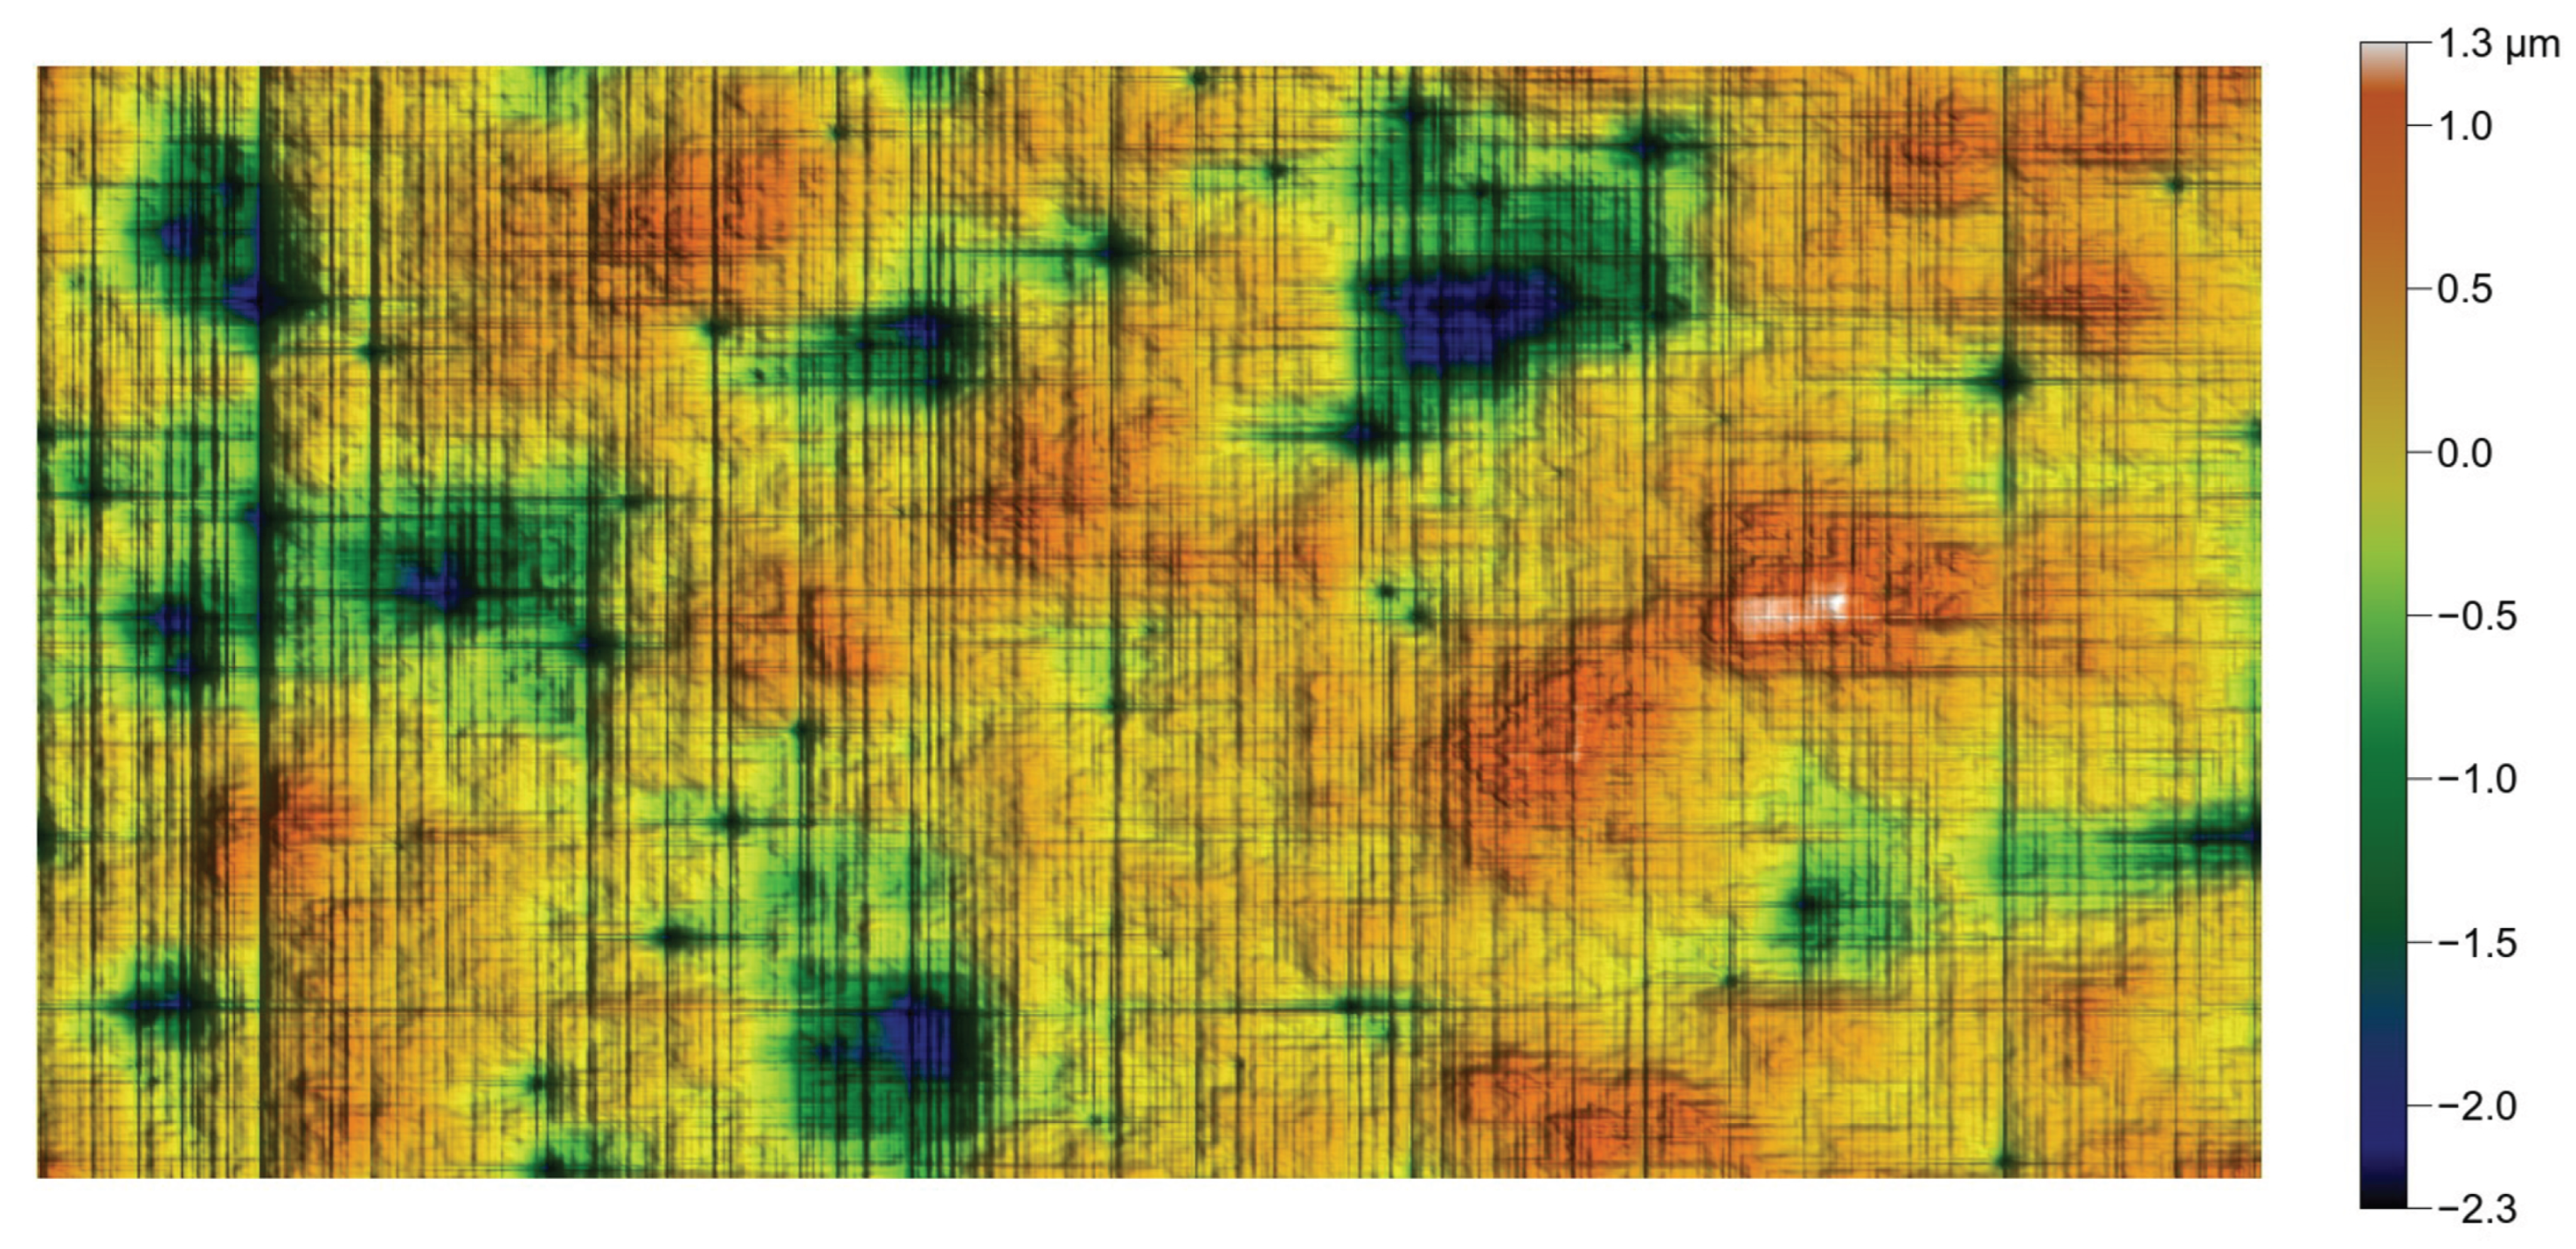
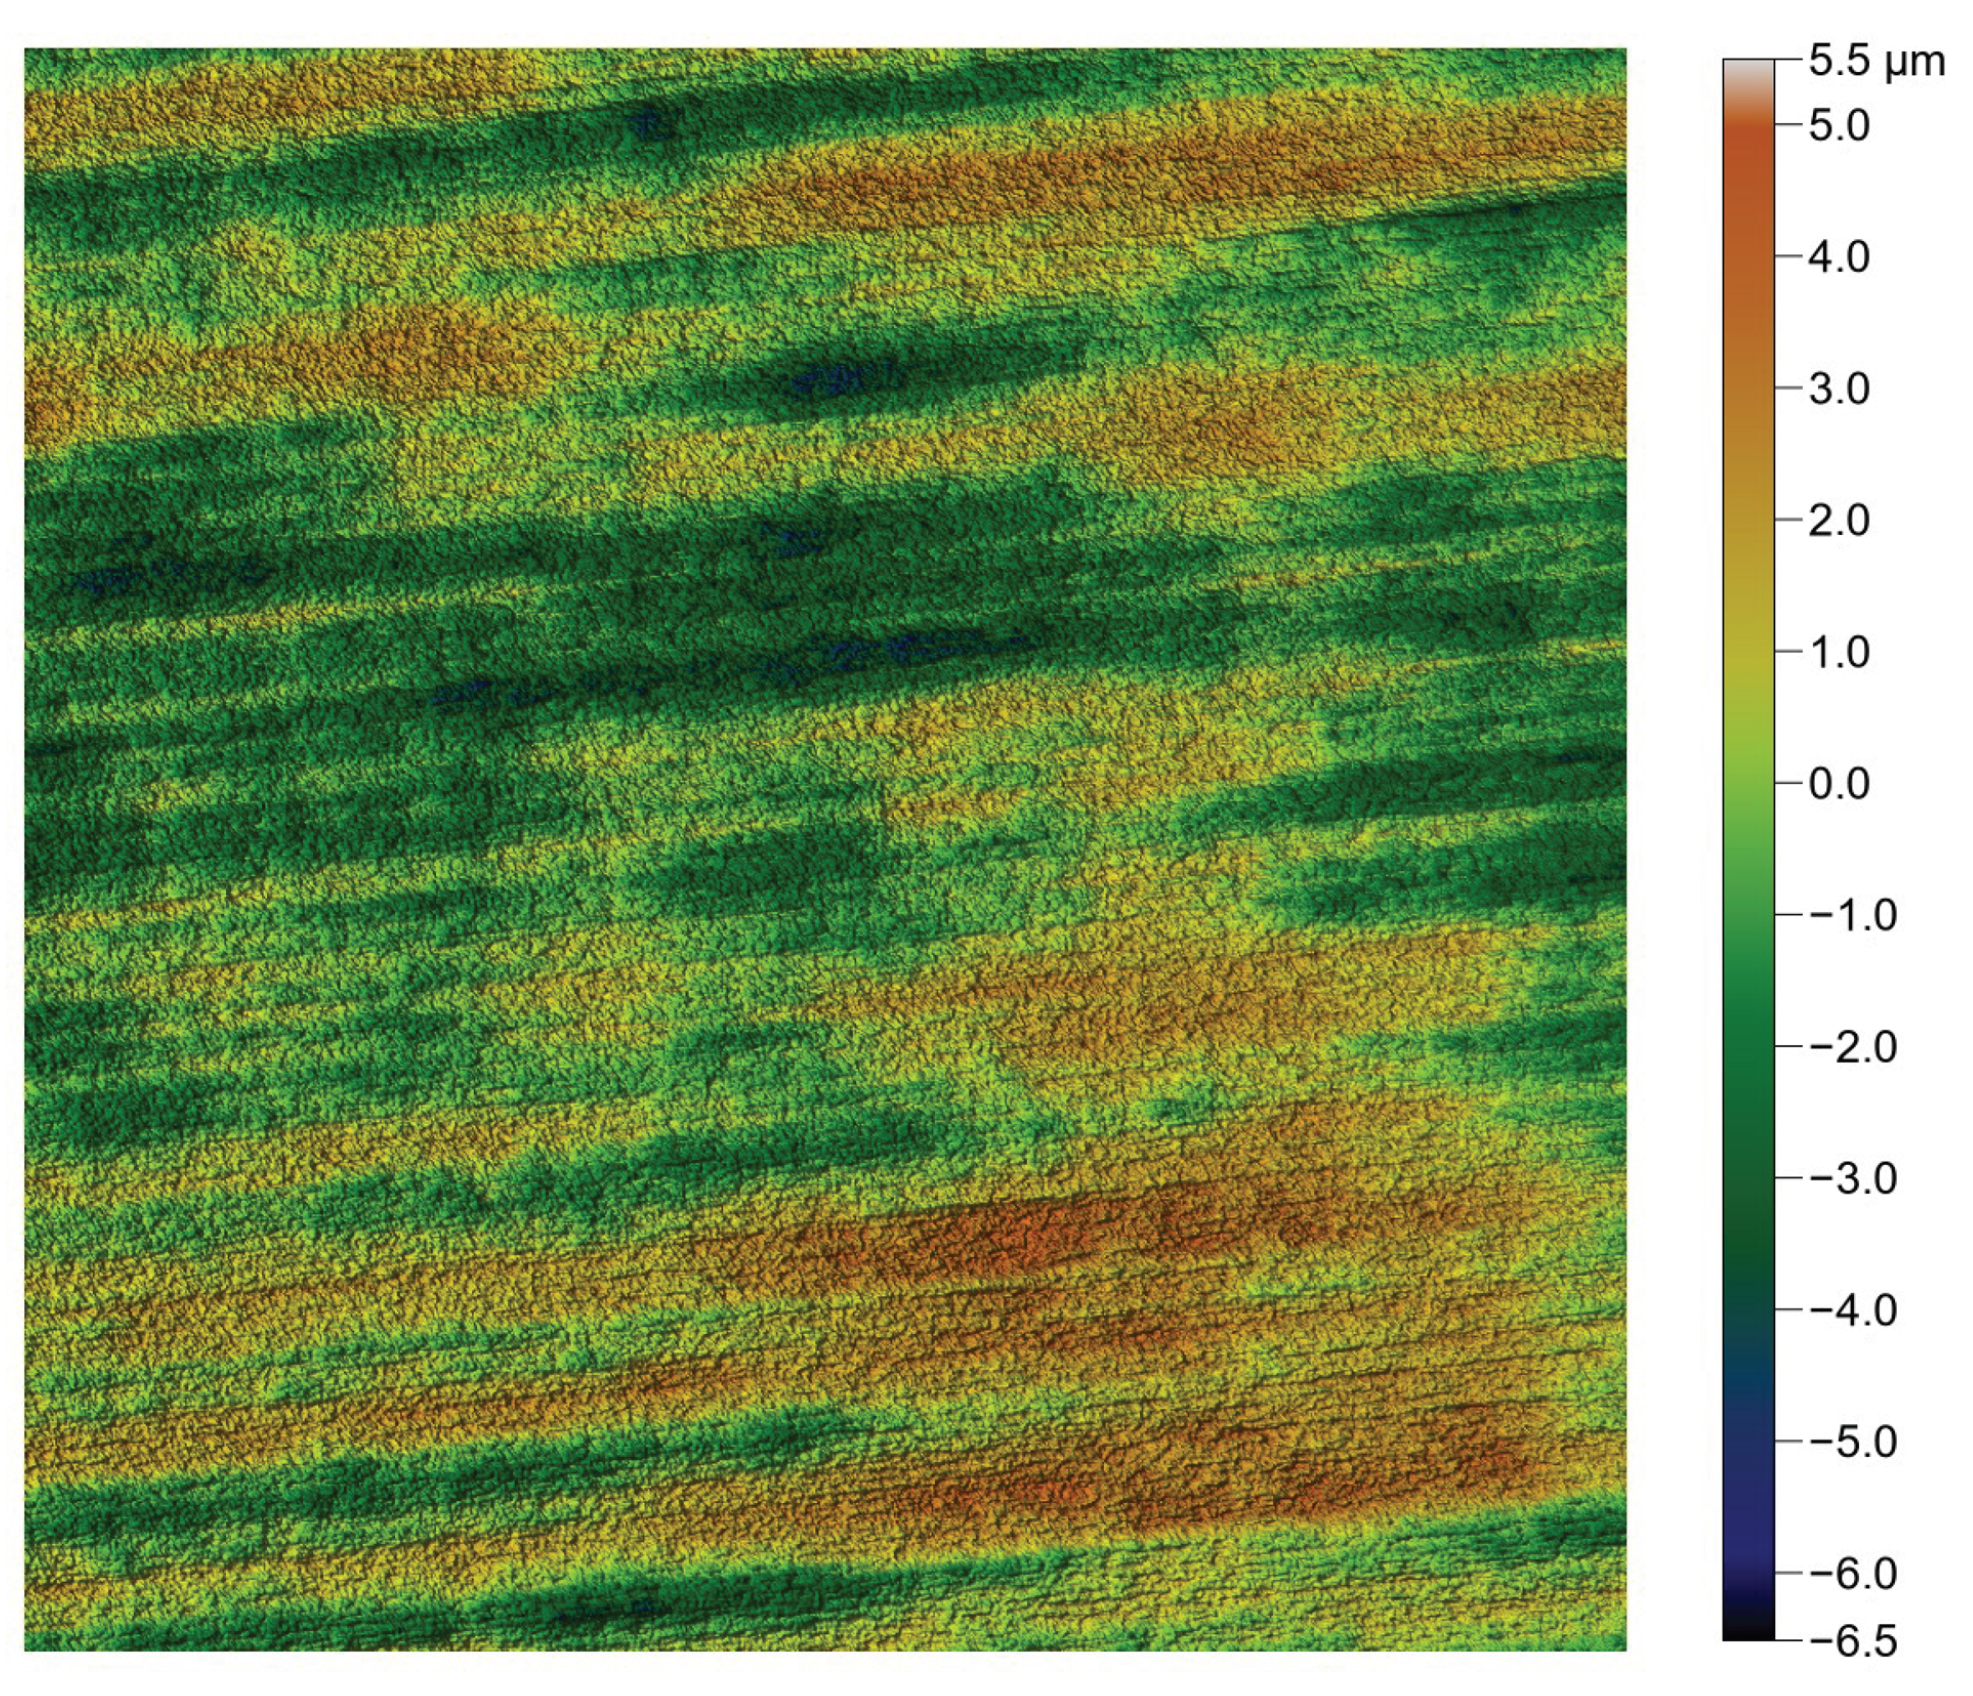
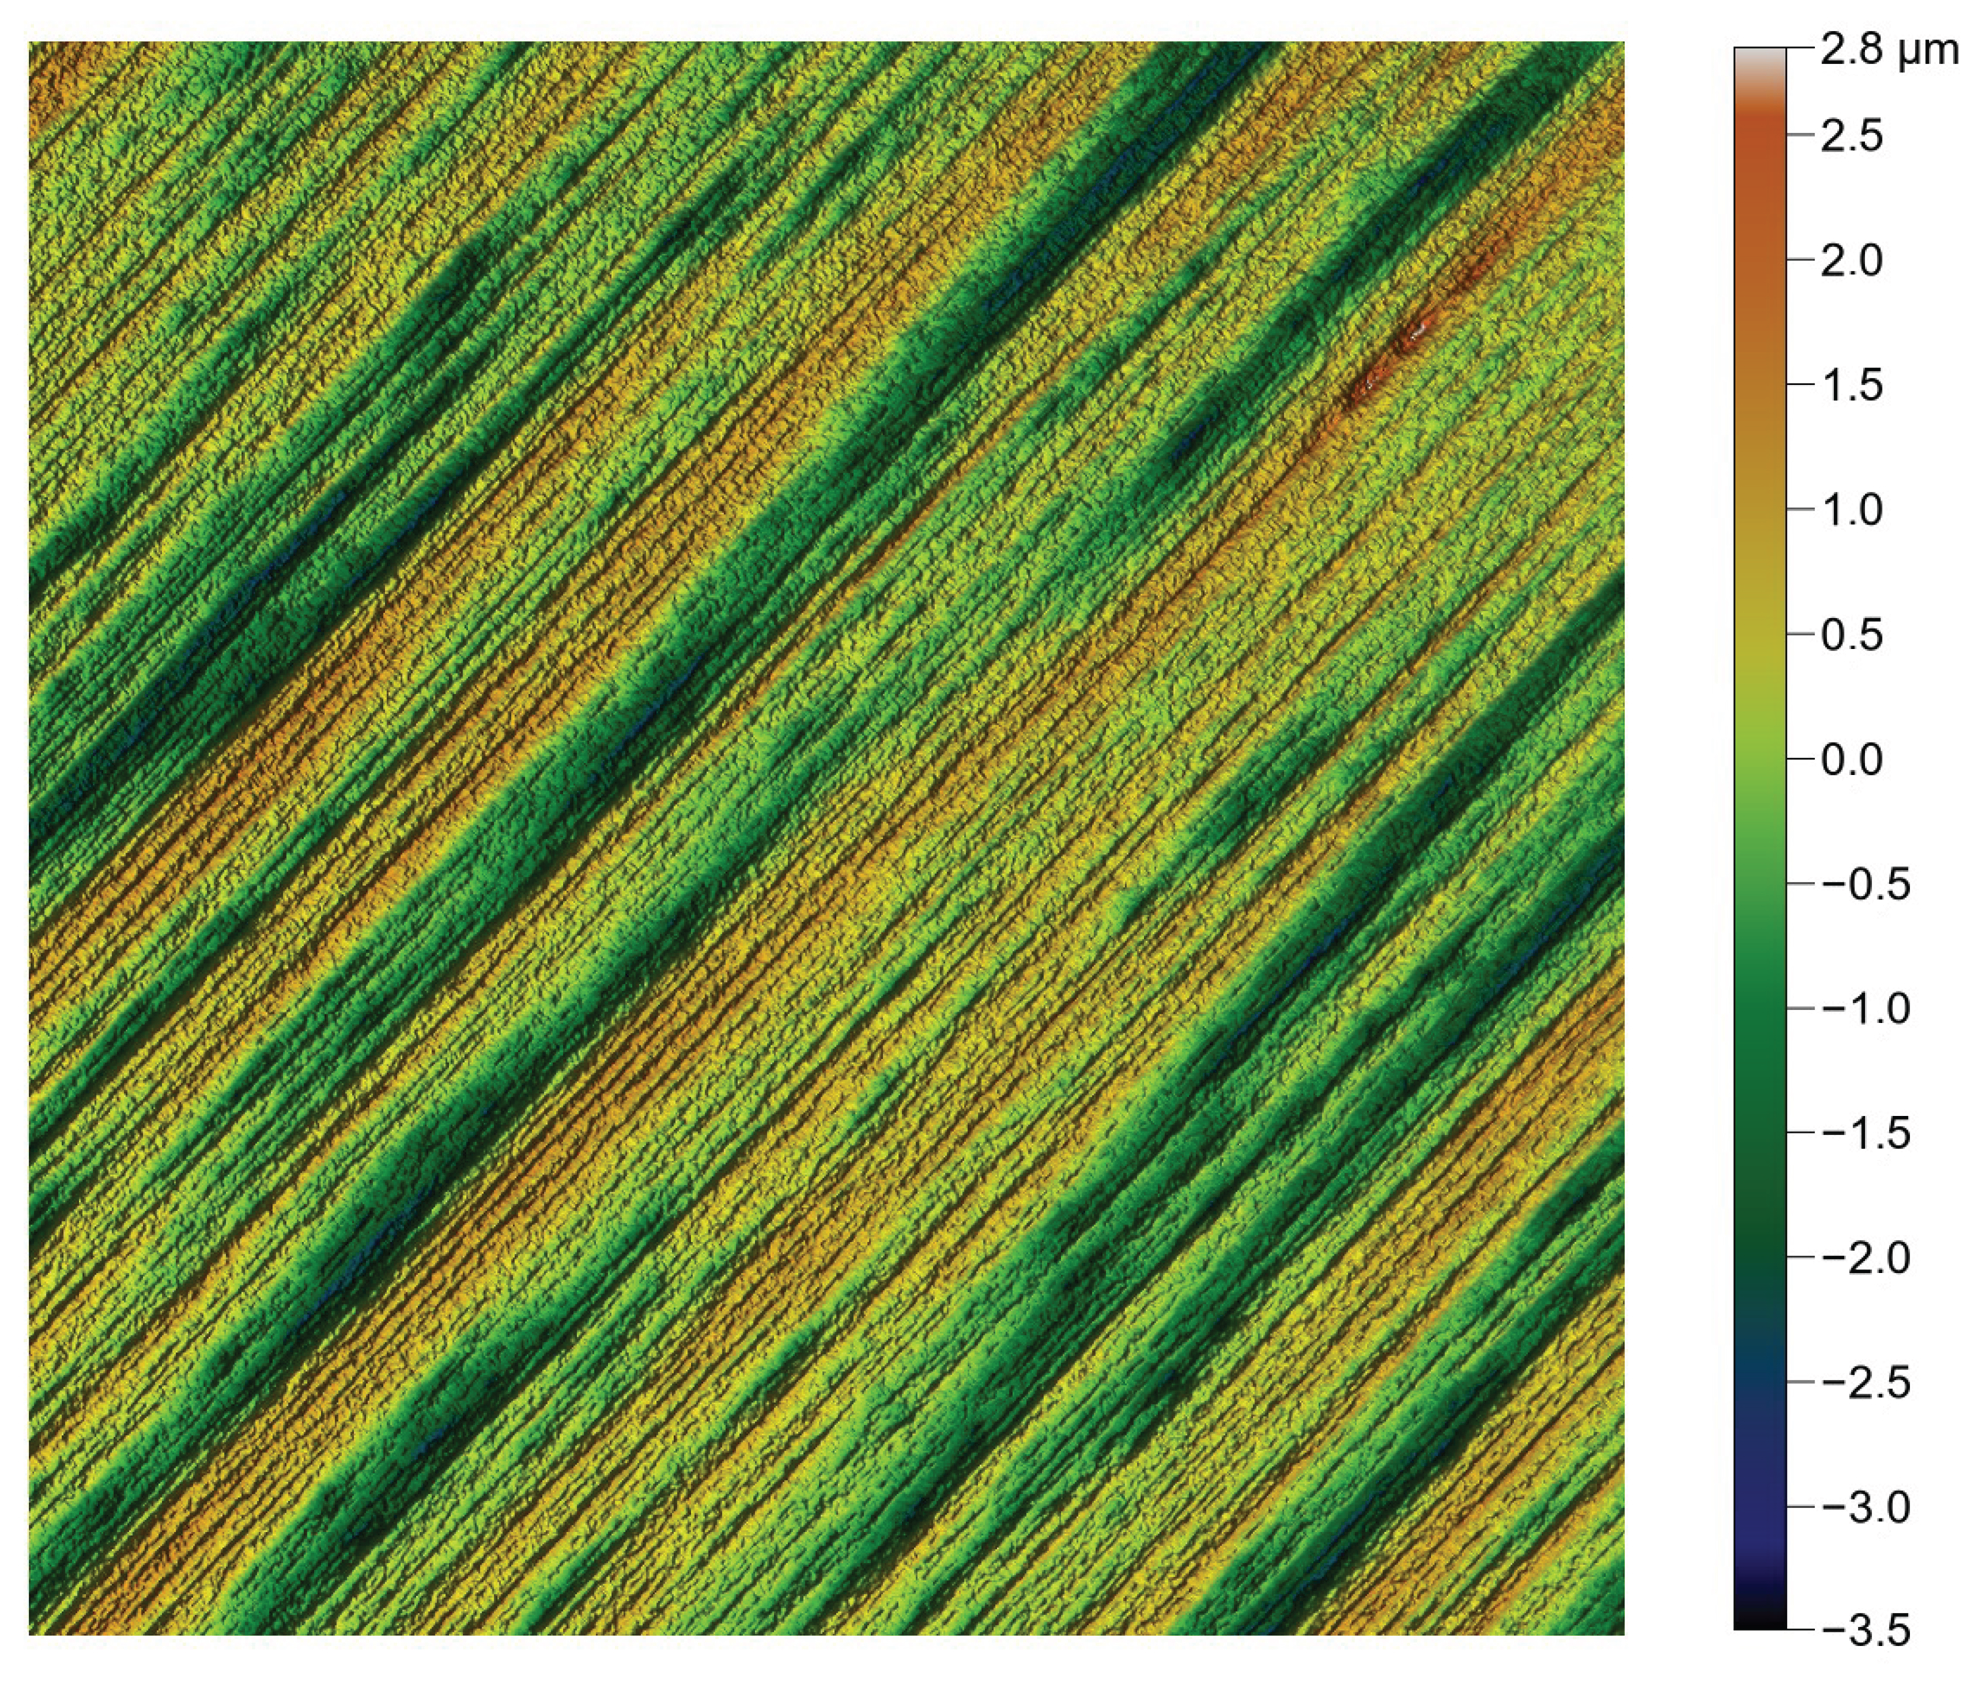
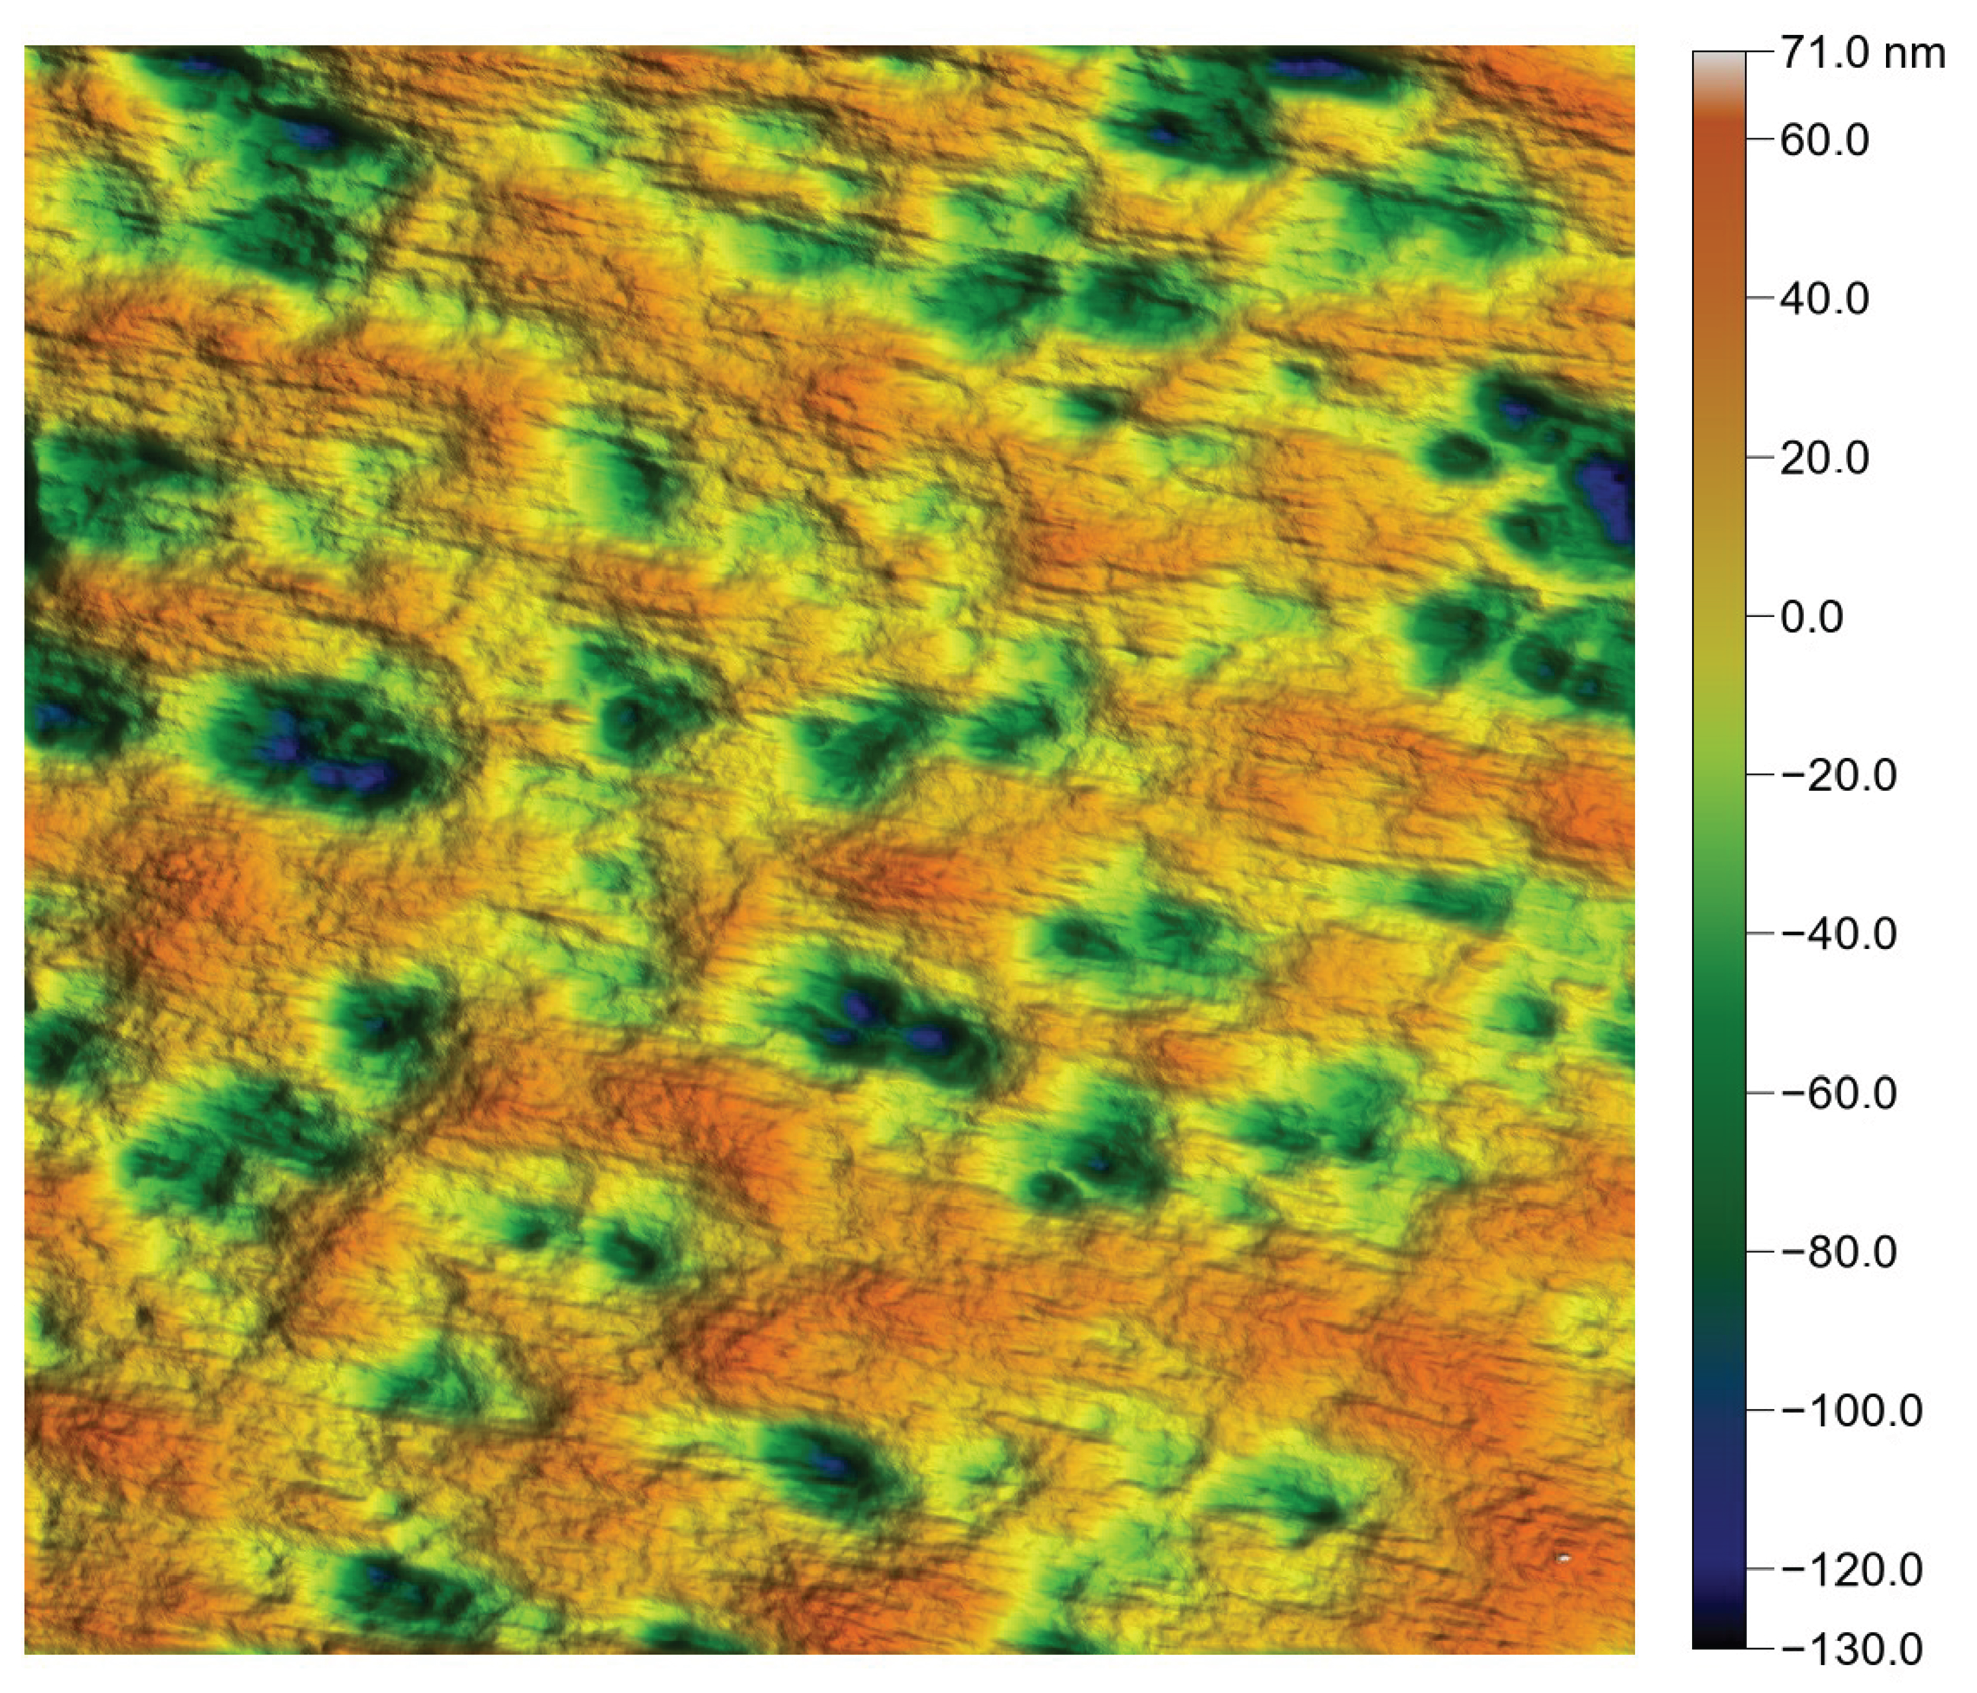
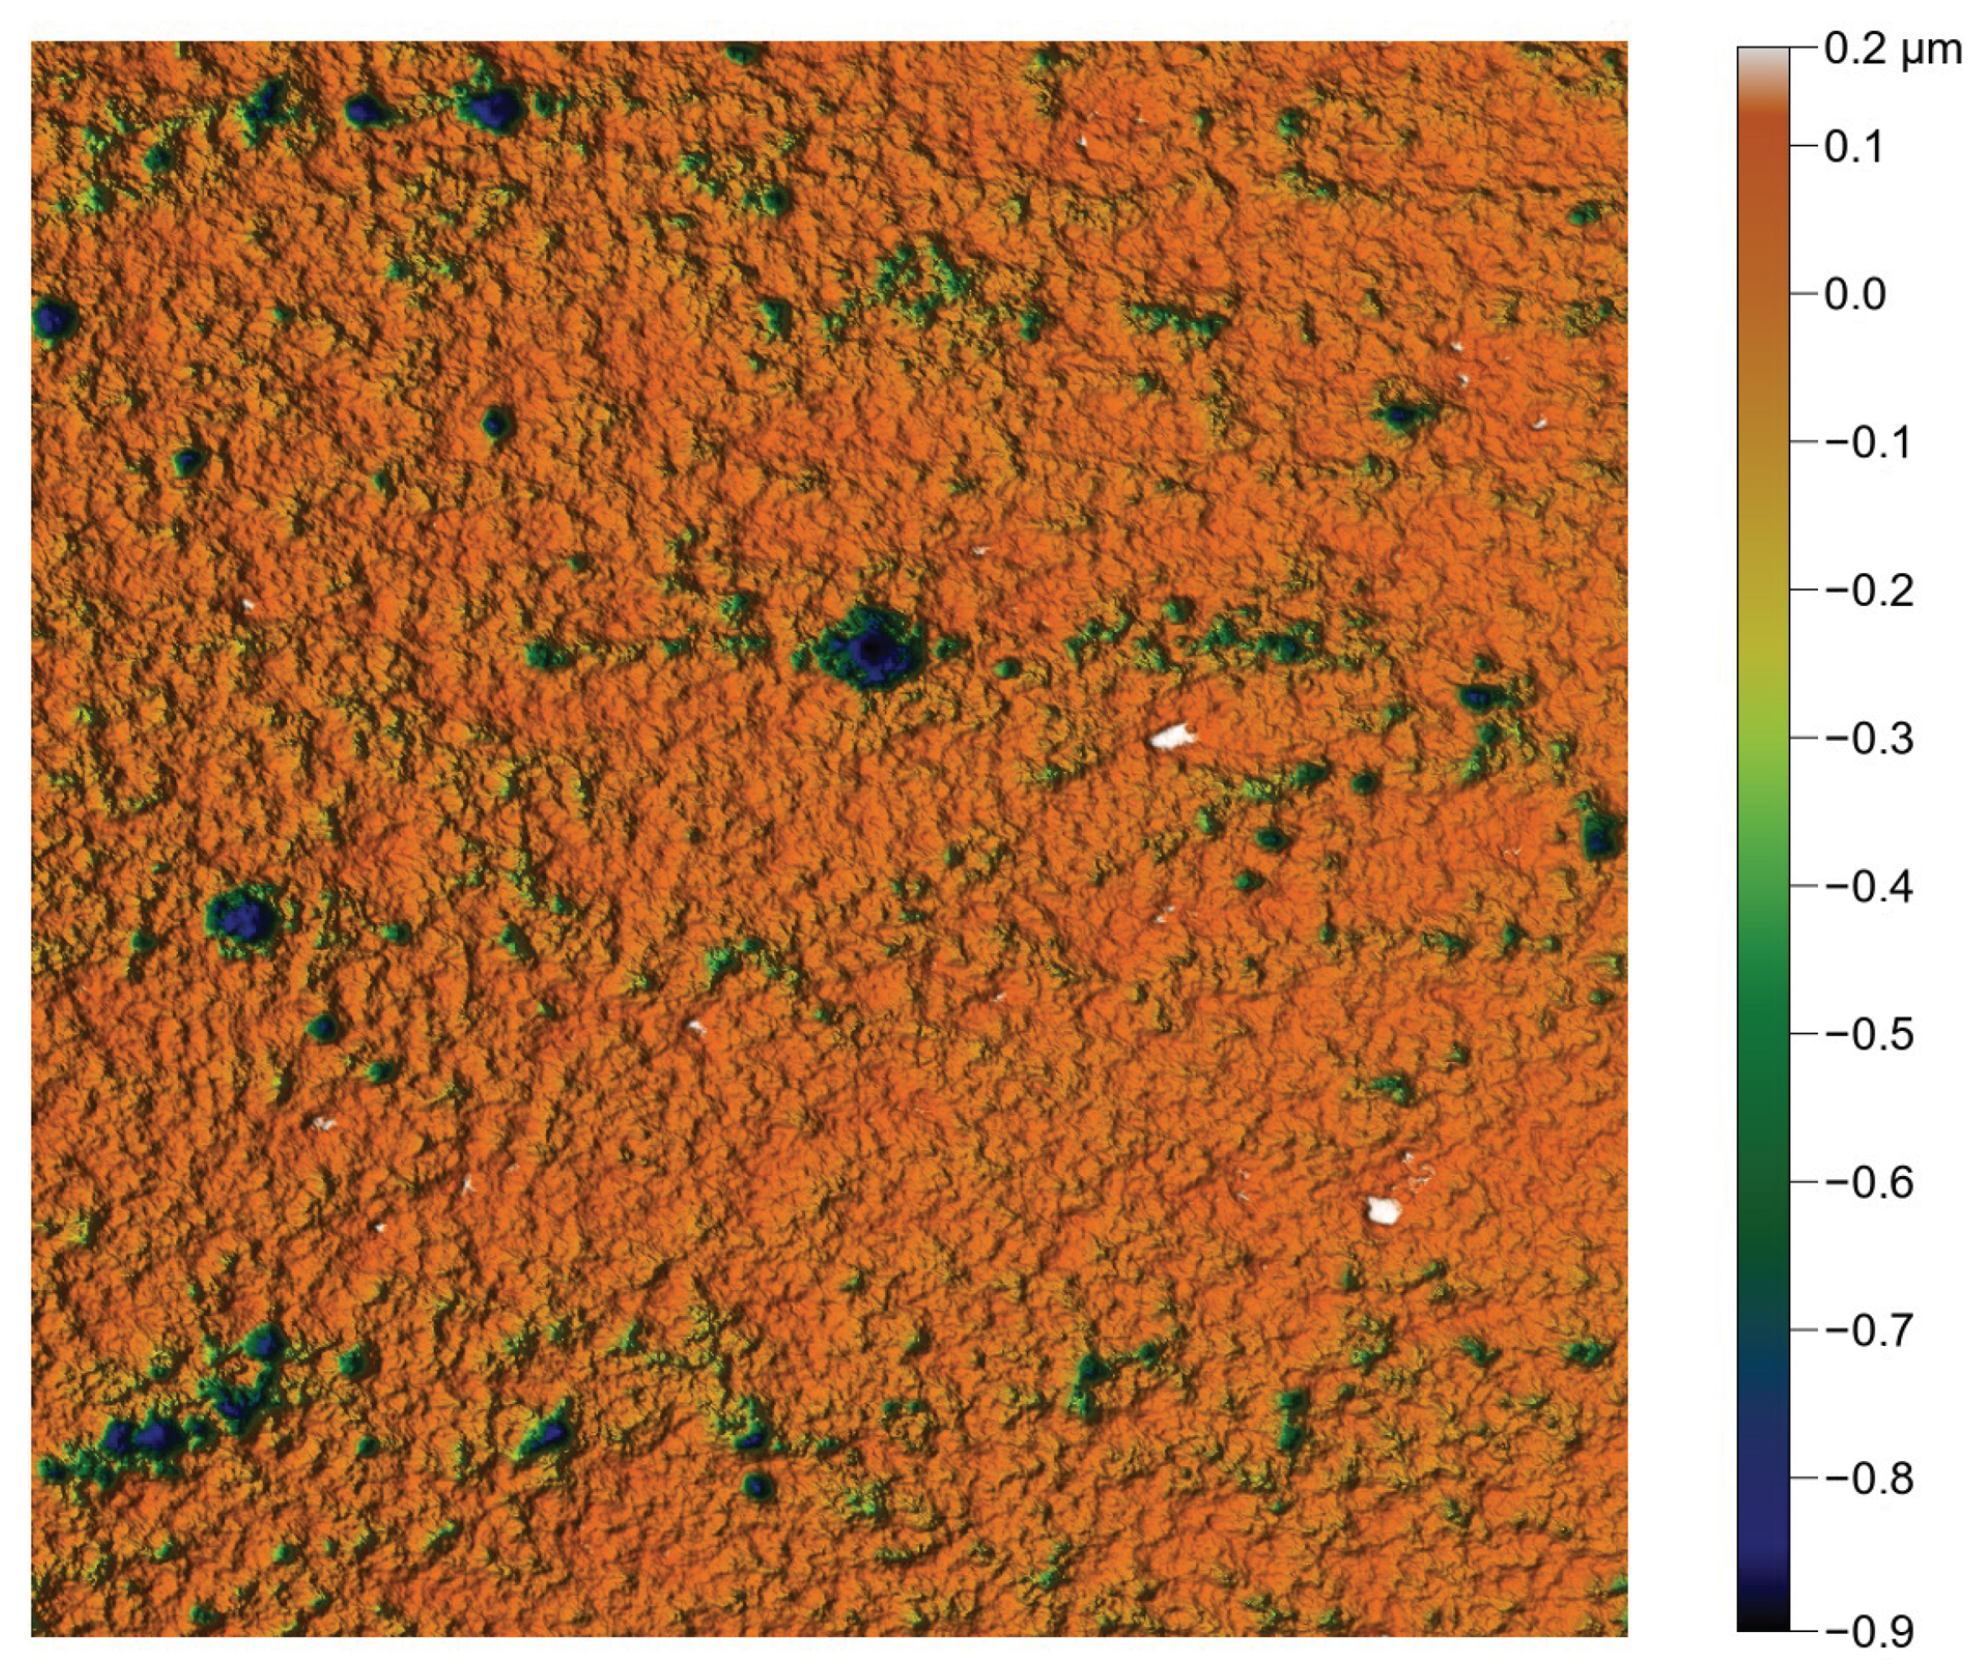
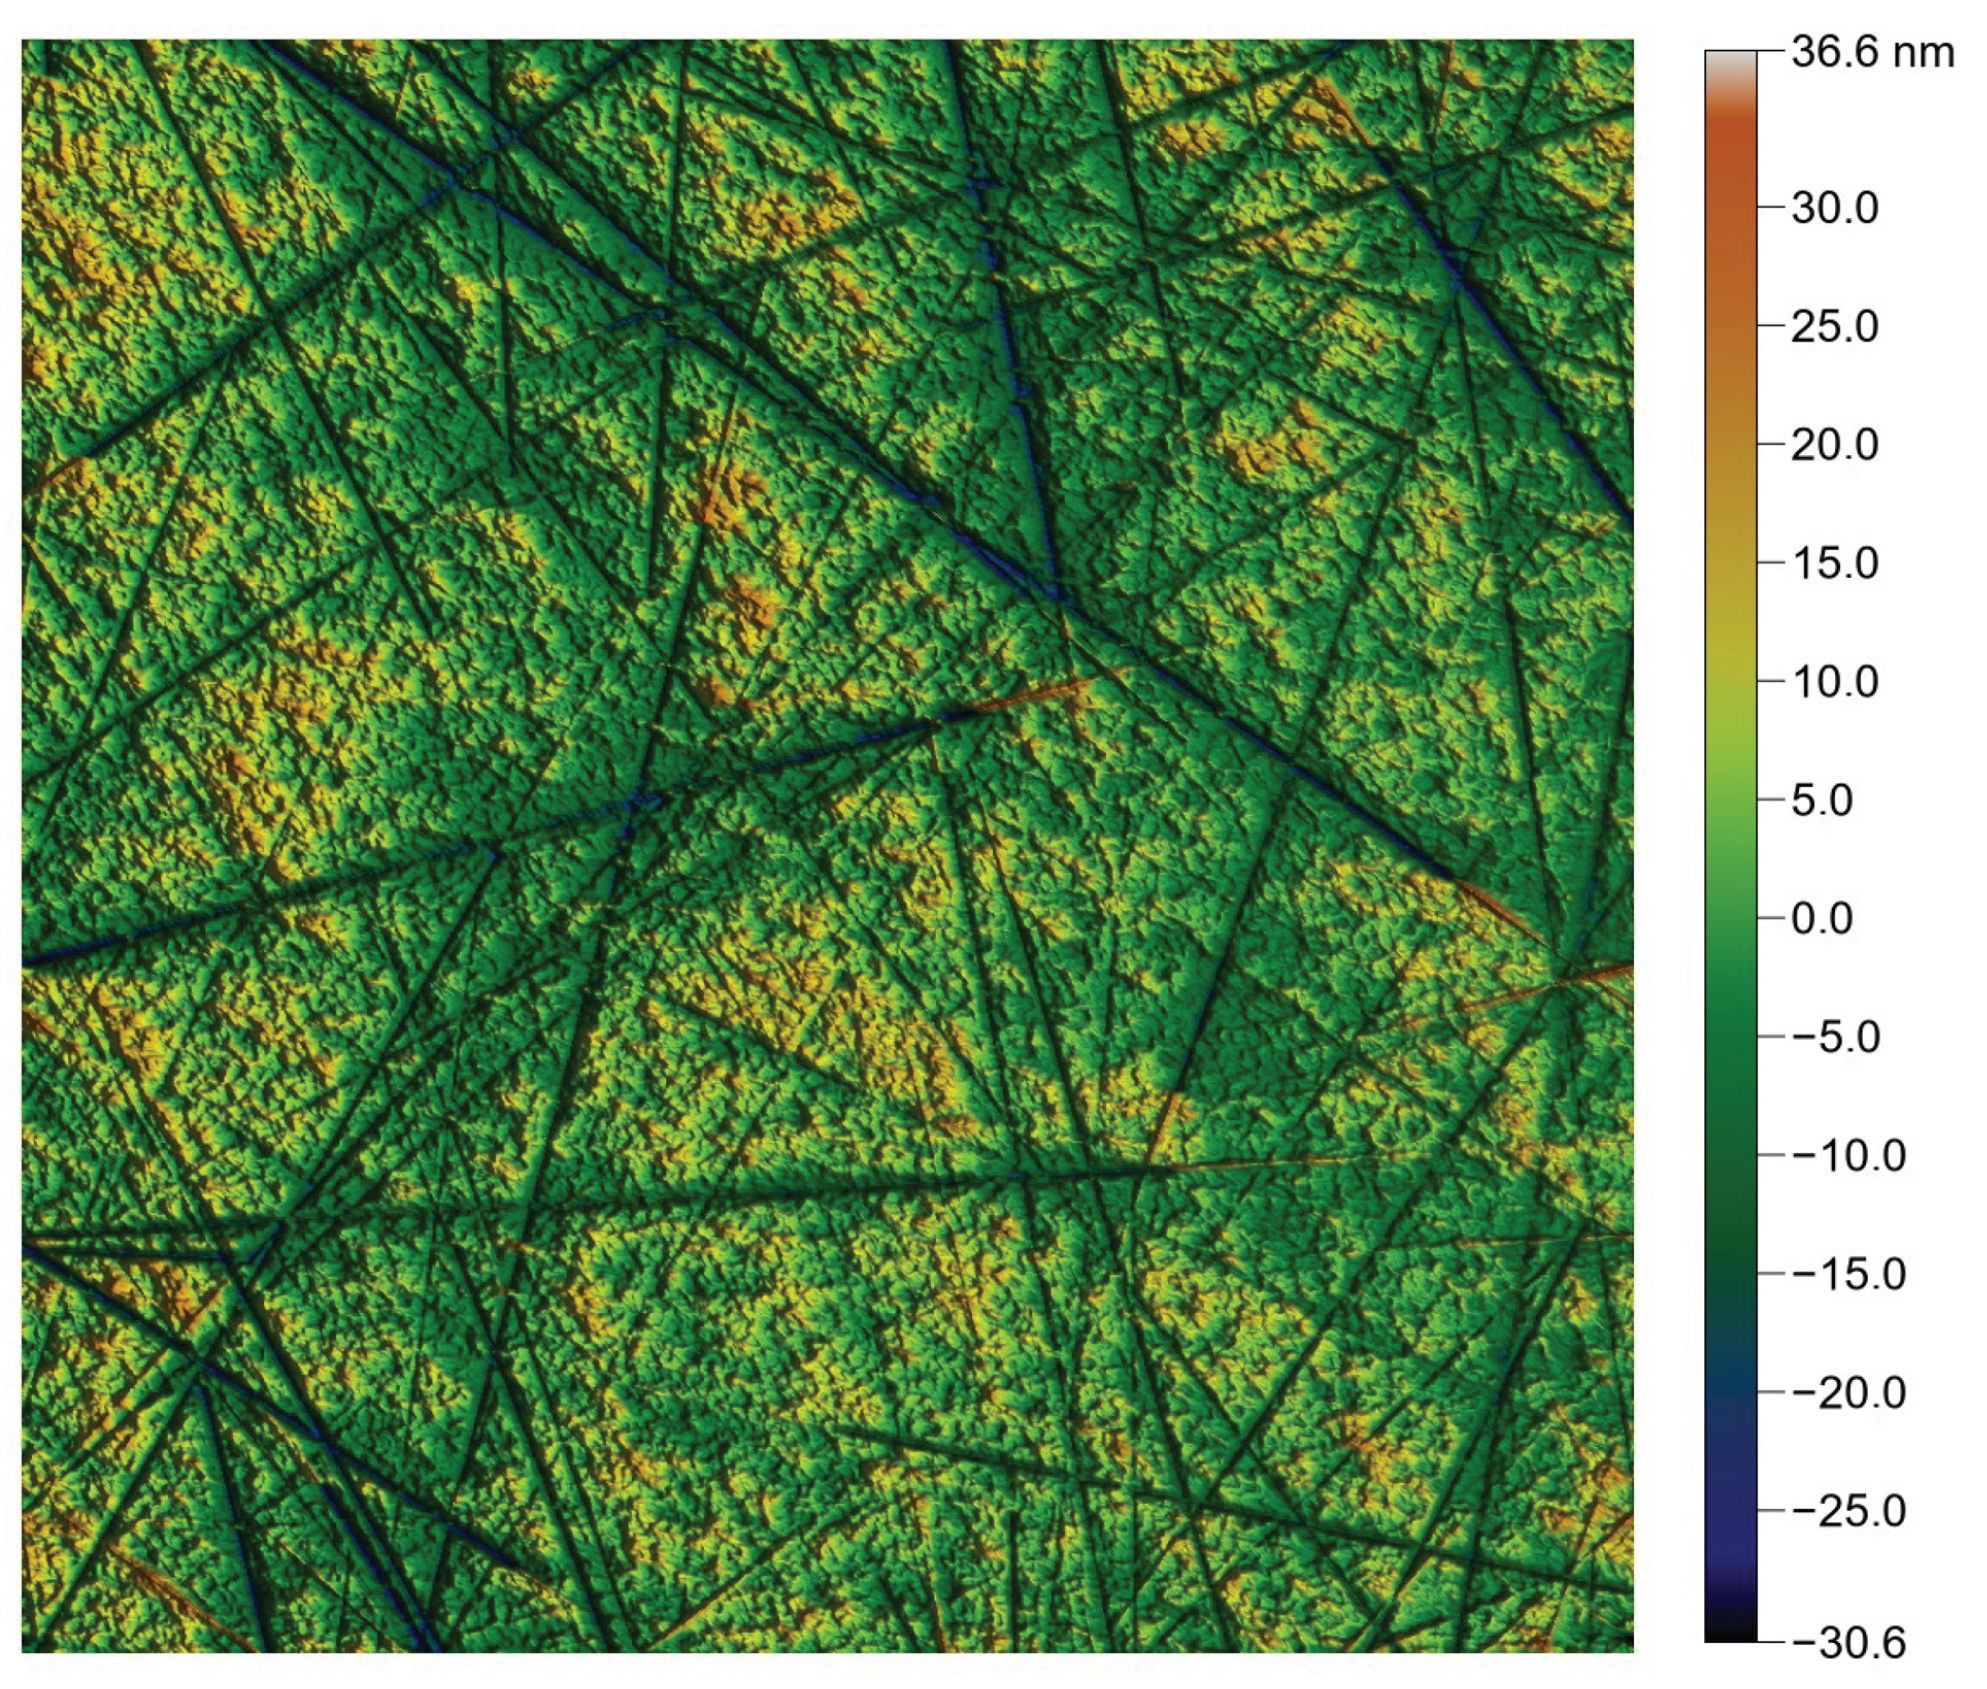
The capability of the proposed algorithm is also tested on typical industrial surfaces. The objective is to reproduce them not only in terms of the imposed parameters but also with respect to realism. Five surfaces are therefore considered, as shown in Figure 10.
Table 3 provides a qualitative overview of the characteristics of the six surfaces considered.

3. Results and Discussion

The generation of homogeneous isotropic rough surfaces is no longer a challenge, even though the visual appearance is not always realistic. In the presence of anisotropy, with an arbitrary orientation, the situation becomes more complex, since it departs from the assumption of periodicity required for the use of FFT. This departure from periodicity becomes increasingly significant as the correlation lengths increase. We will, therefore, first focus on generating oriented rough surfaces, whether periodic or not, with a non-uniform distribution of heights. In a second stage, we will attempt to reproduce existing surfaces, respecting not only their height and spatial parameters but also their visual appearance.

3.1. Generating Rough Surfaces from Scratch

Anisotropic surfaces are defined as those whose topography exhibits a preferred orientation. The most obvious case is that of unidirectionally striated surfaces. When the direction is aligned with one of the principal axes x or y, the periodicity condition inherent to the use of FFT is easily satisfied. Conversely, an orientation different from 0 [ k π 2 ] may lead to a break in periodicity along x or y.
It should be recalled that applying a digital filter to white noise—or approximately white noise—performs a convolution over the entire surface, which cannot yield localized regular topographic patterns, as shown in Figure 11. Achieving such patterns would instead require using a texture as input rather than a white-noise surface.

3.1.1. Periodic Surfaces

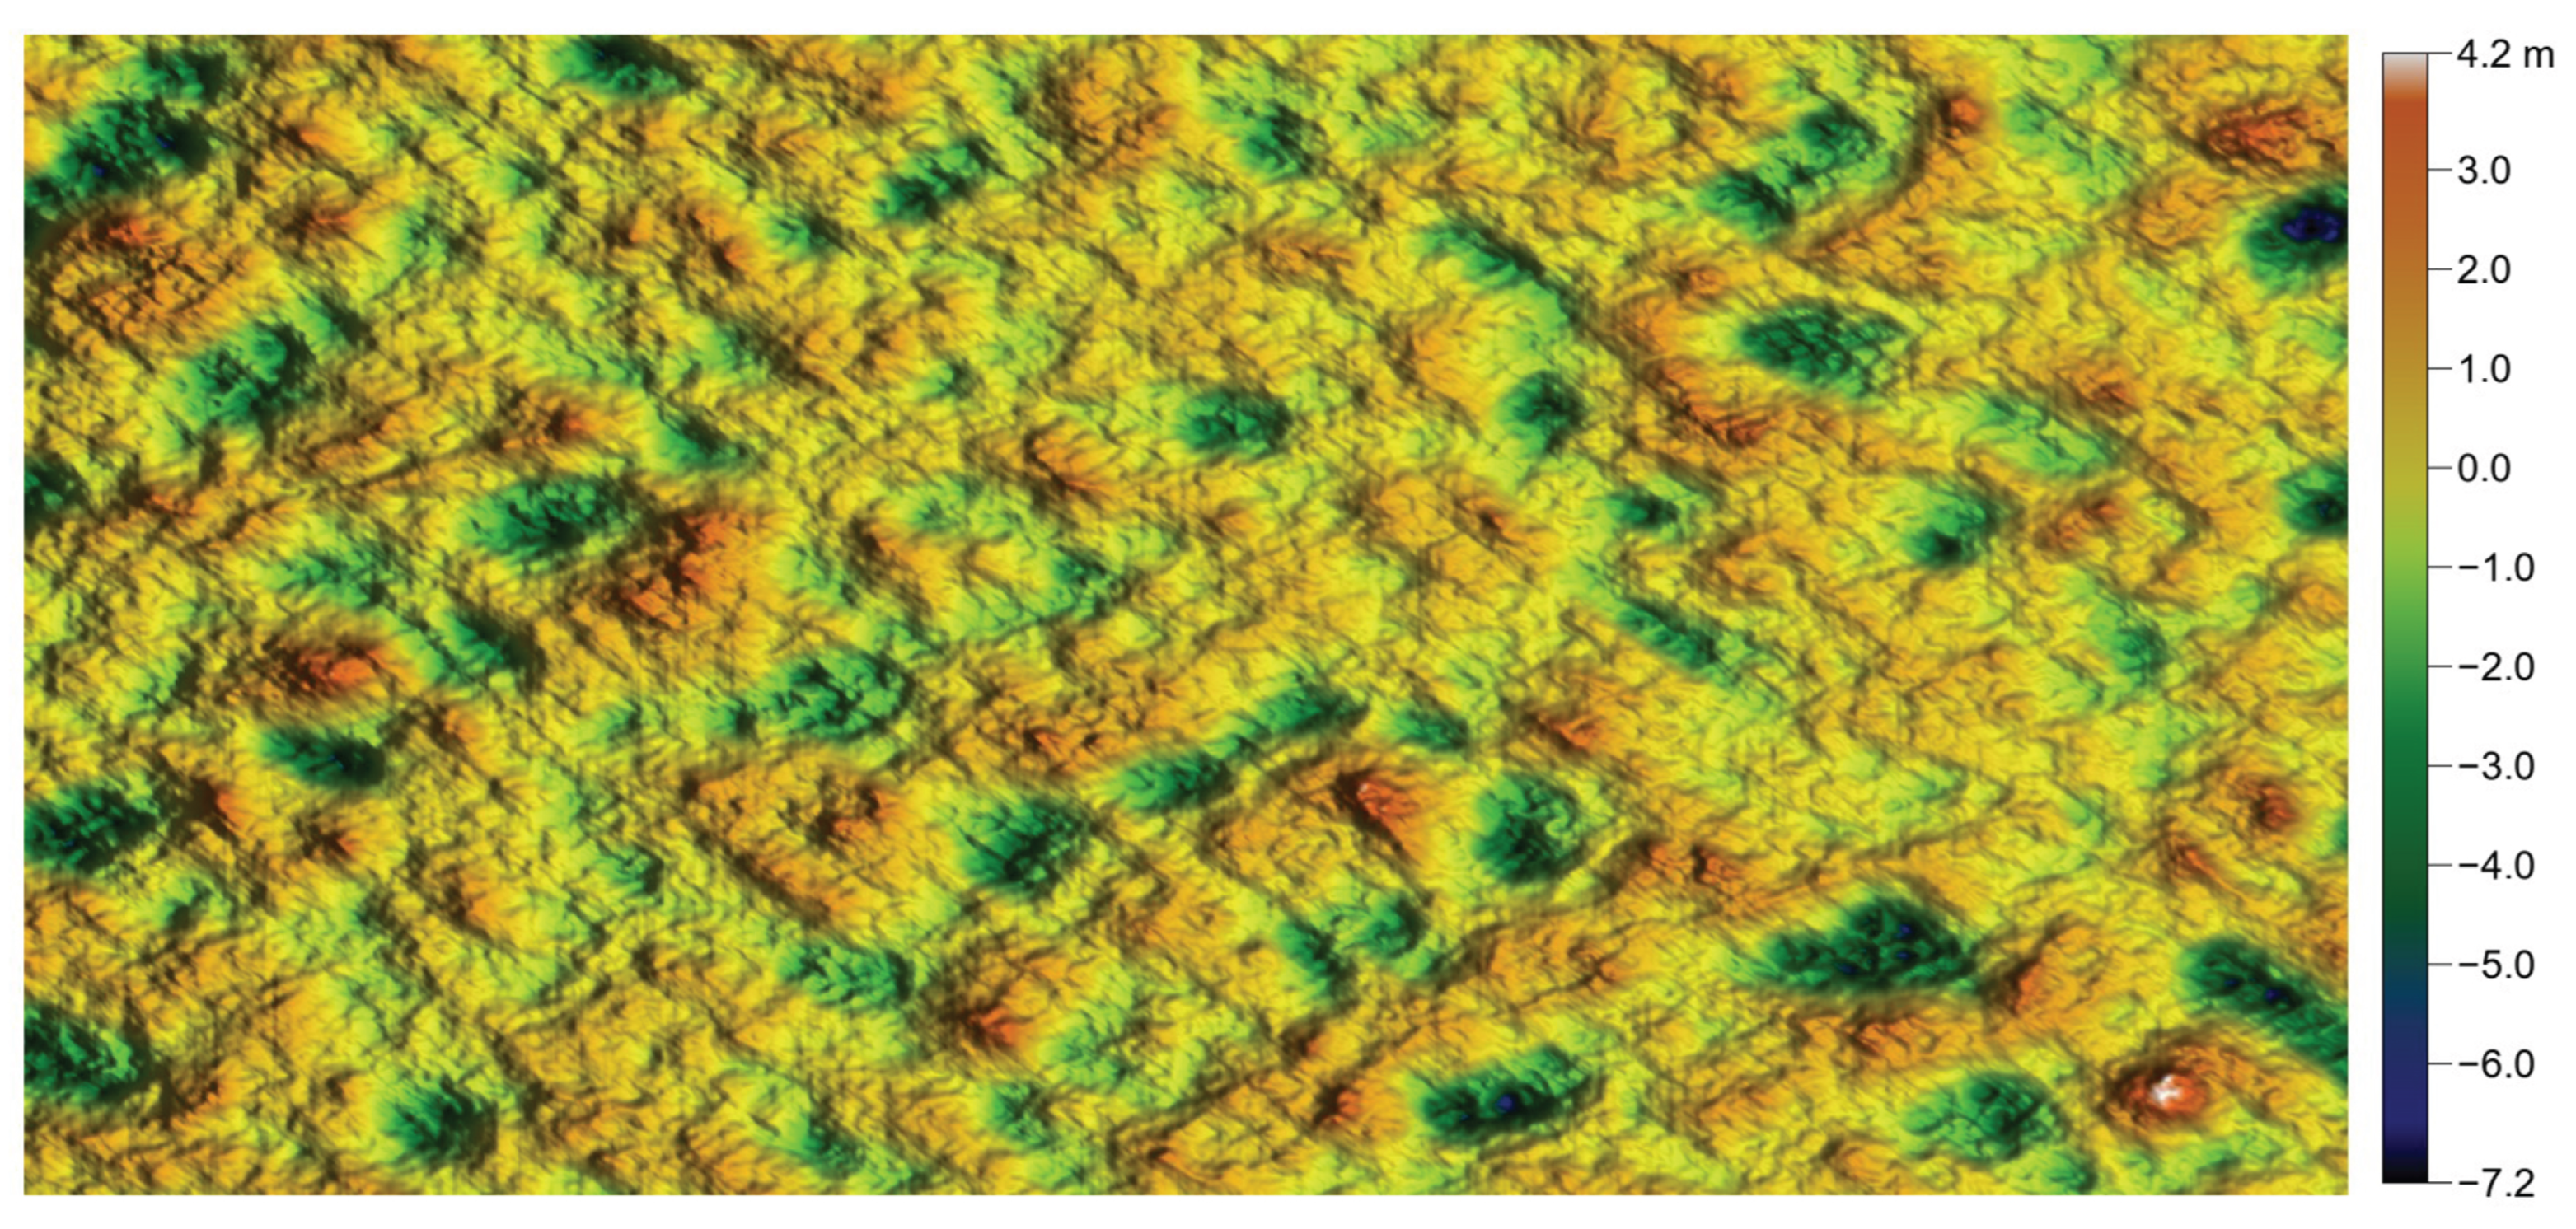
The rough surface to be generated has the following characteristics: w = 200   μ m, h = 100   μ m, μ = 0 , σ = 1 , S s k = 3 , S k u = 15 , α = 40 , l ξ = 30   μ m, l η = 10   μ m, z = 0.5 . It is immediately noticeable that the correlation lengths are large compared to the surface size, which suggests potential issues with realism in the generation process.
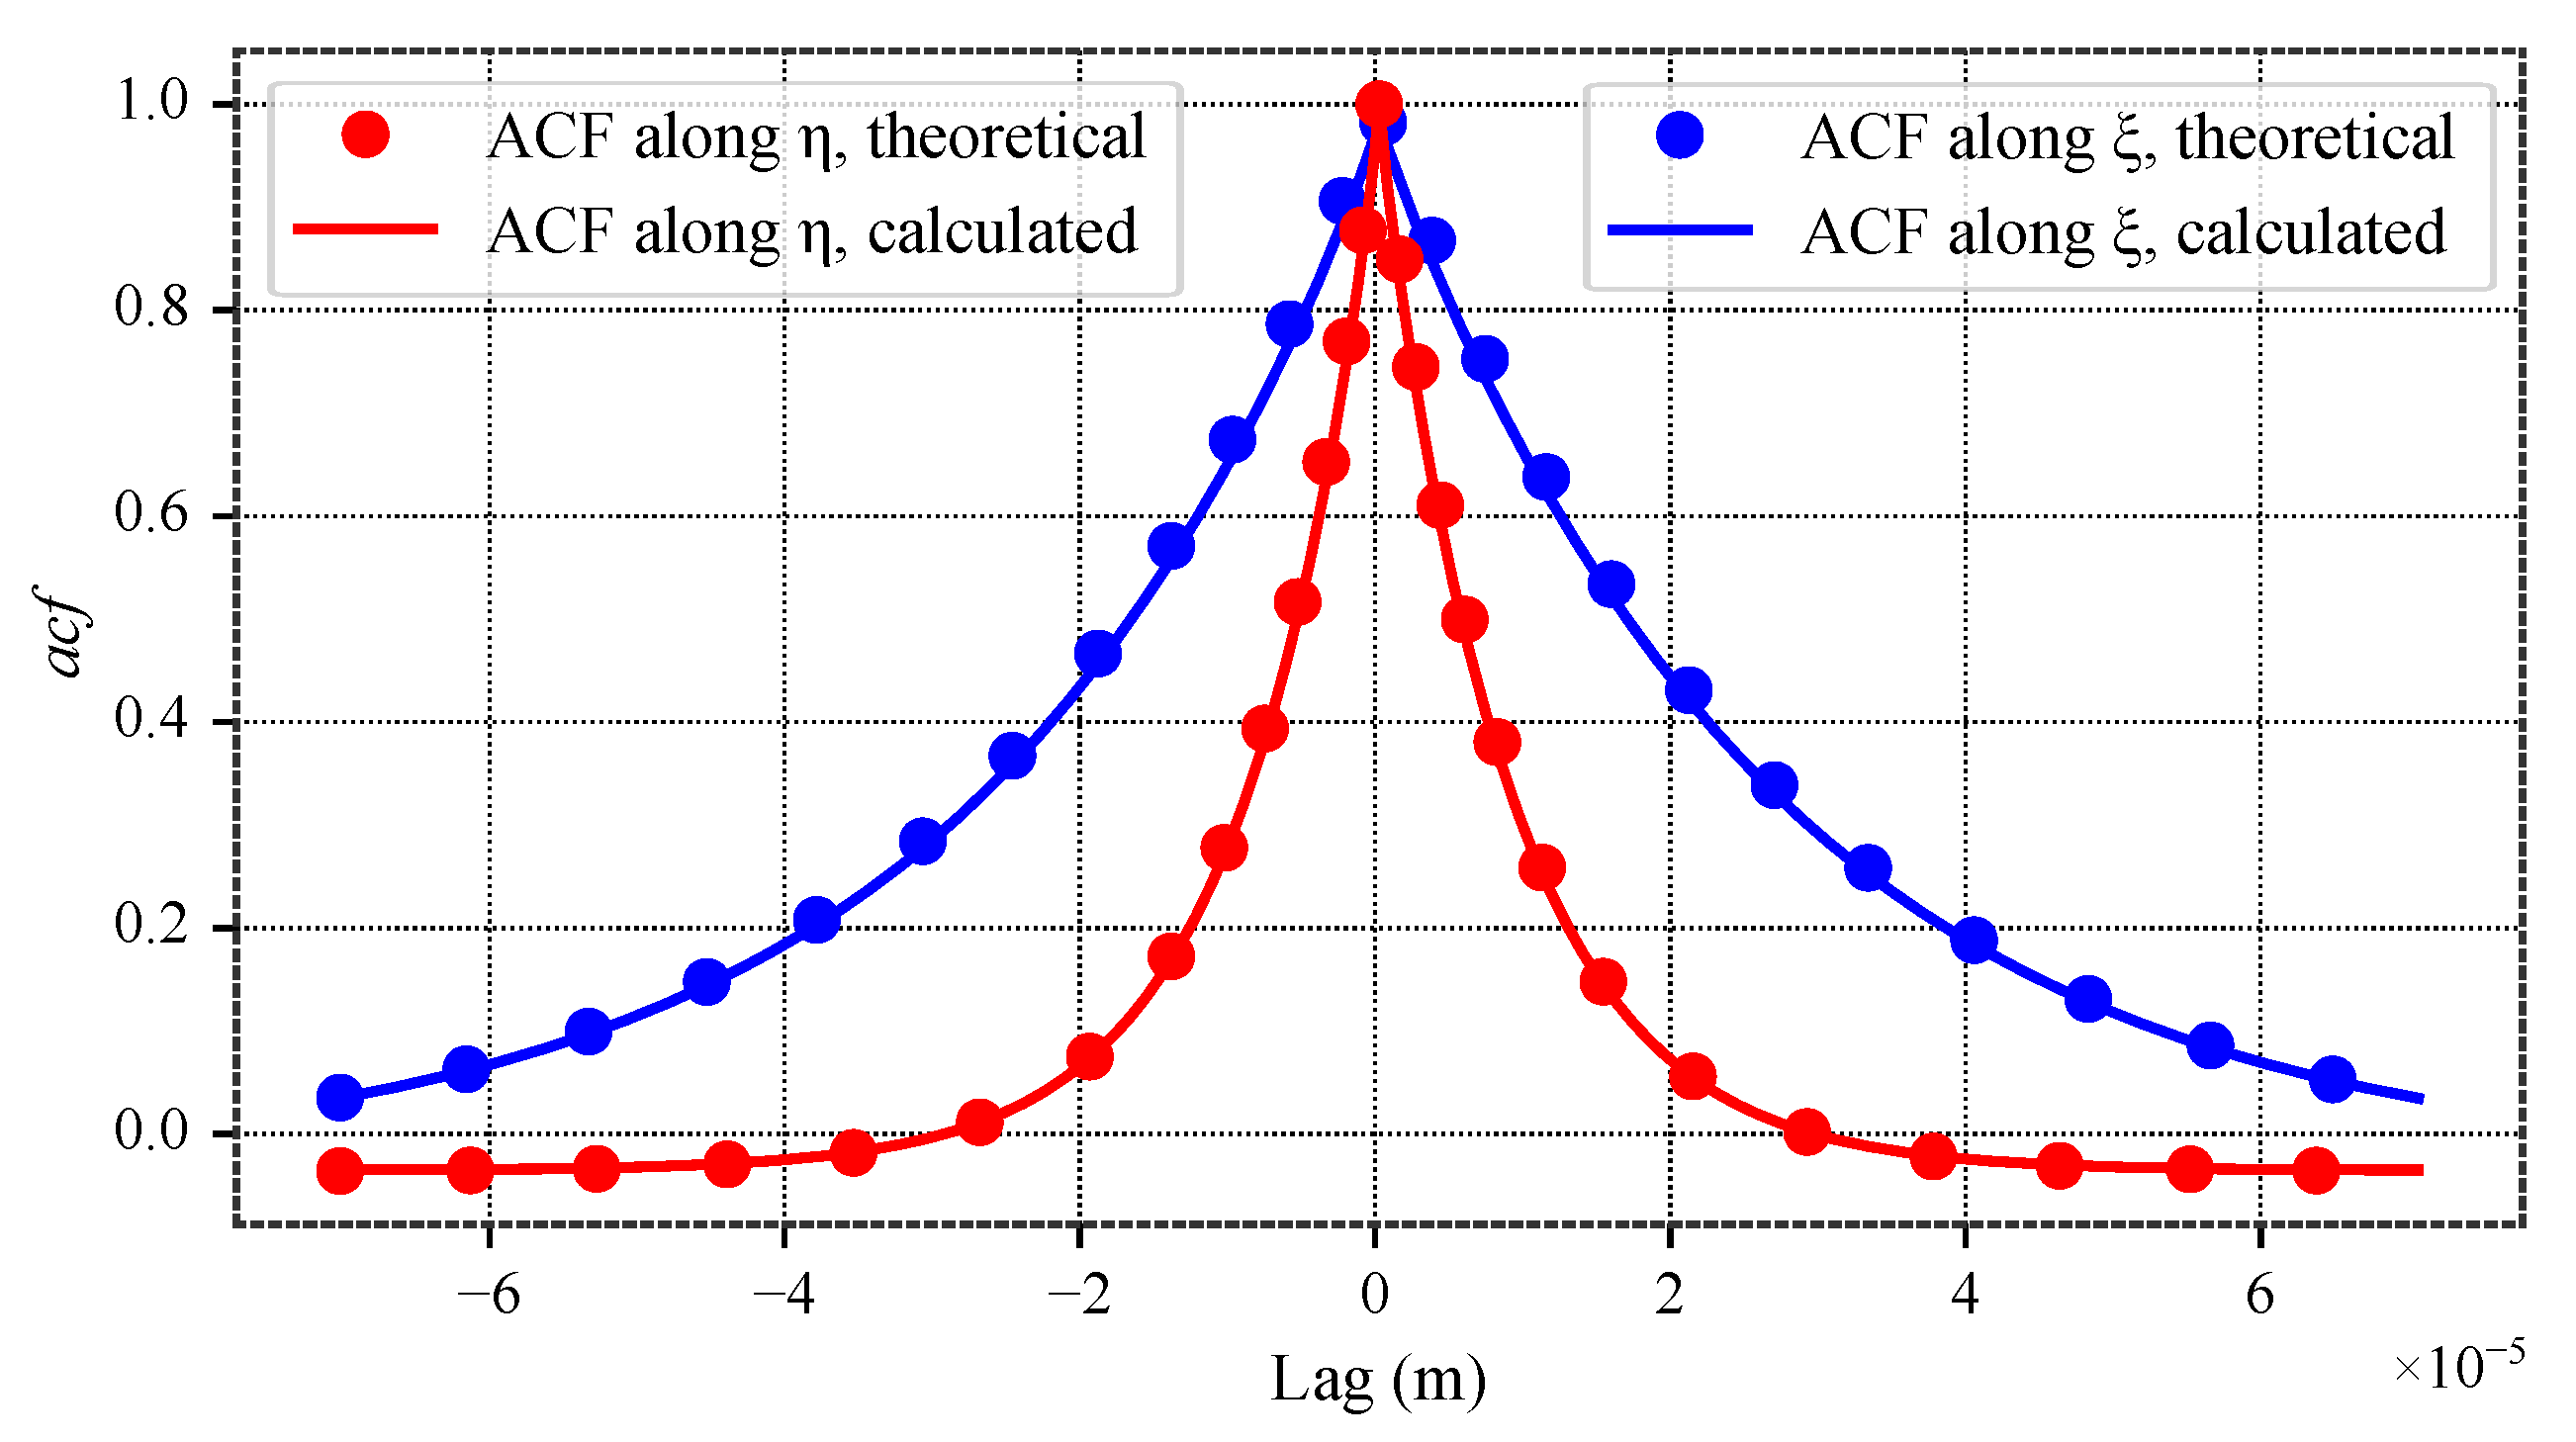
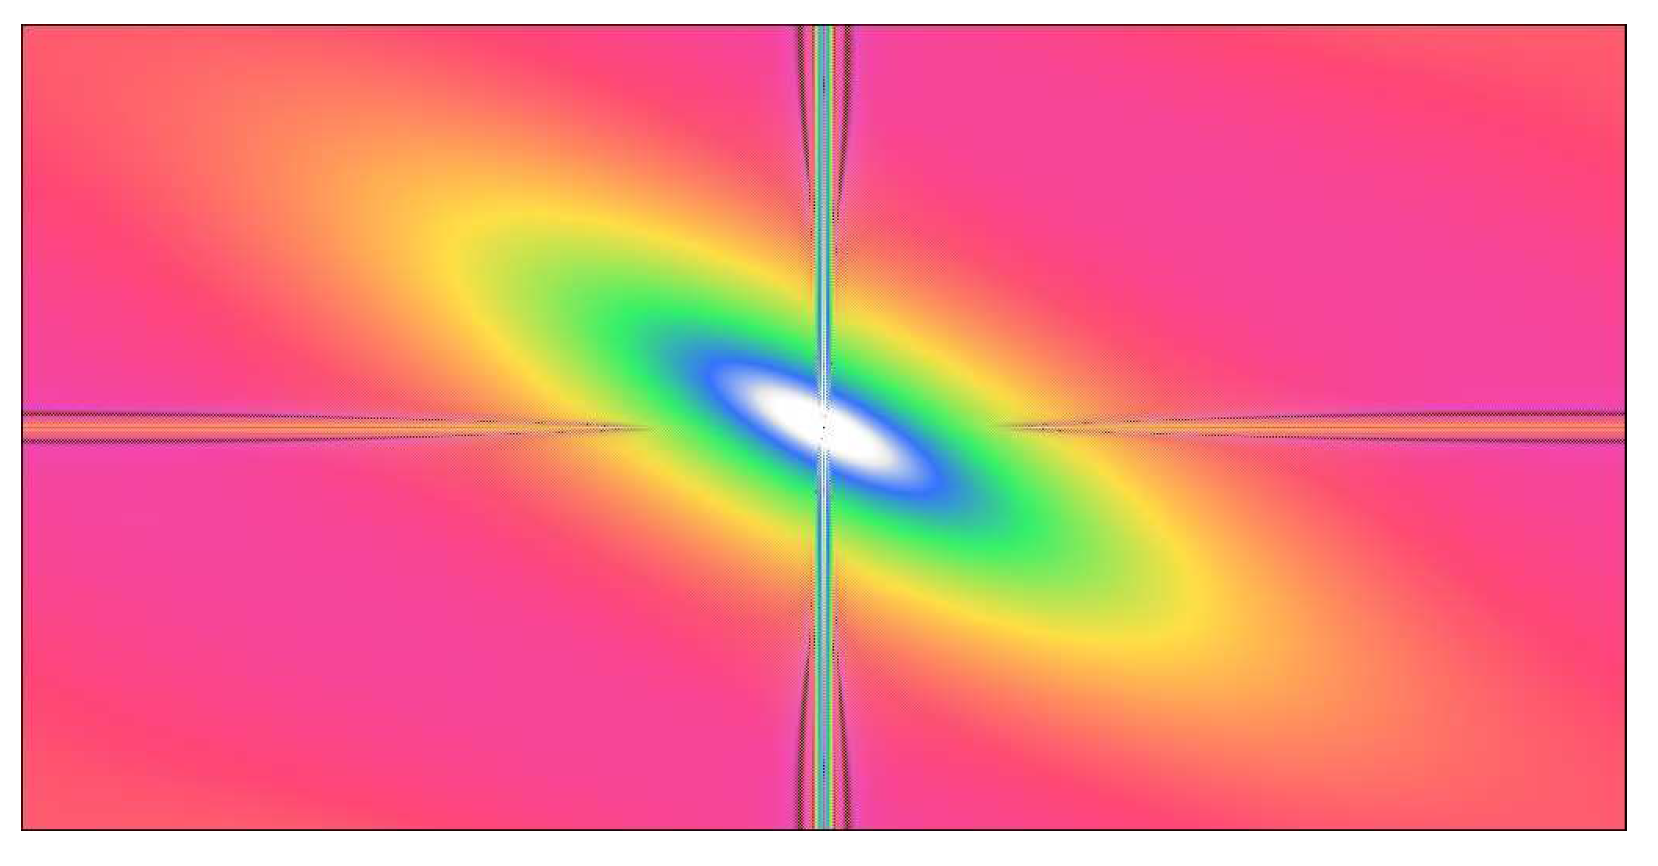
As seen in Figure 12, even though all parameters are strictly satisfied, as shown in Figure 13, the result is unsatisfactory. The reason is that the theoretical autocorrelation function is not periodic—see Figure 14—which induces spurious striations.
To overcome this difficulty, the autocorrelation function can be made periodic by applying a modified Tukey apodization function. The major advantage of the Tukey window lies in its flexibility: it provides an adjustable compromise between the frequency performance of the rectangular window—good resolution—and the strong attenuation of the Hann window—effective suppression of spurious high frequencies.
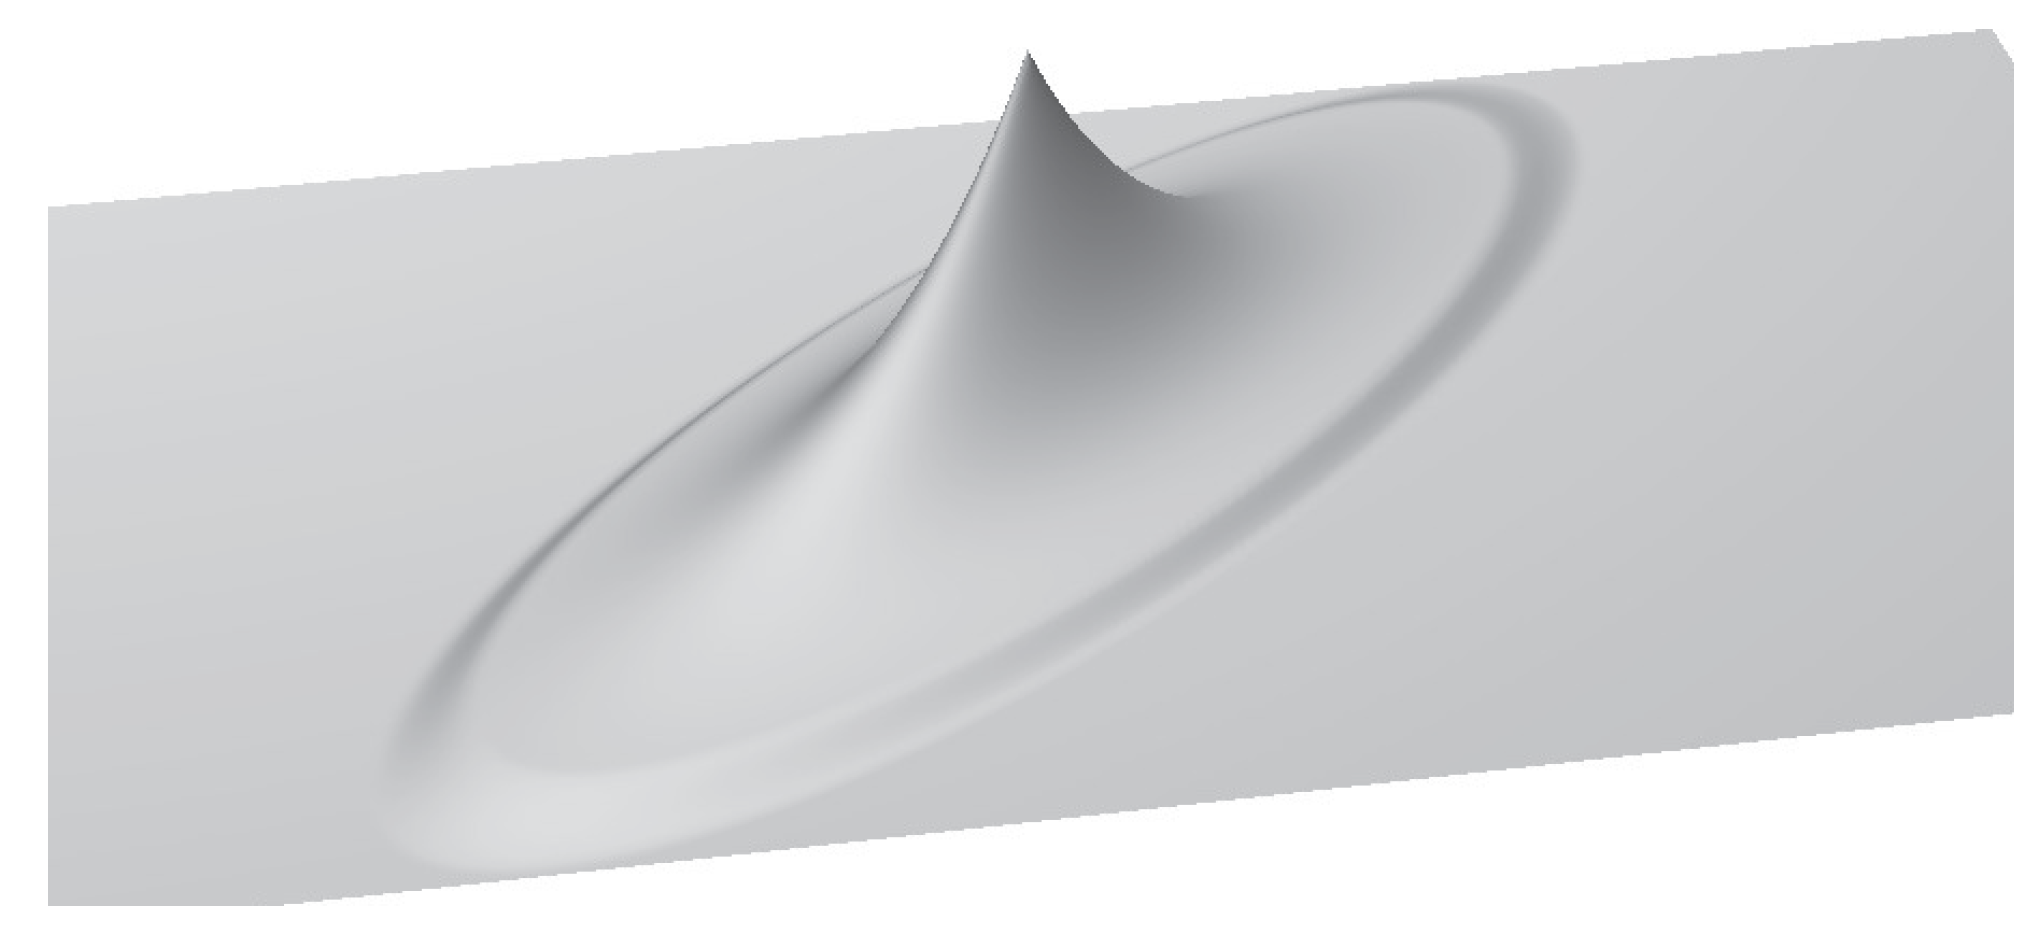
Here, the goal is to preserve both the surface orientation and the anisotropy factor in the windowing process. The modification of the Tukey window, therefore, consists of a product of cosines along the principal axes ( ξ , η ) of the a c f . More specifically, if we define an ellipse whose principal axes coincide with those of the a c f , and whose semi-axes are l ξ and l η , then for every point inside the ellipse the a c f remains unchanged, while outside it is attenuated according to the Tukey window, as shown on Figure 15.
Setting the boundaries of the a c f to zero enforces periodicity, and because the transitions are smooth, the unwanted striations become barely perceptible. As a result, the generated surface appears more realistic and a way to further enhance the realism of the generated surface is to initiate the iterative convolution/height-replacement process with a very smooth surface containing very few valleys. The resulting surface exhibits fewer scattered pits, as shown in Figure 16. It is worth noting that the statistical parameters and the autocorrelation function—for distances shorter than the correlation lengths—remain strictly identical.

3.1.2. Non-Periodic Surfaces

The use of FFT in the image generation process has the advantage of computational speed. The drawback, however, is the periodicity of the resulting surfaces. A relatively simple way to circumvent this issue is to generate a surface larger than the desired size—taking into account the correlation lengths—and then extract a sub-surface of the correct dimensions, whose spatial parameters are closest to the imposed values.
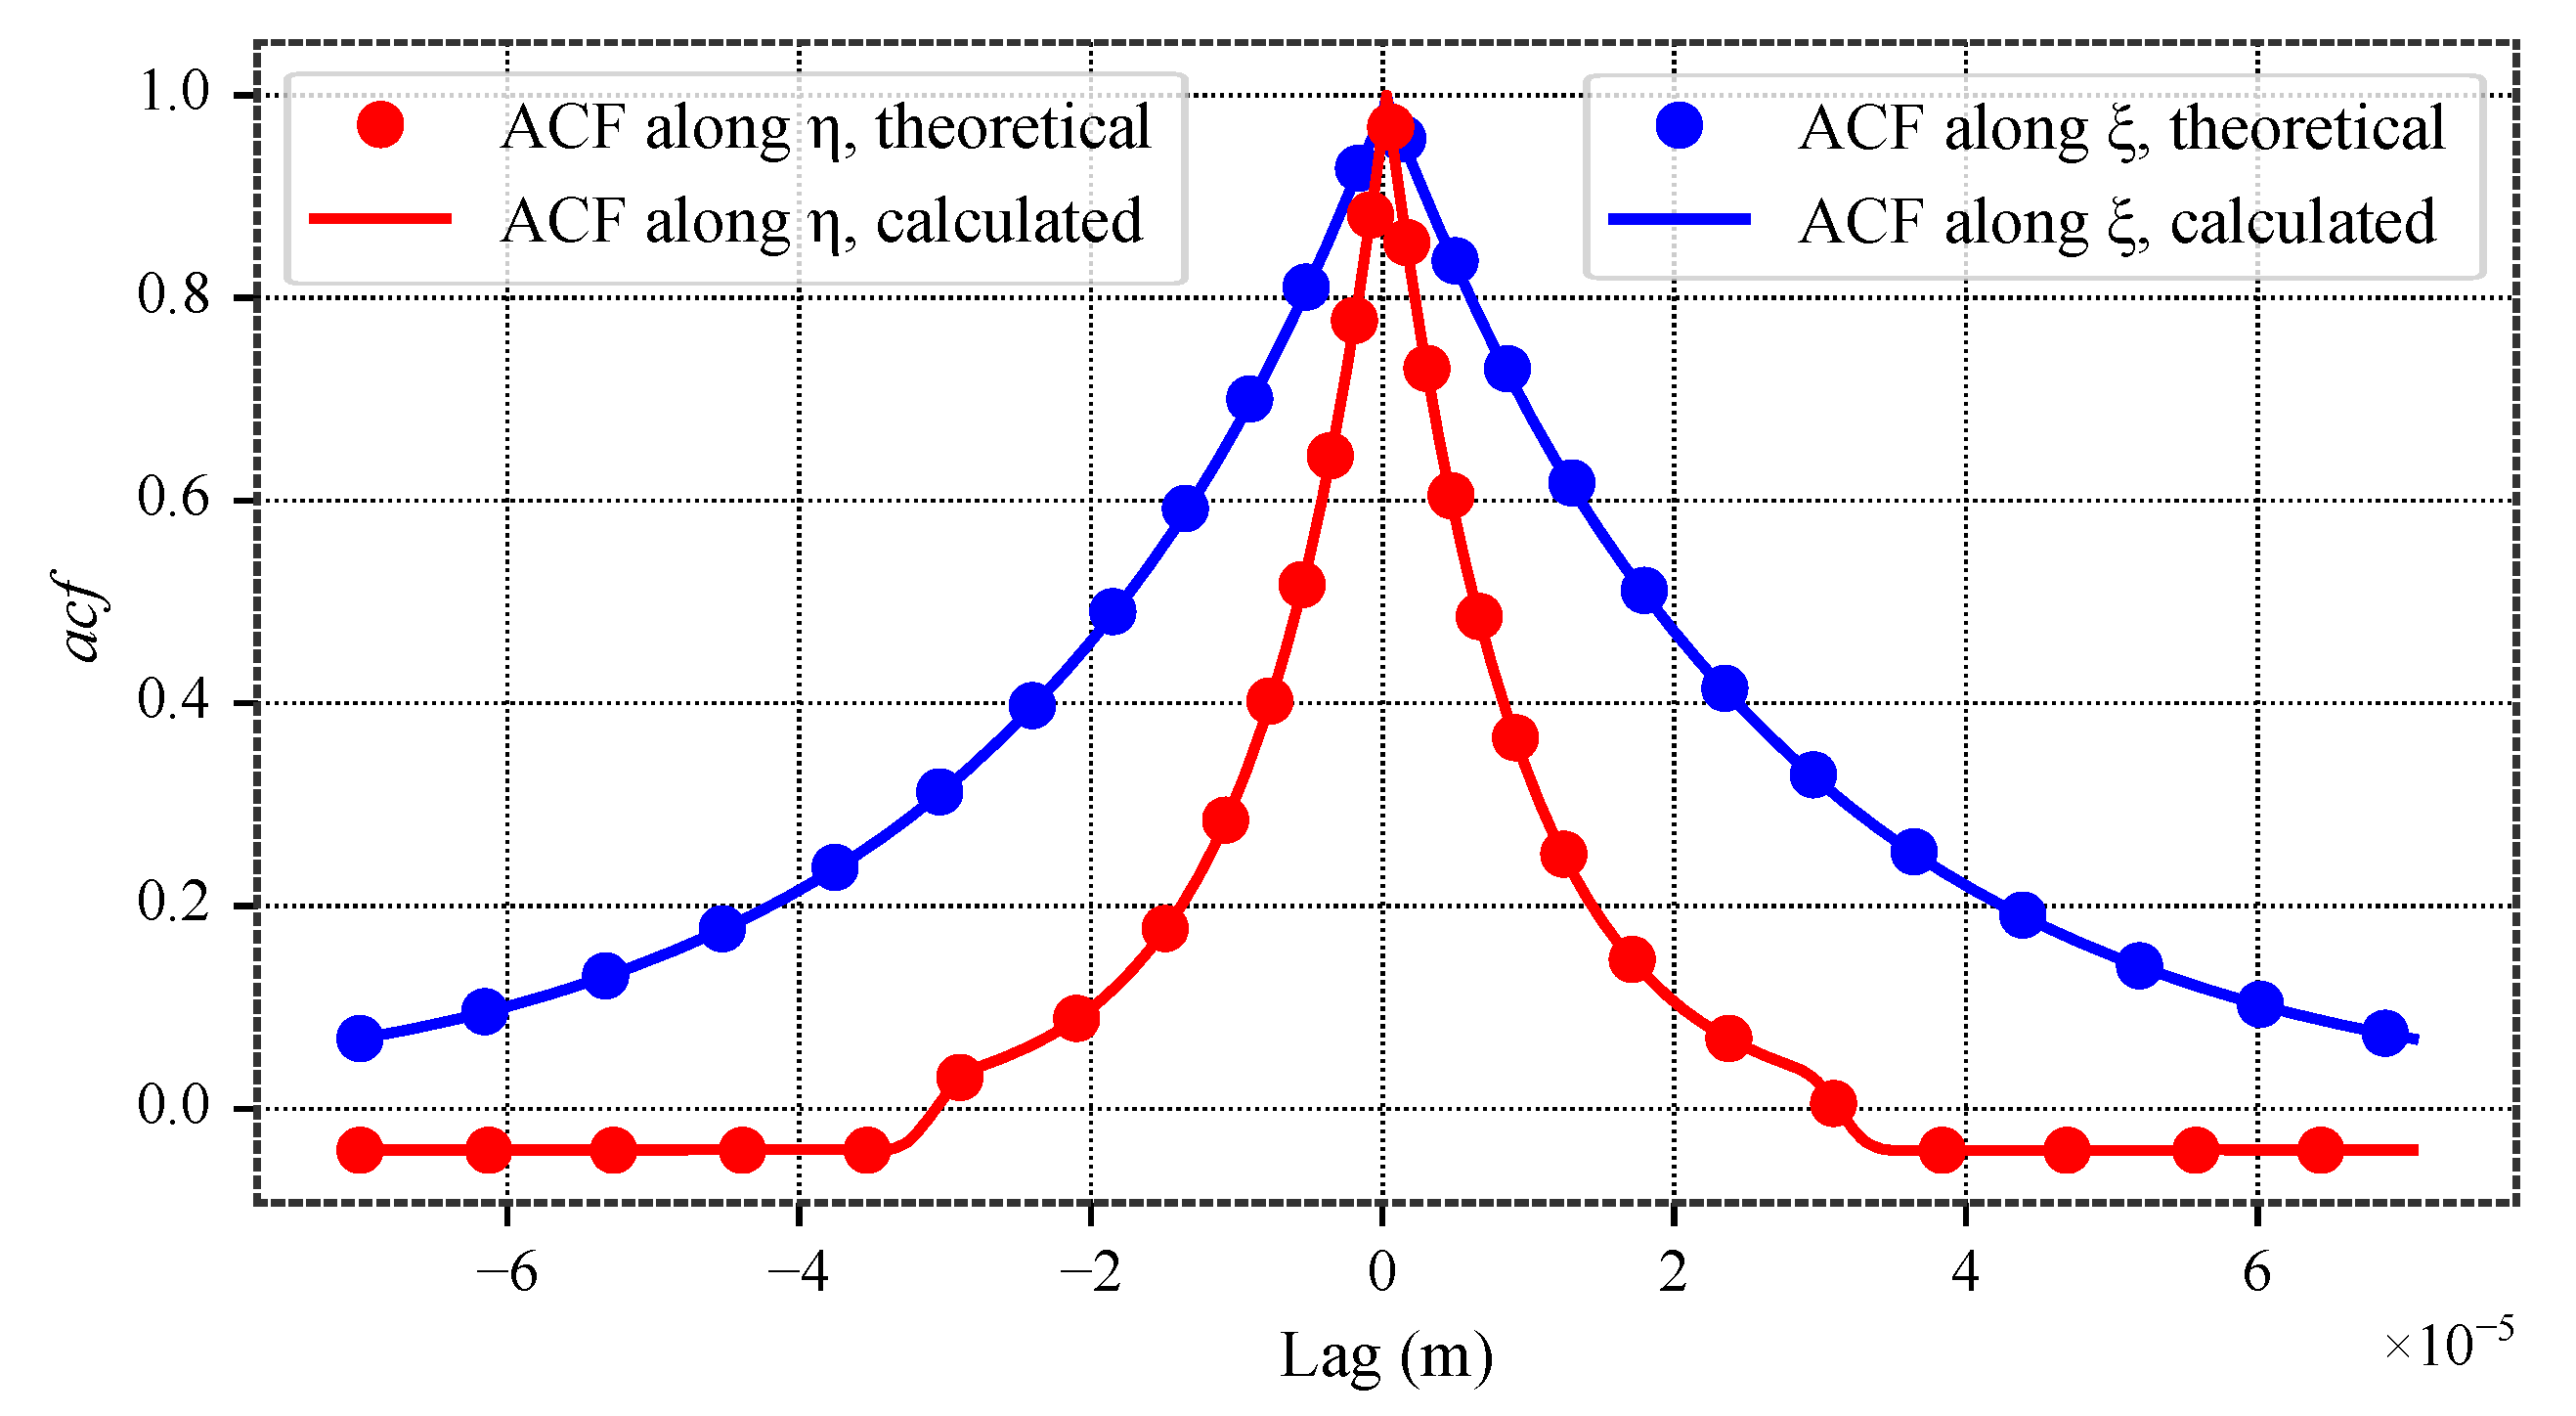
In Figure 17, it can be observed that the realism of the surface has not been affected and that, clearly, the surface is no longer periodic. The statistical parameters strictly match the imposed values, and as shown in Figure 18, the autocorrelation function also remains consistent with the theoretical one. It should be noted, however, that discrepancies between the obtained a c f and the imposed a c f may appear when moving significantly away from the center, beyond the correlation lengths.

3.2. Reproducing Real Rough Surfaces

At the scale of a few tens of microns, surfaces resulting from industrial material removal processes often appear rather homogeneous, even in the presence of anisotropy. Reproducing a fairly homogeneous surface, even an anisotropic one, is not a challenge in itself, although, as we will see, fine scratches require specific handling. Across all the test surfaces shown in the Figure 10, only the rotor surface is not homogeneous at the scale of correlation lengths, which represents a challenge when using convolutions. Indeed, the use of convolution in the surface generation process tends to homogenize the resulting topography, but progressive wear can create local flat areas.
The dental surface is preferentially used to test the capabilities of the developed algorithm, since it is the most difficult to faithfully reproduce. However, the other surfaces will also be used, as each has its own specific features. The steps of the algorithm are almost identical to those used for generating surfaces from the parameters S s k , S k u , l ξ , and l η . The essential difference is that the height dataset is retrieved along with the autocorrelation function a c f .
The direct consequence of restoring the original heights and reinjecting them into the final surface at the last step is that all height parameters are strictly identical between the original and the reproduced surfaces. Therefore, it is unnecessary to compare them before and after reconstruction. Regarding the a c f , the situation is slightly different, as the reinjection of the original heights may alter it. Nevertheless, since the algorithm iteratively enforces compliance with the condition a c f ( x , y ) 0.5 , the resulting a c f remains highly consistent with the original one. Other types of parameters are also worth measuring. The parameter S h is a simple, yet non-standard, quantity, which represents the percentage of surface facets whose normals lie within a cone of 5° half-angle at the apex. It provides an intuitive indicator of the surface flatness. A comparison that appears particularly relevant concerns the fractal parameters—as designated in ISO 25178—as they account for both the surface heights and their spatial arrangement. We have selected two such parameters: S d r and S a s f c . The first corresponds to the developed interfacial area ratio, or more precisely, the excess relative area. The rougher the surface, the higher the S d r value. The second parameter follows the same principle, but the calculation is performed across the different wavelength scales of the surface. The parameter S a s f c is commonly regarded as a measure of surface complexity [1].

3.2.1. Basic Surface Reproduction

The idea is simply to follow, in broad terms, the approach illustrated in Figure 1. The difference is that the heights do not need to be generated, since those from the original surface are used, along with its autocorrelation function. Consequently, Block 1 is replaced by the retrieval of the heights and the autocorrelation function. Following this approach, all requirements are met: the statistical moments are obviously identical, and the autocorrelation function is also preserved, as shown in Figure 19.
The main limitation of this method, in its raw form, is primarily visual, as can be clearly seen in Figure 20. The unwanted folds parallel to x and y are caused by the autocorrelation function. Indeed, this function is obtained through FFT, which inherently assumes the periodicity of the surface, whereas no such periodicity exists naturally. The consequence is a discontinuity at the edges of the surface, manifesting as these folds. This phenomenon is referred to as spectral leakage.
A first improvement therefore consists in making the surface periodic for the computation of the autocorrelation function.

3.2.2. Windowing the Surface to Be Reproduced

The simplest method is the addition of a windowing function—or apodization—which consists of attenuating the heights progressively as one approaches the edges. This is not without consequences on the height spectrum, but given the poor quality of the generated surfaces, the benefit/risk balance leans in favor of its use. It should be noted that apodization is applied only for the determination of the autocorrelation function.
Table 4 clearly illustrates the effect of windowing on the original a c f , as the correlation lengths, the texture aspect ratio, and the main orientation are altered. By contrast, the original height distribution is preserved.
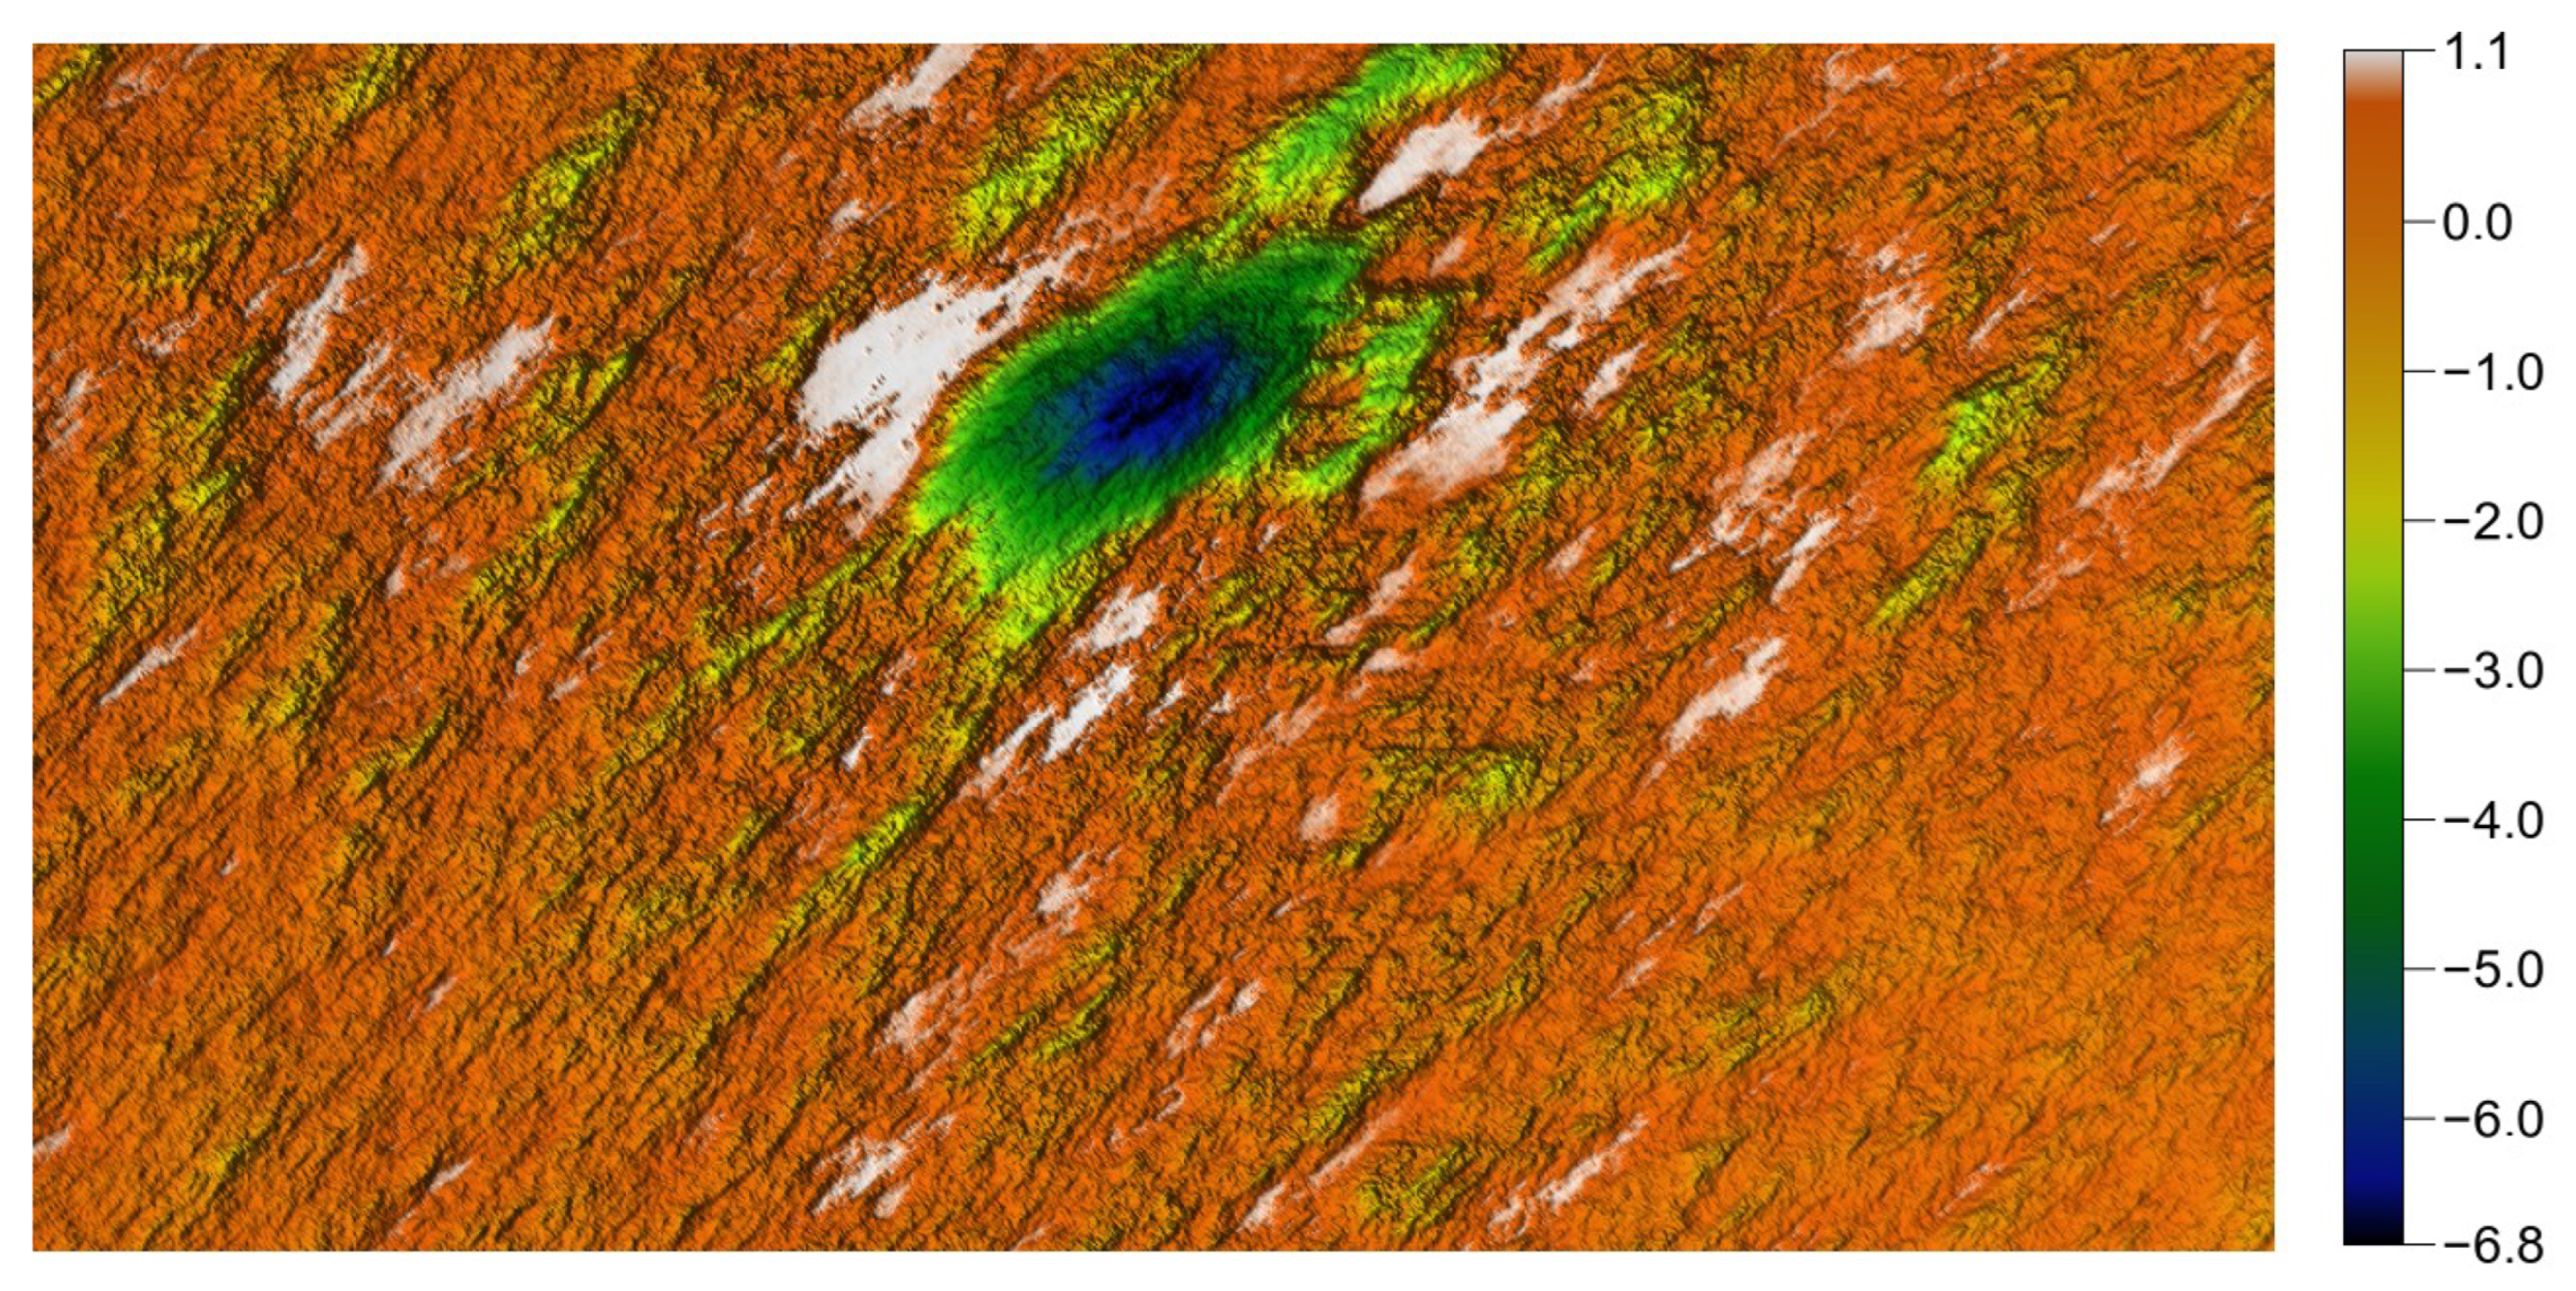
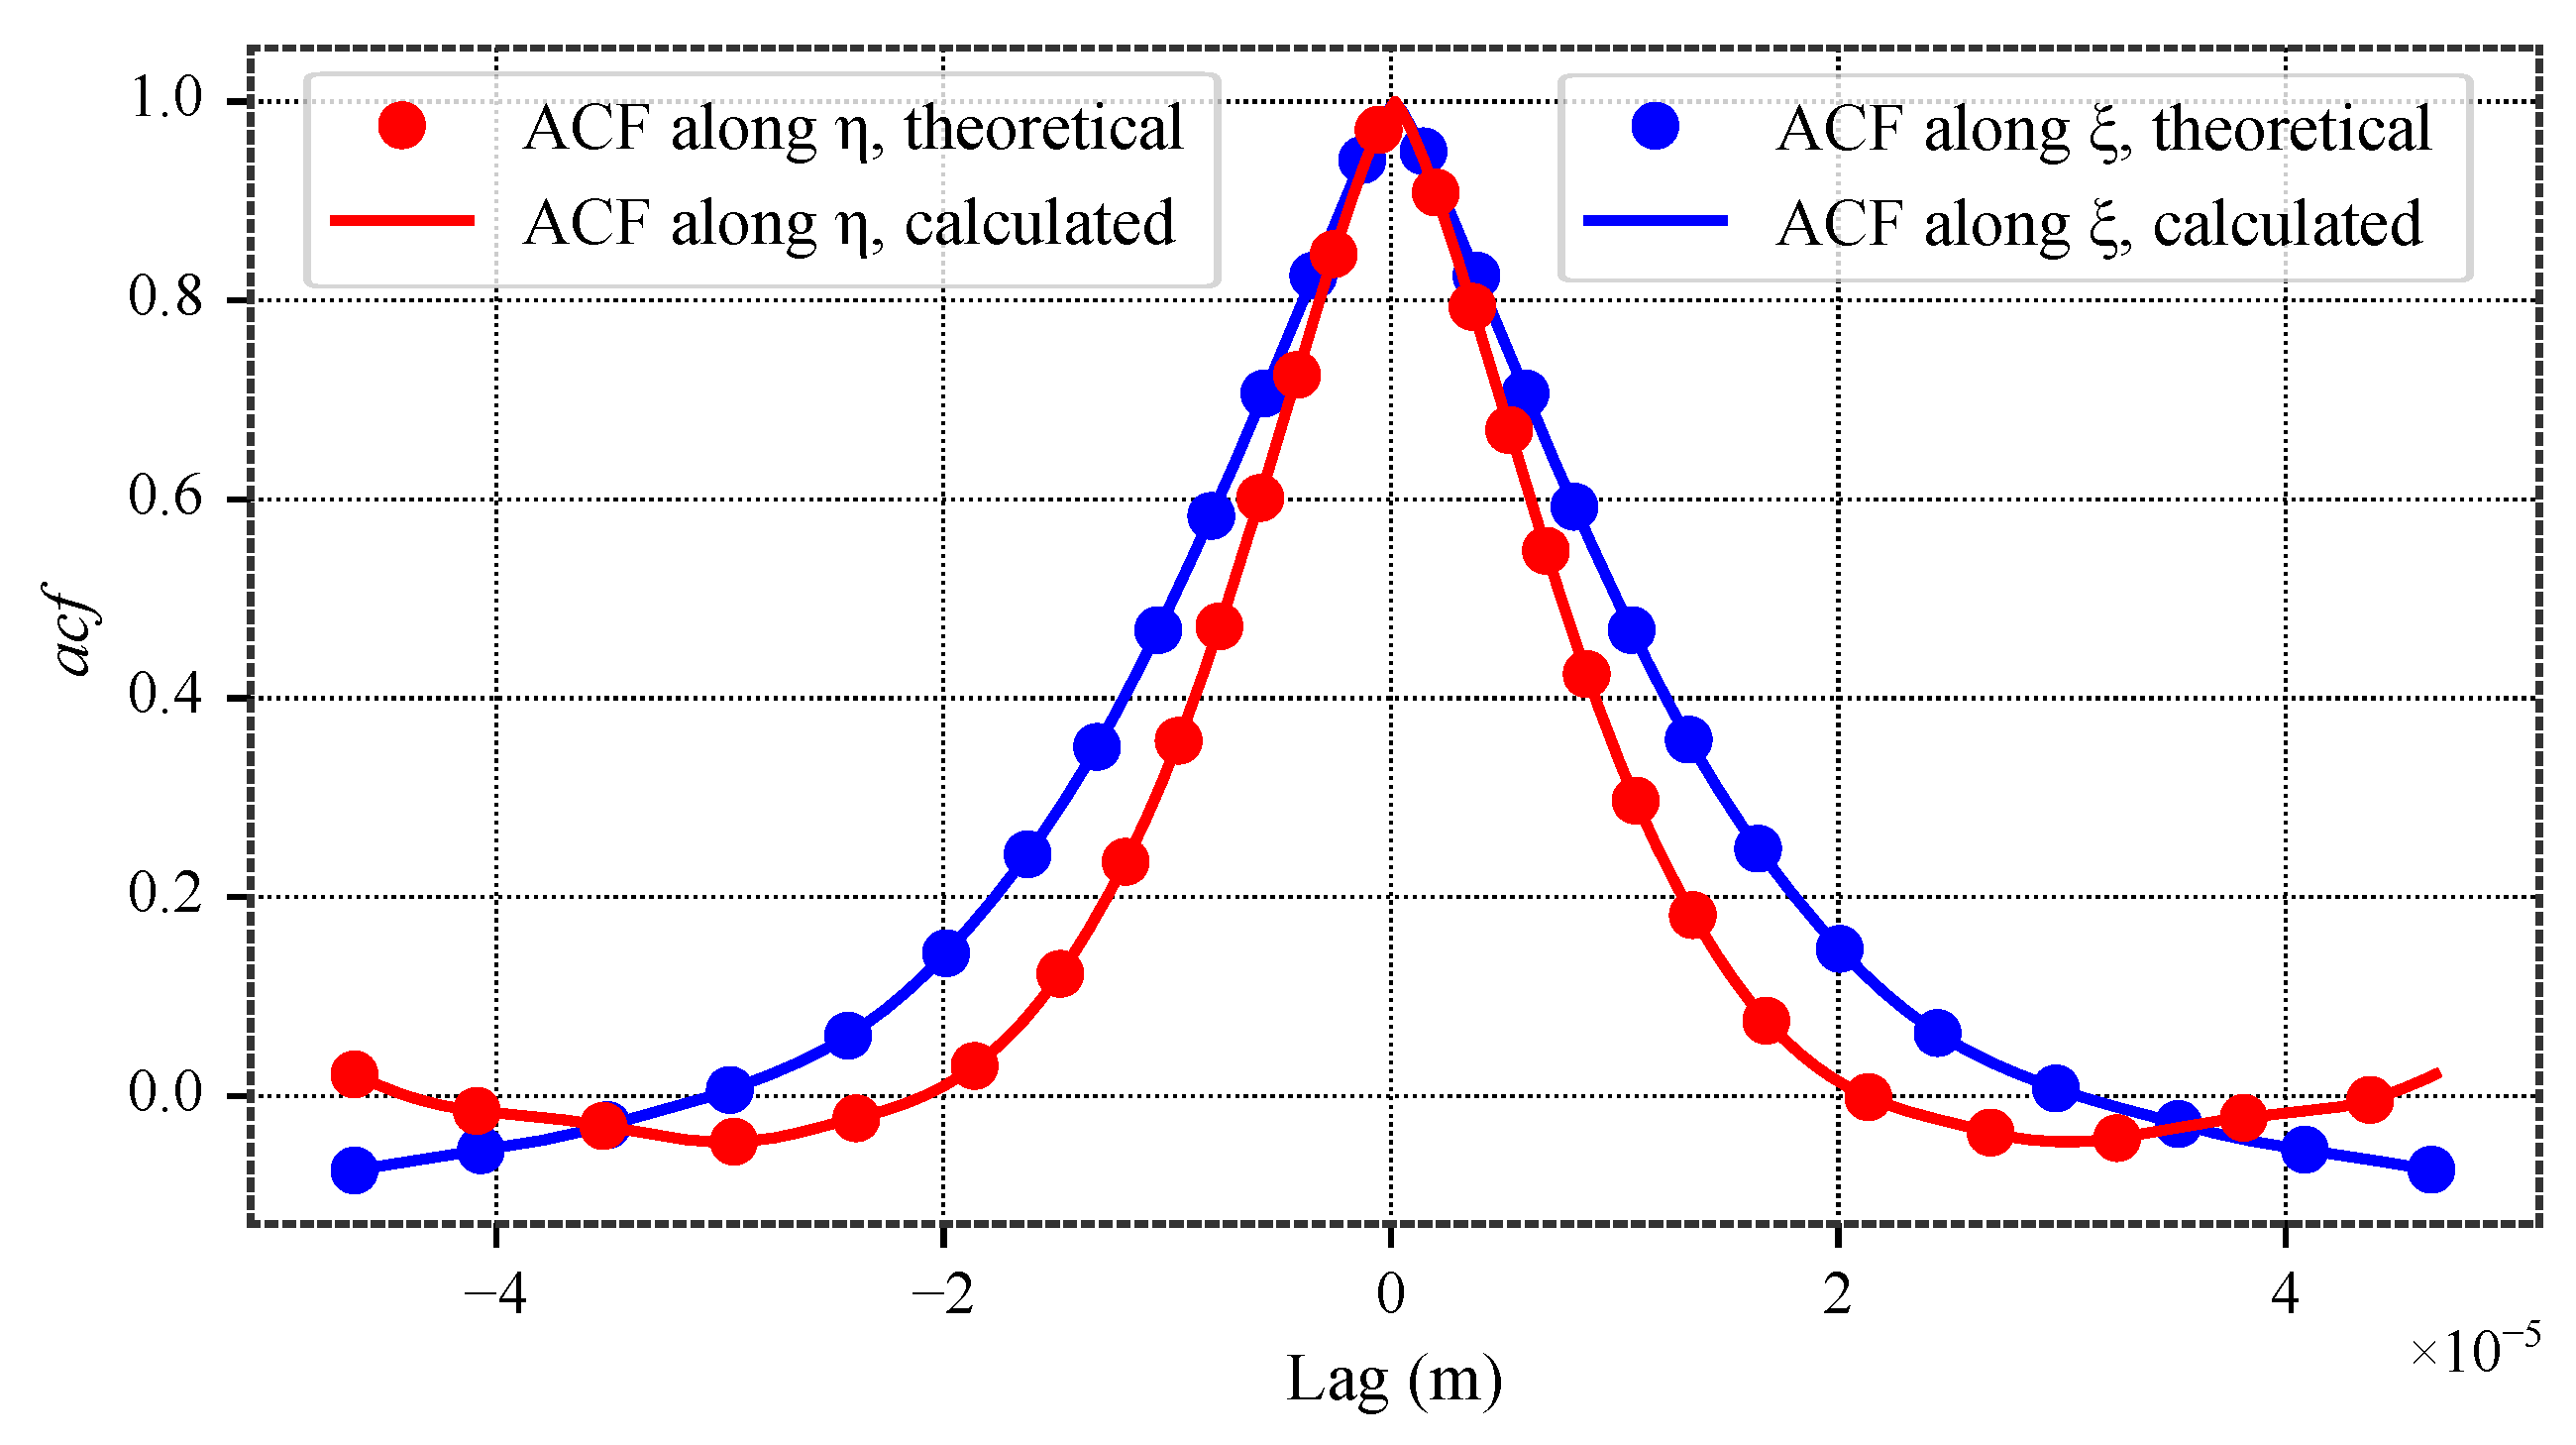
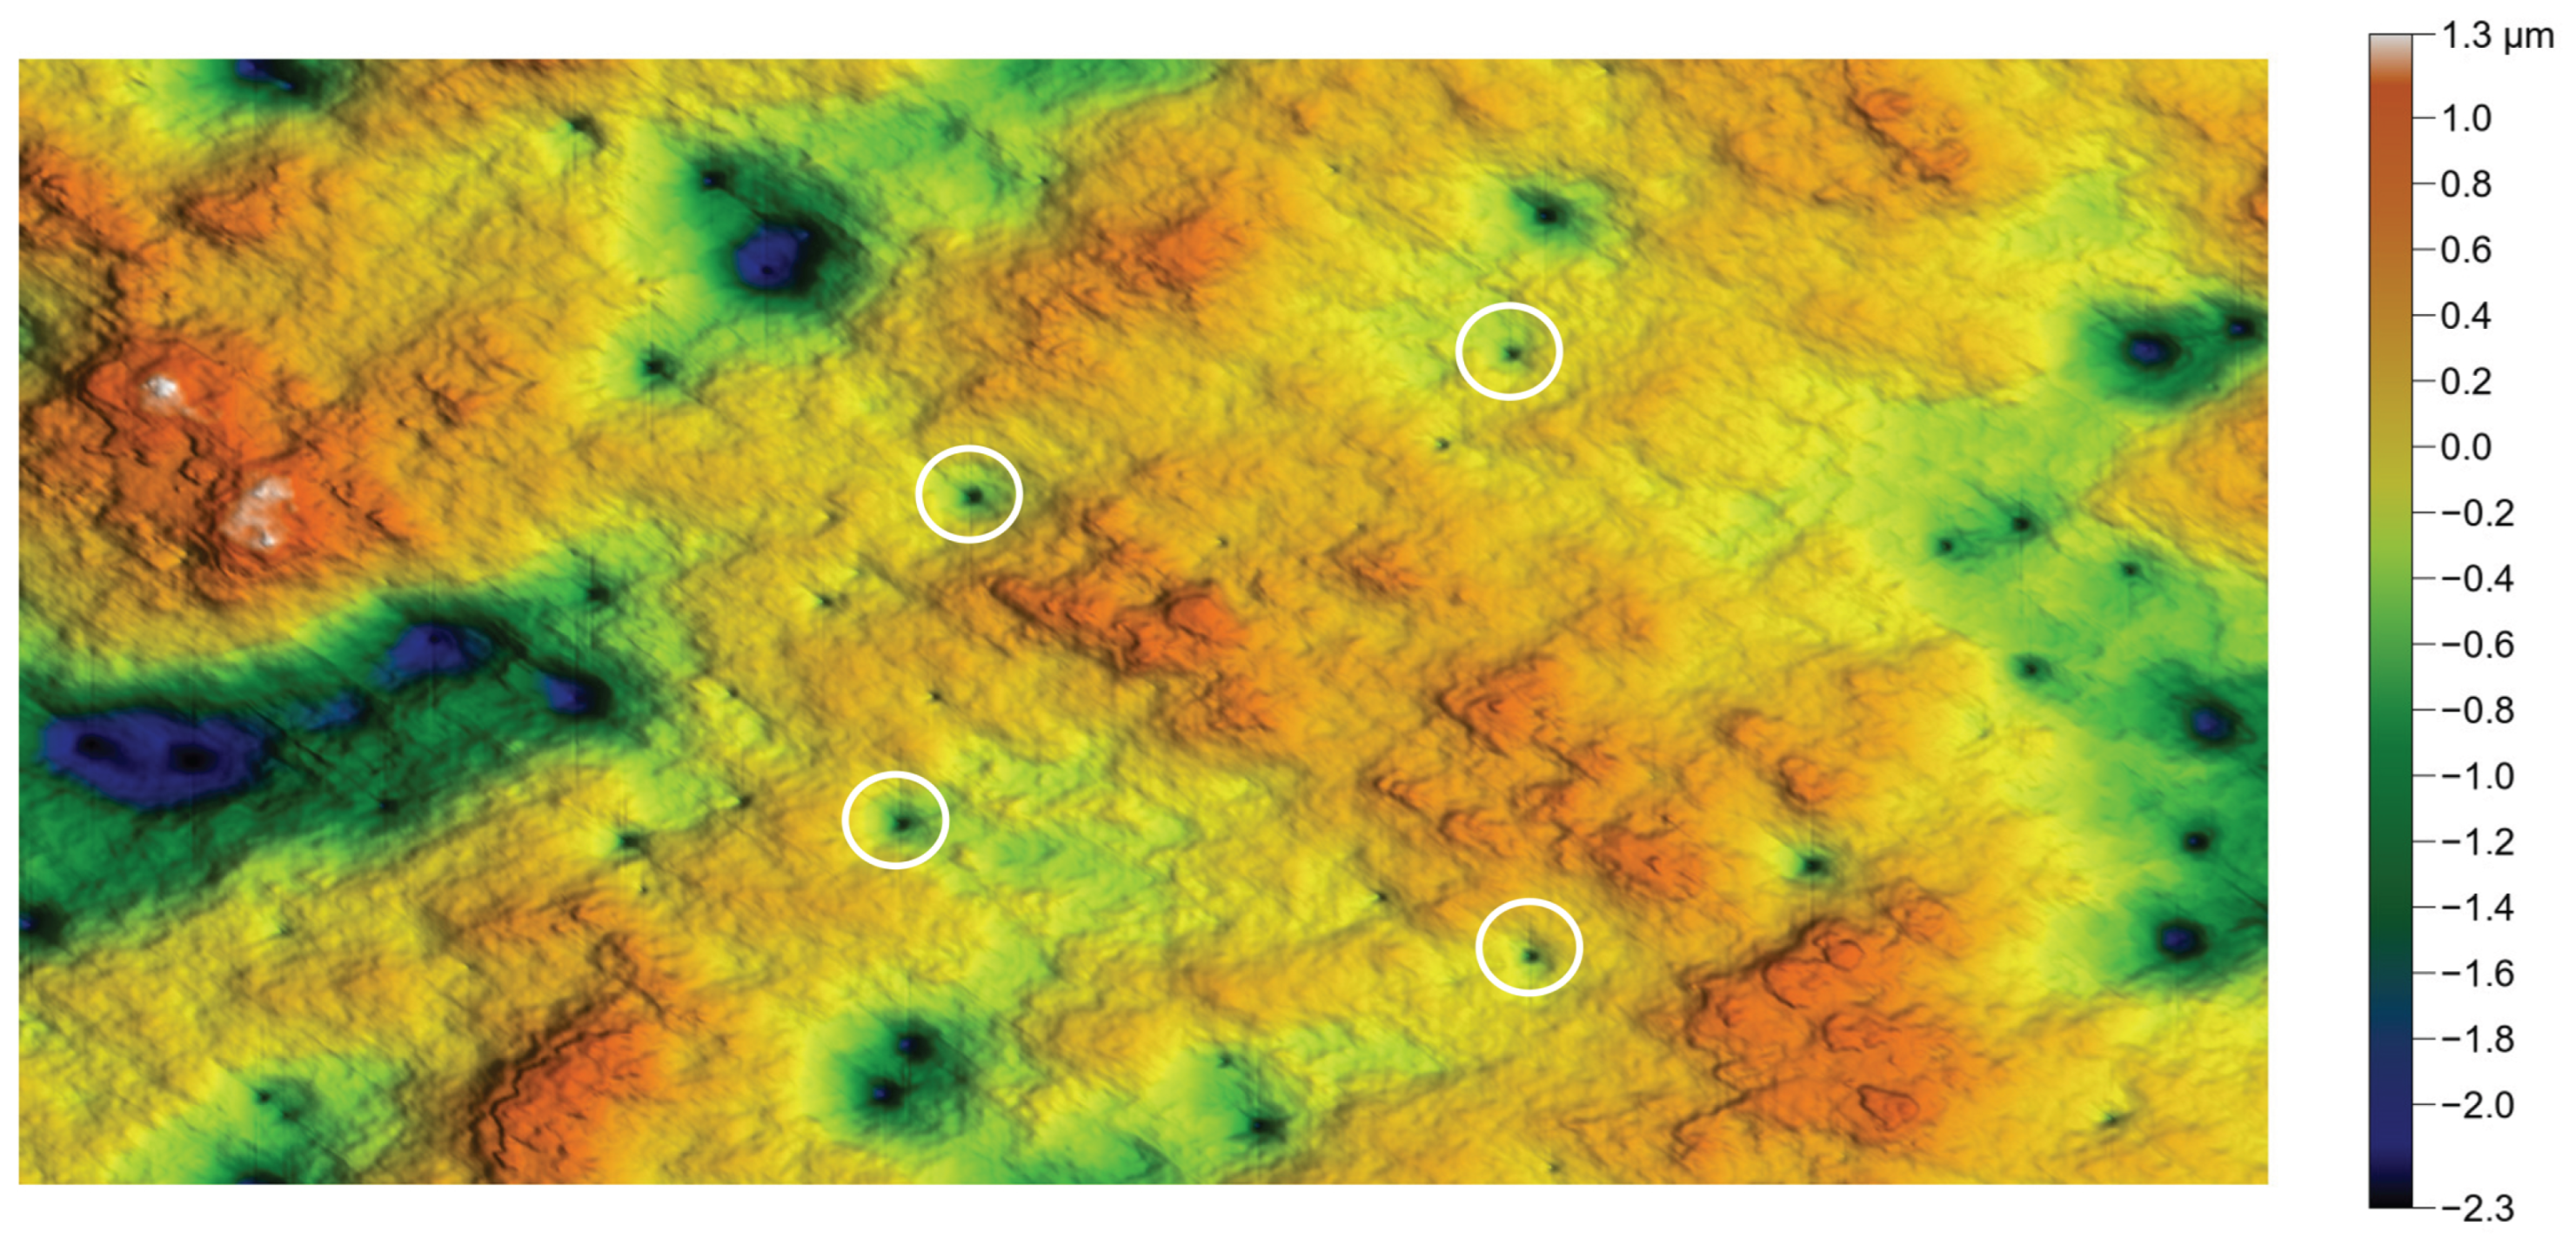
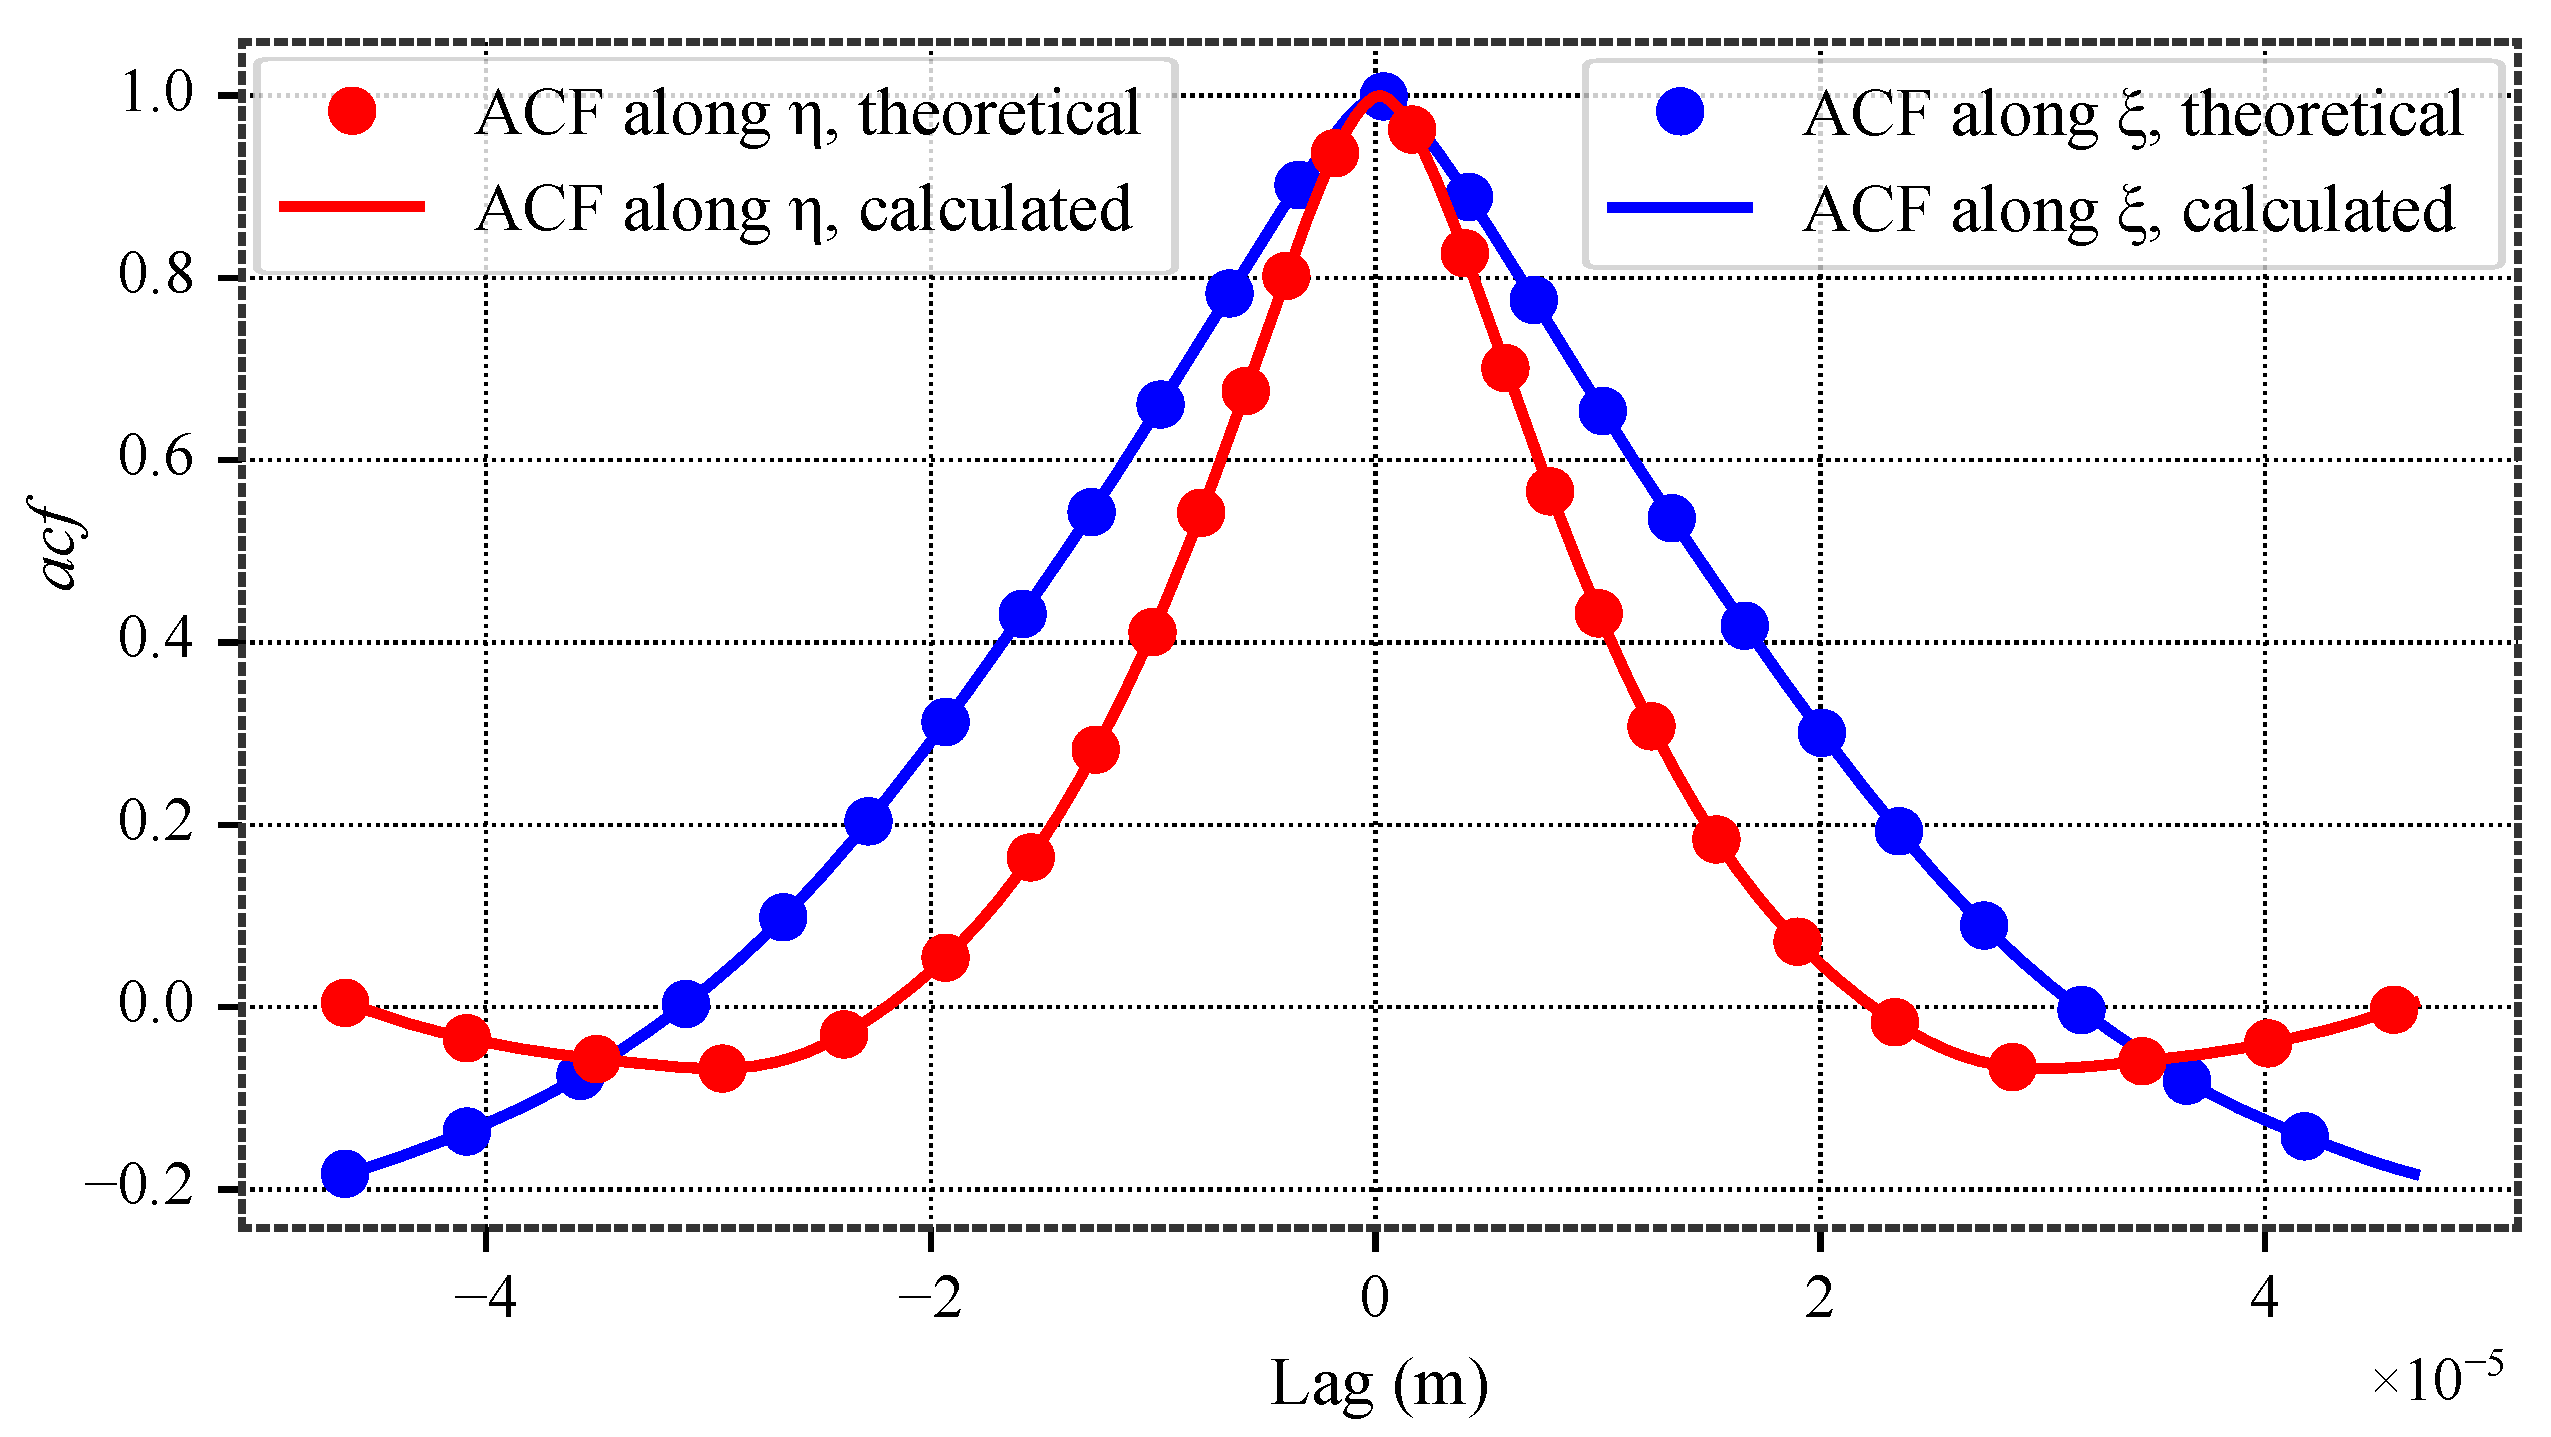
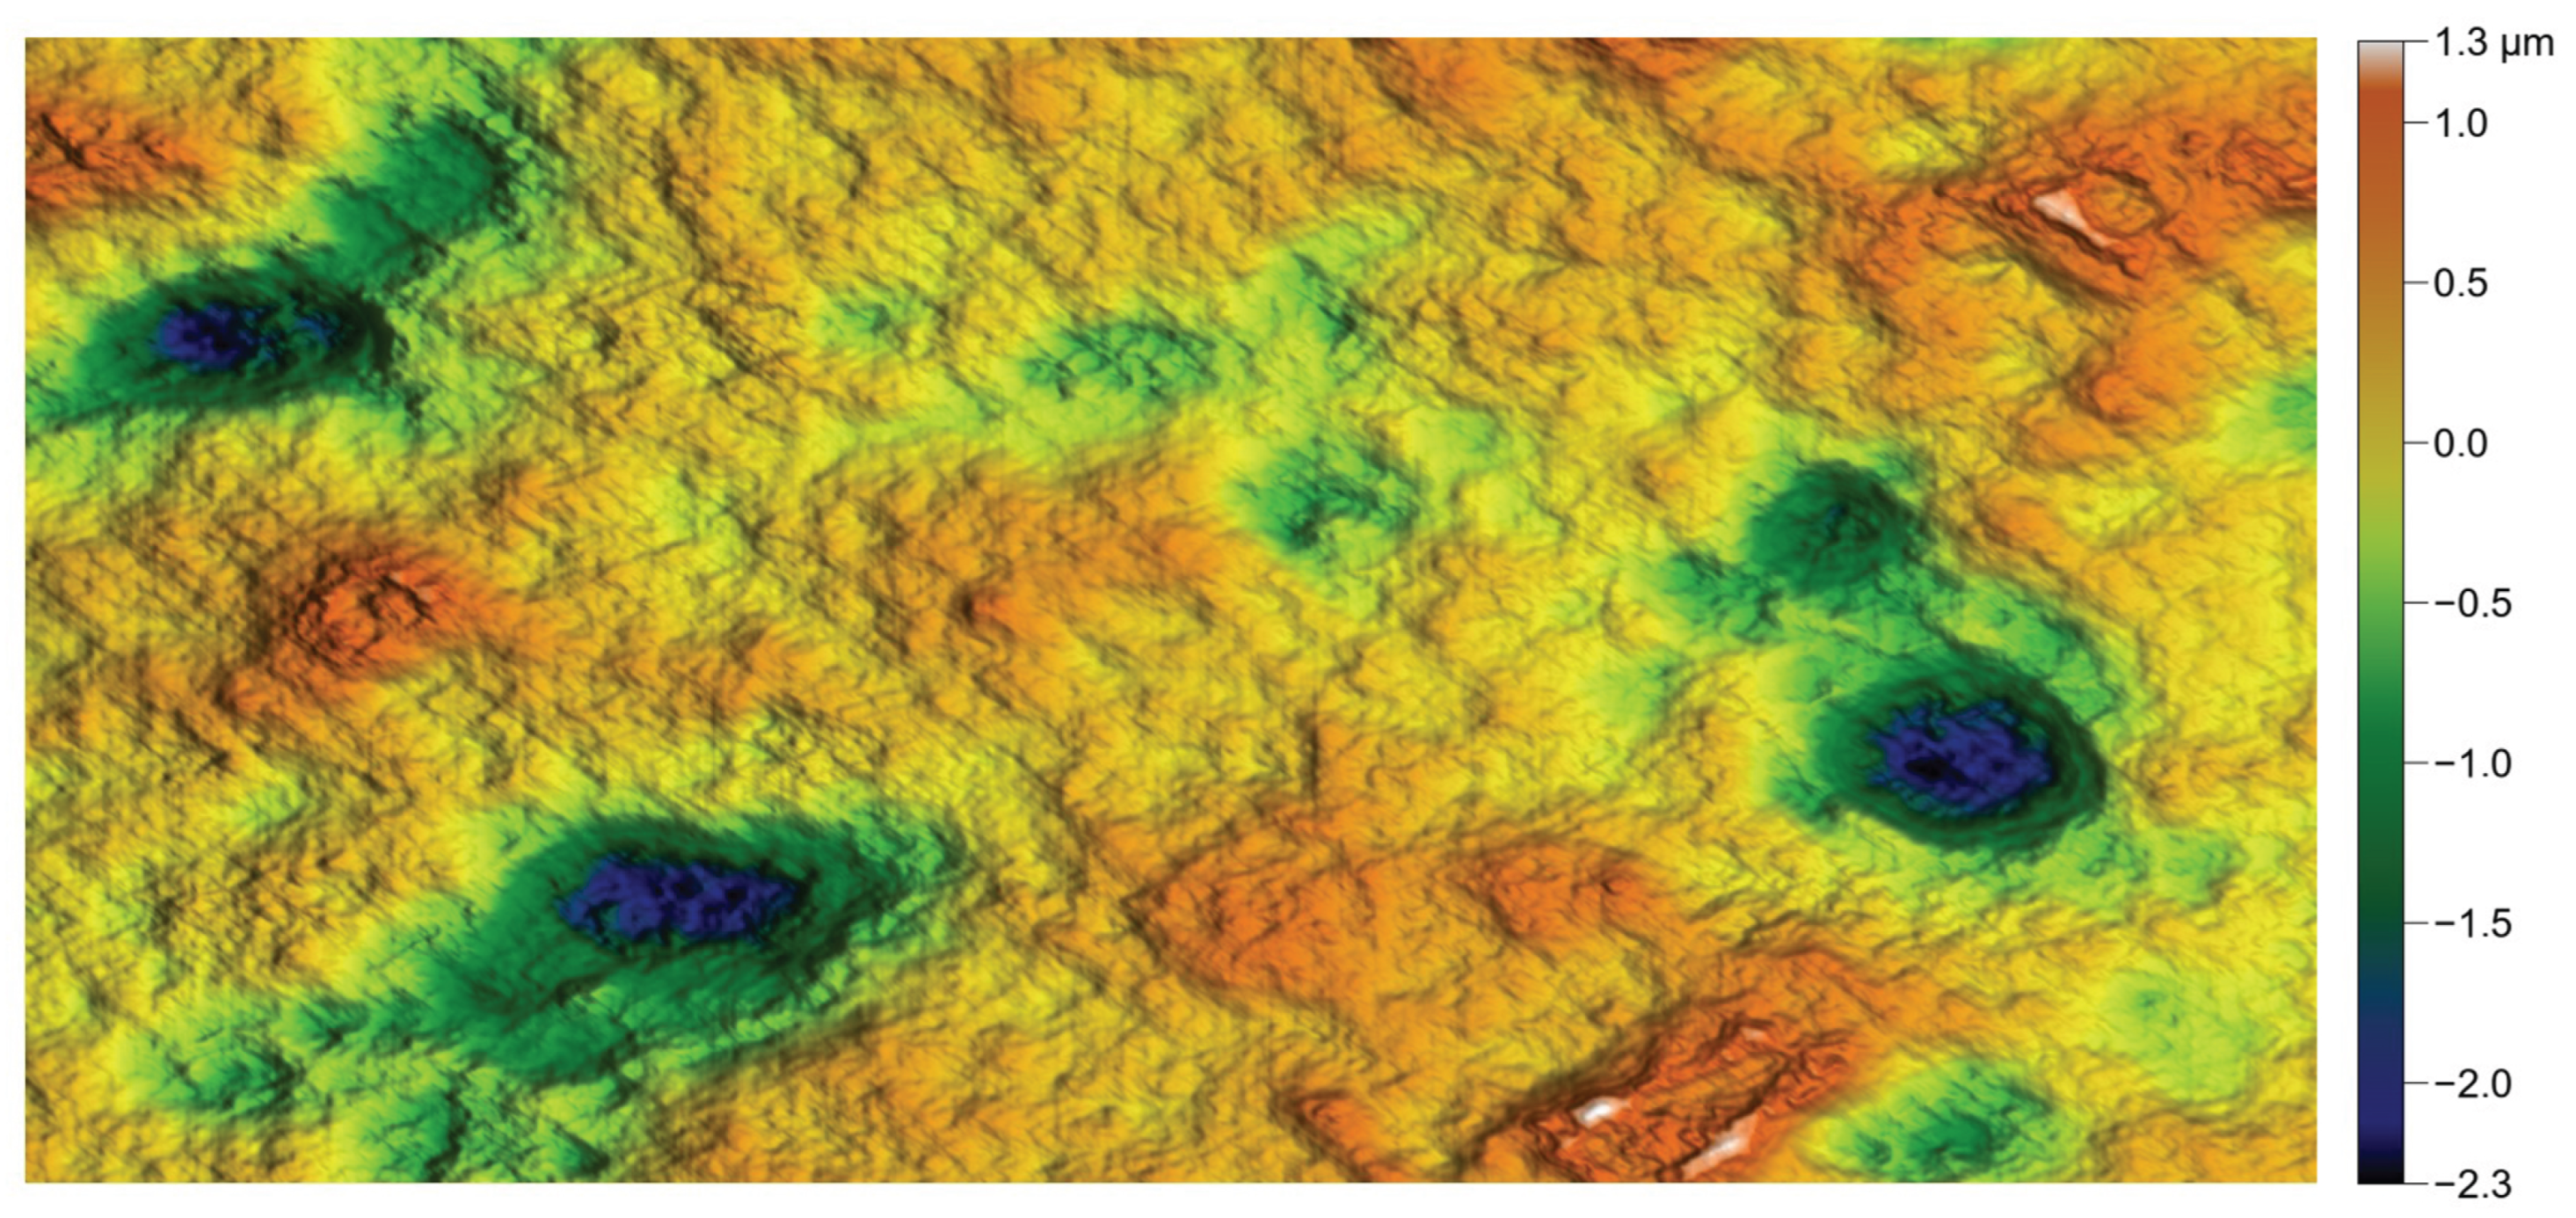
Figure 21 shows the result of the generation along with the new autocorrelation functions along ξ and η in Figure 22. The correlation lengths are larger than previously, since the surface gradually decays to zero near the edges. All imposed parameters are satisfied, but the visual appearance of the generated surface is not yet satisfactory. In particular, one observes pits scattered across the entire surface—highlighted with white circles—that are not present in the original surface.
The idea to eliminate these spurious pits is to initialize the iterative process with a much smoother surface than the one generated randomly, Block 2 in Figure 1.

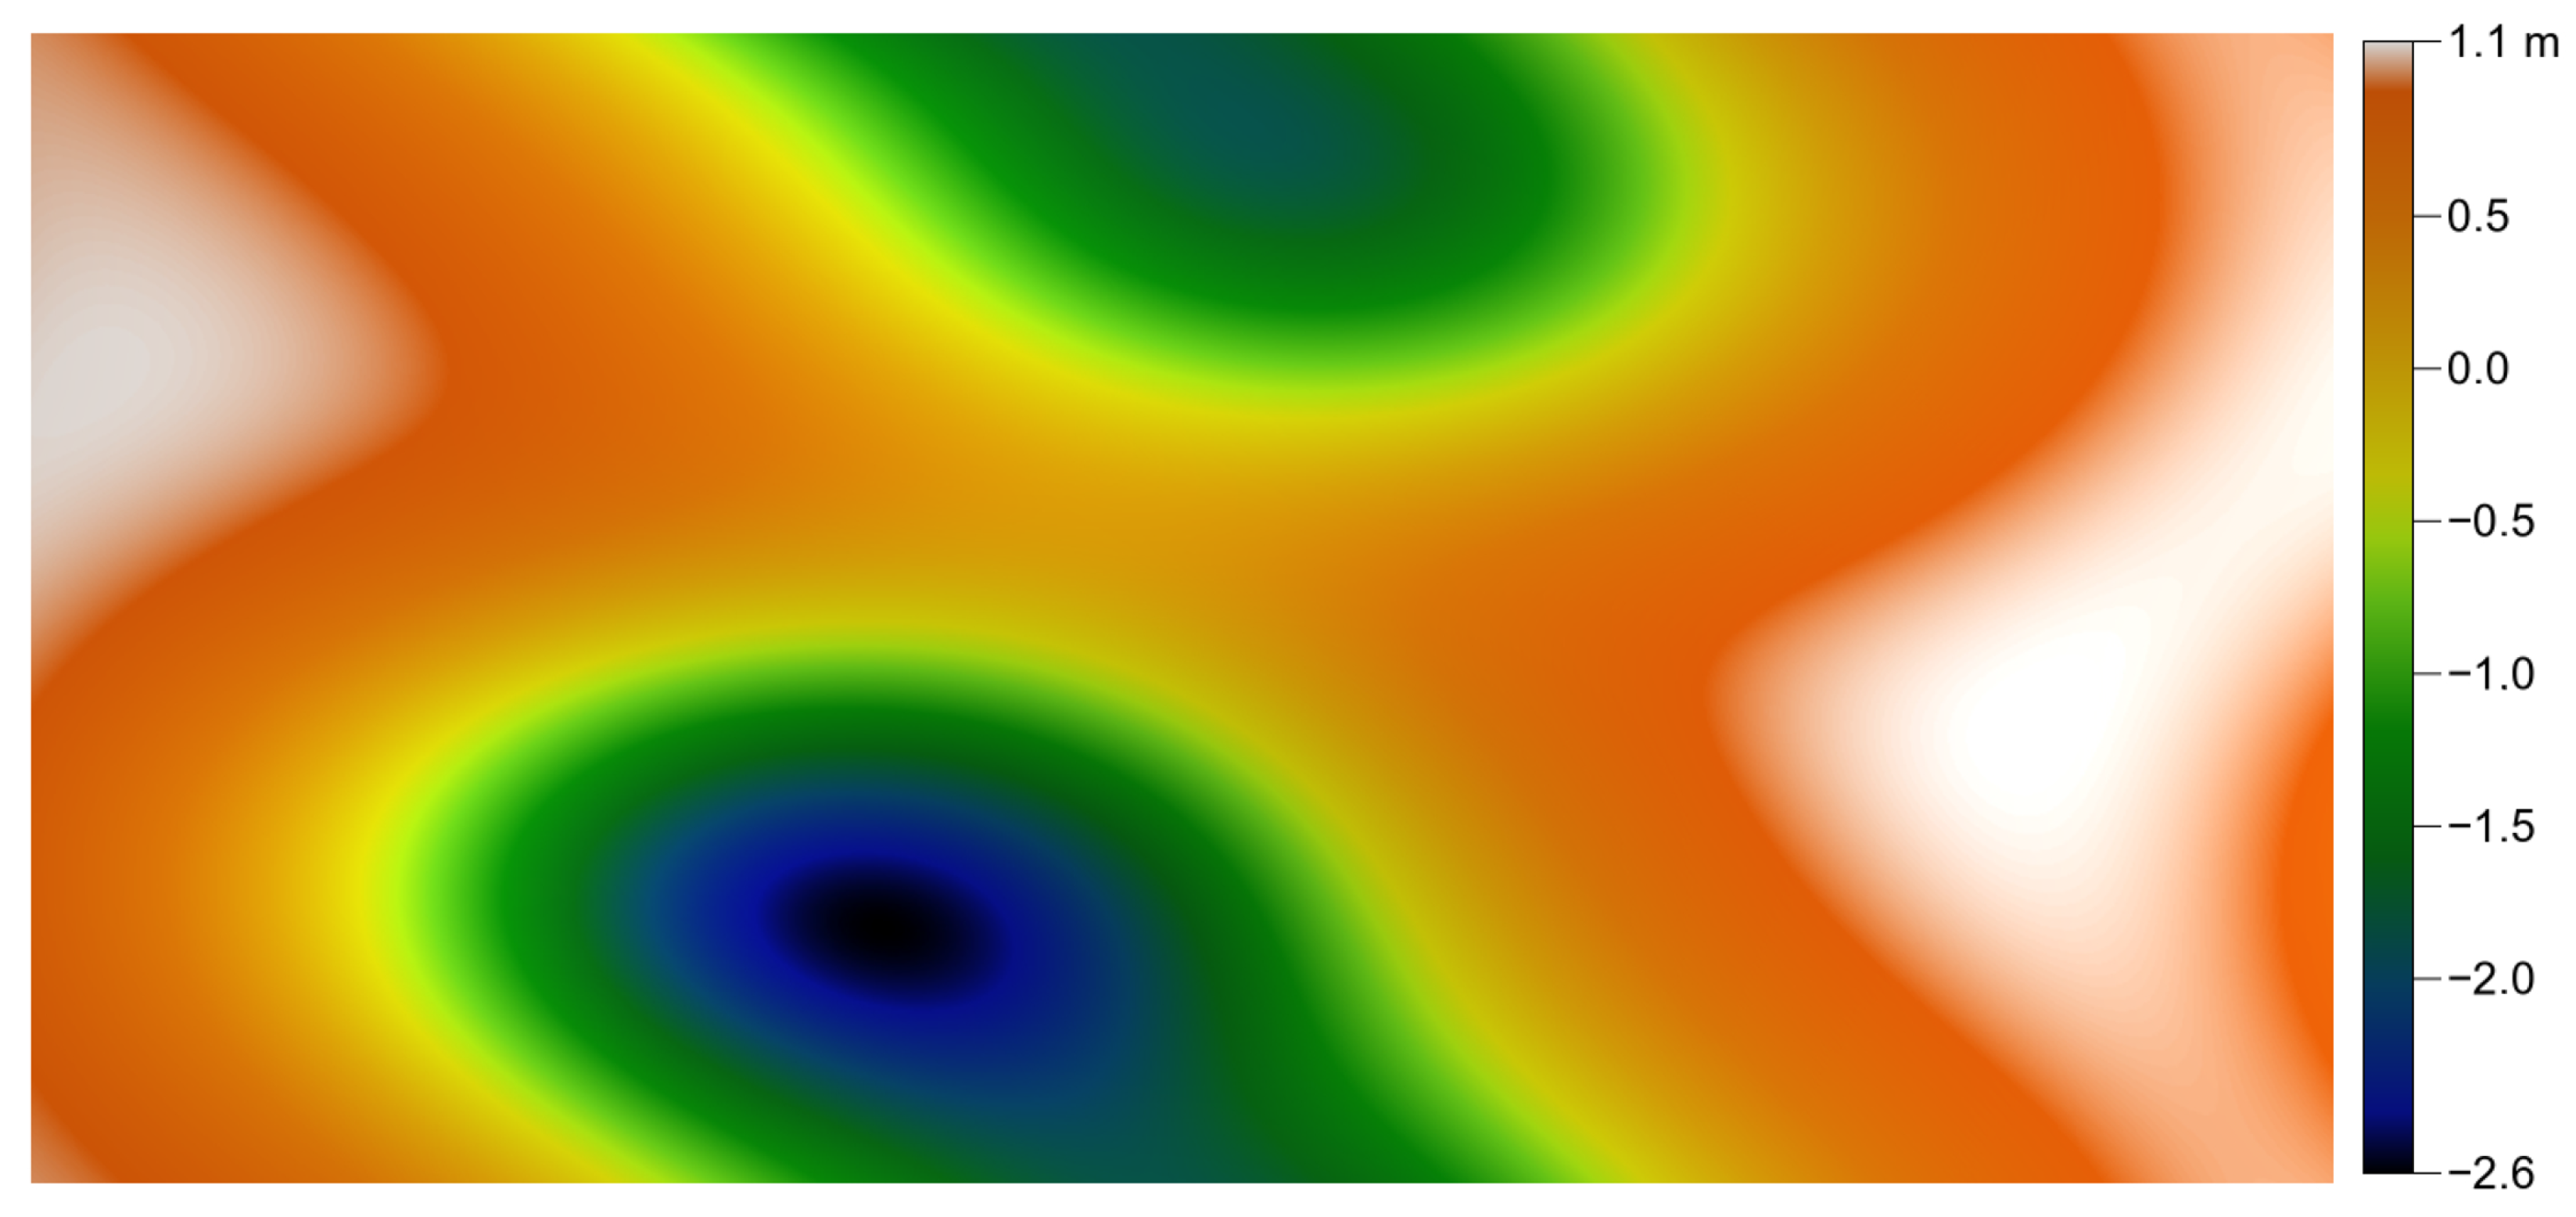
3.2.3. Introducing a Smooth Topography

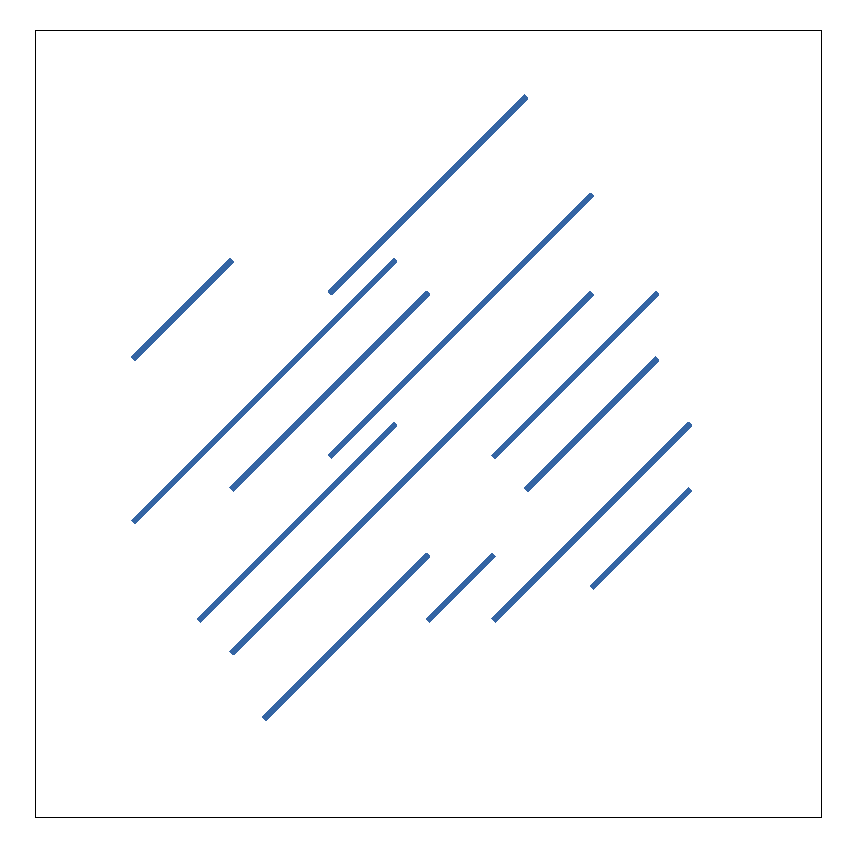
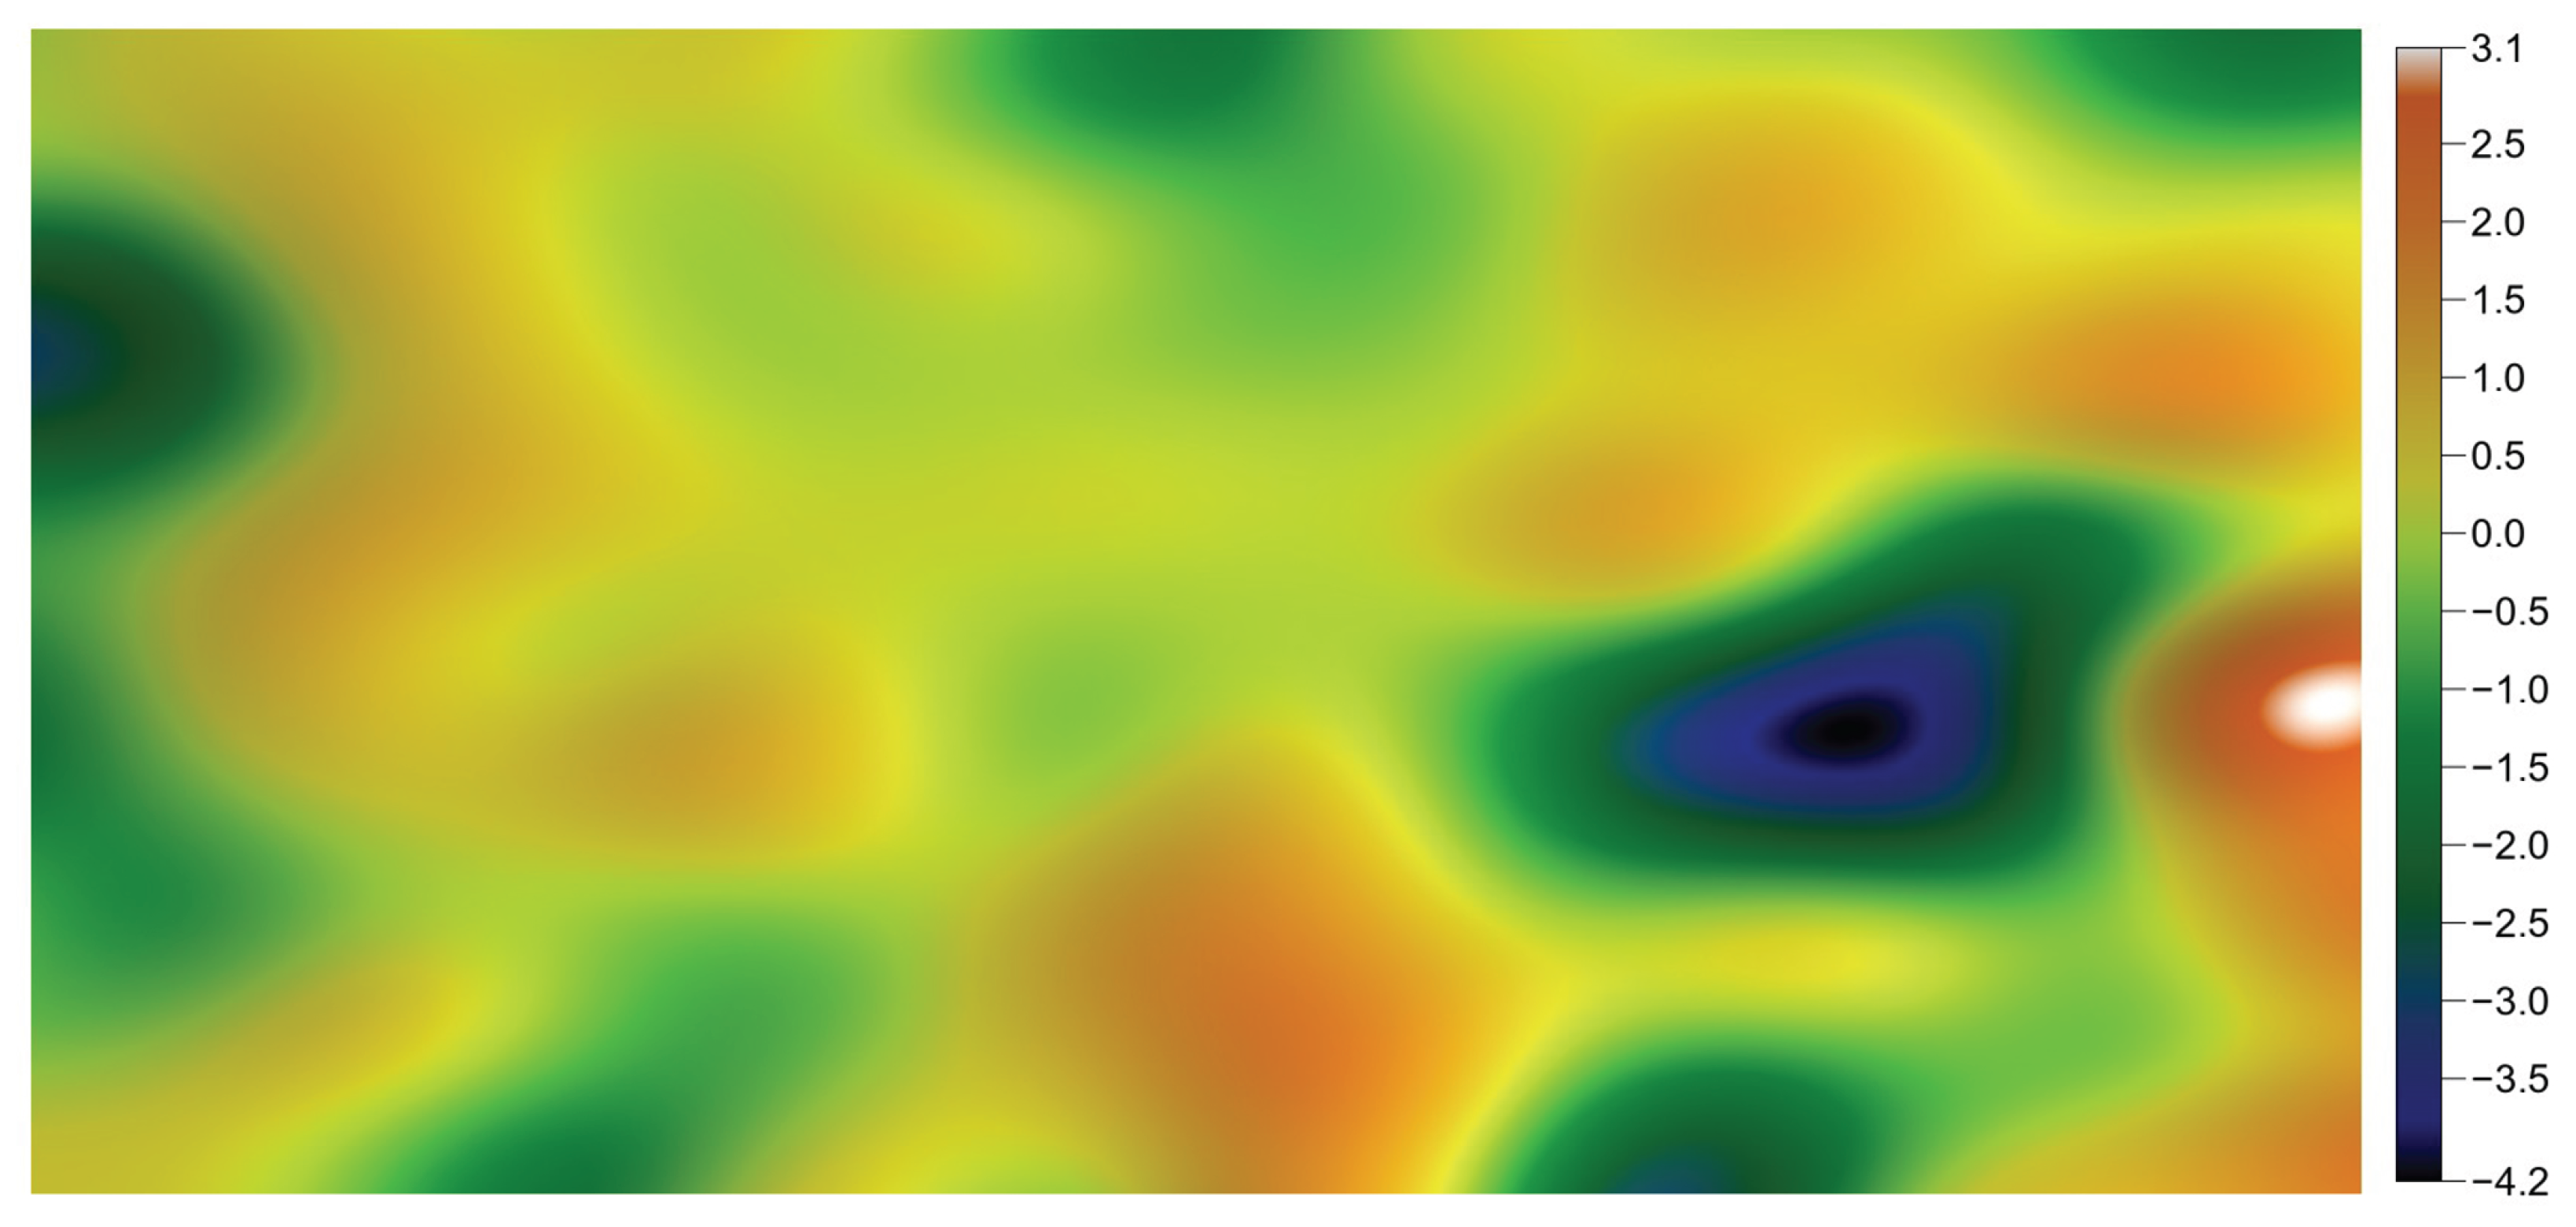
Depending on the type of surface to be reproduced, one may, for example, create an initial periodic surface composed of valleys and hills, as shown in Figure 23, distributed randomly.
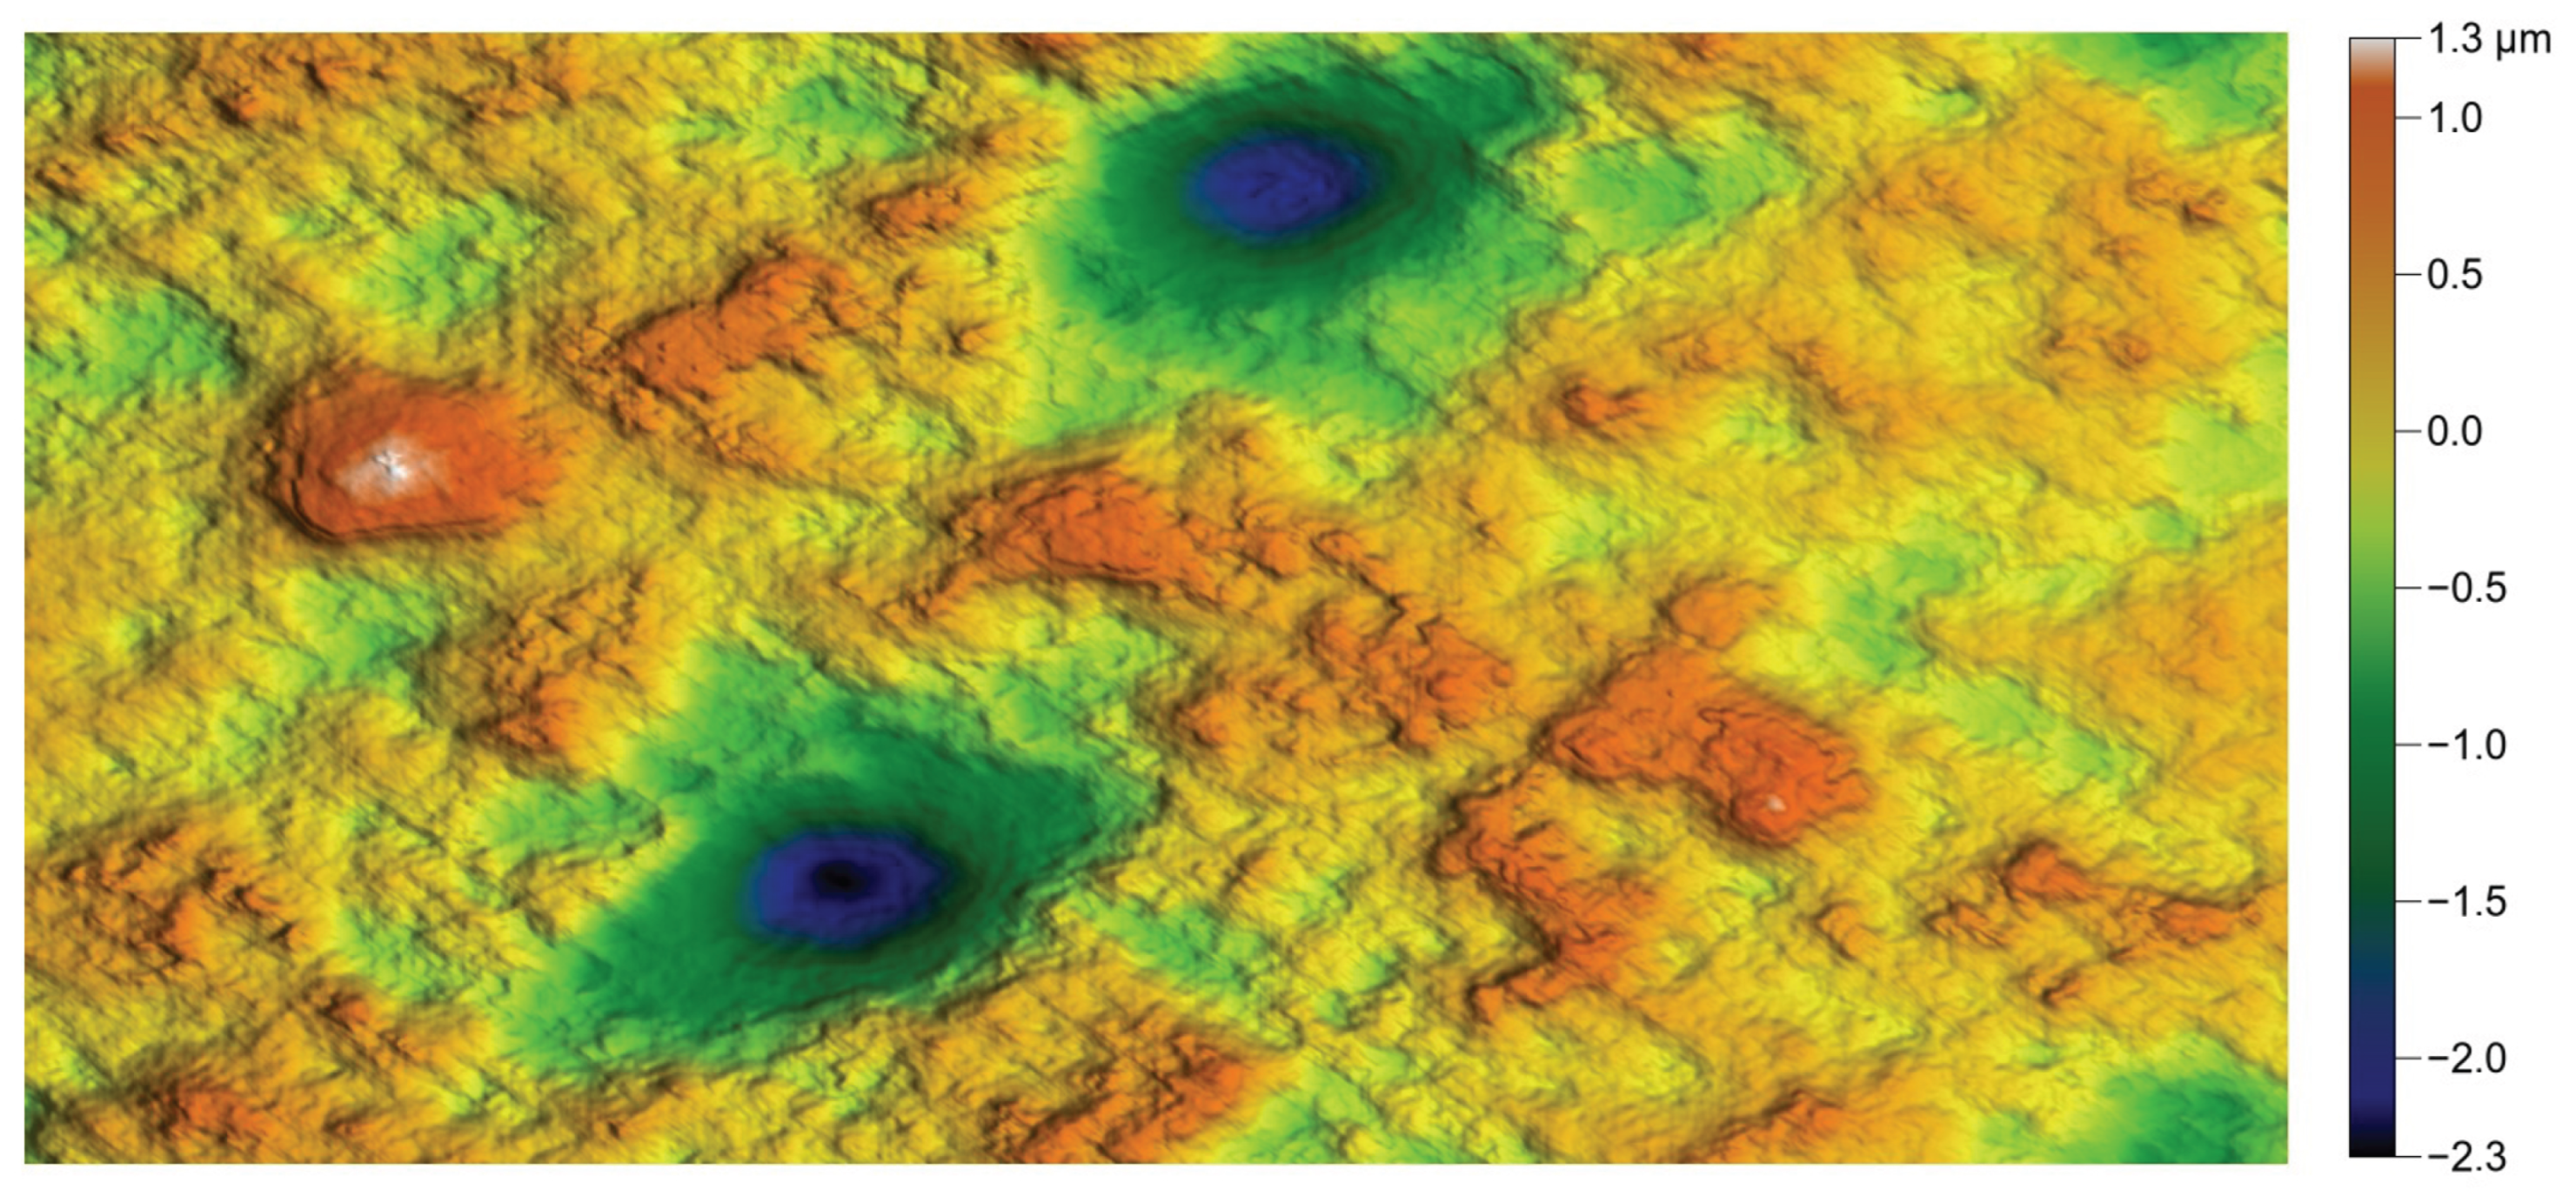
The result is clear: the spurious pits disappear, as shown in Figure 24, while all imposed parameters are still perfectly satisfied. Typically, the random surface used before applying the digital filter should be white noise, so that, after convolution, the autocorrelation function is strictly identical to the imposed autocorrelation function. This statement, however, must be qualified: when the statistical parameters S s k and S k u are large, the noise is no longer white. An example of random surfaces departing from the characteristics of white noise is provided in Appendix C. Consequently, a few iterations are required to obtain the correct autocorrelation function. Based on this principle, one can deliberately deviate from white noise for the surface to be convolved, in order to enforce a smoother final surface.
When the original and reproduced surfaces are visually compared, it can be observed that the numerically generated surface, although highly consistent with the imposed parameters, exhibits a higher degree of complexity than the original one. The S h parameter indicates that the surface is globally less flat, while the increased value of S a s f c reflects a greater rise in surface area with increasing sampling resolution, as shown in Table 5.
Most machined surfaces can be reproduced following this principle. The milled surface, which exhibits strong anisotropy, is faithfully reproduced not only in terms of statistical and spatial parameters but also from a purely visual standpoint, as shown in Figure 25.
Nevertheless, a quantitative analysis of the results reveals the same discrepancies in overall flatness and complexity, as shown in Table 6. A closer match to the original surface could be achieved by performing local height permutations, as proposed by Chen et al. [9], which would increase S h and decrease S a s f c .
The ground surface, which displays similar characteristics, also yields very good results, as shown in Figure 26.
In this case as well, the surface reproduction procedure exhibits the same behavior, characterized by reduced flatness and increased complexity, as shown in Table 7.
When a surface exhibits highly localized features, the qualitative appearance is somewhat degraded, as can be seen on the polished surface, as shown in Figure 27. Nevertheless, the outcome remains highly satisfactory.
It is noteworthy that, in this instance, the situation differs slightly. While S h provides little meaningful information due to the inherent flatness of the surface, the overall complexity appears to be well preserved, as shown in Table 8. A more relevant assessment in this context would involve considering the distribution of topographic features; however, such an analysis falls outside the scope of the present study.
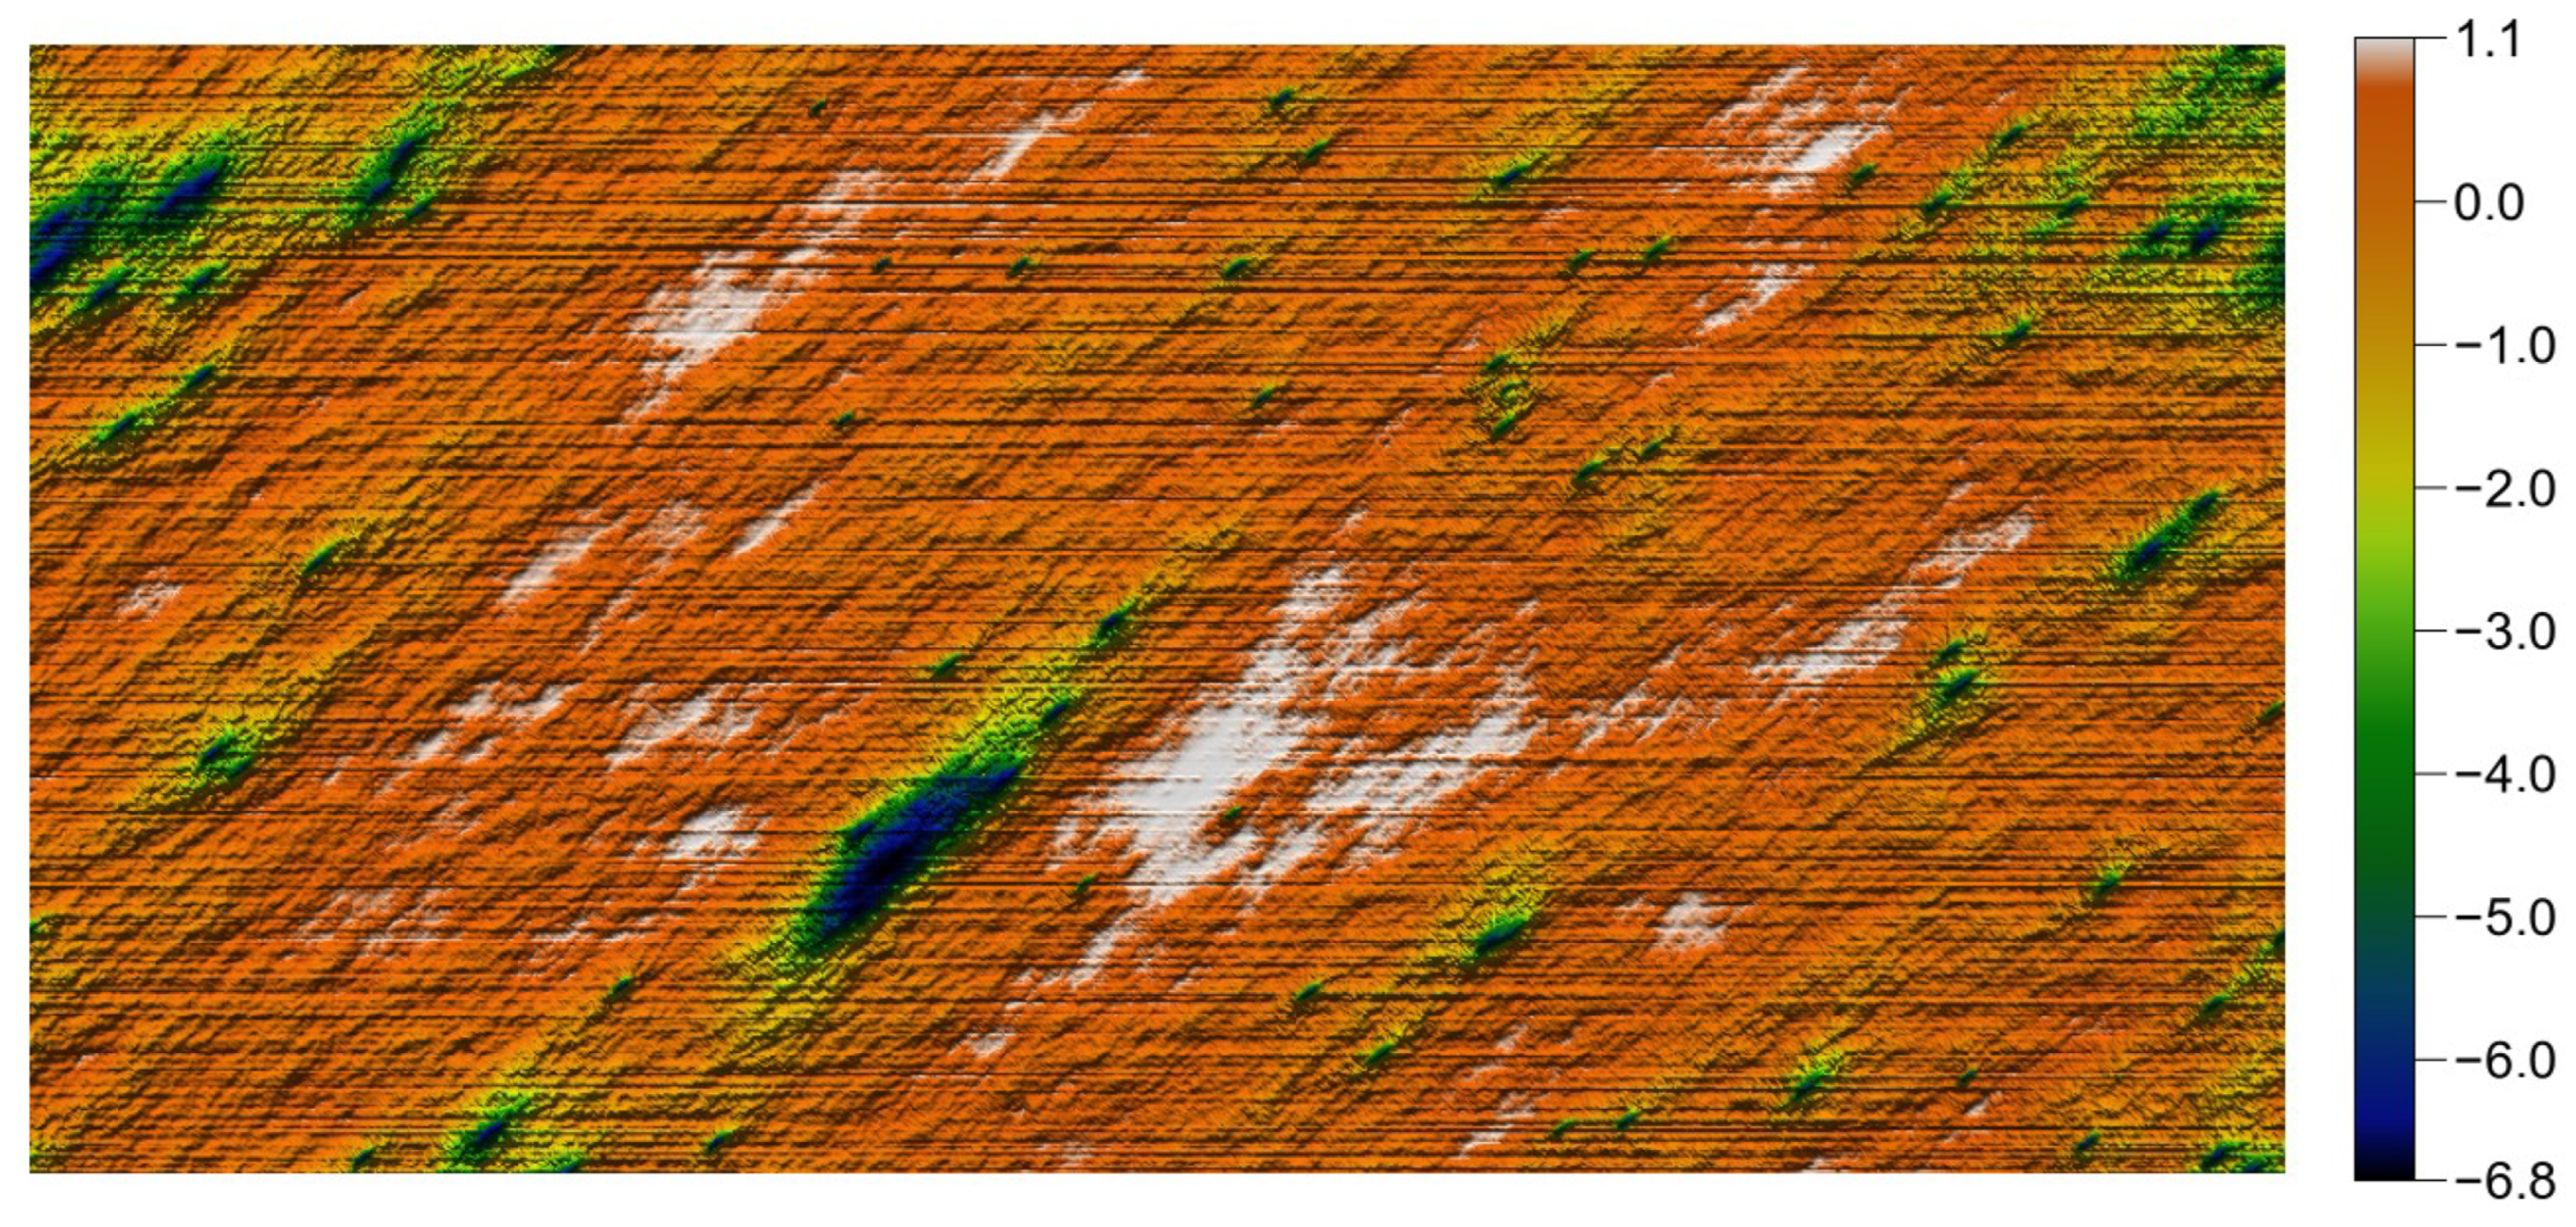
Another case, comparable to the dental surface, concerns the rotor surface. Since the contact area is relatively smooth, it is now well-known that applying a convolution cannot reproduce the surface with high fidelity: the resulting surface is clearly less smooth than the original, as shown in Figure 28, even though the prescribed parameters are strictly satisfied.
The situation here is broadly similar to that observed previously, with no significant deviations in complexity. What differentiates the generated surface from the original one is primarily a matter of homogeneity in the height distribution, as shown in Table 9.

3.2.4. Using a Low-Pass Filter

Another way to achieve a similar result is to apply a low-pass filter—such as a top-hat filter—immediately before each convolution step. This forces the process to limit high frequencies, which also leads to a smoother surface, as shown in Figure 29.
It should be emphasized that no filter is applied after the final convolution iteration, since this would degrade the autocorrelation function. In the example presented, the cutoff frequency is set to 0.01, i.e., 100 times the grid spacing, at 12.9 μ m.
In order to obtain a final surface that is as smooth as possible, the top-hat filter must remove as many high frequencies as possible. However, it can be observed that in the iterative convolution/height-replacement procedure, removing too many high frequencies prior to convolution slows down the process. In the present case, when the cutoff falls below 0.01, the procedure no longer converges satisfactorily, and a larger deviation in the a c f would therefore have to be accepted, without any apparent improvement in the final result.
As the iterations proceed, the effect of the top-hat filter remains minor, as can be seen in Table 10 when this filter is applied in the final step. In all cases, the procedure concludes with the convolution and the restoration of the original height values, which ensures that both the height-related and spatial parameters are correctly preserved. One may be surprised by the limited impact of the filter, given the visual appearance of the surface, as all wavelengths shorter than 100 mesh steps are absent. This observation is, in fact, simply a consequence of the surface characteristics, particularly the correlation lengths of approximately 50 and 80 times the mesh step.
Although the result is quite satisfactory, the generated surface, while matching the statistical parameters of the original one, still does not sufficiently “resemble” it in appearance.

3.2.5. Two-Level Reconstruction

To more faithfully reproduce the surface across its different frequency components, one can attempt to decompose it into two levels: a low-frequency level, as shown in Figure 30, and a high-frequency level, as shown in Figure 31.
Note that there is no universally accepted definition to distinguish low from high frequencies. In this work, the cutoff wavelength was set to 200 grid steps, i.e., 25.8 μ m.
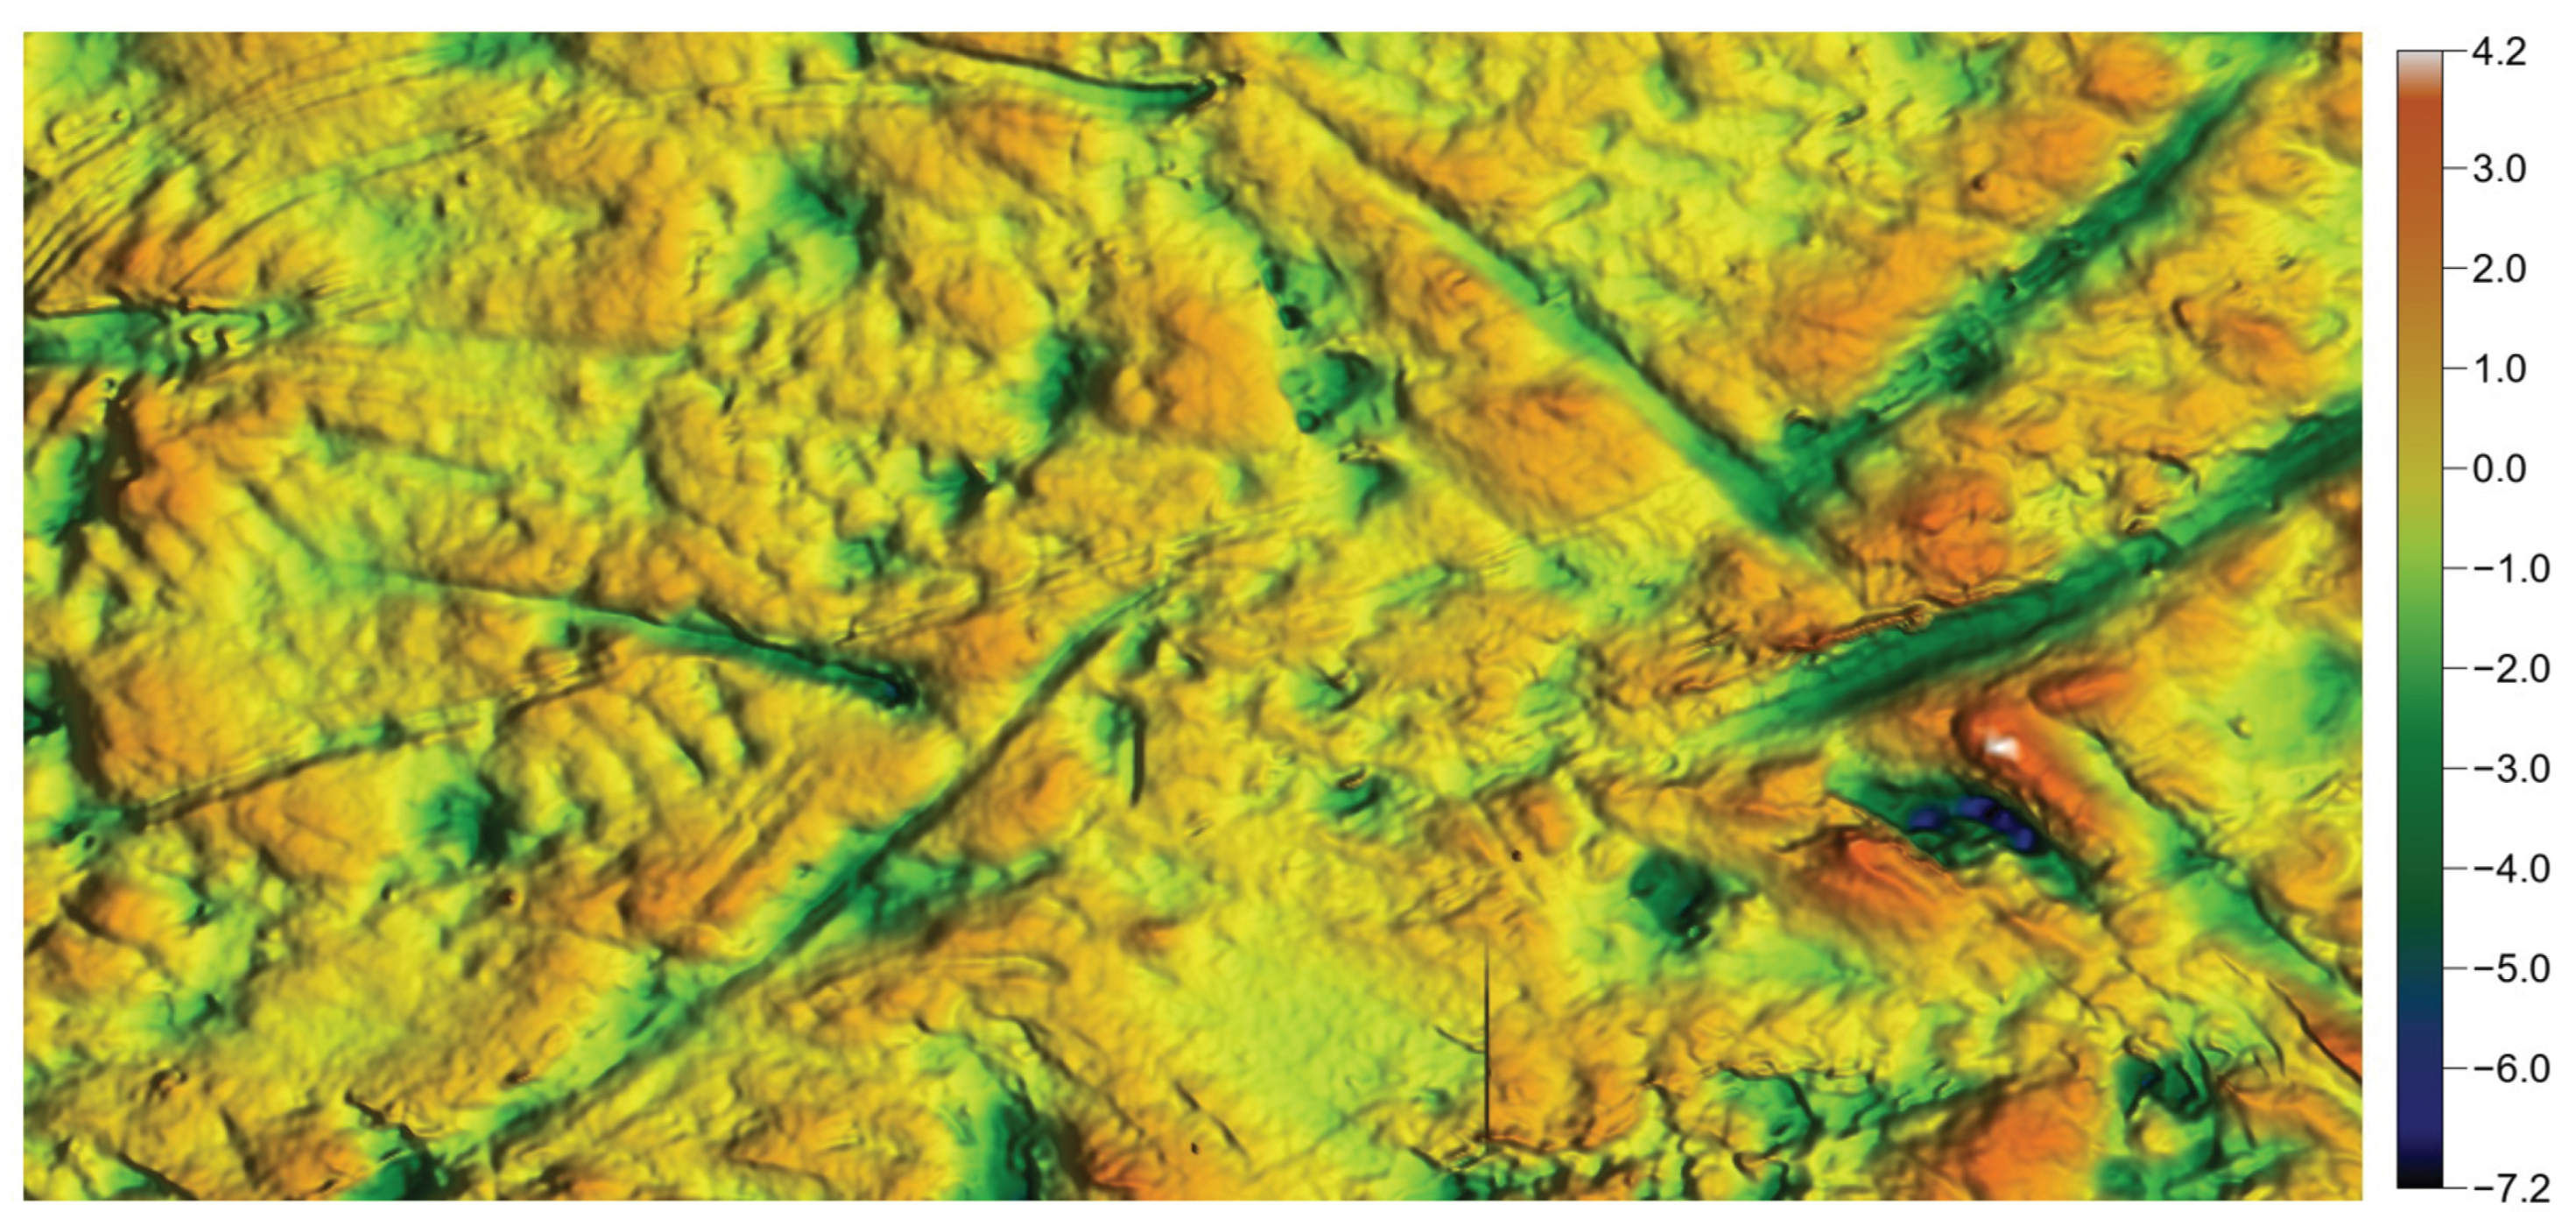
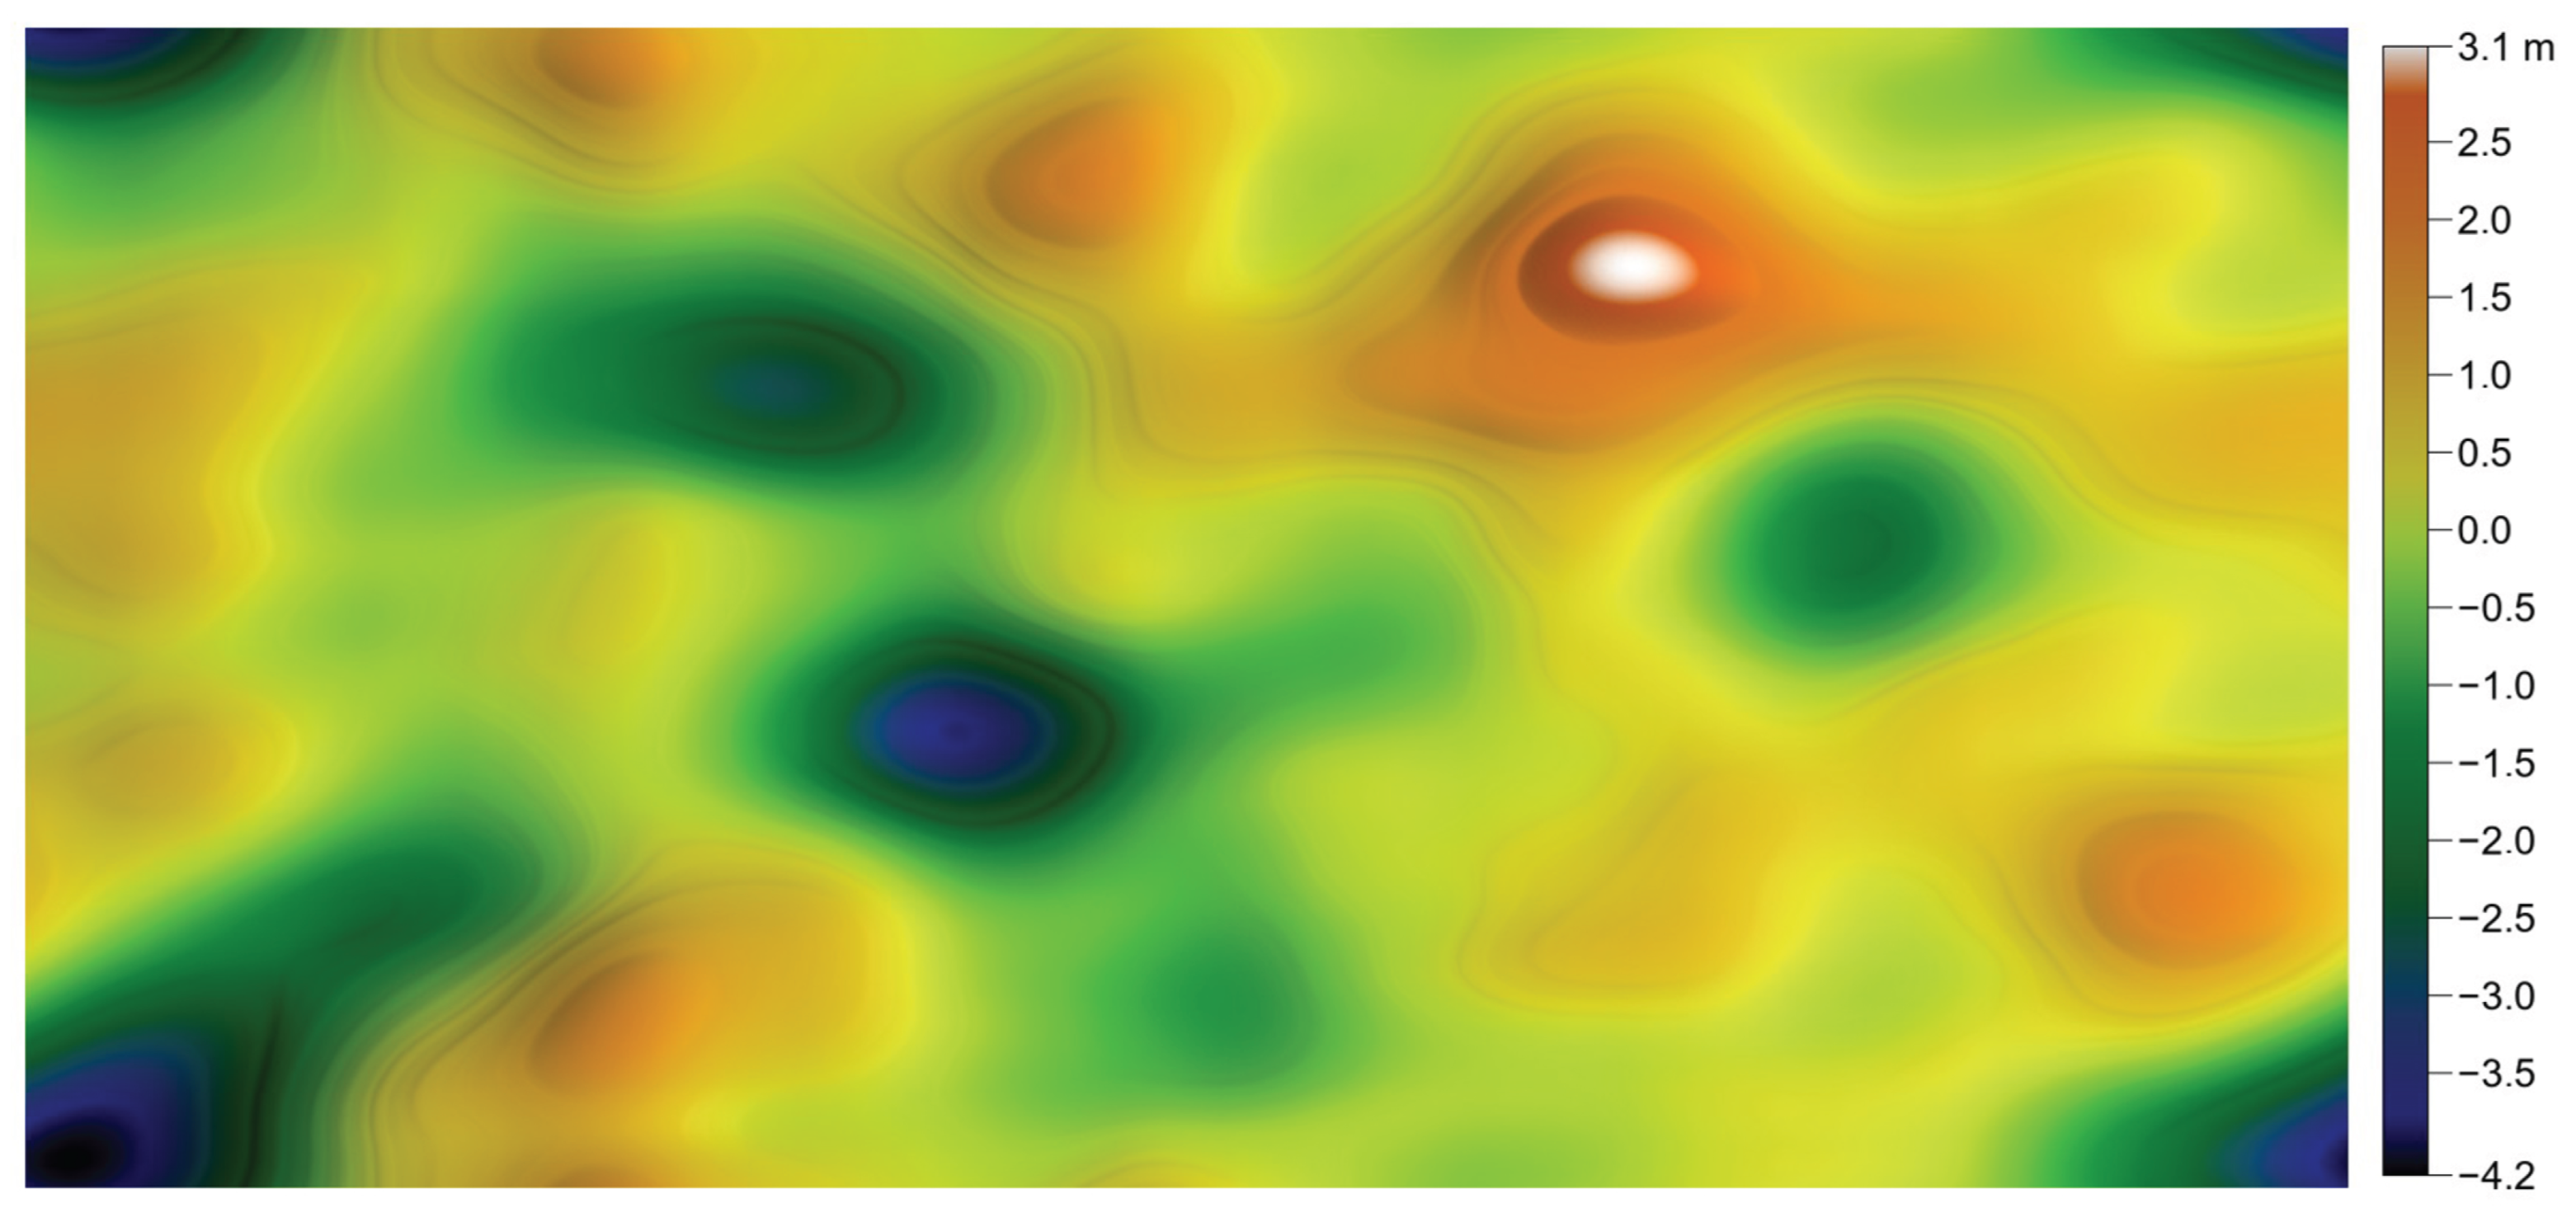
The modified algorithm consists of reproducing as accurately as possible the two surfaces corresponding to the frequency-partitioned components of the original surface—while preserving the four statistical moments and the autocorrelation function—and then recombining them with a few final iterations so that the resulting surface is fully compliant. The resulting surfaces are shown in Figure 32 and Figure 33, with the final result in Figure 34. Once again, all imposed parameters are satisfied, but differences remain observable.
The decomposition did not bring any substantial improvement regarding the “skin-like” aspect of the original surface. Moreover, the parameters S h , S d r , and S a s f c are nearly identical to those obtained for the surface generated by introducing a smooth surface. Nevertheless, one could consider adding a few scratches to the numerical surface, which would provide greater realism.

3.2.6. Introducing Scratches

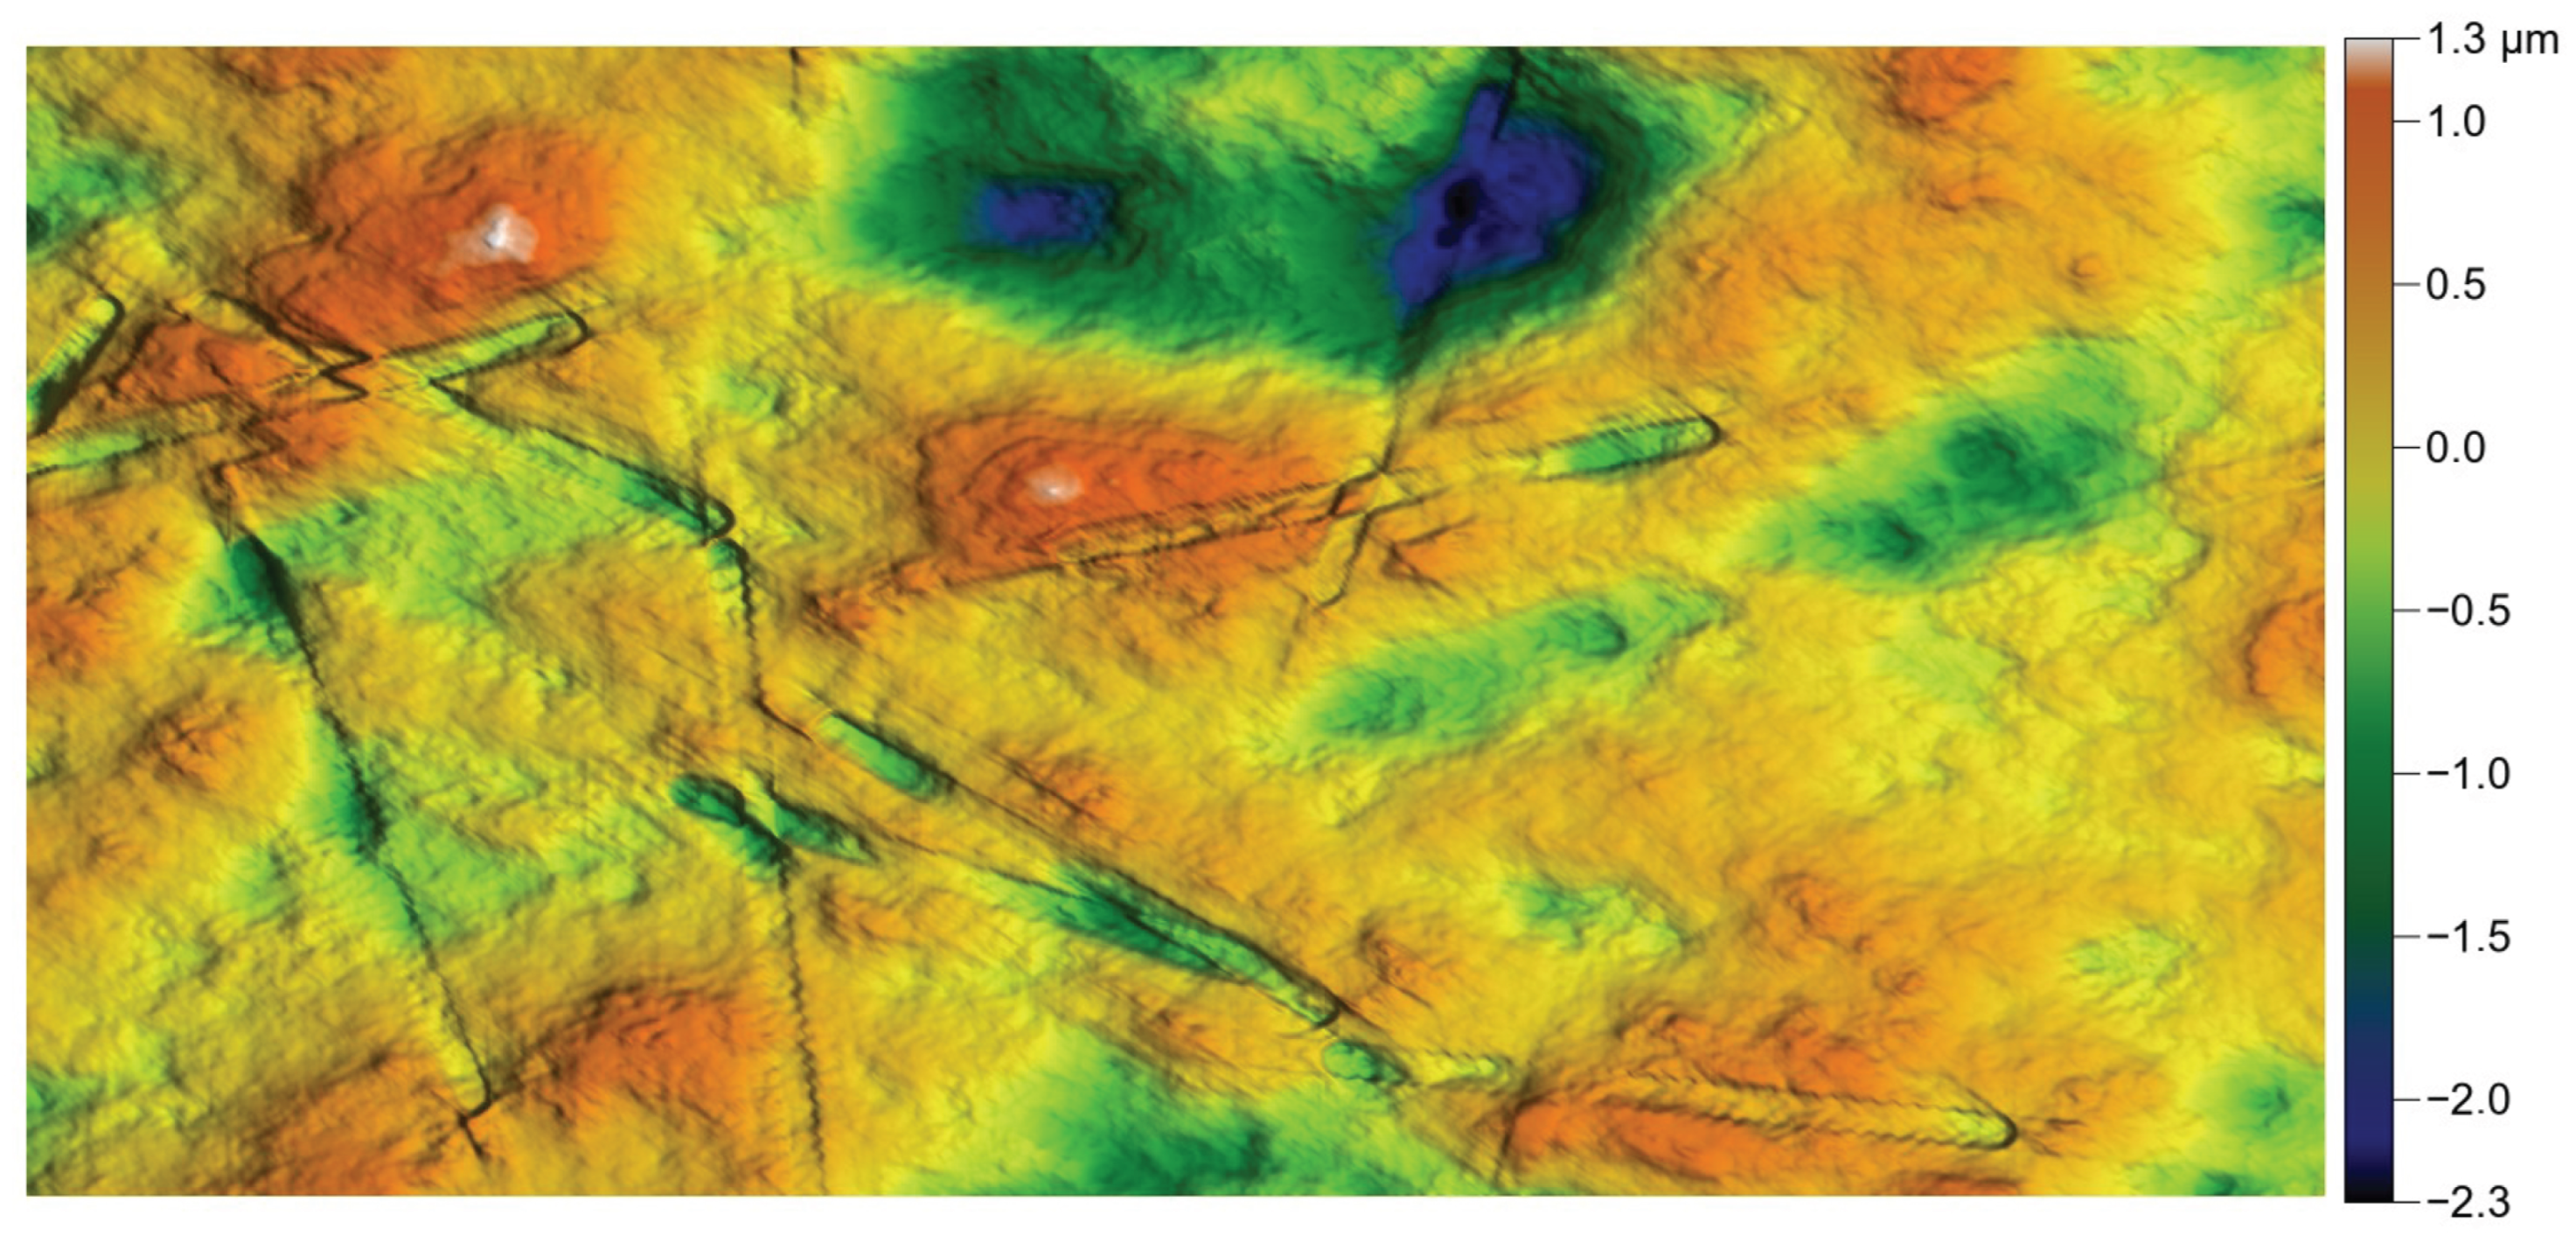
By introducing into the program a routine that models scratches of random lengths and orientations, a scratched texture can be imposed at the beginning of the iterations, causing them to appear in the final surface. It should be noted that the digital filter is then applied to a scratched surface, which ultimately smooths the scratches while leaving scattered artifacts, as shown in Figure 35.
The use of a scratched surface can be particularly useful for reproducing polished mirror-like industrial surfaces, since, as shown in Figure 36, the result is satisfactory. The quality cannot truly be improved by reducing the thickness of the scratches, since even when starting from scratches as narrow as a single pixel, the convolution process broadens them, resulting in scratches that remain wider than desired.
In contrast to the other surfaces, the generated surface exhibits lower complexity, as shown in Table 11. This can be explained by the fact that the original scratches display more varied characteristics than those introduced during the generation process.

4. Conclusions

With regard to the generation of random rough surfaces with prescribed parameters, the algorithm presented has demonstrated the ability to achieve the following objectives:
  • Preservation of strong directional anisotropies,
  • Accurate reproduction of large correlation lengths,
  • Enforcement of high third- and fourth-order statistical moments,
  • Near-realistic rendering of the resulting surfaces.
Concerning the reproduction of rough surfaces, the contributions are as follows:
  • Automatic compliance with both height and spatial parameters,
  • Preservation of realism for surfaces that remain homogeneous at the scale of the correlation lengths,
  • Approximate reproduction of localized topographic features.
The advantages of the proposed process over the REPR (Representative Elementary Pattern of Roughness) method developed by Borodich et al. [12] are as follows:
  • The generated surfaces are, in theory, not limited in size;
  • The statistical parameters of the original surface are preserved, whatever the chosen size;
  • Heterogeneity can be introduced into the surface;
  • The spatial arrangement of heights through the PSD, although imperfect, allows the generated surface to approximate the original one without being a direct extraction of it.
This last point is crucial, particularly in lubrication-related problems, since the wavelengths of the surface heights do not contribute equally to the load-carrying capacity. With the REPR method, the extracted surface patch may exhibit a wavelength distribution that differs significantly from that of the original surface and thus fail to reproduce its tribological behavior accurately. Finally, by construction, the REPR method cannot provide diversity in the generated surfaces, which limits the statistical analysis of the surface parameters with respect to a given quantity (such as the load-carrying capacity or efficiency coefficient).
The attempt to decompose rough surfaces into low- and high-frequency components did not yield the expected results. Nevertheless, we believe this approach should be further explored through a multi-scale decomposition that is not limited to only two components. During the recomposition phase, scaling factors and offsets could then be adjusted for each surface component, so as to better match both the imposed parameters and the visual rendering. Working with a multi-scale decomposition also has the advantage of providing explicit control over.
  • Low-frequency components, which are most relevant for lubrication-related issues,
  • High-frequency components, which capture micro-wear patterns associated with diet.
If this decomposition principle proves to be effective, it will then become possible to generate large quantities of rough surfaces for statistical studies and even for training within the framework of machine learning.

Author Contributions

Conceptualization, methodology, software, A.F.; validation, N.B. and A.F.; writing—original draft preparation, A.F.; writing—review and editing, N.B. and A.F. All authors have read and agreed to the published version of the manuscript.

Funding

This research received no external funding.

Data Availability Statement

The datasets presented in this article are not readily available because the full suite of data and software is not yet ready for release. Insufficient safeguards and documentation currently make it unsuitable for public use. Requests to access the datasets should be directed to the author Arthur Francisco.

Conflicts of Interest

The authors declare no conflicts of interest.

Nomenclature

a , b , c Analytical function parameters
a c f Autocorrelation function
hFilter (Hu and Tonder)
l ξ , l η Autocorrelation lengths along principal axes ξ and η , at z = 0.5 . The default value for z is z = 0.2 ; however for large a c f lengths, a higher z value should be selected.
nNumber of heights
v a Surface height variance
w , h Surface dimensions
x , y Horizontal and vertical axes of a surface
x i z i x-coordinate (analytical height function)
zHeight random variable; a c f plane cut
z i Surface height number i
O z z permutation operator for ordering
S a ISO 25178 parameter, arithmetical mean height of the surface
S a s f c ISO 25178 parameter, area-scale fractal analysis complexity parameter
S a l ISO 25178 parameter corresponding to l η
S d r ISO 25178 parameter, excess relative area
S h Percentage of surface facets whose normals lie within a cone of 5° half-angle at the apex
S m d Height median
S p ISO 25178 parameter, maximum height of peaks
S q ISO 25178 parameter, root mean square height of the surface
S s k , S k u ISO 25178 parameter, height skewness and kurtosis
S t d ISO 25178 parameter, texture direction of the surface
S t r i Inverse of the ISO 25178 anisotropy factor S t r
S v ISO 25178 parameter, maximum height of valleys
α Texture orientation (deg)
μ Surface height mean
σ Surface height standard deviation

Appendix A. Mathematical Justification of the Statistical Moments of z = hη

The following results hold only for infinite series and for white noise η with zero mean and unit variance.

Appendix A.1. Mean μ z

1 n i = 1 n z i = k = 1 n h k 1 n i = 1 n η k + i = n μ h μ η ,
as μ η = 0 , and μ z = 0 .

Appendix A.2. Variance σ z 2

z is zero-mean:
σ z 2 = 1 n i = 1 n z i 2 = k = 1 n h k 2 1 n i = 1 n η k + i 2 + 2 n k = 1 n 1 p = k + 1 n h k h p i = 1 n η k + i η p + i .
η is the unit variance and considered as white noise:
i = 1 n η k + i η p + i = 0 k p .
Therefore,
σ z 2 = k = 1 n h k 2 · σ η 2 = k = 1 n h k 2 = n σ h 2 .

Appendix A.3. Skewness Ssk z

1 n i = 1 n z i 3 = k = 1 n h k 3 1 n i = 1 n η k + i 3 + 3 n k = 1 n 1 p = k + 1 n h k 2 h p i = 1 n η k + i 2 η p + i + + 6 n k = 1 n 2 p = k + 1 n 1 q = p + 1 n h k h p h q i = 1 n η i η ( p k ) + i η ( q k ) + i
Under the key assumption that the η i are independent and identically distributed,
E [ η k + i 2 η p + i ] = E [ η k + i 2 ] · E [ η p + i ] = σ η 2 · 0 = 0 .
For the same reason,
i = 1 n η i η ( p k ) + i η ( q k ) + i = 0 .
Therefore,
S s k z = 1 n σ z 3 i = 1 n z i 3 = 1 n σ h 3 k = 1 n h k 3 S s k η ,
and as μ h = 0 ,
S s k z = 1 n S s k h S s k η .

Appendix A.4. Kurtosis Sku z

1 n i = 1 n z i 4 = k = 1 n h k 4 1 n i = 1 n η k + i 4 + 4 n k = 1 n 1 p = k + 1 n h k 3 h p i = 1 n η k + i 3 η p + i + + 6 n k = 1 n 1 p = k + 1 n h k 2 h p 2 i = 1 n η k + i 2 η p + i 2 + + 12 n k = 1 n 2 p = k + 1 n 1 q = p + 1 n h k 2 h p h q i = 1 n η k + i 2 η p + i η q + i + + 24 n k = 1 n 3 p = k + 1 n 2 q = p + 1 n 1 r = q + 1 n h k h p h q h r i = 1 n η i η ( p k ) + i η ( q k ) + i η ( r k ) + i
In the same way as we eliminated certain products earlier by invoking η as white noise, we can eliminate several terms here as well. What remains is
1 n i = 1 n z i 4 = k = 1 n h k 4 1 n i = 1 n η k + i 4 + 6 n k = 1 n 1 p = k + 1 n h k 2 h p 2 i = 1 n η k + i 2 η p + i 2 .
Under the same assumptions as before about η , we can state ([25]):
1 n i = 1 n η k + i 2 η p + i 2 = 1 n i = 1 n ( η k + i η p + i ) 2 = σ η 2 σ η 2 = 1 ;
hence,
1 n i = 1 n z i 4 = k = 1 n h k 4 1 n i = 1 n η k + i 4 + 6 k = 1 n 1 p = k + 1 n h k 2 h p 2 .
It can be easily established that
2 k = 1 n 1 p = k + 1 n h k 2 h p 2 = k = 1 n h k 2 2 k = 1 n h k 4 ;
hence,
1 n i = 1 n z i 4 = n σ h 4 S k u h S k u η + 3 n σ h 2 2 n σ h 4 S k u h = n 2 σ h 4 1 n S k u h S k u η + 3 1 1 n S k u h .
Finally,
S k u z 3 = 1 n S k u h ( S k u η 3 ) .

Appendix B. Some Analytical Justifications Regarding the Boundaries

The maximum value of the pair ( S s k , S k u ) is approximately ( n , n ) ; so, the function S k u = 1.24 S s k 2 + 1.8 is not compatible with this point. It turns out that, for S s k < n 2 , the points align along a straight line, whereas for S s k > n 2 , the parabola S k u = 1.24 S s k 2 + 1.8 fits perfectly.
This explains why the junction of the two functions occurs at S s k n 2 , when determining the parameters of the straight line passing through the point ( n , n ) and tangent to the parabola S k u = 1.24 S s k 2 + 1.8 .
Moreover, for the transition, the intersection point of the two curves is exactly ( n 2 , n 3 3 ) , to first order in 1 n , if one approximates 1.34 by 4 3 and replaces 1.8 with 9 5 .

Appendix B.1. Minimum of Sku When Ssk=0

Appendix B.1.1. Tangent-Based Distribution

For the tangent-based distribution, the lowest value of S k u is reached around 0. Indeed, near x = 0 , tan ( x ) x , which is the region where all dataset points tan ( x i ) are closest to each other. We then have
σ 2 = 1 2 ϵ ϵ + ϵ ( x μ ) 2 d x = 1 2 ϵ ϵ + ϵ x 2 d x = 1 3 ϵ 2 .
μ = 0 , because the interval is symmetric, and the function f ( x ) = x is odd.
S k u = 1 2 ϵ ϵ + ϵ x μ σ 4 d x = 1 2 ϵ σ 4 ϵ + ϵ x 4 d x = 9 2 ϵ 5 2 ϵ 5 5 = 9 5

Appendix B.1.2. Modified Exponential-Based Distribution

The smallest attainable S k u lies on Pearson’s bound, namely S k u = S s k 2 + 1 . This limit is reached for binary distributions. The exponential-based distribution can approach this limit when the x 3 component is canceled out and the integration bounds are “far away”.
μ = lim l 1 2 l l 0 ( 1 + exp ( x ) ) d x + 1 2 l 0 l ( + 1 exp ( x ) ) d x = 0 σ 2 = lim l 1 2 l l 0 ( 1 + exp ( x ) ) 2 d x + 1 2 l 0 l ( + 1 exp ( x ) ) 2 d x = lim l 1 2 l ( 3 + 2 l + 4 exp ( l ) exp ( 2 l ) ) = 1 S k u = lim l 1 2 l l 0 ( 1 + exp ( x ) ) 4 d x + 1 2 l 0 l ( + 1 exp ( x ) ) 4 d x = lim l 25 6 + 2 l 8 exp ( l ) 6 exp ( 2 l ) + 8 3 exp ( 3 l ) 1 2 exp ( 4 l ) = 1

Appendix B.2. Maximum of Sku When Ssk=0

Appendix B.2.1. Tangent-Based Distribution

For the tangent-based distribution, the analysis is complex, since it involves integrating the fourth power of the tangent function close to its vertical asymptotes located at ± π 2 , within ϵ . The analytical expression can be obtained using a symbolic computation tool such as Maxima [26]:
S k u = π ( ϵ + 1 ) 3 π ( 1 ϵ ) s 3 8 c 3 + 6 c 3 s π 2 ( 1 ϵ ) 2 4 s 2 4 π ( 1 ϵ ) c s + 4 0 + 1 3 ϵ ,
with s = sin ( π ϵ 2 ) and c = cos ( π ϵ 2 ) .
Using 128-bit floating-point numbers, one can numerically approach the theoretical value quite closely with ϵ = 10 3 , namely S k u 333 . Obviously, this value is far above any physically encountered value for a surface, since it would correspond to a globally flat surface with isolated peaks and valleys of very large amplitude. However, during the generation of a random series prior to the application of a digital filter, such values may be required.
The key point here is that the S k u m a x curve cannot be easily plotted, since it depends on the implementation of the distribution (floating-point encoding and the value of ϵ ). For readers aiming to approximate the theoretical curve as closely as possible, it may be necessary to decompose the statistical moments according to intervals:
π 2 ( 1 ϵ l ) , π 2 ( 1 ϵ u ) = π 2 ( 1 ϵ l ) , π 2 ( 1 α ) π 2 ( 1 α ) , π 2 ( 1 α ) π 2 ( 1 α ) , π 2 ( 1 ϵ u ) ,
with ( a , b ) = ( ϵ l , ϵ u ) , a pair of very small values, e.g., 10 6 , and α = 10 3 a value for which the integral can be computed numerically without accuracy issues. The idea is then to approximate the integrals near ± π 2 by series expansions in ϵ l and ϵ u . The point here is to test the overall robustness of the analytic–numeric approach.

Appendix B.2.2. Modified Exponential-Based Distribution

For the exponential-based distribution, the number of parameters was limited to three: two parameters for the integration bounds and one parameter for the x 3 component. Moreover, the choice of normalizing x 3 over the integration interval has the following effects:
1.
It favors the binary-distribution effect when the integration bounds move far from the origin,
2.
It amplifies the influence of x 3 near the origin.
The maximum value of S k u is reached in case 2, on [ x a , x b ] = [ ϵ , + ϵ ] ; therefore,
μ = lim l 1 2 ϵ ϵ + ϵ x 2 ϵ 3 d x = 0 , σ 2 = lim l 1 2 ϵ ϵ + ϵ x 2 ϵ 6 d x = 1 7 . 2 6 , S k u = lim l 1 2 ϵ ϵ + ϵ x 2 ϵ 12 . 7 2 . 2 12 d x = 49 13 3.77 .
In practice, the NSGA-II algorithm in Pymoo does not succeed in properly approaching this limit. The reason lies in the infinitesimals induced by the integration interval and the presence of exponential and power functions. This theoretical limit replaces the numerical value obtained, which is lower.

Appendix B.3. Maximum of Both Sku and Ssk

i.e., ( S s k , S k u ) = max { ( S s k , S k u ) ( a , b ) , ( a , b ) ] 0 , 1 ] 2 }

Appendix B.3.1. Tangent-Based Distribution

For the tangent-based distribution, the situation is complex, as previously explained. To obtain large values for the pair ( S s k , S k u ) , it suffices to take the integration interval [ π 2 ( 1 ϵ ) , 0 ] , with ϵ very small. Once again, the values ( | S s k | , S k u ) are upper-bounded by ( n 3 , n 2 ) .

Appendix B.3.2. Modified Exponential-Based Distribution

For the exponential-based distribution, in order to decenter and flatten the distribution as much as possible, it suffices to select a lower integration bound of zero and an upper bound l , and to cancel the x 3 function:
μ = 1 l 0 l 1 exp ( x ) d x 1 , σ 2 = 1 l 0 l 1 exp ( x ) 1 2 d x 1 2 l , S s k = 1 l 0 l exp ( x ) 3 ( 2 l ) 3 2 d x 2 3 2 3 l , S k u = 1 l 0 l exp ( x ) 4 4 l 2 d x l .
This choice maximizes both S s k and S k u . When l is sufficiently large, the function f ( x ) = 1 exp ( x ) yields for most x i a value around 1, and for x 0 = 0 , the value is 0. Hence, the statistical moments can be deduced, computed over the corresponding dataset, by taking for the two values n 1 and n 1 1 , which ensures μ = 0 and σ = 1 .
S s k = 1 n n 1 3 + ( n 1 ) n 1 3 n 3 , S k u = 1 n + n 1 4 + ( n 1 ) n 1 4 n 2 ,
and Pearson’s inequality is naturally satisfied, since the distribution is binary. Thus, for the exponential based distribution, ( | S s k | , S k u ) ( n 3 , n 2 ) , a result also confirmed numerically.

Appendix C. Impact of the Statistical Moments Ssk and Sku on the Noise Autocorrelation

Table A1 details the number of a c f values of a random surface that exceed a threshold t h , as a function of skewness ( S s k ) and kurtosis ( S k u ). The generated surfaces contain 1024 × 1024 data points. The statistical moments satisfy the relation S k u = 1.1 × S s k 2 + 1.8 , ensuring that the values remain near the Pearson boundary. It is observed that, in contrast to white noise, secondary peaks can occur.
Table A1. Number of a c f values, except the center, exceeding threshold t h as a function of S s k and S k u for a random surface.
Ssk Sku th > 0.05 th > 0.1 th > 0.2
01.8000
−20441.8000
−401761.8000
−603961.8000
−807041.8000
−10011,001.8000
−12015,841.8000
−14021,561.8000
−16028,161.8000
−18035,641.81800
−20044,001.88600
−22053,241.813200
−24063,361.813200
−26074,361.811680
−28086,241.8114200
−30099,001.894260
−320112,641.884300
−340127,161.866420
−360142,561.860280
−380158,841.844300
−400176,001.840266
−420194,041.8302010
−440212,961.8262012
−460232,761.826188
−480253,441.824166
−500275,001.818126

References

  1. Leach, R. Characterisation of Areal Surface Texture; Springer: Berlin/Heidelberg, Germany, 2013. [Google Scholar]
  2. ISO 25178-2:2021; Geometrical Product Specifications (GPS)—Surface Texture: Areal— Part 2: Terms, Definitions and Surface Texture Parameters. International Organization for Standardization: Geneva, Switzerland, 2021.
  3. Wang, W.Z.; Chen, H.; Hu, Y.Z.; Wang, H. Effect of Surface Roughness Parameters on Mixed Lubrication Characteristics. Tribol. Int. 2006, 39, 522–527. [Google Scholar] [CrossRef]
  4. Sedlaček, M.; Podgornik, B.; Vižintin, J. Correlation between Standard Roughness Parameters Skewness and Kurtosis and Tribological Behaviour of Contact Surfaces. Tribol. Int. 2012, 48, 102–112. [Google Scholar] [CrossRef]
  5. Ba, E.C.T.; Dumont, M.R.; Martins, P.S.; Drumond, R.M.; Martins da Cruz, M.P.; Vieira, V.F. Investigation of the Effects of Skewness Rsk and Kurtosis Rku on Tribological Behavior in a Pin-on-Disc Test of Surfaces Machined by Conventional Milling and Turning Processes. Mater. Res. 2021, 24, e20200435. [Google Scholar] [CrossRef]
  6. He, P.; Lu, S.; Wang, Y.; Li, R.; Li, F. Analysis of the Best Roughness Surface Based on the Bearing Area Curve Theory. Proc. Inst. Mech. Eng. Part J. Eng. Tribol. 2021, 236, 527–540. [Google Scholar] [CrossRef]
  7. Pawlus, P.; Reizer, R.; Wieczorowski, M. Functional Importance of Surface Texture Parameters. Materials 2021, 14, 5326. [Google Scholar] [CrossRef] [PubMed]
  8. Yang, D.; Tang, J.; Xia, F.; Zhou, W. Rough Surface Characterization Parameter Set and Redundant Parameter Set for Surface Modeling and Performance Research. Materials 2022, 15, 5971. [Google Scholar] [CrossRef] [PubMed]
  9. Chen, J.; Tang, J.; Shao, W.; Li, X.; Yang, D.; Zhao, B.; Dong, H. A New Numerical Simulation Method of 3D Rough Surface Topography with Coupling 3D Roughness Parameters Sdr, Sdq, Spd, Spc, and Characteristic Functions. Tribol. Int. 2024, 200, 110117. [Google Scholar] [CrossRef]
  10. Chen, J.; Zang, F.; Zhao, X.; Li, H.; Tong, Z.; Yuan, K.; Zhu, L. Generating Non-Gaussian Rough Surfaces Using Analytical Functions and Spectral Representation Method with an Iterative Algorithm. Appl. Math. Model. 2025, 137, 115665. [Google Scholar] [CrossRef]
  11. Francisco, A.; Brunetière, N. A Hybrid Method for Fast and Efficient Rough Surface Generation. Proc. Inst. Mech. Eng. Part J. Eng. Tribol. 2016, 230, 747–768. [Google Scholar] [CrossRef]
  12. Borodich, F.M.; Pepelyshev, A.; Jin, X. A Multiscale Statistical Analysis of Rough Surfaces and Applications to Tribology. Mathematics 2024, 12, 1804. [Google Scholar] [CrossRef]
  13. Francisco, A.; Brunetière, N.; Merceron, G. Gathering and Analyzing Surface Parameters for Diet Identification Purposes. Technologies 2018, 6, 75. [Google Scholar] [CrossRef]
  14. Pawlus, P.; Reizer, R.; Wieczorowski, M. A Review of Methods of Random Surface Topography Modeling. Tribol. Int. 2020, 152, 106530. [Google Scholar] [CrossRef]
  15. Wang, Y.; Azam, A.; Wilson, M.C.T.; Neville, A.; Morina, A. A Comparative Study for Selecting and Using Simulation Methods of Gaussian Random Surfaces. Tribol. Int. 2022, 166, 107347. [Google Scholar] [CrossRef]
  16. Hu, Y.Z.; Tonder, K. Simulation of 3-D Random Rough Surface by 2-D Digital Filter and Fourier Analysis. Int. J. Mach. Tools Manuf. 1992, 32, 83–90. [Google Scholar] [CrossRef]
  17. Bakolas, V. Numerical Generation of Arbitrarily Oriented Non-Gaussian Three-Dimensional Rough Surfaces. Wear 2003, 254, 546–554. [Google Scholar] [CrossRef]
  18. Johnson, N.L. Systems of Frequency Curves Generated by Methods of Translation. Biometrika 1949, 36, 149–176. [Google Scholar] [CrossRef] [PubMed]
  19. Collette, Y.; Siarry, P. Optimisation Multiobjectif; Eyrolles: Paris, France, 2002. [Google Scholar]
  20. Coello, C.C.; Lamont, G.B.; van Veldhuizen, D.A. Evolutionary Algorithms for Solving Multi-Objective Problems, 2nd ed.; Genetic and Evolutionary Computation; Springer: Greer, SC, USA, 2007. [Google Scholar] [CrossRef]
  21. Deb, K.; Pratap, A.; Agarwal, S.; Meyarivan, T. A Fast and Elitist Multiobjective Genetic Algorithm: NSGA-II. IEEE Trans. Evol. Comput. 2002, 6, 182–197. [Google Scholar] [CrossRef]
  22. Blank, J.; Deb, K. Pymoo: Multi-Objective Optimization in Python. IEEE Access 2020, 8, 89497–89509. [Google Scholar] [CrossRef]
  23. Lux, T.C. Fmodpy: A Lightweight, Efficient, Highly Automated, Fortran Wrapper for Python. 2024. Available online: https://github.com/tchlux/fmodpy (accessed on 17 September 2025).
  24. Multiprocessing—Process-Based Parallelism. Available online: https://docs.python.org/3/library/multiprocessing.html (accessed on 17 September 2025).
  25. Goodman, L.A. On the Exact Variance of Products. J. Am. Stat. Assoc. 1960, 55, 708–713. [Google Scholar] [CrossRef]
  26. Maxima. Maxima: A Computer Algebra System. 2025. Available online: https://maxima.sourceforge.io/ (accessed on 17 September 2025).
Figure 1. Flowchart of the modified Hu and Tonder algorithm for rough surface generation. Block 1 can be replaced by the recovery of an existing surface. Block 2 can be replaced by a prescribed texture.
Lubricants 13 00506 g001
Figure 2. The principle of a parametric universal function able to cover the whole S s k , S k u domain. The red curves may approach the Pearson boundary, whereas the green curves can lead to high values of S s k and S k u .
Lubricants 13 00506 g002
Figure 3. Best fit of a rotor surface material curve with tangent and modified exponential functions: S s k = 4.3 and S k u = 27.0 . The rotor heights were measured using a white-light interferometric microscope. From the original surface containing approximately one million points, a representative subset of about 2000 points preserving the minima and maxima was retained. The adjusted heights, on the other hand, are generated numerically.
Lubricants 13 00506 g003
Figure 4. Best fit of a rotor surface material curve with tangent and modified exponential functions. Logarithmic scale.
Lubricants 13 00506 g004
Figure 5. Height histogram of the rotor surface showing unimodality.
Lubricants 13 00506 g005
Figure 6. The Pareto front principle.
Lubricants 13 00506 g006
Figure 7. Analytical function boundaries in log scale. Note that for rough surfaces, S s k is most of the time negative. The upper bounds were not fitted, since their analytical form is of no practical significance; the grey lines are only used to delimit the relevant region.
Lubricants 13 00506 g007
Figure 8. Analytical function boundaries.
Lubricants 13 00506 g008
Figure 9. Dental surface of a grazer-type herbivore. 1024 × 512 px surface, size = 132 × 66 μ m. S s k = 1.2 , S k u = 6.0 , S t r i = 1.4 , S a l = 5.2   μ m. The white ellipsis is the autocorrelation function cut at z = 0.5 . Note that S t r i stands for S t r 1 .
Lubricants 13 00506 g009
Figure 10. Industrial rough surfaces used to test the algorithm. The white ellipses are the autocorrelation functions cut at z = 0.5 . Note that S t r i stands for S t r 1 .
Lubricants 13 00506 g010
Figure 11. Localized scratches that cannot result from a convolution operator applied to homogeneous noise.
Lubricants 13 00506 g011
Figure 12. Generated rough surface showing the impact of the a c f non-periodicity.
Lubricants 13 00506 g012
Figure 13. Autocorrelation functions along principal axes ξ and η .
Lubricants 13 00506 g013
Figure 14. Power spectral density of the dental surface that emphasies the a c f non-periodicity. Scales are irrevelant here, as the information is qualitative.
Lubricants 13 00506 g014
Figure 15. Autocorrelation function in 3D view, showing the effect of the modified Tukey window.
Lubricants 13 00506 g015
Figure 16. Generated surface after a c f apodization and a smooth iterative process initiation.
Lubricants 13 00506 g016
Figure 17. Generated non-periodic surface.
Lubricants 13 00506 g017
Figure 18. Autocorrelation functions of the non-periodic surface.
Lubricants 13 00506 g018
Figure 19. Autocorrelation functions along ξ and η for the dental surface.
Lubricants 13 00506 g019
Figure 20. Basic reproduction of the dental surface showing spectral leakage.
Lubricants 13 00506 g020
Figure 21. Reproduction of the dental surface after apodization, showing spurious pits (white circles).
Lubricants 13 00506 g021
Figure 22. Autocorrelation functions along ξ and η after apodization, showing its limited impact.
Lubricants 13 00506 g022
Figure 23. Smooth topography for the iterative process initiation.
Lubricants 13 00506 g023
Figure 24. Reproduction of the dental surface with the smoothing texture.
Lubricants 13 00506 g024
Figure 25. Reproduction of the milled surface.
Lubricants 13 00506 g025
Figure 26. Reproduction of the ground surface.
Lubricants 13 00506 g026
Figure 27. Reproduction of the polished surface, showing a lack of high and flat areas, resulting from the polishing process.
Lubricants 13 00506 g027
Figure 28. Reproduction of the rotor worn surface. Here again, flat areas should be observed.
Lubricants 13 00506 g028
Figure 29. Reproduction of the dental surface after top-hat low-pass filter.
Lubricants 13 00506 g029
Figure 30. Dental surface: low frequencies (LF).
Lubricants 13 00506 g030
Figure 31. Dental surface: high frequencies (HF).
Lubricants 13 00506 g031
Figure 32. Reproduction of the LF dental surface.
Lubricants 13 00506 g032
Figure 33. Reproduction of the HF dental surface.
Lubricants 13 00506 g033
Figure 34. Final result after combination of BF and HF results.
Lubricants 13 00506 g034
Figure 35. Reproduction of the dental surface with added scratches.
Lubricants 13 00506 g035
Figure 36. Reproduction of a polished mirror-like industrial surface.
Lubricants 13 00506 g036
Table 1. An example illustrating the limitations of the relations in Equation (4).
Width ( μ m)Height ( μ m)wh Ssk z Sku z l ξ ( μ m) l η ( μ m)
200.0200.010241024−3.015.030.030.0
Table 2. Resulting statistics S s k and S k u with the parameters shown in Table 1.
Ssk h Sku h Ssk η Sku η
21.81537.3−141.08187.9
Table 3. Qualitative overview of the six surfaces, highlighting the difficulty of each characteristic.
SurfaceNon-GaussianAnisotropy Stri Correlation Length l ξ
Dental + + + + +
Rotor + + +
Milled + + + +
Ground + + +
Polished++ + +
Mirror-polished
Table 4. Changes in spatial parameters with and without surface windowing. S a l : a c f fastest decay rate. S t r : Texture aspect ratio. S t d : Texture direction.
SurfaceWindowing Sal ( μ m) Str Std   (°)
Original5.227.00 × 10−1−13.0
Reproduced, Figure 20no5.237.00 × 10−1−13.0
Reproduced, Figure 21yes5.875.58 × 10−1−19.0
Table 5. Comparison of hybrid and spatial parameters between the original and the reproduced surface—dental surface case.
Surface Sh (%) Sdr Sasfc Sal ( μ m) Str Std ( ° )
Original4.30 × 1011.70 × 10−22.295.875.57 × 10−119.0
Reproduced2.39 × 1012.08 × 10−22.615.875.58 × 10−119.0
Table 6. Comparison of hybrid and spatial parameters between the original and the reproduced surface—milled surface case.
Surface Sh (%) Sdr Sasfc Sal ( μ m) Str Std ( ° )
Original2.16 × 1011.12 × 10−14.45 × 1012.40 × 1011.01 × 10−16.0
Reproduced1.25 × 1011.46 × 10−15.80 × 1012.35 × 1019.50 × 10−26.0
Table 7. Comparison of hybrid and spatial parameters between the original and the reproduced surface—ground surface case.
Surface Sh (%) Sdr Sasfc Sal ( μ m) Str Std ( ° )
Original3.43 × 1019.63 × 10−21.75 × 1015.404.99 × 10−247.0
Reproduced1.12 × 1011.06 × 10−12.00 × 1015.384.95 × 10−247.0
Table 8. Comparison of hybrid and spatial parameters between the original and the reproduced surface—polished surface case.
Surface Sh (%) Sdr Sasfc Sal ( μ m) Str Std ( ° )
Original1.00 × 1022.12 × 10−62.81 × 10−42.66 × 1014.89 × 10−1−10.0
Reproduced1.00 × 1022.15 × 10−62.94 × 10−42.63 × 1014.90 × 10−1−10.0
Table 9. Comparison of hybrid and spatial parameters between the original and the reproduced surface—rotor surface case.
Surface Sh (%) Sdr Sasfc Sal ( μ m) Str Std ( ° )
Original9.59 × 1012.64 × 10−34.37 × 10−14.107.75 × 10−13.0
Reproduced9.31 × 1012.92 × 10−34.80 × 10−14.057.74 × 10−13.0
Table 10. Changes in spatial and height parameters after top-hat smoothing.
Windowing Sv ( μ m) Sp ( μ m) Smd ( μ m) Sa ( μ m) Sq ( μ m) Ssk Sku Sal ( μ m) Str Std ( ° )
no−2.311.256.84 × 10−23.46 × 10−14.85 × 10−1−1.206.025.865.58 × 10−119
yes−2.141.147.23 × 10−23.45 × 10−14.85 × 10−1−1.276.076.125.64 × 10−119
Table 11. Comparison of hybrid and spatial parameters between the original and the reproduced surface—polished mirror-like surface case.
Surface Sh (%) Sdr Sasfc Sal ( μ m) Str Std ( ° )
Original1.00 × 1023.10 × 10−66.48 × 10−49.386.67 × 10−1−34.0
Reproduced1.00 × 1022.92 × 10−66.12 × 10−49.076.67 × 10−1−34.0
Disclaimer/Publisher’s Note: The statements, opinions and data contained in all publications are solely those of the individual author(s) and contributor(s) and not of MDPI and/or the editor(s). MDPI and/or the editor(s) disclaim responsibility for any injury to people or property resulting from any ideas, methods, instructions or products referred to in the content.