Article

Stability and Tribological Performance of Water-Emulsified Engine Oils for Hydrogen-Fuelled Internal Combustion Engines

by
Nur Aisya Affrina Mohamed Ariffin
1,
Jiahe Poy
1,
King Jye Wong
2,
Jo-Han Ng
3 and
William Woei Fong Chong
1,4,*
1
Faculty of Mechanical Engineering, Universiti Teknologi Malaysia (UTM), Johor Bahru 81310, Johor, Malaysia
2
Department of Mechanical, Materials and Manufacturing, Faculty of Science and Engineering, University of Nottingham Malaysia, Jalan Broga, Semenyih 43500, Selangor, Malaysia
3
Carbon Neutrality Research Group, University of Southampton Malaysia, Iskandar Puteri 79100, Johor, Malaysia
4
Institute for Sustainable Transport (IST), Universiti Teknologi Malaysia, Johor Bahru 81310, Johor, Malaysia
*
Author to whom correspondence should be addressed.
Lubricants 2025, 13(10), 464; https://doi.org/10.3390/lubricants13100464
Submission received: 30 September 2025 / Revised: 17 October 2025 / Accepted: 20 October 2025 / Published: 21 October 2025
(This article belongs to the Special Issue Tribological Impacts of Sustainable Fuels in Mobility Systems)

Abstract

Hydrogen-fuelled internal combustion engines (H2ICEs) generate water vapour that can condense in the sump and form water-in-oil emulsions, altering lubricant performance. This study measures the viscosity–temperature behaviour, copper corrosivity, and boundary tribology of three commercial oils—synthetic (5W-40), semi-synthetic (10W-40), and mineral (15W-40)—emulsified with 5–40 wt% water and tested in both freshly emulsified and aged (3 months; clarified oil layer) states. In fresh emulsions, viscosity rose with water fraction. At 25 C and 40 wt%, the increase was 44.4% (5W-40), 78.7% (10W-40), and 81.2% (15W-40) versus the neat oils. Ageing drove viscosities toward the baseline, with the strongest effect observed for 15W-40, indicating destabilisation. The Vogel–Fulcher–Tammann (VFT) model was fitted to all datasets (RMSE < 5%). A VFT-based screening map uses two ratios at the friction test temperature: R η = η / η neat (relative film-forming tendency) and R s = S / S neat with S = B / ( T T 0 ) 2 (thermal-thinning sensitivity). A Preferred regime, R η 1.25 and R s 0.95 , is correlated with lower friction, smaller wear scars, and copper rating 1a, with most aged conditions migrated out of this regime. Under boundary conditions, 5–10 wt% water generally reduced friction, whereas higher fractions and ageing increased friction and wear. Synthetic oil (5W-40) showed the most robust response.

1. Introduction

The shift towards low-carbon mobility emphasises electrification, but improving internal combustion engines (ICEs) remains essential given their ongoing dominance in the global fleet [1,2]. Hydrogen-fuelled internal combustion engines (H2ICEs) offer a practical near-term option for decarbonised transport because hydrogen combustion does not generate direct CO2 emissions [3,4]. Achieving this potential involves tackling lubrication issues that are unique to hydrogen combustion.
The ring–liner conjunction is especially sensitive to gas forces. Inter-ring pressure gradients modulate ring loading, film thickness, and shear, governing transitions between mixed and boundary lubrication [5]. In H2ICEs, the large amount of water vapour generated during combustion condenses in cooler zones. It is driven into the ring pack by blow-by, directly coupling moisture ingress to the tribological state of this contact [6]. Real-time measurements show that lubricant water content is duty-cycle dependent: short, intermittent operation (typical of hybrid electric vehicle use) promotes water accumulation (up to 24 wt%), whereas sustained hot running drives moisture out of the oil [7]. Consequently, the lubricant experiences repeated wet–dry cycling and, at times, substantial water fractions that favour water-in-oil (W/O) emulsions. Under mechanical agitation and thermal cycling in the sump and ring pack, emulsion stability is controlled by droplet size distribution, interfacial tension, base-oil polarity, and the dispersant–detergent balance [8]. Coalescence, creaming, and partial phase separation can emerge during operation or storage. However, quantitative thresholds—i.e., the water fraction at which bulk rheology and interfacial behaviour begin to degrade—remain poorly defined for engine-relevant oils and temperatures. Recent tribological studies further show that dispersed water droplets can transiently reduce friction under specific droplet-size and load–speed regimes, but promote wear when coalescence or partial phase separation occurs, highlighting a narrow operating window for beneficial emulsion behaviour [9].
Water, as a polar phase, can solubilise, leach, or hydrolyse essential additives (e.g., ZDDP, MoDTC). These processes alter the transport and reactivity of these additives, undermining tribofilm formation [10,11]. Competition between water and emulsifier species for adsorption weakens boundary films on ferrous and copper-containing surfaces, increasing yellow-metal reactivity and shifting the balance between anti-wear and friction-modifying functions [12,13]. When an emulsion destabilises and a distinct aqueous layer develops, boundary contacts become vulnerable to tribocorrosion. The copper-strip outcomes (ASTM D130 [14]) serve as a sensitive proxy for water presence at the metal interface, where progression from grades 1a to 2c indicates conditions favouring oxide formation, pitting, and adhesive smearing [13]. These processes depend on formulation. Consequently, the base-oil type (synthetic, semi-synthetic, mineral) is expected to determine the “stability window” under water exposure. Complementary boundary-regime studies show that even small water levels affect ZDDP-derived tribofilms, impeding outer-layer polymerisation and changing the additive chemistry, thus impacting friction and durability. Notably, these effects may continue after the surface appears dry [15].
High in-cylinder temperatures in H2ICEs can accelerate lubricant oxidation and thermal breakdown, decreasing film thickness and promoting boundary/mixed lubrication [6,12,16]. Emulsification further reorganises the continuous phase and alters the viscosity–temperature profile. Since ring–liner contacts experience rapid flash heating, a non-Arrhenius model is required. The Vogel–Fulcher–Tammann (VFT) framework provides mechanistic parameters ( η 0 , B, T 0 ) that correspond to the viscosity scale, thermal thinning, and low-temperature thickening, respectively [17,18,19]. Although VFT has been adopted in recent lubricant studies [20], systematic VFT analyses across water fraction and ageing for commercial engine oils are limited. Increased mechanical friction is a parallel concern. Hydrogen-fuelled engines can exhibit ∼35% higher frictional power losses than compressed natural gas (CNG) counterparts, primarily due to ring–liner interactions [21]. Surface engineering, such as periodic micropatterns and DLC coatings, can reduce friction and protect degraded films [12,22]. Nonetheless, lubricant robustness under water-rich conditions remains a primary constraint. Together, emulsion-scale friction effects and the water-sensitivity of ZDDP/MoDTC tribofilms [9,15] motivate an integrated approach that couples emulsion stability, viscosity–temperature mapping, and surface reactivity under engine-relevant water loads and ageing.
To address the lack of quantitative, engine-relevant data on oil–water emulsions in H2ICE lubrication, this study performs a controlled evaluation of three commercial engine-oil types—synthetic (5W-40), semi-synthetic (10W-40), and mineral (15W-40). These engine oils are exposed to water fractions of 5–40 wt% in two states: freshly emulsified and aged (three months, ambient). For aged testing, the clarified oil layer is sampled, explicitly excluding the whitish emulsion band and any free water. The objectives are to (i) determine temperature-dependent rheology using the Vogel–Fulcher–Tammann model and extract η 0 , B, and T 0 as mechanistic indicators of film-forming capacity and thermal thinning; (ii) assess water availability at metal surfaces via copper strip corrosion (ASTM D130) as an indicator of tribocorrosion risk; and (iii) measure boundary performance (coefficient of friction, wear-scar diameter) under repeatable ball-on-disk tests. These combined measurements offer a physically meaningful framework that links emulsion stability, viscosity–temperature behaviour, and surface reactivity, supporting comparisons between different base-oil types and enabling screening criteria for H2ICE-related lubricant formulation and selection.

2. Methodology

2.1. Materials and Sample Preparation

Three commercially available Shell engine oils were chosen to represent different base-oil categories: synthetic (5W-40, Helix Ultra), semi-synthetic (10W-40, Helix HX7), and mineral (15W-40, Helix HX5). All oils were sourced from Shell Malaysia Trading Sdn. Bhd., Kuala Lumpur, Malaysia. The SAE viscosity grades were not treated as controlled variables. Instead, they reflected typical market formulations within each base-oil category, enabling the study to concentrate on the impact of water contamination across categories rather than grade-specific effects.
Emulsions were prepared by mixing each oil with deionised water at water fractions of 5–40 wt%, with the neat oils (0 wt%) serving as controls. The emulsification process involved two steps: (i) magnetic stirring at 400 rpm for 10 min to promote vortex formation and droplet dispersion (hotplate–stirrer: Wiggens WH220HT); and (ii) ultrasonication at 60 C for 2 h (bath sonicator: Soltec 2200 EP S3; peak power 260 W; 40 kHz) to further reduce droplet size and improve kinetic stability. Immediately after sonication, dispersions were transferred into test tubes with PTFE-lined caps, filled to a consistent headspace, and sealed while warm to minimise dissolved-air variability. Short-term dispersion quality was verified by visual opalescence and absence of macroscopic phase separation at t = 0 and t = 24 h (1-day). Fresh samples were gently inverted once before viscosity testing to homogenise the dispersion, whereas aged samples were not re-dispersed. All samples, including neat oils, were stored in sealed test tubes at room temperature. Storage conditions were identical for all compositions (dark cabinet, 22 ± 2   ° C ambient, no agitation). Single-use pipettes and vials were employed for sampling to limit cross-contamination.
To simulate lubricant ageing, a portion of each emulsion was stored under ambient conditions for three months (90 days). This horizon was selected as a conservative surrogate for extended off-engine dwell and intermittent engine operation. During this operation, oil moisture accumulates during short runs. It relaxes during lay-up, allowing slow processes—demulsification, droplet coalescence/creaming, and additive partitioning—to manifest beyond the day–week timescale [7,23]. The study does not equate 90 days to a specific duty cycle; rather, it brackets “fresh” versus “time-relaxed” or “aged” states.
Emulsion stratification was monitored non-destructively by periodic photography on days 1, 3, 5, 7, and 90, noting the clarified oil layer, whitish emulsion band, and any free water. Subsequently, fresh samples refer to the freshly emulsified dispersions used as prepared. Aged samples were taken solely from the clarified oil layer, deliberately excluding the whitish emulsion band and any distinct aqueous layer. Unless specified otherwise, the nominal water fraction reported for aged samples corresponds to the initial preparation level (the clarified layer was analysed as the in-service phase). All oils (neat and emulsified) underwent the same storage protocol in a dark cabinet at 22 ± 2   ° C; thus, any oxidative or contaminant effects are common-mode across samples.

2.2. Viscosity Measurement and Vogel–Fulcher–Tammann (VFT) Analysis

Dynamic viscosity was measured using a digital rotary viscometer (NDJ-8S) with rotor #0 selected for the expected range. The rotational speed was adjusted to maintain instrument torque within the optimal range. Measurements were taken from 25 C to 80 C, using a sufficient sample volume to immerse the rotor and fill the steel sample cup. This is especially important at higher temperatures to limit evaporative losses. Fresh samples were gently inverted before loading; aged measurements used only the clarified oil layer (no emulsion band). Each point was measured in triplicate with a fresh loading. Repeatability was typically better than ± 2 % .
Temperature was controlled by a heater band wrapped around a steel sample cup and driven by a PID controller. A single K-type thermocouple (mounted on the outer cup wall beneath the heater band) provided the control and measurement signal. The PID loop was tuned to achieve a stable approach with negligible overshoot (typically <0.2 C at the K-type thermocouple). At each setpoint, the sample was allowed to equilibrate for 10 min (or until the wall–thermocouple reading varied by <0.1 C over 60 s) before data capture. Because only a wall-mounted sensor was used, a small wall–fluid offset is expected. To mitigate this, insulation and a fixed equilibration protocol were applied uniformly so that any residual bias is systematic and cancels in the relative analyses.
Viscosity was recorded at four temperatures (25, 40, 60, 80 C). For VFT analysis, the viscosity–temperature data were fitted to
η ( T ) = η 0 exp B T T 0 ,
where η 0 is the pre-exponential (infinite-temperature) viscosity scale (mPa·s), B is the pseudo-activation constant (K) governing thermal thinning, and T 0 is the Vogel temperature (K) that controls low-temperature thickening via ( T T 0 ) . Temperatures T were expressed in Kelvin.
The parameters ( η 0 , B , T 0 ) were obtained by non-linear least-squares (Excel Solver, GRG Nonlinear) minimizing the RMSE of absolute viscosity relative to the VFT-calculated values. Positivity constraints were introduced for all paratemeters. Multi-start initializations were used and converged solutions were onserved to be stable within the reporting precision. Across all oils, water fractions, and fresh/aged states, RMSE was <5% of the mean measured viscosity. The calculated residuals versus temperature showed no systematic trend, supporting the appropriateness of the three-parameter VFT form over 25–80 C. Where a local temperature-sensitivity index was required, S ( T ) = B / ( T T 0 ) 2 was evaluated at the test temperature for comparison across samples. Screening ratios R η = η / η neat and R s = S / S neat were computed at the same temperature as the friction tests, which reduces sensitivity to any small, systematic temperature-offset errors.

2.3. Copper Strip Corrosion Test

Copper strip corrosion was assessed using a modified ASTM D130 procedure (following Shi and Larsson [24]). Copper coupons (15 ± 1 mm × 13 ± 1 mm × 3 ± 1 mm) were polished sequentially with 120- and 220-grit SiC papers and cleaned with acetone. Strips were placed in test tubes containing either fresh emulsions or the aged oil layers (as described above), with the liquid level at least 5 mm above the top edge of the strip to ensure complete immersion. The tubes were held in an oil bath at 100 ± 1 C for 3 h, after which the strips were rinsed with acetone.
Corrosion severity was determined by visual comparison with the ASTM Copper Strip Corrosion Standard. Each condition was tested in triplicate. While ASTM D130 is not a tribocorrosion test per se, the presence of free/available water indicated by higher strip ratings correlates with conditions that promote synergistic wear–corrosion in sliding contacts [25]. Copper strip tarnish was graded per the ASTM visual comparator (ratings 1a–2c). To improve reproducibility, strips were photographed in a fixed lightbox. Two trained assessors independently assigned ratings against the ASTM reference. Any disagreements in assigned rating were resolved by consensus. The worst-of-three replicate rating is reported.

2.4. Boundary Friction Testing

Friction tests used a custom ball-on-disk tribometer (Figure 1) with an AISI 52100 steel ball (6 mm diameter) sliding on an AISI 304 stainless-steel disk (50 mm diameter, ±1 mm thick). Both the steel balls and stainless-steel disks were sourced from Lasertech Engineering Sdn. Bhd., Senai, Johor, Malaysia. The mean surface roughness R a of the ball and disk was 0.15 μ m and 0.30 μ m, respectively.
Before testing, specimens were rinsed with distilled water, ultrasonically cleaned in acetone, stored in ethanol, then oven-dried at 30 C for 30 min and cooled to room temperature. Lubricant films were prepared by depositing 0.5 mL of the fresh emulsion or the aged oil layer onto the disk and spin-coating at 3500 rpm for 30 s using a compact spin-coater (Zhengzhou CY Scientific Instrument Co., Ltd., Zhengzhou, China) [26]. Pre-/post-coating gravimetry with an analytical balance (±0.5 mg) verified areal mass consistency. Each condition used a new ball and a single-use track to avoid cross-contamination and track polishing. Table 1 summarises the friction test conditions and materials.
The load range in Table 1 targets boundary/mixed lubrication relevant to the ring–liner conjunction in H2ICEs, which exhibits elevated friction and intermittent starvation during the cycle [6]. The computed maximum Hertzian pressures (535–800 MPa for a 6 mm steel sphere on steel) are characteristic of asperity-scale stresses—i.e., a significant fraction of hardened steel hardness—consistent with rough-contact mechanics [27]. The ball-on-disk configuration follows established boundary–tribometry practice (ASTM G99 guidance on pin/ball-on-disk), providing a controlled proxy for boundary contacts. Each load step was repeated three times, and wear was quantified by measuring the ball wear-scar diameter optically.

3. Results and Discussion

3.1. Emulsified Engine Oil

The freshly prepared emulsions in Table 2 appeared visually uniform across all lubricant classes at higher water fractions (≥10 wt%). The synthetic (5W-40) and semi-synthetic (10W-40) oils formed fine, opalescent dispersions at every water fraction, consistent with small droplet sizes and stable water-in-oil structures [28]. By contrast, the mineral (15W-40) formulation at 5 wt% showed a near-clear appearance, indicating poor dispersion and rapid droplet coalescence or phase separation at low aqueous load. This behaviour is likely linked to a less polar base-oil matrix and a more demulsifier-leaning additive balance that provides weaker interfacial stabilisation than the synthetic and semi-synthetic formulations [29]. At higher water fractions (≥10–20 wt%), the mineral oil produced distinctly opalescent emulsions, similar to the other engine oils.
After three months of ambient storage, stability differences became pronounced at a 20 wt% water fraction (Table 3). All stored emulsions exhibited partial phase separation, with visible stratification, within seven days. The synthetic (5W-40) oil maintained a persistent whitish emulsion band and only subsequently developed a transparent aqueous layer. This separation behaviour is consistent with higher base-stock polarity and polar dispersant–detergent additives, which lower interfacial tension, thereby slowing coalescence and creaming [23]. In contrast, the semi-synthetic (10W-40) and mineral (15W-40) oils more readily developed a transparent aqueous layer alongside a thinner emulsion band, consistent with less polar matrices, lower continuous-phase viscosity at room temperature, and additive packages balanced toward demulsification. Similar patterns were observed at other water fractions.

3.2. Viscosity–Temperature Variation

All “aged” viscosity and tribology measurements used only the clarified oil layer; the emulsion band and any free water were explicitly excluded. Thus, aged–fresh comparisons should be interpreted as (clarified) oil-layer vs. freshly emulsified states rather than whole-emulsion vs. whole-emulsion.
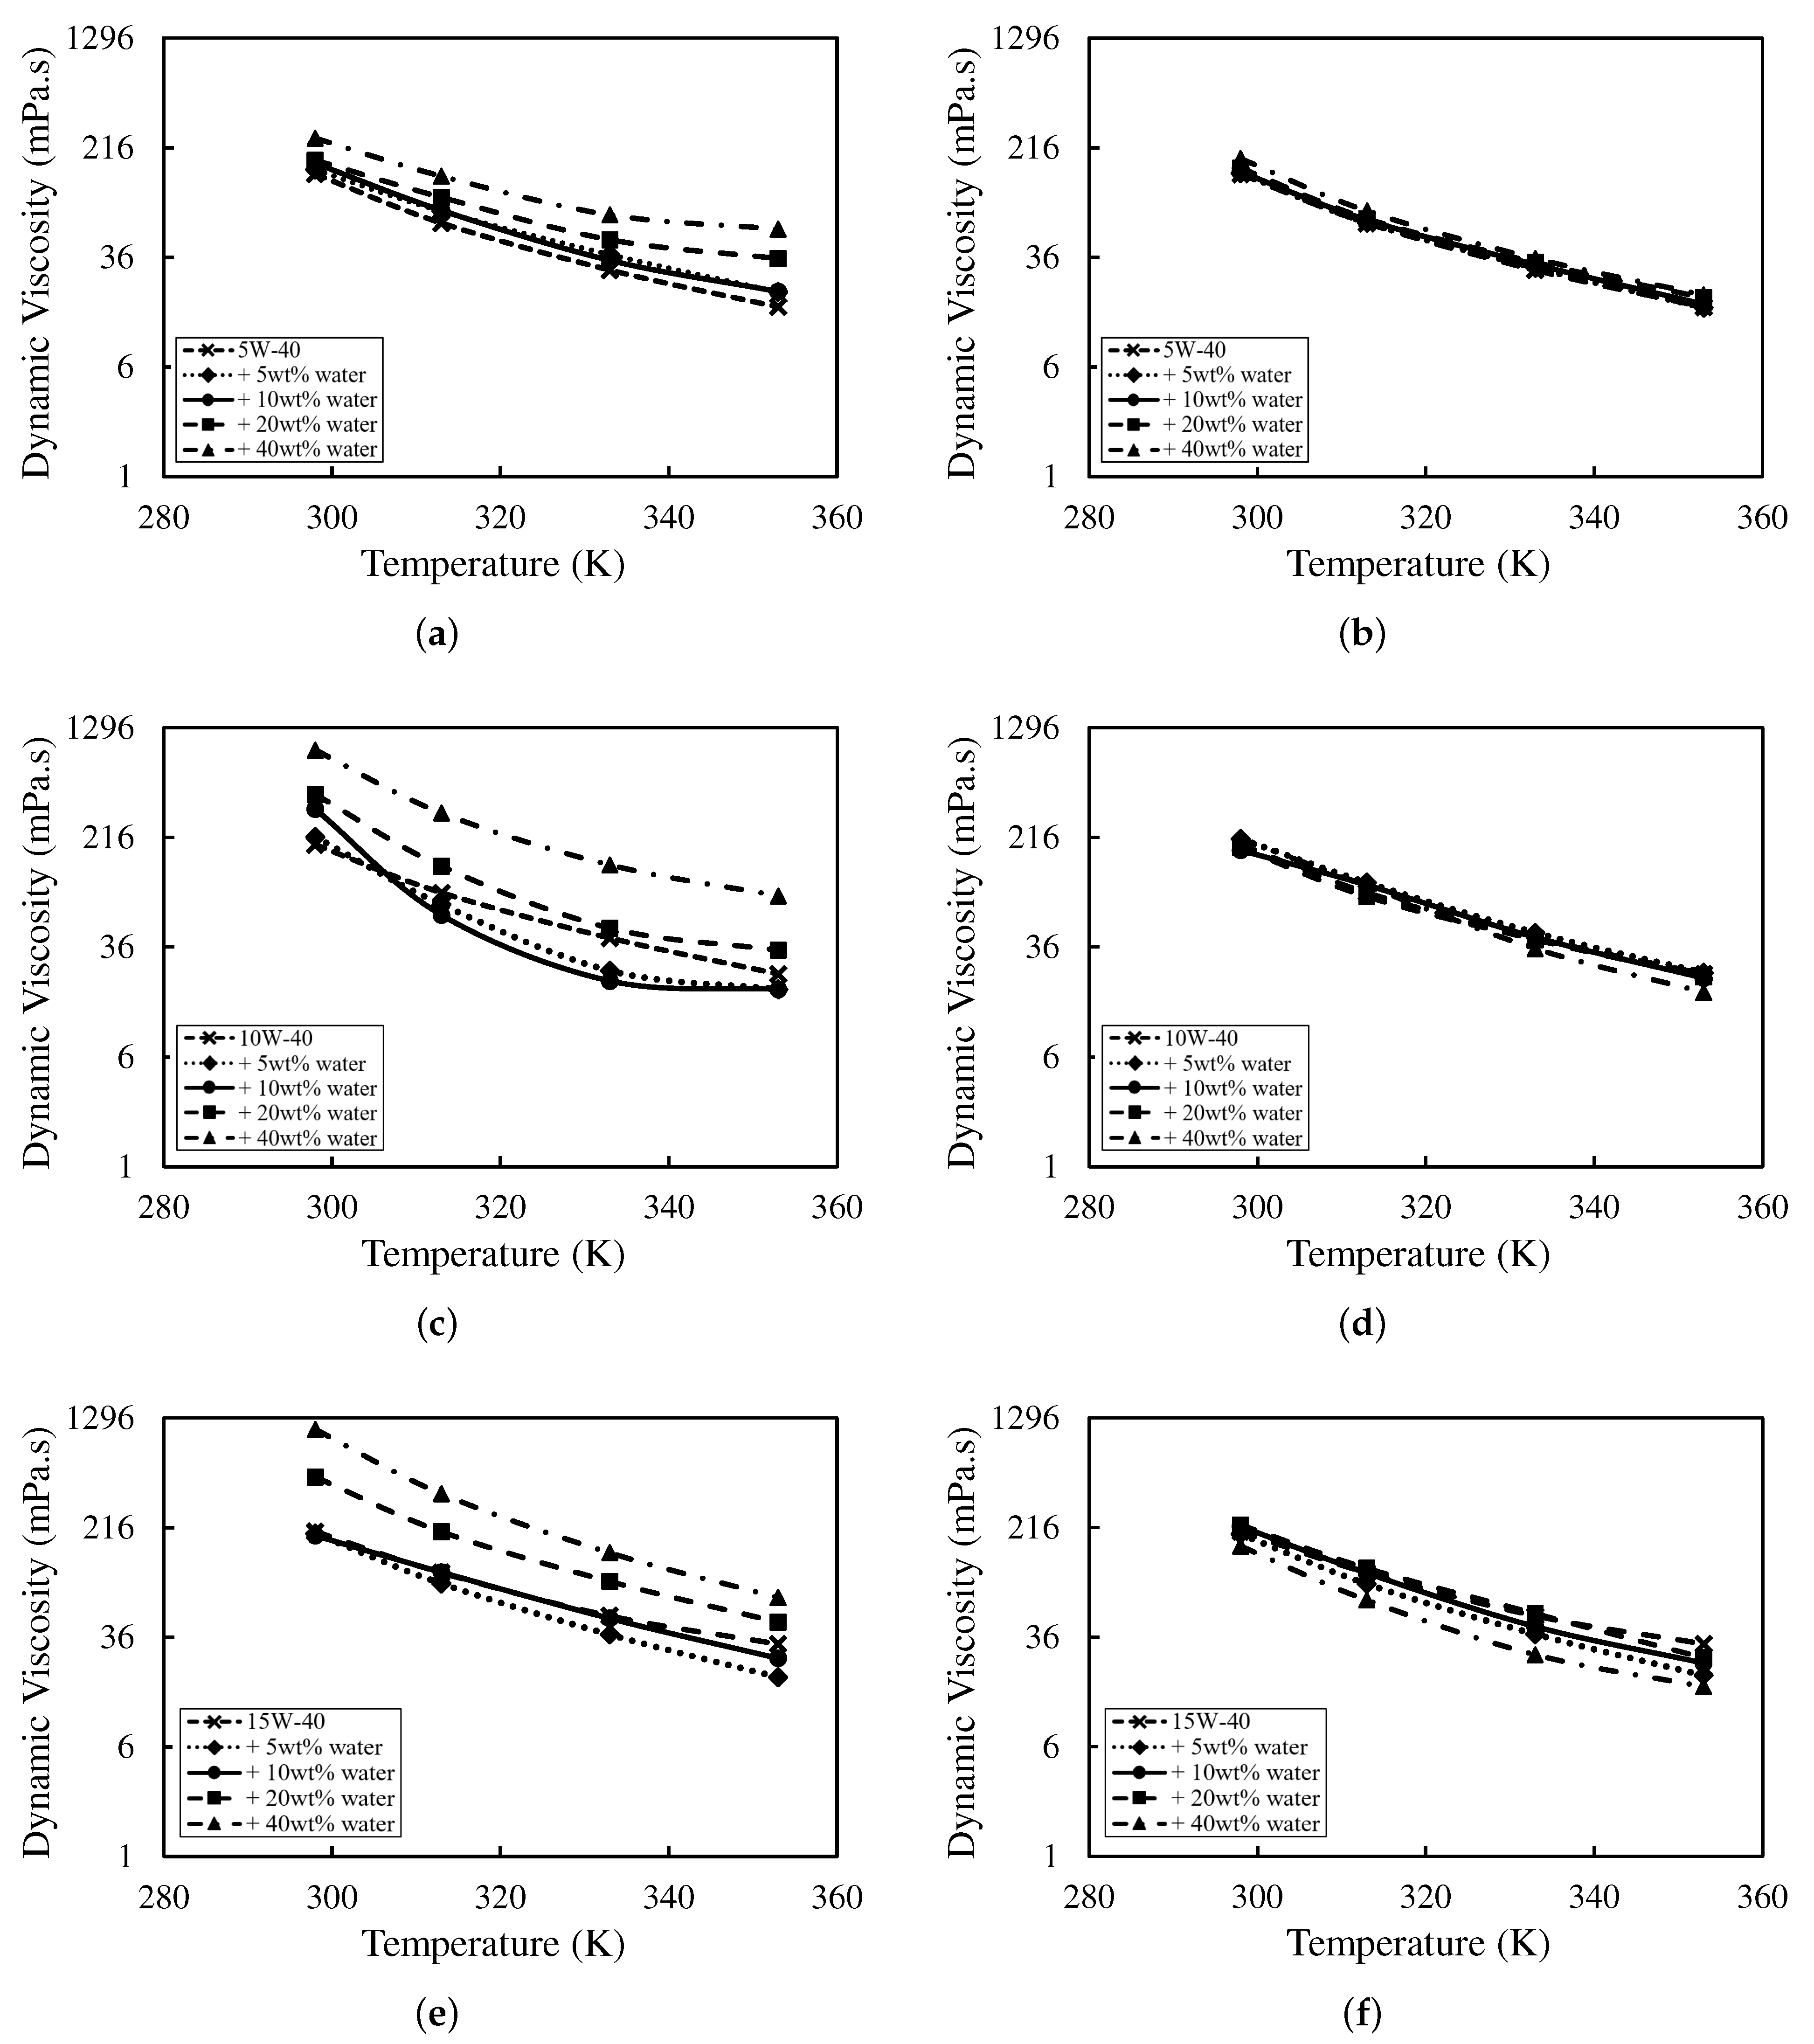
Figure 2 shows viscosity–temperature curves for all oils at water fractions of 5–40 wt% in both freshly emulsified and aged states. At a given temperature, viscosity increases with water fraction across all fresh emulsions, consistent with enhanced hydrogen bonding and dispersed-phase structuring [8,30]. At 25 C, the relative increase at 40 wt% was smallest for the synthetic (5W-40) oil (44.4%), followed by semi-synthetic (10W-40) (78.7%) and mineral (15W-40) (81.2%). This ordering reflects base-oil class and additive chemistry, with mineral formulations generally more susceptible to water-induced thickening than synthetic systems [31].
Aged samples exhibited lower viscosities across all water fractions, especially at lower temperatures, compared with the freshly emulsified samples. This behaviour is consistent with time-dependent demulsification and/or relaxation of the dispersed structure, where partial water release or breakdown of the hydrogen-bonded network lowers the effective dispersed-phase volume fraction [32]. The effect is more substantial at higher water fractions, and aged curves tend to approach the neat-oil viscosity at elevated temperatures, indicating a diminished contribution from emulsified water after storage [33]. For aged tests, only the clarified oil layer (excluding the emulsion band and any free water) was sampled, so the effective dispersed-phase volume fraction in the measured fluid is lower after stratification, especially for less-stable systems.
Among the formulations, the mineral (15W-40) oil showed the most significant viscosity loss upon ageing, especially at 40 wt%, indicating limited emulsion stability. In contrast, the synthetic (5W-40) oil maintained relatively stable viscosities after three months compared to the neat one, consistent with greater resistance to water-induced demulsification. Overall, while water-emulsified oils can exhibit short-term thickening, long-term rheology still depends critically on emulsion stability and base-oil compatibility. These trends align with recent reports that moisture-driven demulsification and additive partitioning reduce viscosity on ageing, and that of emulsion stability [33]. Mechanistically, higher base-oil polarity and a more effective dispersant–detergent balance suppress coalescence and slow creaming, preserving a finer dispersion and therefore a higher effective viscosity after storage. Thus, long-term rheology is strongly governed by base-oil polarity and interfacial properties, with synthetic formulations generally demonstrating greater resistance to water-induced destabilisation than mineral oils [8].
In Figure 2, trendlines are VFT fits (Equation (1)) obtained by non-linear least-squares on η . All compositions achieved RMSE <5%, confirming the suitability of VFT for both fresh and aged states. The optimised parameters ( η 0 , B , T 0 ) are listed in Table 4. The VFT analysis captures how water fraction and ageing reshape η via coordinated shifts in η 0 , B, and T 0 [34,35].
In the fresh state, synthetic (5W-40) shows a marked rise in η 0 with water (0.261 → 14.1 mPa·s, 0–40 wt%), a decrease in B (1030 → 141 K), and an upward shift in T 0 (155 → 249 K). This trend is consistent with stronger low-temperature thickening (smaller T T 0 ) and faster convergence toward neat-oil viscosities at higher temperatures (smaller B) [34]. The semi-synthetic (10W-40) oil also shows rising η 0 with water (to 8.41 mPa·s), with B dipping at 10 wt% (69.4 K) and T 0 elevated (245–280 K), indicating pronounced low-temperature thickening but reduced mid-temperature robustness [34,35]. Lastly, the mineral (15W-40) oil displays a non-monotonic pattern, where very low η 0 at ≤10 wt% is followed by higher η 0 at 20–40 wt%. The term B peaks near 10 wt% (1810 K) and T 0 dips (103 K) before recovering, consistent with weaker interfacial stabilisation at low water fractions and higher oil–water interfacial tension in less-polar base stocks [8].
Ageing (90 days or 3 months) attenuates fresh-state effects. For synthetic (5W-40) at high water, η 0 collapses (14.1 → 0.591 mPa·s at 40 wt%), B rebounds (141 → 497 K), and T 0 moderates (249 → 211 K), indicating loss of dispersed-phase structure [11]. The shifts are stronger for semi-synthetic (10W-40) oil, where aged η 0 becomes very small at 5–10 wt% (down to 0.00405 mPa·s), B increases (to 1570–2300 K), and T 0 drops (84.7–197 K), which is a signature of demulsification and partial water release [8]. The mineral oil (15W-40) exhibits the least regular aged pattern (e.g., B = 2610 K, T 0 = 65.9 K at 20 wt%), consistent with unstable emulsions prone to droplet growth and phase separation [8].
Overall, higher η 0 together with elevated T 0 (smaller T T 0 ) explain the increased low-temperature viscosities in fresh emulsions, while reductions in B explain the faster decay with temperature. After ageing, lower η 0 , recovery/increase of B, and moderation of T 0 drive convergence toward neat-oil baselines and diminish temperature sensitivity [34]. Among base-oil classes, synthetic (5W-40) shows the most controlled parameter evolution. It retains the most coherent VFT signature post-ageing, whereas semi-synthetic (10W-40) and especially mineral (15W-40) oils exhibit larger, less regular shifts, consistent with their weaker dispersion stability observed visually [8,11].

3.3. Corrosion Rating

Table 5 presents the post-test appearance of the copper strips alongside a freshly polished reference, for both freshly emulsified and aged conditions across all water fractions. At low water fractions (≤10 wt%), all oils received a rating of 1a, indicating negligible reactivity with copper. Within this range, the native inhibitor/additive systems appear sufficient to suppress corrosive activity, and results were consistent across replicates. This outcome aligns with the VFT behaviour in Table 4, where fresh samples at ≤10 wt% show moderate T 0 shifts and comparatively larger ( T T 0 ) at 373 K, consistent with dispersed water rather than a distinct free-water phase and thus limited copper contact [7,10].
At higher water fractions (≥20 wt%), tarnishing became evident. The mineral (15W-40) and synthetic (5W-40) oils most frequently received ratings of 2a–2c (slight to moderate discolouration), whereas the semi-synthetic (10W-40) oil tended to show slightly lower (less severe) ratings under the same conditions. These trends are consistent with the fresh-state VFT signatures. For 5W-40 and 10W-40, T 0 rises while B decreases (Table 4), indicating strong low-temperature structuring with easier thermal thinning. At the corrosion-test temperature, the emulsions can remain dispersed without immediately releasing a bulk aqueous layer. By contrast, the mineral oil at 20–40 wt% exhibits higher B with less elevated T 0 , consistent with weaker interfacial stabilisation, larger droplet growth, and water release, conditions that increase copper exposure and tarnish [8].
Ageing accentuated corrosion across all oils, particularly at water fractions of 20–40 wt%. The increased reactivity aligns with the aged VFT patterns, which indicate demulsification and additive depletion. The term η 0 collapses. At the same time, B generally rebounds and T 0 moderates or decreases (Table 4), enlarging ( T T 0 ) at 373 K and signalling loss of the dispersed-phase network. This favours phase separation and formation of a clear aqueous layer (observed visually in Table 3), increasing liquid-water residence at the copper surface and amplifying corrosive attack.
Under identical conditions, the fully synthetic (5W-40) oil generally retained lower ratings than the mineral (15W-40) oil. Its aged parameters (more moderate B and T 0 relative to 10W-40/15W-40 at high water) are consistent with better interfacial film integrity and reduced free-water availability. Collectively, the corrosion outcomes align with the VFT-inferred stability window, where formulations that preserve a higher T 0 (relative to the test temperature) without an extreme rise in B resist water release and exhibit milder copper reactivity. In contrast, systems trending toward low η 0 , high B, and lower T 0 on ageing correlate with greater phase separation and more severe tarnish [10].

3.4. Friction and Wear Properties

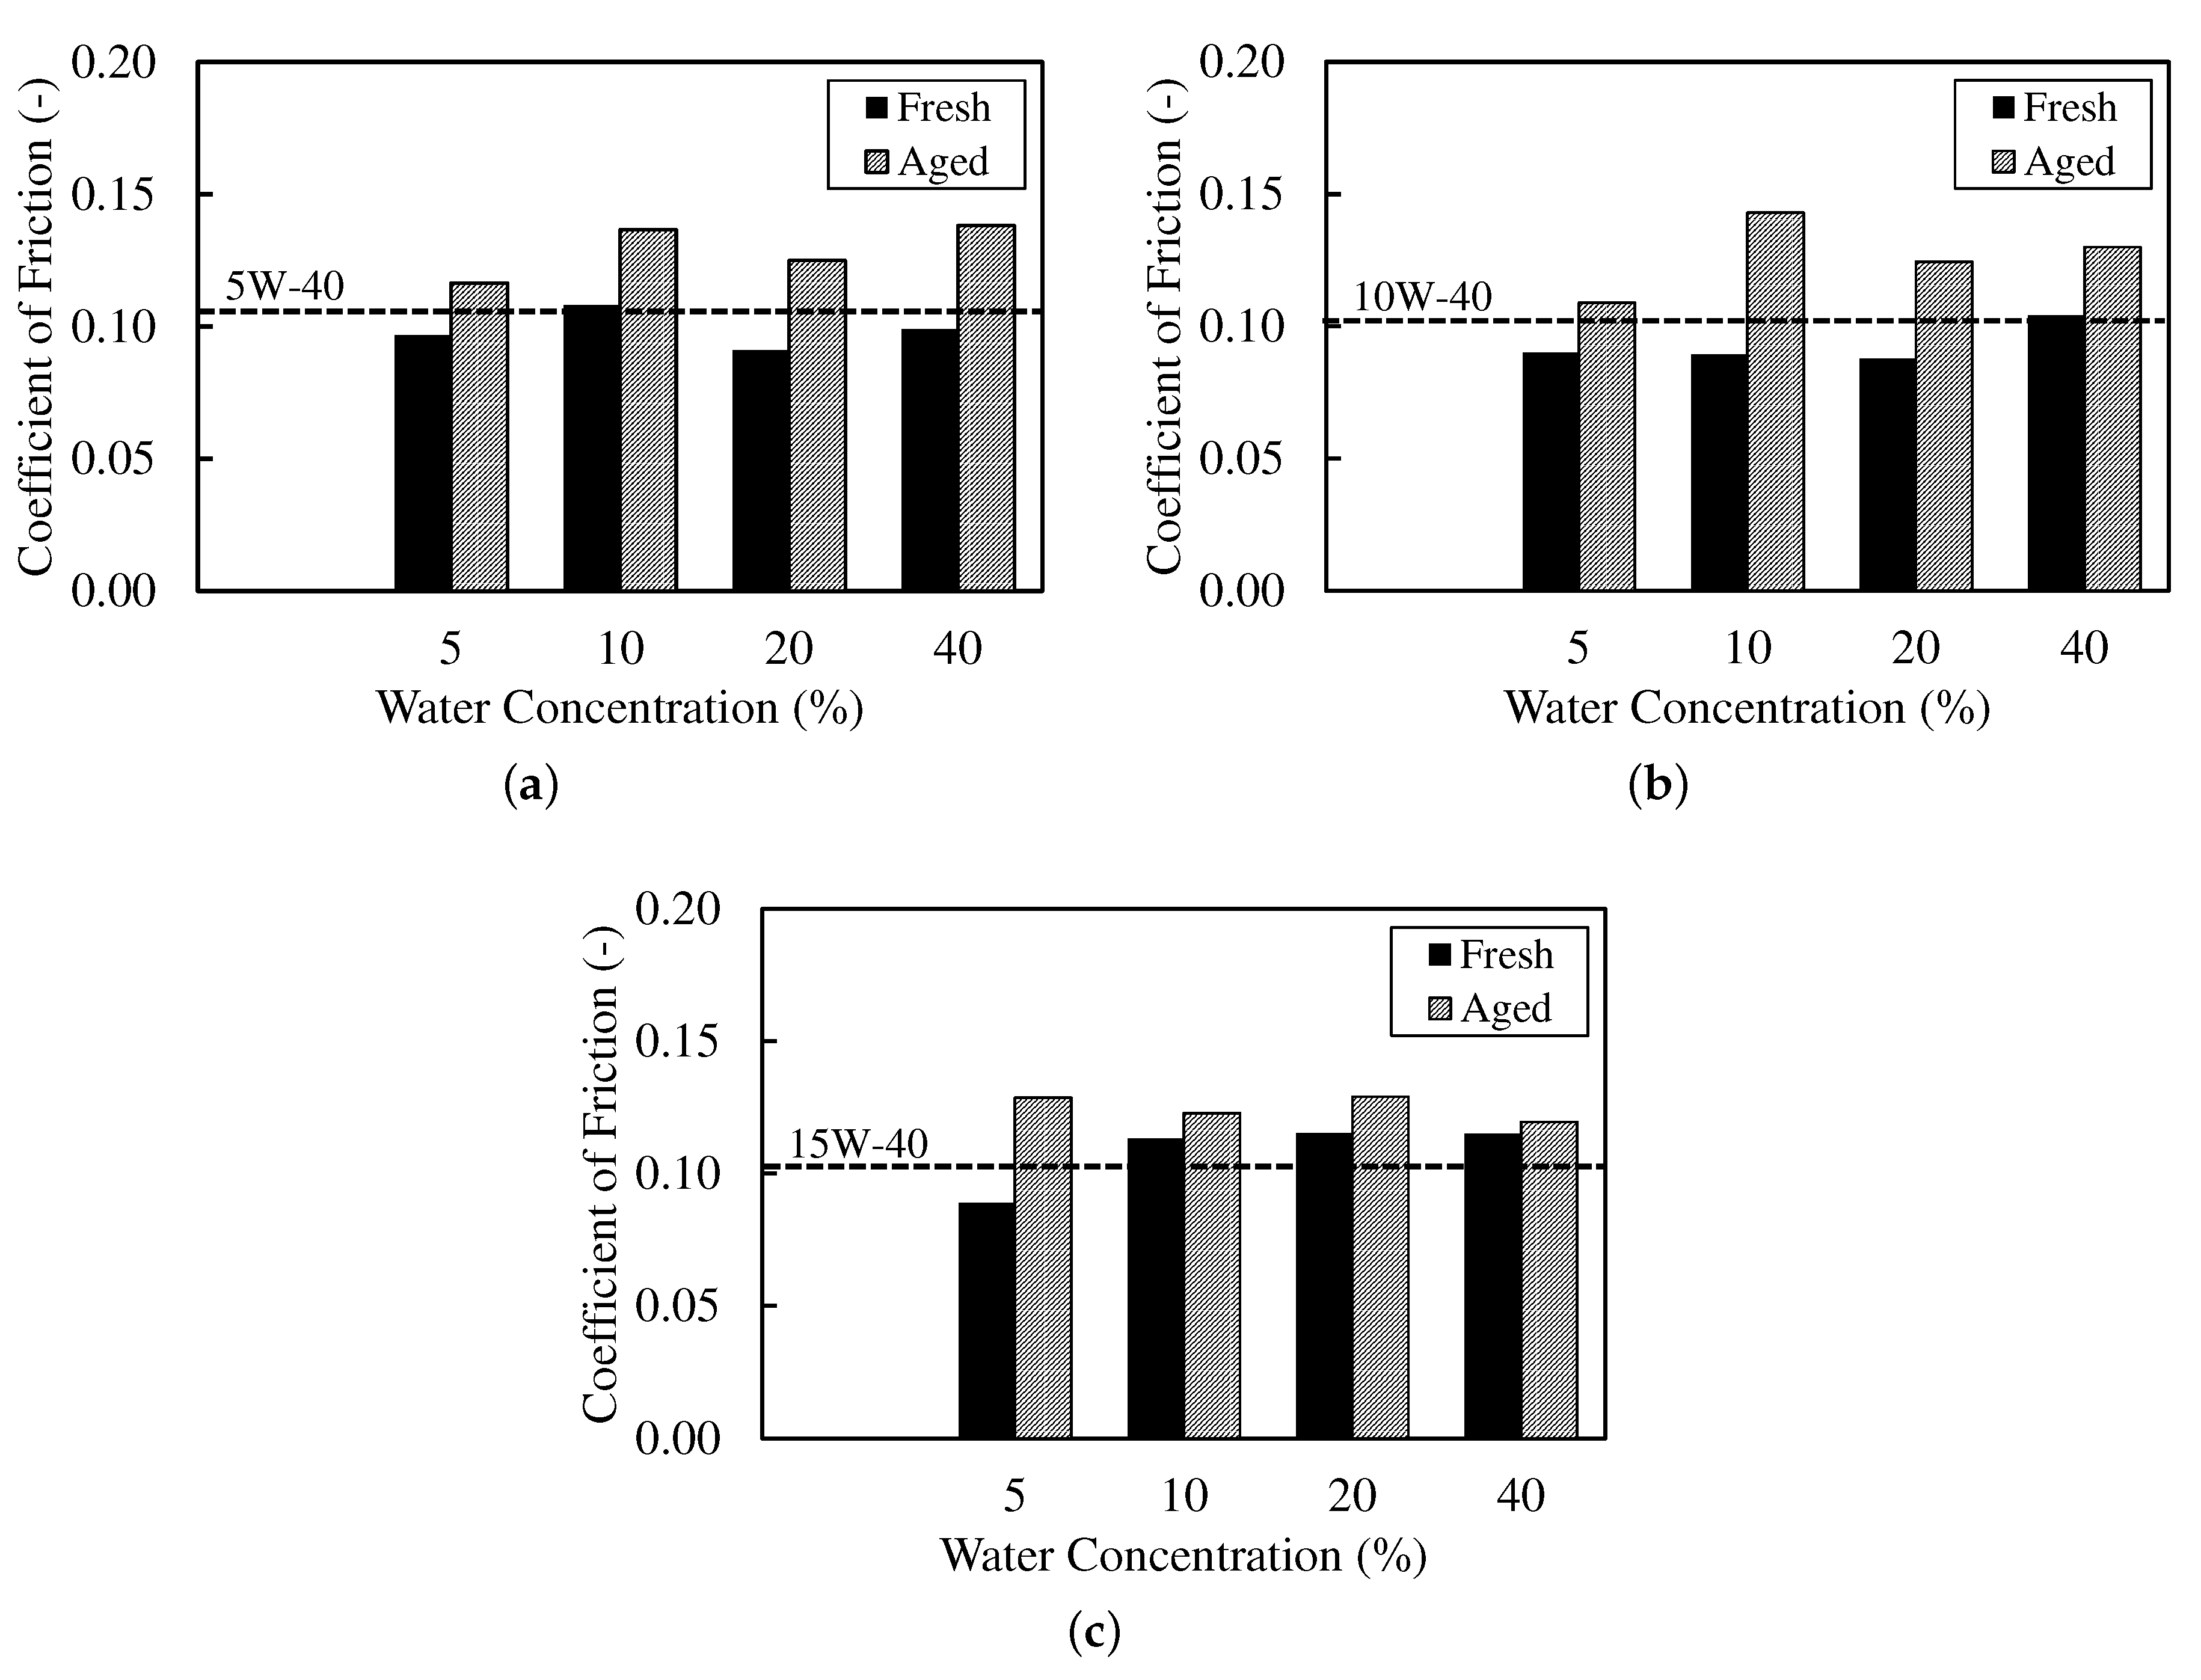
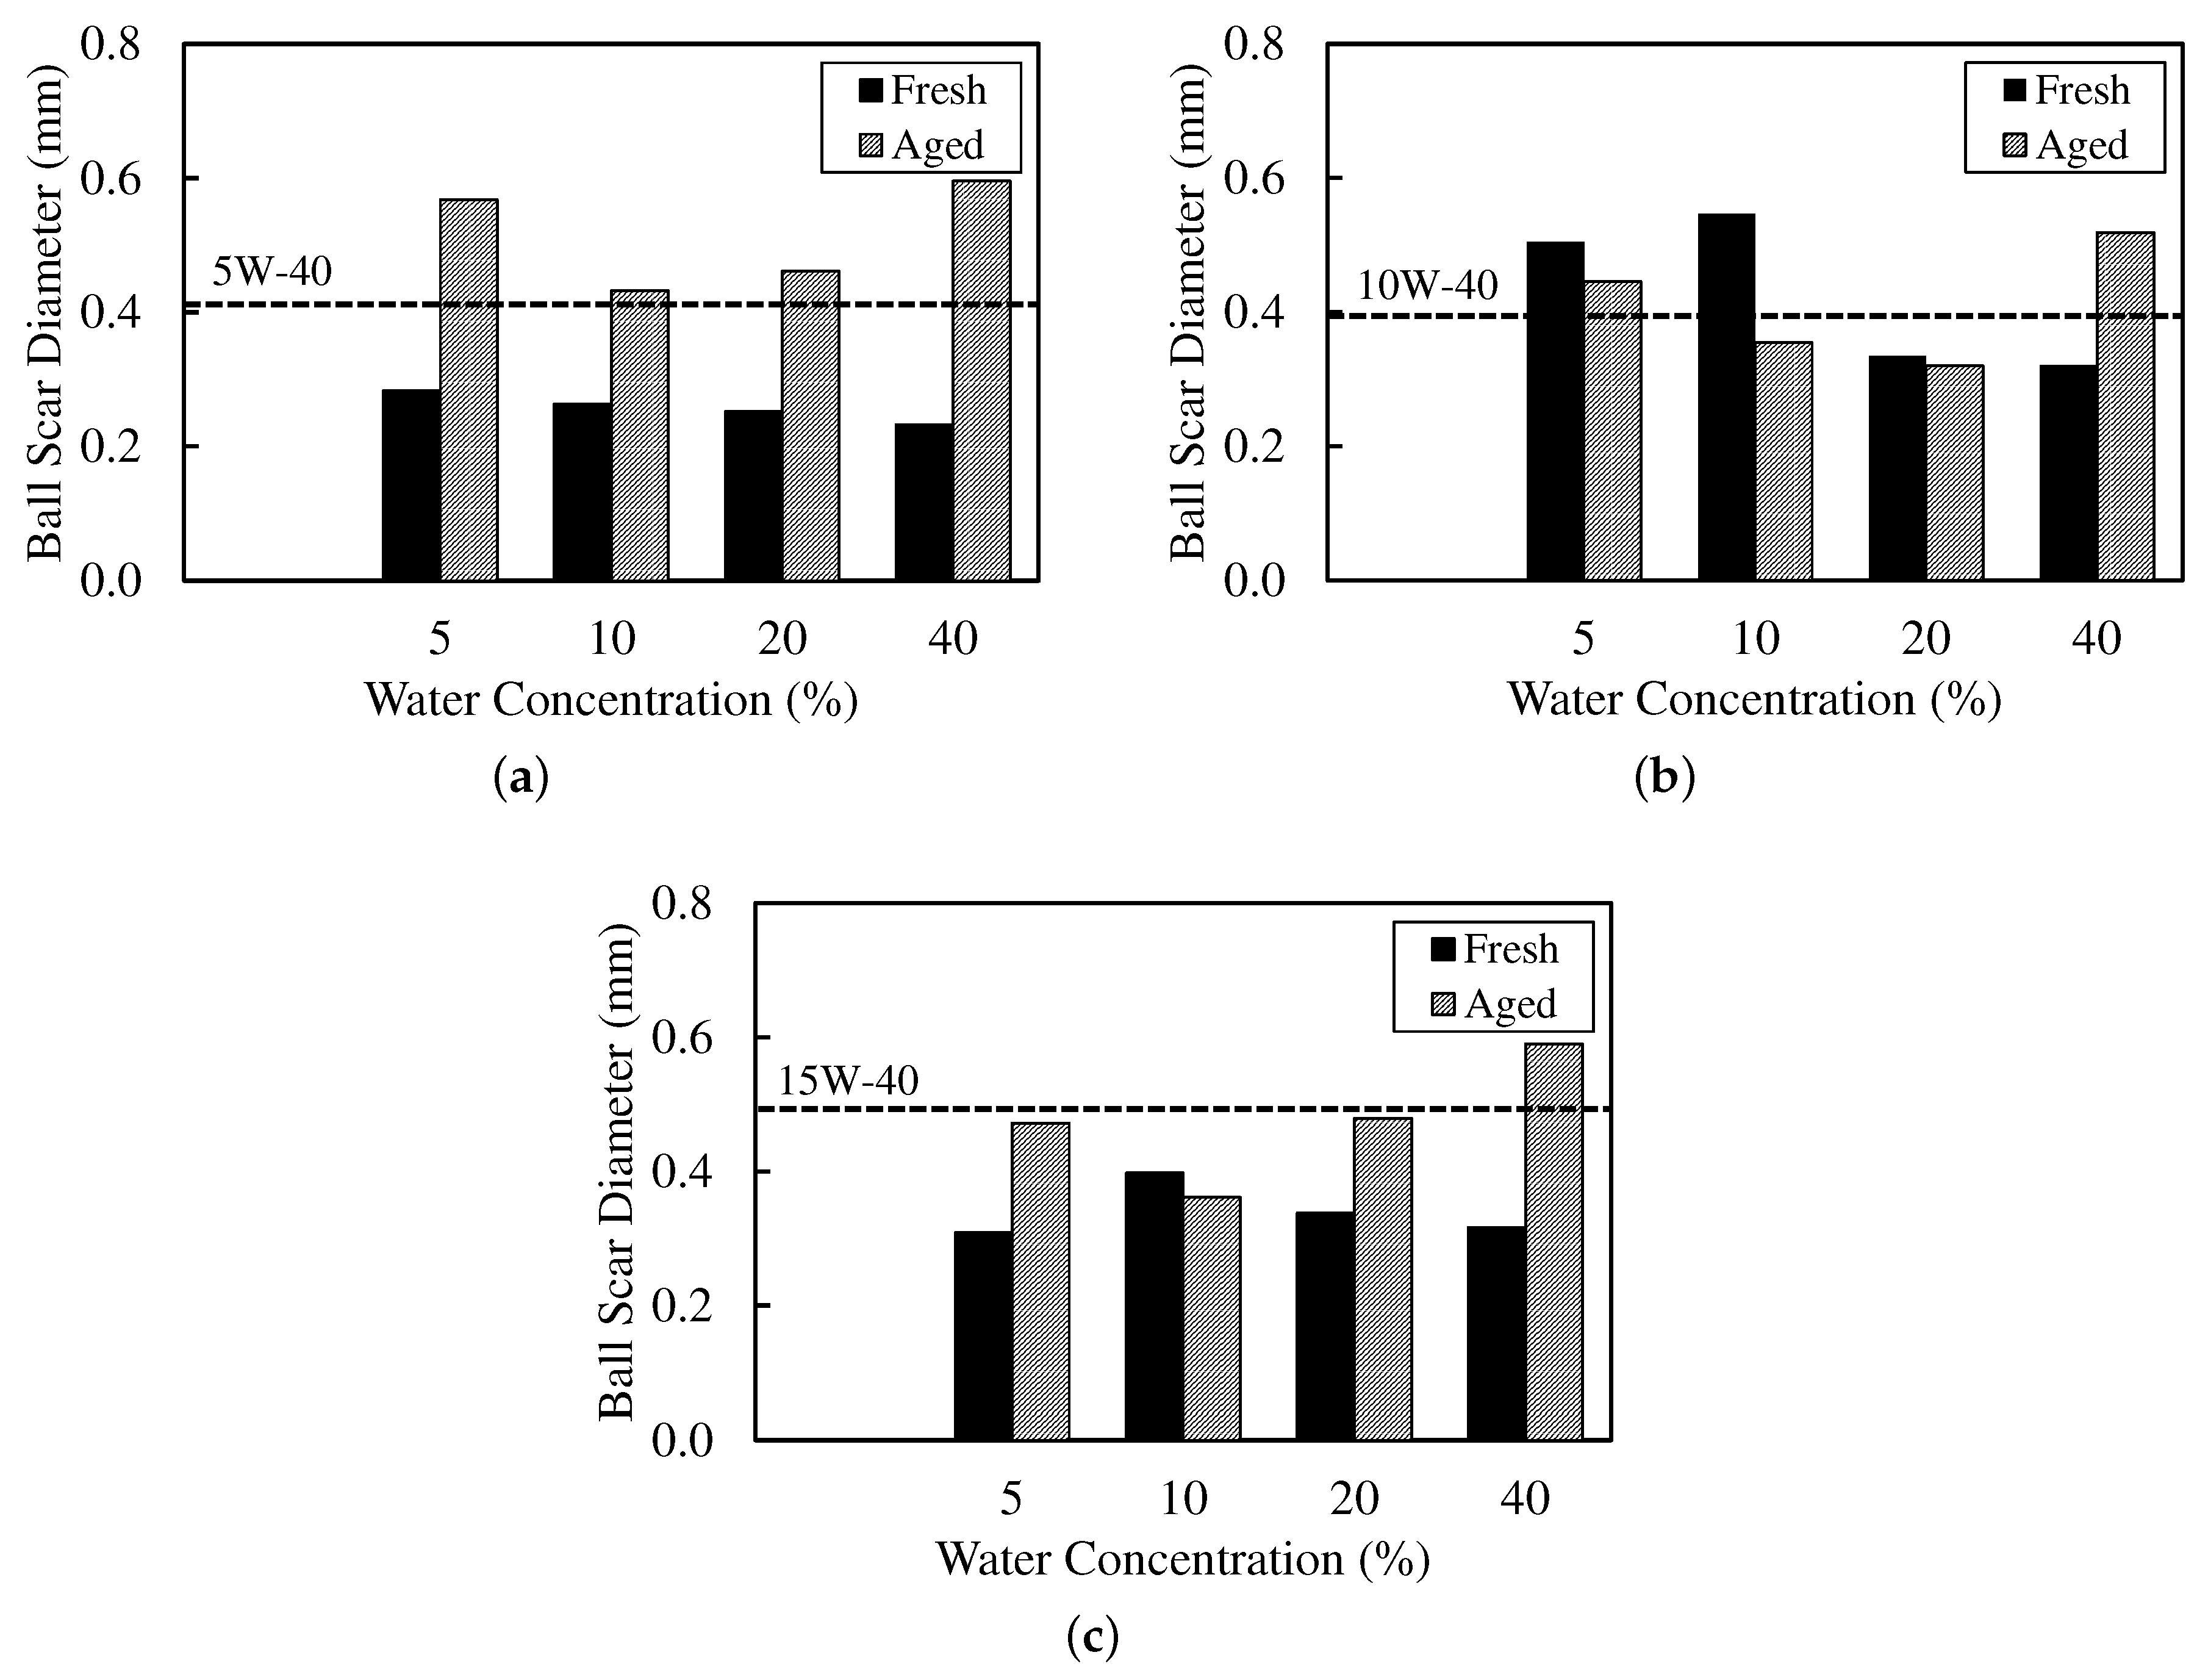
The tribological trends in Figure 3 and Figure 4 are consistent with the VFT signatures (Table 4) and the copper outcomes (Table 5). Each coefficient of friction (CoF) and ball wear-scar diameter (WSD) value shown is the mean of three independent repeats. The associated standard deviations were typically <3%, smaller than the plot symbols, and are omitted for clarity. CoF was computed as the slope of a least-squares fit of time-averaged friction force against normal load across the load steps.
For fresh, low-water emulsions (5–10 wt%), the synthetic (5W-40) oil shows modest CoF (0.10–0.11) with small WSD (0.30 mm), alongside an increase in T 0 (155–198 K) and moderate B (1030→600 K), consistent with a thicker low-temperature film that still thins reasonably with temperature [36,37]. The mineral (15W-40) oil at 5 wt% similarly lowers CoF (0.09) with WSD of 0.30 mm. In both cases, copper rating is 1a at ≤10 wt%, indicating minimal free-water contact. So, wear reductions are attributable to rheology (VFT) rather than tribocorrosion [10].
By contrast, the semi-synthetic (10W-40) oil at 5–10 wt% exhibits low CoF (0.09) but larger WSD (0.50 mm). Its elevated T 0 (245–280 K) and small B (as low as 69.4 K at 10 wt%) imply high local sensitivity. The viscosity is expected to drop rapidly with frictional heating, sufficient to reduce friction but insufficient to maintain anti-wear film thickness—again with copper rating at 1a (i.e., not corrosion-driven) [36]. These paired changes in CoF and WSD are consistent with boundary-regime contact mechanics for lubricated contacts, where ultra-thin boundary films modulate junction shear and real area of contact [38].
At higher water fractions (20–40 wt%), the balance between dispersion stability and boundary-film robustness is clearer. Fresh synthetic (5W-40) at 40 wt% sustains low CoF (0.10) and the lowest WSD (0.20 mm), aligning with high T 0 (249 K) and low B (141 K). Strong low-temperature structuring plus facile thermal thinning can, over short durations, support a protective film even as copper rating transitions to 2a–2c (greater liquid-water availability) [8]. Fresh mineral (15W-40) maintains modest CoF (0.11–0.12). Still, it shows no wear benefit at high water, consistent with less favourable VFT triplets (higher/irregular B with lower T 0 ) and weaker interfacial stabilisation that promote droplet growth and water release. Its higher tarnish ratings at 20–40 wt% corroborate increased free-water exposure [8,10].
Ageing (90 days or 3 months) diminishes or reverses the fresh-state benefits and is mirrored by VFT shifts, indicative of demulsification and additive depletion. The term η 0 collapses (e.g., synthetic 5W-40 at 40 wt% from 14.1 to 0.591 mPa·s), T 0 moderates or drops (249→211 K), and B rebounds (141→497 K). This trend is consistent with loss of dispersed-phase structure and reduced low-temperature thickening [8,10]. Correspondingly, the CoF rises and the WSD increases (5W-40 at 40 wt%: CoF 0.10→0.14; WSD 0.20→0.60 mm), while copper ratings worsen (2a–2c at 20–40 wt%). Such trend signals greater free-water residence and tribocorrosion risk [10]. Aged mineral (15W-40) shows the largest wear at high water (WSD 0.50–0.60 mm at 20–40 wt%), aligning with irregular aged VFT triplets (e.g., B up to 2610 K with T 0 as low as 65.9 K at 20 wt%), which indicate weak low-temperature structuring and poor film resilience [8]. Aged semi-synthetic (10W-40) exhibits mixed responses (e.g., WSD ∼0.40 mm at 10–20 wt% despite higher CoF), reflecting a different balance of thinning kinetics (large B, lower T 0 ) and interfacial stability [39].
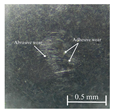
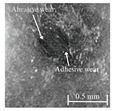
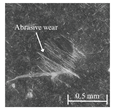
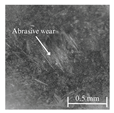
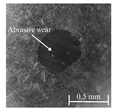
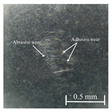
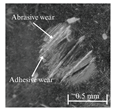
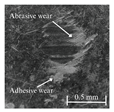
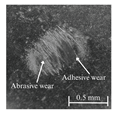
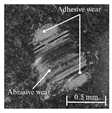
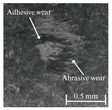
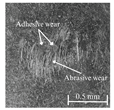
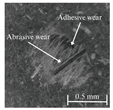
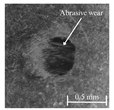
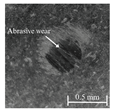
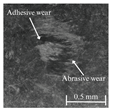
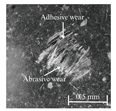
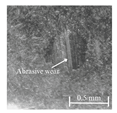
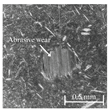
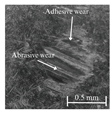
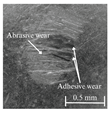
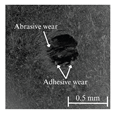
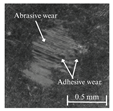
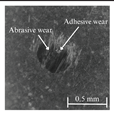
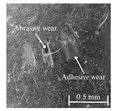
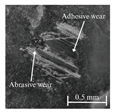
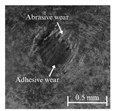
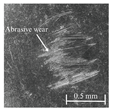
Table 6 presents representative optical micrographs of ball wear scars observed after testing with freshly emulsified samples and the aged clarified oil layers across all water fractions. Morphologically, these scars are characterised by (i) abrasive features (parallel micro-grooves, matte texture) and (ii) adhesive features (smeared transfer patches, plastically flowed rims). For synthetic (5W-40) and semi-synthetic (10W-40) oils at low water fractions (5–10 wt%), the scars mainly show mild abrasion with limited smearing, consistent with smaller WSD. This aligns with their fresh-state VFT signatures (Table 4), where T 0 shifts upward while B remains moderate, resulting in higher η and moderate sensitivity S = B / ( T T 0 ) 2 , conditions that support a thicker boundary film.
As the water fraction increases (20–40 wt%), scars tend to transition towards predominantly abrasive tracks (with occasional adhesive streaks). VFT captures this shift: T 0 stays elevated but B decreases (e.g., fresh 5W-40 and 10W-40), promoting faster thermal thinning under flash heating. When η remains high (e.g., 5W-40 at 40 wt%), abrasion remains mild and WSD is lowest. In cases where η is lower and S higher (e.g., 10W-40 at 5–10 wt%), adhesive patches appear, resulting in WSD increment despite low CoF [8,39].
In the mineral oil (15W-40), mixed abrasive–adhesive mechanisms are evident at all water fractions, characterised by coarser grooves and more frequent transfer patches. This behaviour is consistent with less favourable VFT parameter triplets, where lower or irregular T 0 coupled with elevated B at low–mid water fractions together reduce η and increase the local temperature sensitivity S = B / ( T T 0 ) 2 . The resulting thinner, less resilient film at test temperature explains the larger WSD and the prevalence of abrasive tracks interspersed with adhesive smearing [8,34,35].
Ageing intensifies damage for all oils. Relative to fresh samples at the same water fraction, aged clarified oil layers show wider scars with more pronounced abrasion and intermittent adhesive transfer. The corresponding VFT evolution—collapse of η 0 , rebound of B, and moderated/lower T 0 —lowers η while raising S, indicating films that thin and fail more readily under flash heating. This linkage between frictional heating, viscosity loss, and boundary-film collapse is consistent with mixed/boundary contact models and experiments [39]. The observed scar morphologies and WSD growth therefore follow the VFT-inferred reduction in film robustness, while water-driven additive depletion and emulsion destabilisation further exacerbate tribocorrosion and wear [8,10].

3.5. Integrated Interpretation: VFT Rheology, Friction/Wear, and Copper Corrosivity

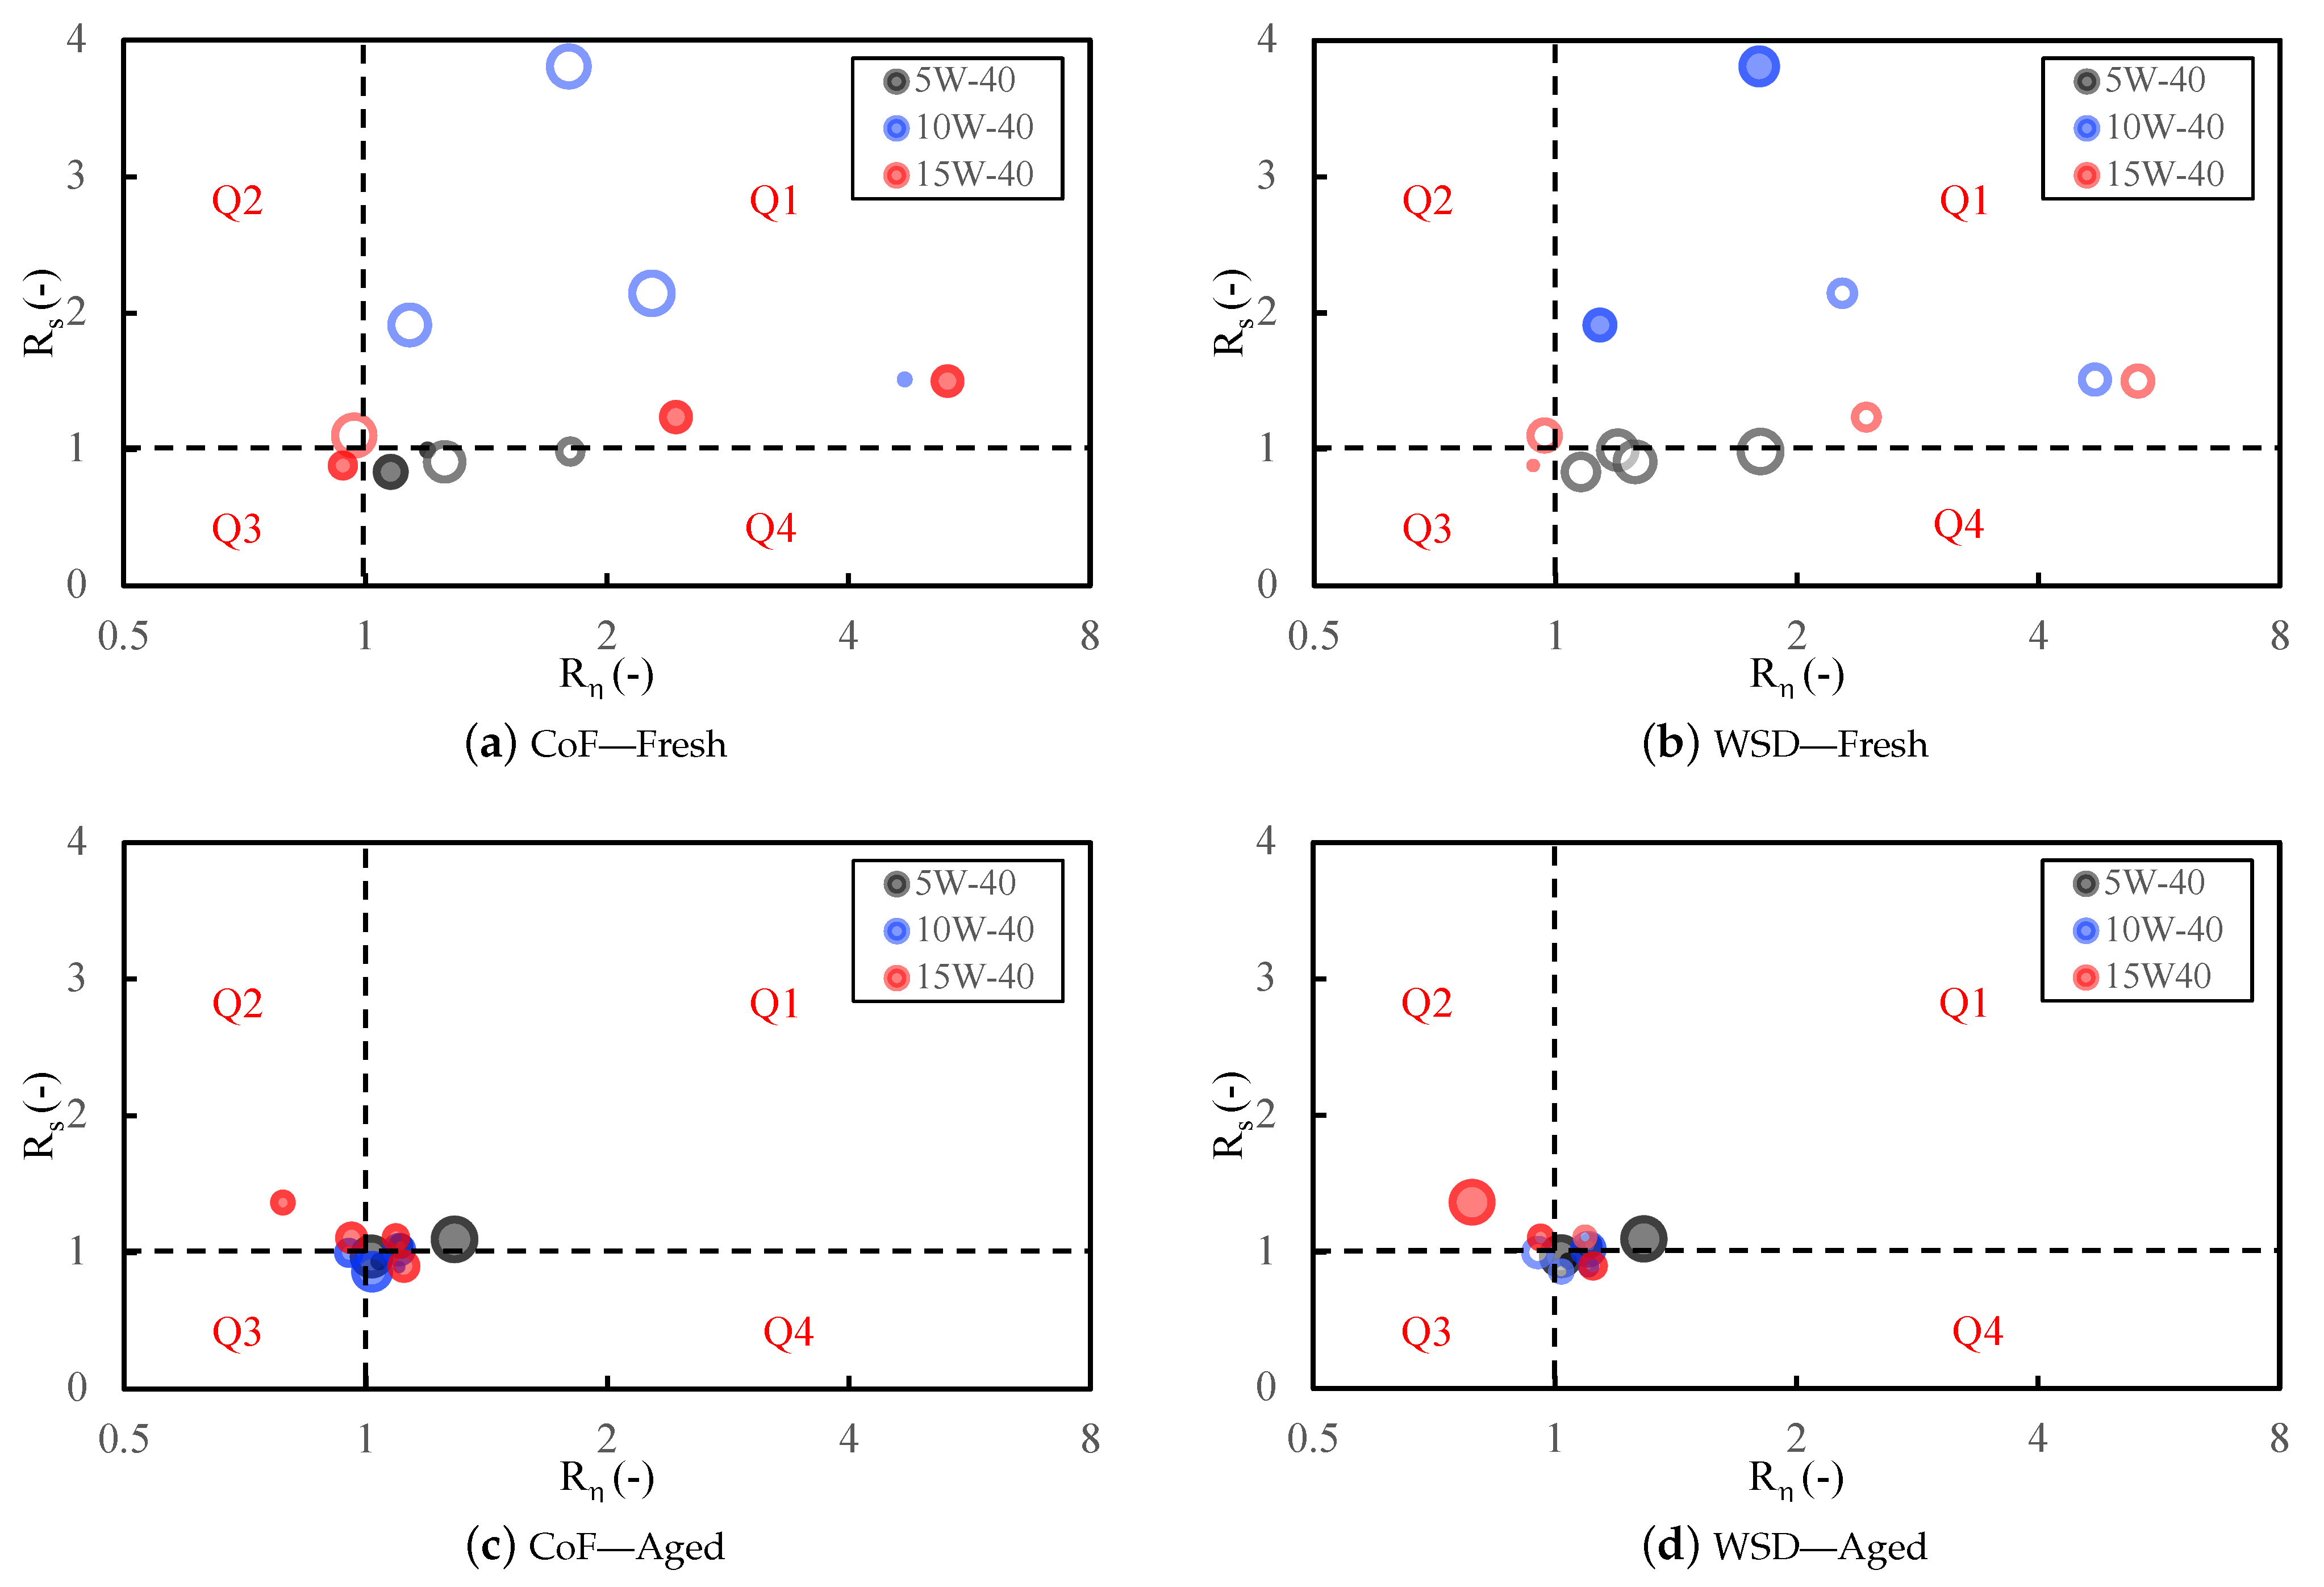
To connect rheology to tribology, two VFT–derived screening ratios were evaluated at the friction-test temperature T test : R η η ( T test ) / η neat ( T test ) (relative film-forming tendency) and R s S ( T test ) / S neat ( T test ) (relative thermal-thinning sensitivity under flash heating, with S = B / ( T T 0 ) 2 ). A simple anti-clockwise quadrant map (Figure 5) uses thresholds R η = 1 and R s = 1 : Q1 (thick and sensitive: R η 1 , R s 1 ), Q2 (thin and sensitive: R η < 1 , R s 1 ), Q3 (thin and stable: R η < 1 , R s < 1 ), and Q4 (thick and stable: R η 1 , R s < 1 , preferred).
Fresh emulsions. Synthetic oil (5W-40) predominantly occupies Q4 across 5–40 wt% ( R η = 1.08 1.80 , R s = 0.83 0.99 ), giving consistently smaller WSD (–31 to –43%) with neutral-to-lower CoF (from +10% at low R η to –14% as R η increases). Copper rating remains 1a at ≤10 wt%, and shifts to 2a–2b at 20–40 wt%. The combination “Q4 + copper rating 1a” indicates rheology-dominated protection (thicker, thermally resilient films) rather than corrosion-assisted damage. Semi-synthetic oil (10W-40) lies mainly in Q1 ( R η = 1.14 4.70 , R s = 1.51 3.81 ). The CoF decreases (–2 to –17%) but WSD rises (+23 to +33%), a signature of rapid flash-thinning of initially thick films, while copper rating stays 1a except at 40 wt% (2c). Mineral oil (15W-40) spans Q2/Q3 at low water and Q1 at high water. The CoF improvements are inconsistent (–16% to +9%) and WSD reductions modest, while copper rating worsens to 2a–2c for 20–40 wt%. Overall, fresh performance ranks Q4 > Q1 > Q3/Q2, mapping to synthetic > semi-synthetic > mineral.
Aged oils (clarified layer). After three months, all oils migrate away from Q4. Synthetic oil (5W-40) shifts toward Q1 ( R η = 1.02 1.29 , R s = 0.94 1.10 ) with higher CoF/WSD (+6 to +45%) and copper rating 1a–2a, consistent with η 0 , B , and moderated T 0 (weaker dispersed-phase network). Semi-synthetic oil (10W-40) straddles Q3/Q4/Q1 ( R η 0.95 1.10 , R s 0.86 1.02 ). The CoF tends to increase (+3 to +35%), while WSD can still improve at mid water (–13 to –22%), indicating partial decoupling of friction and wear as boundary films weaken without strong tribocorrosion (copper rating 1a–2b). Mineral oil (15W-40) occupies Q2/Q1/Q4 depending on water. The CoF and WSD generally rise (up to +44%), with copper rating 1a–2b, reflecting poor film resilience and more persistent water at the surface.
Mechanistic interpretation. Although ASTM D130 is not a tribocorrosion test, higher strip ratings are a practical proxy for water availability and align with sliding conditions that promote synergistic wear–corrosion. Therefore, the quadrant map, read together with copper ratings, highlights three dominant pathways.
  • Rheology-dominated protection (Q4, R η 1 , R s < 1 ): Copper 1a (typical of fresh synthetic oil), lower WSD, and neutral-to-lower CoF because thicker, thermally resilient films limit junction shear and real contact area.
  • Additive weakening/flash-thinning (Q1, R η 1 , R s 1 ): Often lower CoF but higher WSD; initially thick films thin rapidly under flash heating while functional additives are partially compromised.
  • Thin and sensitive (Q2, R η < 1 , R s 1 ): Limited CoF benefit and larger WSD due to both low baseline thickness and high thinning propensity.
  • Thin and stable (Q3, R η < 1 , R s < 1 ): Thermally stable but too thin; CoF is typically neutral or slightly higher and WSD reduction is modest at best, so protection is limited.
Tribocorrosion-assisted wear is indicated by copper ratings of 2a–2c, most often when points fall in Q1/Q2. In this dataset, the migration to copper rating 2a–2c at 20–40 wt% water and after ageing, together with larger WSD and the VFT shift ( R η , R s ) , marks a transition from rheology-dominated protection to tribocorrosion-assisted damage. Under these conditions, available water fosters oxide/oxyhydroxide formation and abrasive debris, while additive partitioning/hydrolysis curtails ZDDP/MoDTC tribofilm renewal [10,13]. This combination explains why CoF may remain moderate even as wear escalates in aged or high-water states.
Screening implication. Q4 (thick and stable) is the only quadrant that consistently delivers lower CoF, smaller WSD, and copper ≤1a. Within Q4, a preferred band defined by R η 1.25 and R s 0.95 captures the conditions most often associated with simultaneous CoF and WSD reductions and benign copper ratings in this study. Q1 can reduce CoF yet risks higher wear, whereas Q2 and Q3 are generally unfavourable. Formulation-wise, shifting systems toward high R η and low R s suggests water-tolerant, polar-rich additive chemistries (e.g., ionic-liquid-based modifiers) that stabilise boundary films and suppress copper reactivity under humid, thermally aggressive duty [26].

3.6. Limitations and Future Work

The present work focuses on first–order, engine-relevant trends; detailed compositional and microstructural diagnostics were beyond the scope. To sharpen mechanistic attribution, follow-on tests will (i) quantify residual water in the clarified aged layer by ASTM D6304 (Karl–Fischer) and (ii) characterise worn tracks by XPS/ToF-SIMS to separate additive-depletion effects from tribocorrosion. Future studies will also refine viscosity thermometry (sensor placement/calibration) and add emulsion microstructure measurements (e.g., droplet size, interfacial tension) to link dispersion physics to VFT shifts. Finally, the VFT-based screening will be validated on ring–liner style rigs under controlled humidity/temperature transients to confirm transferability.

4. Conclusions

Water ingress profoundly alters the physicochemical and tribological behaviour of engine oils under H2ICE–relevant conditions. Low water fractions (≤10 wt%) can transiently thicken fresh emulsions and reduce friction, whereas higher fractions and/or ageing drive demulsification, low-temperature viscosity loss, increased copper reactivity, and accelerated wear. Among the three classes, the synthetic oil (5W-40) proved to be the most resilient, while the mineral (15W-40) oil was the most vulnerable under both fresh and aged states.
Beyond trend description, this work introduces an actionable screening based on the VFT model: two ratios evaluated at the test temperature— R η = η / η neat (film-thickness proxy) and R s = S / S neat with S = B / ( T T 0 ) 2 (flash-thinning sensitivity)—map directly to friction, wear, and copper outcomes. In practice, high R η with low R s (e.g., R η 1.25 , R s 0.95 ) identifies conditions most likely to deliver low CoF, small WSD, and copper rating 1a, while ageing consistently shifts oils away from this region, quantitatively narrowing the stability window and elevating tribocorrosion risk.
The VFT mapping (i) provides a physics-grounded pre-screen for lubricant selection under water exposure, (ii) identifies formulation levers—preserving higher T 0 without excessively increasing B and maintain non-negligible η ( T test ) —and (iii) offers a transferable metric set to compare oils, water fractions, and ageing without repeating full tribocorrosion testing. For H2ICE applications, prioritising synthetic base stocks and tailoring additive packages (antioxidants, anti-wear agents, corrosion inhibitors, and water-management chemistries) should extend service life in wet duty by shifting operating points toward the “thick and stable” quadrant ( R η , R s ).
While the present benchmarks used ambient ageing and bench tribometry, the same VFT-based screening can be validated under engine transients, extended to alternative additive chemistries, and paired with in situ sensing to enable predictive maintenance of hydrogen-fuelled powertrains. Future work will include quantitative moisture analyses of aged layers and surface chemical characterisation (e.g., XPS of wear tracks) to strengthen causal attribution between rheology changes, additive depletion, and tribocorrosion.

Author Contributions

Conceptualization, N.A.A.M.A. and W.W.F.C.; Data curation, N.A.A.M.A. and J.P.; Formal analysis, N.A.A.M.A., K.J.W., and W.W.F.C.; Funding acquisition, W.W.F.C.; Investigation, N.A.A.M.A., J.P., and W.W.F.C.; Methodology, N.A.A.M.A. and J.P.; Project administration, J.-H.N., K.J.W., and W.W.F.C.; Resources, K.J.W. and W.W.F.C.; Supervision, J.-H.N., K.J.W., and W.W.F.C.; Validation, N.A.A.M.A. and J.P.; Visualization, N.A.A.M.A. and J.P.; Writing—original draft, N.A.A.M.A. and J.P.; Writing—review and editing, J.-H.N., K.J.W., and W.W.F.C. All authors have read and agreed to the published version of the manuscript.

Funding

This work was supported by the Ministry of Higher Education (MOHE) Malaysia’s Higher Institution Centre of Excellence (HICoE) program under HICoE Research Grant R.J130000.7824.4J741.

Institutional Review Board Statement

Not applicable.

Data Availability Statement

The original contributions presented in this study are included in the article. Further inquiries can be directed to the corresponding author.

Conflicts of Interest

The authors declare no conflicts of interest.

References

  1. Lieuwen, T.; Emerson, B.; Acharya, V.; Gupta, I. Roles for combustion in a net-zero CO2 society. Proc. Combust. Inst. 2024, 40, 105753. [Google Scholar] [CrossRef]
  2. Link, S.; Stephan, A.; Speth, D.; Plötz, P. Rapidly declining costs of truck batteries and fuel cells enable large-scale road freight electrification. Nat. Energy 2024, 9, 1032–1039. [Google Scholar] [CrossRef]
  3. Wallington, T.J.; Woody, M.; Lewis, G.M.; Keoleian, G.A.; Adler, E.J.; Martins, J.R.; Collette, M.D. Green hydrogen pathways, energy efficiencies, and intensities for ground, air, and marine transportation. Joule 2024, 8, 2190–2207. [Google Scholar] [CrossRef]
  4. Wallington, T.; Woody, M.; Lewis, G.; Keoleian, G.; Adler, E.; Martins, J.; Collette, M. Hydrogen as a sustainable transportation fuel. Renew. Sustain. Energy Rev. 2025, 217, 115725. [Google Scholar] [CrossRef]
  5. Chong, W.W.F.; Howell-Smith, S.; Teodorescu, M.; Vaughan, N. The influence of inter-ring pressures on piston-ring/liner tribological conjunction. Proc. Inst. Mech. Eng. Part J J. Eng. Tribol. 2013, 227, 154–167. [Google Scholar] [CrossRef]
  6. Rahmani, R.; Dolatabadi, N.; Rahnejat, H. Multiphysics performance assessment of hydrogen fuelled engines. Int. J. Engine Res. 2023, 24, 4169–4189. [Google Scholar] [CrossRef]
  7. Butcher, R.; Bradley, N.; Powell, T. Real Time Observations of Water Entering and Leaving Internal Combustion Engine Oil, Over Both Standard Engine, ICE and Plug-in Hybrid, PHEV Dynamic Drive-Cycles. SAE Int. J. Adv. Curr. Pract. Mobil. 2023, 6, 133–144. [Google Scholar] [CrossRef]
  8. Zhou, Z.; Zhou, X.; Huang, Q.; Liu, X.; Wang, L.; Xing, S. Impact of oil-water emulsions on lubrication performance of ship stern bearings. Sci. Rep. 2024, 14, 31478. [Google Scholar] [CrossRef] [PubMed]
  9. Liu, H.; Pape, F.; Zhao, Y.; Ellersiek, L.; Denkena, B.; Poll, G. On the elastohydrodynamic film-forming properties of metalworking fluids and oil-in-water emulsions. Tribol. Lett. 2023, 71, 10. [Google Scholar] [CrossRef]
  10. Al Sheikh Omar, A.; Salehi, F.M.; Farooq, U.; Morina, A. Additives depletion by water contamination and its influences on engine oil performance. Tribol. Lett. 2024, 72, 74. [Google Scholar] [CrossRef]
  11. Su, R.; Cao, W.; Jin, Z.; Wang, Y.; Ding, L.; Maqsood, M.; Wang, D. Deterioration Mechanism and Status Prediction of Hydrocarbon Lubricants under High Temperatures and Humid Environments. Lubricants 2024, 12, 116. [Google Scholar] [CrossRef]
  12. Dobrenizki, L.; Tremmel, S.; Wartzack, S.; Hoffmann, D.C.; Brögelmann, T.; Bobzin, K.; Bagcivan, N.; Musayev, Y.; Hosenfeldt, T. Efficiency improvement in automobile bucket tappet/camshaft contacts by DLC coatings–Influence of engine oil, temperature and camshaft speed. Surf. Coatings Technol. 2016, 308, 360–373. [Google Scholar] [CrossRef]
  13. Apicella, B.; Catapano, F.; Di Iorio, S.; Magno, A.; Russo, C.; Sementa, P.; Tregrossi, A.; Vaglieco, B.M. Impact of fuel and lubricant oil on particulate emissions in direct injection spark ignition engines: A comparative study of methane and hydrogen. Fuel Process. Technol. 2024, 265, 108144. [Google Scholar] [CrossRef]
  14. ASTM D130-20; Standard Test Method for Corrosiveness to Copper from Petroleum Products by Copper Strip Test. ASTM International: West Conshohocken, PA, USA, 2020. [CrossRef]
  15. Dorgham, A.; Azam, A.; Parsaeian, P.; Khan, T.; Sleiman, M.; Wang, C.; Morina, A.; Neville, A. Understanding the effect of water on the transient decomposition of zinc dialkyldithiophosphate (ZDDP). Tribol. Int. 2021, 157, 106855. [Google Scholar] [CrossRef]
  16. Costa, A.; Ferreira, F.; Colaux, J.; Vahidi, A.; Serra, R.; Oliveira, J. Effect of hydrogen incorporation on the mechanical properties of DLC films deposited by HiPIMS in DOMS mode. Surf. Coatings Technol. 2023, 473, 129980. [Google Scholar] [CrossRef]
  17. Vogel, H. The law of the relation between the viscosity of liquids and the temperature. Phys. Z. 1921, 22, 645–646. [Google Scholar]
  18. Fulcher, G.S. Analysis of recent measurements of the viscosity of glasses. J. Am. Ceram. Soc. 1925, 8, 339–355. [Google Scholar] [CrossRef]
  19. Tammann, G.; Hesse, W. Die Abhängigkeit der Viscosität von der Temperatur bie unterkühlten Flüssigkeiten. Z. Anorg. Allg. Chem. 1926, 156, 245–257. [Google Scholar] [CrossRef]
  20. MacLaren, A.; Kadiric, A. Elastohydrodynamic traction and film thickness at high speeds. Tribol. Lett. 2024, 72, 92. [Google Scholar] [CrossRef]
  21. Nikolopoulou, V.I.; Zavos, A.; Nikolakopoulos, P. A Comparative Analysis of Friction and Energy Losses in Hydrogen and CNG Fueled Engines: Implications on the Top Compression Ring Design Using Steel, Cast Iron, and Silicon Nitride Materials. Materials 2024, 17, 3806. [Google Scholar] [CrossRef]
  22. Michelberger, B.; Schell, F.; Jaitner, D.; Götze, A.; Leupolt, B.; Wetzel, F.J.; Leson, A.; Lasagni, A.F. Positive Effect of Periodic Micropatterns on Compression Ring Friction. Adv. Eng. Mater. 2023, 25, 2201708. [Google Scholar] [CrossRef]
  23. Ravera, F.; Dziza, K.; Santini, E.; Cristofolini, L.; Liggieri, L. Emulsification and emulsion stability: The role of the interfacial properties. Adv. Colloid Interface Sci. 2021, 288, 102344. [Google Scholar] [CrossRef]
  24. Shi, Y.; Larsson, R. Non-corrosive and biomaterials protic ionic liquids with high lubricating performance. Tribol. Lett. 2016, 63, 1. [Google Scholar] [CrossRef]
  25. Puthillam, U.; Selvam, R.E. Tribocorrosion in biomaterials and control techniques: A review. Corros. Rev. 2024, 42, 37–56. [Google Scholar] [CrossRef]
  26. Mohamed Ariffin, N.A.A.; Foong, S.Y.; Chong, W.W.F.; Lam, S.S.; Ng, J.H.; Zhang, H. Ionic liquid lubricity enhancement with bio-oil derived from microwave pyrolysis of bamboo. Ind. Crops Prod. 2024, 214, 118543. [Google Scholar] [CrossRef]
  27. Greenwood, J.A.; Williamson, J.P. Contact of nominally flat surfaces. Proc. R. Soc. Lond. Ser. A Math. Phys. Sci. 1966, 295, 300–319. [Google Scholar] [CrossRef]
  28. Kupikowska-Stobba, B.; Domagała, J.; Kasprzak, M.M. Critical review of techniques for food emulsion characterization. Appl. Sci. 2024, 14, 1069. [Google Scholar] [CrossRef]
  29. Zhou, K.; Che, X.; Wei, C.; Tang, Z.; Yu, H.; Wang, D.; Wang, J.; Zhang, L. The Molecular Modeling, Simulation, and Design of Base Oils and Additives in Lubricating Oils: A Review. Processes 2024, 12, 2407. [Google Scholar] [CrossRef]
  30. Cyriac, F.; Yi, T.X.; Poornachary, S.K.; Chow, P.S. Influence of base oil polarity on the tribological performance of surface-active engine oil additives. Tribol. Lett. 2021, 69, 87. [Google Scholar] [CrossRef]
  31. Cañellas, G.; Emeric, A.; Combarros, M.; Navarro, A.; Beltran, L.; Vilaseca, M.; Vives, J. Tribological performance of esters, friction modifier and antiwear additives for electric vehicle applications. Lubricants 2023, 11, 109. [Google Scholar] [CrossRef]
  32. McClements, D.J.; Lu, J.; Grossmann, L. Proposed methods for testing and comparing the emulsifying properties of proteins from animal, plant, and alternative sources. Colloids Interfaces 2022, 6, 19. [Google Scholar] [CrossRef]
  33. Pessanha, T.M.; Varade, S.; Salonen, A.; Langevin, D. Coalescence Frequency in O/W Emulsions: Comparisons of Experiments with Models. Langmuir 2024, 40, 23695–23705. [Google Scholar] [CrossRef] [PubMed]
  34. Wang, Y.; Qiu, Q.; Zhang, P.; Gao, X.; Zhang, Z.; Huang, P. Correlation between lubricating oil characteristic parameters and friction characteristics. Coatings 2023, 13, 881. [Google Scholar] [CrossRef]
  35. Bantchev, G.B.; Cermak, S.C. Correlating viscosity of 2-ethylhexyl oleic estolide esters to their molecular weight. Fuel 2022, 309, 122190. [Google Scholar] [CrossRef]
  36. Chen, Y.Y.; Horng, J.H. Investigation of lubricant viscosity and third-particle contribution to contact behavior in dry and lubricated three-body contact conditions. Front. Mech. Eng. 2024, 10, 1390335. [Google Scholar] [CrossRef]
  37. Manjunath, M.; De Baets, P.; Fauconnier, D. In Situ Measurement and Mapping of Lubricant Film Temperature in Cylindrical Roller Thrust Bearings Using Thin-Film Sensors. Machines 2025, 13, 297. [Google Scholar] [CrossRef]
  38. Chong, W.W.F.; De la Cruz, M. Elastoplastic contact of rough surfaces: A line contact model for boundary regime of lubrication. Meccanica 2014, 49, 1177–1191. [Google Scholar] [CrossRef]
  39. Simpson, M.; Rahmani, R.; Dolatabadi, N.; Morris, N.; Jones, D.; Craig, C. An analytical friction model for point contacts subject to boundary and mixed elastohydrodynamic lubrication. Tribol. Int. 2024, 196, 109699. [Google Scholar] [CrossRef]
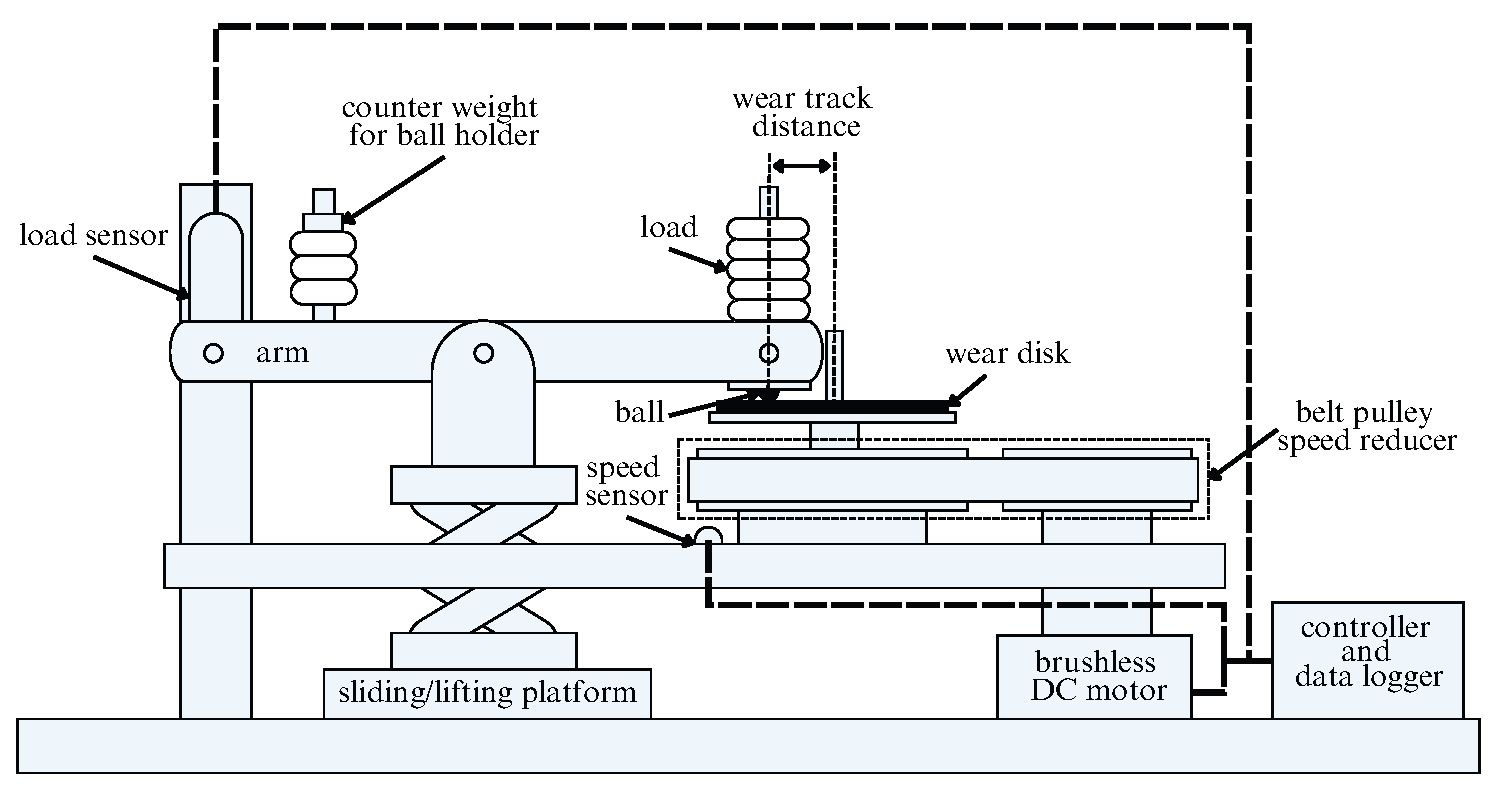
Figure 1. Custom-made ball-on-disk tribometer.
Lubricants 13 00464 g001
Figure 2. Viscosity variation for fresh emulsions of (a) synthetic (5W-40), (c) semi-synthetic (10W-40), and (e) mineral (15W-40); and aged samples of (b) synthetic (5W-40), (d) semi-synthetic (10W-40), and (f) mineral (15W-40).
Lubricants 13 00464 g002
Figure 3. Coefficient of friction (CoF) for (a) synthetic (5W-40), (b) semi-synthetic (10W-40), and (c) mineral (15W-40) across water fractions for fresh and aged conditions.
Lubricants 13 00464 g003
Figure 4. Ball wear-scar diameter (WSD) for (a) synthetic (5W-40), (b) semi-synthetic (10W-40), and (c) mineral (15W-40) across water fractions for fresh and aged conditions.
Lubricants 13 00464 g004
Figure 5. Relative CoF and WSD versus VFT screening ratios ( R η , R s ) at the test temperature. Panels (a,b): fresh; (c,d): aged (clarified oil layer only). Hollow markers: improvement (negative change); solid markers: deterioration; marker size ∝ change magnitude.
Lubricants 13 00464 g005
Table 1. Friction test conditions and properties of ball/wear discs.
ParameterTest Condition/Value
Speed (rpm)500
Load (g)60–200 (20 g increments)
Duration per load (s)255
Young’s modulus, E (ball/disk)210 GPa/210 GPa
Poisson’s ratio, ν (ball/disk)0.30/0.30
Sphere radius, R3 mm
Maximum Hertzian pressure (range)535–800 MPa
Table 2. Freshly emulsified samples of synthetic (5W-40), semi-synthetic (10W-40), and mineral (15W-40) at different water fractions.
SampleWater Fraction (wt%)
0 5 10 20 40
Synthetic (5W-40)Lubricants 13 00464 i001Lubricants 13 00464 i002Lubricants 13 00464 i003Lubricants 13 00464 i004Lubricants 13 00464 i005
Semi-synthetic (10W-40)Lubricants 13 00464 i006Lubricants 13 00464 i007Lubricants 13 00464 i008Lubricants 13 00464 i009Lubricants 13 00464 i010
Mineral (15W-40)Lubricants 13 00464 i011Lubricants 13 00464 i012Lubricants 13 00464 i013Lubricants 13 00464 i014Lubricants 13 00464 i015
Table 3. Stored emulsions at 20 wt% water fraction for (a) synthetic (5W-40), (b) semi-synthetic (10W-40), and (c) mineral (15W-40), illustrating stratification and emulsion band thickness. Note: For all subsequent “aged” measurements (viscosity, friction, wear, and corrosion), only the clarified oil layer was sampled, explicitly excluding the whitish emulsion band and any free water.
SampleDay
1 3 5 7 90
Synthetic (5W-40),
20 wt%
Lubricants 13 00464 i016Lubricants 13 00464 i017Lubricants 13 00464 i018Lubricants 13 00464 i019Lubricants 13 00464 i020
Semi-synthetic (10W-40),
20 wt%
Lubricants 13 00464 i021Lubricants 13 00464 i022Lubricants 13 00464 i023Lubricants 13 00464 i024Lubricants 13 00464 i025
Mineral (15W-40),
20 wt%
Lubricants 13 00464 i026Lubricants 13 00464 i027Lubricants 13 00464 i028Lubricants 13 00464 i029Lubricants 13 00464 i030
Table 4. VFT parameters—the pre-exponential viscosity η 0 , pseudo-activation constant B, and Vogel temperature T 0 —for each oil and water fraction in fresh and aged states. Decimal notation; three significant digits.
Sample η 0 (mPa·s)B (K) T 0 (K)
Fresh Aged Fresh Aged Fresh Aged
 Synthetic (5W-40)
Neat (0 wt%)0.2610.262657657193193
+ 5 wt%0.1160.1601030790155182
+ 10 wt%0.4200.133600870198174
+ 20 wt%4.560.730246455231213
+ 40 wt%14.10.591141497249211
 Semi-synthetic (10W-40)
Neat (0 wt%)0.4670.467614614196196
+ 5 wt%2.580.02371761570258125
+ 10 wt%6.670.0040569.4230028084.7
+ 20 wt%7.050.480135599265197
+ 40 wt%8.410.003612452010245115
 Mineral (15W-40)
Neat (0 wt%)1.481.48449450207207
+ 5 wt%0.05060.08771150992159169
+ 10 wt%0.01810.1741810854103179
+ 20 wt%0.6720.00289652261019965.9
+ 40 wt%0.8740.699625401210224
Table 5. Copper strip appearance and ratings across water fractions for synthetic (5W-40), semi-synthetic (10W-40), and mineral (15W-40) oils in fresh and aged conditions. Note: For aged measurements, the sample taken was the clarified oil layer only, explicitly excluding the whitish emulsion band and any free water.
SampleConditionWater Concentrations (wt%)
0 5 10 20 40
Freshly polishedLubricants 13 00464 i031
5W-40FreshLubricants 13 00464 i032Lubricants 13 00464 i033Lubricants 13 00464 i034Lubricants 13 00464 i035Lubricants 13 00464 i036
1a1a1a2a2b
AgedLubricants 13 00464 i037Lubricants 13 00464 i038Lubricants 13 00464 i039Lubricants 13 00464 i040Lubricants 13 00464 i041
1a1a1a2a2a
10W-40FreshLubricants 13 00464 i042Lubricants 13 00464 i043Lubricants 13 00464 i044Lubricants 13 00464 i045Lubricants 13 00464 i046
1a1a1a1a2c
AgedLubricants 13 00464 i047Lubricants 13 00464 i048Lubricants 13 00464 i049Lubricants 13 00464 i050Lubricants 13 00464 i051
1a1a1a1b2b
15W-40FreshLubricants 13 00464 i052Lubricants 13 00464 i053Lubricants 13 00464 i054Lubricants 13 00464 i055Lubricants 13 00464 i056
1a1a1a2a2c
AgedLubricants 13 00464 i057Lubricants 13 00464 i058Lubricants 13 00464 i059Lubricants 13 00464 i060Lubricants 13 00464 i061
1a1a1a1a2b
Table 6. Representative ball wear-scar micrographs and dominant mechanisms across oil class, condition, and water fraction. All panels at identical magnification.
SampleConditionWater Concentrations (wt%)
0 5 10 20 40
Synthetic (5W-40)FreshLubricants 13 00464 i062Lubricants 13 00464 i063Lubricants 13 00464 i064Lubricants 13 00464 i065Lubricants 13 00464 i066
AgedLubricants 13 00464 i067Lubricants 13 00464 i068Lubricants 13 00464 i069Lubricants 13 00464 i070Lubricants 13 00464 i071
Semi-synthetic (10W-40)FreshLubricants 13 00464 i072Lubricants 13 00464 i073Lubricants 13 00464 i074Lubricants 13 00464 i075Lubricants 13 00464 i076
AgedLubricants 13 00464 i077Lubricants 13 00464 i078Lubricants 13 00464 i079Lubricants 13 00464 i080Lubricants 13 00464 i081
Mineral (15W-40)FreshlLubricants 13 00464 i082Lubricants 13 00464 i083Lubricants 13 00464 i084Lubricants 13 00464 i085Lubricants 13 00464 i086
AgedLubricants 13 00464 i087Lubricants 13 00464 i088Lubricants 13 00464 i089Lubricants 13 00464 i090Lubricants 13 00464 i091
Disclaimer/Publisher’s Note: The statements, opinions and data contained in all publications are solely those of the individual author(s) and contributor(s) and not of MDPI and/or the editor(s). MDPI and/or the editor(s) disclaim responsibility for any injury to people or property resulting from any ideas, methods, instructions or products referred to in the content.