Abstract
Turn-milling is a relatively new process which combines turning and milling operations, offering a number of advantages such as chip breaking and interrupted cutting, which improves tool life. In addition to providing the capability of producing eccentric forms or shapes, it increases productivity for difficult-to-machine material at lower cost. This study investigates the influence of cutting speed and feed on surface roughness and tool wear in conventional turning and turn-milling of H13 tool steel. The tests were conducted for longitudinal and face machining strategies. It was found that the range of surface roughness in turning is lower than in turn-milling. In longitudinal turning, face-turning, and face turn-milling operations, surface roughness is elevated in the higher feeds. However, the surface roughness in longitudinal turn-milling operations can be reduced by increasing the feed. Although the simultaneous rotation of the tool and workpiece in turn-milling could negatively affect the surface quality, this operation provides the advantage of an interrupted cutting mechanism that produces discontinuous chips. Also, the wear of the endmill in longitudinal and face turn-milling operations is lower than the wear of the inserts used in conventional longitudinal and face turning. Using Response Surface Methodology (RSM), mathematical models were developed for surface roughness and tool wear in each operation. The RSM models developed in this study achieved coefficients of determination (R2) above 90%, with prediction errors below 7% for surface roughness and below 3% for tool wear. The analysis of variance (ANOVA) revealed that the feed and cutting speed are the most influential parameters on the surface roughness and tool wear, respectively, with p-value < 0.05. The experimental results demonstrated that tool wear in turn-milling was reduced by up to 50% compared to conventional turning.
1. Introduction
Nowadays, the aerospace and automotive industries have increasing interest in using hard materials with improved mechanical properties, like hardened steel, superalloys, metal matrix composites, and titanium alloys, to enhance the service life and functional performance of components [1]. AISI H13 steel is a 5% Cr ultra-high strength tool-steel alloy with relatively high contents of molybdenum and vanadium that provide the combination of excellent toughness, high hardenability, and high wear resistance due to the presence of hard vanadium carbides. Because of its high hardness and strength at elevated temperatures, good stability in heat treatment, and resistance to thermal fatigue cracking, H13 steel is widely used to produce different types of hot working dies used for forging, extrusion, and die-casting operations [2,3]. However, due to the presence of these strong carbide forming elements, namely, V, Mo, and Cr, H13 steel is classified as a difficult-to-cut material [4]. The increasing industrial demand for hard materials and their wide range of applications require comprehensive experimental and numerical investigations to improve their machinability. Turning is a widespread process in industry to machine hardened steel parts and create desired shapes with high surface quality. Several research studies have been conducted in the context of the turning of H13 tool steels. Ng and Aspinwall [5] investigated the effect of workpiece hardness and cutting speed on cutting forces and chip formation in the turning of H13 steel. Özel et al. [6] experimentally studied the effects of different cutting parameters on the surface roughness and cutting forces in the finish hard turning of AISI H13 steel. The results indicated that the geometry of the cutting edge has a significant effect on surface roughness and cutting forces. Çiçek et al. [7,8] investigated the performance of tungsten carbide and HSS end mills in machining AISI H13 steel under dry and wet conditions. Their results showed that multilayer-coated (MLC) endmills produced lower cutting forces and average surface roughness, while also exhibiting higher resistance to abrasive wear. Abu Bakar et al. [4] conducted an experimental study to investigate tool wear mechanisms in dry and cryogenic milling of AISI H13 steel with varying cutting-edge radii. The results showed that a prepared tool with a cutting-edge radius of Rn = 0.03 mm under cryogenic conditions improved tool performance, achieving a 55% increase in tool life. Kumar et al. [9] developed empirical models using response surface methodology (RSM) to predict surface roughness and tool–chip interface temperature in the turning of H13 steel. Their results indicated that feed rate was the most significant factor affecting surface roughness, while cutting speed had the greatest influence on temperature.
Outeiro [10] has also applied Artificial neural networks (ANN) and genetic algorithms (GAs) for the modeling and optimization of surface roughness in the longitudinal turning of H13 steels using different inserts under different cutting parameters. Suresh and Basavarajappa [11] developed empirical models for surface roughness and tool wear. In a recent study, they developed an ANN model to predict the tool wear during the turning of H13 steel [12]. They concluded that the cutting speed and feed rate are the highest influencing factors on the tool wear and surface roughness, respectively.
High-speed machining (cutting speed > 100 m/min) of H13 has also been investigated in the literature to enhance its machinability and optimize machining outputs [13,14]. Tuli et al. [14] optimized the cutting parameters in the high-speed machining of H13 tool steel using response methodology and a genetic algorithm to achieve improved surface finish and less tool wear. Using finite element simulations and high-speed turning experiments, Umer [13] evaluated the machinability of H13 tool steel by analyzing tool wear, surface roughness, and cutting forces.
Turn-milling is a relatively new machining operation, which is being rapidly developed for machining difficult-to-cut materials. In this operation, where a multi-point cutter is used, both the cutting tool and the workpiece rotate at the same time providing an interrupted cutting mechanism [15]. Unlike the conventional turning process with a single point in a continuous machining mode, interrupted cutting protects the cutter from overheating by spreading the heat generated during cutting throughout the multiple edges, as well as allowing sufficient time to dissipate heat during the disengagement period [16]. Choudhury and Bajpai [17] conducted an experimental investigation to estimate the surface roughness during the turn-milling process of mild steel using response surface methodology in terms of work speed, diameter of cutter, and depth of cut. They observed that the surface roughness in the orthogonal turn-milling process is less than that in conventional milling. Savas et al. [18] utilized the Taguchi method and analysis of variance (ANOVA) approach to determine the significant parameters affecting surface roughness in tangential turn-milling of SAE 1050 steel. They obtained the cutting conditions leading to minimum surface roughness by solving the experimental regression model of surface roughness using a genetic algorithm. A literature review showed the limited research on turn-milling of difficult-to-cut materials. In the early studies on turn-milling operations, this operation was divided into two main categories, which were orthogonal and coaxial operations [16,19]. Figure 1c,d show the schematic representation of longitudinal (orthogonal) and face (co-axial) turn-milling processes. In longitudinal turn-milling, the axes of the end mill and the workpiece are perpendicular while in the face (co-axial) machining the axes of the cutter and the workpiece are parallel. Schulz et al. [16,19] experimentally investigated the effect of process parameters on the surface quality and chip geometry of hardened steel and ASTM 52100 Bearing Steel (DIN 100Cr6). They observed that under suitable cutting conditions, the surface roughness could be reduced significantly (below Ra = 0.5 µm) which is comparable to ground surfaces. Sasahara et al. [20] investigated high-speed turn milling of difficult-to-cut materials, namely, SUS304 stainless steel and Inconel 718. They observed that the tool wear was significantly less than in conventional turning. Karaguzel et al. [21] evaluated the tool life in the turn-milling and conventional turning of Inconel 718 and waspaloy. They concluded that the turn-milling operation offered two times better tool life than traditional turning. Later, Berenji et al. [22] performed experimental tests on AISI 316 and waspaloy, showing that better surface finish, higher tool life, and productivity were obtained in both orthogonal and co-axial configurations compared to conventional turning during roughing and finishing operations.
Although several studies have been carried out on longitudinal turning of AISI H13 steel [5,6,10,11,12,23], to the authors’ best knowledge, no studies have been conducted on high-speed longitudinal and face turn-milling of H13 steel. This paper aims to experimentally investigate the machinability of H13 tool steel during the following machining operations: conventional longitudinal and face turning, as well as longitudinal turn-milling and face turn-milling (as shown in Figure 1). The influence of cutting speed and feed on the surface roughness, surface quality, chip formation, and tool wear is experimentally evaluated. The response surface methodology (RSM) was applied to mathematically model the surface roughness and tool wear in terms of feed and cutting speed using a second-order polynomial. Analysis of variance (ANOVA) was also adopted to determine the significant parameters affecting the outputs of each operation.

Figure 1.
The schematic of operations employed for machining of H13 tool steel: (a) longitudinal turning, (b) face turning, (c) longitudinal turn-milling, and (d) face turn-milling.
Figure 1.
The schematic of operations employed for machining of H13 tool steel: (a) longitudinal turning, (b) face turning, (c) longitudinal turn-milling, and (d) face turn-milling.

2. Experimental Setup and Methodology
2.1. Workpiece Material and Cutting Tool
The workpiece material was hardened AISI H13 tool steel of 54 HRC. Its mechanical properties and chemical composition are given in Table 1 and Table 2, respectively. The longitudinal conventional turning and turn-milling machining tests were conducted on rods (50 mm diameter and 300 mm long), while the conventional face turning and face turn-milling machining tests were performed on disks (127 mm diameter and 22 mm thick). All workpieces were pre-machined to ensure a high-quality initial surface, thereby eliminating any influence of surface allowance variations on the results. The cutting length of each longitudinal and face machining test was 25 mm and 40 mm, respectively. The volumes of the material removed in longitudinal and face machining were 1962 mm3 and 5705 mm3, respectively. The turning tests were carried out using Titanium Nitride (TiN) coated carbide inserts with a diamond-shaped (CNMG-432 grade) chip-breaker, nose angle of 80°, and nose radius of 0.8 mm (1/32″) (see Figure 2e). For the turn-milling operation, a 12.7 mm (1/2″) diameter uncoated carbide end mill (110-0500-401) with four cutting edges and 30° helix angle was used (see Figure 2f). The corner geometry of the end mill corresponds to a small edge radius of approximately 0.05 mm. All machining tests were carried out under controlled laboratory conditions at a temperature of 23 ± 2 °C and relative humidity of 40–50%. Cutting was performed under dry conditions without coolant. To ensure repeatability, a new cutting tool was used for each run. The experimental run order was randomized to minimize systematic bias due to machine drift or progressive heating effects. Between successive tests, the machine was allowed to cool for approximately 10 min to stabilize thermal transients before the next cut.

Figure 2.
Experimental setup for machining of H13 tool steel: (a) longitudinal turning, (b) face turning, (c) longitudinal turn-milling, (d) face turn-milling, (e) turning insert, (f) end mill.
Figure 2.
Experimental setup for machining of H13 tool steel: (a) longitudinal turning, (b) face turning, (c) longitudinal turn-milling, (d) face turn-milling, (e) turning insert, (f) end mill.


Table 1.
Mechanical properties of AISI H13 tool steel [24].
Table 1.
Mechanical properties of AISI H13 tool steel [24].
| Mechanical Property | Value |
|---|---|
| Yield Strength (MPa) | 1648 |
| Poisson’s ratio | 0.3 |
| Hardness | Rockwell C54 |
| Coefficient of Thermal Expansion (/°C) at 93 °C | 10.4 × 10⁻⁶ |
| Density (kg/m3) | 7800 |
| Elongation (%) | 9 |
Table 2.
Chemical composition of AISI H13 tool steel (wt%).
Table 2.
Chemical composition of AISI H13 tool steel (wt%).
| C | Mn | Si | Cr | Mo | V | Ni | Fe |
|---|---|---|---|---|---|---|---|
| 0.38 | 0.35 | 1.00 | 5.25 | 1.35 | 1.05 | 0.15 | Remainder |
2.2. Machine Setup and Measurement System
The turning and turn-milling machining tests were conducted on a 6-axis Boehringer NG200 CNC Turning Centre. Figure 2 presents the experimental setups applied for conventional and turn-milling operations. The tool wear, machined surface quality, and chip morphology were studied using a Zeiss Smartzoom 5 digital microscope. The surface roughness was measured in the feed direction of the cutting tool (see Figure 1) using Taylor Hobson, model Form Talysurf 120 mm. Each surface roughness was an average of four measurements.
2.3. Design of Experiments (DOE)
The machining tests were carried out in four sets: conventional longitudinal turning, conventional face turning, longitudinal turn-milling, and face turn-milling. In the conventional turning process, the material is removed by feeding the tool in the axial or radial direction () as shown in Figure 1a and Figure 1b, respectively. In longitudinal turn-milling, shown in Figure 3, there are two different feeds: axial feed and circumferential feed . The axial feed results from the translation motion of the cutting tool along the workpiece axial direction (i.e., axial speed (mm/min)), while the circumferential feed is caused by the rotation of the workpiece to cover its perimeter (i.e., circumferential speed (mm/min)). In face turn-milling (Figure 1d), both the axial feed and circumferential feed are used to machine the face of the workpiece using a milling cutter. Since the axial and circumferential feeds act simultaneously and are orthogonal, a helical trajectory generates a feed mark around the workpiece with a feed angle (β), which determines the feed direction of the tool for chip generation (see Figure 3). In the turn-milling of a workpiece with a diameter of , the feed per tooth (mm) can be obtained in terms of the axial feed (mm/workpiece rev) and circumferential feed (mm/workpiece rev) [25]:
where and are the workpiece and the tool rotational speeds (revolution per minute rpm), respectively, and z is the number of cutting edges. In the current work, the axial feed was kept constant at 10 mm per workpiece revolution, the circumferential feed was equal to perimeter of the workpiece, and z = 4. As can be seen in Table 3, in the turning process, the feed is expressed in terms of mm per workpiece revolution, and in the turn-milling process, it is mm per cutting edge (tooth). Machining tests were conducted under dry conditions by varying two cutting parameters, the cutting speed and feed. The cutting parameters and their values for various machining tests are shown in Table 3. Each of the input parameters has 3 levels, while the depth of cut was kept constant, doc = 0.5 mm. Thus, nine cutting tests were conducted for each of the four machining operations. Table 4 shows the design of experiments, as well as the measured values of surface roughness and tool wear. To ensure fair comparisons, each corresponding test in longitudinal turning and turn-milling, as well as in face turning and face turn-milling, was performed with a nearly equal Material Removal Rate (MRR) and the same cutting conditions.
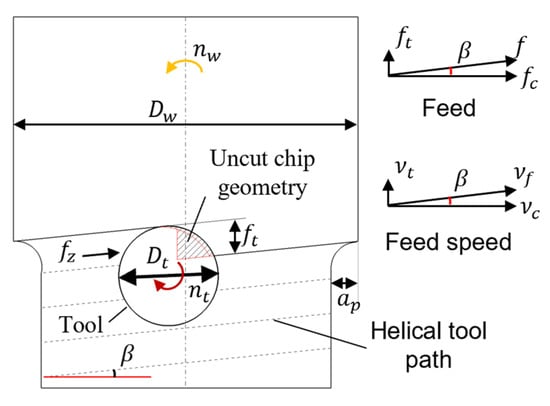
Figure 3.
Cutting geometry in longitudinal turn-milling.
Table 3.
Cutting conditions and their levels applied for experimental tests.
Table 4.
Cutting parameters and measured outputs of the experimental tests for each machining operation.
3. Results and Discussion
3.1. Chip Formation and Surface Quality
In the material removal process, the chip formation reflects the interaction between the workpiece and the cutting tool in the cutting zone, as well as the underlying metal cutting mechanisms [26]. Chip formation has a significant impact on the quality of the machined surface and the tool life [27]. In this study, the chips were collected separately for all tests. Figure 4 shows the chips collected during each operation under the cutting conditions of cutting speed = 140 m/min and feed = 0.09 mm/rev (or = 0.09 mm/tooth). It is seen that the chips generated in the turn-milling processes are very short compared to the conventional turning processes. In turn-milling, chip length ranged from 3 to 4.5 mm, with thickness values between 0.07 and 0.15 mm. By contrast, in conventional turning, the chip length was on the order of a few centimeters, and chip thickness ranged between 0.15 and 0.22 mm. Due to simultaneous rotations of the endmill cutting tool and the workpiece, the turn-milling operation provides an interrupted cutting mechanism, resulting in discontinuous chip formation and easy chip removal. As a result, the turn-milling process can avoid chip nest formation, and chip disposal is no longer a problem for the operator. During the face turn-milling process, the chip is formed by the flank side of the tool while in the longitudinal turn-milling process both the flank side and bottom side of the cutting edge remove the material from the surface [17,28]. Figure 5 illustrates the uncut chip geometry in longitudinal and face turn-milling processes. It is seen that in the longitudinal turn-milling (Figure 5a), the uncut chip thickness formed on the bottom edge is significantly lower than the uncut chip thickness of the flank side, resulting in short and sharp chips. However, in the face turn-milling (Figure 5b), the chips generated by the flank side of the cutting edge are short and uniform.
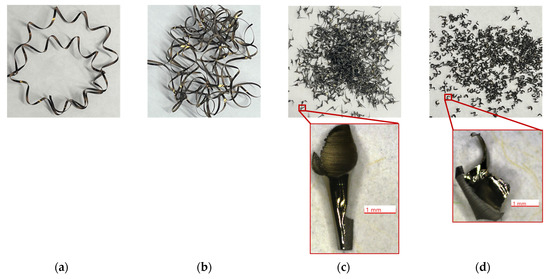
Figure 4.
Chip formation in (a) longitudinal and (b) face turning, and (c) longitudinal (d) and face turn-milling of H13 tool steel under the cutting speed = 140 m/min and feed = 0.09 mm/rev. (or = 0.09 mm/tooth).
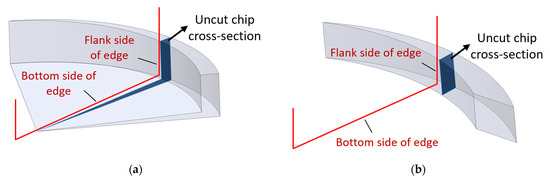
Figure 5.
Uncut chip geometry in (a) longitudinal and (b) face turn-milling operations.
Figure 6 presents the machined surface of each of the four operations under similar cutting conditions of cutting speed = 140 m/min and feed = 0.09 mm/rev (or = 0.09 mm/tooth). It was observed that, due to circular form errors and cusp height formation, the surface quality in the turn-milling operations was lower than those of conventional turning. These errors were generated because of the combined rotations of the workpiece and tool, and simultaneous feeds in the axial and circumferential directions [28]. Figure 7 shows the helical feed marks generated in longitudinal turn-milling, which affects the quality of the finished surface. The cutting tool geometry is also another parameter that affects the surface quality in the turn-milling process. As can be seen in Figure 7, the surface profile in the axial direction shows the mark of the bottom edge of the tool on the machined surface. These marks are generated due to the dish angle, which is defined as an angle formed between the end cutting edge and perpendicular to the plane of the cutter axis [29]. It should be noted that although selecting optimized parameters may help mitigate these effects, the surface quality in turn-milling is ultimately constrained by the intrinsic process kinematics and is predominantly influenced by the tool edge geometry—particularly the bottom-edge (dish) angle and the radius of the edge corner. Using cutting tools with smaller dish angles or flat bottom edges can improve the surface quality and reduce the circular form error in the longitudinal turn-milling process and thus reduce surface roughness.
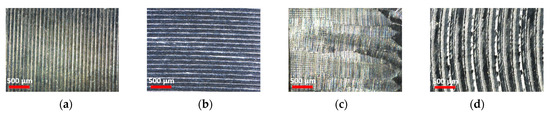
Figure 6.
The machined surfaces obtained by (a) longitudinal and (b) face turning, and (c) longitudinal (d) and face turn-milling of H13 tool steel under the cutting speed = 140 m/min and feed = 0.09 mm/rev. (or = 0.09 mm/tooth).
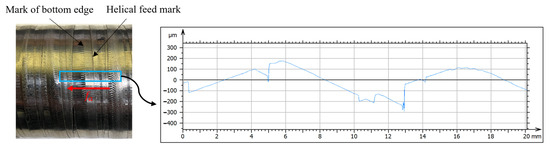
Figure 7.
The helical feed mark on the machined surface generated during longitudinal turn-milling and the surface profile in the axial feed direction.
3.2. Surface Roughness
Surface roughness measurements were conducted in the feed direction of the cutting edge for both conventional turning and turn-milling operations to avoid the effect of the geometric errors on measurements, mainly in the turn-milling process. Surface roughness (Ra) was consistently measured in the feed direction for both conventional turning and turn-milling. In turning, the tool feed direction coincides with the axial feed (), whereas in turn-milling it is inclined by the feed angle β due to the combined tool–workpiece rotations, i.e., corresponding to the feed per tooth . This approach ensures that the measured roughness reflects the influence of the cutting parameters along the actual tool–material interaction path, while minimizing the effect of geometric marks such as side-edge traces or cusp-height formations. Figure 8 shows the direction of surface roughness measurement of the machined surfaces after conventional turning and turn-milling operations. Surface roughness was measured and analyzed using Taylor Hobson, model Form Talysurf 120 mm, and applying a Gaussian filter (cut-off length λc = 0.8 mm, evaluation length 8 mm, stylus tip radius = 2 µm, stylus load = 0.7 mN, sampling interval = 0.25 µm). Each measurement was repeated four times at different surface locations, and the mean value was reported. Figure 9 shows the dependence of the surface roughness Ra of machined parts on the cutting parameters in the longitudinal and face conventional turning and turn-milling. For conventional longitudinal and face turning (Figure 9a,c), the increase in the feed leads to an increase in the surface roughness, except at the intermediate feed of = 0.1 mm/rev and the cutting speed range of 140 < < 160 m/min, where Ra is reduced or remains practically unchanged. The decrease in Ra observed at = 0.1 mm/rev (Figure 9a,c) may suggest the presence of a local optimum in the feed rate; however, because the experimental matrix was restricted to a limited range of cutting conditions, further tests beyond the current design would be required to reliably confirm and generalize such optima.
In face turn-milling (Figure 9d), the surface roughness increased with the increase in the feed for different cutting speed values. However, in longitudinal turn-milling, increasing the feed lead to a reduction in the surface roughness, as shown in Figure 9b. This can be attributed to the plowing of material at low feeds. As mentioned earlier (see Figure 5), during the longitudinal turn-milling machining, both the flank side and the bottom side of the cutting edge remove the material from the surface. Since the uncut chip thickness on the bottom side of the tool is very small, plowing takes place instead of cutting. When the feed increases, the plowing effect is reduced, and the surface roughness is improved. It was also observed that by increasing the cutting speed, the surface roughness was reduced for most of the feed values. However, in face turn-milling (Figure 9d), the surface roughness in cutting speed = 140 m/min was generally higher than that of = 120 (m/min). As can be seen in Figure 10, the main reason could be the formation of a built-up edge at a cutting speed of = 140 (m/min), which destroys the surface quality.
Referring to Figure 9c,d, it can be seen that the surface roughness in the feed direction in face turning is significantly lower than that in face turn-milling. The main reason is the simultaneous rotation of the cutting tool and workpiece in turn-milling, which produces a helical tool mark on the workpiece. It is evident that in longitudinal turn-milling at cutting speeds higher than 140 m/min the surface roughness in the feed direction is lower than that of the longitudinal turning.
A widely accepted kinematic model for estimating surface roughness in conventional turning is expressed as follows [30]:
where denotes the turning insert nose radius and is the axial feed per revolution of the turning insert. For the orthogonal turn-milling operation, the theoretical surface roughness can be defined as follows [15]:
where is the radius of the workpiece and is feed per tooth of the endmill. Table 5 compares the experimentally measured surface roughness values (reported in Table 4) with those predicted by the kinematic models in Equations (2) and (3). The experimental ranges reported in Table 5 correspond to the surface roughness values obtained at the same feed but under different cutting speeds in turning and turn-milling. It was observed that the predictions of the kinematic models did not match the actual surface roughness and failed to capture the surface characteristics generated in both turning and turn-milling. This highlights the limitations of purely geometric (kinematic) approaches, which neglect the complex tool–workpiece interactions inherent in machining. In contrast, empirical models provide a more reliable means of addressing these inaccuracies and capturing process-dependent effects.

Figure 8.
Surface roughness measurement of the parts machined by (a) longitudinal and (b) face turning, (c) longitudinal (d) and face turn-milling operations.
Figure 8.
Surface roughness measurement of the parts machined by (a) longitudinal and (b) face turning, (c) longitudinal (d) and face turn-milling operations.


Figure 9.
Effect of cutting speed and feed on surface roughness in (a) longitudinal turning, (b) longitudinal turn-milling, (c) face turning, and (d) face turn-milling operations.
Figure 9.
Effect of cutting speed and feed on surface roughness in (a) longitudinal turning, (b) longitudinal turn-milling, (c) face turning, and (d) face turn-milling operations.


Figure 10.
Built-up edge (BUE) formation of the endmill at cutting speed = 140 m/min and feed = 0.11 mm/tooth.
Figure 10.
Built-up edge (BUE) formation of the endmill at cutting speed = 140 m/min and feed = 0.11 mm/tooth.

Table 5.
Comparison of measured surface roughness values with those of theoretical prediction values.
Table 5.
Comparison of measured surface roughness values with those of theoretical prediction values.
| Turning | Turn-Milling | |||
|---|---|---|---|---|
| Theoretical Ra Equation (2) (µm) | Measurement (µm) | Theoretical Ra Equation (3) (µm) | Measurement (µm) | |
| = 0.09 (mm/rev.) = 0.09 (mm/tooth) | 0.316 | [0.413–0.605] | 0.179 | [0.14–3.23] |
| = 0.1 (mm/rev.) = 0.1 (mm/tooth) | 0.391 | [0.363–0.610] | 0.206 | [0.123–3.869] |
| = 0.11 (mm/rev.) = 0.11 (mm/tooth) | 0.473 | [0.611–0.765] | 0.252 | [0.117–3.891] |
3.3. Tool Wear
Tool wear is known to strongly affect the quality of machined surfaces and cutting forces. Tool wear was evaluated in accordance with ISO 3685:1993 (single-point turning tools) [31] and ISO 8688-2:1989 (end mills) [32]. Using a high magnification optical microscope, the maximum flank wear land width (VBmax) was used as the principal wear metric, defined as the maximum distance from the cutting edge to the wear boundary on the flank face. The tool wear (VBmax) of the turning inserts and endmills (at the four edges) were measured and the average values are reported. For comparability, the cutting length of each longitudinal test was 25 mm, and for each facing, it test was 40 mm; also, the corresponding volumes of material removed were 1962 mm3 and 5705 mm3 for longitudinal and face machining, respectively. Figure 11 shows the tool wear on the inserts and endmills after the turning and the turn-milling at a cutting speed = 140 m/min and feed = 0.09 mm/rev ( = 0.09 mm/tooth). Figure 12 illustrates the effects of cutting speed and feed on the tool wear in each operation. As expected, the figure shows that by increasing the feed and cutting speed, the tool wear increases in all machining operations. The results also revealed that the tool wear in longitudinal turn-milling (Figure 12b) and face turn-milling (Figure 12d) is lower than the corresponding conventional turning operations (Figure 12a,c) by up to approx. 50 and 40%, respectively, at = 120 m/min, and up to 22% at = 160 m/min, for the same material removal rate. As reported in the literature, coated cutting tools generally exhibit longer tool life compared to uncoated tools. Çiçek et al. [8] experimentally demonstrated that the tool life of TiAlN/TiN-coated end mills was approximately three times greater than that of uncoated end mills. However, in the present study, the tool wear observed in turn-milling with an uncoated end mill was lower than that in conventional turning with a TiN-coated insert. This indicates that the reduced tool wear in turn-milling is primarily a consequence of the process kinematics rather than the coating effect. This reduction in tool wear could be attributed to the interrupted cutting and the use of multi-teeth cutter in turn-milling, which provide sufficient time for the dissipation of heat during the disengagement period and the reduction in thermal stress and tool wear.
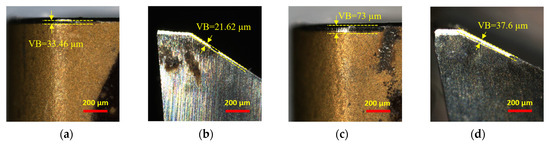
Figure 11.
Tool wear in (a) longitudinal turning, (b) longitudinal turn-milling, (c) face turning, and (d) and face turn-milling operations, for a cutting speed = 140 m/min and feed = 0.09 mm/rev ( = 0.09 mm/tooth).
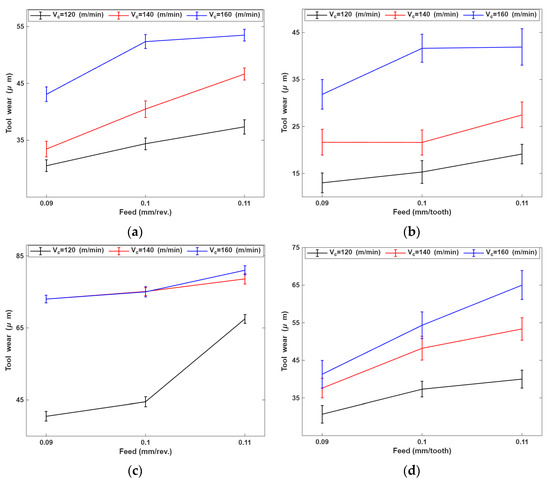
Figure 12.
Effect of cutting speed and feed on tool wear in (a) longitudinal turning, (b) longitudinal turn-milling, (c) face turning, and (d) face turn-milling operations.
3.4. RSM Modeling
The nonlinear behavior of surface roughness and flank wear observed in turning and turn-milling necessitates the use of nonlinear prediction models to achieve the best correlation between experimental and predicted results. Response surface methodology (RSM) was used for modeling of the system response (in terms of surface roughness and tool wear) to the independent input variables (cutting speed and feed). RSM is particularly suitable for machining studies because it enables efficient experimentation while capturing both linear and interaction effects. The general form of a second-order response surface polynomial model is expressed by Equation (4):
where y is the response variable, is a set of input parameters, is a regression coefficient, and ε is residual error [33]. The statistical software Minitab 21 was utilized to establish the relationship between the responses and the independent input variables. Table 6 presents the developed model, correlating outputs with cutting parameters in conventional longitudinal and face turning, as well as longitudinal and face turn-milling. The adequacy of each model has been checked using the coefficient of determination (R2), 0 < R2 < 100%, which is defined as the ratio of the explained variation to the total variation in a regression model [34]. The higher the R2 value, the better the response model fits the actual data. Table 6 shows that the value of R2 for each of processes is higher than 92%, implying the goodness of fit of the models for predicting experimental results. In addition to the coefficient of determination (R2), the adjusted R2 and predicted R2 were reported to provide a more comprehensive evaluation of model adequacy. The adjusted R2 compensates for the number of terms in the model, ensuring that the reported fit is not artificially inflated by unnecessary variables. In this study, the adjusted R2 values ranged between 80.60% and 99.70%, indicating that the models generally explain a high proportion of the variability in the experimental data. The predicted R2 assesses the model’s ability to predict new observations outside the fitted dataset. The predicted R2 values ranged from 37.05% to 99%, suggesting that while some models demonstrate excellent predictive capability, others may be more sensitive to process variability or unmodeled factors. Therefore, the models with lower predicted R2 should be interpreted cautiously, whereas those with high predicted R2 provide reliable predictions within the studied parameter range. Variance inflation factors (VIF) for all terms in the response surface models were equal to one, confirming the orthogonality of the design and the absence of multicollinearity. In Figure 13, the values of surface roughness and tool wear predicted by the RSM are compared with the experimental values. This comparison is depicted in terms of residual percentage. Although the percentage error of few tests is large (for example, the surface roughness residual percentage of test #4), the average residual percentage in predicting the surface roughness and tool wear is less than 7% and 3%, respectively. It shows that the predictions made by the RSM are in good agreement with the experimental values. Therefore, the proposed mathematical models in Table 6 can be employed to predict the surface roughness and tool wear in the turning and turn-milling of H13 steel for the range of cutting conditions used in the investigation. Although the response surface models were not validated against an independent dataset, their adequacy was further supported by high R2 and adjusted R2 values, together with residual (%) plots of Figure 13 confirming the absence of strong systematic bias.
Table 6.
The RSM model of the measured outputs in turning and turn-milling operations.
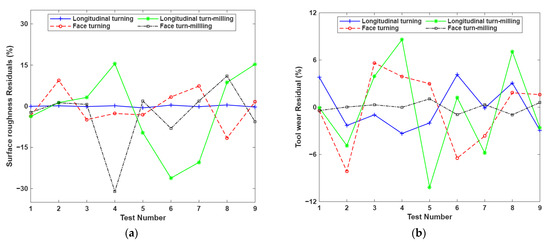
Figure 13.
Plots of residuals (%) vs. run numbers for (a) surface roughness and (b) tool wear.
Figure 14 illustrates the contour plots of the interaction effects of cutting speed and feed on the surface roughness in conventional longitudinal and face turning, as well as longitudinal and face turn-milling. The contour plots were generated using the fitted equations described in Table 6. The plots shown in Figure 14 indicate that the smallest surface roughness is obtained at the highest cutting speed of = 160 m/min. The effect of feed on the surface roughness is not the same for all machining operations. The minimum surface roughness in longitudinal and face turning, and in face turn-milling processes is achieved at the lowest range of feed rate; while in the longitudinal turn-milling operation, the smallest surface roughness corresponds to the highest feed rate (0.11 mm/tooth). As mentioned earlier, in the longitudinal turn-milling operation, the chip is formed both by the flank side and the bottom side of the cutting edge. Due to the small chip thickness generated by the bottom side and the plowing effect (see Figure 5), increasing the feed rate results in a reduction in the surface roughness.
Figure 15 depicts the contour plots of tool wear for different machining operations using the fitted equations in Table 6. As expected, the contour plots show that the maximum tool wear takes place at the highest feed and cutting speed, i.e., at feed rate of 0.11 mm/rev in conventional turning (and 0.11 mm/tooth in turn-milling) and cutting speed of 160 m/min. Machining at greater values of cutting parameters causes a rise in cutting temperature, resulting in excessive tool wear.


Figure 14.
Contour plots of surface roughness vs. cutting speed and feed in (a) longitudinal turning, (b) longitudinal turn-milling, (c) face turning, (d) face turn-milling operations.
Figure 14.
Contour plots of surface roughness vs. cutting speed and feed in (a) longitudinal turning, (b) longitudinal turn-milling, (c) face turning, (d) face turn-milling operations.


Figure 15.
Contour plots of tool wear vs. cutting speed and feed in (a) longitudinal turning, (b) longitudinal turn-milling, (c) face turning, (d) face turn-milling operations.
Figure 15.
Contour plots of tool wear vs. cutting speed and feed in (a) longitudinal turning, (b) longitudinal turn-milling, (c) face turning, (d) face turn-milling operations.

An analysis of variance (ANOVA) was carried out to determine the significance of the model coefficients. The details of the ANOVA are provided in Appendix A. Based on the variance analyses at 95% confidence level, the regression inputs with a probability value (p-value) of less than 0.05 are considered significant input variables in predictive models of surface roughness and tool wear. The analysis of variance was performed for all RSM models given in Table 6, and the significant input variables (p-value ≤ 0.05) of each model are summarized in Table 7. For each model output, the p-value of the input variables depicted by the blue triangle(s) is less than those of input variables with the black triangle(s) (p-value (▲) < p-value (▲) ≤ 0.05), indicating the impact of input with p-value (▲) is more significant than that with p-value (▲). It is obvious that both cutting speed and feed have significant effects (i.e., p-value ≤ 0.05) on the surface roughness and tool wear within the range of the investigated parameters. The ANOVA results also revealed that the feed is the most significant parameter affecting the surface roughness in longitudinal (p-value = 0.004), face turning (p-value = 0.008), and face turn-milling (p-value = 0.022) operations, which is identical to the experimental results presented above. It is well known that for a given tool, the surface roughness is primarily a function of feed [35]. However, in the longitudinal turn-milling operation, the cutting speed was the most significant parameter affecting the surface roughness (p-value = 0.001).
Based on the ANOVA results depicted in Table 7, among the cutting parameters, the cutting speed is the most significant parameter affecting the tool wear in longitudinal (p-value = 0.003) and face (p-value = 0.009) turning and longitudinal (p-value = 0.002) and face (p-value = 0.000) turn-milling operations. By increasing the cutting speed, the temperature in the tool–chip interface is elevated, which accelerates thermally activated wear mechanisms [36].
The RSM models developed in this study are valid within the investigated ranges of cutting speed and feed rate under steady-state cutting conditions. They do not explicitly account for stochastic effects such as burr formation or chip adhesion, nor do they capture the evolutionary nature of tool wear driven by energy transformations in the cutting zone. Accordingly, the predictive capability of the models should be interpreted within these limitations.
Table 7.
Summary of ANOVA for outputs (p-value (▲) < p-value (▲) ≤ 0.05).
Table 7.
Summary of ANOVA for outputs (p-value (▲) < p-value (▲) ≤ 0.05).
| Operation | Output | Feed | Cutting Speed | Cutting Speed × Feed |
|---|---|---|---|---|
| Longitudinal turning | Surface roughness | ▲ | ▲ | |
| Tool wear | ▲ | ▲ | ||
| Longitudinal turn-milling | Surface roughness | ▲ | ▲ | |
| Tool wear | ▲ | ▲ | ||
| Face turning | Surface roughness | ▲ | ▲ | |
| Tool wear | ▲ | ▲ | ||
| Face turn-milling | Surface roughness | ▲ | ▲ | |
| Tool wear | ▲ | ▲ | ▲ |
4. Conclusions
An experimental study has been conducted to investigate the effect of cutting parameters, namely, the cutting speed and feed on the surface roughness and tool wear in conventional longitudinal and face turning and in longitudinal and face turn-milling of H13 tool steel. The results showed that the surface roughness increases when increasing the feed. However, in longitudinal turn-milling, because of the very small chip thickness generated on the bottom side of the tool and the plowing of material, surface roughness is larger at low feeds. It is also observed that due to the interrupted cutting mechanism in the turn-milling processes, the formed chip is very short and easy to remove, compared to the conventional turning process. The measurements of tool wear revealed that tool wear in turn-milling process is lower than in conventional turning, which makes the turn-milling operation a suitable option for the rough machining of hard-to-cut materials. The experimental results demonstrated that tool wear in turn-milling was reduced by up to 50% compared to conventional turning.
The response surface methodology RSM was employed to model the surface roughness and tool wear in terms of cutting parameters. The results indicated that the models are reliable in predicting the responses in longitudinal and face turning and in longitudinal and face turn-milling of H13 tool steel. The ANOVA results demonstrated that feed and cutting speed are the main parameters influencing the surface roughness and tool wear, respectively, in longitudinal and face turning, and in face turn-milling. In longitudinal turn-milling, cutting speed is the significant parameter that affects both surface roughness and tool wear. The RSM models developed in this study achieved coefficients of determination (R2) above 90%, with prediction errors below 7% for surface roughness and below 3% for tool wear.
Due to the fact the surface quality in turn-milling operations could be affected by tool geometry and the simultaneous rotations of the tool and workpiece, it calls for further research on the optimization of the cutting parameters of turn-milling operations and investigations of the influence of cutting tools with different edge geometries on surface quality and surface roughness.
Author Contributions
H.G.: Methodology, Software, Visualization, Formal Analysis, Investigation, Data Curation, Writing—original draft. B.S.: Conceptualization, Methodology, Formal Analysis, Validation, Writing—review and editing. H.A.: Conceptualization, Methodology, Supervision, Project Administration, Funding Acquisition, Resources, Writing—review and editing. All authors have read and agreed to the published version of the manuscript.
Funding
This research was funded by the Natural Sciences and Engineering Research Council of Canada (NSERC) under the grant number: RGPIN-2020-06223, the Centre québécois de recherche et de développement de l’aluminium (CQRDA) under grant CONT1058; and National Research Council Canada (NRC) through the Aerospace Research Center and METALTec industrial R&D group—Advanced Manufacturing Program (A1-014126).
Data Availability Statement
Data are contained within the article.
Acknowledgments
The authors acknowledge the financial support of the Natural Sciences and Engineering Research Council of Canada (NSERC), the Centre québécois de recherche et de développement de l’aluminium (CQRDA); National Research Council Canada (NRC) through the Aerospace Research Center and METALTec industrial R&D group-Advanced Manufacturing Program.
Conflicts of Interest
The authors declare no conflicts of interest.
Appendix A. Detailed ANOVA Results of RSM Models
Table A1.
ANOVA for RSM model of surface roughness in longitudinal turning.
Table A1.
ANOVA for RSM model of surface roughness in longitudinal turning.
| Parameter | Degree of Freedom | Adj SS | Adj MS | F-Value | p-Value |
|---|---|---|---|---|---|
| Model | 5 | 0.004064 | 0.000813 | 26.87 | 0.011 |
| Linear | 2 | 0.003298 | 0.001649 | 54.52 | 0.004 |
| 1 | 0.001386 | 0.001386 | 45.82 | 0.007 | |
| 1 | 0.001912 | 0.001912 | 63.23 | 0.004 | |
| Square | 2 | 0.000688 | 0.000344 | 11.37 | 0.040 |
| 1 | 0.000002 | 0.000002 | 0.05 | 0.833 | |
| 1 | 0.000686 | 0.000686 | 22.68 | 0.018 | |
| 2-Way Interaction | 1 | 0.000078 | 0.000078 | 2.58 | 0.206 |
| 1 | 0.000078 | 0.000078 | 2.58 | 0.206 | |
| Error | 3 | 0.000091 | 0.000030 | ||
| Total | 8 | 0.004155 |
Table A2.
ANOVA for RSM model of tool wear in longitudinal turning.
Table A2.
ANOVA for RSM model of tool wear in longitudinal turning.
| Parameter | Degree of Freedom | Adj SS | Adj MS | F-Value | p-Value |
|---|---|---|---|---|---|
| Model | 5 | 531.812 | 106.362 | 24.97 | 0.012 |
| Linear | 2 | 517.603 | 258.801 | 60.76 | 0.004 |
| 1 | 363.170 | 363.170 | 85.26 | 0.003 | |
| 1 | 154.432 | 154.432 | 36.26 | 0.009 | |
| Square | 2 | 11.023 | 5.511 | 1.29 | 0.393 |
| 1 | 5.578 | 5.578 | 1.31 | 0.336 | |
| 1 | 5.445 | 5.445 | 1.28 | 0.340 | |
| 2-Way Interaction | 1 | 3.186 | 3.186 | 0.75 | 0.451 |
| 1 | 3.186 | 3.186 | 0.75 | 0.451 | |
| Error | 3 | 12.779 | 4.260 | ||
| Total | 8 | 544.590 |
Table A3.
ANOVA for RSM model of surface roughness in longitudinal turn-milling.
Table A3.
ANOVA for RSM model of surface roughness in longitudinal turn-milling.
| Parameter | Degree of Freedom | Adj SS | Adj MS | F-Value | p-Value |
|---|---|---|---|---|---|
| Model | 5 | 0.504959 | 0.100992 | 41.27 | 0.006 |
| Linear | 2 | 0.450490 | 0.225245 | 92.06 | 0.002 |
| 1 | 0.425334 | 0.425334 | 173.83 | 0.001 | |
| 1 | 0.025155 | 0.025155 | 10.28 | 0.049 | |
| Square | 2 | 0.050870 | 0.025435 | 10.40 | 0.045 |
| 1 | 0.049981 | 0.049981 | 20.43 | 0.020 | |
| 1 | 0.000889 | 0.000889 | 0.36 | 0.589 | |
| 2-Way Interaction | 1 | 0.003600 | 0.003600 | 1.47 | 0.312 |
| 1 | 0.003600 | 0.003600 | 1.47 | 0.312 | |
| Error | 3 | 0.007340 | 0.002447 | ||
| Total | 8 | 0.512300 |
Table A4.
ANOVA for RSM model of tool wear in longitudinal turn-milling.
Table A4.
ANOVA for RSM model of tool wear in longitudinal turn-milling.
| Parameter | Degree of Freedom | Adj SS | Adj MS | F-Value | p-Value |
|---|---|---|---|---|---|
| Model | 5 | 879.683 | 175.937 | 23.17 | 0.013 |
| Linear | 2 | 850.006 | 425.003 | 55.96 | 0.004 |
| 1 | 769.156 | 769.156 | 101.27 | 0.002 | |
| 1 | 80.850 | 80.850 | 10.65 | 0.047 | |
| Square | 2 | 25.776 | 12.888 | 1.70 | 0.321 |
| 1 | 25.522 | 25.522 | 3.36 | 0.164 | |
| 1 | 0.255 | 0.255 | 0.03 | 0.866 | |
| 2-Way Interaction | 1 | 3.901 | 3.901 | 0.51 | 0.525 |
| 1 | 3.901 | 3.901 | 0.51 | 0.525 | |
| Error | 3 | 22.784 | 7.595 | ||
| Total | 8 | 902.468 |
Table A5.
ANOVA for RSM model of surface roughness in face turning.
Table A5.
ANOVA for RSM model of surface roughness in face turning.
| Parameter | Degree of Freedom | Adj SS | Adj MS | F-Value | p-Value |
|---|---|---|---|---|---|
| Model | 5 | 0.185043 | 0.037009 | 12.79 | 0.031 |
| Linear | 2 | 0.147947 | 0.073974 | 25.57 | 0.013 |
| 1 | 0.027744 | 0.027744 | 9.59 | 0.053 | |
| 1 | 0.120204 | 0.120204 | 41.54 | 0.008 | |
| Square | 2 | 0.036326 | 0.018163 | 6.28 | 0.085 |
| 1 | 0.000481 | 0.000481 | 0.17 | 0.711 | |
| 1 | 0.035845 | 0.035845 | 12.39 | 0.039 | |
| 2-Way Interaction | 1 | 0.000770 | 0.000770 | 0.27 | 0.642 |
| 1 | 0.000770 | 0.000770 | 0.27 | 0.642 | |
| Error | 3 | 0.008680 | 0.002893 | ||
| Total | 8 | 0.193723 |
Table A6.
ANOVA for RSM model of tool wear in face turning.
Table A6.
ANOVA for RSM model of tool wear in face turning.
| Parameter | Degree of Freedom | Adj SS | Adj MS | F-Value | p-Value |
|---|---|---|---|---|---|
| Model | 5 | 1660.63 | 332.13 | 12.89 | 0.031 |
| Linear | 2 | 1250.10 | 625.05 | 24.26 | 0.014 |
| 1 | 975.38 | 975.38 | 37.86 | 0.009 | |
| 1 | 274.73 | 274.73 | 10.66 | 0.047 | |
| Square | 2 | 320.28 | 160.14 | 6.22 | 0.086 |
| 1 | 287.20 | 287.20 | 11.15 | 0.044 | |
| 1 | 33.08 | 33.08 | 1.28 | 0.340 | |
| 2-Way Interaction | 1 | 90.25 | 90.25 | 3.50 | 0.158 |
| 1 | 90.25 | 90.25 | 3.50 | 0.158 | |
| Error | 3 | 77.29 | 25.76 | ||
| Total | 8 | 1737.92 |
Table A7.
ANOVA for RSM model of surface roughness in face turn-milling.
Table A7.
ANOVA for RSM model of surface roughness in face turn-milling.
| Parameter | Degree of Freedom | Adj SS | Adj MS | F-Value | p-Value |
|---|---|---|---|---|---|
| Model | 5 | 1.02796 | 0.205592 | 7.65 | 0.062 |
| Linear | 2 | 0.77253 | 0.386267 | 14.37 | 0.029 |
| 1 | 0.25627 | 0.256267 | 9.53 | 0.054 | |
| 1 | 0.51627 | 0.516267 | 19.21 | 0.022 | |
| Square | 2 | 0.25480 | 0.127400 | 4.74 | 0.118 |
| 1 | 0.24500 | 0.245000 | 9.11 | 0.057 | |
| 1 | 0.00980 | 0.009800 | 0.36 | 0.589 | |
| 2-Way Interaction | 1 | 0.00062 | 0.000625 | 0.02 | 0.888 |
| 1 | 0.00062 | 0.000625 | 0.02 | 0.888 | |
| Error | 3 | 0.08064 | 0.026881 | ||
| Total | 8 | 1.10860 |
Table A8.
ANOVA for RSM model of tool wear in Face turn-milling.
Table A8.
ANOVA for RSM model of tool wear in Face turn-milling.
| Parameter | Degree of Freedom | Adj SS | Adj MS | F-Value | p-Value |
|---|---|---|---|---|---|
| Model | 5 | 921.984 | 184.397 | 559.62 | 0.000 |
| Linear | 2 | 857.308 | 428.654 | 1300.91 | 0.000 |
| 1 | 461.214 | 461.214 | 1399.72 | 0.000 | |
| 1 | 396.094 | 396.094 | 1202.09 | 0.000 | |
| Square | 2 | 12.836 | 6.418 | 19.48 | 0.019 |
| 1 | 5.179 | 5.179 | 15.72 | 0.029 | |
| 1 | 7.657 | 7.657 | 23.24 | 0.017 | |
| 2-Way Interaction | 1 | 51.840 | 51.840 | 157.33 | 0.001 |
| 1 | 51.840 | 51.840 | 157.33 | 0.001 | |
| Error | 3 | 0.989 | 0.330 | ||
| Total | 8 | 922.973 |
References
- M’Saoubi, R.; Axinte, D.; Soo, S.L.; Nobel, C.; Attia, H.; Kappmeyer, G.; Engin, S.; Sim, W.-M. High performance cutting of advanced aerospace alloys and composite materials (Keynote Paper). CIRP Ann. 2015, 64, 557–580. [Google Scholar] [CrossRef]
- Yan, H.; Hua, J.; Shivpuri, R. Flow stress of AISI H13 die steel in hard machining. Mater. Des. 2007, 28, 272–277. [Google Scholar] [CrossRef]
- Coldwell, H.; Woods, R.; Paul, M.; Koshy, P.; Dewes, R.; Aspinwall, D. Rapid machining of hardened AISI H13 and D2 moulds, dies and press tools. J. Mater. Process. Technol. 2003, 135, 301–311. [Google Scholar] [CrossRef]
- Bakar, H.A.; Ghani, J.; Haron, C.C.; Ghazali, M.; Kasim, M.; Al-Zubaidi, S.; Jouini, N. Wear mechanisms of solid carbide cutting tools in dry and cryogenic machining of AISI H13 steel with varying cutting-edge radius. Wear 2023, 523, 204758. [Google Scholar] [CrossRef]
- Ng, E.-G.; Aspinwall, D.K. The effect of workpiece hardness and cutting speed on the machinability of AISI H13 hot work die steel when using PCBN tooling. J. Manuf. Sci. Eng. 2002, 124, 588–594. [Google Scholar] [CrossRef]
- Özel, T.; Hsu, T.-K.; Zeren, E. Effects of cutting edge geometry, workpiece hardness, feed rate and cutting speed on surface roughness and forces in finish turning of hardened AISI H13 steel. Int. J. Adv. Manuf. Technol. 2005, 25, 262–269. [Google Scholar] [CrossRef]
- Cicek, A.; Ekici, E.; Kıvak, T.; Kara, F.; Uçak, N. Performance of multilayer coated and cryo-treated uncoated tools in machining of AISI H13 tool steel—Part 2: HSS end mills. J. Mater. Eng. Perform. 2021, 30, 3446–3457. [Google Scholar] [CrossRef]
- Cicek, A.; Kıvak, T.; Ekici, E.; Kara, F.; Ucak, N. Performance of multilayer coated and cryo-treated uncoated tools in machining of AISI H13 tool steel—Part 1: Tungsten carbide end mills. J. Mater. Eng. Perform. 2021, 30, 3436–3445. [Google Scholar] [CrossRef]
- Venkata Ajay Kumar, G.; A, R.; Shilpa, M. Modelling and optimization based on RSM in dry turning parameters of AISI H13 steel using novel hybrid design texture tool. Cogent Eng. 2024, 11, 2375427. [Google Scholar] [CrossRef]
- Outeiro, J. Surface integrity predictions and optimisation of machining conditions in the turning of AISI H13 tool steel. Int. J. Mach. Mach. Mater. 7 2014, 15, 122–134. [Google Scholar] [CrossRef]
- Suresh, R.; Basavarajappa, S. Effect of process parameters on tool wear and surface roughness during turning of hardened steel with coated ceramic tool. Procedia Mater. Sci. 2014, 5, 1450–1459. [Google Scholar] [CrossRef]
- Suresh, R.; Joshi, A.G.; Manjaiah, M. Experimental investigation on tool wear in AISI H13 die steel turning using RSM and ANN methods. Arab. J. Sci. Eng. 2021, 46, 2311–2325. [Google Scholar] [CrossRef]
- Umer, U. High speed turning of H-13 tool steel using ceramics and PCBN. J. Mater. Eng. Perform. 2012, 21, 1857–1861. [Google Scholar] [CrossRef]
- Tuli, N.T.; Amin, A.N.; Kaisar, R.; Dhrubo, F.I.; Bin Rashid, A. Optimisation of machining parameters in high-speed end milling of hardened AISI H13 die steel by integrating RSM and GA. Adv. Mater. Process. Technol. 2024, 11, 1564–1582. [Google Scholar] [CrossRef]
- Vikram, K.A.; Prasad, R.; Lakshmi, V.; Praveen, A. Overview of turn-milling machining processes–A review. In Proceedings of the 2nd International Conference & Exposition on Mechanical, Material, and Manufacturing Technology (ICE3MT 2022), Hyderabad, India, 28–29 October 2022; p. 020011. [Google Scholar]
- Schulz, H.; Kneisel, T. Turn-milling of hardened steel-an alternative to turning. CIRP Ann. 1994, 43, 93–96. [Google Scholar] [CrossRef]
- Choudhury, S.; Bajpai, J. Investigation in orthogonal turn-milling towards better surface finish. J. Mater. Process. Technol. 2005, 170, 487–493. [Google Scholar] [CrossRef]
- Savas, V.; Ozay, C. Analysis of the surface roughness of tangential turn-milling for machining with end milling cutter. J. Mater. Process. Technol. 2007, 186, 279–283. [Google Scholar] [CrossRef]
- Schulz, H.; Spur, G. High speed turn-milling—A new precision manufacturing technology for the machining of rotationally symmetrical workpieces. CIRP Ann. 1990, 39, 107–109. [Google Scholar] [CrossRef]
- Sasahara, H.; Kato, A.; Nakajima, H.; Yamamoto, H.; Muraki, T.; Tsutsumi, M. High-speed rotary cutting of difficult-to-cut materials on multitasking lathe. Int. J. Mach. Tools Manuf. 2008, 48, 841–850. [Google Scholar] [CrossRef]
- Karaguzel, U.; Olgun, U.; Uysal, E.; Budak, E.; Bakkal, M. Increasing tool life in machining of difficult-to-cut materials using nonconventional turning processes. Int. J. Adv. Manuf. Technol. 2015, 77, 1993–2004. [Google Scholar] [CrossRef]
- Berenji, K.R.; Kara, M.E.; Budak, E. Investigating high productivity conditions for turn-milling in comparison to conventional turning. Procedia CIRP 2018, 77, 259–262. [Google Scholar] [CrossRef]
- Özel, T.; Karpat, Y. Predictive modeling of surface roughness and tool wear in hard turning using regression and neural networks. Int. J. Mach. Tools Manuf. 2005, 45, 467–479. [Google Scholar] [CrossRef]
- Thai, N.; Shi, B.; Ghorbani, H.; Attia, H. Experimental investigation and simulation of laser surface heating and its effects on residual stresses and microstructure for AISI 52100 and H13. Procedia CIRP 2025, 133, 501–506. [Google Scholar] [CrossRef]
- Otalora-Ortega, H.; Osoro, P.A.; Arriola, P.J.A. Analytical modeling of the uncut chip geometry to predict cutting forces in orthogonal centric turn-milling operations. Int. J. Mach. Tools Manuf. 2019, 144, 103428. [Google Scholar] [CrossRef]
- Barry, J.; Byrne, G. The mechanisms of chip formation in machining hardened steels. J. Manuf. Sci. Eng. 2002, 124, 528–535. [Google Scholar] [CrossRef]
- Dogra, M.; Sharma, V.S.; Sachdeva, A.; Suri, N.M.; Dureja, J.S. Tool wear, chip formation and workpiece surface issues in CBN hard turning: A review. Int. J. Precis. Eng. Manuf. 2010, 11, 341–358. [Google Scholar] [CrossRef]
- Karagüzel, U.; Uysal, E.; Budak, E.; Bakkal, M. Analytical modeling of turn-milling process geometry, kinematics and mechanics. Int. J. Mach. Tools Manuf. 2015, 91, 24–33. [Google Scholar] [CrossRef]
- Santhakumar, J. Parametric optimization of trochoidal step on surface roughness and dish angle in end milling of AISID3 steel using precise measurements. Materials 2019, 12, 1335. [Google Scholar] [CrossRef]
- Wang, X.; Feng, C. Development of empirical models for surface roughness prediction in finish turning. Int. J. Adv. Manuf. Technol. 2002, 20, 348–356. [Google Scholar] [CrossRef]
- International Organization for Standardization. ISO 3685:1993, Tool-Life Testing with Single-Point Turning Tools. Available online: https://www.iso.org/standard/9151.html (accessed on 1 October 2025).
- International Organization for Standardization. ISO 8688-2:1989, Tool Life testing in Milling Part 2: End Milling. Available online: https://www.iso.org/standard/16092.html (accessed on 1 October 2025).
- Ramesh, S.; Karunamoorthy, L.; Palanikumar, K. Measurement and analysis of surface roughness in turning of aerospace titanium alloy (gr5). Measurement 2012, 45, 1266–1276. [Google Scholar] [CrossRef]
- Neşeli, S.; Yaldız, S.; Türkeş, E. Optimization of tool geometry parameters for turning operations based on the response surface methodology. Measurement 2011, 44, 580–587. [Google Scholar] [CrossRef]
- Singh, D.; Rao, P.V. A surface roughness prediction model for hard turning process. Int. J. Adv. Manuf. Technol. 2007, 32, 1115–1124. [Google Scholar] [CrossRef]
- Astakhov, V.P. The assessment of cutting tool wear. Int. J. Mach. Tools Manuf. 2004, 44, 637–647. [Google Scholar] [CrossRef]


Disclaimer/Publisher’s Note: The statements, opinions and data contained in all publications are solely those of the individual author(s) and contributor(s) and not of MDPI and/or the editor(s). MDPI and/or the editor(s) disclaim responsibility for any injury to people or property resulting from any ideas, methods, instructions or products referred to in the content. |
© 2025 by the authors. Licensee MDPI, Basel, Switzerland. This article is an open access article distributed under the terms and conditions of the Creative Commons Attribution (CC BY) license (https://creativecommons.org/licenses/by/4.0/).