1. Introduction
Wearable devices are expected to grow thinner and smaller due to simplified circuitry and other factors, with the global wearable technologies market having sales of
$61.30 billion in 2022 and expected to expand at a compound annual growth rate (CAGR) of 13.6% from 2025 to 2030 [
1]. Wearable devices include watches and rings worn on the body. The use of nanosheets as substrates for wearable devices is expected to enable even thinner and smaller devices, further expanding sales in the wearable technology market.
Nanosheet is a two-dimensional structure with a controlled film thickness of several tens of nanometers. It possesses extremely high flexibility and adhesiveness. Nanosheets have excellent properties that allow them to be attached to even complex uneven surfaces by physical adsorption alone, without the use of adhesives. Okamura et al. used biocompatible and biodegradable polylactic acid, which is used in surgical sutures, as a nanosheet material [
2,
3]. The polylactic acid nanosheet is expected to be used as a biomedical device to reduce the burden on patients during surgery and as an alternative to cloth for preventing bleeding in emergency situations. Medical devices and surfaces require materials with anti-biofouling and antimicrobial growth properties. Biofouling can easily occur on medical devices such as catheters and dental implants and can spread infection. The surface structure that prevents infection is shark skin. Polylactic acid (PLA) primarily exists in two forms: crystalline Poly-L-lactic acid (PLLA) and amorphous Poly-DL-lactic acid (PDLLA). Both forms are well-known for their biodegradability and excellent biocompatibility [
4,
5]. Previous studies have employed PLLA; however, its high crystallinity results in significant molding shrinkage, posing challenges in processing. In contrast, PDLLA, being an amorphous material, exhibits reduced molding shrinkage and is easier to process. In experiments involving transplantation of PDLLA into small animals, degradation within the body was observed approximately six months post-implantation. Local inflammatory responses were minimal and naturally resolved. Furthermore, blood tests revealed no significant abnormalities, indicating high biocompatibility. Based on these findings, PDLLA was selected for use in this study [
6]. Sharks have small V-shaped dermal denticles that cover their skin. They also have periodic grooves with intervals of several tens of µm called rivulet structures [
7,
8,
9,
10]. These two structures allow water to move quickly on the skin surface by reducing drag and turbulent eddies when moving through water [
11] and have a friction-reducing effect by reducing the contact surface with objects due to microscopic surface protrusions. Although numerous studies have been conducted on shark-skin-inspired surfaces, the majority have focused on imparting functional properties either through direct laser processing onto mechanical components [
12,
13,
14] or by replicating the structures in PDMS [
15,
16]. In contrast, relatively few studies have explored the application of such structures to coatings or polymer sheets. Based on the above results, it was considered that the introduction of a shark-skin-like structure on the surface of a nanosheet might enhance its functionality and improve its frictional properties. However, applying a shark-skin-inspired riblet structure to an extremely thin three-dimensional structure such as a nanosheet remains technically challenging. Therefore, to address this issue, we initially attempted to place nanosheets onto a shark-skin surface, thereby imparting a pseudo-shark skin morphology to the nanosheet surface.
Therefore, the objective of this study is to investigate whether the tribological properties between a human finger and shark-skin surface change depending on differences in surface texture when the shark skin is covered with a PDLLA nanosheet. Additionally, to examine the influence of fingerprint patterns (Whorls, Loops, Arch) on frictional characteristics, experiments were conducted with male and female participants aged 20 to 30 years. Furthermore, this study evaluates whether the characteristics of the riblet structures are affected when a wearable device using a nanosheet as a substrate is attached to a shark-skin surface. In addition, a portion of this research was previously published as an abstract for a conference [
17]; however, although differences in fingerprint pattern geometry were reported within the presented friction data, comparisons involving the shark skin and the denticle-based model, as well as the influence of sliding direction, were not addressed in the previous submission. This paper provides a more detailed and expanded description of the results and discussion.
2. Materials and Methods
In previous studies, the PLLA has been used as a material for poly lactic acid, but it is crystalline [
18], and its physical properties change at high temperatures so the development of processes such as heat treatment cannot be expected. In this study, Poly-DL-Lactic Acid (PDLLA) was used to solve this problem. Due to its distinct chemical characteristics and amorphous nature compared to PLLA, PDLLA nanosheets do not undergo crystallization even upon thermal treatment. Consequently, their physical properties remain stable during high-temperature processing, such as embossing.
Therefore, in this experiment, PDLLA (Mw~450,000, Polysciences, Inc., Warrington, PA, USA) was used as the material for the nanosheets and was produced using the MG printing method [
19]. The nanosheets were fabricated by micro-gravure (MG) printing (μCoater™ 350, Yasui Seiki, Japan).
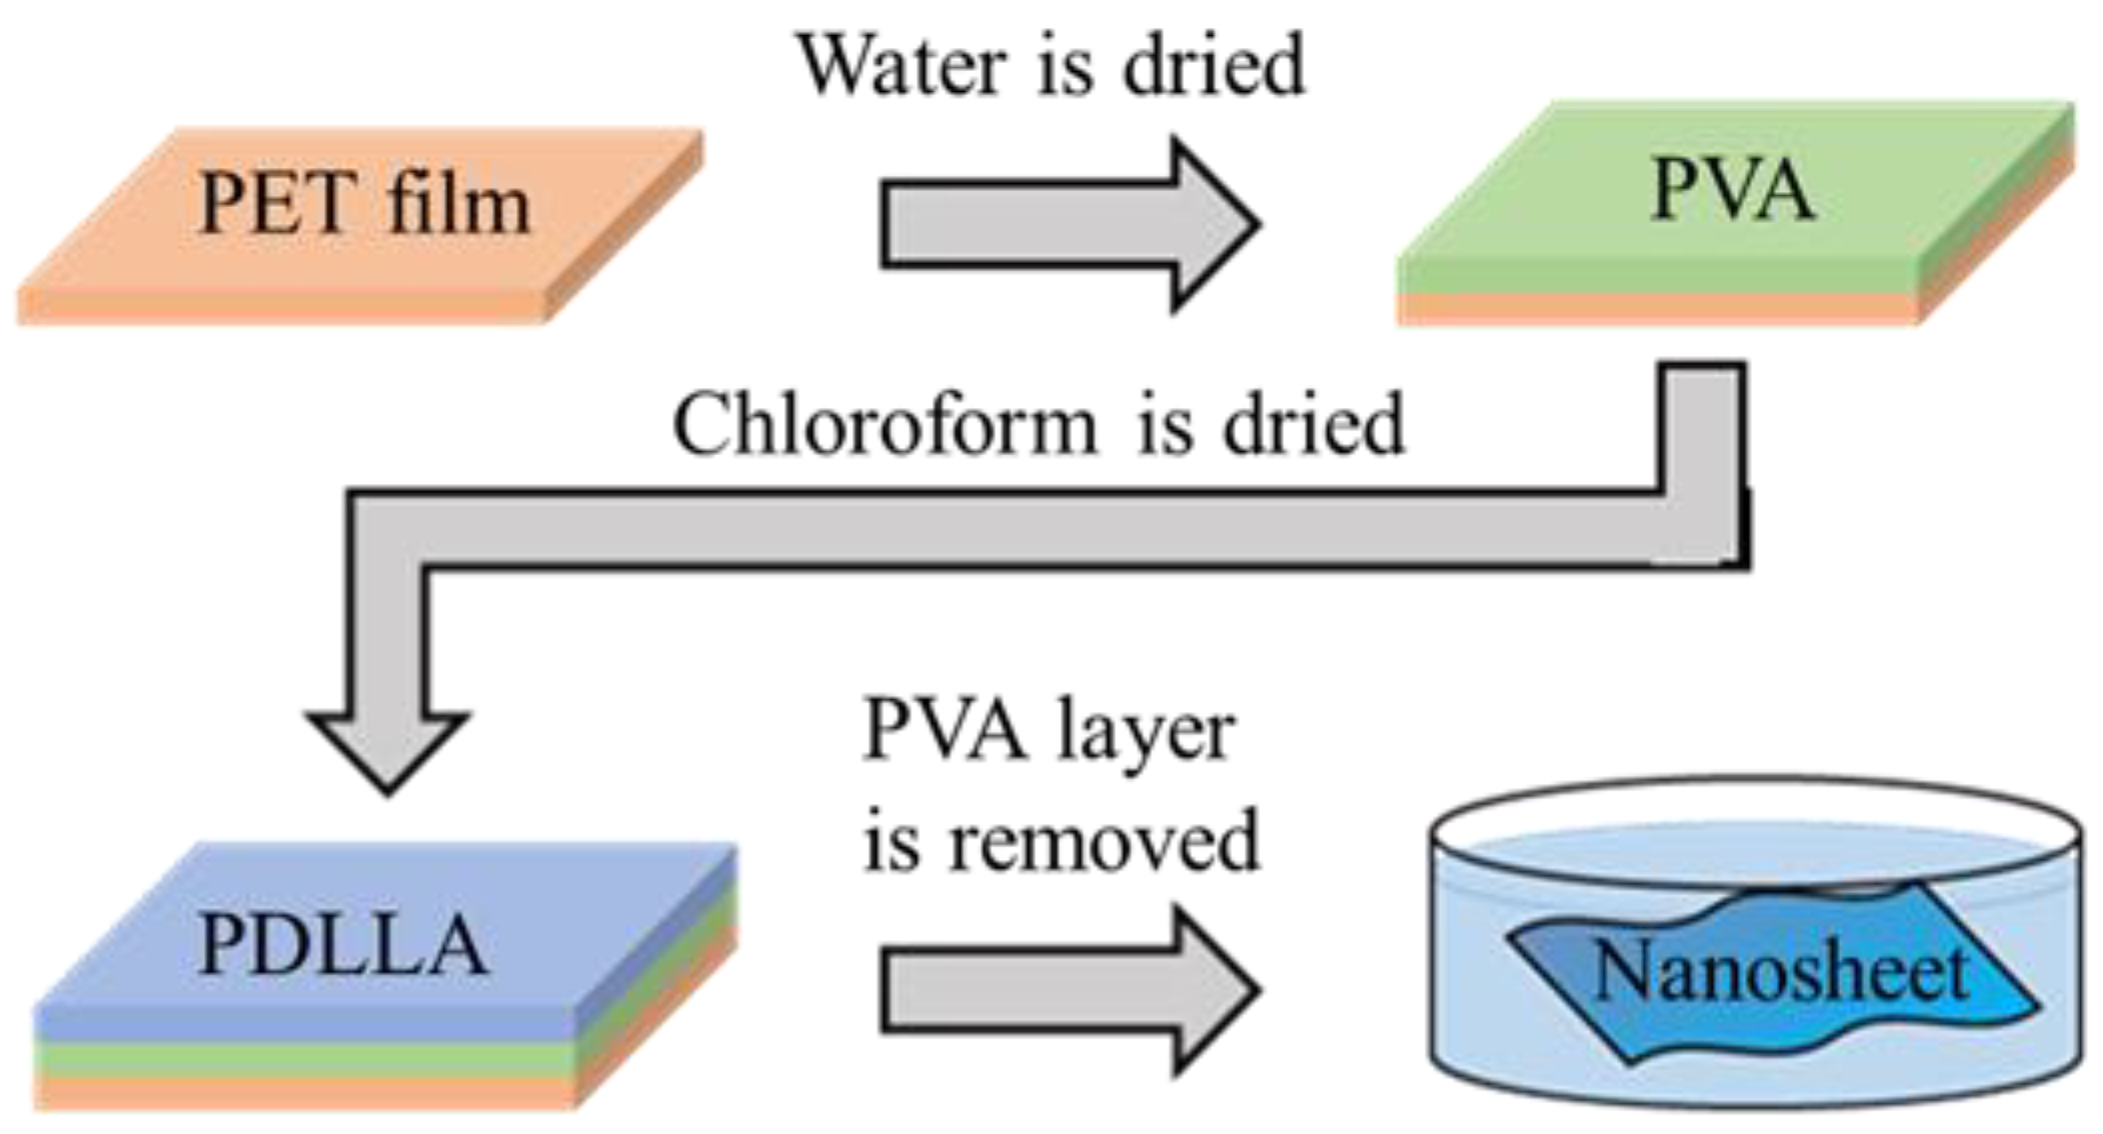
Figure 1 shows the sacrificial film method used to fabricate nanosheets. The coating requires the solid polymer to be liquefied and placed in a solution tank. For this, the polymer to be used and its solvent are described as follows. First, an aqueous solution of polyvinyl alcohol (PVA, Mw = 1500–1800, FUJIFILM Wako Pure Chemical Corporation, Osaka, Japan), dissolved in ultrapure water was coated onto the Polyethylene terephthalate (PET) film (100T60, Toray Industries, Inc., Tokyo, Japan) at a web speed of 1.0 m/min and an MG roll rotation speed of 64 rpm, followed by drying at 100 °C. Subsequently, a solution of PDLLA dissolved in chloroform (1st Grade, Wako, Japan) was coated on the PVA layer at the speed of 4.0 m/min and an MG roll rotation speed of 64 rpm and dried at 80 °C. The resulting trilayer film (PET film/PVA/PDLLA) was then immersed in ultrapure water at 25 °C for 1.0 min to dissolve the intermediate PVA layer, thereby releasing the PDLLA nanosheet from the PET film. The nanosheet was subsequently placed onto a silicon (Si) substrate (<100>, p-type, SUMCO Corporation, Tokyo, Japan), followed by the evaluation of its film thickness and surface roughness. Film thickness was measured using a profilometer (DektakXT, BRUKER, Billerica, MA, USA) [
19], while surface roughness was characterized using a white light interferometric microscope (BW-S507, Nikon, Tokyo, Japan). To assess the uniformity of film thickness along the longitudinal axis, the nanosheet was cut into dimensions of 10 mm × 90 mm and subject to thickness measurement.
To evaluate the uniformity of film thickness in the transverse direction (perpendicular to the conveyance direction), the nanosheet was cut into dimensions of 10 mm × 90 mm and subject to measurement. During the measurement, a groove was created along the longitudinal axis, and a stylus profilometer was used to scan across the groove in the perpendicular direction. The height difference between the groove and the surrounding surface was taken as the film thickness.
The process is shown in
Figure 2. Preparation of samples involved the pre-treatment process and preparation of a polydimethylsiloxane (PDMS) mixture that involved the elastomeric embedded stamping (PEES) method [
20]. We adopted this method because it offers high reproducibility of microstructures and versatility compared to other stamping methods. PDMS was used to replicate the negative imprint of shark skin. The PDMS was degassed in a vacuum chamber for 1 h to remove air bubbles and subsequently cured in an oven at 100 °C for 3 h. Then, a nanosheet was used to imprint the shark skin from the negative imprint of shark skin. The preparation of samples started with the pre-treatment process of fresh shark skin. The shark was deskinned to remove the meat and fat from the shark skin. Then, the shark skin underwent a drying process to ensure that the shark skin was suitable for further procedures. During the drying process, the shark skin was pinned on top of polystyrene to ensure the skin did not shrink or wrinkle during the drying process. The next step in preparation of the sample was the preparation of a polydimethylsiloxane (PDMS) mixture that involved the elastomeric embedded stamping (PEES) method. In this method, PDMS polymer (SILPOT 184, TORAY, Japan) and its curing agent were mixed at a ratio of 10:1. The model was fabricated with a thickness of 5.0 mm. The shark skin was placed in the container before the PDMS mixture was poured into the mold.
The product obtained was a negative imprint of the shark skin (NSS). The steps were then repeated with negative imprints as the mold to obtain the positive imprint of the shark skin (PSS), which is also known as biomimetic shark skin. The process for this part is shown in the schematic diagram in
Figure 2. The last part in the preparation of the sample was the extraction of the PDLLA nanosheet. In this procedure, distilled water was used to separate the PDLLA nanosheet from the PVA sheet before transferring the PDLLA nanosheet to the surface of the sample. The film was immersed in water for one hour, then we slowly separated the PDLLA nanosheet from the PVA sheet using tweezers. The PDLLA nanosheet was naturally hydrophobic polymer while PVA was hydrophilic polymer. The PDLLA nanosheet was ready for transfer when the PDLLA nanosheet floated on the surface of the water while the PVA sheet sank to the bottom of the water. After the preparation of samples, the samples were observed by scanning electron microscopy (SEM) (TM3030, HITACHI, Tokyo, Japan) to ensure the denticles were present on the surface of the PDMS. Prior to SEM observation, the real shark skin and model surfaces were thoroughly dried to prevent the presence of water droplets and then coated with a thin layer of platinum. If the denticles were absent, the process was repeated until the denticles were present on the PDMS for the next research procedure. The nanosheets fabricated for this study had an approximate thickness of 100 nm, and those with a surface roughness of 2.53 nm were selected for tribological measurements, as shown in
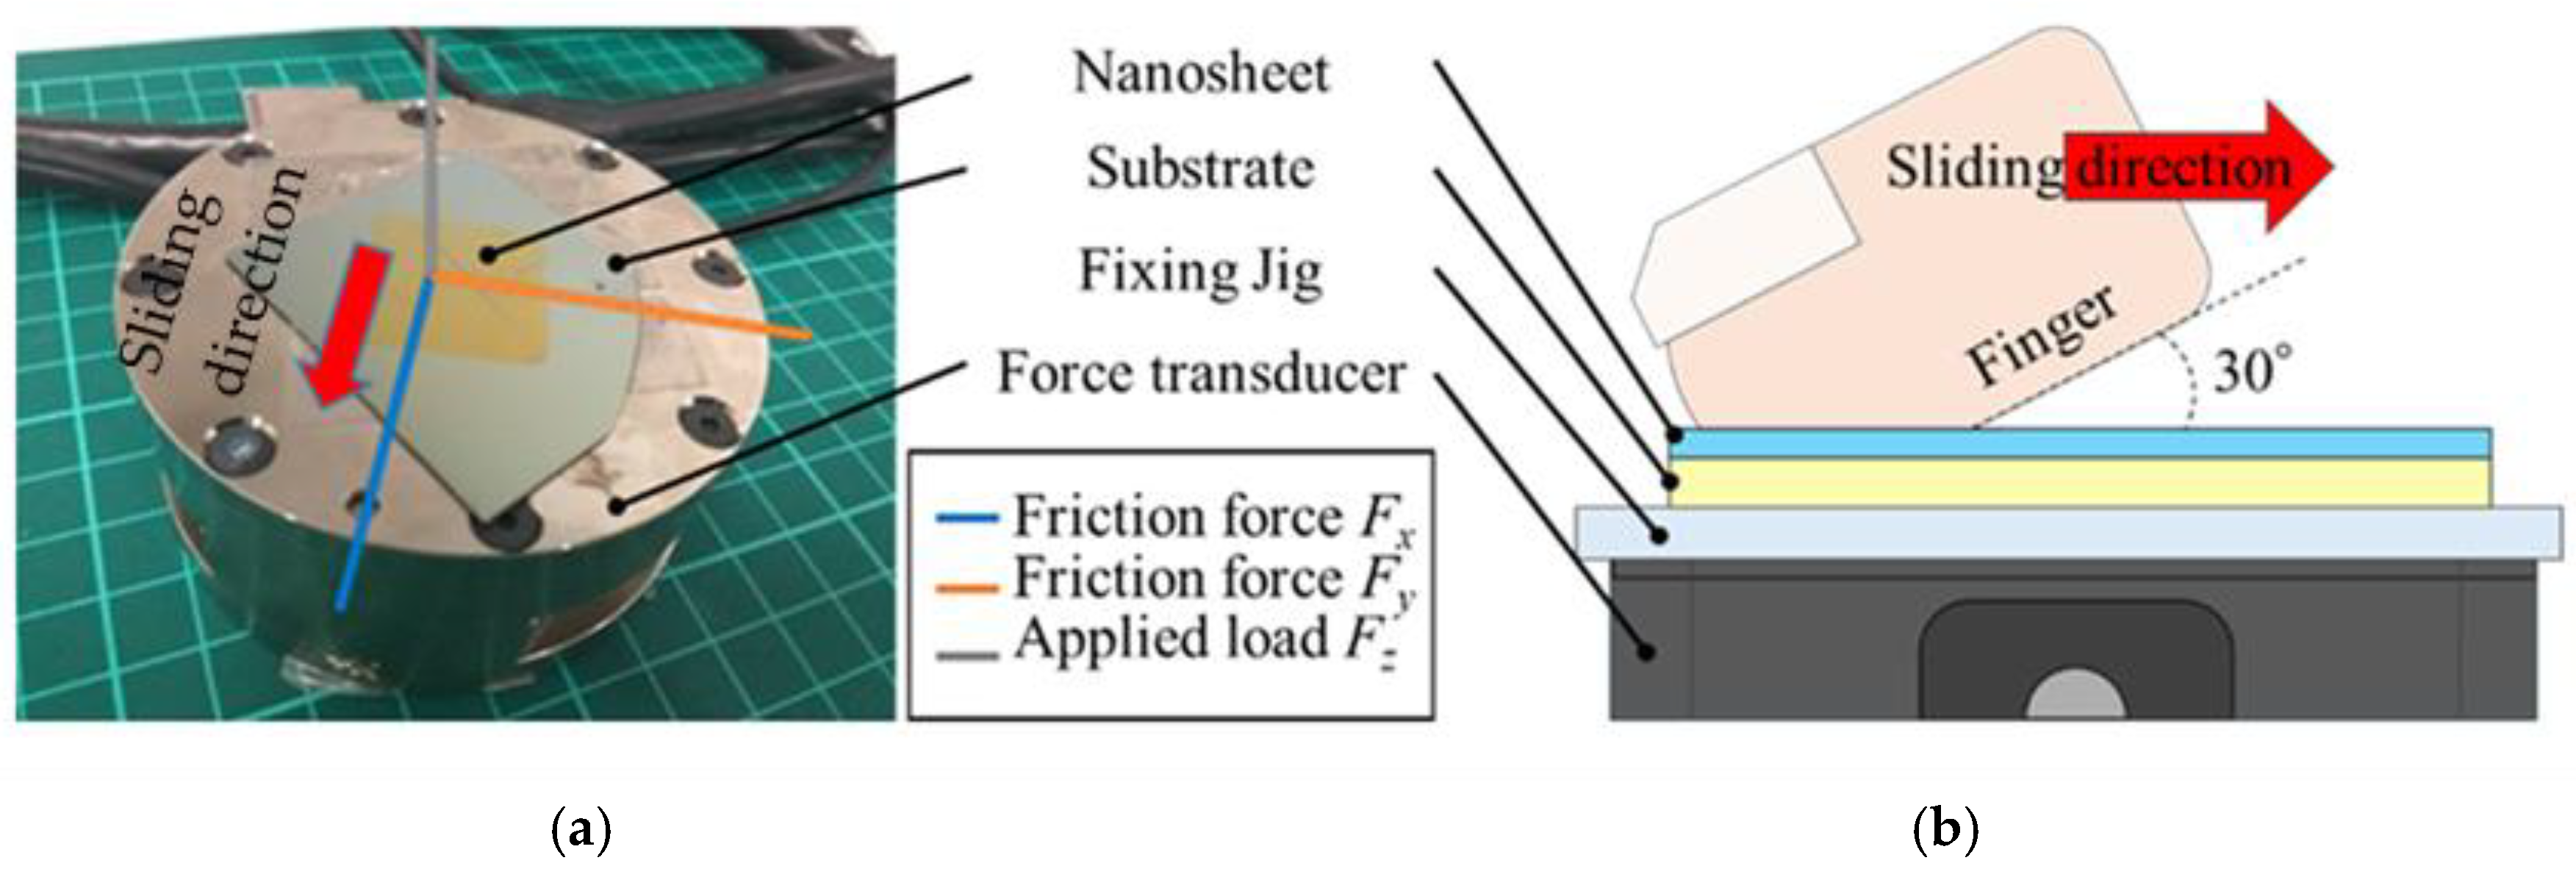
Figure 3, using a force transducer (ATI F/T Sensor Gamma, ATI Industrial Automation, Apex, NC, USA) with a measurement range of X,
Y-axis ~32 N (Resolution 1/160 N) and
Z-axis ~100 N (Resolution 1/80 N). The force transducer was used to measure the friction between two surfaces. In this experiment, biomimetic shark skin, real shark skin, and flat PDMS were used. The coefficient of friction was analyzed by computer from a force transducer. The force transducer consisted of three axes:
X-axis,
Y-axis, and
Z-axis. In this experiment, the
X-axis focused only on the sliding force and the
Z-axis on the normal force acting on the sample; the
Y-axis was ignored because the finger could slide over the sample in only one direction, the X direction, and no force was applied in the Y direction [
21,
22]. A nanosheet measuring 30 × 30 mm was placed on a silicon substrate and secured to a force transducer. The sliding tests were conducted at a speed of 10 mm/s and a distance of 30 mm, with the finger contacting the sample at an angle of 30°. To eliminate sweat and sebum from the skin surface prior to testing, the finger was thoroughly washed with soap, and residual moisture was removed using an air spray.
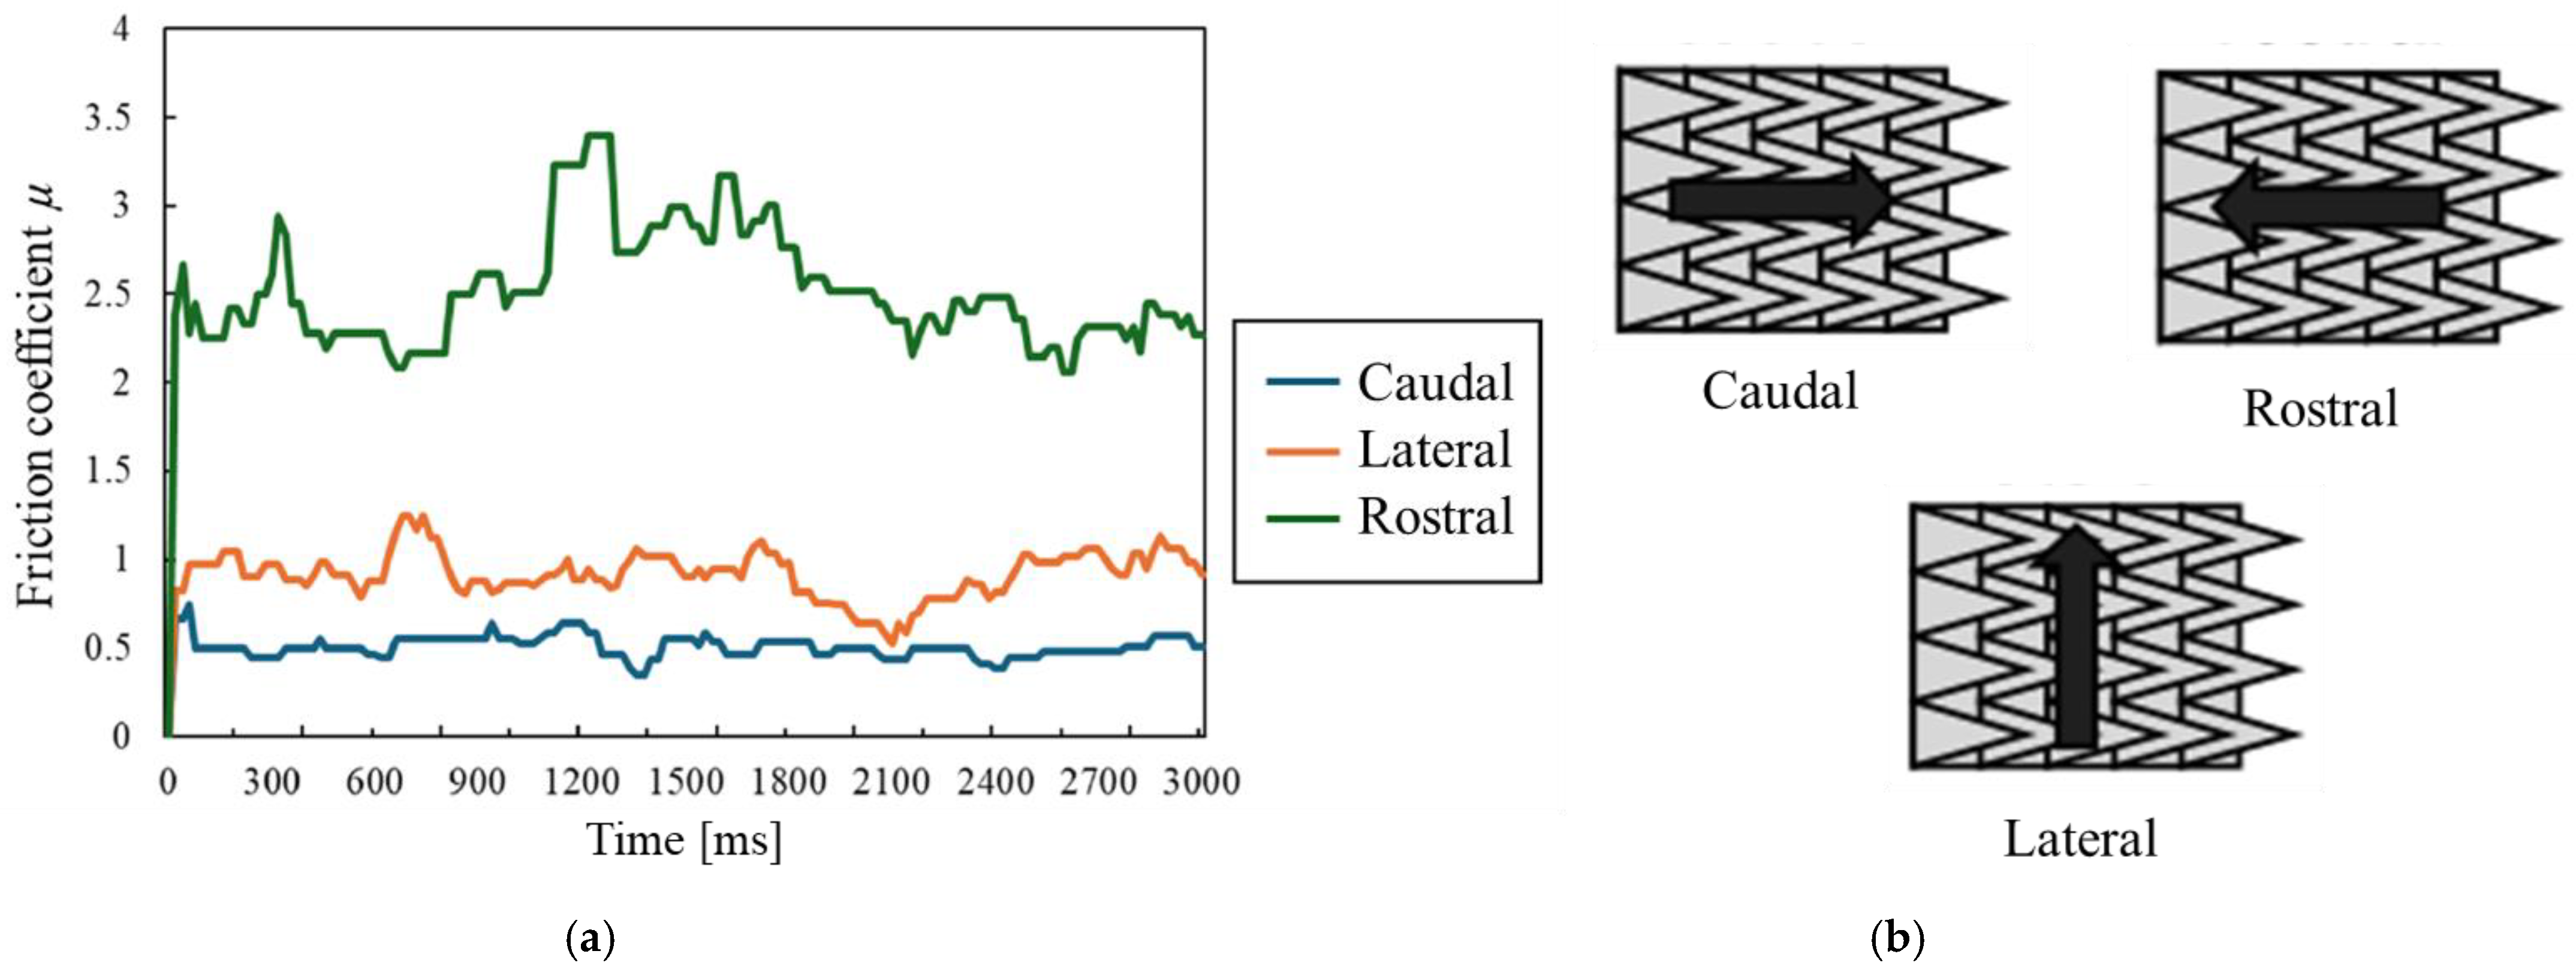
The sliding directions were taken in three different directions. The sliding directions included the caudal direction along the shark skin dent, the rostral direction sliding against the shark skin dent, and the transverse direction across the shark skin dent.
This experiment was conducted on three different individuals to examine the effects of different human tactile sensations on samples with and without PDLLA nanosheet coating. The experiment was also conducted by applying three different ranges of normal force to the samples.
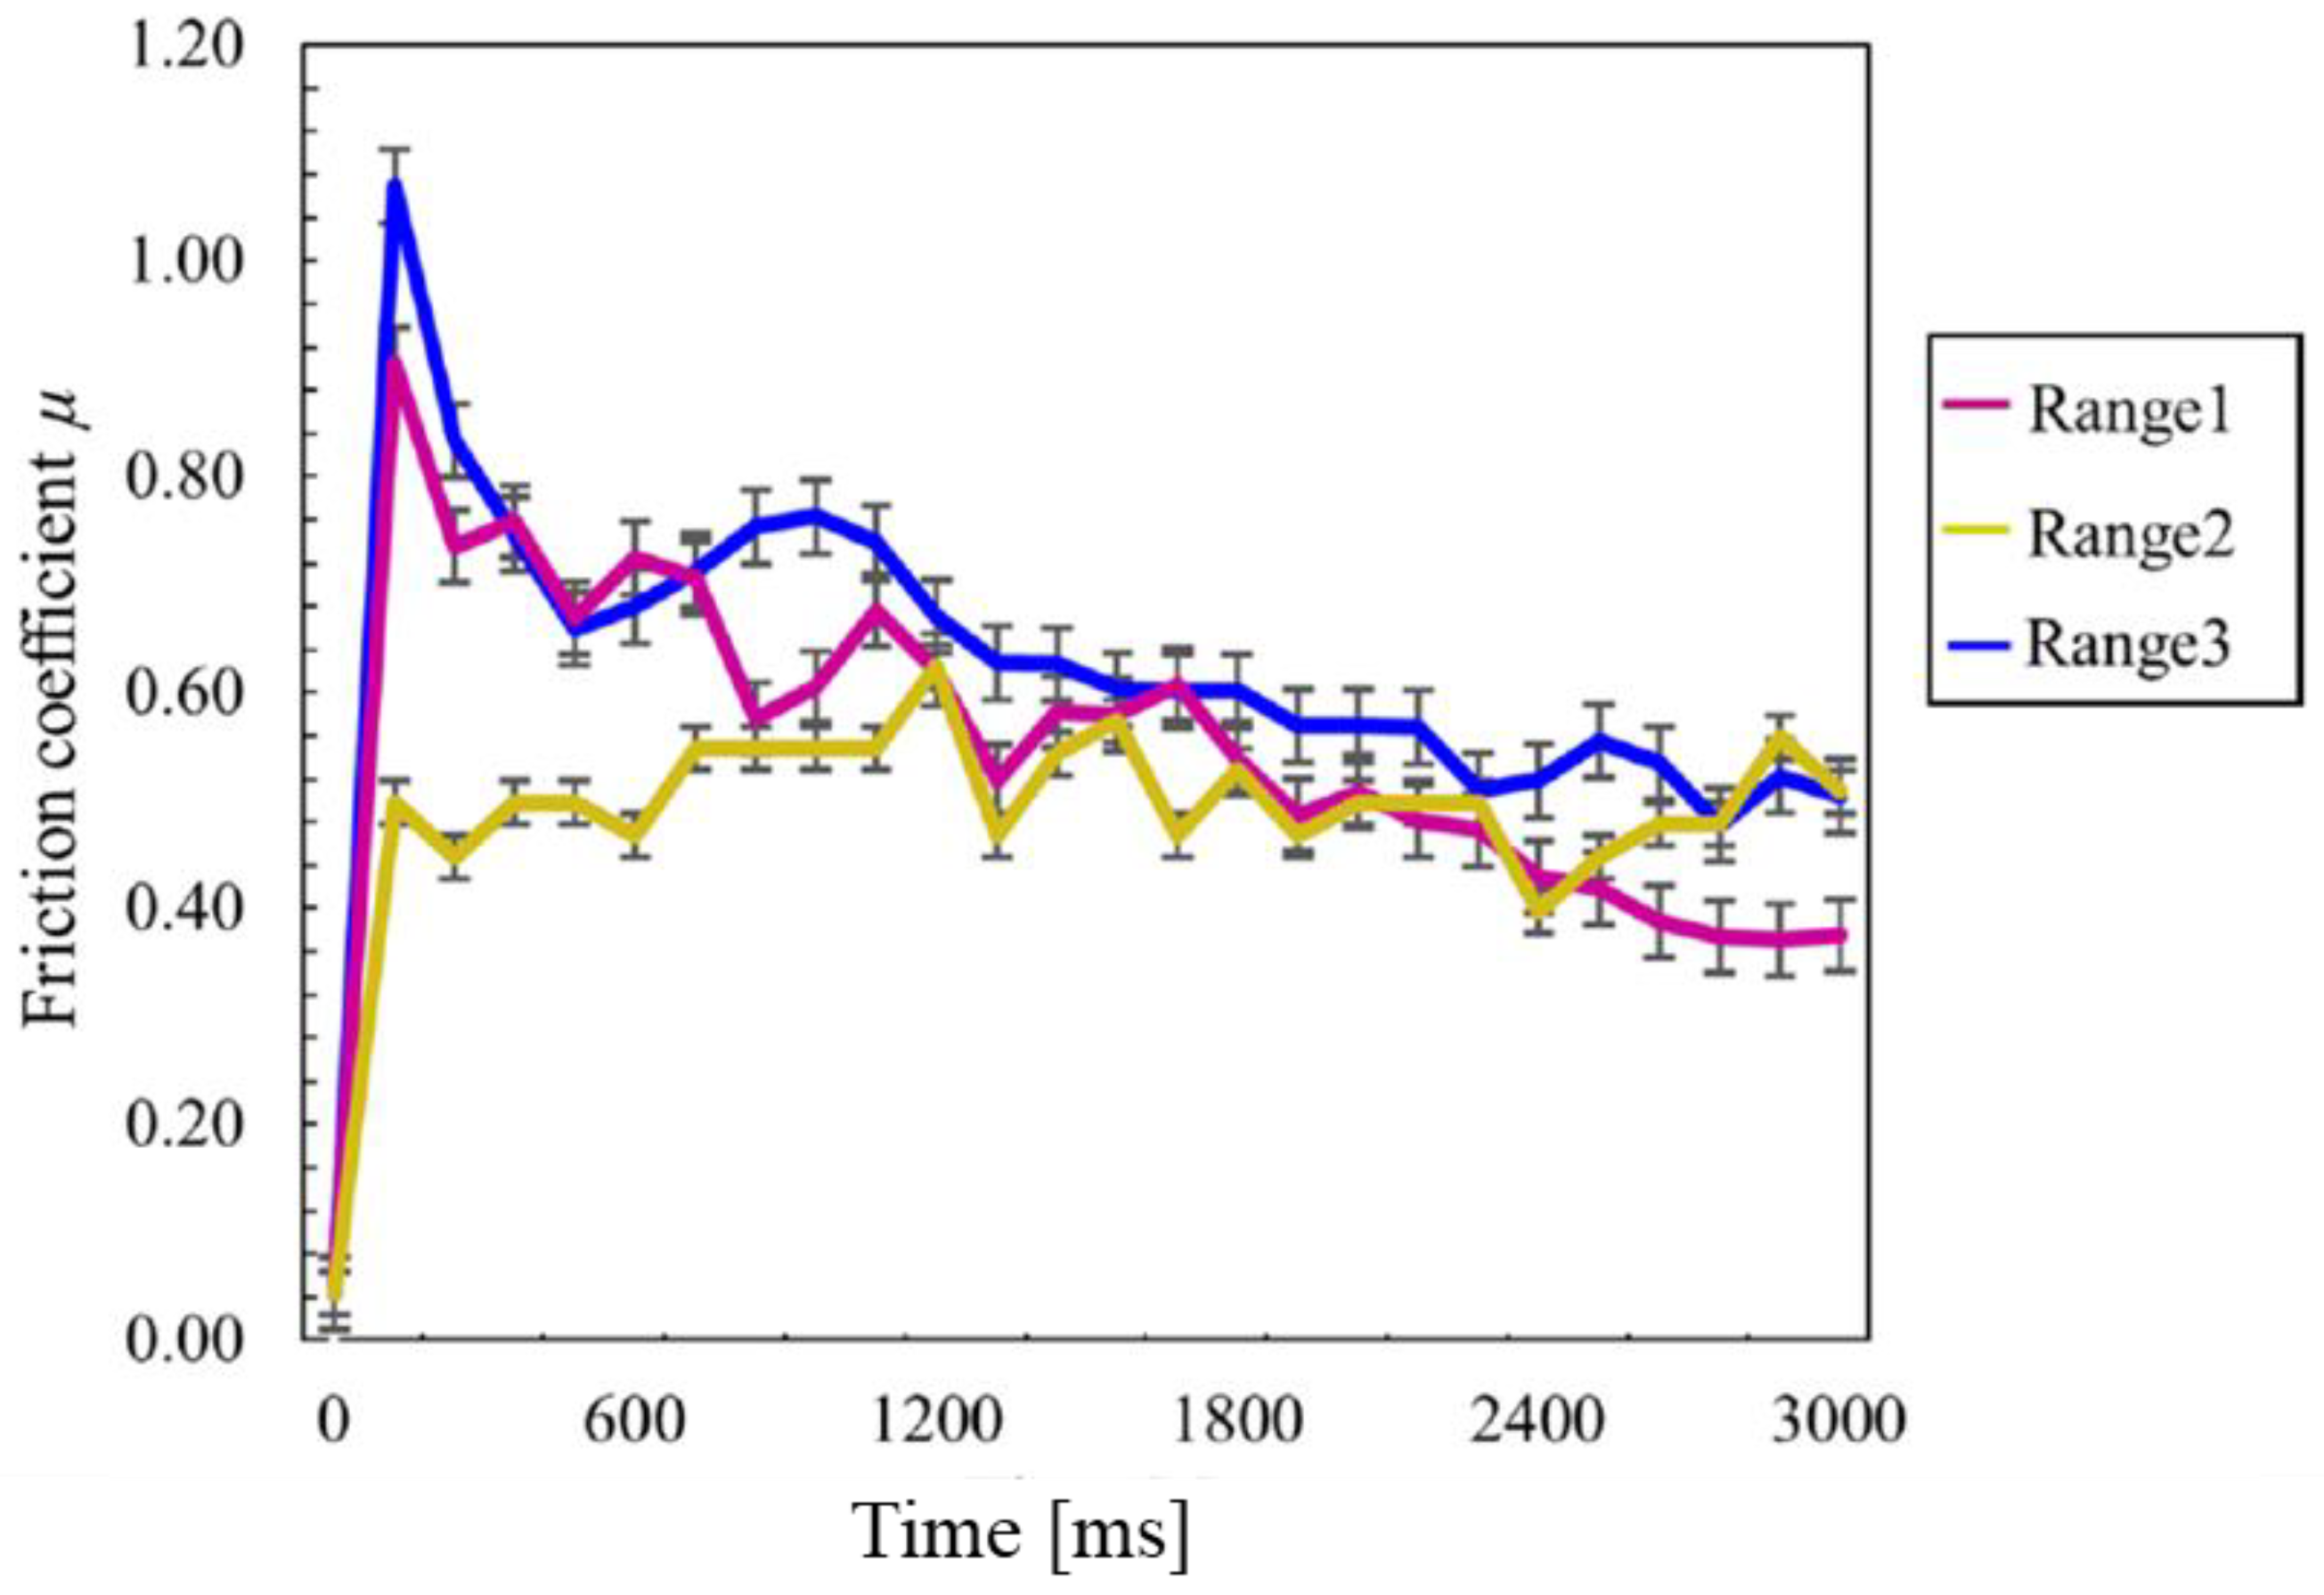
Figure 4 shows the variation in the coefficient of friction over time under different normal forces applied during sliding. The horizontal axis represents time, while the vertical axis represents the coefficient of friction. The pink line represents Range 1, the yellow line represents Range 2, and the blue line represents Range 3. These values represent the average results from three experimental runs. The first range is between 0.1 N and 1.0 N, the second range is between 1.1 N and 2.0 N, and the third range is between 2.1 N and 3.0 N. Considering the vulnerability of the nanosheets under high-humidity conditions during the experimental setup, the applied sliding force was restricted to a maximum of 3.0 N, beyond which mechanical failure of the nanosheet structure was observed, as shown in the graph in
Figure 4. When using the force transducer; for samples with PDLLA nanosheets, the experiment was performed using only Range 1 to avoid nanosheet damage to the sample. Furthermore, the application of the nanosheets was more focused on the effects of human touch against the surface. The average human touch force is 60.42 g, which is about 0.6 N [
23]. Since the average human touch force is within range 1, using range 1 was sufficient to evaluate the coefficient of friction in samples coated with PDLLA nanosheets. The purpose of collecting data at different ranges was to manipulate the load, also called the normal force, to investigate the effect of different loads on the coefficient of friction. The experiment was repeated 10 times, with each run involving sliding on a 30 mm × 30 mm nanosheet for a period of 3 s. The three-second period was used as an indicator to measure the sliding distance of 20 mm at a constant speed. The average coefficient of friction (COF) in each direction was calculated using the following equation. The participants in the measurement, based on fingerprint patterns, were males and females aged between 20 and 30 years. The global distribution of fingerprint patterns, according to the Henry Classification System, is reported as follows: Whorl accounts for 30–35%, Arch for 5–10%, and Loop for 60–65% [
24]. Based on this distribution, participants with three types of fingerprint patterns—Whorl, Arch, and Loop—were selected for this study. It is generally known that ridge density in fingerprint patterns is higher in females than in males [
25,
26,
27]. Moreover, the maximum surface roughness (SMa) of fingerprints in subjects aged 26 ± 3 years has been reported to be 0.85 ± 0.03 µm for males and 1.2 ± 0.02 µm for females [
28]. However, as the objective of this experiment is to investigate the influence of differences in fingerprint patterns on frictional characteristics, variations in the contact surface and differences in surface roughness due to gender are excluded from the scope of this study.
3. Experimental Results
This part discusses the friction coefficient (COF) for real shark skin, biomimetic shark skin, and samples coated with PDLLA nanosheet using a force transducer. The friction coefficient of the samples was taken by sliding experiment using force transducer in the caudal, rostral, and lateral directions of sliding. Other than that, the effect of different individual touch against the samples was also observed in this section to determine the effect of friction coefficient of different persons on the samples.
Figure 5 shows SEM images of shark skin used as transfer substrates for PDLLA nanosheet. From the surface images, it is evident that
Figure 5b successfully replicates the surface structure of RS. Furthermore,
Figure 5c appears to have effectively transferred the inverse pattern of
Figure 5a.
Figure 6 shows the coefficient of friction as a function of time, with varying normal forces during the sliding process. The horizontal axis represents time, while the vertical axis indicates the coefficient of friction. The different lines correspond to various conditions: the dark blue line represents FS, the purple line represents N, the pink line represents P, the light green line represents NN, the orange line represents FSN, the brown line represents PN, the light blue line represents RSSN, and the green line represents RSS. These values represent the average results from three experimental runs.
Figure 6 shows the graph has a similar trend to the typical graph of coefficient of friction against time. Even though the trend is similar, the degree of value for each sample is different. The peak value of friction coefficient indicates the stick–slip phenomena that occurs on every static object before moving. Stick–slip is a phenomenon where there is spiking in the friction coefficient with time at the beginning of stationary contact between two surfaces [
29].
Table 1 shows that flat surface PDMS (FS) has the highest friction coefficient compared to other samples. This is because there was no presence of friction reduction microstructures as well as other friction-reducing coatings or materials on top of it. FS was considered as the control sample for this study as there was no presence of biomimetic shark-skin surfaces or PDLLA nanosheet on top of it. From the graph, real shark skin (RSS) had the lowest friction coefficient in the three-second period experimental procedure. Furthermore, in the models with and without nanosheets, the coefficient of friction was lower with nanosheets than without nanosheets.
Friction evaluation was conducted to study the effect of the friction coefficient at different directions of sliding. There are three directions of sliding involved in this procedure, which are the caudal direction, which is along the direction of the denticles of the shark skin; the rostral direction, which is against the direction of the shark skin denticles; and the lateral direction, which is in the direction across the denticles of the shark skin. This procedure was conducted to compare the friction reduction properties exhibited by the shark skin when it swims. The control environment used to compare the differences in the friction reduction properties of different directions of sliding was real shark skin with normal force applied at range 1, which is between 0.1 N to 1.0 N.
Figure 7 shows that there is a significant difference in the friction coefficient between the three different directions of sliding. The green line represents Caudal (Caudal direction), the orange line represents Lateral (Lateral direction), and the blue line represents Rostral (Rostral direction). These values represent the average results from three experimental runs. From the graph, it is shown that the caudal direction of sliding, which involves sliding along the direction of the denticles, has the lowest friction coefficient, at a period of 3000 ms. Additionally,
Table 2 shows the average friction coefficients from
Figure 7.
This proves that the shark skin structure has friction reduction properties when sliding is performed in a correct manner, which is in the caudal direction.
The friction evaluation was conducted to study the effects of different surfaces which human touches in relation to the friction coefficient. In this study, the index fingers of three different persons were used to study the friction coefficient under different touch conditions. The control variable used in this procedure was the real shark skin (RSS), with the index finger sliding in the caudal direction and normal force applied at range 1, which is at 0.1 N to 1.0 N. Then, each index finger on the three samples was scanned under a digital microscope to relate the friction coefficient with the surface morphology of each index finger.
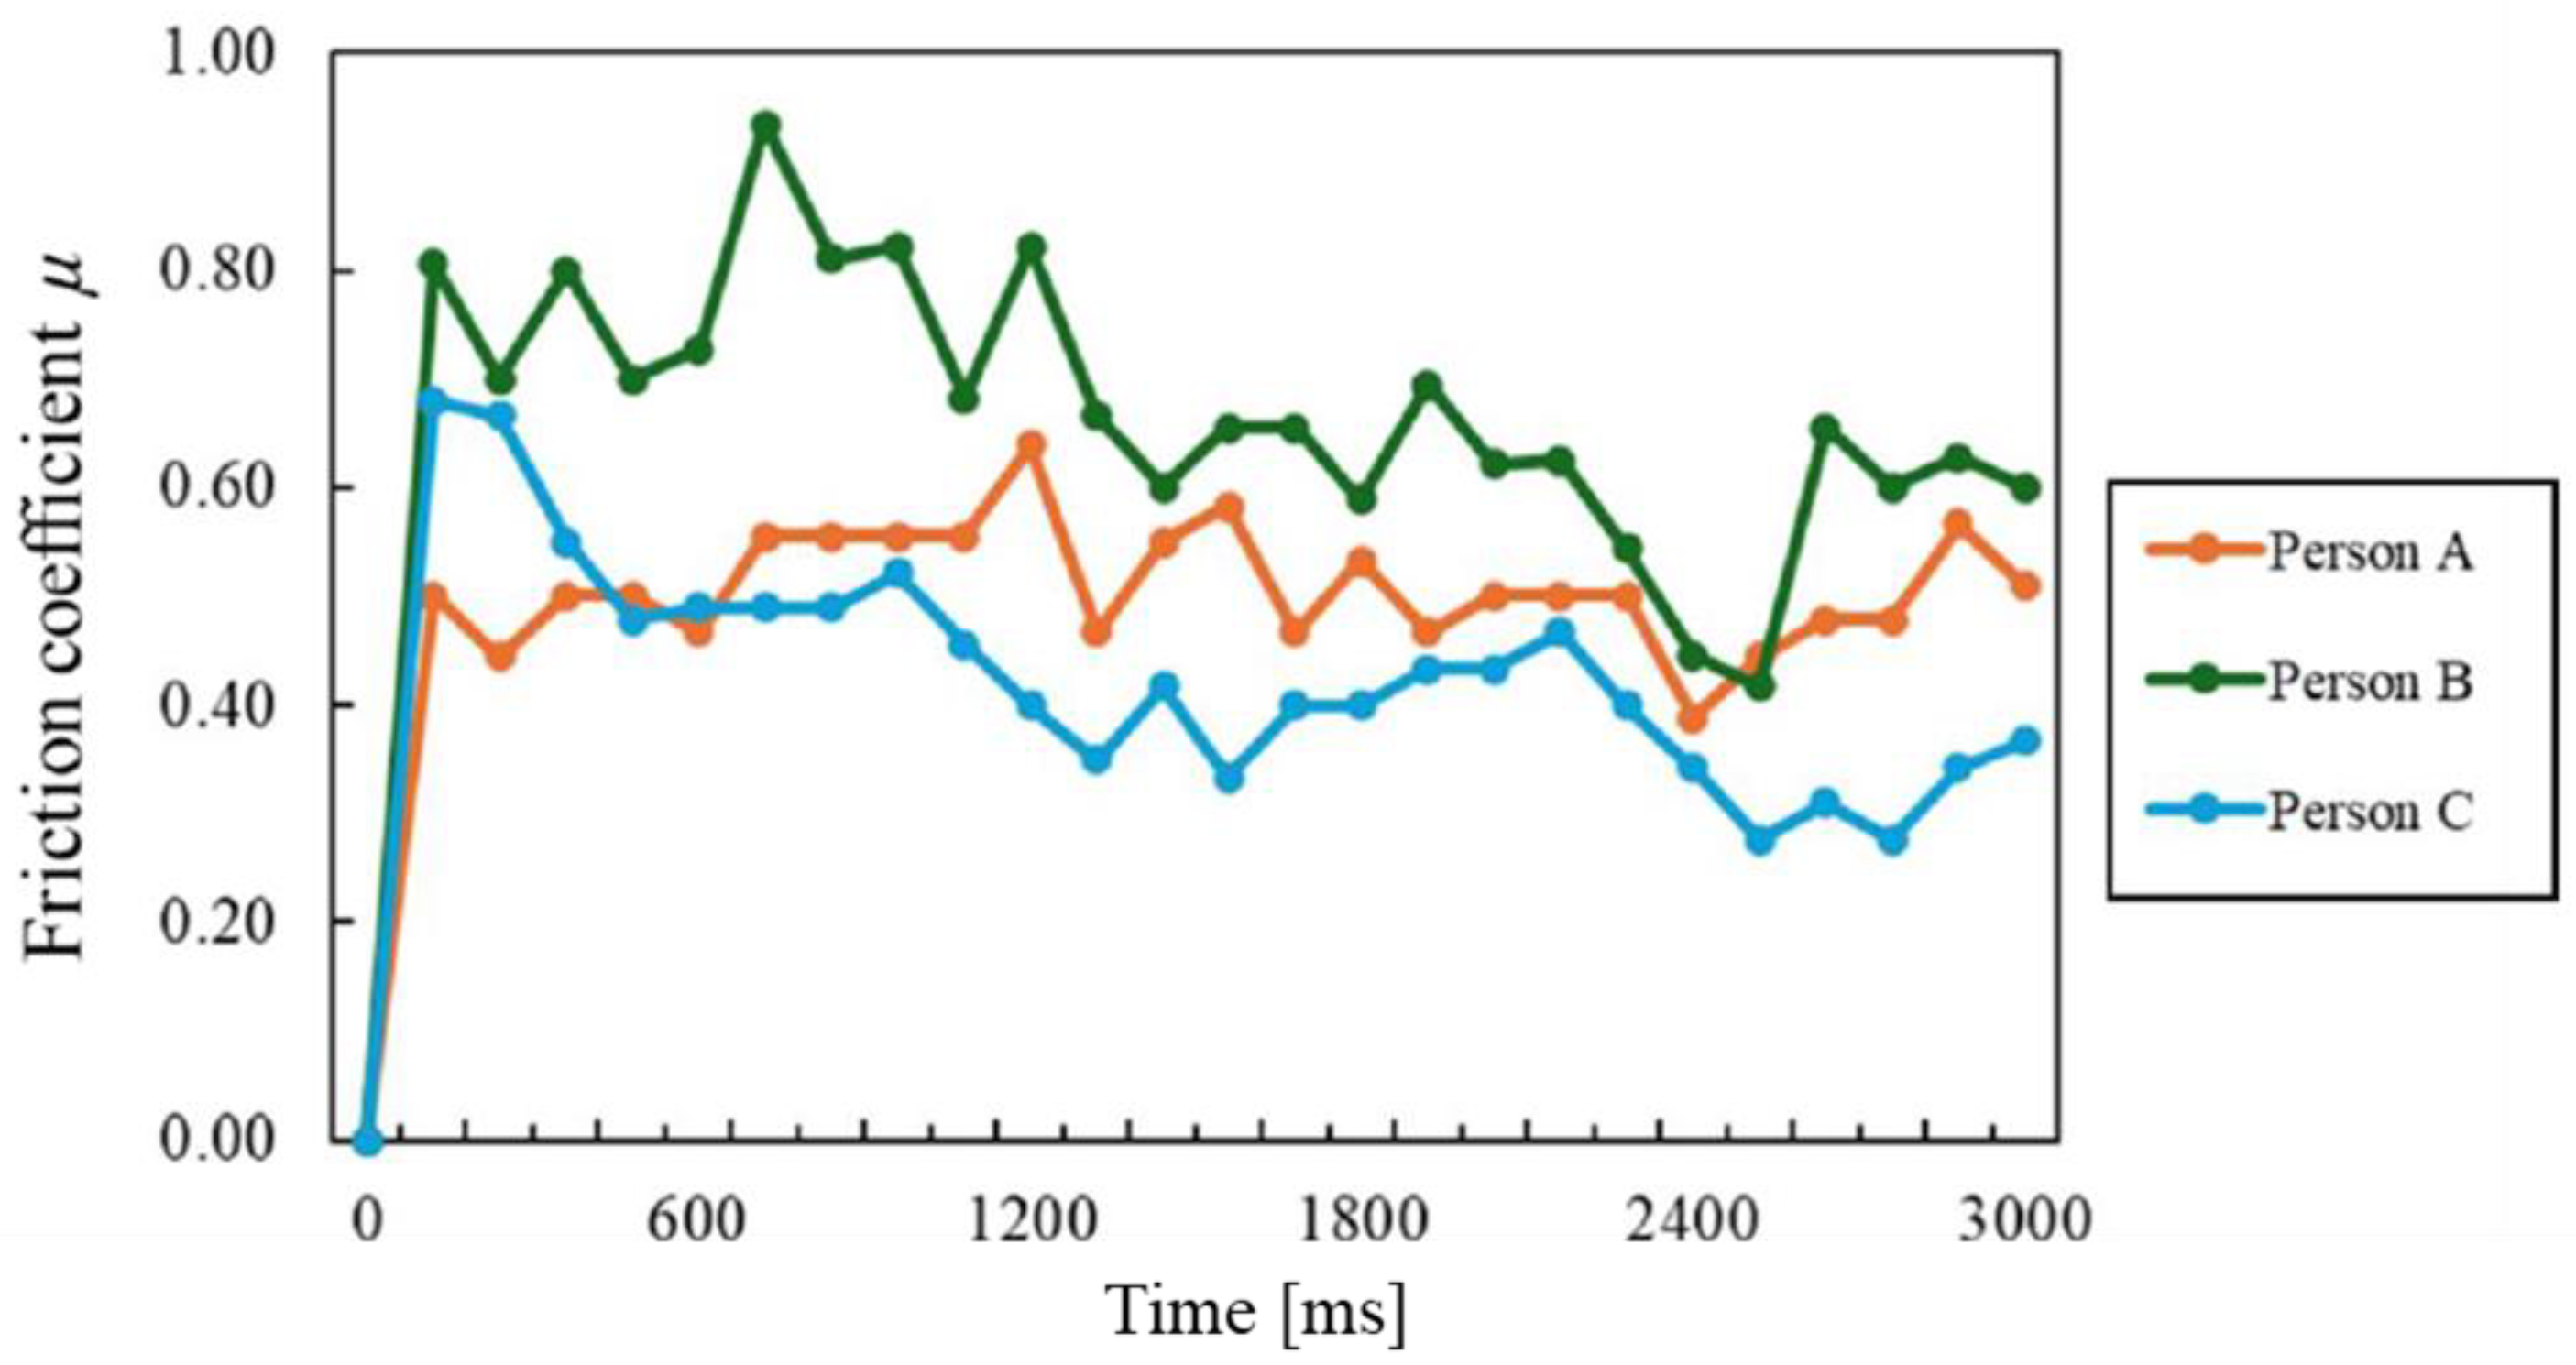
Figure 8 shows that different people had different friction coefficients in the three-second period. The horizontal axis represents time, while the vertical axis represents the coefficient of friction. The orange plot represents Person A, the green plot represents Person B, and the light blue plot represents Person C. These values represent the average results from three experimental runs. Individuals ABC each have their fingerprint patterns shown in
Figure 9. Person A had the lowest static friction, at 0.50, in a period of 120 milliseconds. The surface morphology of Person A’s index finger can be referred to in
Figure 9a. The index finger of Person A has a vertical groove that can be seen as a parallel riblet arranged together. Riblets are small surface protrusions that are aligned with the flow direction and give a surface an anisotropic roughness [
30]. This surface morphology allowed Person A to overcome the static friction with the least force compared to the other two individuals. Next, Person B had the highest friction coefficient. The friction coefficient for overcoming static friction was 0.81. The surface morphology of Person B’s index finger can be referred to in
Figure 9b. It was shown that Person B’s finger had a rough surface morphology. The spiral-like grooves on their index finger made it harder to overcome the static friction, thus this caused Person B to have the highest friction coefficient as compared to the other individuals. Lastly, Person C had the second lowest friction coefficient in this analysis, which can be referred to in the graph plotted in
Figure 7. The surface morphology of the index finger of Person C can be seen in
Figure 9c. It was shown that the sweat gland of Person C is more visible, as Person C tended to sweat a lot even after their hands were washed before the experiment.
Table 3 shows the average friction coefficient and standard deviation for Persons ABC. This feature allowed Person C to have a lower friction coefficient compared to Person B. Sweaty fingers show a presence of lubricant, which is sweat, when sliding occurs; thus, this allows Person C to have a static friction of 0.68 at a period of 120 milliseconds. Person C had a higher static friction compared to Person A even though the former exhibited sweaty fingers.
4. Experimental Discussion
Figure 4 shows that the friction coefficient for the shark-skin surface was smaller in all ranges compared to the friction results for the silicon substrate. This is thought to be due to the smaller contact area caused by the fine grooves in the riblet structure. This means that frictional resistance can be reduced when the nanosheet is applied to a surface with microscopic irregularities, such as a shark skin, rather than to a smooth surface. The following discussion will examine each of these conditions.
A low friction coefficient value indicates that the force required for sliding to occur is less than the force required when the friction coefficient is high [
31]. This is due to the presence of riblets on the surface of the shark denticles, which possess drag reduction properties [
32,
33]. From this analysis, it was shown that the friction coefficient decreases when there is a presence of riblet structures on the surface. From the graph, the samples coated with a PDLLA nanosheet experienced a decrease in the coefficient of friction, which is shown by the flat surface, negative imprint, and positive imprint samples. In previous research on Graphene Oxide (GO) nanosheets, GO nanosheets also possessed friction reduction properties [
17,
34]. This shows that the addition of nanosheet coating on top of a surface can reduce the friction coefficient of the surface. Addition of PDLLA nanosheet on the surface of a sample enhanced the friction reduction for that surface. However, for the real shark skin, the sample experienced an increase in its coefficient of friction when PDLLA nanosheet was added. This is because the denticle structures on the shark skin were covered by the PDLLA nanosheet, thus disrupting the friction reduction properties of the shark skin. Since shark skin has very high friction reduction properties [
11,
31], coating the shark skin with PDLLA nanosheet is not necessary, as it will end up disrupting the friction reduction properties of the nanosheet. From
Figure 9a, the denticles are covered by a nanosheet, thus causing the denticles and the riblet microstructure to be unable to perform their functions effectively according to their usual applications.
The friction-reducing properties of shark skin, like its drag reduction capabilities, are attributed to the flow dynamics above the riblets, where the flow interacts primarily with the tips of the riblets. This design minimizes high-velocity flow in the valleys, enabling the shark to swim efficiently and rapidly [
35]. Similarly, in the case of the biomimetic samples, the contact between the sample surface and the fingerprint was reduced, as the interaction occured predominantly at the tips of the riblets. This resulted in enhanced friction-reducing characteristics, like those observed in shark skin. Consequently, the coefficient of friction was influenced by the direction of sliding. When the sliding direction aligned with the indentation direction of the riblets, the friction coefficient was observed to be lower. In contrast, if the sliding direction was opposite to the riblet profile, the friction coefficient increased. Additionally, the friction coefficient varied across different directions of sliding. Specifically, the transverse direction exhibited a higher friction coefficient than the caudal direction, but a lower coefficient compared to the rostral direction. Based on these observations, the order of friction coefficients, from lowest to highest, is as follows, caudal direction, lateral direction, and rostral direction, with the rostral direction yielding the highest friction coefficient. Comparable results have been reported concerning fluid resistance induced by fluid flow [
32]. These findings highlight the significant role of surface texture orientation in modulating the tribological behavior of biomimetic materials.
The reason why the static friction of Person C was greater than that of Person A, despite Person C having sweaty fingers, was likely due to the surface texture of Person C’s fingers, which feature transverse grooves. The fingerprint of Person C, with its transverse grooves, intersected with the sliding direction. This configuration makes it difficult for the sebum to flow easily along the grooves, causing the sebum to remain on the surface of the finger. As a result, a larger force was required to transition from static friction to kinetic friction [
36]. In contrast, the finger surface textures of Person A and Person B had grooves aligned with the direction of sliding, which allowed the sebum to flow more easily through the grooves. Among Persons A, B, and C, Person B exhibited the highest coefficient of friction. This can be attributed to Person B’s spiral-shaped fingerprints, which possess suction-like properties, leading to a higher coefficient of friction and stick–slip-like behavior in the force–displacement curve. Therefore, the coefficient of friction varied depending on the surface texture of skin. Additionally,
Table 3 shows the average friction coefficient. Even by looking at the average values, Person C has the lowest friction coefficient.
Based on these findings, it is believed that further friction reduction effects can be expected if a shark skin riblet structure can be incorporated into the surface of the nanosheet. Applying these to the substrates of wearable devices would enable the creation of displays that can be attached to the skin, and in terms of surface coating, friction reduction effects can be expected simply by adding nanosheets to existing products.
