Abstract
In order to clarify the effect of mixed lubrication methods on the oil flow and power loss of the gearbox, this study adopts a high-precision moving particle semi-implicit (MPS) method to investigate the lubrication of the gearbox under the joint influence of splash lubrication and oil injection lubrication. The accuracy of the numerical method to calculate the churning torque was verified by the constructed test rig. The effects of rotational speed, immersion depth, injection volume rate, and oil injection angle were analyzed and evaluated for lubrication. The results show that better lubrication can be achieved with relatively small churning torques by using a hybrid lubrication method. This provides some references for engineering applications of gearboxes.
1. Introduction
The rail transportation industry is dedicated to decreasing energy consumption and continuously enhancing the transmission efficiency of high-speed trains, in line with the current trend of energy conservation and emission reduction. In high-power industrial applications, the power loss of gearboxes is significant. When gears rotate at high speeds, friction occurs in the meshing area, generating a large amount of heat. Using only splash lubrication [1] may be difficult to meet good gear lubrication conditions and will result in phenomena such as pitting and galling of the tooth surfaces, which will affect the service life of the gears. Oil injection lubrication can provide a greater power capacity for gears [2,3,4]. It is becoming a progressively vital method for decreasing the temperature of high-velocity or heavy-duty gears. However, the use of oil-injected lubrication alone may result in inadequate lubrication in other critical areas. Therefore, it is important to study the lubrication performance and power loss of gearboxes under mixed lubrication methods.
The lubrication and efficiency of gearboxes has been studied by many scholars before and it is a subject of great interest. Concli and Gorla [5], Concli et al. [6], Mastrone and Concli [7] used open-source CFD software for different types of gears to study the power loss. Mastrone et al. [8] predicted the oil flow and churning torque of a gearbox using the CFD method and tested it using the particle image velocimetry (PIV) technique. The comparison revealed that the torque, oil distribution, and local flow detail characteristics were consistent with the tests. Su et al. [9] built a unique test rig to conduct tests of nanofluid participation in splash lubrication. And, the finite volume method (FVM) was used to track the oil volume fraction on the gear surface, which opened up a new direction for the research of nanofluid participation in splash lubrication. Wei et al. [10] simplified a gear as a disk, and established a unique low-temperature experimental system to study the flow field and churning torque of splash lubrication. Leprince et al. [11] set up a flow measurement test rig that can measure the oil flow around gears with splash lubrication. And, based on the test results, a series of equations were deduced using magnitude analysis. Neurouth et al. [12] developed a unique test rig to measure stirring losses and aeration effects in individual gears at different temperatures. A removable wall was inserted into the gearbox to observe the effects. It was found that inserting the biscuits at the right location could reduce the stirring loss. Liu et al. [13,14] studied the engineering application and theory of splash lubrication in gearboxes. Among them, Liu et al. [13] focused on the churning loss and lubrication performance of gearboxes with splash lubrication under vibration, and comprehensively evaluated the efficiency and lubrication using dimensionless numbers. Liu et al. [14] focused on the influence of the guide plate on gear lubrication and the contribution of the guide plate to the reduction in churning loss. In addition to installing guide plates outside the gears, jet lubrication is another way to reduce the churning torque. The use of new fluids or structural optimization is a common means of improving splash lubrication performance, while jet lubrication is also a way to reduce churning torque and improve lubrication and cooling performance.
Jet lubrication has begun to receive increasing attention from researchers due to the excellent cooling and lubricating effects on the engagement zone. Hu et al. [2] established a numerical model of jet lubrication for spur gears, investigated the process of oil injection into the meshing zone using the Lattice Boltzmann Method (LBM), and analyzed the lubrication performance under different working conditions. Keller et al. [15,16,17] investigated the impact of jets on gears with oil flow behavior via Smoothed Particle Hydrodynamics (SPH) and LBM. In the simulation process of injection lubrication using the CFD method, researchers often only consider the oil injection but neglect the oil return, which leads to incomplete oil circulation. Zhou et al. [18] constructed an experimental setup for jet lubrication, applied dye to the oil, and examined and studied the flow characteristics of the oil in high-speed helical gear jet lubrication. In addition, Mirza et al. [19] and Yilmaz et al. [20] investigated minimum quantity lubrication (MQL) and on-demand drip lubrication to significantly reduce the amount of oil supplied. MQL and on-demand dip lubrication methods use less oil supply compared to splash lubrication and injection lubrication, which results in lower churning losses, but also results in poorer heat dissipation, which in turn leads to high component temperatures. Researchers have focused more on the theoretical study of jet lubrication and oil distribution, but less on the engineering application of jet lubricated gearboxes with power loss.
The rapid development of numerical methods in CFD has led to a significant increase in the visibility of gearbox lubrication. A combination of numerical computation and experimentation has become the conventional approach. FVM is the traditional method for performing CFD analysis of gearboxes. Maccioni et al. [21] performed numerical simulations of splash lubrication on bearings using open-source software and explored the aeration phenomenon in conjunction with the PIV method. Concli and Mastrone [22,23] conducted a comprehensive analysis of the entire system, which encompassed shafts, gears, and bearings. The study employed a global meshing method with mesh clustering to examine all rolling bodies involved. Particle methods are considered along with the emerging numerical methods, including SPH [24], LBM [25], MPS [26], etc. However, while both LBM and SPH possess distinct traits and capabilities, LBM necessitates a significant amount of memory and exhibits low computational efficiency. On the other hand, SPH lacks the ability to accurately describe turbulence and is imprecise in calculating churning torque. MPS has convenient pre-processing and high computational efficiency and accuracy. Liu et al. [27] utilized the MPS method to investigate the splash lubrication of a rail vehicle gearbox. This approach allowed for the visualization of the intricate internal structure of the gearbox and facilitated the optimization of the gearbox’s design. Deng et al. [28,29] The lubrication of worm gearing was studied by combining numerical and experimental methods, and parameter optimization was carried out via the Taguchi method. Although some discussion is made on lubrication in gearboxes, quantitative lubrication indexes are usually missing in previous studies.
This work examines the lubrication and churning losses of gearboxes using numerical approaches, specifically focusing on mixed lubrication techniques. The MPS method with high efficiency and accuracy is used for calculation and verified by experimental comparison. The effects of parameters such as rotational speed, oil immersion depth, injection speed, and injection angle on the effectiveness of hybrid lubrication are investigated. Further, the hybrid lubrication effect was evaluated according to the described lubrication condition evaluation method. This research provides the prospect of hybrid lubrication in heavy-duty, high-speed gearboxes.
2. MPS Methodology
2.1. Governing Equations
The motion of incompressible fluids is determined by solving the continuity and Navier–Stokes equations [30].
2.2. Kernel Function Model
The governing equations of fluid motion in MPS can be solved on the basis of inter-particle interactions. And, the interaction of discrete particles is mainly determined by the kernel function, which is expressed as follows [30]:
where re is the radius of the area affected by each particle. rij is the distance vector between the ith particle and the jth particle, which is given by rij = |rj − ri|.
Further, calculate the particle number density (PND):
2.3. Particle Interaction Models
The way in which differential operators are transformed into particle expressions in MPS is called the particle model, whose gradient and Laplace models are as follows:
and the Laplace operator is
The particle number density (PND) is the total of the weighting functions in the supporting region, and as all particles have the same mass, it may be expressed as
2.4. Boundary Conditions
No-slip wall and free-surface boundaries are frequent MPS boundary conditions. Whether particle i is a free surface particle depends on the liquid surface particle density being smaller than n0:
where β is the free-surface recognition parameter, and the value of β in this numerical calculation is 0.97 [31].
2.5. Numerical Fitting of Churning Losses
In gearboxes, the direct contact of all rotating parts with the oil overcomes the fluid resistance to do work, which results in power loss. To calculate churning losses, it is necessary to quantify the process of churning losses in numerical terms.
For the splash lubrication gear box, churning loss is mainly composed of 3 parts: gear teeth directly promoting the main stream (tangential flow) energy loss; the flow continuity and volume suction effect of the formation of the secondary flow (radial flow) energy loss; and the energy loss due to squeezing and pumping during gear meshing [32,33]. In the case of oil-injected lubricated gearboxes, the power losses that occur when the gearbox is not under load can be divided into three categories: impulse power losses, squeezing power losses in the meshing zone, and wind resistance power losses [24]. At low rotational speeds, the power loss due to wind resistance is minimal and can be disregarded. During the simulation of the flow pattern in the gearbox, the fluid force is applied to the gear surface by interpolation. The fluid force monitored on the surface of the gear pair is extracted. The churning resistance moment is the result of multiplying the reaction force by the force arm [13].
In the numerical simulation of a gearbox, the power loss generated by the gears can be expressed as
where T is the churning resistance torque generated by the gear, and Ω is the rotation speed.
3. Model and Parameterization
3.1. Model
The main structure of the gearbox of the rolling stock studied in this paper includes the following: the case, gear pair, bearings, and other accessories. The schematic diagram of the structure is shown in Figure 1. The main purpose of this paper is to study the churning loss and lubrication performance of gears under mixed lubrication. The shaft end cover, shaft bushing, and output shaft have little impact on oil flow; hence, they are neglected. Table 1 lists the gear parameters.

Figure 1.
Exploded view of the studied gearbox. 1—output shaft; 2—wheel; 3—upper case; 4—wheel side seal ring; 5—output shaft wheel side bearing; 6—output shaft wheel side bearing retaining ring; 7—output shaft wheel side retaining ring side seal ring; 8—output shaft wheel side bushing; 9—input shaft pinion side end cover; 10—input shaft pinion side bushing; 11—input shaft pinion side bearing; 12—input shaft pinion side bearing retaining ring; 13—pinion side seal ring; 14—pinion; 15—lower case.

Table 1.
Parameters of gear pair.
This gearbox operates at high speeds where proper lubrication performance may be difficult to achieve with splash lubrication alone. The linear speed of the gears meets the conditions for the use of injection lubrication. To study the performance of oil injection lubrication under vibration conditions, injection holes are provided above the mesh zone. The oil injected from one of the holes comes from the lubricant at the bottom of the case and does not add to the total mass of oil in the case. When the injection volume rate is 0 L/min, the gearbox is splash lubricated only. In the initial stage of gearbox operation, the lubricant is distributed at the bottom of the case. The rotation of the gear pair churns the oil to splash into the mesh zone, bearings, and other critical areas to perform lubrication and cooling. Monitoring surfaces are set up at the oil inlet and oil return holes on both sides of the driven gear to record the amount of oil supplied to the bearings and the amount of oil returned.
3.2. Configuration of the Simulation
The gearbox is equipped with lubricating oil of grade 80 W–140 W. Density and kinematic viscosity are significant markers of the lubricating oil in this investigation; Table 2 displays the lubricating oil’s properties. Due to the effect of temperature on lubricant physical properties, the density and viscosity at different oil temperatures are calculated using the standard AGMA 925 A03 [34] expressions for the relevant physical parameters under 40 °C and 90 °C.
where T is the absolute temperature, K; A and B are constants that can be computed numerically; and ν40 and ν100 are the kinematic viscosities, cst, at oil temperatures of 40 °C and 100 °C, respectively.

Table 2.
Parameters of oil.
In the simulation process, choosing the right time step is essential. Smaller time steps may cause a very low computational efficiency, while larger time steps may cause computational dispersion. The time step is determined based on the Courant–Friedrichs–Lewy (CFL) condition.
where l0 is the particle diameter, umax is the maximum particle velocity, di is the diffusion coefficient, v is the fluid kinematic viscosity, vmax is its maximum value, and cmax is the Coulomb coefficient, which is 0.2 in this study. Δtin is the initial time step, is to ensure that Δt satisfies the CFL condition, and is to ensure the stability of the viscosity calculation.
The particle radius, which is an important solution parameter related to the computational speed and accuracy, is set to 1.0 mm in this study. The total number of particles in the computational domain is 447,210. The results of the particle independence validation are shown in Table 3. From Table 3, it can be seen that the difference in the stirring torque of the gears under different particle diameters is not higher than 6.1%. Therefore, the model with a particle diameter of 1.0 mm is selected for simulation. The fluid surface tension is set to 0.072 N/m, and the wall contact angle is set to 20°.

Table 3.
Results of particle independence verification.
In this numerical simulation, only the bottom oil sump supplies oil when splash lubrication is used. When mixed lubrication with splash lubrication and oil injection lubrication is used, in addition to the oil supply from the bottom pool, the nozzle on the top of the meshing area injects oil. At the same time, the oil return pump located at the bottom of the pool starts working to keep the total oil volume of the pool balanced.
3.3. Evaluation of Gearbox Lubrication
The lubrication effectiveness of the gearbox can be discussed in terms of the oil distribution on the bearing and gear surfaces as well as the oil distribution inside the box.
When the gearbox works, under the mixed lubrication mode, the internal fluid is mainly divided into the oil in the pool, the oil involved in bearing lubrication, and the oil in the approximately uniformly distributed oil–air mixture inside the box. The total volume of the fluid domain inside the case is denoted as V, and the initial oil volume is denoted as Voil. The area between the bottom surface of the box and the initial oil level is the bottom area of the box. The lubricant oil content in each grid below the initial oil level is obtained by a customized function, and the oil volume in the tank is obtained by integrating over the bottom region of the case.
The net oil inlet mass of the bearing region at moment t = I is computed.
where denotes the bearing mass flow rate at the moment of time t = I, the oil return mass of the bearing region is . The average oil volume fraction is αi.
The oil concentration in the bearing regions is
The bearing region is assumed to have a fluid composition consisting of 40% volume of continuous fluids [35].
Therefore, the amount of lubricating oil in the bearing area is
The instantaneous lubrication effectiveness of the bearing is
The effective oil concentration, written as , refers to the volume proportion of oil in the oil mixture within the case, assuming a nearly uniform distribution and without taking into account the local accumulation of lubricating oil. The portion of the oil volume referred to as the effective oil volume is written as . The calculation of the effective oil concentration is as follows:
4. Results and Discussion
To investigate the impact of rotational speed, oil immersion depth, oil jet volume rate, and injection angle on lubrication and churning loss in a mobile gearbox operating under mixed lubrication, various experimental conditions were created. These conditions involved four different rotational speeds, three different oil immersion depths, four oil spray volume rates, and four oil spray angles.
4.1. Influence of Rotational Speed
The flow field of the splash-lubricated gearbox at different rotational speeds is shown in Figure 2. As the rotational speed increases, the flow in the flow channel and meshing zone supplying oil to the bearing increases significantly, and the oil distribution in the case becomes more uniform. However, when the rotational speed reaches 3000 rpm, the oil in the bottom pool moves to the right and no longer covers the entire bottom of the case. At this point, splash lubrication alone is no longer sufficient to provide sufficient oil.
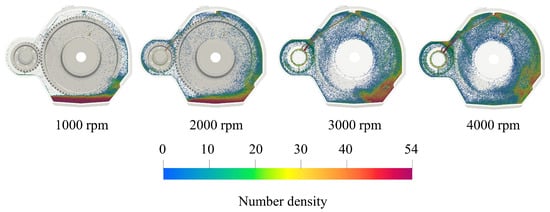
Figure 2.
The splash lubrication flow field of the gearbox with different speeds.
Figure 3a illustrates the lubrication efficiency of the bearing, the concentration of effective lubricant, and the flow rate of oil in the engagement zone during the stabilization of the flow field. These values are averaged with respect to the change in rotational speed. From the picture, it is evident that when the rotational speed increases, the lubrication effectiveness of the bearing, the concentration of effective lubricant, and the rate of oil flow in the meshing zone all rise in a roughly linear manner. The reason for this is because the higher rotational speed results in a greater agitation of the oil by the gear. The flow rate into the bearing area from the flow channel at the top of the case increases, and the bearing lubrication efficiency increases; the amount of oil delivered to the meshing area also increases; the disorder of the oil inside the case increases, and the amount of oil distributed approximately uniformly inside the case in the form of oil–air mixtures increases, and the effective lubricant concentration increases. When the rotational speed is 1000 rpm and 4000 rpm, the effective lubricant concentration is 0.74% and 6.02%, respectively. The significance of the rotating speed in enhancing the lubrication index is evident.
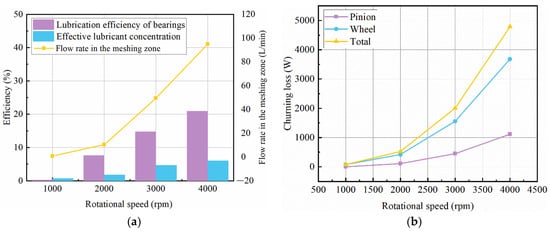
Figure 3.
Lubrication and churning loss results at different speeds. (a) Lubrication index; (b) churning loss.
The average values of churning losses at different speeds are given in Figure 3b. From Figure 3b, it is evident that the churning loss escalates as the rotational speed increases in the case of splash lubrication of the gearbox. At 1000 rpm, the percentage of pinion loss is only 1.8%. At 2000 rpm, the pinion churning loss percentage increases abruptly to 20.5%. As the speed increases further, the pinion churning loss percentage increases slowly and saturates. At 4000 rpm, the pinion churning loss is 23.2%. This is due to the fact that at low speeds the pinion gear is exposed to less oil and is therefore subjected to less resistance. As the speed increases, the oil resistance to the pinion gear increases. The churning losses are 78.0 W and 4788.8 W when the speeds are 1000 rpm and 4000 rpm, respectively. It is evident that the increase in speed will lead to intense turbulence in the gearbox, causing a significant increase in no-load losses.
Figure 4 shows the pattern of change in the mean value of time-averaged coverage of gear and bearing rollers at different speeds. The coverage shows the probability of contact between the surface of the gearbox and the oil versus the area of oil adherence. The gear coverage had a significant rise of 264%, while the bearing roller coverage saw an even greater increase of 355% as the rotational speed climbed from 1000 rpm to 4000 rpm. The oil coverage on the gear and bearing surfaces experienced a substantial increase in area.
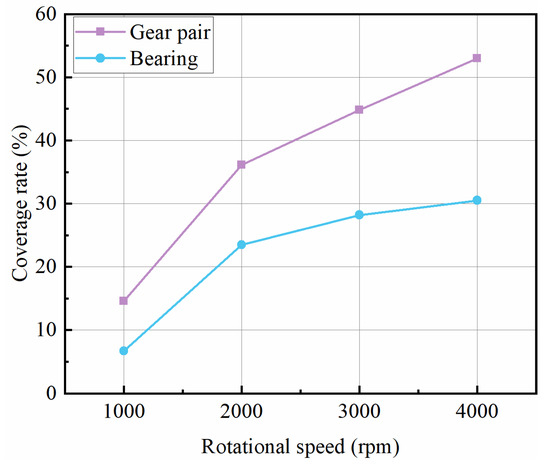
Figure 4.
Coverage rate at different rotational speeds.
4.2. Influence of Immersion Depth
Figure 5a shows the variation rule of the average values of the three lubrication indicators with the immersion depth after the flow field is stabilized. From the picture, it is evident that as the depth of oil immersion increases, the oil flow rate in the engagement region shows a nearly linear increase. This leads to an improvement in the lubrication efficiency of the bearing and an increase in the concentration of effective lubricant. When the immersion depth is 1.0 h and 3.0 h, the effective lubricant concentration is 1.77% and 4.09%, respectively. It can be seen that the improvement of the lubrication index by oil quantity is obvious. When the immersion depth is 1.0 h, the oil distribution inside the gearbox is more uniform, and there is no lack of lubricant in the key parts.
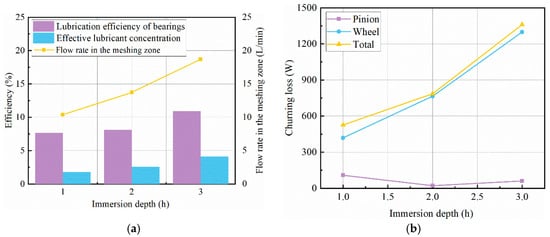
Figure 5.
Lubrication and churning loss results at different immersion depth. (a) Lubrication index; (b) churning loss.
The average values of churning losses for different immersion depths are given in Figure 5b. Figure 5b shows that the total churning loss increases linearly with increase in oil immersion depth in case of splash lubrication of gearbox. From the figure, it can be found that the churning loss of the pinion does not change significantly with the increase in immersion depth and the percentage decreases.
Figure 6 shows the variation patterns of the mean values of the time-averaged coverage of gears and bearing rollers at different immersion depths. During the process of increasing the immersion depth from 1.0 h to 3.0 h, the coverage of gears increased by 32.5% and the coverage of bearing rollers increased by 24.0%. The area covered by oil on the gear and bearing surfaces increased.
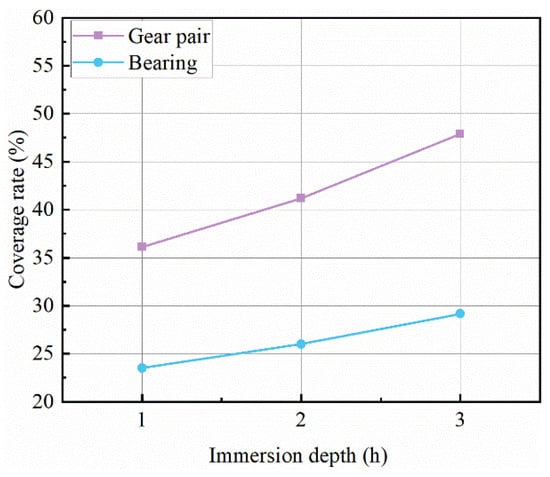
Figure 6.
Coverage rate at different immersion depth.
In general, the effect of oil immersion depth on the splash lubrication flow field is linear and easily predictable.
4.3. Influence of Injection Speed
The hybrid lubrication simulation is run at 2000 rpm active gear speed, 1.0 h oil immersion depth, 5 L/min, 10 L/min, 15 L/min oil injection volume rate, and 10° oil injection angle. The numerical simulation results for an oil injection volume rate of 5 L/min are shown in Figure 7. On one hand, Figure 6 shows that the splash lubrication flow field fills the entire fluid domain, and there is enough oil at critical locations such as the gear circumference, bearing area, and meshing area. On the other hand, the oil injected from the injection holes directly enters the meshing zone to lubricate and cool the position. After the pumping action in the engagement zone, a part of the oil flows to the bottom of the case, which will participate in the splash lubrication together with the oil accumulated at the bottom of the pool, while the other part is distributed in the cavity of the case on the pinion side.
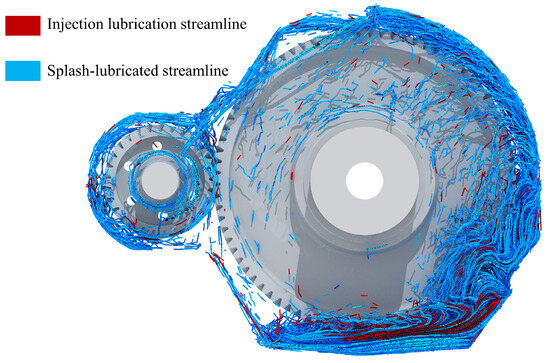
Figure 7.
Diagram of flow streamline distribution for hybrid lubrication.
The splash lubrication flow field is ignored, and only the change rule of the oil injection flow field under different oil injection volume rates is tracked, as shown in Figure 8. As the oil injection volume rate increases, the oil distribution below and to the right of the gear becomes uniform. The sprayed oil acts directly on the meshing area, and the oil around the pinion increases with the increase in the spray volume rate.
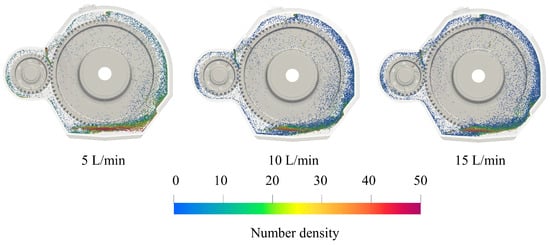
Figure 8.
Flow field of the injection lubricated gearbox at different injection volume rates.
Figure 9a,b show the variation rule of the average values of the three lubrication indexes and churning loss with the oil injection volume rate after the flow field is stabilized. As can be seen from the figures, the average values of the three lubrication indicators and churning loss increase with the increase in the injection volume rate.
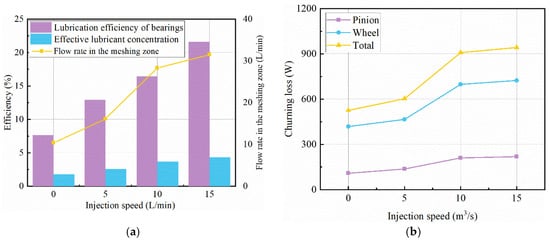
Figure 9.
Lubrication and churning loss results at different injection speeds. (a) Lubrication index; (b) churning loss.
A comparison is made with Figure 3. The lubrication efficiency of the bearings at an injection volume rate of 15 L/min is similar to that at 4000 rpm, while the effective lubricant concentration and the flow rate in the engagement zone are lower than the corresponding values at 4000 rpm. There is also a huge difference between the churning loss of 943.1 W at an injection volume rate of 15 L/min and 4788.8 W at a speed of 4000 rpm.
A comparison is made with Figure 5. The effective lubricant concentration at an injection volume rate of 15 L/min is similar to that at an immersion depth of 3.0 h, while the effective lubricant concentration and the flow rate in the engagement zone are higher than the corresponding values at an immersion depth of 3.0 h. The effective lubricant concentration and the flow rate in the engagement zone are higher than the corresponding values at an immersion depth of 3.0 h. The churning loss of 943.1 W at an injection volume rate of 15 L/min and 1358.9 W at an immersion depth of 3.0 h also differed significantly.
It can be seen that hybrid lubrication with simultaneous injection and splash lubrication improves lubrication performance in a relatively gentle and efficient manner compared to single splash lubrication. Increasing the speed allows more oil to splash and improves the lubrication performance, but it also results in significant churning losses, generating a lot of heat and causing a temperature rise. Continuous high speed operation may affect gear life. Increasing the immersion depth and increasing the injection lubrication both essentially provide more oil to the gears. However, unlike direct lubrication of the mesh zone by the oil from the oil injection, increasing the lubrication performance by increasing the oil immersion depth is clearly less efficient and also results in more churning losses.
Figure 10 shows the variation pattern of the mean values of time-averaged coverage of gears and bearing rollers at different injection volume rates using hybrid lubrication. In the process of increasing the oil injection volume rate from 0 L/min to 15 L/min, the coverage of gears increases by 77.1% and the coverage of bearing rollers increases by 103.9%. The enhancement of the area covered by oil for gears and bearings by the hybrid lubrication method is obvious.
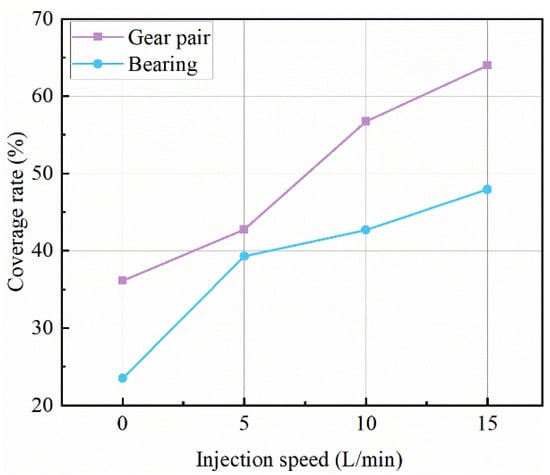
Figure 10.
Coverage rate at different injection speed.
4.4. Influence of Injection Angle
The oil injection flow field under different injection angles is shown in Figure 11. It can be seen that when the injection angle is 0°, the oil distribution in the case is the most uniform. And, the oil injection angle is 10 °, 20 °, 30 ° when the oil injection lubrication flow field is similar, only in the local difference.
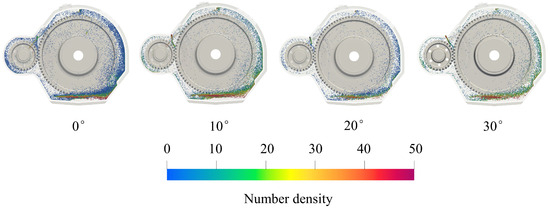
Figure 11.
Flow field of jet lubricated gearbox under different spray angles.
Figure 12a shows the variation rule of the mean values of the three lubrication indicators with the injection angle after the flow field is stabilized. Wang et al. [36] proposed a method to incline the oil nozzle toward the pinion can to increase the flow rate in the engagement zone. This is also proved by the simulation results as shown in Figure 9a. The flow rate in the engagement zone can be improved by increasing the incline angle appropriately. And, the change in the spray angle has a limited effect on the real-time lubrication efficiency of the bearing and the effective lubricant concentration. Meanwhile, Figure 12b shows that a certain tilt angle can obtain a larger impact depth, which also leads to a larger churning loss.
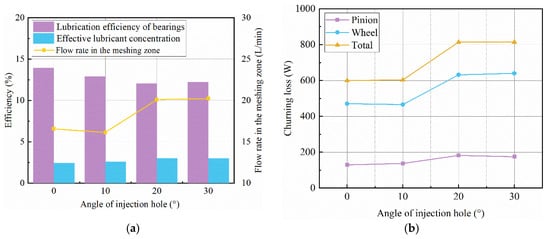
Figure 12.
Lubrication and churning loss results at different injection angles. (a) Lubrication index; (b) churning loss.
Figure 13 shows the variation patterns of the mean values of the hourly coverage of gears and bearing rollers at different injection angles. There is no significant change in the coverage of the gears and a slight decrease in the coverage of the bearing rollers when the oil injection angle is increased from 0° to 30°.
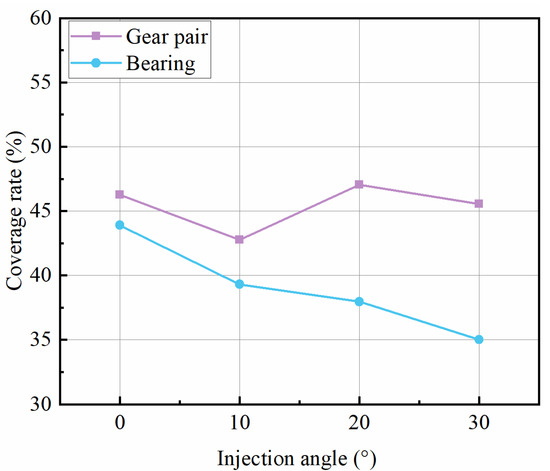
Figure 13.
Coverage rate at different injection angle.
4.5. Comprehensive Lubrication Evaluation
A comprehensive evaluation of efficiency and lubrication can be made in terms of the following: lubrication effectiveness in critical areas, sealing performance, and power loss. The lubrication performance and efficiency of bearing lubrication are directly proportional to the oil flow rate in the engagement zone. On the other hand, the sealing performance is inversely proportional to the effective oil concentration, and efficiency is inversely proportional to churning loss. The numerical simulation results were linearly scaled to provide dimensionless values for assessing the lubrication performance. The dimensionless numbers range from 0 to 1, with a value of 1 indicating optimal performance of the gearbox and a value of 0 indicating the poorest performance. The lubricating indicators that exhibit a positive correlation with the overall evaluation are determined using Equation (19), whereas those that show a negative correlation are determined using Equation (20):
The integrated lubrication performance for each condition is obtained by summing the four dimensionless numbers for each condition, as shown in Figure 14. From Figure 14a–d, at a speed of 2000 rpm, with a volume rate of oil injection of 5 L/min and an angle of oil injection of 0°, the sum of six dimensionless lubrication evaluation indices reaches its maximum value of 2.17, 2.15, and 3.11, respectively. Consequently, the gearbox exhibits the best comprehensive lubrication performance. For the mixed lubrication mode, the sprayed oil improves the lubrication performance on the one hand, but on the other hand, it leads to the deterioration of transmission efficiency and sealing performance.
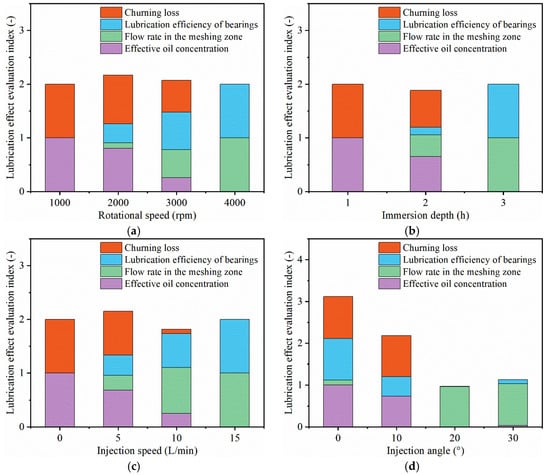
Figure 14.
Comprehensive evaluation. (a) Different rotational speed; (b) different depth of immersion; (c) different injection speed; (d) different injection angle.
The operation parameters on the gear box lubrication indicators have an important impact on the influence of the coefficient Ye calculated as Equation (21); the results are shown in Figure 15. From the figure, it can be seen that the degree of influence on the lubrication indicators are arranged in descending order. The effective lubricant concentration: rotation speed > oil injection volume rate > oil immersion depth > oil injection angle; engagement zone oil flow rate: rotation speed > oil injection volume rate > oil immersion depth > oil injection angle; bearing lubrication efficiency: rotation speed > oil injection volume rate > oil immersion depth > oil injection angle; churning loss: rotation speed > oil immersion depth > oil injection depth > oil injection angle; loss of churning: rotation speed > oil immersion depth > oil injection volume rate > oil injection depth > oil injection angle. Churning loss: rotation speed > oil injection volume rate > oil injection angle.

Figure 15.
Quantitative analysis of the impacts of various operational parameters.
From the presented discussion, it is evident that rotational speed is the most significant factor influencing the lubrication performance and regularity loss of the gearbox. An elevated rotational speed markedly enhances the lubrication performance, yet concurrently results in a considerable power loss. This, in turn, gives rise to an increase in heat generation, which may ultimately lead to a reduction in the gearbox’s operational reliability and mechanical performance.
The hybrid lubrication method, which employs a combination of oil injection lubrication and splash lubrication, represents a potential solution to this contradiction. The implementation of splash lubrication in conjunction with oil injection above the meshing zone results in notable lubrication performance at lower speeds while simultaneously minimizing power loss. Hybrid lubrication represents an effective lubrication method for gearboxes operating at high speeds and under heavy loads.
5. Experimental Verification
Figure 16 displays the mechanical arrangement of the FZG no-load power loss test apparatus.
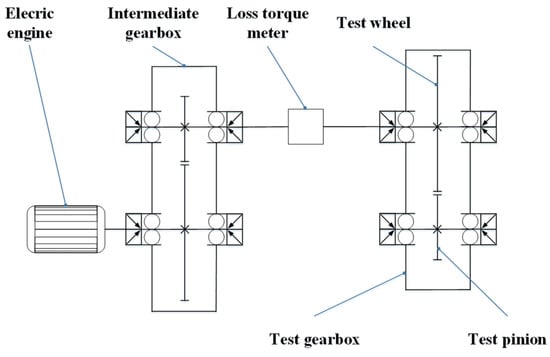
Figure 16.
Mechanical design of FZG no-load power loss test equipment.
The accuracy of the numerical method for calculating the oil distribution was verified by the flow field test with guide plate gears conducted by Hildebrand et al. [37], and the accuracy of calculating the power loss was verified by comparing the churning moment results obtained from the FZG test rig test conducted by Liu et al. [38]. The mechanical layout of the FZG no-load power loss test rig used for the two tests is shown in Figure 16.
The test gearbox has a width of 260 mm, a height of 171 mm, and a depth of 56 mm. The speed of the electric engine is transmitted to the test gearbox through the intermediate gearbox and pinion shaft. The test gears are of the FZG type C-PT, comprising surface-carburized steel (16MnCr5E). The dimensions of the pinion and large gears are presented in Table 4 for reference.

Table 4.
Test gear size parameters.
The lubricant used for the test was FVA3 mineral oil with the parameters shown in Table 5.

Table 5.
Physical parameters of FVA3.
To maintain the optimal temperature of the oil sump, a temperature sensor was integrated into the sump to continuously monitor and regulate the temperature within a range of ±2 K. To enhance the visibility of the display, a dye was introduced to impart a red hue to the oil. The test was conducted using a high-speed camera to document the oil flow dynamics, as illustrated in Figure 14.
The velocity of the electric motor is sent to the test gearbox through the intermediate gearbox and the pinion shaft. The no-load losses caused by the test gearbox are measured using a torque meter attached to the pinion shaft. The no-load losses consist of losses resulting from gear friction, as well as losses caused by four bearings and two seals. Needle roller bearings were chosen to decrease the amount of energy lost in the bearings. The torque meter has a measurement range of 10 Nm and a measurement error that does not exceed ±0.1%. To maintain the temperature of the oil sump within the specified range, a temperature sensor was placed inside the sump to monitor and manage it within a tolerance of ±2 K. A high-speed camera was used to monitor the temperature of the oil sump. Furthermore, a high-speed camera was employed to record the oil flow dynamics. To enhance the display contrast, a dye is introduced to give the oil a red or green appearance.
Figure 17 shows the simulation [14] and experiment [37] results of the flow field. When the velocity of the gears, vt, reaches 2.1 m/s, the oil that is agitated by the gears comes together in a diagonal position above the area where they mesh. The intersection point of the simulation results is consistent with the overall flow field and the experimental results. vt = 7.0 m/s, and the flow disorder in the inner side of the guide plate increases. In addition, a small amount of continuous-like oil is hollowed out to the outside of the guide plate. At a speed of 10.0 m/s, the volume of oil above the engagement zone increases, making the trajectory of oil dropping back to the bottom down the shaft more apparent and causing an increase in the amount of oil escaping to the oil reservoir region. Despite the augmentation in rotational velocity, the fluid level in the oil reservoir area consistently remains tranquil. Therefore, the numerical method can simulate the oil flow better.
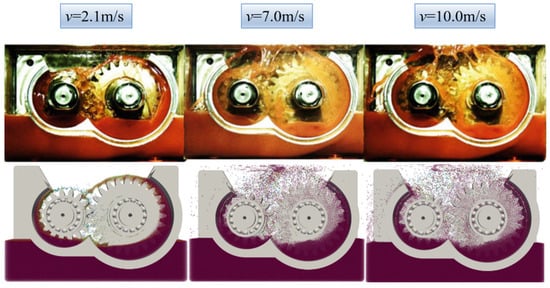
Figure 17.
Comparative analysis of oil flow dispersion in experimental and simulation scenarios.
Further, the churning losses are validated. The no-load losses resulting from the test gearbox were quantified through the use of a torque meter on the pinion shaft, as detailed by Liu et al. [38]. The no-load losses included the losses associated with the gear system, as well as those attributable to the bearings and seals. The torque meter has a measurement range of 10 Nm, and the associated measurement error is less than ±0.1%.
In order to measure the churning torque of the gears, two different tests were performed. The first run was performed with immersion oil lubrication, while the second run was performed with the gears rotating in an empty tank without oil. The churning torque of the gear was determined by subtracting the results of the second test from the results of the first test, as shown in Figure 18. Figure 18 shows the validation of the numerical method for churning power at different speeds. Figure 15 exhibits a maximum error of 8.44% and a minimum error of 3.48%, with the values and trends displaying significant proximity. The aforementioned findings demonstrate that the numerical analytical technique employed in this study exhibits excellent suitability and precision in computing both oil distribution and power loss.
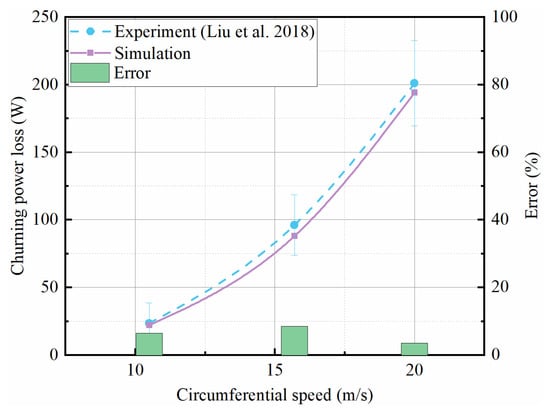
Figure 18.
Experiment and simulate churning loss at different circumferential speeds [38].
6. Conclusions
This study examines the effectiveness and lubricating capabilities of gearboxes when both splash lubrication and oil injection lubrication are used simultaneously. The accuracy of this churning torque calculation is verified by the experiment, and the following main conclusions are drawn.
- (1)
- Mixed lubrication improves lubrication performance more consistently and efficiently than single splash lubrication. Increasing the speed allows more oil to be splashed into the critical areas of the gearbox, but the resulting churning losses are also significant.
- (2)
- The oil stirring moment, bearing oil supply, and bearing lubrication efficiency all rise as the gear speed, oil immersion depth, and oil injection volume rate increase. Increasing the amplitude results in an increase in the peak value of each curve. As the frequency increases, the number of peaks on each curve also increases. However, there is no discernible pattern regarding the size of the peaks.
- (3)
- The lubrication performance and efficiency of the gearboxes were evaluated comprehensively by four lubrication indexes. In this study, the rotational speed has been identified as the factor with the most significant impact on the lubrication condition and efficiency of the gearbox. The optimal lubrication condition was observed at a rotational speed of 2000 rpm, an injection volume rate of 5 L/min, and an injection angle of 0°.
This study demonstrates the promising application of hybrid lubrication in heavy-duty, high-speed gearboxes. In the subsequent study, the flow pattern of active lubrication and hybrid lubrication of gears and the churning loss of gears at low temperatures will be investigated based on the low-temperature test rig at the State Key Laboratory of Vehicle Transmission, Beijing Institute of Technology.
Author Contributions
L.W.: conceptualization, methodology, investigation, data curation, writing—original draft preparation. Y.L.: software, data curation, formal analysis, investigation, visualization, writing—original draft preparation. K.Z.: supervision. S.S.: conceptualization, methodology. Y.Y.: methodology, funding acquisition. K.H.: software, validation. All authors have read and agreed to the published version of the manuscript.
Funding
This research was funded by the National Natural Science Foundation of China [grant number 52372403 and U2268211] and the Natural Science Foundation of Sichuan Province [grant Numbers 2022NSFSC0034 and 2022NSFSC1901].
Data Availability Statement
Data are contained within the article.
Conflicts of Interest
Author Kuangzhou He was employed by the company Suzhou shonCloud Engineering Software Co., Ltd. The remaining authors declare that the research was conducted in the absence of any commercial or financial relationships that could be construed as a potential conflict of interest.
References
- Zhu, X.; Dai, Y. Development of an analytical model to predict the churning power losses of an orthogonal face gear. Eng. Sci. Technol. Int. J. 2023, 41, 101383. [Google Scholar] [CrossRef]
- Hu, X.; Li, P.; Quan, C.; Wang, J. CFD Investigation on Oil Injection Lubrication of Meshing Spur Gears via Lattice Boltzmann Method. Lubricants 2022, 10, 184. [Google Scholar] [CrossRef]
- Massini, D.; Fondelli, T.; Facchini, B.; Tarchi, L.; Leonardi, F. High Speed Visualizations of Oil Jet Lubrication for Aero-Engine Gearboxes. Energy Procedia 2016, 101, 1248–1255. [Google Scholar] [CrossRef]
- Dai, Y.; Liang, C.; Chen, X.; Zhu, X. Numerical Analysis for Wetting Behaviors of an Oil Jet Lubricated Spur Gear. Lubricants 2022, 10, 17. [Google Scholar] [CrossRef]
- Concli, F.; Gorla, C. Numerical modeling of the churning power losses in planetary gearboxes: An innovative partitioning-based meshing methodology for the application of a computational effort reduction strategy to complex gearbox configurations. Lubr. Sci. 2017, 29, 455–474. [Google Scholar] [CrossRef]
- Concli, F.; Maccioni, L.; Gorla, C. Lubrication of gearboxes: CFD analysis of a cycloidal gear set. WIT Trans. Eng. Sci. 2019, 123, 101–112. [Google Scholar]
- Mastrone, M.N.; Concli, F. CFD simulation of grease lubrication: Analysis of the power losses and lubricant flows inside a back-to-back test rig gearbox. J. Non-Newton. Fluid Mech. 2021, 297, 104652. [Google Scholar] [CrossRef]
- Mastrone, M.N.; Erwin, A.; Valery, C.; Concli, F. Oil distribution and churning losses of gearboxes: Experimental and numerical analysis. Tribol. Int. 2020, 151, 106496. [Google Scholar] [CrossRef]
- Su, J.; Li, S.; Hu, B.; Yin, L.; Zhou, C.; Wang, H.; Hou, S. Innovative Insights into Nanofluid-Enhanced Gear Lubrication: Computational and Experimental Analysis of Churn Mechanisms. Tribol. Int. 2024, 199, 109949. [Google Scholar] [CrossRef]
- Wei, C.; Wu, W.; Hou, X.; Nelias, D.; Yuan, S. Research on flow pattern of low temperature lubrication flow field of rotating disk based on MPS method. Tribol. Int. 2023, 180, 108221. [Google Scholar] [CrossRef]
- Leprince, G.; Changenet, C.; Ville, F.; Velex, P. Investigations on oil flow rates projected on the casing walls by splashed lubricated gears. Adv. Tribol. 2012, 2012, 365414. [Google Scholar] [CrossRef]
- Neurouth, A.; Changenet, C.; Ville, F.; Octrue, M.; Tinguy, E. Experimental investigations to use splash lubrication for high-speed gears. J. Tribol. 2017, 139, 061104. [Google Scholar] [CrossRef]
- Liu, Y.; Zhang, K.; Shao, S.; Xiang, H.; Ye, Z. Influence of vibration on the lubrication effect of a splash-lubricated gearbox. J. Zhejiang J. Zhejiang Univ. Sci. A 2024, 25, 324–339. [Google Scholar] [CrossRef]
- Liu, Y.; Shao, S.; Zhang, K.; Yao, Y.; Wang, X. Investigation of characteristics of splash lubrication and churning power loss in gearboxes with a guide plate. Tribol. Int. 2024, 198, 109875. [Google Scholar] [CrossRef]
- Keller, M.C.; Braun, S.; Wieth, L.; Chaussonnet, G.; Dauch, T.F.; Koch, R.; Schwitzke, C.; Bauer, H.J. Smoothed particle hydrodynamics simulation of oil-jet gear interaction. In Turbo Expo: Power for Land, Sea, and Air; American Society of Mechanical Engineers: New York, NY, USA, 2017; Volume 50794, p. V02BT41A019. [Google Scholar]
- Keller, M.C.; Braun, S.; Wieth, L.; Chaussonnet, G.; Dauch, T.F.; Koch, R.; Höfler, C.; Bauer, H.J. Numerical modeling of oil-jet lubrication for spur gears using smoothed particle hydrodynamics. In Proceedings of the 11th International SPHERIC Workshop, Munich, Germany, 13–16 June 2016; pp. 14–16. [Google Scholar]
- Keller, M.C.; Kromer, C.; Cordes, L.; Schwitzke, C.; Bauer, H.J. CFD study of oil-jet gear interaction flow phenomena in spur gears. Aeronaut. J. 2020, 124, 1301–1317. [Google Scholar] [CrossRef]
- Zhou, C.; Jiang, X.; Su, J.; Liu, Y.; Hou, S. Injection lubrication for high-speed helical gears using the overset mesh method and experimental verification. Tribol. Int. 2022, 173, 107642. [Google Scholar] [CrossRef]
- Mirza, M.; Yilmaz, M.; Thieme, E.; Lohner, T.; Venner, C.H. Drop-on-demand lubrication of gears: A feasibility study. Front. Mech. Eng. 2021, 7, 746407. [Google Scholar] [CrossRef]
- Yilmaz, M.; Önüt, A.; Lohner, T.; Stahl, K. Gear and bearing power losses: From dip to minimum quantity lubrication. Ind. Lubr. Tribol. 2022, 74, 985–994. [Google Scholar] [CrossRef]
- Maccioni, L.; Chernoray, V.; Mastrone, M.N.; Concli, F. Study of the impact of aeration on the lubricant behavior in a tapered roller bearing: Innovative numerical modelling and validation via particle image velocimetry. Tribol. Int. 2022, 165, 107301. [Google Scholar] [CrossRef]
- Concli, F.; Mastrone, M.N. Advanced lubrication simulations of an entire test rig: Optimization of the nozzle orientation to maximize the lubrication capability. Lubricants 2023, 11, 300. [Google Scholar] [CrossRef]
- Concli, F.; Mastrone, M.N. Latest advancements in the lubricant simulations of geared systems: A technology ready for industrial applications. Forsch Ingenieurwes 2023, 87, 1181–1191. [Google Scholar] [CrossRef]
- Liu, H.; Arfaoui, G.; Stanic, M.; Montigny, L.; Jurkschat, T.; Lohner, T.; Stahl, K. Numerical modelling of oil distribution and churning gear power losses of gearboxes by smoothed particle hydrodynamics. Proc. Inst. Mech. Eng. Part J J. Eng. Tribol. 2019, 233, 74–86. [Google Scholar] [CrossRef]
- Li, Q.; Xu, P.; Li, L.; Xu, W.; Tan, D. Investigation on the lubrication heat transfer mechanism of the multilevel gearbox by the Lattice Boltzmann Method. Processes 2024, 12, 381. [Google Scholar] [CrossRef]
- Shibata, K.; Masaie, I.; Kondo, M.; Murotani, K.; Koshizuka, S. Improved pressure calculation for the moving particle semi-implicit method. Comput. Part. Mech. 2015, 2, 91–108. [Google Scholar] [CrossRef]
- Liu, H.; Wei, T.; Zhou, J.; Xie, C. Research on characteristics of splash lubrication and power losses of reducer based on MPS method. Lubr. Sci. 2023, 35, 596–615. [Google Scholar] [CrossRef]
- Deng, X.; Wang, S.; Youssef, H.; Qian, L.; Liu, Y. A combined experimental and computational study of lubrication mechanism of high precision reducer adopting a worm gear drive with complicated space surface contact. Tribol. Int. 2020, 146, 106261. [Google Scholar] [CrossRef]
- Deng, X.; Wang, S.; Youssef, H.; Qian, L.; Liu, Y. Study on the influence of key design parameters on lubrication characteristics of a novel gear system applying the Taguchi method. Struct. Multidiscip. Optim. 2020, 62, 2833–2847. [Google Scholar] [CrossRef]
- Koshizuka, S.; Oka, Y. Moving-particle semi-implicit method for fragmentation of incompressible fluid. Nucl. Sci. Eng. 1996, 123, 421–434. [Google Scholar]
- Xie, C.; Liu, H.; Jia, R.; Li, Q. Study on splash lubrication characteristics of secondary gearbox based on MPS method. China Mech. Eng. 2021, 32, 1827–1835+1843. [Google Scholar]
- Wang, B.; Ning, B.; Chen, X.; Lv, H. Research progress in churning losses of gear transmission. J. Mech. Eng. 2020, 56, 1–20. [Google Scholar]
- Guo, D.; Chen, F.; Liu, J. Theoretical and experimental study of churning resistance torque of high-speed gear pair. J. Mech. J. Mech. Eng. 2021, 57, 49–60. [Google Scholar]
- AGMA 925 A03; Effect of Lubrication on Gear Surface Distress. AGMA (American Gear Anufacturers Association): Alexandria, VA, USA, 2003.
- Wang, J. Analysis and Application of Oil Bath Lubrication Based on CFD. Master’s Thesis, Chongqing University, Chongqing, China, 2015. [Google Scholar]
- Wang, Y.; Niu, W.; Wei, S.; Song, G. Influence of Spin Flow on Lubricating Oil Jet-Design Method of Oil Spray Parameters to High Speed Spur Gears. Tribol. Int. 2015, 92, 290–300. [Google Scholar] [CrossRef]
- Hildebrand, L.; Dangl, F.; Sedlmair, M.; Thomas, L.; Karsten, S. CFD analysis on the oil flow of a gear stage with guide plate. Forsch Ingenieurwes 2022, 86, 395–408. [Google Scholar] [CrossRef]
- Liu, H.; Jurkschat, T.; Lohner, T.; Stahl, K. Detailed investigations on the oil flow in dip-lubricated gearboxes by the finite volume CFD method. Lubricants 2018, 6, 47. [Google Scholar] [CrossRef]
Disclaimer/Publisher’s Note: The statements, opinions and data contained in all publications are solely those of the individual author(s) and contributor(s) and not of MDPI and/or the editor(s). MDPI and/or the editor(s) disclaim responsibility for any injury to people or property resulting from any ideas, methods, instructions or products referred to in the content. |
© 2024 by the authors. Licensee MDPI, Basel, Switzerland. This article is an open access article distributed under the terms and conditions of the Creative Commons Attribution (CC BY) license (https://creativecommons.org/licenses/by/4.0/).