1. Introduction
Flattening refers to the process where the highest asperities on the surfaces are gradually flattened or leveled out due to the applied load. Flattening leads to an increase in the contact area between the surfaces, which can increase friction due to energy dissipation during deformation processes. Understanding the interplay between flattening and plastic deformation is essential for predicting and controlling friction and wear behavior in sliding contacts, rolling contacts, and abrasive wear processes. The object of this work is to analyze the interaction between the roughness parameters and the deformed microstructure of surface layers. Some models of the flattening and plasticity of surface layers will be analyzed.
A simple model of roughness surfaces represents a periodic profile projected on one of the contacting surfaces [
1,
2]. A smooth cylinder is considered to be a smooth surface on a regular wavy surface whose radius and wavelength are specified [
2]. The plastic strain at the contact interface can be represented by two components: a compressive and a unidirectional shear component [
3]. The contact pressure is increased by increasing the wavelength or decreasing the radius of the tip. Using Nowell and Hill’s model [
2], Kapoor et al. showed that the normalized peak pressure (
pmax/
p0) depends strongly on the roughness parameters [
4]. High contact pressures increase local stresses, resulting in higher roughness parameters and a shorter service life. Finally, it was noted that the calculated normalized peak pressure did not account for plasticity.
Flattening, as well as the deformation and damage development under contact interaction, is a scale-dependent parameter. Scale effects from macro to nanoscales under dry friction were considered by Bhushan and Nosonovsky [
5]. A definite relation between hardness parameters and the real area of contact was revealed. Harder surface layers result in smaller real contact areas. Moreover, it was demonstrated that the average shear strength is mainly determined by dislocation-assisted sliding and increases with decreasing geometrical scale. Scale-dependent friction results are dependent on the real contact area and shear strength of the surface layers under elastic or plastic contact conditions. At present, the precise definition and quantification of contact and friction lack the characteristic length parameters, which are responsible for scale effects. The roughness of asperities and the deformation parameters of friction surfaces are scale-dependent. In relation to this theory, the fractal model of asperity surfaces developed by Majumdar and Bhushan [
6] does not contain length parameters and is based on the scale-invariant principle. Existing models of contact interaction during inelastic deformation are largely based on the continuum theory (e.g., Persson [
7,
8], Gong and Komvopoulos [
9], Pei et al. [
10], and Gao et al. [
11]).
As a development of the continuum theory, discrete dislocation models allow us to demonstrate significant deviations from classical plasticity predictions. Concerning existing models of rough contact surfaces described by the continuum theory of plasticity, the discrete dislocation model provides contact pressures significantly higher than those predicted by the continuum theory of plasticity. For this reason, a strain gradient plasticity theory has been proposed for a better understanding of microscale deformation [
12,
13,
14]. The dependence of the scale-dependent strain gradient determines the mechanical properties of contact interaction; the smaller the size of the deformed region, the greater the gradient of the plastic strain. A mechanism-based strain gradient plasticity model, linking strain gradients on the microscale (10–100 nm) and mesoscale (1–10 μm) under plastic deformation, was proposed by Gao H. et al. [
15] and Huang et al. [
16,
17]. The effects of contact size and deformation resistance due to dislocation sliding on the evolution of the mean contact pressure were explored [
13]. The response of crystals having dislocation sources in the surface layers to that of dislocation sources in the bulk was compared. Under severe plastic deformation of bulk sources, the mean contact pressure is independent of the friction condition, whereas, for sufficiently small contact sizes, there is a significant dependence on the friction condition. If only surface dislocation sources are considered, the contact pressure increases more rapidly with detachment depth than when bulk sources are present.
The plastic deformation of neighboring contact spots occurs at smaller deformation depths for small contact sizes, and this interaction leads to an increase in the slope of the contact pressure [
13,
14]. It should be pointed out that the exact location and strength of the sources and obstacles are found in the high-stressed region near the contact. It is concluded that the contact pressure on the macroscale (large contact spots ≥ 1 μm) is independent of the friction between the contacting surfaces, while for contact spot sizes (<1 μm), significant plastic deformation occurs.
Recently, Gao Y.F. et al. [
18] provided an analysis of the contact between elastic–plastic solids, where the surface roughness was represented by a Weierstrass profile. Here, a two-dimensional contact model of deformation between two bodies—a flat, rigid platen and an elastic–plastic solid with a sinusoidal surface—was analyzed. The authors characterized the deformation of surface layers by two parameters:
α =
a/
λ, where
a is the half-width of the contact and
λ is the period of the surface waviness. Plasticity of the surface layers was estimated by a new parameter, the index of plasticity,
ψ =
E*
g/
σYλ, where
E* and
σY are the effective modulus and yield stress of the substrate, respectively, and
g is the amplitude of the surface roughness. Based on the analysis of
ψ, eight stages of plasticity of asperity contact surfaces were considered: (a) elastic, elastic–plastic, or fully plastic for isolated Hertz contacts; (b) elastic, or elastic–plastic for isolated non-Hertzian contacts; (c) elastic, elastic–plastic, or fully plastic for contact interaction. Interaction between the contact pressure, size of the contact spots, indentation depth, and residual stress were investigated for each loading regime. In addition, the discrete dislocation plasticity theory was used to analyze single crystal indentation [
19]. Size-dependent contact pressures calculated by application of the discrete dislocation plasticity theory were several times higher than those predicted by the continuum theory of plasticity. These results were confirmed by simulation of the interaction between neighboring rough asperity surfaces and contact pressure using discrete dislocation plasticity analysis [
20]. The simulation was performed using the model of rough surfaces as an array of equispaced asperities with a sinusoidal profile. The asperity density effect is a result of the collective glide of dislocations, the formation of gradient nanocrystalline grains, and the interaction between neighboring plastic zones. Since dislocation-limited plasticity plays a dominant role, the asperity density effect will mainly be relevant for surfaces having a small asperity roughness. It is suggested that the asperity density effect vanishes when the hardening coefficient approaches zero. The real contact area is considered to be the sum of the contact spots in sheared asperities on a microscopic scale [
21]. Nevertheless, the real contact area of small asperities and the pressure cannot be described accurately in the macroscopic plasticity of surface layers. In order to analyze the interaction between a rigid platen and an elastoplastic solid with rough rubbed surfaces, the conventional mechanism-based strain gradient plasticity model (CMSGP) was applied.
The flattening behavior of sinusoidal asperities is studied by the application of CMSGP and J2 isotropic plasticity theories. The flattening of strain-gradiented asperities gives rise to a higher flow stress and average contact pressure in the CMSGP model than in under-sized J2 plasticity. In general, all the materials considered increase their contact area nearly linearly with flattened surfaces. In this instance, the asperity distribution is strongly influenced by size-dependent plasticity and shifts toward higher pressure levels. Size-dependent plasticity magnifies the sensitivity of contact pressure to surface roughness; the larger the surface roughness, the bigger the difference between size-independent and size-dependent plasticity. According to the authors, future friction experiments, such as the shear of friction surfaces, and the analysis of gradient structures will be crucial in the development of simulation models and real contact interactions.
The static frictional behavior of a metal asperity in contact with a rigid platen was investigated by discrete dislocation plasticity simulations [
22]. Plasticity can delay or inhibit slipping under close static conditions or low friction. Size-independent frictional behavior is observed when asperities of different sizes are flattened to the same depth and sheared. However, asperity sizes can vary under the same contact pressure: smaller asperities continue to slip, but larger asperities deform plastically. In other words, large asperities form during severe plastic deformation, localized in thick surface layers, while contact partial slip is dominant in contact with a smooth surface localized in thin surface layers. Moreover, small asperities can be subjected to higher pressure than large asperities when their contact area is smaller. Consequently, when real multiscale rough surfaces are tangentially loaded, the large macroscale asperities slide before small mesoscale asperities. When the smoothness of the rubbed surfaces is obtained, friction on the atomic scale is dominant.
Recently, Persson et al. investigated the plastic deformation of rough metallic surfaces [
23,
24]. The nature of plastic deformation on a sandblasted aluminum surface was studied. It is noted that Perrson’s model is less accurate than the discrete dislocation plasticity model, but it is easy to implement. It is expected that the resistance of asperities to severe plastic deformation becomes maximal when the applied stress approaches hydrostatic stress and further plastic deformation is limited. It was shown that the plasticity of deformed roughness depends strongly on work hardening and the stress–strain relation. The results of Persson’s theory were compared with those of discrete dislocation plasticity [
25]. The results obtained by theory and by simulations are in good agreement for rough surfaces with a very small root mean square (
rms) height. The multi-scale contact theory proposed by Jackson and Streator [
26] was developed using a comparison with the finite element simulation analysis of rough surfaces and CMSGP theory [
27]. Ghaednia et al. [
28] summarize the models of elastic–plastic contacts in a wide range of geometries and loading situations.
Recently, Ta W. et al. [
29] considered the interface model, including the mechanical and thermal properties of the friction contact, by establishing a mechanical–thermal contact model. The authors evaluated the contact area, number of contact points, void, and contact force based on the thermal analysis of contact resistance. The proposed model, based on the change in contact volume, allows us to describe the change in the real contact area and the number of contact points. In this model, all micro-contacts are in various states ranging from elastic to severe plastic deformation.
Here, we seek to employ the theoretical models of the deformation process in the analysis of asperity contact interaction (flattening models) published in the literature and the experimental results of the effect of test time on the variation in the parameters of asperity contact, friction, and wear of pure FCC metals. This study investigated the interaction between the plasticity of deformed surface layers of FCC metals and the flattening parameters, hardness, and asperity profiles. The effectivity of plastic strain gradients on the formation of surface profiles will be evaluated. The balance between hardening and softening in surface layers of friction contact on the one hand and the external parameters of loading (contact area, contact pressure, and distribution of asperity contacts) on the other hand will be considered. The interaction between applied external and internal stresses will be evaluated during friction in the steady state. The two-dimensional contact model of a flat, rigid plate and an elastic–perfectly plastic solid with a sinusoidal surface will be analyzed while considering a link between parameters of a gradient nanograined structure and the flattened spots. Multi-asperity contact surfaces subjected to severe plastic deformation will be analyzed as being size- and scale-dependent. The interaction between the asperity parameters and variations in the deformed structure will be performed on macro and mesoscales.
2. Models of Flattening and Discrete Plastic Deformation
The effect of roughness on sliding contact is the basis of most models of friction and wear, e.g., [
30,
31,
32,
33,
34]. We will start with the partial contact model for a sinusoidal surface used to develop a relation between the distribution of contact pressure on different scales [
35,
36,
37,
38]. In
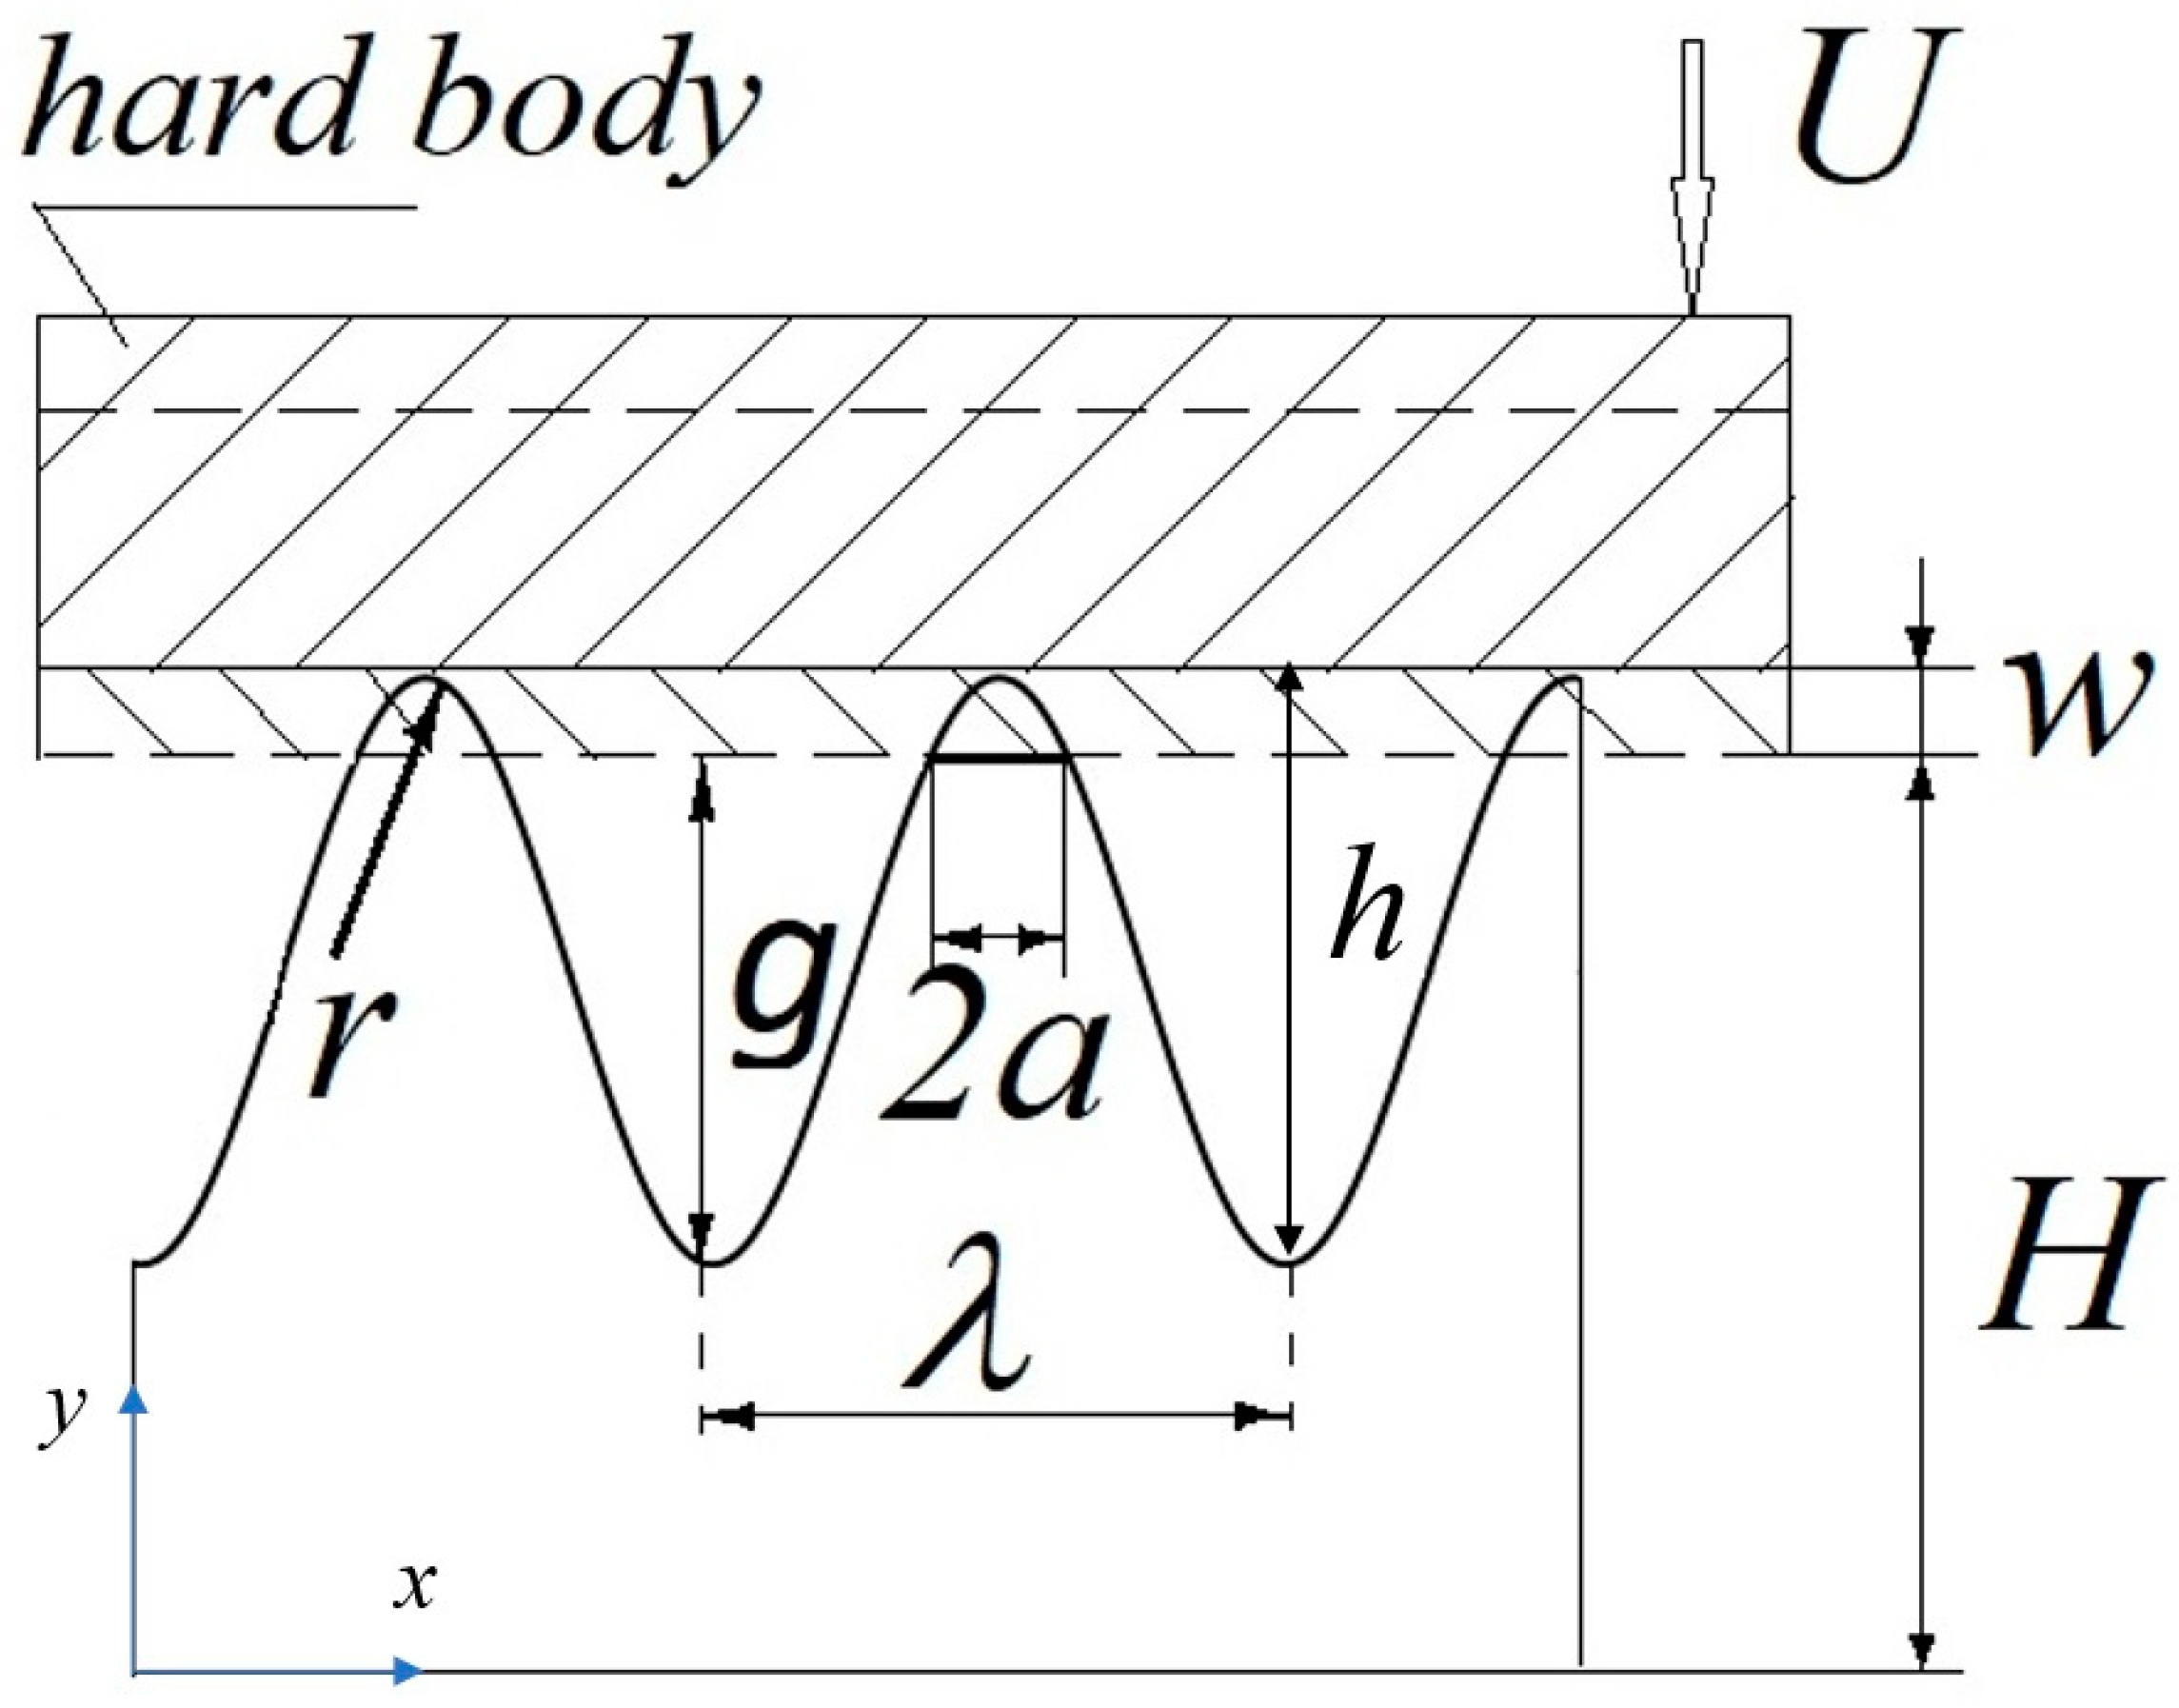
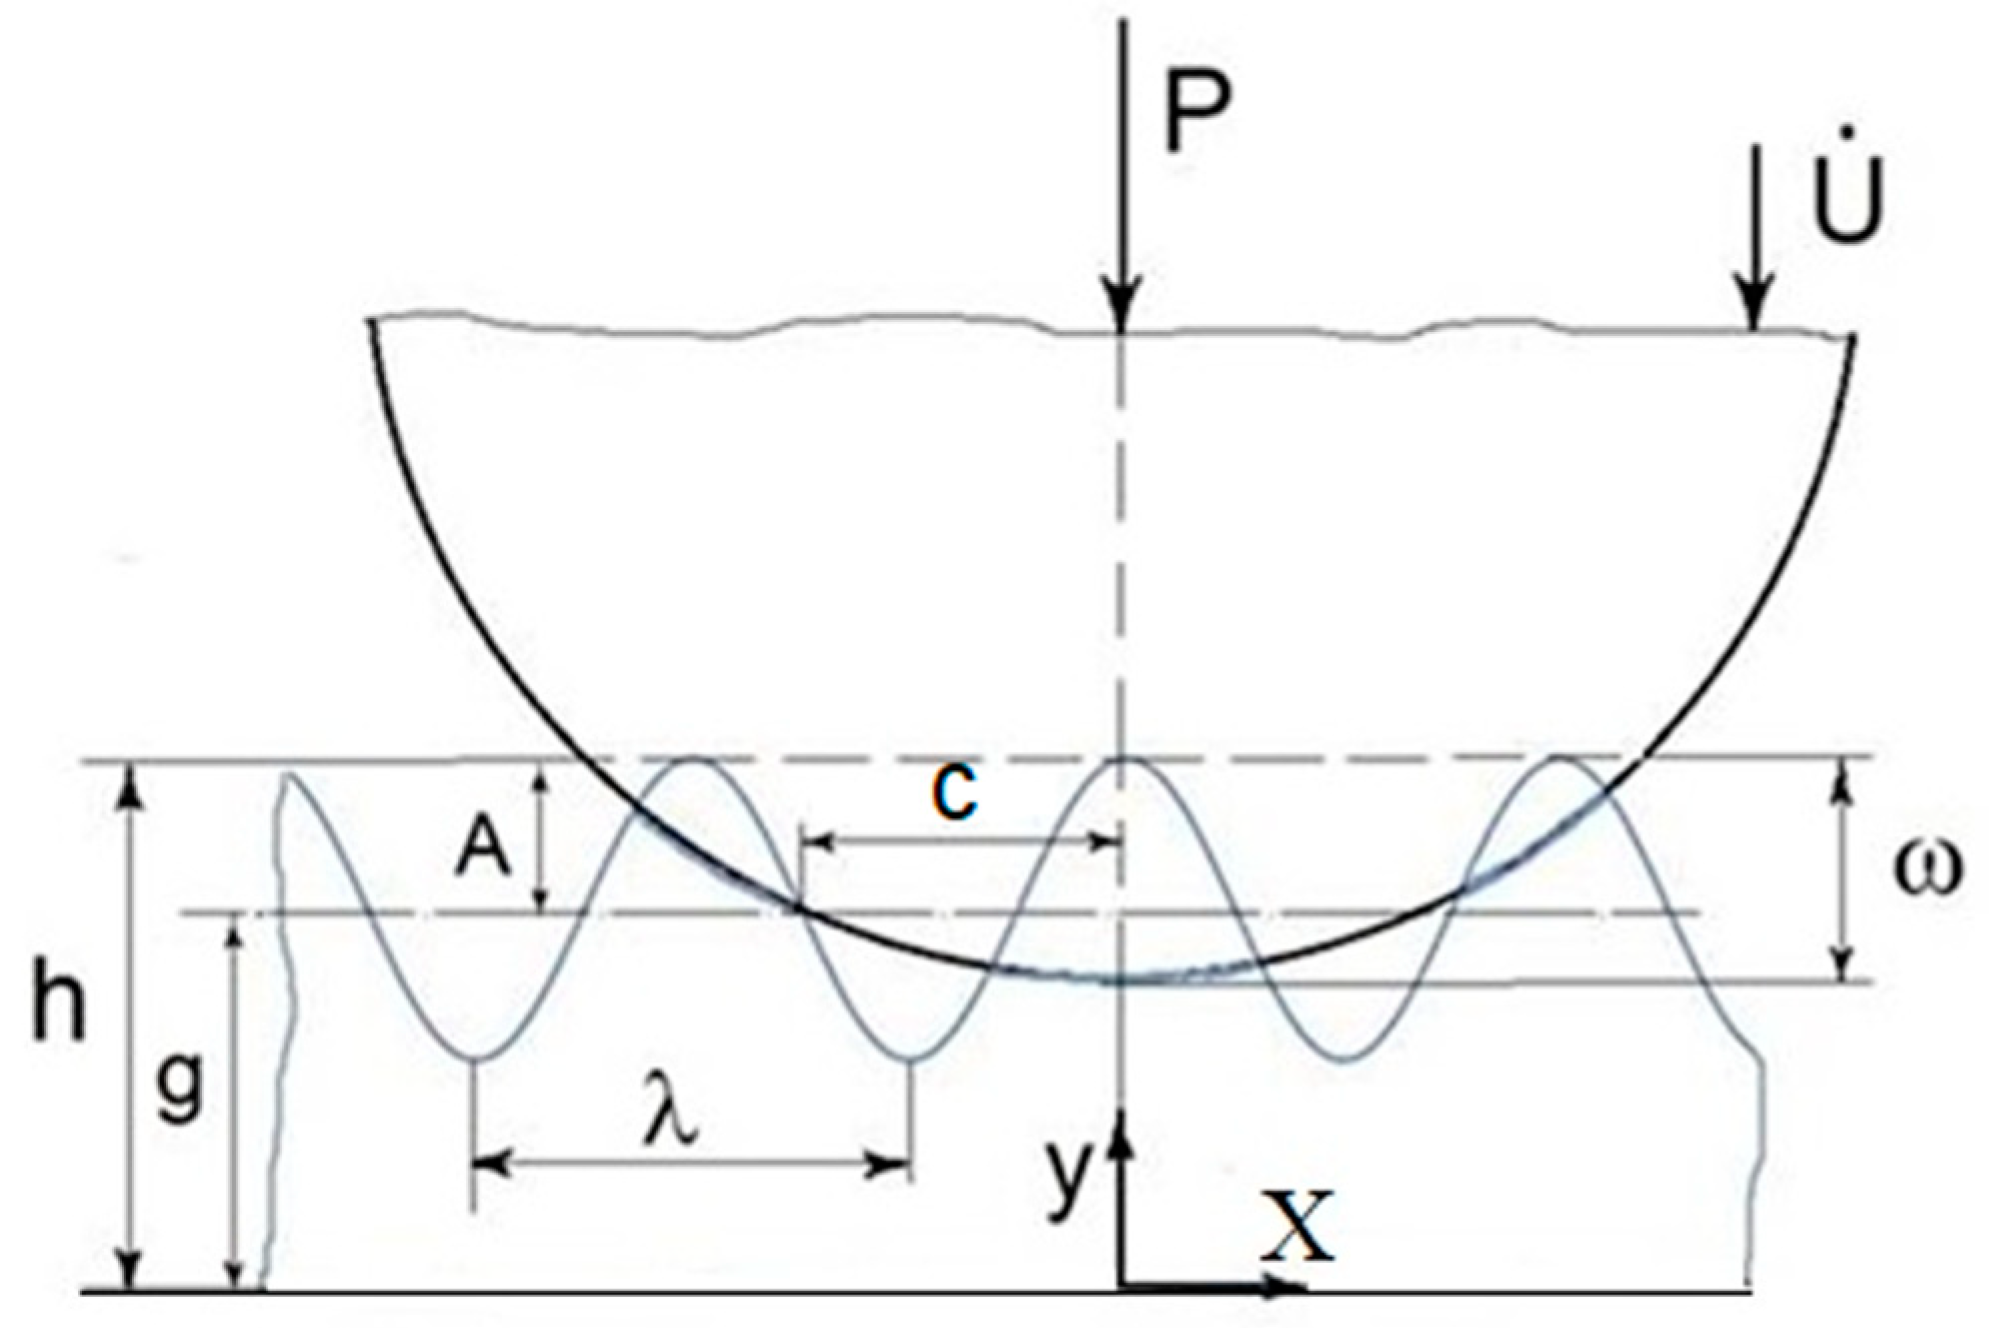
Figure 1, a two-dimensional elastic rigid body with a sinusoidal profile was first considered, where
Furthermore, the roughness was described by the two-dimensional Weierstrass function as
where
g0 and
λ0 are the amplitude and wavelength of the Zeroth scale, respectively, and
g and
D are dimensionless parameters that characterize the fractal properties. The authors represent the contact area by a fractal set, i.e., contact is limited by set of infinitesimal contact segments with the limit
n → ∞. It is clear that the addition of surface contamination, diffusion, and adhesion would also vary the behavior of mesoscale contacts. A.J. Gao et al. [
11] developed Ciavarella’s research of elastic–plastic solids. The average contact pressure
pm and nominal contact pressure
p were estimated by
where a represents the contact half-width; 0 <
<
λ/2. No connection between contact pressure and the parameters of plasticity in the surface layers appeared. Functional relationships between these parameters are defined by
where α =
α/
λ is the fractional contact area. An additional dependent parameter,
Ψ, has been introduced [
19]:
It is suggested that there are substantial regions of parameters where the behavior of the contact depends on
α.
ψ,
g/
λ, and
E*/
σy. E* = E (1
− ν2). For a large number of materials, 10 <
E*/
σY < 1000, and for most surfaces, 0.01 <
g/
λ < 0.1. Thus,
ψ comprises a significant amount of parameters, i.e., 0.1 <
ψ < 100. The parameter
α and the nominal contact pressure
p can be regarded as load parameters. However, the analysis of these parameters in the elastic–plastic and plastic regimes indicates that
ψ and
α do not fully characterize the features of the contact interaction. The maximum value of
pm depends on the properties of the material (
E/
σY) and the contact geometry (
g/
λ). The transition from an elastic–plastic to a fully plastic contact occurs for a definite value of
α~0.7 [
18]. The elastic to elastic–plastic contact is determined only by the parameters
α and
ψ, and it is independent of the parameter
g/
λ. When neighboring plastic spots interact, the contact pressure increases abruptly and may reach high values of hardness. To evaluate the effect of surface roughness on the displacement of the hard body, Gao et al. [
18] described a difference in the vertical displacements
and
on the surfaces of the rigid body and the solid, respectively:
A sharp increase in both the asperity and the nominal contact pressure begins when δ/g→1 and Ψ > 2. The fraction of direct contact is about 30% higher than in linear elastic regimes under high contact pressure and severe plastic deformation. It was concluded that for most engineering surfaces, only the first few roughness scales (0 < n < 4) will be in the elastic or elastic–plastic regimes of behavior. The scales (n > 4) are characterized as a fully plastic asperity interaction, which occurs at high values of α and ψ. In addition, the average values of asperity contact pressure persists and approaches a fixed asymptote as n→∞.
To compare the results of the simulation with real contact conditions, the value of
ψ under real experiments with Cu rubbed in elastohydrodynamic lubrication (EHL) and boundary lubrication (BL) regions were evaluated [
39].
According to preliminary results [
40,
41], the following parameters were used:
E*~143 GPa (
E = 130 GPa,
n = 0.3);
σy in the steady states of the EHL and BL regions (
σy = H/3):
σEHL~0.37 and
σBL~0.57 GPa; and
g/
λ was chosen as 0.01 and 0.05 under friction in EHL and BL regions, respectively. The calculated values of
Ψ are as follows:
Ψ = 3.9 and 12.5 in EHL and BL conditions, respectively. As can be seen,
Ψ > 1 in the EHL region, while
Ψ > 10 in the plastic region. Interestingly, when a severe plastic deformation gradient occurs in the BL region, the real value of
Ψ is significantly larger than in the simulation. When the hardness of the surface layers was increased from 1100 MPa to 1700 MPa, the roughness parameter,
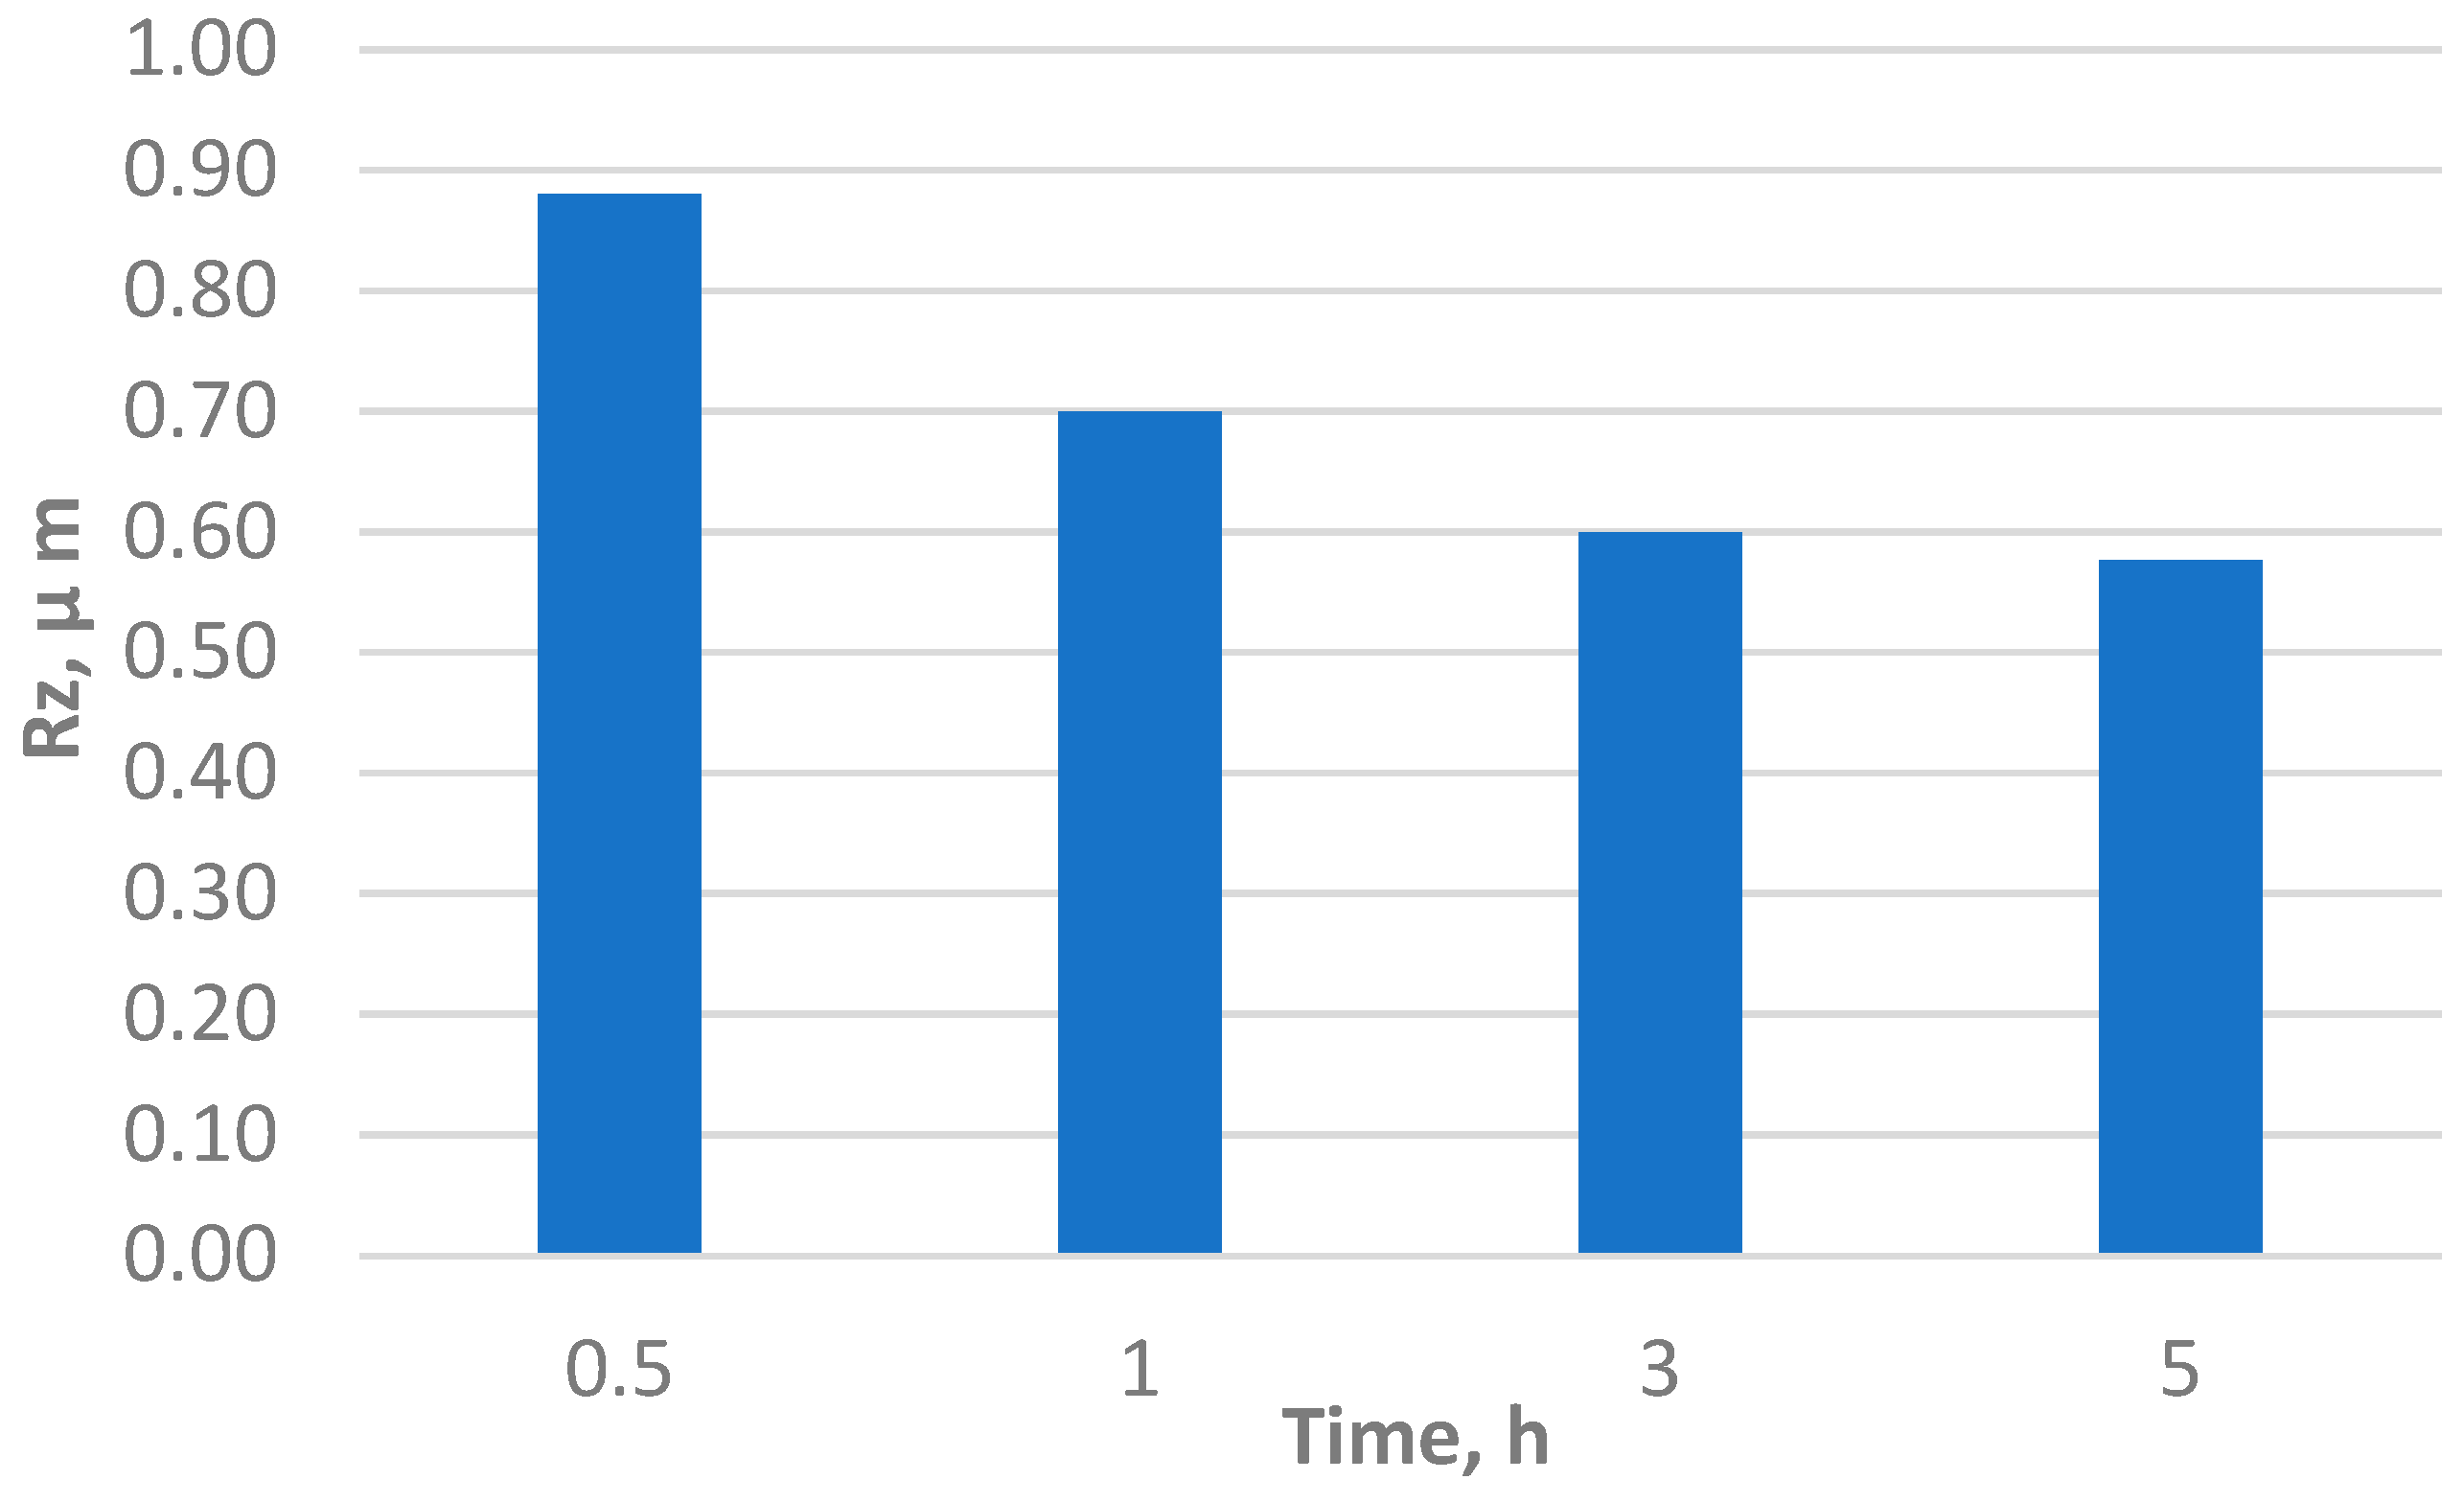
Rz, was raised from ~0.2 to 0.65 μm in the EHL and BL regions, respectively. If H
BL/H
EHL is greater than 1.5, then
RzBL/
RzEHL is greater than 3. Hence, we can draw the following conclusion: the idea that “harder is smoother” is convenient in the description of initial hardness only. Moreover, hardening in the BL region does not directly effect a decrease in the roughness of the asperities. It is suggested that flattening is mainly determined by the relation between the applied stress and the deformation resistance stress. During friction in the steady state (
μ and
H are constant),
λ will decrease while
δ (and
Rz) will increase with loading. The definite correlation can be observed between the vertical displacement
δ and the
Rz parameter; the larger the
δ, the deeper the penetration of the indenter into the surface layers (
Rz).
Discrete dislocation plasticity (DDP) simulation investigates the role of interactions between neighboring asperities on the contact pressure induced by a rigid platen on a rough surface. In this instance, the sinusoidal surface asperity model flattened by a rigid platen is considered [
20]. A sinusoidal profile of asperities is characterized by the wavelength
λ and amplitude
A. The spacing asperities are described by the next function:
where
h is the height from the bottom of the crystal to the mean height of the asperity. The contact area,
C, is defined as the region of direct contact between the flat platen and the crystal. To evaluate the effect of contact load on the platen surface, the flattening force
F (per unit of length) was calculated:
The fundamental equation for shear rate on the slip system
α corresponds to the viscoplastic power law [
42,
43]:
Without going into the complexities of this equation, the driving force of plastic deformation as the effective stress, τ
αeff, will be considered.
ταeff = {(
τα −
τbα)/
Sα}, where
τα is the applied stress,
τbα is the internal back stress, and
Sα is the local athermal stress. The back stress defines the deformation resistance of dislocation pile-ups. The back stress can be screened when the number of piled-up dislocations approaches the critical value. The evolution of back stress increases in fine grains of the surface layers during friction, while it decreases in the softening process. The balance between hardening and softening was considered in our previous works [
44,
45] and will be analyzed in our future works in more detail. Increasing the hardness of surface layers with the formation of a refined structure decreases the wear rate. On the other hand, ductility is deceased, leading to failure development. Wear properties are best achieved under high work hardening and definite softening values determined by dynamic recovery or dynamic recrystallization at relatively high temperatures. Our experiments showed that
ταeff = τα − τbα is very low in a steady friction state in the regime of balanced deformation hardening–dynamic recovery [
45].
The applied stress can be expressed as τα = μL/NA in friction, where μ is the coefficient of friction, N is the number of contact spots, and A is the area of a single contact. Here, τα is the applied stress at the macroscale level, where dominant processes are determined by the hardness and wear of contact points. Plastic deformation at the mesoscale is characterized by dislocation gliding as interference decreases. Qualitative analysis of the applied and back stress will allow us to better understand the model of structural balance during friction and the transition to instability. We will investigate the mechanisms of plasticity to characterize the applied stress, back stress, and energy activation during friction.
Song H. et al. [
21] analyzed the strengthening of the asperity density effect in the plastic deformation of surface layers and evaluated the effects of different combinations of dislocation interactions under plastic deformation of asperity contact as (a) plastic strain gradient effects, (b) the interaction between plastic zones, or (c) limited dislocation plasticity. It is known that severe plastic deformation of asperity surfaces is accompanied by the formation of inhomogeneous compressive stress in thin surface layers of about two microns of the crystal, according to the DDP simulation. Importantly, stress peaks are remarkably high, up to 200 times the yield strength. Moreover, the effect of the distance between contact spots was analyzed. Simulations were performed for asperities with the following sizes:
w = 2 μm and
A = 0.1 μm; a constant obstacle spacing,
Lobs = 0.18 μm; but different spacings between nucleated spots:
Lnuc = 0.09, 0.13, 0.26 and 1 μm. A maximum effect appeared for a spacing between spots of
Lnuc = 1 and 0.26 μm. When decreasing the number of spacing sources, the effect of the asperity density decreases until it converges at the plasticity limit. Hence, when plastic deformation was estimated by DDP simulation with a source spacing of about
Lnuc = 0.26 μm, the effect of the asperity density was enhanced both in the elastic and the continuum plastic regimes. Finally, it was shown that the asperity density depends significantly both on the hardening and the continuum plasticity. The effect of asperity density on the asperity size was also investigated. Simulation was performed for some asperity parameters:
w = 4 μm, spaced at s = 4 μm and s = 16 μm. As expected, the larger the asperities, the easier it is to flatten the contact spots compared with the smaller asperities. When the actual spacing between contacts is twice as large as that for small asperities, the interaction of plastic zones is not expected. Our experiments under friction in lubricant conditions [
43,
44] and dry friction [
46] indicate the complexity of plasticity and flattening in surface layers, demonstrating that the application of continuum plasticity in the analysis of friction and wear mechanisms is limited. Furthermore, Song H. et al. [
21] proposed a conventional mechanism-based strain gradient plasticity (CMSGP) model for two-parameter characterizations of rough surfaces using the analysis of the root mean square (
rms) height and the surface correlation length
ls:
The average contact pressure of asperity
pm,asp under a definite pre-set displacement
U is given as:
Here,
p (
x,
y) represents the contact pressure of the partial element, and
C indicates the contact area between the two surfaces. Furthermore, a strain-like value is described as:
ε = U/
Rasp, where
U is the displacement of the asperity under the deformation and
Rasp is the radius of curvature. Three spherical asperities with radii of 50 μm, 5 μm, and 0.5 μm were chosen. Contact pressure and strain change analyses indicate a strong size dependency between asperity parameters and the contact surface deformation; smaller is harder. Similar experiments [
15,
17] use the Taylor hardening model to describe the deformation shearing:
where
μ is the shear modulus,
b is the magnitude of the Burgers vector, and
α is an empirical coefficient of the order 0.2–0.5. The densities,
ρs and
ρG, are the densities of the statistically stored (SSD) and geometrically necessary dislocations (GNDs), respectively. The density of the GND is connected to the effective plastic strain gradient
ηp:
If
ρG = 10
14 m
−2,
is the Nye factor, which is close to 1.9 for FCC polycrystals, and if b = 0.25 nm, then
ηp = 100 μm
−1. The real evaluation of
ηp, performed for nanocrystalline Cu (d~100 nm) after friction in the BL region will be considered bellow. Following this line of reasoning, Huang et al. [
16,
17] proposed an expression for flow stress that holds in the presence of strain gradients. The flow stress,
σflow, is
where
l is the intrinsic material length,
l ≈
μ/
σY, and it is in the range of micrometers. It is seen from Equation (14) that the flow stress grows with increasing
. Thus, the asperities become harder and smoother as the flow stress increases. The interaction between the microscopic flow stress,
σflow, and the macroscopic yield stress,
σy, was formulated as
σflow = σy f(
εp), where
εp is the effective plastic strain, and
f is the non-dimensional hardening function.
f(
εp) is represented as
f(
εp)
= (1 +
Eεp/
σY)
n, where
E is Young’s modulus, and
n is the plastic work-hardening exponent (0 <
n < 1).
A lot of length scale parameters are used in the analysis of the interaction between the plasticity of surface layers and the flattening of the asperity contact. There is a constant obstacle spacing (
Lobs = 0.18 μm) and different source spacings (
Lnuc = 0.26 and 1 μm [
18], some micrometers [
19], or
l = 4.4 μm [
25]). The
l value was evaluated based on our friction test with Cu and Ni [
35]. For instance,
l (Cu)~0.4 μm, and ~0.3 μm for Ni. Usually, the real value of
l under severe plastic deformation in the nanocrystalline structure is decreased and close to
Lnuc = 0.26 μm. Analysis of the material’s length under deformation during friction will be considered in more detail in the part on “Results”.
Furthermore, statistics of the contact pressure were analyzed. The real pressure distribution on the rough surface is difficult to estimate experimentally. It is noted that the change in pressure distribution using the CMSGP model is much more significant. Since A/A0 and U are strongly related, it is preferable to study the distribution of contact pressures at a particular U value. The contact pressure distribution is insensitive to whether it is computed at the same flattening distance, U = 0.25 μm (when A/A0 is found to be 0.3), or at the same contact area, A/A0 = 0.1 (which requires flattening to U = 0.16 μm). Finally, it was concluded that increased surface roughness in a larger strain gradient is mathematically equivalent to a larger material intrinsic length l in CMSGP theory.
The considered relations,
A/
A0, were compared under friction in the BL region. The
A/
A0 relation in friction tests of FCC metals was calculated based on the results presented in refs. [
41]. Interestingly, this relation is significantly lower than in the simulation:
A/
A0 = 0.07 and 0.06 for Cu and Ni, respectively. Thus, the number of asperities in direct contact is relatively low under friction in lubrication conditions, i.e., a large part of the load is taken by the lubricant film. It is clear that the
U value will be lower in conditions of lubrication in the simulation.
Researchers widely accept the contact model of Kogut and Etsion (KE) [
47]. In the KE model, the transition from elastic deformation to elastic–plastic deformation is determined by the critical deformation thickness:
δcr = (
pKH/2
E)
2. Based on the KE model, and the multi-scale contact theory of Jackson and Streator [
26], the scale effect using a finite element method and CMSGP theory was analyzed [
27]. The following relationships of dimensionless contact parameters (contact force,
P/
Pcr; contact area,
A/
Acr; and deformation thickness,
δ/
δcr) were considered. In an elastic regime, where
δcr represents the critical interference at the yielding initiation,
Pcr and
Acr indicate the critical contact force and contact area in the elastoplastic regime. It is suggested that the single asperities are distributed on the surface, and that they have the same geometric parameters for the contact load equally for each scale space i. Thus:
where
Pi,
Ai, and
are the contact force, contact area, and deformation thickness, respectively, and
ηI is a real asperity number density. The fitting parameters d, m, c, and e are varied for different materials and contact conditions and will be estimated in future work.
Finally, the effect of a deformed shape on hardness and the real-time change during the contact process were not considered in this study. Hence, in our future work, we will continue to explore the influence of the above factors on contact behavior with the scale effect to broaden the applicability of the model.
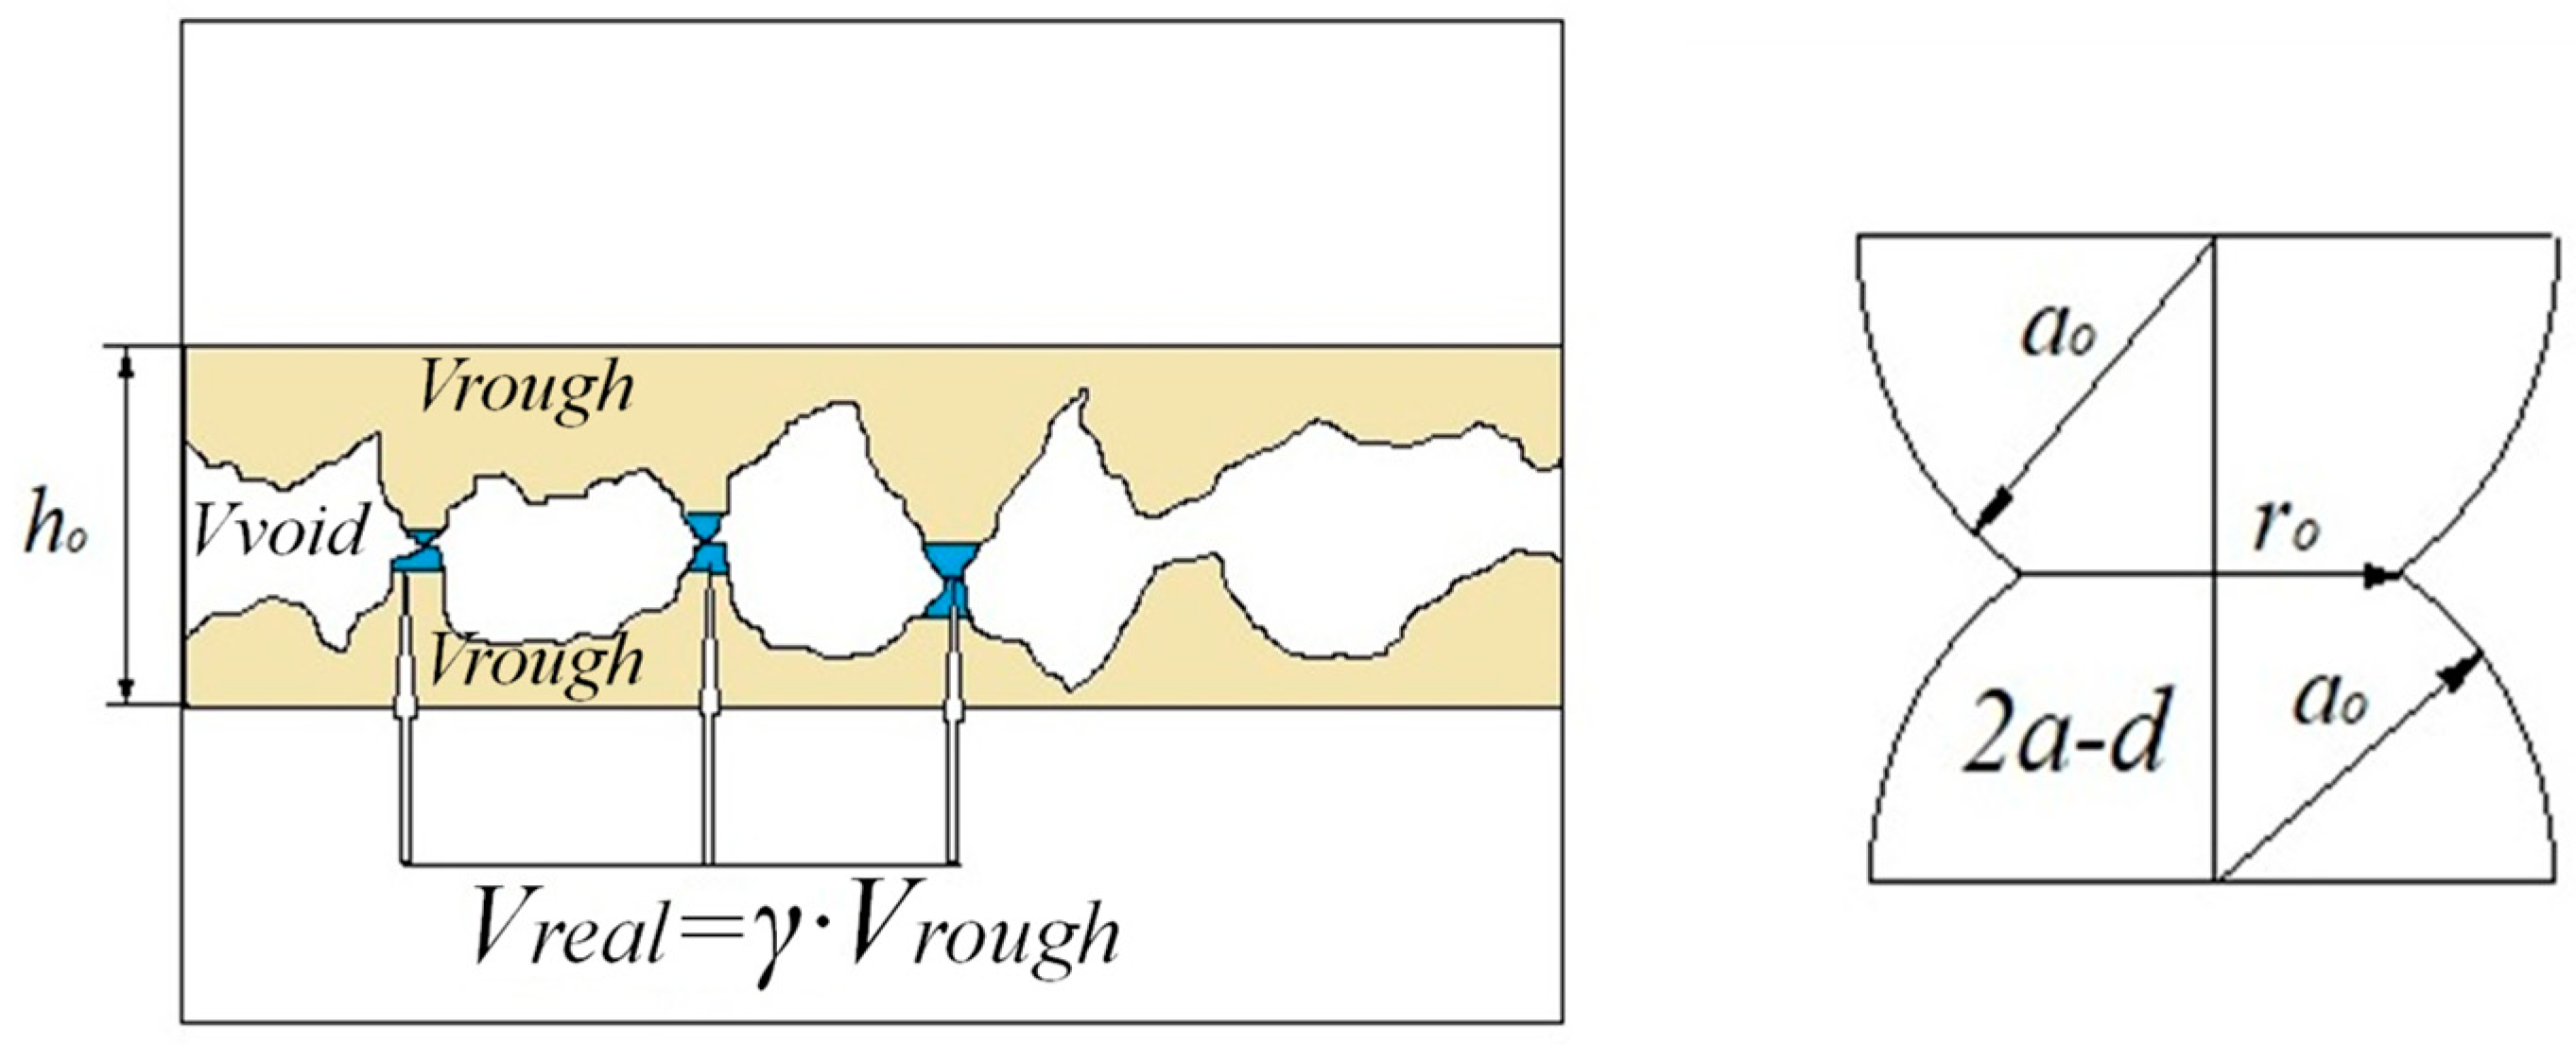
Previously, Ta et al. [
29] had proposed a mechanical–thermal contact model based on the reconstruction of the contact interface, as shown in
Figure 2.
The volume of the two solid contact parts,
Vtotal, is considered as three volumes by these two parameters, which are the void volume
Vvoid (equal to
αVtotal), rough volume
Vrough (equal to
Vtotal − Vvoid), and true contact volume
Vreal (equal to
γVrough). The void volume should gradually decrease, while the actual contact area should gradually increase as the contact is loaded. The void ratio in the initial contact, α
0, and the real contact volume ratio,
γ, are close to zero. The relationship between
α and
γ is described by an exponential function. The authors evaluate the real contact area
Sreal as a relation between the real contact volume
γVrough and (
h0 − d), where
d is the contact depth,
d = (
α0 − α)
h0, and the real contact volume change,
Vreal = [Vtotal − (
α0 − Δ
α)
Vtotal]γ, and the void reduction ratio is Δ
α = d/
h0;
α = α0 − d/
h0. As can be seen, all equations for contact depth,
Sreal, and
Vreal include
α as a fitting parameter. All parameters determined by
α and
A are key parameters that depend on the deformation plasticity of surface layers. It is noted that as contact occurs,
α gradually decreases to 0, and
γ gradually increases to 1. In fact, when
γ is close to 1, seizure or galling usually appears. The values of
α,
A, and
γ depend strongly on variations in the mechanical properties and the deformed microstructure, geometrical, and loading parameters of the contact bodies. Such analyses were not considered in the presented work. Therefore, this model cannot present reliable results. The number of contacting asperities
n is expressed as
n = Aa Nmax, where
Nmax is the number of contact asperities after full contact. However, full contact is not obtained in the conditions of normal friction. The
Sreal is described as
The correlating contact force
F acting on the asperities equals
F/
n = F/
γNmax. The contact force
F is the tangential force that depends on the many geometrical and structural parameters. Moreover,
σY is an unknown parameter determined by the accumulation of plastic deformation and the formation of the gradient structure. To confirm the results of simulation, the friction from 99.90% copper was studied. Finally, it is concluded that the proposed model provides direct observation of the interface morphology and temperature and stress distributions, which allows us to evaluate the interface performance. This conclusion was not confirmed by physical evidence. Moreover, the loads in the presented results under Cu friction have unreal values (2000–10,000 N) [
29]. Some realistic results of loads under friction from Cu or Cu alloys are presented here: 1.5 N [
48]; 10 N (Cu-Ag) [
49], 10–200 N (Cu-Zn) [
50], and 30 N (Cu-Al) [
51] (all in dry friction).
Finally, it can be concluded that the interaction between asperity distribution and the deformed structure of surface layers plays a crucial role in the prediction of friction and wear behavior, which warrants further investigation of the interaction between the applied stress and deformation resistance based on modern new models.
