1. Introduction
Piston–cylinder systems are widely used in various engineering applications. These include internal combustion engines, spool valves, various actuators, capsule-pipeline transportation devices, viscometers, timing devices, piston compressors, plunger pumps and free pistons in some versions of the Stirling engine [
1]. In addition to the primary reciprocating axial motion of the piston, the small clearance between the piston and the cylinder liner allows lateral and rotational motion in the direction of the clearance during the reciprocating motion, also known as secondary motion [
2]. For hydraulic pistons, unlike those in internal combustion engines, the lateral forces due to the axial motion mechanism are small; hence, the main contributors to the radial forces are the hydrodynamic forces, which may lead to instability of the secondary motion [
3].
The secondary motion of an untreated hydraulic piston (smooth and cylindrical in shape) is unstable, as was observed both analytically through the perturbation method [
4] and experimentally [
5] in piston hydraulic machines for various fluid properties, geometric properties and operation conditions. Unstable motion results in collisions of the radially oscillating piston with the cylinder [
1], which is detrimental to the piston–cylinder system and may also lead to a 50%–100% increase in leakage [
6]. The secondary motion of the piston should be stabilized to reduce its detrimental effect. In other words, the piston should be centered during its reciprocating axial motion. Several methods for centering a piston have been presented in the literature. For instance, Xie et al. [
7] introduced a method for centering a piston using a closed-loop active magnetic control system. In Refs. [
8,
9], it was shown for a stepped-profile piston (also known as a Rayleigh step bearing), assuming small eccentricities (without rotation), that centering of the piston can be achieved due to a radial returning force, and the optimum step design was discussed. In [
10], Kligerman et al. showed that the secondary motion of the piston (lateral and rotational) during reciprocating motion can be stabilized by utilizing axial step profiling of the piston at the end of the high-pressure region.
However, while a Rayleigh step bearing is easy to model mathematically, it may not be applicable at the micron scale. In [
11], Tonder suggested that an effective step or slope profile could be produced by removing material through texturing. Various texturing techniques can be used for micro-surface texturing, including machining, ion beam texturing and etching techniques. Nevertheless, it seems that laser surface texturing (LST) offers the most promising concept of all practical micro-surface texturing methods [
12]. This is due to its high flexibility and accuracy. The implementation of LST is quick, cheap and environmentally clean [
13]. In Ref. [
14], it was shown that LST in the form of spherical dimples can improve tribological performance. In Ref. [
15], the topography of dimples was measured, and it showed good agreement with a spherical shape. LST produces a very large number of micro-dimples on the surface. The dimples’ diameter and height can be precisely controlled; the diameter typically ranges from 20 to 200 microns, and the height ranges from 0 to 100 microns [
16]. In addition to generating a separating force in the case of full lubrication, each dimple may serve as a micro-reservoir or a micro-trap for wear debris in the case of starved lubrication [
17].
Similar to a Rayleigh step bearing, LST can be implemented on part of the piston at the end of the high-pressure region, a treatment that is also known as “partial texturing” [
18]. In Ref. [
19] for thrust bearings and in Ref. [
20] for piston rings, the pressure distribution for partial texturing was shown to be similar to the pressure distribution for Rayleigh step bearings. These studies also investigated the impact of various texturing parameters, including dimple depth, textured portion and dimple area density. The results indicated that the dimple area density, which is the ratio of the total area of the dimples to the area of the textured zone, should be maximized for optimal performance. The optimal values for dimple depth and other parameters were found to be dependent on specific operational conditions. In Ref. [
21], a computational fluid dynamics (CFD)-based investigation was performed to compare the pressure distribution of a partially textured surface with that of an equivalent-volume step. The influence of different texturing parameters on the applicability of the equivalent-volume step to model partial texturing was examined, and an analytic tool to predict the pressure distribution for surface texturing was proposed. The authors noted that while a CFD-based model for surface texturing showed good agreement with the experimental results, the agreement with the Reynolds equation was poor. This conclusion is compatible with Ref. [
22], in which it was stated that the Reynolds equation cannot handle the surface discontinuities added by texturing. Therefore, the mathematical model that should be used is the more general mass and momentum conservation equations (Navier–Stokes equations) rather than the Reynolds equation.
In the following, several methods that were used in the literature for analyzing the stability of secondary motion are presented. Fagotti et al. [
23] developed a numerical model to calculate the secondary motion of a ringless piston in a small reciprocating compressor. The piston trajectory of the secondary motion during the reciprocating motion was obtained through simultaneous solution of the Reynolds equation and the piston’s equation of motion (EOM). The authors showed the effect of different parameters on the secondary motion of the piston, which significantly affects the power consumption and oil leakage. They suggested using their model for piston design optimization. Tan et al. [
24] established an experimental technique for measuring the secondary motion of a piston using laser sensors. In their later study [
25], the measurement technique was used to validate the numerical model of pistons’ secondary motion. The numerical model assumed linear dynamics, and a nonlinear term was added for cases of contact between the piston and the cylinder. The agreement between the numerical model and the experiment was good, especially for low frequencies of reciprocating motion. It was found that the vibration amplitude decreased as the damping and stiffness coefficients increased. In [
10], Kligerman et al. used simultaneous solution of the Reynolds equation and the EOM for analyzing the stability of the secondary motion of a stepped-profile piston. In their later study [
26], the solution acquired from the Reynolds equation was validated with a more accurate model, which is based on simultaneous solution of the full Navier–Stokes equations and the dynamic equations. The validity limits of the Reynolds equation in terms of normalized parameters were discussed. Kumar and Bergada [
27] investigated the effect of groove cuts along the piston’s surface on the secondary motion stability of pump pistons. By solving the Reynolds equation for various eccentric displacements and angular positions of the piston during the reciprocating motion, the authors showed that axial groove cuts can increase the stability of the secondary motion by increasing the stiffness of the system. In [
28], a simultaneous solution of the Reynolds equation, the EOM and the deformation equations was applied for a grooved piston in an axial piston pump. It was found that grooves that are located near the displacement chamber (a chamber where suction and pumping of the liquid occur) can prevent contact between the piston and cylinder and reduce viscous friction power loss. However, as stated in [
29], the analytical models should be further improved to better design piston profiles for enhanced tribological performance.
While it was shown in some of the abovementioned studies that the secondary motion of a piston can be stabilized, most of the studies did not provide mathematical proof of the stability of the secondary motion. The Lyapunov method [
30] can potentially be employed to test the stability of the EOM. However, due to the coupling of the EOM with the Reynolds equation, this approach becomes cumbersome. Nevertheless, when a linear model is employed, as demonstrated in [
25], for small oscillations around the equilibrium point, which is usually a concentric piston, additional methods can be utilized to test the stability. For linear time–invariant (LTI) systems, the classic modal analysis (see [
31]) can be used. By representing the LTI system in state space, the stability can be proven if all the eigenvalues of the state matrix have negative real parts. Nevertheless, the secondary motion of the piston has time-varying behavior due to reciprocating motion, and therefore, other methods for testing stability should be used. Among the suitable methods for time-varying systems are perturbation methods (see [
32]), such as the averaging and multiple-scale methods. However, in perturbation methods, small damping forces are assumed, and therefore, these methods might not be suitable. Another method that can be used for time-varying systems in which small damping forces are not assumed is Floquet theory (see [
33]). Because of the applicability of this method, it can be used for analyzing the stability of the secondary motion.
Research Objectives
The motivation of the present work is to reduce energy loss and wear by stabilizing the secondary motion of a piston. The stability of the secondary motion of a piston with partial laser surface texturing and of a stepped-profile piston during axial reciprocating motion inside a cylinder liner is studied. The trajectory of the piston’s secondary motion during the reciprocating motion is obtained by simultaneously solving both the Navier–Stokes equation and the EOM and by a more convenient linear model based on mass, stiffness and damping matrices. A unique approach for analyzing the stability of the secondary motion based on Floquet theory due to the time-varying stiffness and damping terms, which arise due to the axial motion, is presented. The use of Floquet theory with a matrix-based model allows the performance of stability analysis and the generation of stability maps for various operation conditions and different parameters of dimple texturing and step bearings with relatively low computational costs. The main goals of the current study are to examine the stability range for various texturing and step parameters and to draw guidelines for the optimal texturing parameters.
2. Theoretical Model
In the following, the physical model of the problem and the models for the step bearing and partial laser surface texturing are presented.
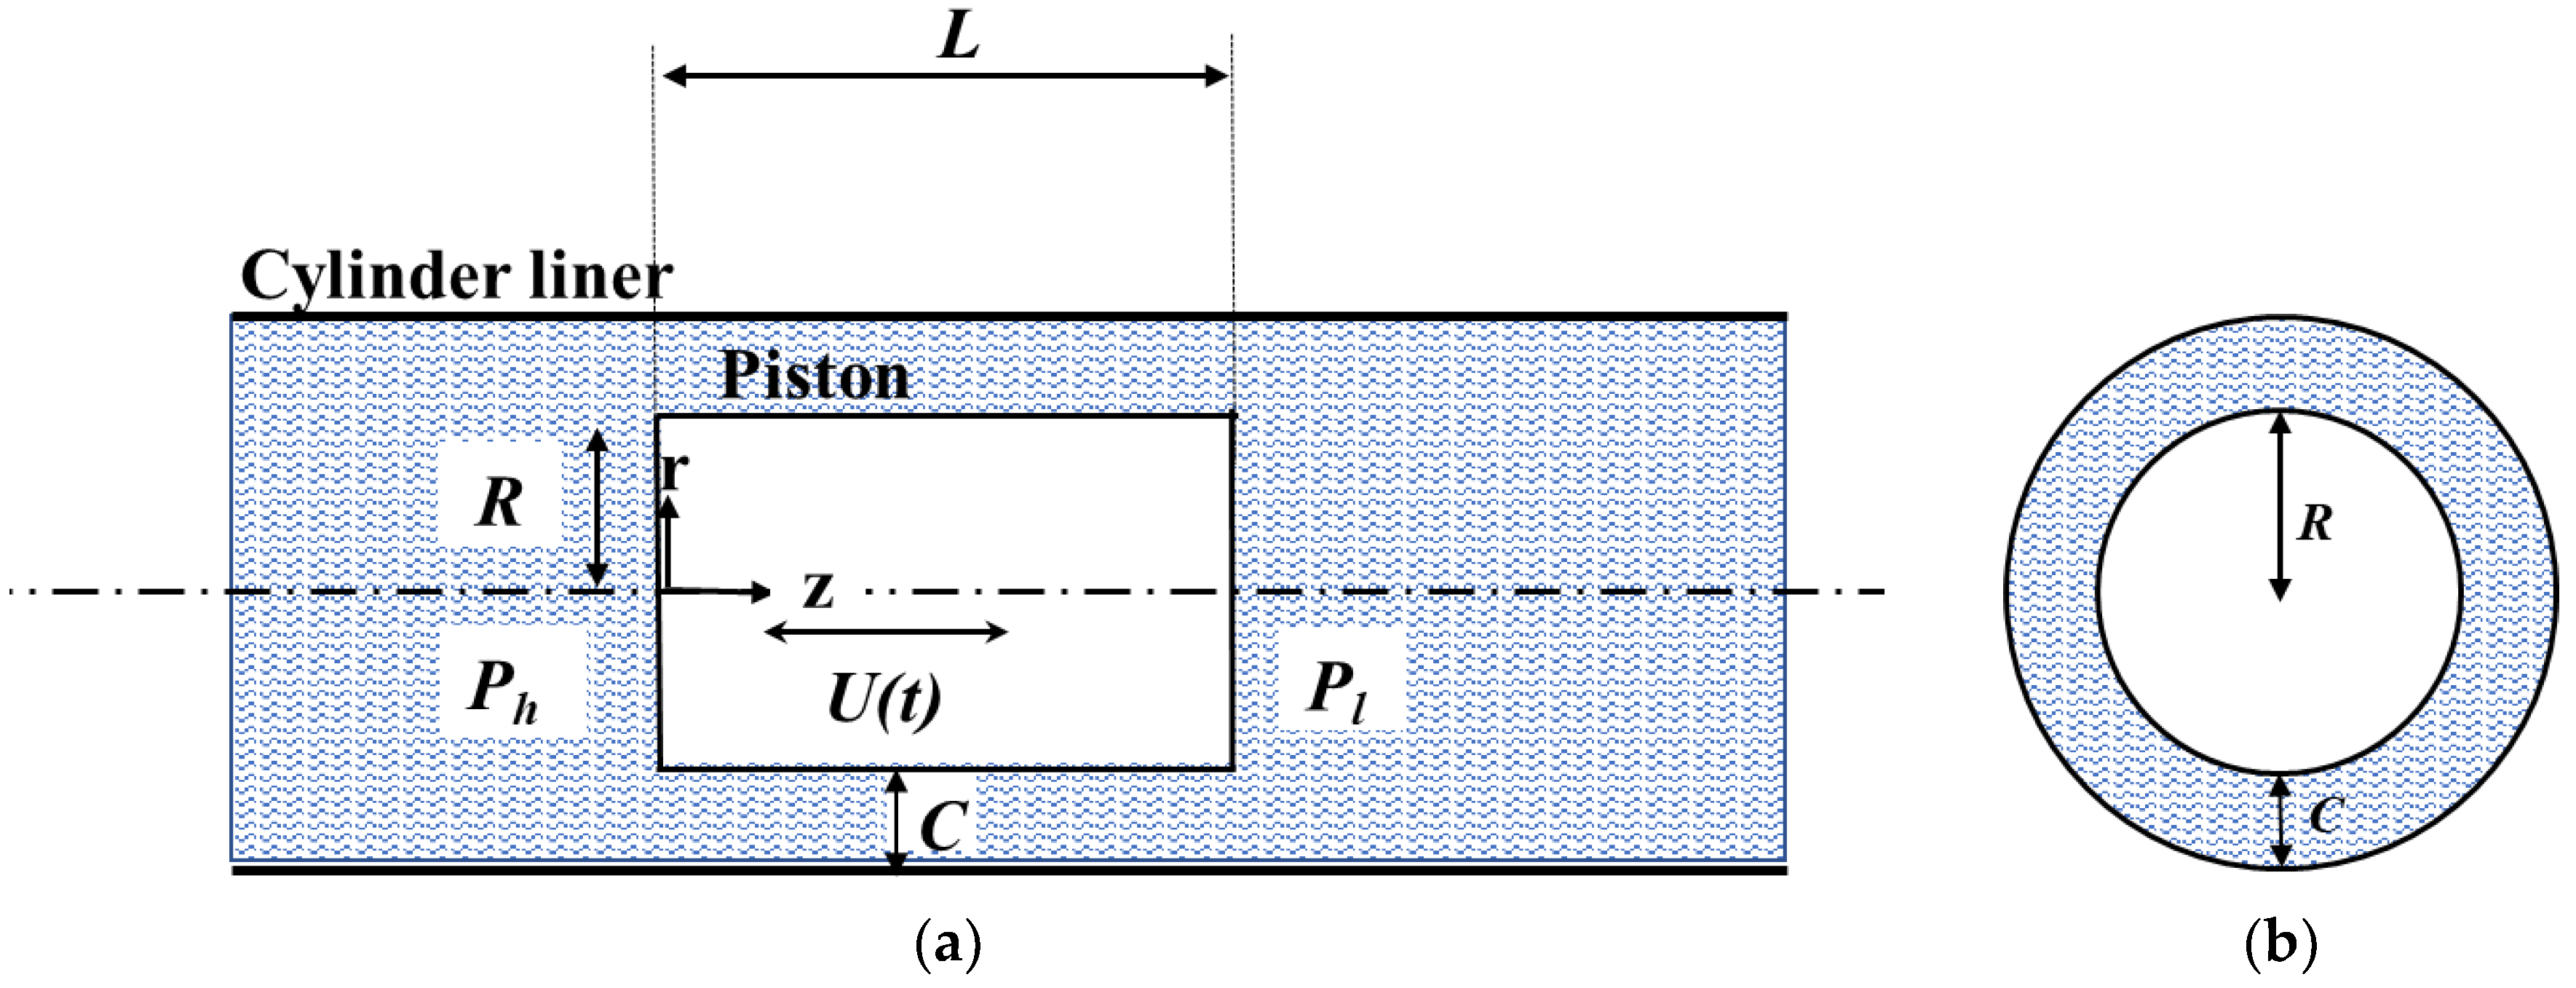
In
Figure 1, a schematic cross section of the investigated ringless piston–cylinder system is presented. The piston, surrounded by a viscous fluid, performs an axial reciprocating motion within the cylinder according to a predetermined law in time. The piston separates the high and low pressure regions of the cylinder. The parameters that describes the model are as follows:
U(t)—the instantaneous axial velocity of the piston;
Ph—the pressure at the high-pressure region;
Pl—the pressure at the low-pressure region;
∆P(Ph − Pl)—the pressure drop;
L—the length of the piston;
R—the radius of the piston;
C—the clearance between the piston and the cylinder;
z and r—the axial and radial coordinates, respectively.
In the present study, it is assumed that the secondary motion of the piston (translation and rotation) occurs in one plane only (the r-z plane). This assumption is reasonable because for small oscillations, translation and rotation in one plane do not affect motion in the perpendicular plane. Nevertheless, the geometry is not axisymmetric; therefore, the fluid flow is modeled by 3-D geometry. In addition, it is assumed that the axial motion mechanism does not enable the piston to rotate relative to its axis (about the z-axis) and that the axial motion of the piston is not affected by the piston’s secondary motion.
Based on these assumptions, the piston has two degrees of freedom, namely, radial translation and rotation around the center of mass, as presented in
Figure 2. The translation and rotation are determined by the hydrodynamic forces acting on the piston.
is the instantaneous eccentricity during the piston radial translation, and
is the instantaneous angle during its rotation. Thus,
and
are the instantaneous radial and angular velocities, respectively, of the piston.
2.1. Step Profiling and Surface Texturing
In the following, the geometric properties of the step bearing and of the partial surface texturing are presented. In
Figure 3, an axisymmetric section of a concentric stepped-profile piston and a cyclic section of a concentric textured piston are presented. The step is characterized by its length and height, which are denoted as follows:
The spherical-segment-shaped dimples of the partial surface texturing are characterized by 4 parameters:
α×L—the length of the textured zone;
rp—the radius of the dimples;
2rb—the imaginary square cell length;
hp—the dimple depth.
The imaginary square cell length and the dimple base radius determine the dimple area density,
, which was shown to have a significant effect on the tribological performance [
34]; hence, this parameter was examined in the present study.
2.2. Governing Equation
The solution process of the presented problem involves simultaneously solving two sets of coupled equations: the hydrodynamic equations for the pressure and velocity fields and the EOM for the relationship between the forces acting on the piston (due to shear and pressure differences in the fluid) and its secondary motion.
The main assumptions of the model are as follows:
The fluid flow is laminar and fully developed.
The fluid is Newtonian and incompressible with constant viscosity (isothermal—the energy equation is not being solved).
The body and gravitational forces are negligible.
The operating pressure is high, and therefore, no cavitation occurs.
No slip and no penetration conditions are applied to the surfaces.
The piston and the cylinder are rigid bodies.
Based on the abovementioned assumptions, the mass and momentum conservation equations (Navier–Stokes equations) in vector notation are given by [
35]:
where the variables are defined as follows:
The EOM describing the piston radial translational and rotation are given by:
where the variables are defined as follows:
m—the piston’s mass;
I—the piston’s mass moment of inertia;
and —the radial and angular accelerations of the piston, respectively;
F and M—the radial force and moment exerted on the piston by the fluid, respectively;
Uamp—the amplitude of the axial velocity;
f—the frequency of the axial velocity.
F and
M are calculated by integration of the instantaneous pressure and shear stress fields. A more detailed explanation of the governing equations and boundary conditions can be found in Ref. [
26].
3. Numerical Model
The numerical model that was used to obtain the full simultaneous dynamic model is described in Ref. [
26]. The commercial ANSYS Fluent 2021 R1 software was used. For more information regarding this solver, the reader is referred to [
36]. The mesh design of the fluid in the gap is presented in
Figure 4.
The outer cylindrical surface corresponds to the fluid layer adjacent to the inner surface of the stationary cylinder liner. The inner cylindrical surface is the fluid layer adjacent to the piston. The pressure inlet is denoted by
Ph, and the pressure outlet is denoted by
Pl. The mesh for each imaginary square cell has 10 × 10 elements and 8 layers in the gap, as presented in
Figure 4b. The time step for the dynamic model was 1 × 10
−5 [Sec]. Increasing the number of elements changed the results by less than 5%. Increasing the time step resulted in numerical instability. A smaller time step changed the results by less than 1%. The chosen numerical properties make it possible to obtain physical insights at a reasonable computational cost.
To apply the axial velocity, moving wall boundary conditions were employed. Generally, the moving wall boundary condition should be applied to the piston. However, despite the simplicity and efficiency of the moving wall boundary condition, it considers only the tangential velocity (see Ref. [
36]); therefore, it may not be accurate to physical reality for textured surfaces, especially for deep dimples. In our previous study [
19], we reported differences between the movement of textured and untextured surfaces based on the use of moving wall boundary conditions. However, upon further investigation, we identified that the application of these conditions in the context of piston–cylinder systems is incorrect. This new study addresses this issue by applying moving wall boundary conditions to the cylinder, which is more appropriate for the configurations involving textured surfaces.
3.1. Linear Model
To obtain the trajectory of the piston’s secondary motion, the simultaneous solution of the coupled equations should be used. However, simultaneous transient solutions require discretizing the time domain and solving the Navier–Stokes equation for each time step. The complex geometry and the numerous mesh elements that are required to model the textured piston demand expensive computational resources (a single case may take more than a month). Therefore, to study the influence of different types of texturing and to enable solutions for multiple cases in a relatively short time, a more efficient model should be used.
By assuming small perturbations and neglecting time-dependent inertia effects of the fluid (common assumptions in hydrodynamic lubrication), a linear dependency between
and the resulting force
F and moment
M can be assumed, and Equation (3) can be rewritten in matrix notation:
where
M is the mass matrix, which consists of the mass and mass moment of inertia of the piston (
M is a 2 × 2 diagonal matrix);
K is the stiffness matrix, which consists of the relationship between
and the resulting forces and moments; and
is the damping matrix, which consists of the relationship between
and the resulting forces and moments. Equation (4) can be integrated over time by using the Runge–Kutta method to obtain the trajectory of the piston’s secondary motion without the need to repeatedly solve the Navier–Stokes equation, and from that, an efficient linearized model is proposed. The linear model is validated in the Results section.
Based on the Reynolds equation, when assuming that there is no cavitation, the relation between the axial velocities, the pressure drop and the resulting force in the gap direction is linear and commutative, as shown in
Appendix A. The current numerical model shows similar results for small values of the reduced Reynolds number,
, which are within the considered range of the current study. Therefore, the stiffness matrix,
K, can be separated into two matrices:
, which denotes the stiffness matrix for a pressure drop of ∆
P without axial motion; and
, which denotes the time-dependent stiffness matrix for an axial velocity with an amplitude of
Uamp, a frequency of
f and a viscosity of μ without a pressure drop. In addition, the damping matrix,
, which is related to the squeeze effect, has a linear dependency on the viscosity and is not dependent on the pressure drop or the axial velocity; therefore, it can be expressed as μ
D Therefore, Equation (4) can be rewritten as:
For given matrices
and given values of ∆
P, μ,
Uamp, the dynamic response due to initial excitation can be achieved by integrating Equation (5) over time. The coefficients of the matrices in Equation (5) can be rewritten explicitly as follows:
The eigenvalues of the system (without axial velocity) are obtained via modal analysis. The state matrix
A can be derived such that:
where
x is the state vector of the system. The eigenvalues of the system are the eigenvalues of the state matrix
A. The stability criterion of the secondary motion (centering of the piston) is:
where
are the eigenvalues of
A. The solution of Equation (7) is a linear combination of all mode shapes (eigenvectors of
A), where the response of the ith mode shape is proportional to
. The real part of
is the decay rate of the ith mode.
3.2. Derivation of the Damping and Stiffness Coefficients
In the following, two methods for deriving the matrix coefficients are presented. The first method is based on harmonic motion, and the second method is a simplified method based on finite perturbation, neglecting inertia terms.
To derive the matrix coefficients, a harmonic radial motion,
, should be applied to the piston, which leads, according to the frequency response theorem, to a harmonic radial force and moment on the piston with phase shift,
and
. The harmonic motion can then be applied to ANSYS Fluent through a user-defined function (UDF). A similar treatment should be performed for angular harmonic motion. The forces applied by the fluid on the piston consist of inertia, damping and stiffness components; therefore, the EOM of the piston are:
where
and
are the coefficients of the inertia force matrix, which are related to the inertia of the fluid being pushed by the motion of the piston and are also known as the added mass (these parameters were neglected in the previous subsection). Substituting the harmonic motions into Equation (9) yields:
Similarly, applying harmonic angular motion,
yields:
The harmonic motion should be applied in the radial and angular directions, while a pressure drop, ∆P, or axial velocity, U, should be applied at several different frequencies, since no unique solution for the inertia and stiffness parameters can be achieved from a single frequency. The resultant forces and moments should be substituted into the LHS of Equations (10) and (11) to derive the coefficients of the matrices in Equation (6).
However, the computational resources for this approach are expensive. As an alternative, a simplified approach can be used by neglecting the inertia of the fluid (a common assumption in lubrication theory). Equation (10) becomes the following (a similar treatment should be performed for angular harmonic motion):
For the simplified approach, the stiffness and damping coefficients can be found by the instantaneous forces of the harmonic motion at two time frames: maximum movement and zero velocity, and vice versa. These time frames can be simulated with the finite perturbation method without using harmonic motion. The dynamic mesh approach was used for applying the perturbations (
) to the piston. The abovementioned CFD model was used. The matrix coefficients are found by dividing the resultant force or moment by the disturbance. A similar approach was used in [
37]. The differences in the values of the coefficients between the first approach and the simplified approach for the present study were found to be less than 1% (see [
38]), while the computation time was significantly lower (less than an hour for the simplified approach and more than a week to apply harmonic motion). These results also indicate that the neglect of the time-dependent inertia effects in the present work is justified.
4. Results
In the following, the normalization method and the linear model, which are used to obtain multiple results and to generalize the results, are validated. In addition, by using the linear model and the normalization method, the stability of the secondary motion of the piston, for different geometries and operating conditions for various texturing parameters and step profiling is analyzed. The ranges of the examined parameters for the current study are as follows:
;
;
;
;
.
The dimples’ parameters are in accordance with [
16].
4.1. Validation of the Normalization Approach and Linear Model
In the following, the normalization method that enables generalization of the results is presented and validated. The normalization is based on the characteristic parameters which are as follows:
U0—the reference axial velocity;
T—the reference piston vibration cycle time;
∆P*—the reference pressure drop.
The characteristic parameters are used to normalize the dimensional parameters of the velocity, time and pressure, and from that, a universal solution in terms of
and
can be obtained. In addition, the dimensionless parameter
, which is the reduced Reynolds number, is presented. These parameters were developed in [
26].
The reference axial velocity,
U0, and the characteristic value of the piston’s radial vibration cycle time,
T, are given by [
26]:
Extensive simulations have shown that the characteristic pressure,
, can be obtained as follows:
The meaning of the characteristic pressure is that the same ratio of yields the same normalized dynamic response.
The reduced Reynolds number,
, for the present study is given by [
26]:
Numerical simulations showed (see [
38]) that values of
do not affect the results; therefore, the current study is limited to this range.
The normalization method for a stepped-profile piston was validated in [
26]. To demonstrate the validity of the suggested normalization method for a partially textured piston, solutions for different fluid parameters and geometries (with the same normalized parameters) were calculated using the linearized model. The fluid and geometry parameters for three different example cases are presented in
Table 1. All the cases have the same normalized parameters,
and
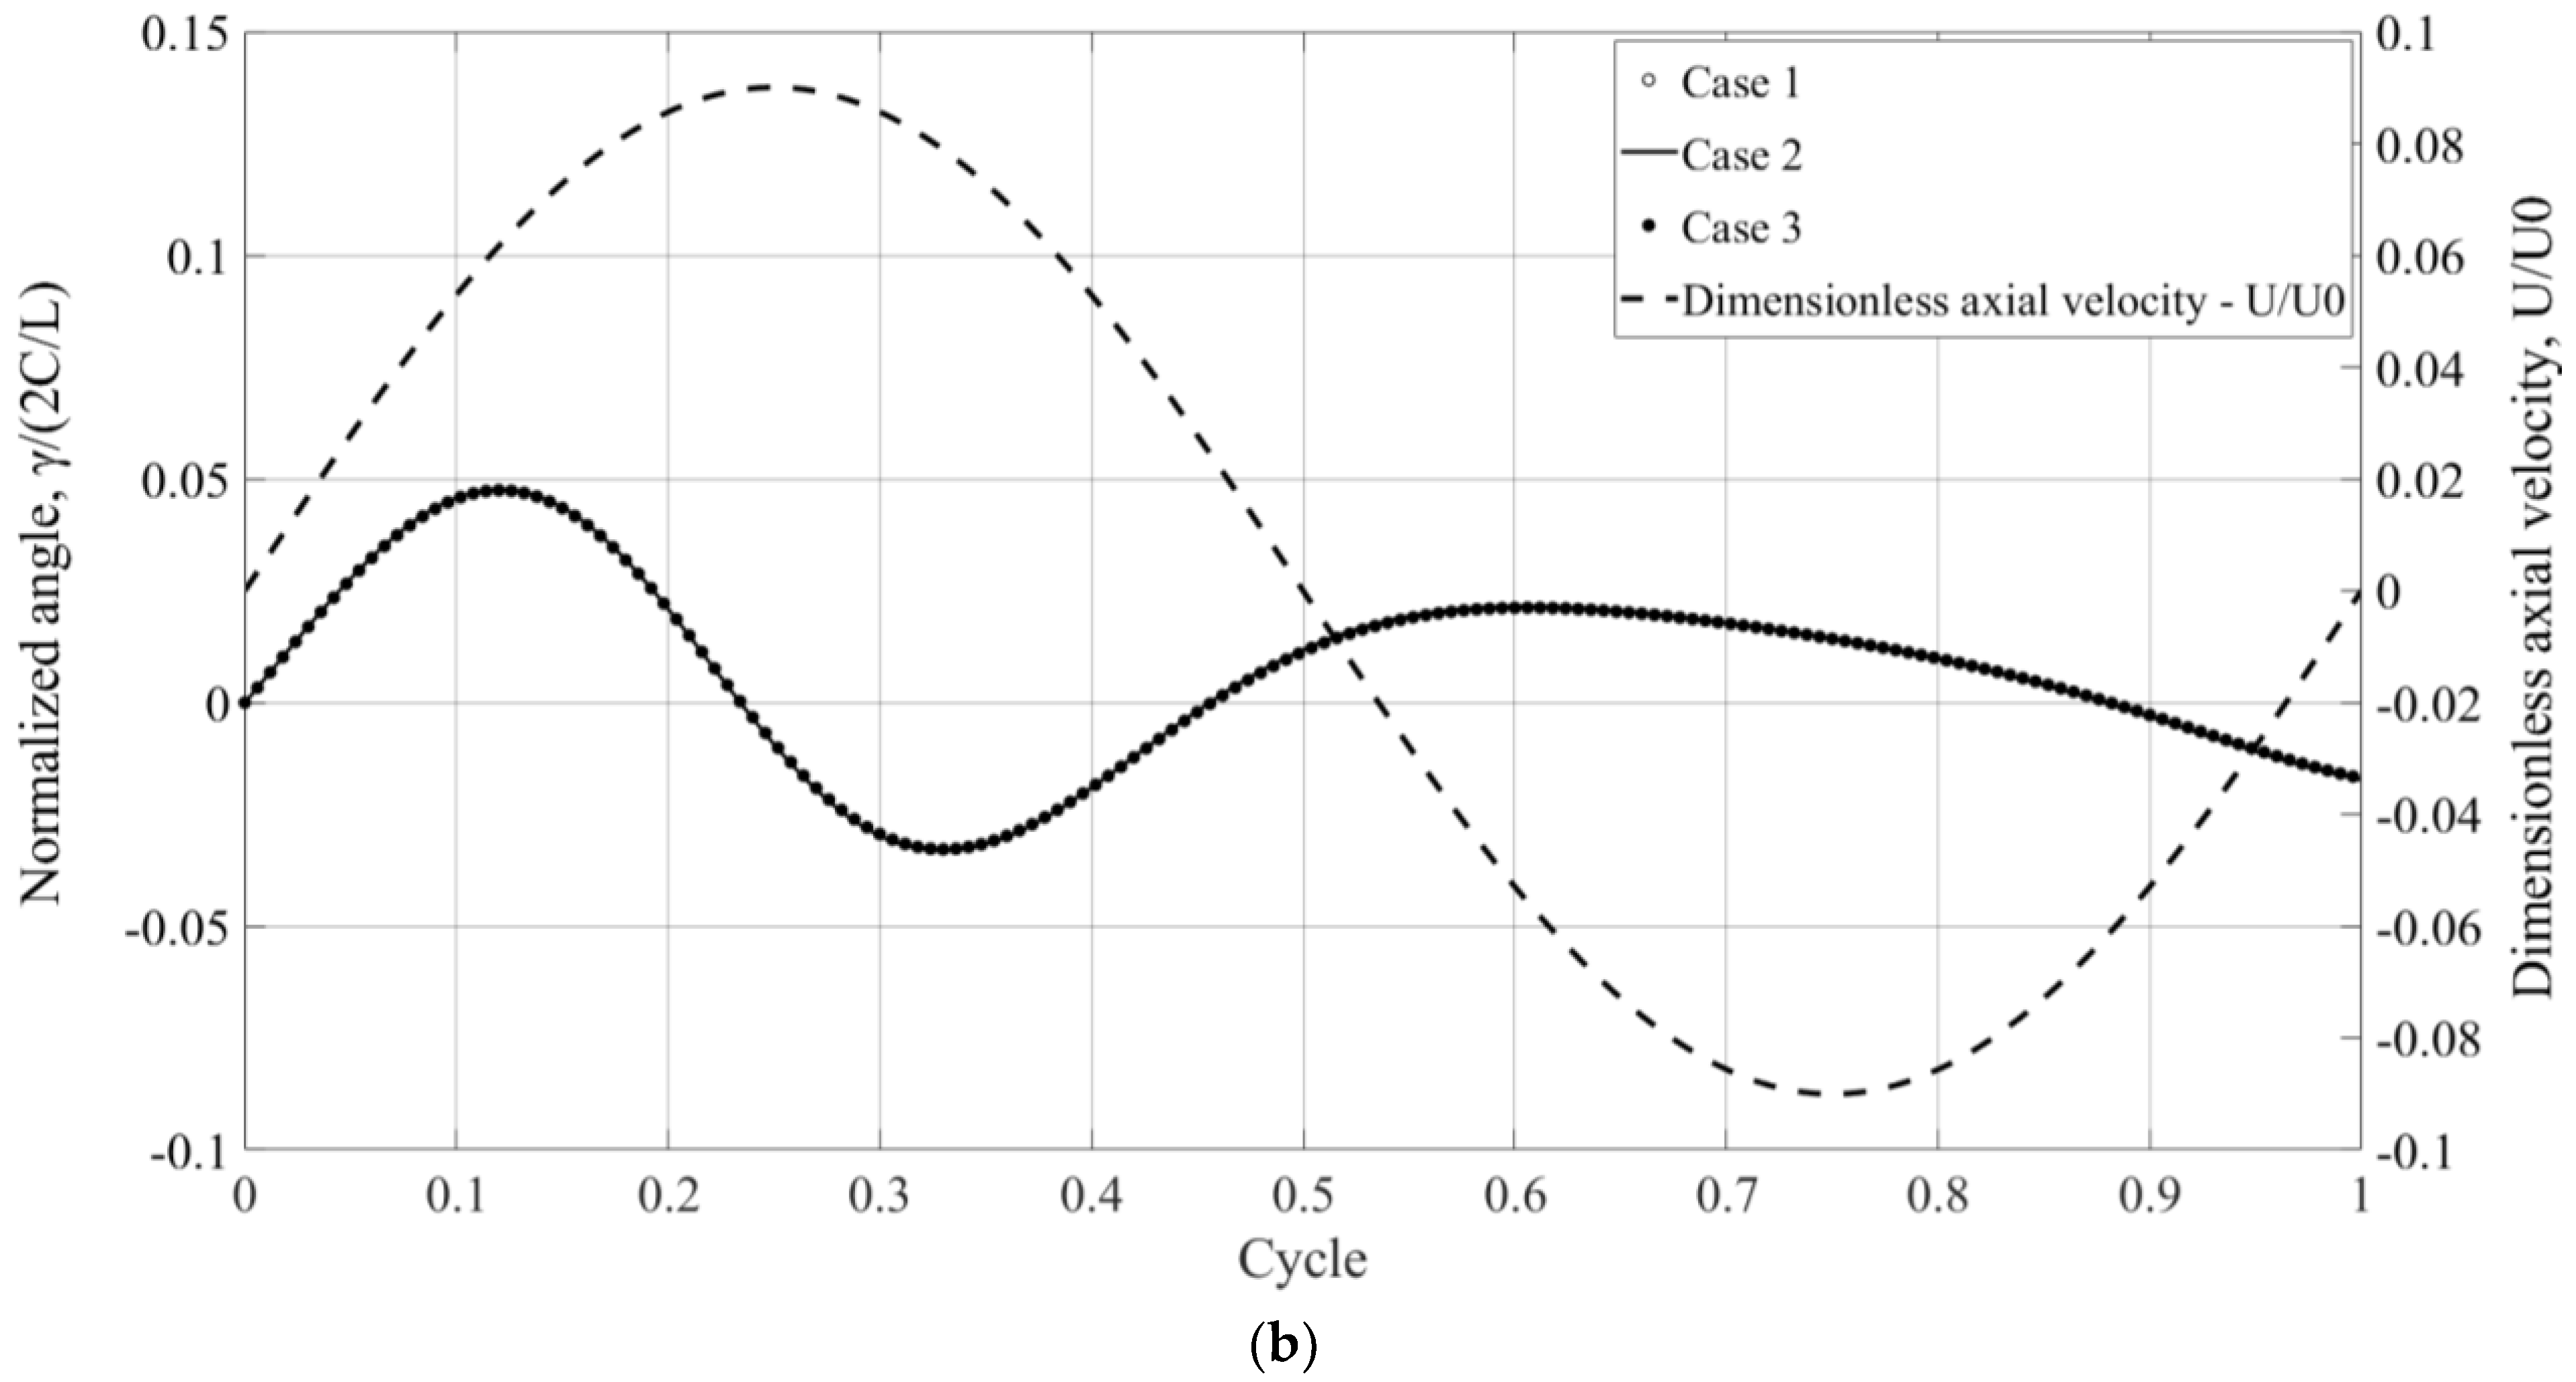
. The parameters of the texturing (relative to the other geometric parameters) were kept constant. The variations in time of the normalized radial eccentricity and angle for an initial radial eccentricity of 0.3 for the different cases are presented in
Figure 5. The time scale was normalized according to the cycle time of the axial velocity of the piston. The radial eccentricity was normalized according to the clearance and the angle was normalized according to the maximum geometrical angle—
. The axial velocity was normalized according to
U0 and is presented by the dashed line related to the secondary vertical axis. Cases 1, 2 and 3 are represented by the white circle markers, solid line and black circle markers, respectively. Despite the different dimensions of the geometric features and operating conditions, the difference between the normalized solutions is less than 1%; therefore, it can be concluded that the normalization approach is valid. Further numerical analysis showed (see also [
26,
38]) that while the normalized results are not sensitive to
m, μ, ∆
P or
U (it can also be shown from the linearity of Equation (6)), they are valid only for high
ratios (see [
26]). Further numerical results indicate that for step bearings, the normalization method is valid for
, while for partial texturing, it is valid for
(see [
38]).
Since the normalization method is valid, a smaller radius can be used. Based on Equation (14), decreasing the radius by a factor of 10 and the mass by a factor of 1000 will yield the same normalized results. Therefore, to save computation time (fewer dimples and, hence, fewer mesh elements in the circumferential direction), R = 0.002 [m] was used in all the subsequent results of the present work.
To validate the linearized model for secondary motion, the full simultaneous model was used. A comparison between the models is presented in
Figure 6. The results are presented in terms of the minimum piston–cylinder gap, which varies over time. This gap represents the closest distance between any point on the piston and the cylinder wall. Since the minimum gap depends on both radial eccentricity and rotational motion, it is not fixed at a single point on the piston. The gap can range from 0 (indicating contact) to 1 (indicating a concentric position). The full simultaneous solution and the linear solution are presented by the solid and dot-and-dash lines, respectively. The axial velocity is presented by the dashed line related to the secondary vertical axis. The differences are small (less than 5% difference in the time period of the oscillations and less than 1% difference in the peak value of the oscillation); therefore, the linearized model is reasonable and can be used for the stability analysis. As for the computation time, a single case of simultaneous solution takes more than two weeks, while the computation time of the linear model is a few seconds.
4.2. The Form of the Stiffness Matrix
In the following, a numeric example for and D is presented. In addition, the general form of the stiffness matrices is discussed and an example for the root-locus map is presented.
For the parameters that are presented in case 1 (see
Table 1), the stiffness and damping matrices obtained from the CFD model are:
All the units are in MKS (they are different for each term; see Equation (6)). The matrices of Equation (16) can be used to obtain the trajectory of the secondary motion for any ∆
P, μ,
Uamp (see Equation (5)) for a given initial perturbation and to generate stability maps. The values of the matrix terms in Equation (16) are affected by the geometry of the piston and by the texturing or step parameters. However, since the results in this study are presented in dimensionless form, the values of the matrix terms for the other cases are not presented. Generally,
(see Equation (6)) and the damping matrix are quite insensitive to the texturing and the step, unlike the other terms, which are significantly more sensitive. For an untreated piston,
, and the secondary motion is unstable regardless of ∆
P, μ,
Uamp (see [
10]).
From Equation (16), it can be noticed that the cross-coupled stiffness coefficients (the terms on the secondary diagonal) are high relative to the direct stiffness coefficients. In addition, the cross-coupled stiffness coefficients have opposite signs. While, for most mechanical systems, the stiffness matrix is symmetric, non-symmetric stiffness matrices can be found, for instance, in journal bearings (see [
39]) and robotic grasps [
40]. To explain the opposite signs of the cross-coupled stiffness coefficients, an illustration of the perturbations and the resultant forces and moments is presented in
Figure 7. For radial eccentricity (see
Figure 7a), the center of pressure (the average location of all of the pressure acting on the piston) is close to the end of the texturing zone. This is because the local pressure increase due to eccentricity at the end of the texturing zone is maximal. Hence, when the textured portion is below 50%, the moment’s direction is positive, e.g.,
is positive. On the other hand, a positive angle leads to converging clearance (in the direction of the axial velocity, from left to right) on one side and diverging clearance on the other side; therefore, the direction of the force is negative, e.g.,
is negative. In addition to the non-symmetry of the stiffness matrix, it is also time dependent (due to the time-dependent axial velocity). To the best of the authors’ knowledge, a non-symmetric time-dependent stiffness matrix is unique to this study. It yields unique stability maps, which are presented in the upcoming subsection.
4.3. Modal Solution
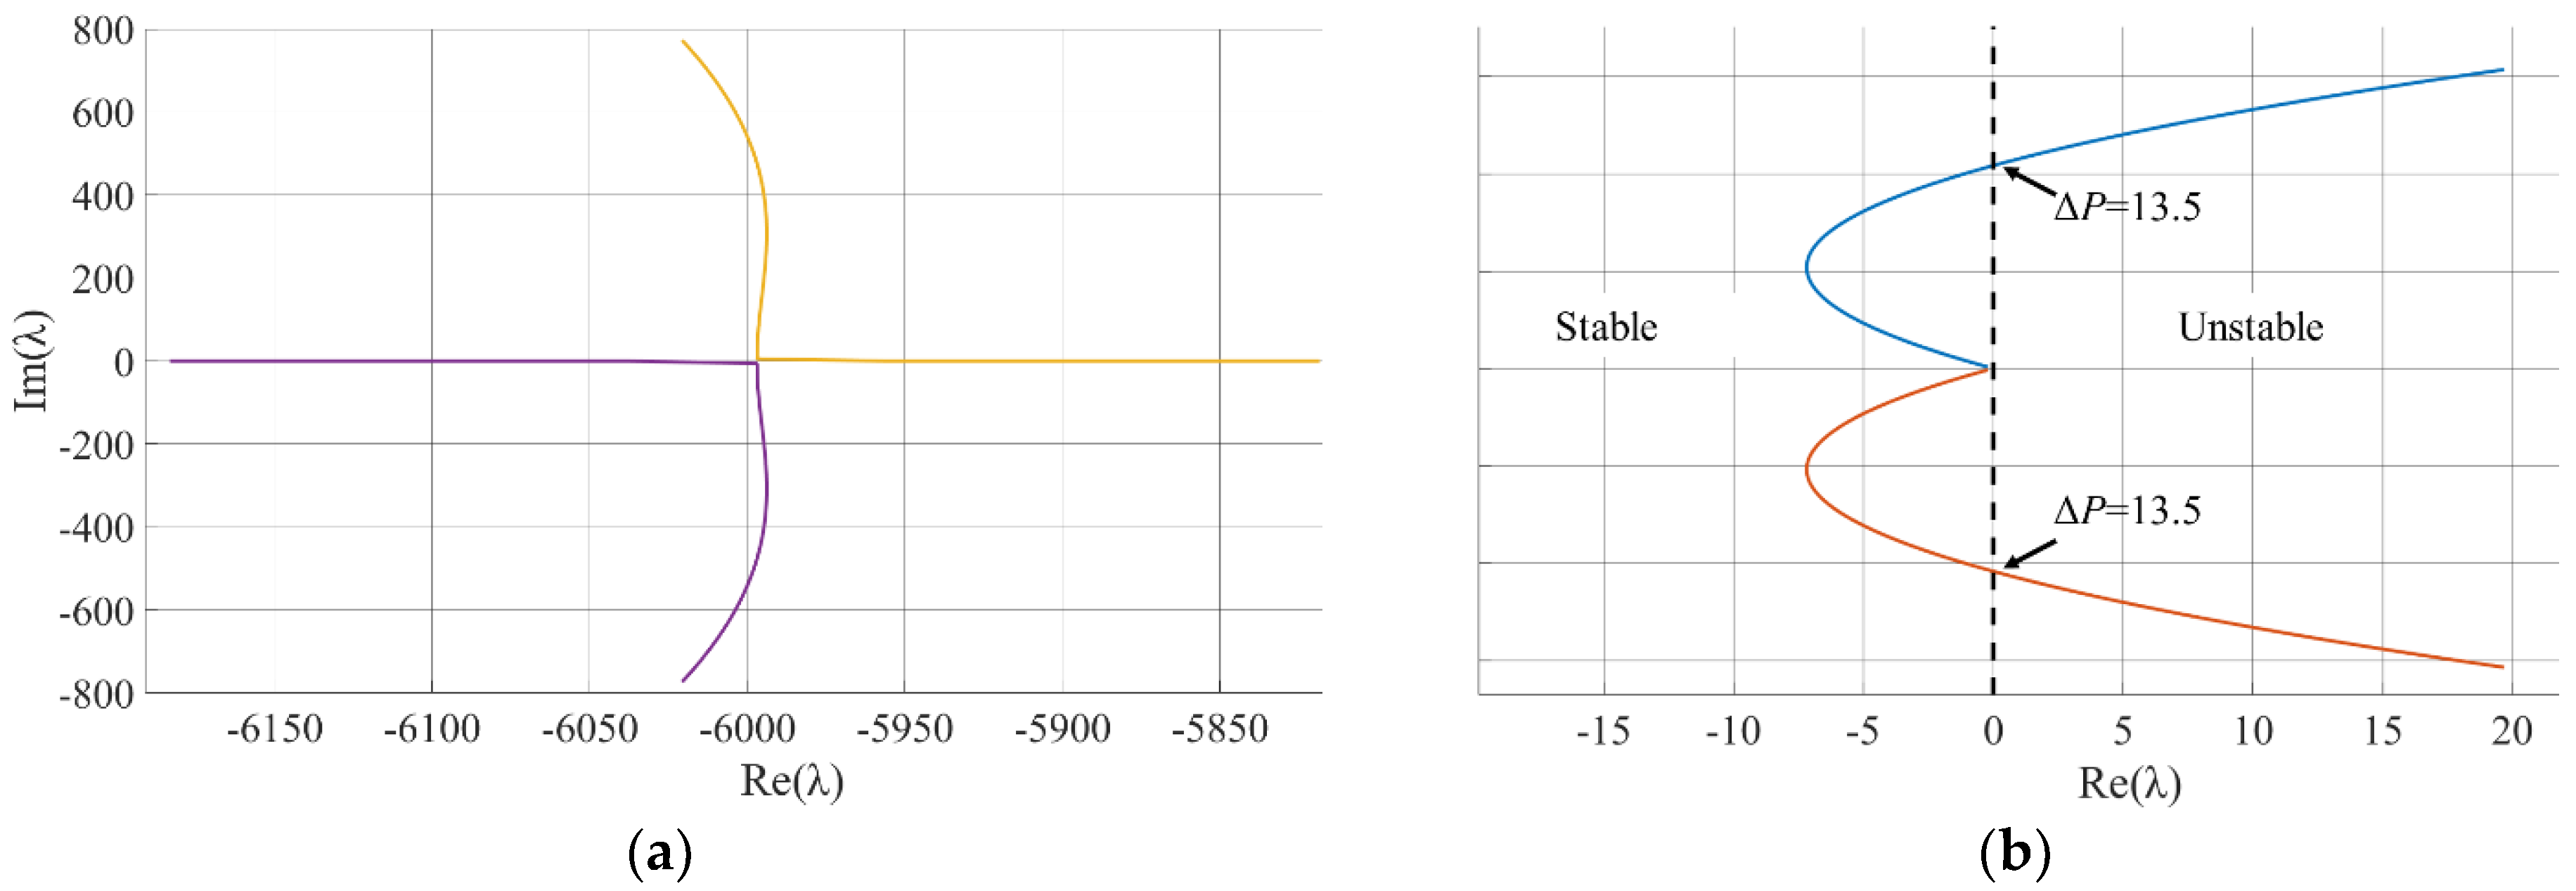
In
Figure 8, a root-locus map for the considered parameters with varying Δ
P is presented (without axial motion). For convenience, the map is divided into two parts. Each pole is presented by different color. It seems that there are two poles (eigenvalues of the state matrix
A) with high negative real parts, which means that their corresponding eigenvectors are damped very quickly, and, hence, are outside the scope of our interest in the current study. On the other hand, there is a composite pole with a real part that is close to zero, and it becomes unstable (positive real part) for
. The instability of the system is due to relatively low damping (which is unaffected by pressure). Since the left poles dampen very quickly, the natural frequency of the piston is determined only by the imaginary part of the right poles (the upcoming results that discuss the decay rate and the natural frequency refer to the right pole)s. The corresponding mode shape (the two first terms) of the right poles for Δ
P = 10 [MPa] is [−2.5 × 10
−5 ± 2.7 × 10
−6i; 1 × 10
−4 ± 0.0032i].
4.4. Influence of Step Parameters
In the following, the influence of different step parameters (length and depth) are examined. For convenience, the step depth is presented in dimensionless form as follows: . The parameters were compared in terms of the stability range for low axial velocities that are negligible in comparison to the pressure drop () obtained by using modal analysis. They were also compared in terms of the stability range for high amplitudes of the velocity and the stability range for low frequencies obtained by Floquet theory.
The ranges of the examined parameters for the current study are as follows:
0.1 < α < 0.3;
1.04 < β < 1.2.
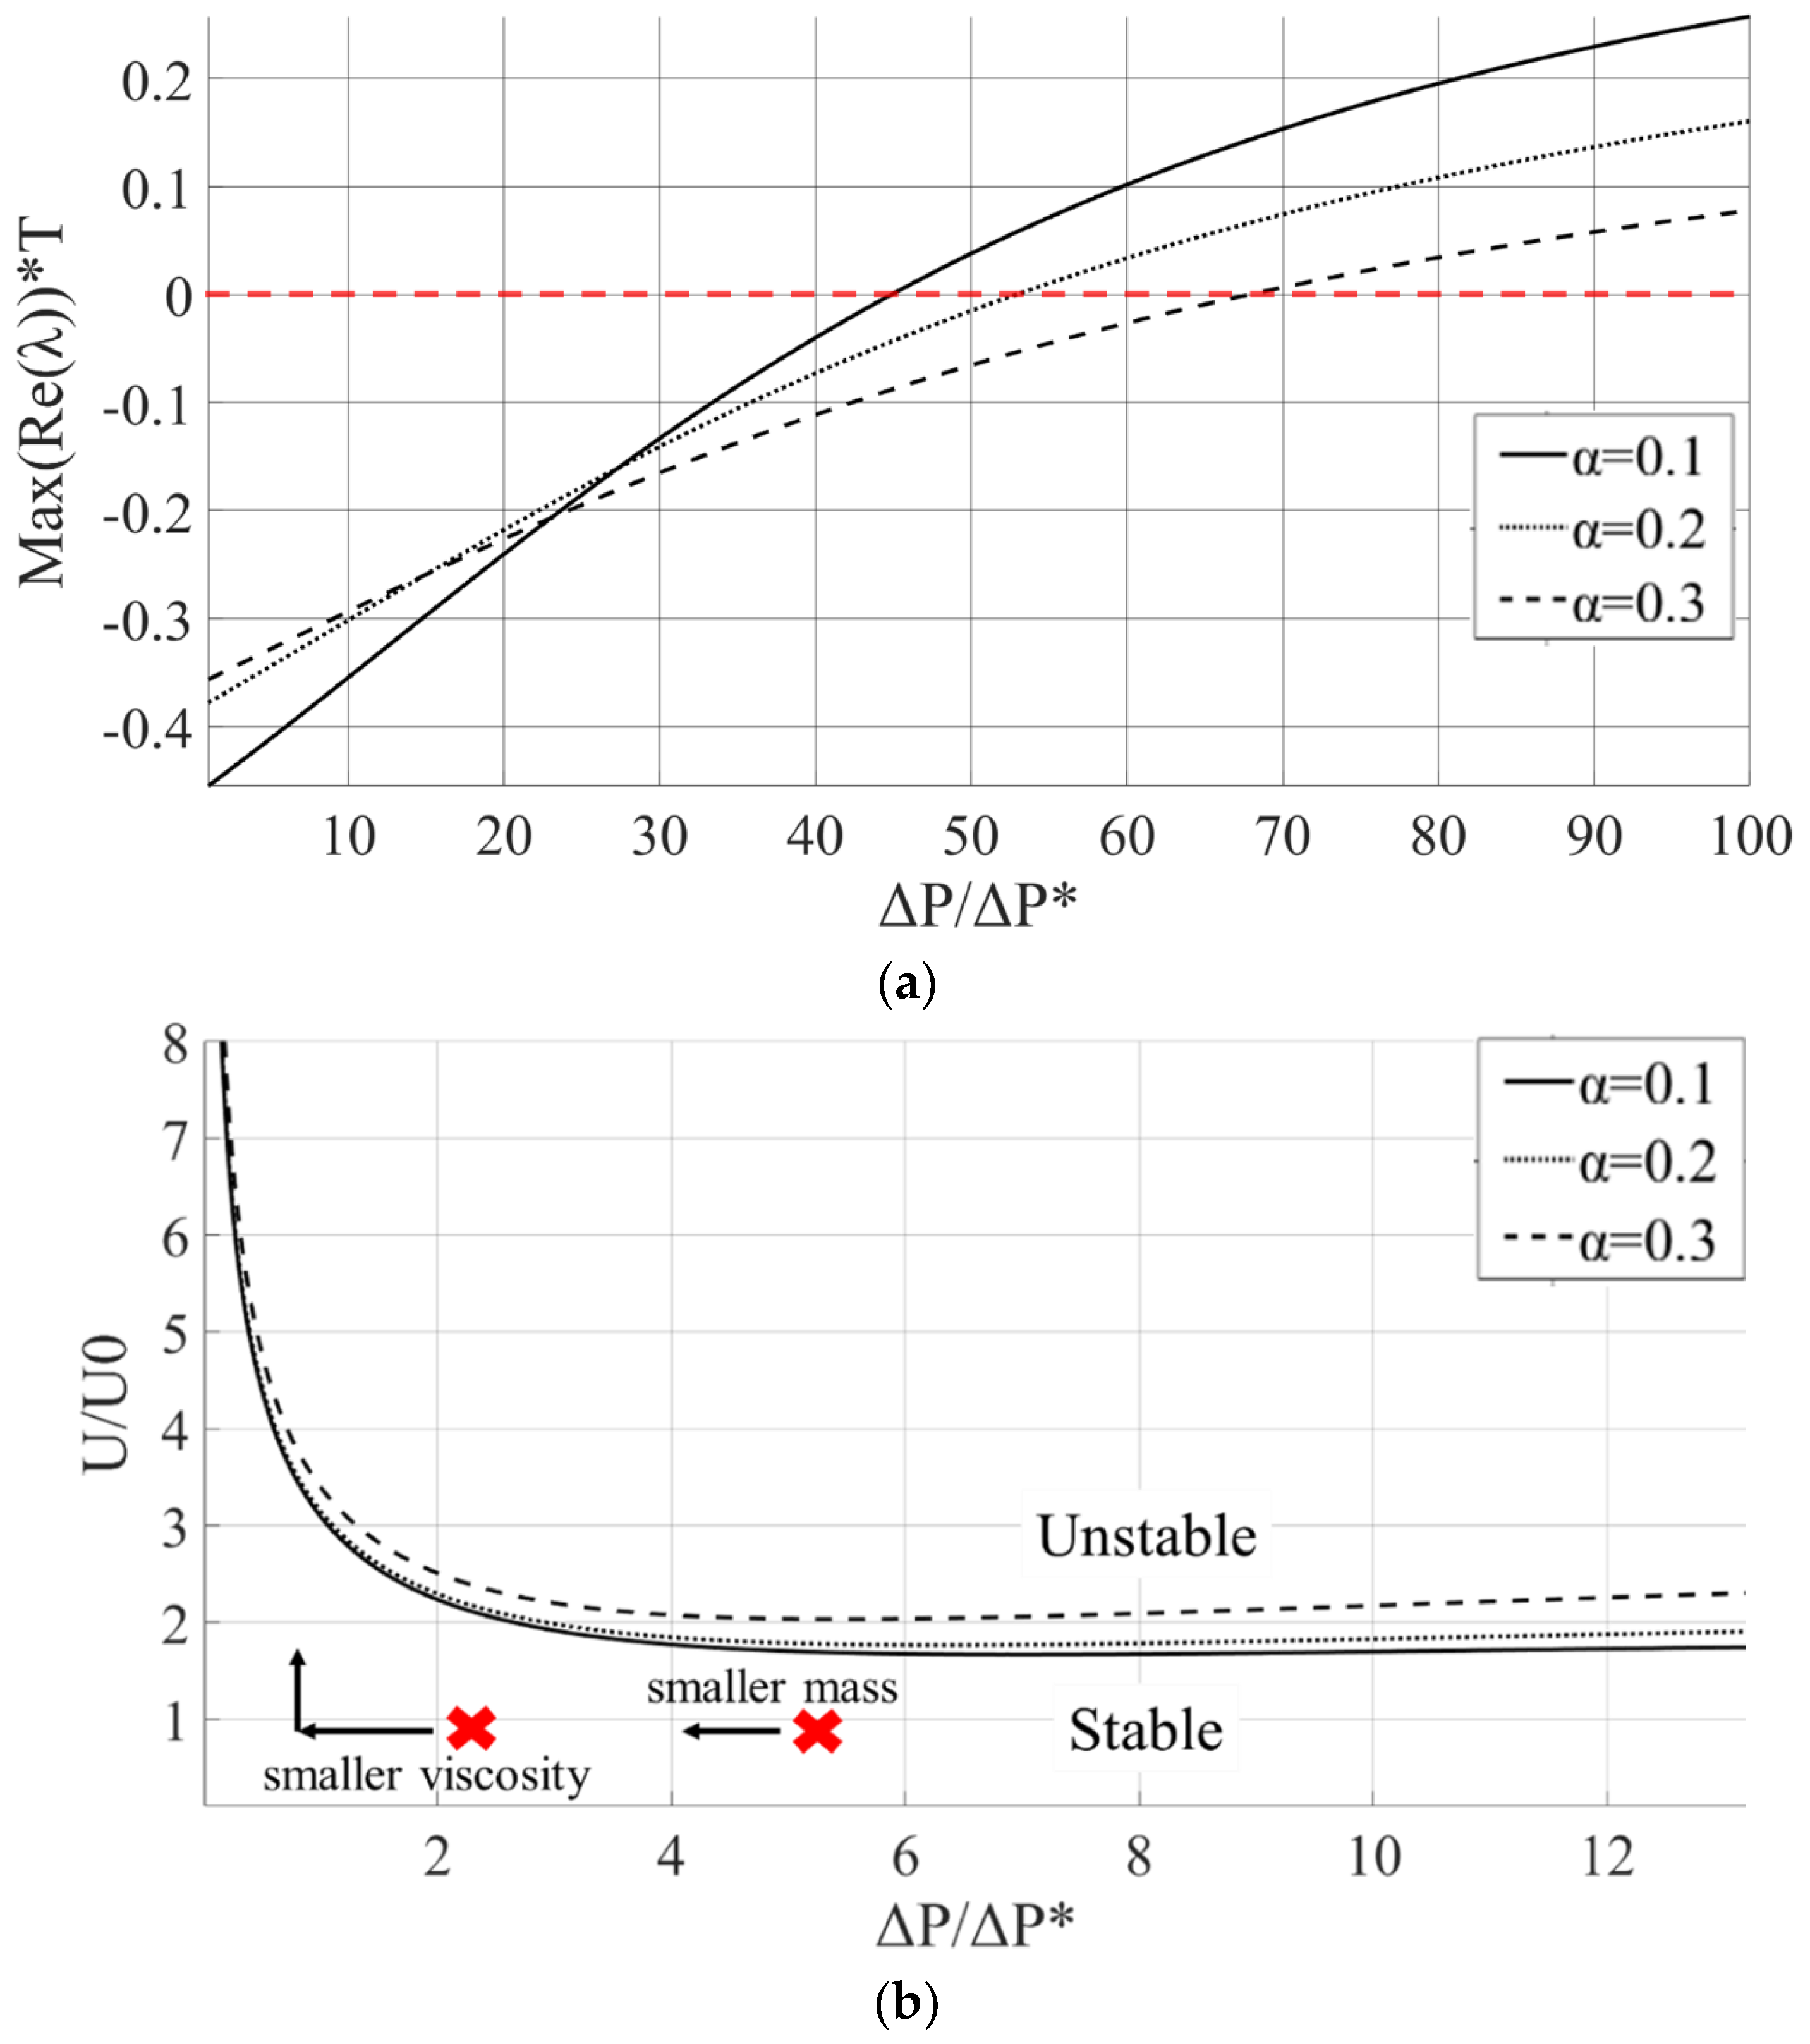
Figure 9 and
Figure 10 present a comparison between different step lengths (0.1 < α < 0.3) for a dimensionless depth of β = 1.1.
Figure 9a presents the maximum real part of the eigenvalues (decay rate), normalized by the radial vibration characteristic time,
T, as a function of
, for the case without axial velocity. The solid, dashed and dotted lines indicate the different values of α, and the dashed red line indicates the stability threshold,
.
Figure 9a shows that the secondary motion remains stable for a wide range of parameters at low axial velocities. For low values of
, lower values of α (among the considered parameters) result in faster convergence as the decay rate increases. The ratio
depends on various parameters (see Equation (14)). However, the most significant parameter is the radial clearance,
C, for instance, for the considered parameters in [
10], in which
and
, and for the considered parameters in [
26], in which
and
. Generally, for
,
for a wide range of parameters. For higher values of
(which can be found especially for relatively large clearances), higher values of α result in better convergence (faster convergence and a wider range of stability).
Figure 9b shows the dimensionless stability maps in the
plane for different values of α and
f = 10/
T (for
, the results are not sensitive to
f). The solid, dashed and dotted lines indicate the threshold values of stability. Based on
Figure 9b, it appears that higher values of α result in better convergence, as the secondary motion is stable for higher values of the axial velocity. In addition, in
Figure 9b, it is demonstrated how a universal solution can be obtained. According to Equations (4) and (8), reducing the mass,
m, leads to an increase in
, and therefore, the normalized pressure decreases. In addition, increasing µ leads to an increase in
and a decrease in
, as depicted by the arrows in
Figure 9b. It can also be noted from Equation (5) that while increasing µ leads to increased damping and therefore increases the stability, it also leads to an increase in the parametric excitation,
, which may lead to instability. Similarly, the influence of the other parameters on the stability can be examined. For some cases, changing one of the parameters can cause a stable case to become unstable.
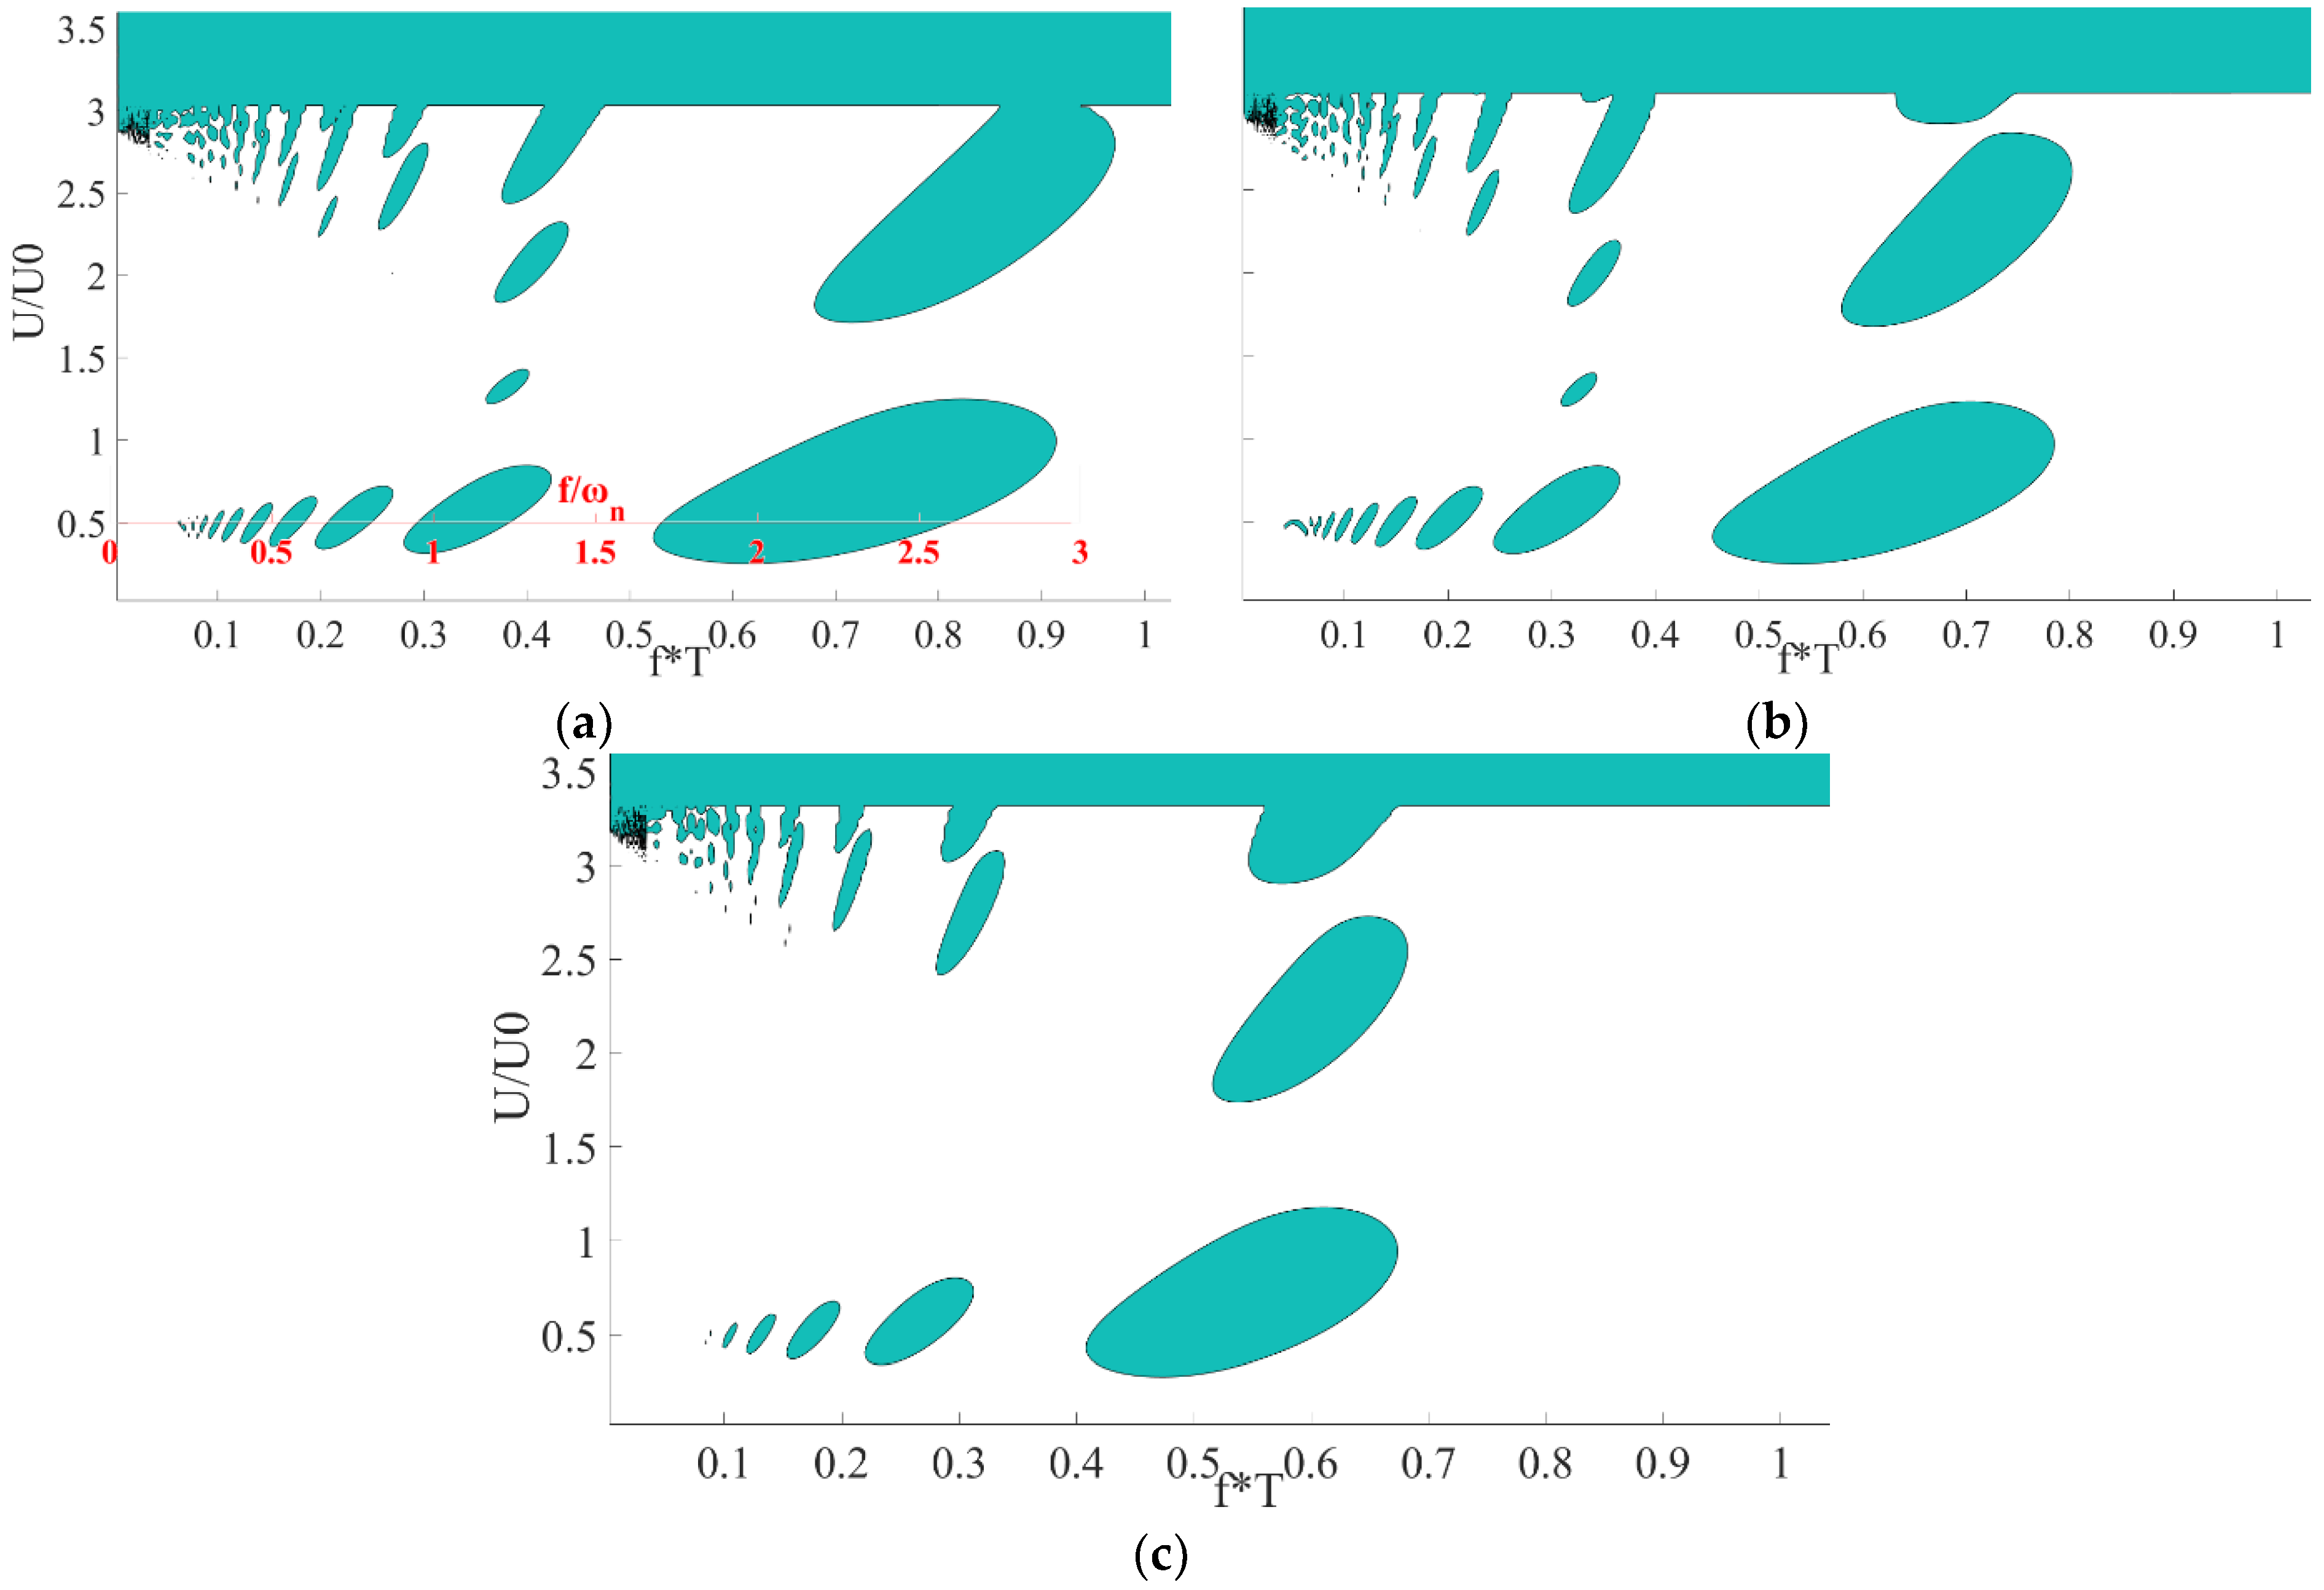
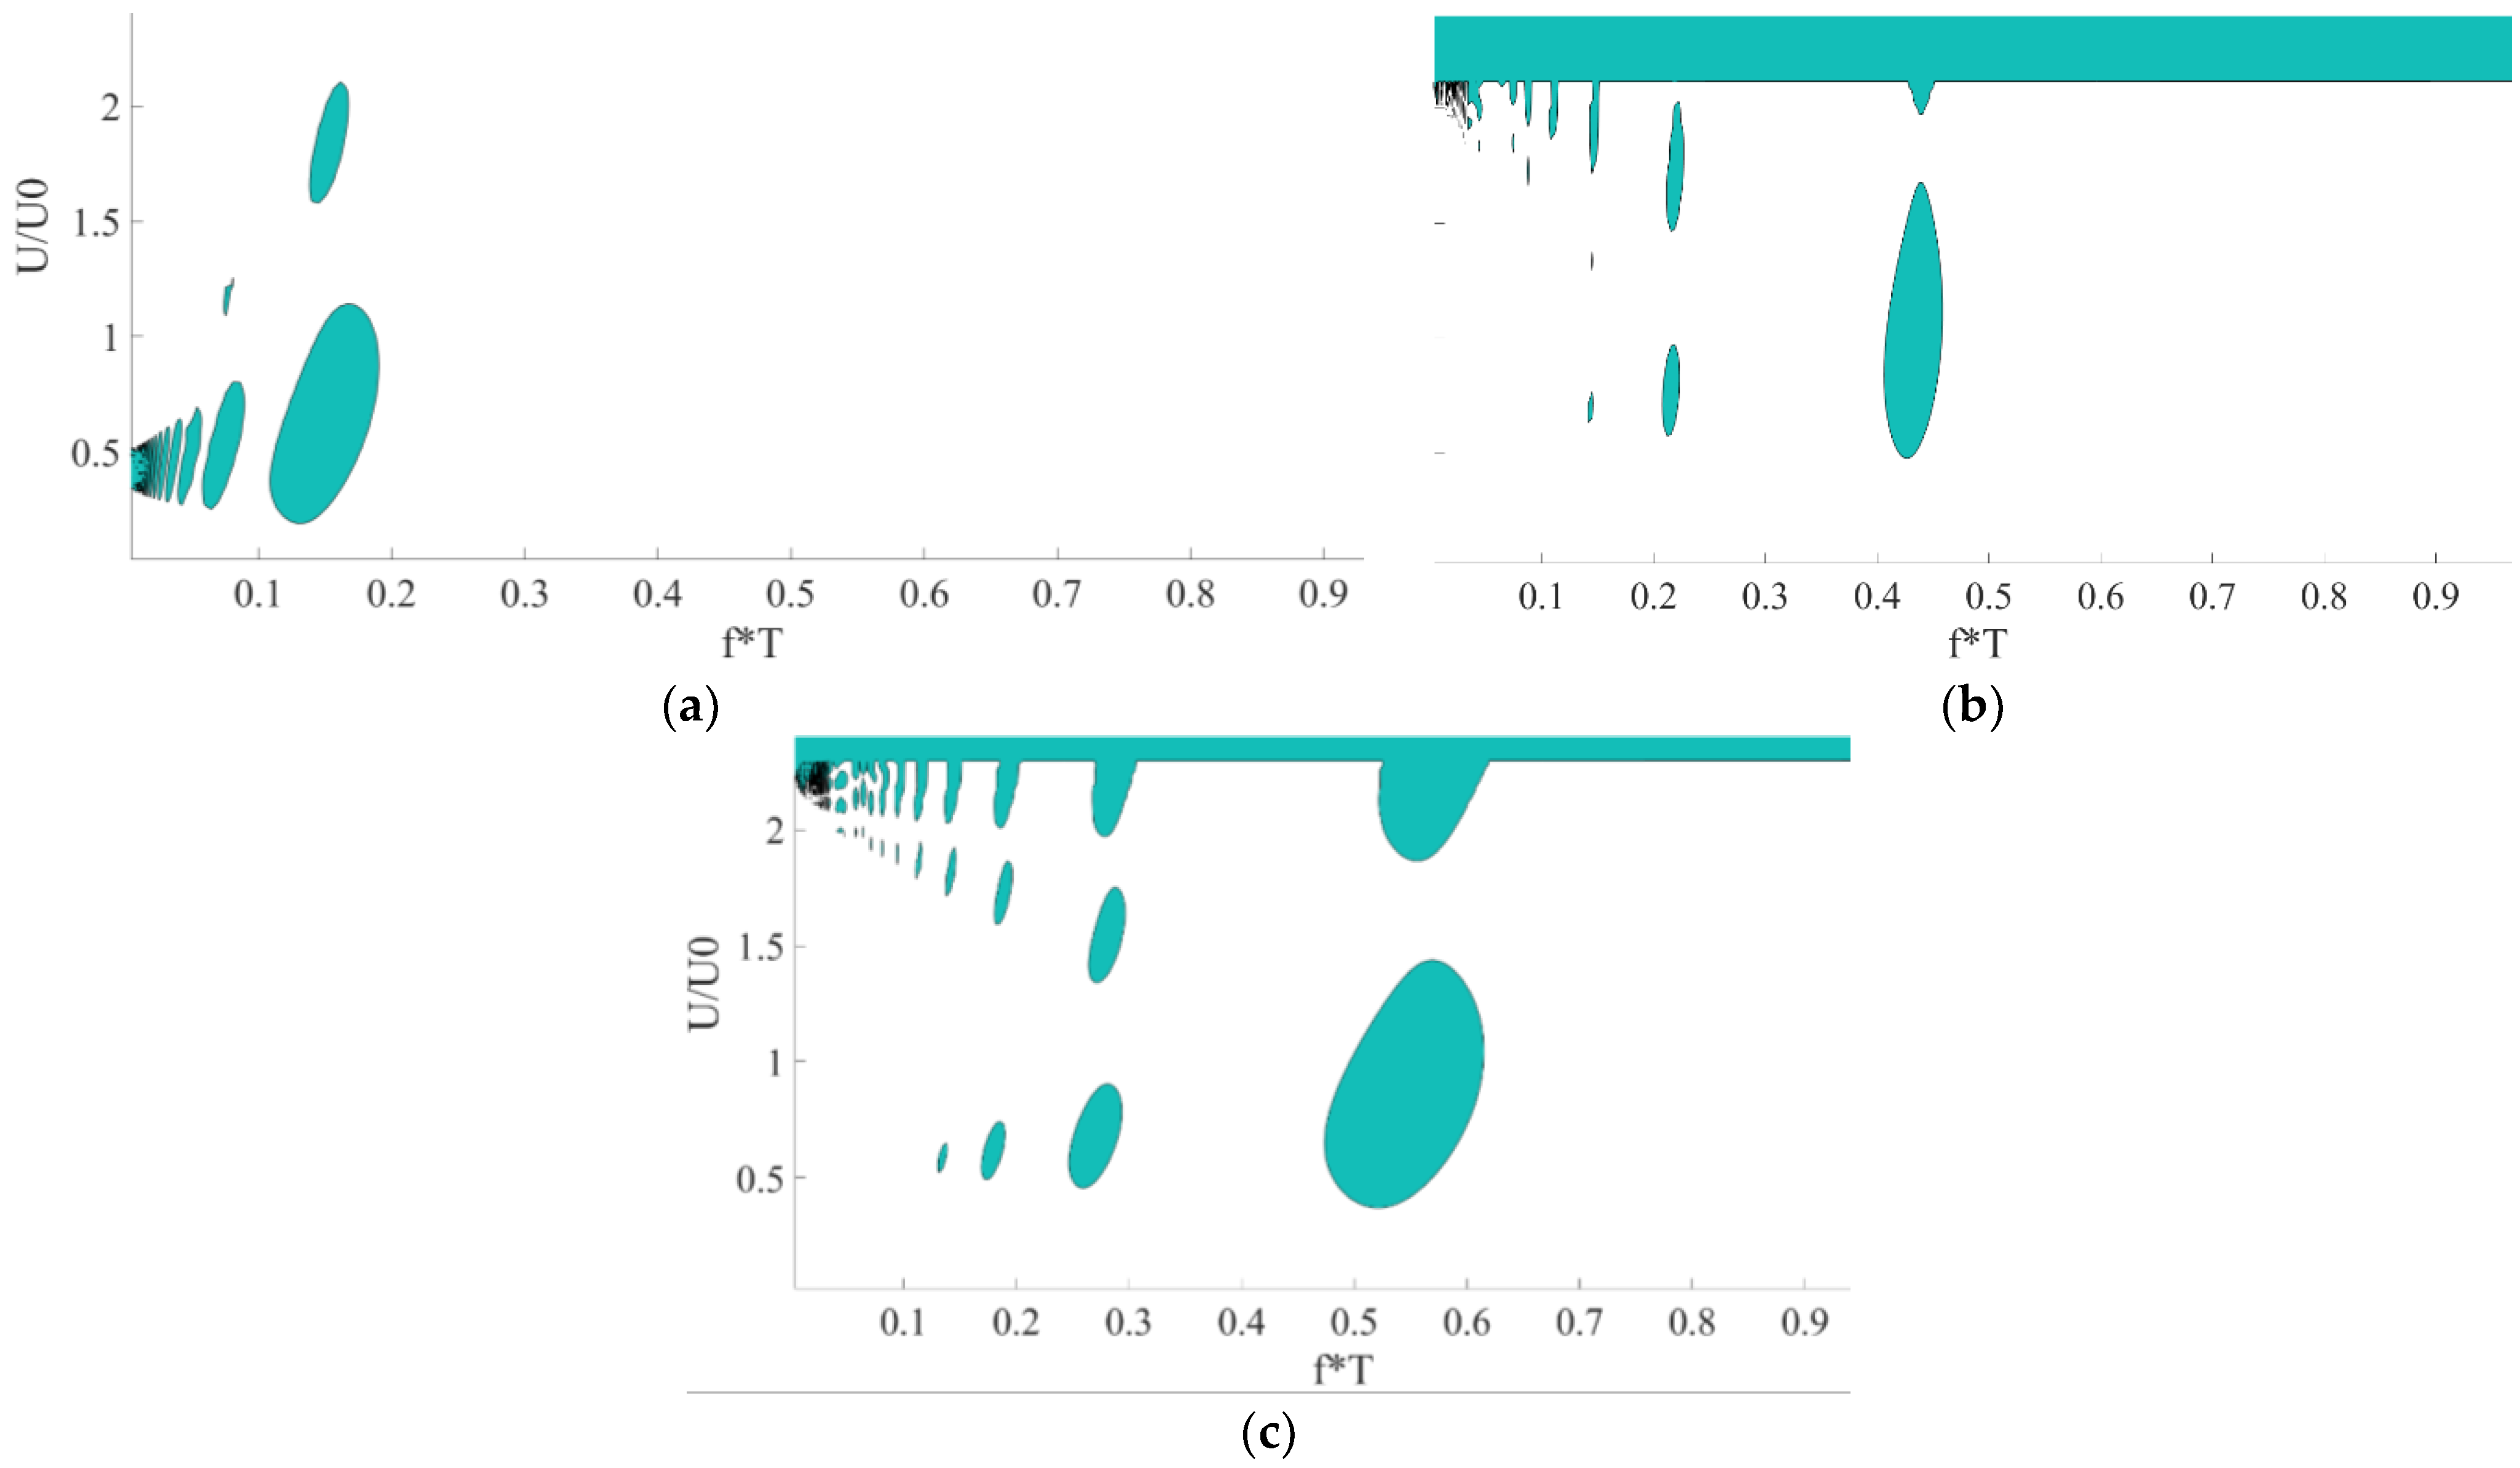
Figure 10 presents stability maps (Strutt diagrams) in the
plane for
for different values of α. The results show a unique phenomenon, derived from the non-symmetry of the stiffness matrix described above, of bubble-shaped areas of instability. Usually, Strutt diagrams are presented as the magnitude of the parametric excitation vs. the frequency, normalized by the natural frequency. However, since different values of α result in different natural frequencies and to enable generalization of the results, the frequency of the axial velocity,
f, is normalized according to
T, which is not dependent on the texturing or the step, and not according to the natural frequency. In our previous study (see Ref. [
26]), it was shown that
T is on the same order of magnitude as the natural frequency, which can be derived from the imaginary part of the right pole of matrix
A. For all the results of the current study, the largest area of instability (the column of bubbles furthest to the right) is around twice the natural frequency (principal parametric resonance) as expected, and the second from the right column is around the natural frequency, as depicted on the secondary x-axis of
Figure 10a. For smaller frequencies, multiple columns appear without any noticeable pattern, and for higher frequencies, there are no bubbles at all (a wider range than presented, up to
, was examined). These results (as well as the instability bubbles) are not compatible with other Strutt diagrams from the literature.
Further numerical results (see [
38]) indicate that the frequencies of the axial velocity at which the bubble phenomenon occurs do not depend on
.
Figure 10 shows that instability bubbles appear at relatively low frequencies (
), especially around
. For now, an explanation for this value was not found, and it should be addressed in the future. The results show, for the considered parameters, that the range of instability (frequencies and amplitudes of the velocity) decreases as α increases; therefore, for low frequencies and for the considered parameters, higher values of α are more stable.
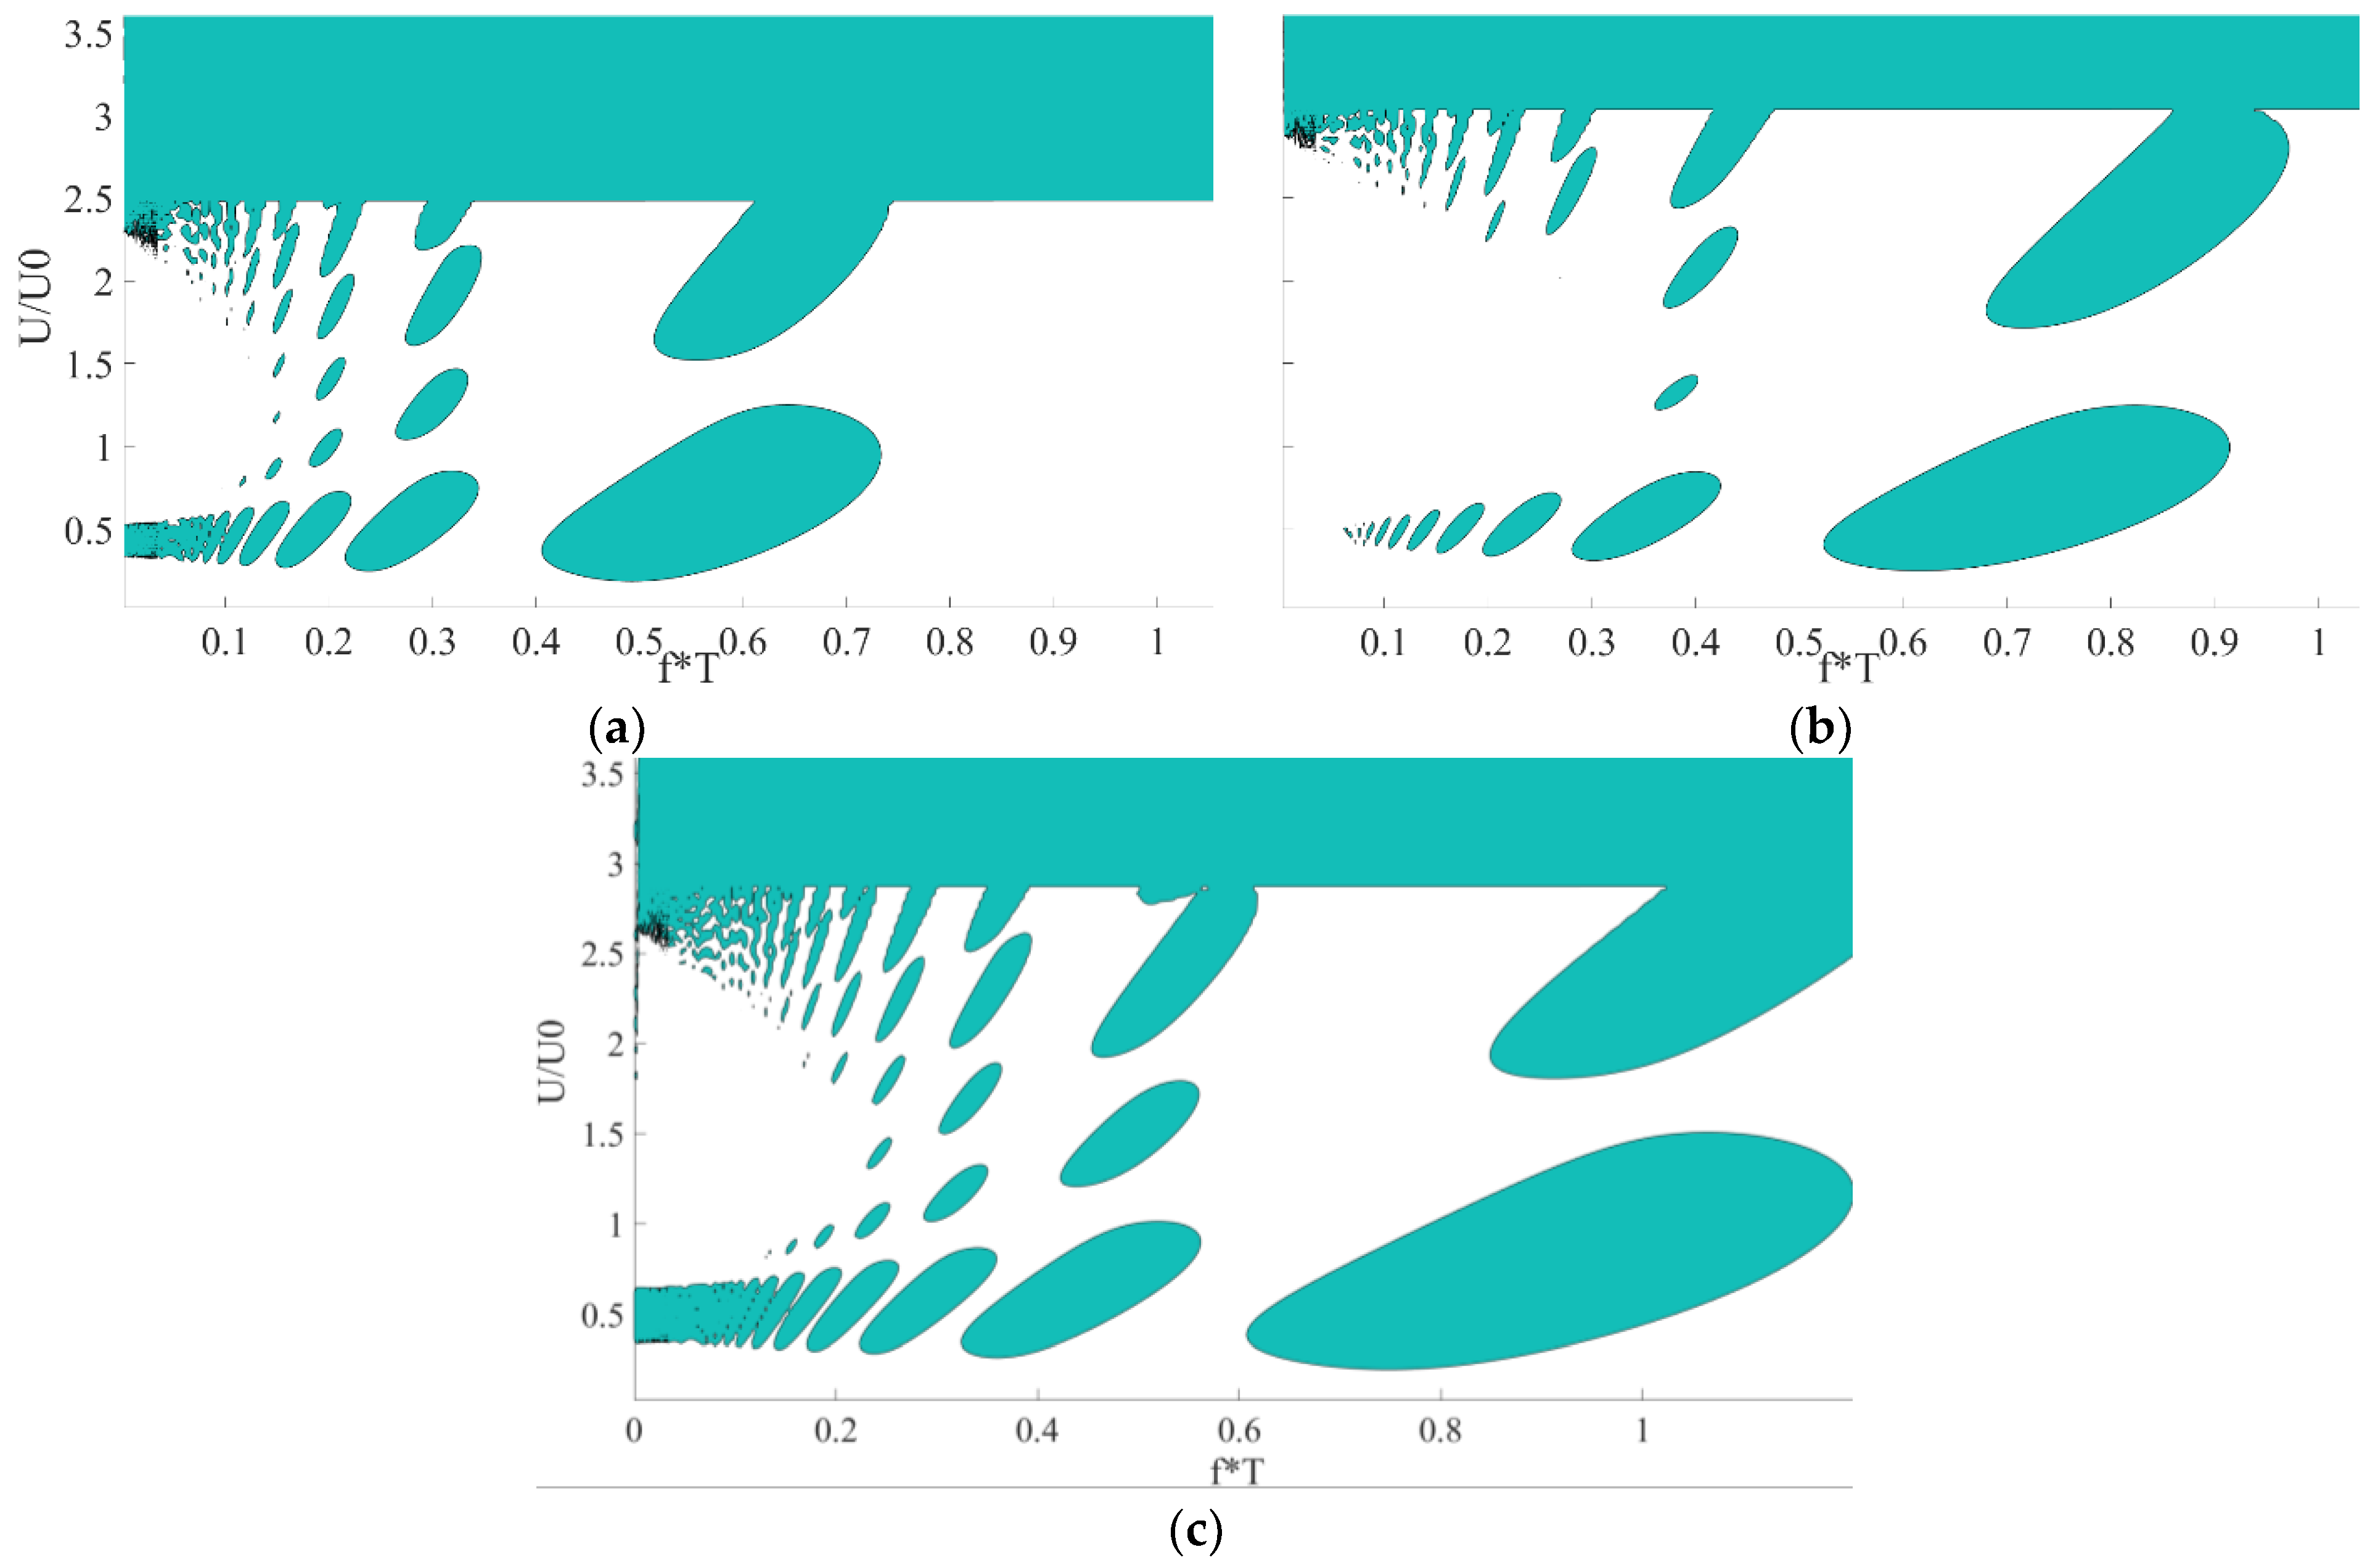
Figure 11 and
Figure 12 present a comparison between different step depths
for a dimensionless length of α = 0.1.
Figure 11a shows the decay rate (for the case without axial velocity), normalized according to the radial vibration characteristic time,
T, as a function of
.
Figure 11a shows, similar to the results in
Figure 9, that the secondary motion remains stable for a wide range of parameters at low axial velocities. For low values of
, β = 1.1 and β = 1.2 result in similar rates of convergence, while β = 1.04 has a slower rate of convergence. However, for higher values of
, β = 1.2 results in a faster rate of convergence and a wider range of stability.
Figure 11b shows the dimensionless stability maps in the
plane for different values of β and
f = 10/
T. Based on
Figure 11b, it appears that for high axial velocities, β = 1.1 is the optimum. However, the differences are small.
Figure 12 presents the Strutt diagram for
for different values of β. As with the results for α, there are bubbles of instability, especially around
. The results show, for the considered parameters, that the natural frequency and width of the bubbles increase as β increases. As for the amplitude of the axial motion, β = 1.1 is more stable, since the instability bubbles occur at higher amplitudes.
4.5. Influence of Texturing Parameters (Dimples)
In this subsection, the influence of different texturing parameters on the stability of the secondary motion of a partially textured piston is examined. The following parameters are examined: aspect ratio, 2
rp/
hp; textured portion, α; dimple depth,
hp/
C; and dimple area density,
(see
Figure 3). The reference dimensionless parameters are as follows: aspect ratio—2
rp/
hp = 15, textured portion—
, dimensionless dimple depth—
and dimple area density—
.
The ranges of the examined parameters for the current study are as follows:
0.05 < α < 0.15;
20% < Sp < 60%;
0.05 < hp/C < 0.2;
7.5 < 2rp/hp < 30.
In
Figure 13 and
Figure 14, a comparison between different portions of textured area is presented (the other parameters are the same as in the reference case). The examined range (0.05 < α < 0.15) is more limited than the range used for the step due to numerical limitations (higher values of
require a denser mesh).
Figure 13a shows the decay rate (for the case without axial velocity), normalized according to the radial vibration characteristic time,
T, as a function of
. The results indicate that the secondary motion remains stable for
. The rate of convergence and the stability range are similar for the considered values of α.
Figure 13b shows the dimensionless stability maps in the
plane for different values of α and
f = 10/
T. The influence of α on the stability range is small.
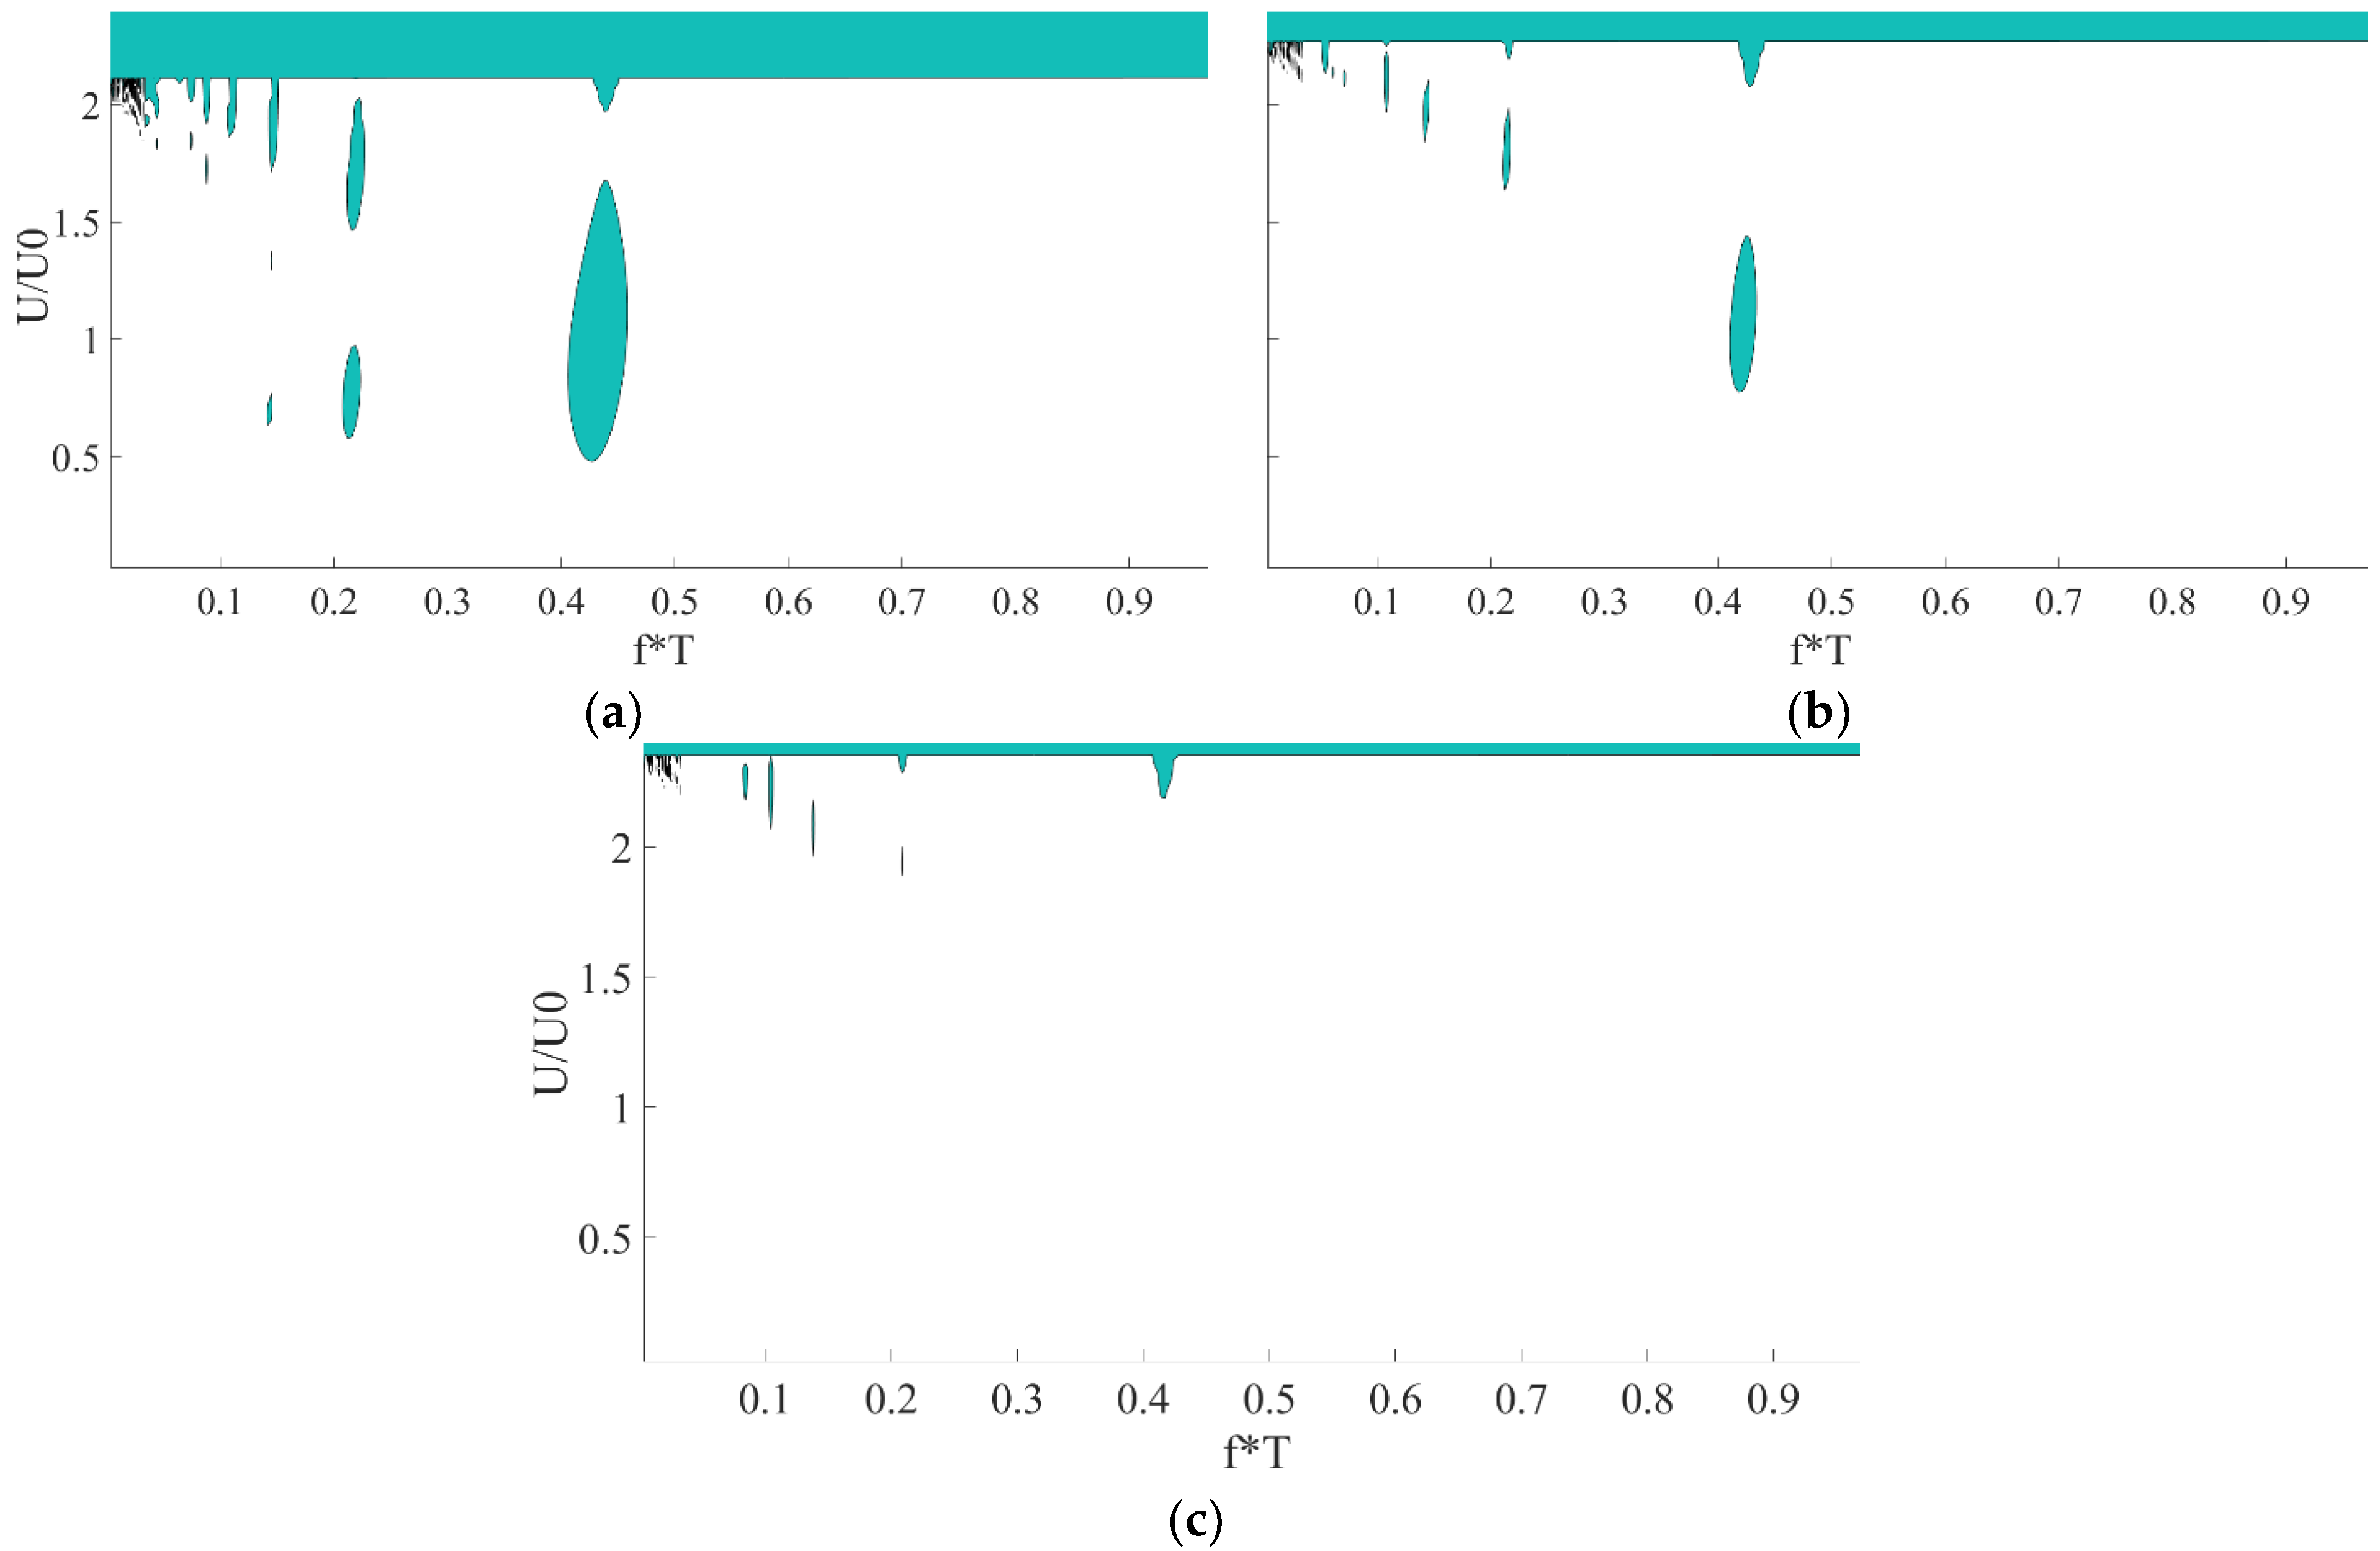
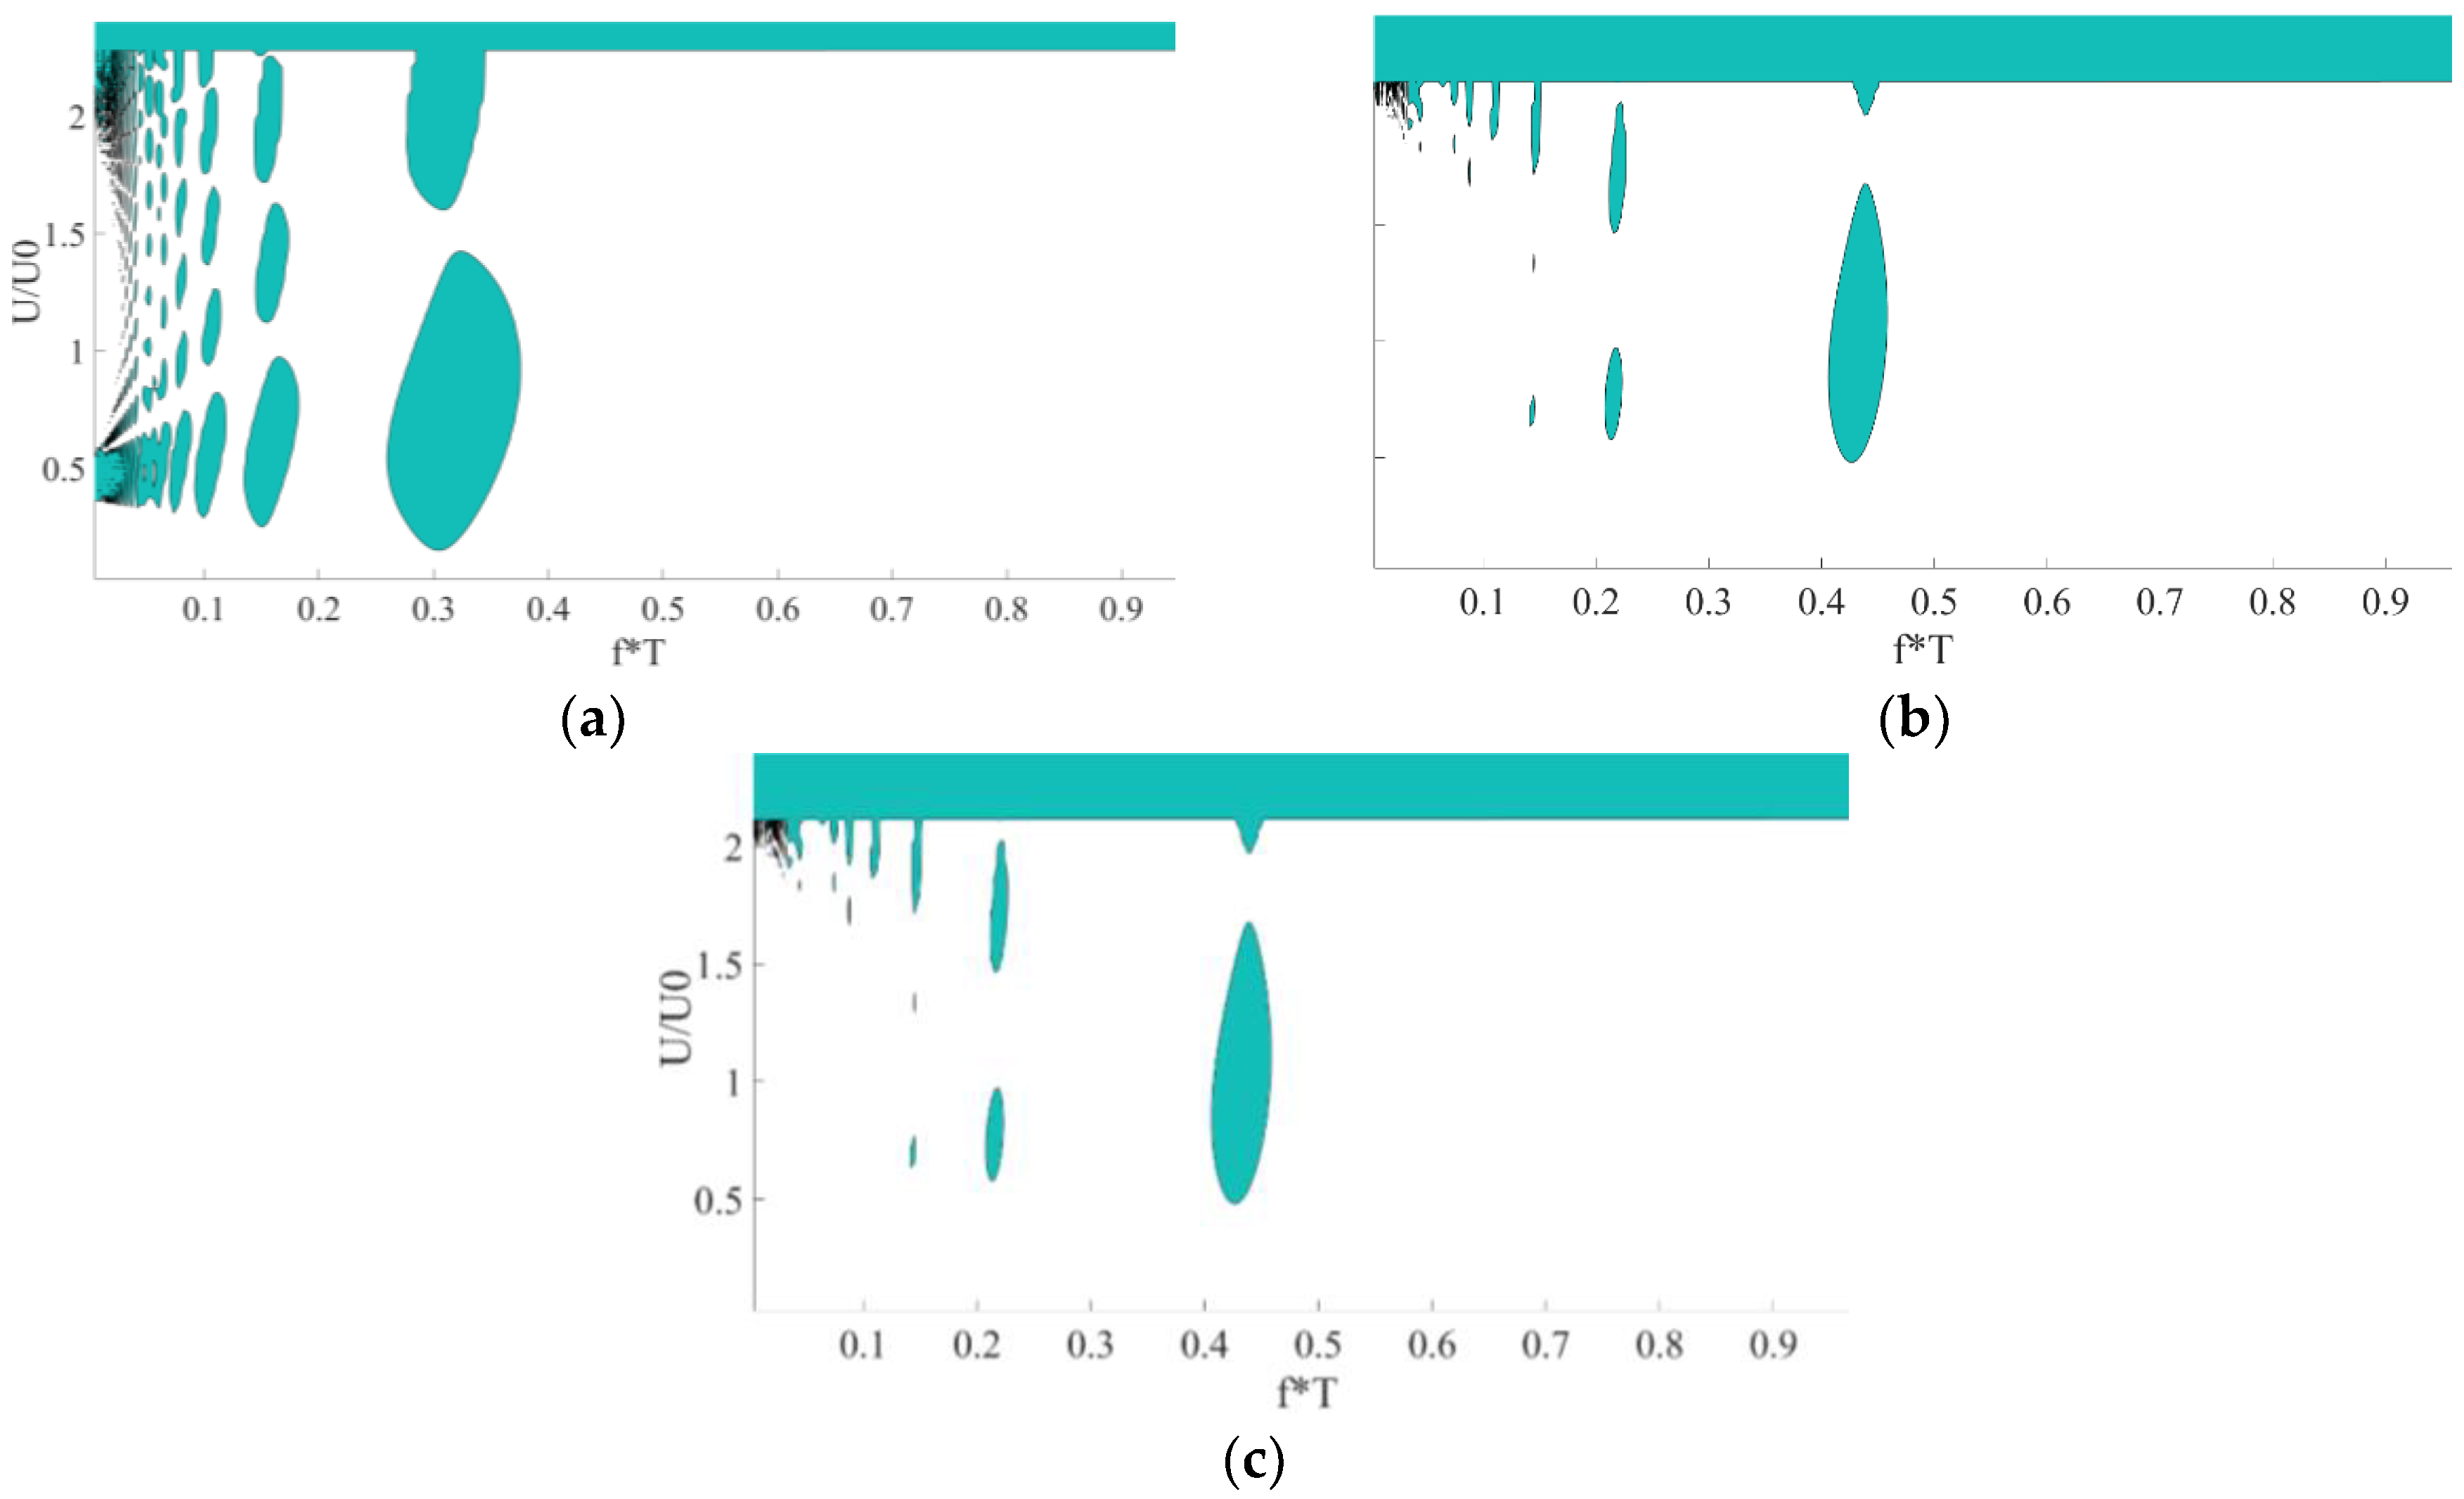
Figure 14 presents the Strutt diagram for
for different values of α. It seems that the phenomenon of “bubbles” occurs within the same range of frequencies for all the values of α. Hence, the natural frequency is not sensitive to α. Nevertheless, the instability bubbles are smaller for higher values of α. This is because
is smaller for higher values of α, and therefore, the non-symmetry of
is smaller. For the considered parameters, it seems that the textured piston results in a slower convergence rate (higher values of the maximum eigenvalue) and a smaller stability range than the step-profiled piston (see
Figure 9,
Figure 10 and
Figure 11). However, for small frequencies, the secondary motion of the textured piston is more stable, as derived from
Figure 14.
In
Figure 15 and
Figure 16, a comparison between different dimple area densities (20% <
Sp < 60%) is presented (the other parameters are the same as in the reference case).
Figure 15a shows the decay rate (for the case without axial velocity), normalized according to the radial vibration characteristic time,
T, as a function of
. It seems that for low velocities,
should be as high as possible. These results are compatible with the results in [
19], in which there is no optimum for
.
Figure 15b presents the dimensionless stability maps in the
plane for different values of
and
f = 10/
T. The results indicate that for high velocities and low values of
,
results in a greater range of stability, unlike the results for low velocities (see
Figure 15a). This is due to smaller values of
(smaller parametric excitation).
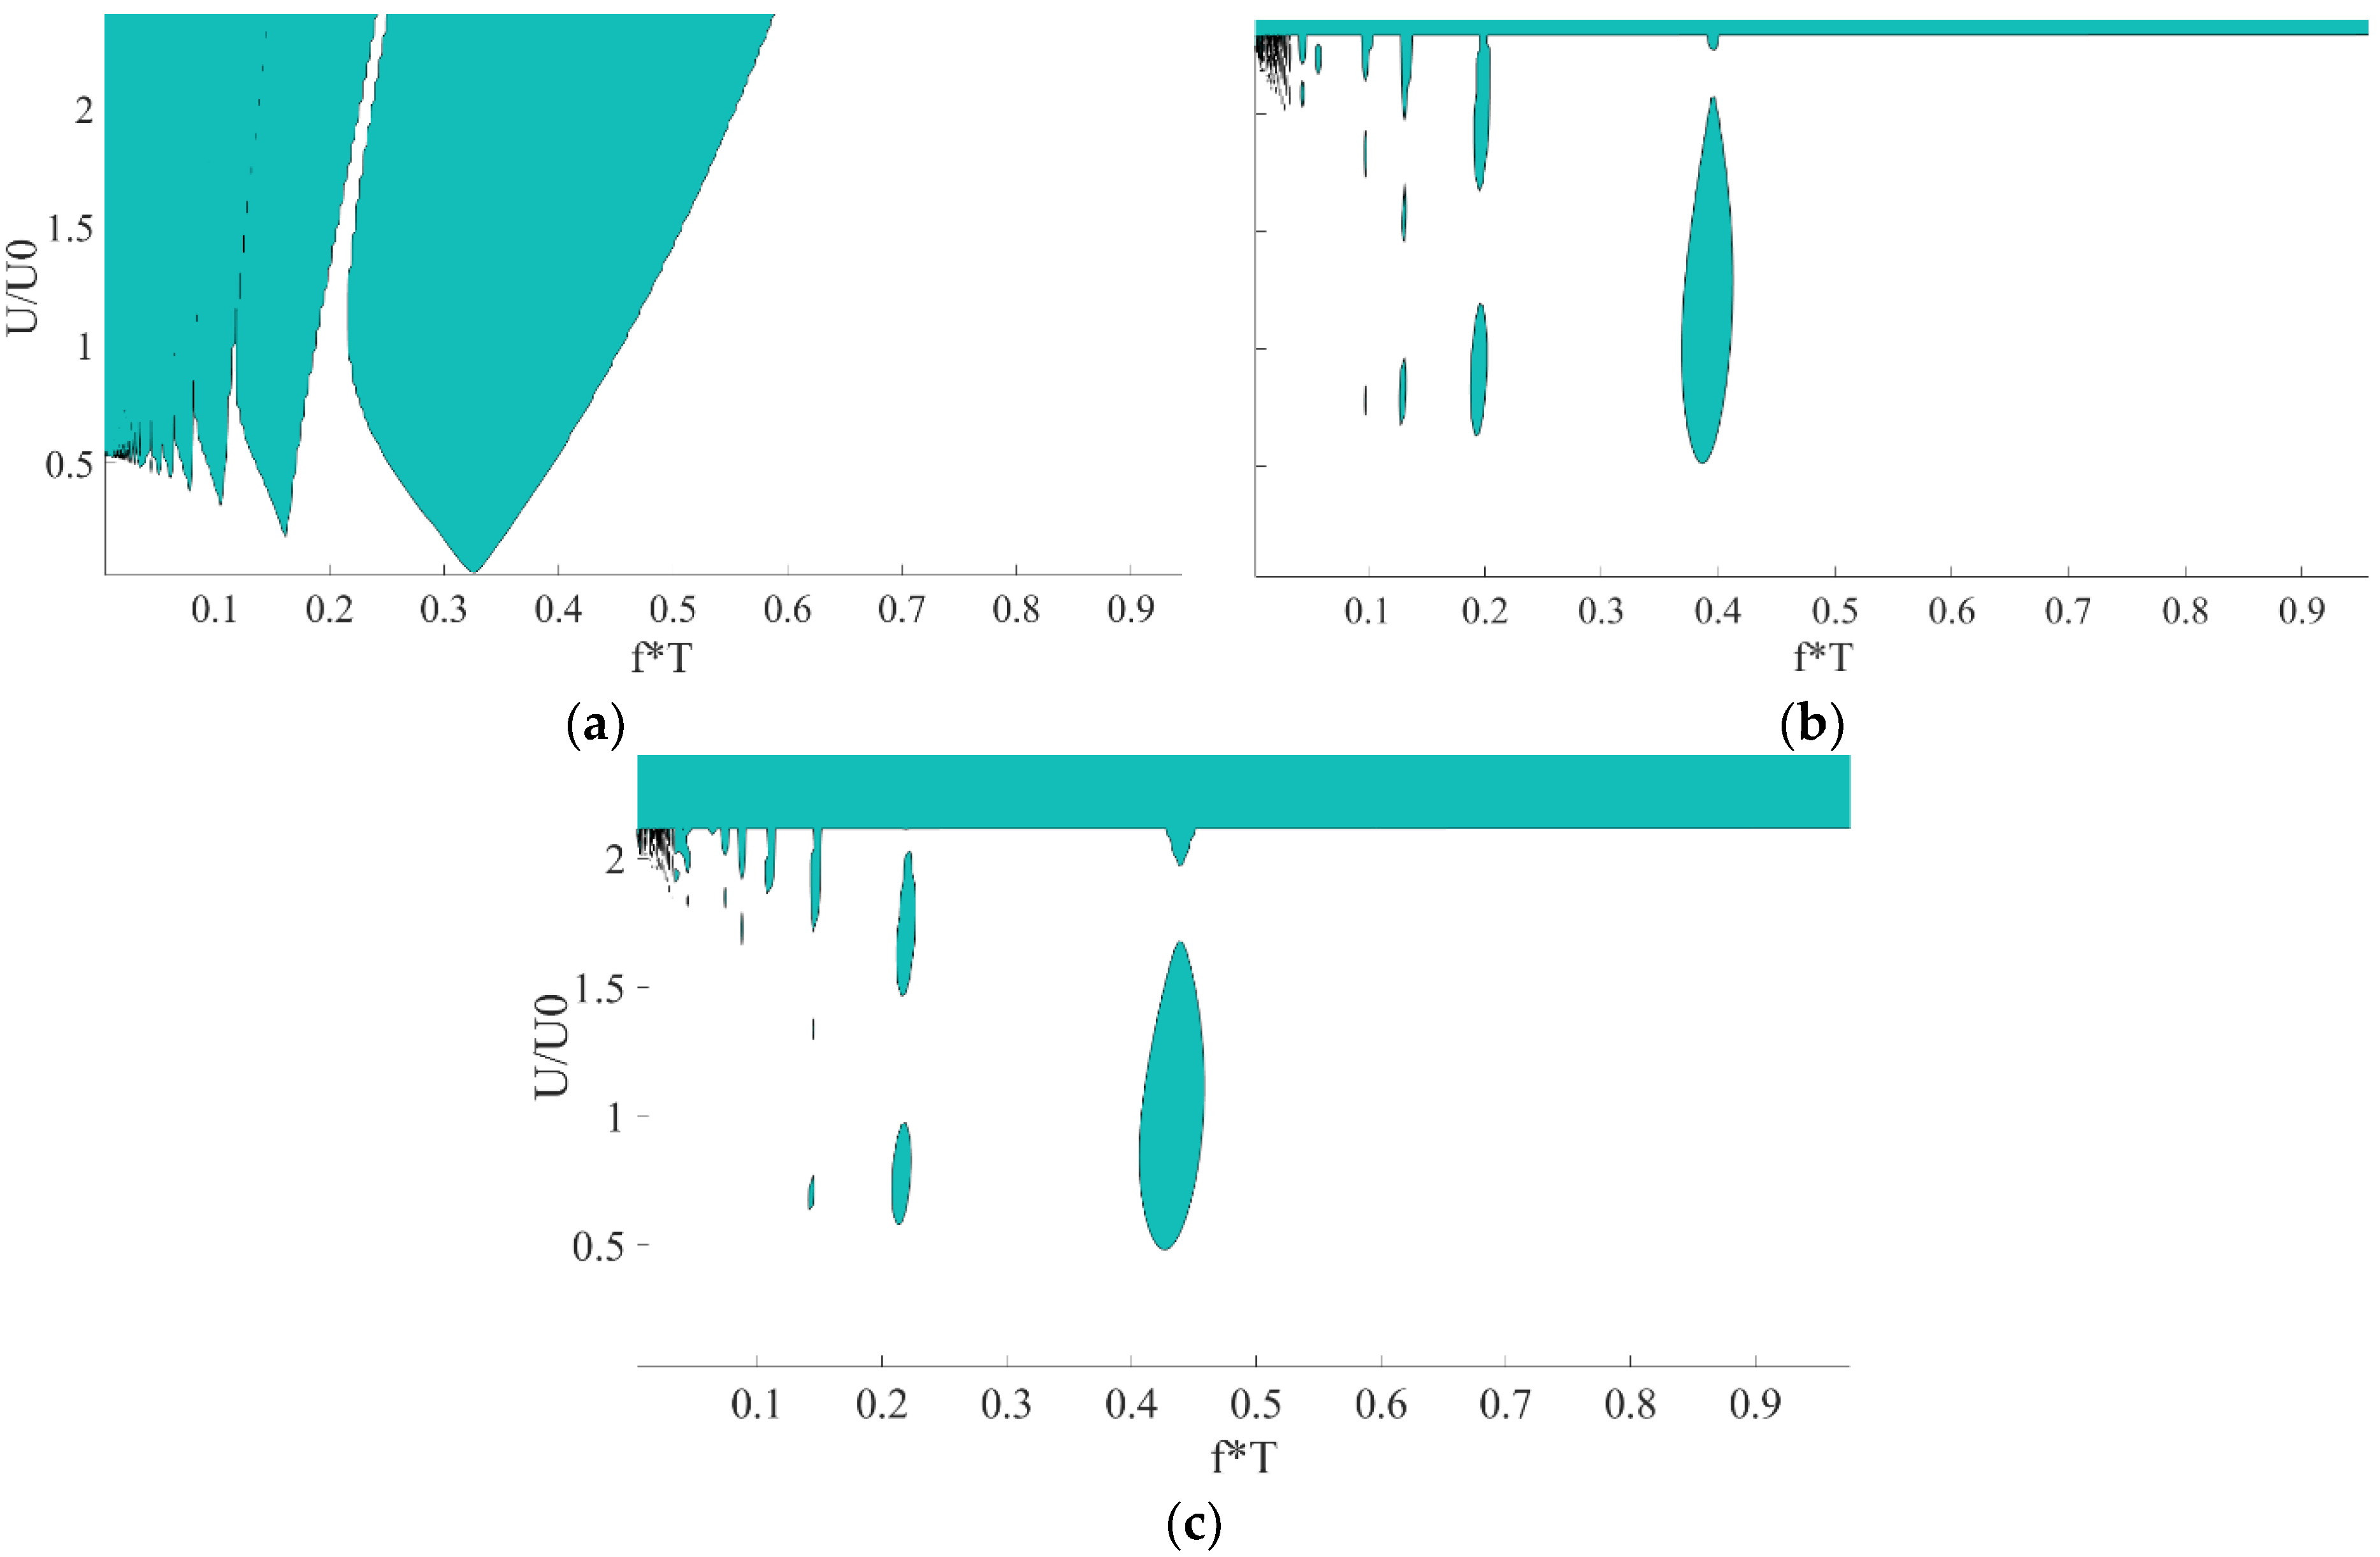
Figure 16 presents the Strutt diagram for
for different values of
. The results indicate that for low frequencies,
is significantly less stable. This is because
is relatively small (significantly smaller than all the other cases in the current study); therefore, the non-symmetry of the stiffness matrix,
, is small, leading to a more classic Strutt diagram, which is less stable at the natural frequency and double that value (principal parametric resonance).
In
Figure 17 and
Figure 18, a comparison between different dimensionless dimple depths (0.05 <
hp/
C < 0.2) is presented (the other parameters are the same as in the reference case).
Figure 17a shows the decay rate (for the case without axial velocity), normalized according to the radial vibration characteristic time,
T, as a function of
. The results indicate that while
is more stable for low values of
, for higher values,
is more stable, since it remains stable regardless of
. This is because, for this case, the direct stiffness coefficients are high relative to the cross-coupled stiffness coefficients, and as a result, the eigenvalues of the state matrix,
A, for the case without damping (µ = 0) are purely imaginary. Therefore, minimum damping is sufficient to stabilize the system.
Figure 17b presents the dimensionless stability maps in the
plane for different values of
and
f = 10/
T. It seems that the stability range for
is significantly greater, as it remains stable for high values of
(for low values of
, the stability threshold is greater than the values that are presented). This is because the values of
are small relative to the values of
.
Figure 18 presents the Strutt diagram for
for different values of
. It seems that the natural frequency and the range of frequencies in which the instability bubbles occur for
are smaller.
In
Figure 19 and
Figure 20, a comparison among different aspect ratios,
, is presented.
Figure 19a shows the decay rate (for the case without axial velocity), normalized according to the radial vibration characteristic time,
T, as a function of
. The results show that for the considered parameters, for low axial velocities,
is the optimum.
Figure 19b presents the dimensionless stability maps in the
plane for different values of
and
f = 10/
T. The results show that the stability range for
is greater.
Figure 20 presents the Strutt diagram for
for different values of
. It seems that for low frequencies,
is the optimum, since the range of the bubbles (frequency and amplitude) is smaller. In addition, for
, the density of the bubbles seems to be the highest among all the considered parameters of the current study. This is due to the high non-symmetry of
.
5. Conclusions
A linear model based on CFD simulations and Floquet theory was developed to analyze the stability of the secondary motion of partially textured and step-profiled pistons around the working point of a concentric piston. This linearized model was validated against the full simultaneous model. A normalization approach was introduced and validated, allowing the results to be generalized across various geometries and operating conditions. It was shown that the axial motion leads to parametric excitation, resulting in a time-dependent and non-symmetric stiffness matrix, which leads to a unique phenomenon of bubble-shaped areas of instability in the Strutt diagrams for low frequencies (up to about 2.5 times the natural frequency). Unlike the classic cases, in which increasing the parametric excitation at some dangerous frequencies (especially the natural frequency and double that value) leads to instability of the system, the presence of instability bubbles indicates that increasing excitation up to a certain level can stabilize the system. Furthermore, it was demonstrated that while a minor degree of non-symmetry in yields a more traditional yet less stable Strutt diagram, excessive non-symmetry increases the number and size of instability bubbles. Thus, an optimal level of non-symmetry exists that enhances stability.
The influence of different step and texturing parameters on the stability of the secondary motion was examined for three different cases: low axial velocities with various pressures, high axial velocities with various pressures and low frequencies with various velocities. Some guidelines can be drawn regarding the optimal parameters based on the operating conditions.
The following was found for length:
For a step-profiled piston, the influence of the step length, α, seems to be small. For all the considered parameters, the stability range of the secondary motion is wide. For low velocities, α = 0.1 results in faster stabilizing for most of the cases, while for high velocities and for low frequencies, α = 0.3 is more stable.
For the length of the textured zone, a similar trend was observed for low axial velocities (for texturing, the range of α that was examined is 0.05 < α < 0.15). However, for high axial velocities, there is an optimum (α = 0.1), and for low frequencies, the texturing length does not affect the stability range.
For depth, the following was found:
For a step-profiled piston, the step depth, β, for the considered parameters and for low velocities, should be as high as possible. For high velocities, there is an optimum (β = 1.1), and for low frequencies, β should be as low as possible.
For the texturing depth, the range of that was examined is . seems to be the optimum texturing among all the considered dimensionless texturing and step parameters for a wide range of parameters, as it remains stable for high values of and for high amplitudes of the axial velocities. In addition, the range of the instability bubbles is the smallest. Nevertheless, for low axial velocities and low values of , is more stable.
For the other texturing parameters, the following was found:
For the dimple area density, , the range of that was examined is . For the considered texturing parameters at low amplitudes of velocity, should be as high as possible. For high velocities, low values of are more stable. Therefore, for applications with high reciprocating velocities and relatively low pressure drops, should be low. However, low values may be significantly less stable for low frequencies.
For the aspect ratio , the range of that was examined is . For the considered parameters, at low velocities, the aspect ratio should be as high as possible, and at high velocities and low frequencies, there is an optimum.
For the considered texturing parameters, the results are very sensitive to the texturing depth and aspect ratios; therefore, further investigation for different depths is needed. In addition, the current model assumes that the axial motion is independent, and therefore, it does not consider the radial forces resulting from the mechanism of the axial velocity. This limitation should be addressed in future work to make the model applicable to a wider range of piston–cylinder systems such as piston engines.
