Article

A Study on the Lubrication Characteristics and Parameter Influence of a High-Speed Train Herringbone Gearbox

1
State Key Laboratory of Rail Transit Vehicle System, Southwest Jiaotong University, Chengdu 610031, China
2
Department of Mechanics and Maritime Sciences, Chalmers University of Technology, 41296 Gothenbur, Sweden
3
Technology Center, CRRC Qingdao Sifang Co., Ltd., Tsingtao 266109, China
4
Simulation Department, Suzhou shonCloud Engineering Software Co., Ltd., Suzhou 215100, China
*
Author to whom correspondence should be addressed.
Lubricants 2024, 12(8), 270; https://doi.org/10.3390/lubricants12080270
Submission received: 27 June 2024 / Revised: 22 July 2024 / Accepted: 26 July 2024 / Published: 29 July 2024
(This article belongs to the Special Issue Friction–Vibration Interactions)

Abstract

:
To investigate the lubrication characteristics in high-speed train gearboxes, a two-stage herringbone gearbox with an idle gear was analyzed. The lubricant flow and distribution were shown using the moving particle semi-implicit (MPS) method. A liquid film flow model was brought in to enhance the non-slip wall boundary conditions, enabling MPS to predict the film flow characteristics. This study investigates the influence of gear rotating speed, lubricant volume, and temperature on lubricant flow, liquid film distribution, lubrication state in the meshing zone, and churning power loss. The results indicate that lubrication characteristics depend on the splashing effect of rotating gears and lubricant fluidity. Increasing gear rotating speed and lubricant temperature can improve liquid film distribution on the inner wall, increase lubricant volume, and thus enhance film thickness. The lubricant particles in the meshing zone correlate positively with the gear rotating speed and lubricant volume, correlate negatively with a temperature above 20 °C, and decrease notably at low temperatures. Churning power loss mainly comes from the output gear. As lubricant volume and gear rotating speed increase, churning torque and power loss increase. Above 20 °C, viscosity decreases, reducing power loss; low temperatures lessen lubricant fluidity, reducing churning power loss.

1. Introduction

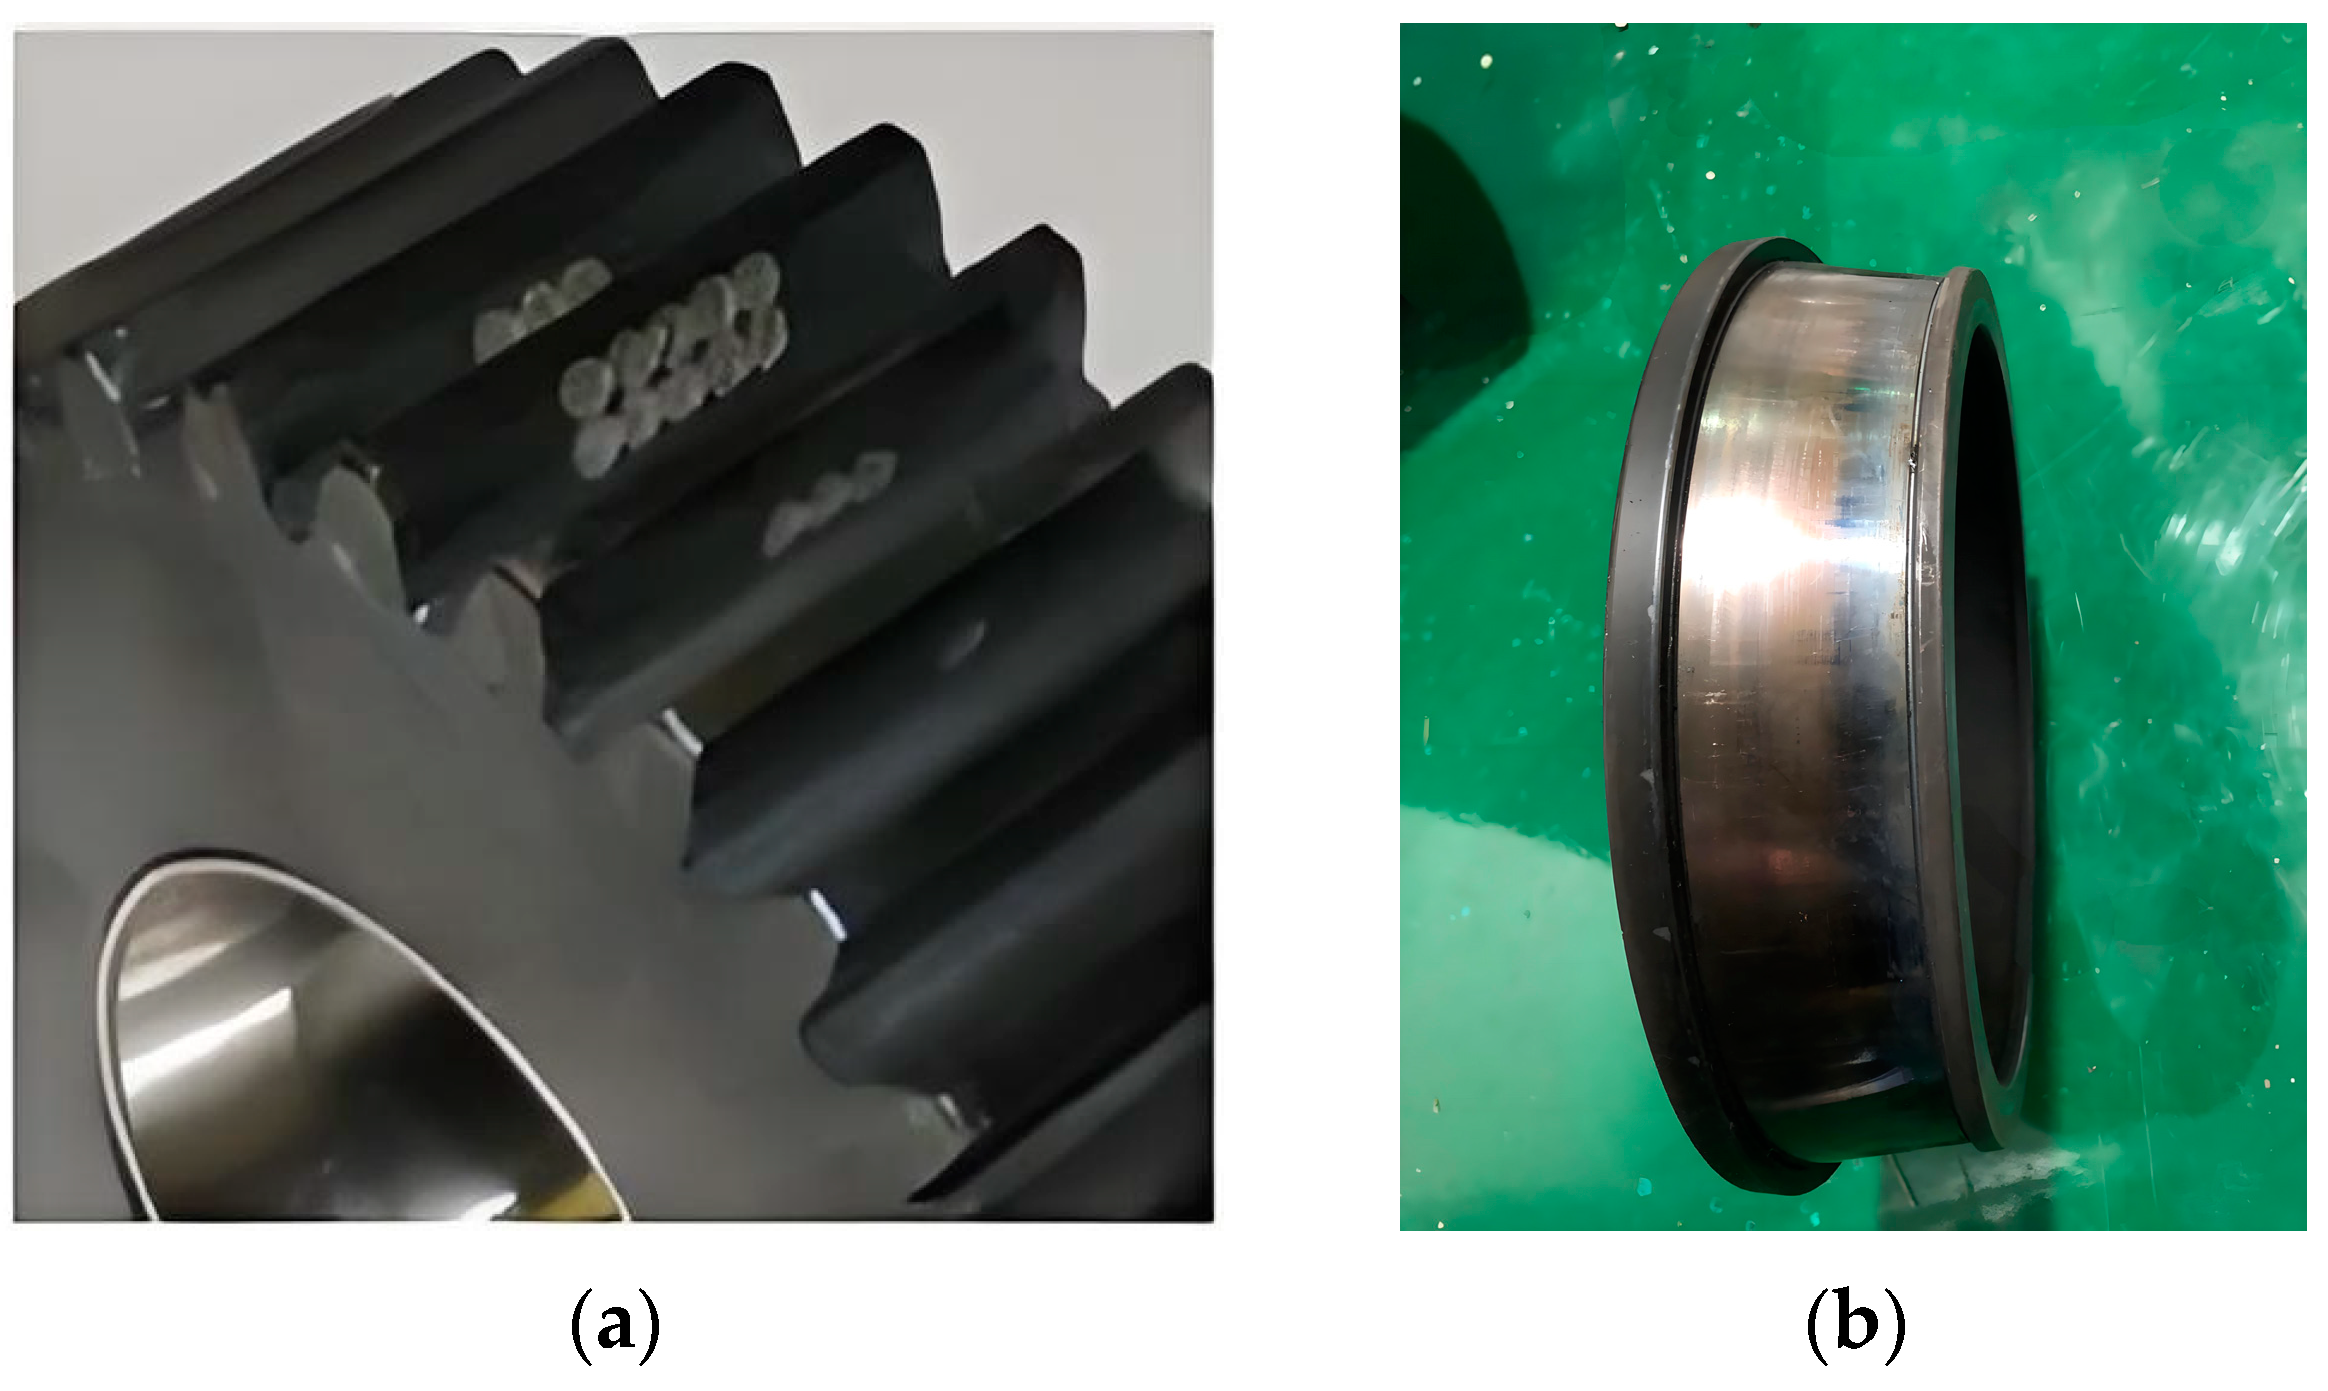
High-speed train gearboxes serve in extreme environments for long durations, so it is particularly important to evaluate the lubrication state during their service. The temperature of bearings and lubricant is typically a key indicator for monitoring the operational state of the gearbox. When the temperature surpasses the predetermined safety threshold, the safety warning mechanism of the high-speed train will be triggered, and the train will have to slow down or stop. Effective lubrication minimizes friction and wear between components, absorbs shocks and vibrations, reduces noise, and dissipates heat, maintaining the gearbox at optimal temperatures. In contrast, inadequate lubrication increases friction and raises bearing temperatures sharply, potentially causing burnouts, gear pitting [1], and scoring, as shown in Figure 1, and significantly reducing gearbox lifespan and reliability. In order to ensure good lubrication of the gearbox and improve the reliability of the train operation, it is necessary to accurately evaluate the lubrication state of each component of the gearbox [2,3]. Hence, studying the lubrication characteristics and influencing factors of high-speed train gearboxes is highly significant.
Many scholars have applied numerical simulation methods to study the splash lubrication characteristics of gearboxes, and the finite volume method (FVM) is commonly adopted [4]. Liu and colleagues established a computational fluid dynamics (CFD) model for the splash lubrication of FZG gearboxes based on the FVM and investigated the relationships between fluid distribution, churning power loss, gear rotating speed, and oil level [5,6]. Hildebrand et al. studied the interaction relationship between lubricant flow and power loss by introducing a guide plate [7]. Mastrone et al. improved the mesh generation process of the FVM, and the proposed mesh partitioning algorithm can significantly reduce computational costs. The flow field structure of the CFD numerical model was validated by particle image velocimetry, and good consistency was achieved [8]. Hu et al. [9] and Jiang et al. [10] conducted an array of investigations regarding the splash lubrication characteristics of bevel gear trains for helicopters. Nevertheless, there are many simplifications of the housing structure in their CFD models, all in order to ensure mesh quality. Mastrone et al. [11] proposed a grid reconstruction method, which is believed to be applicable to multi-stage transmission systems. In CFD models based on the FVM, the moving grid technique is needed to generate the grid surrounding the gears to simulate rotational motion [12,13,14]. If the clearance is too small, it is easy to cause severe mesh distortion in the meshing area, which can lead to non-convergence of the calculation. Excessive clearance will weaken the gear meshing effect and increase the calculation error. The moving grid used in helical gear transmission is more likely to diverge due to mesh distortion than that of spur gear transmission. The moving grid used in herringbone gear transmission needs to ensure the coordination and consistency of the two sets of meshes. However, for continuous transmission with the idle gear, many meshing techniques are no longer applicable.
Compared to the grid-based CFD method, there is no fixed topology between the nodes in the particle-based CFD method, which avoids the complex process of grid distortion and old–new grid conversion in large deformation problems. It has obvious advantages in dealing with severe deformation issues such as free-surface flow. Liu et al. applied the smoothed particle hydrodynamics (SPH) approach to simulate and analyze the oil distribution of an FZG gearbox. The oil distribution captured by a fast frame camera showed that the SPH has a strong ability to predict oil distribution [15]. Ji et al. employed this method to discretize air and oil in a gearbox and studied the aeration behavior during the churning process [16]. Legrady et al. studied the churning loss in spiral bevel gear trains and found that the difference in churning loss was up to 30% using a 98% scaled gear geometry [17]. One other widely available particle-based CFD method is the moving particle semi-implicit (MPS) approach. Liu et al. [18] used MPS to simulate the CFD model established in reference [14] and pointed out that MPS is more accurate than SPH in the prediction of churning torque. Guo et al. [19] used an orthogonal experimental method to study the influence of geometric dimensions and working conditions on the churning power loss of a gear system and pointed out gear rotating speed as the mostly important influential parameter. Deng and others [20,21,22] visualized the internal flow field of the single-stage transmission gearbox and screw reducer with MPS. Shao et al. [23] further carried out a study on the impact of oil adjustment devices on the lubrication mechanism of high-speed train gearboxes. The CFD simulation models established in references [20,21,22,23] highly replicate the actual structure of the gearbox, demonstrating the significant superiority of MPS in visualizing the internal flow field of transmission systems with complex surfaces. However, their research focuses only on oil circulation, flow patterns, and churning losses, without studying the coverage of lubricants on component surfaces or the distribution characteristics of oil films on these surfaces.
Different types of lubricants are used in gearboxes, each with distinct advantages and disadvantages. Mineral oil is cost-effective and widely available but lacks thermal stability and longevity [24]. Synthetic oil offers superior performance and durability but is expensive [25]. High-viscosity-index oil ensures stable viscosity across temperature variations but is costly [26]. Specialty oils provide enhanced protection for specific applications but may have compatibility issues and higher costs. Semi-synthetic oil, often considered the best option, balances cost and effectiveness, offering good performance at a reasonable price, and is therefore widely used in gear transmission systems [27]. Additionally, adding suitable additives to lubricating oils can improve their frictional properties [28].
The unique structural design of herringbone gears ensures more uniform interaction between the teeth, thereby reducing noise and vibration. The two helices of the herringbone gear are arranged on the opposite side, which can withstand both radial and axial forces simultaneously, while reducing load on the bearings and having stronger carrying capacity [29,30,31]. The increasing speed of the high-speed train has led to higher requirements for the power that can be transmitted by the transmission system. And, at the same time, the continuous improvement in passenger comfort also puts forward higher requirements for noise control of the transmission system. Transmission systems with herringbone gears can better meet these requirements. The space under the high-speed train is very limited, and the structure of the bogies is very compact [32,33]. With a fixed transmission ratio, the fixed platform height limits the use of large gears in the transmission system. To ensure the power transmission distance, gearboxes with idle gears have been widely used. In this kind of transmission system, in order to meet the lubrication requirements, multiple gears are immersed in the lubricant, and the lubricant splash behavior is more complicated. The lubrication characteristics of gearboxes with an idle gear remain largely unstudied.
This study focuses on the herringbone gearbox used in high-speed trains, introducing a liquid film flow model to enhance the non-slip wall boundary conditions of MPS, so that MPS possesses the capability to forecast surface liquid film flow. The distribution characteristics of the liquid film on the inner wall of the casing are analyzed, and the influence of gear rotating speed, lubricant volume, and temperature on the lubrication performance of the gearbox are studied. The research findings offer a theoretical basis for optimizing the casing structure and improving the sealing effect and transmission efficiency of the gearbox.

2. Numerical Approach

2.1. Discrete Principle

MPS is primarily used for solving incompressible flows and has been widely applied in various specialized engineering and scientific research fields [34,35,36,37]. This method uses the point collocation method to arrange a series of discrete particles on the solution region and its boundary to represent the macroscopic fluid. The kernel function determines a weighting relationship of the mutual actions between adjacent particles. Various differential operators in the motion-controlling equations and the interactions between particles are discretely solved based on the kernel function. By tracking the kinematic and dynamic properties of each tracking particle in the Lagrange coordinate system, the flow information of the macroscopic fluid is obtained.

2.2. Controlling Equations and Particle Action Models

Assuming that the lubricant is an incompressible fluid, the MPS-controlling equations involve the mass equation and the momentum equation [38]:
D ρ D t = 0 ,
D u D t = 1 ρ p + μ ρ Δ 2 u + g ,
where u denotes the fluid velocity vector, ρ denotes the fluid density, p denotes the fluid pressure, μ denotes the fluid dynamic viscosity coefficient, and g denotes the gravity vector.
A continuous fluid is made up of discrete particles whose motion can be used to characterize the motion of the fluid. Each particle carries its own physical properties, including position, velocity, pressure, and so on. The motion of each particle has an effect on its surrounding particles. The interactions between particles are achieved by the kernel function w(r) [39]:
w ( r ) = r e r 1 0 r r e 0 r e r ,
where r = |rirj| represents the particle distance and re represents the action radius of the particles. Every particle only interacts with a specific amount of particles that are located inside re. The particle density is determined by a weight sum of the particle number within re, and the particle number density ni of particle i located at ri can be expressed as follows [40]:
n i = j i w r j r i ,
For incompressible fluids, it is necessary for the fluid density to remain unchanged. Due to the proportional relationship between ρ and ni [34], ni will also be maintained at a constant n0. Furthermore, according to the kernel function, the gradient operator of particle i is available by weighting the gradient vectors of other particles, while the Laplace operator is expressed as the physical quantity transfer from the particle and surrounding particles [41]:
ϕ i = d n 0 j i ϕ j ϕ i r j r i 2 r j r i w r j r i ,
2 ϕ i = 2 d λ n 0 j i ϕ j ϕ i w r j r i ,
λ = j i r j r i r j r i 2 j i r j r i ,
where d is the space dimensionality of the issue.

2.3. Algorithms and Boundary Conditions

MPS adopts a semi-implicit time step advancement algorithm, which means that the momentum equation is solved explicitly and the mass equation is solved implicitly. At each time step, the estimations of particle velocity and position are obtained by solving the viscosity and source terms in the momentum equation based on the initial conditions. Then, the modified values are solved according to the mass conservation equation, and the velocity and location of the particle for the following time step are calculated based on the corresponding modified values. By tracing the particles’ movement pattern at every time step, flow information can be obtained for the flow field.
In MPS, particles are rearranged at each time step, so quickly identifying free surface particles is key to accurately solving the pressure field. Fluid particles inherently rely on the free-surface; hence, the ni at the free surface is relatively low. The condition for identifying the free surface is as follows [42]:
n i β n 0 ,
where β is the free-surface judgment coefficient, generally taken as 0.97.
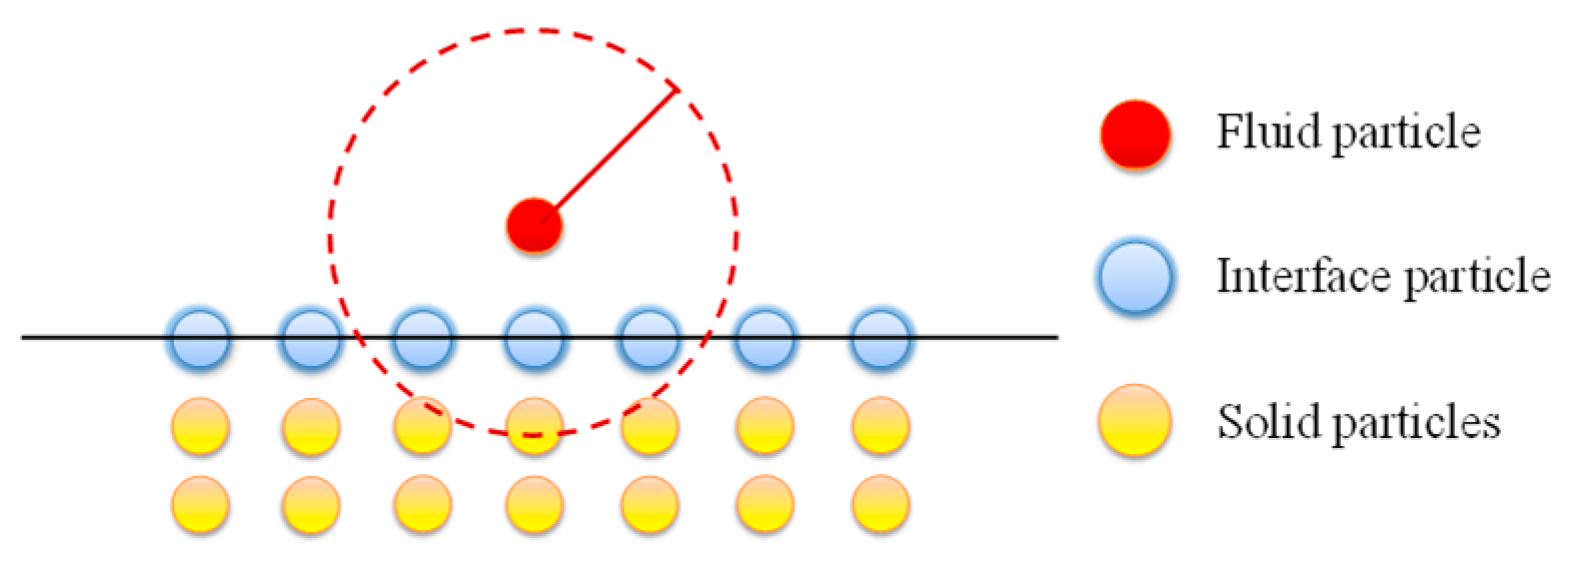
In addition to free-surface boundary conditions, MPS also requires accurate identification of solid boundaries. Solid walls generally use polygon boundaries, and the pressure inside the fluid is balanced by setting up virtual particles [43]. In general, three layers of solid boundary particles are arranged, as depicted in Figure 2. The first layer of boundary particles adjacent to the fluid is called interface particles, which participate in pressure calculations but do not make corrections to flow velocity and position vectors. The other two layers are solid particles and only participate in particle density calculations.

2.4. Liquid Film Flow Modeling

The liquid film on a rotating disk is driven solely by centrifugal force and is often used as a typical physical model for thin film flow. The liquid film itself is very thin. It is assumed that the pressure of the film in the thickness direction is constant, and the shear stress between the air and liquid on the film surface is neglected. In the analysis process, the liquid is regarded as an incompressible Newtonian fluid, and the momentum equation and continuity equation followed by the liquid film during the flow process are as follows:
ρ u t + · u u = p + ρ g + T + f ,
· u = 0 ,
where T is the shearing force tensor and f is the extraneous force.
Vita et al. proposed the thin film estimation method, which can transform the three-dimension thin film flow issue into a two-dimension approximate model issue [44], significantly improving the solution efficiency. The two-dimensional approximate thin film flow model is shown in Figure 3.
By integrating the momentum in Equation (9) in the thickness direction, the integrated shape of the momentum equation for liquid film flow can be obtained:
ρ t h u ¯ + ρ h · u u d z = h ρ g δ + σ κ τ d i s k + F ,
where u ( _ ) denotes the mean velocity of liquid film flow, δ is the thickness of the film, σ is the surface tensile force coefficient, κ is the surface curvity, F is the extraneous force, and τdisk is the shearing stress of the liquid film on the surface of the disk:
τ d i s k = μ u z z = 0 ,
By incorporating the velocity profile function and vertical velocity fluctuations, the final form of the control equation for a 2D thin film flow approximation model can be obtained:
t h u ¯ + · h u u ¯ + C = 1 ρ h p 1 ρ τ d i s k + S m ,
h t + · h u ¯ = Q m ,
where the momentum source term Sm and the mass source term Qm represent the moving jet. The differential convection term C, pressure p, and shear stress τdisk are given by the following equation:
C = 213 875 h u ¯ u d i s k u ¯ u d i s k ,
p = ρ g h + σ · h ,
τ d i s k = μ h 12 5 u ¯ u d i s k ,

3. Model and Simulation

3.1. CAD Model of a High-Speed Train Gearbox

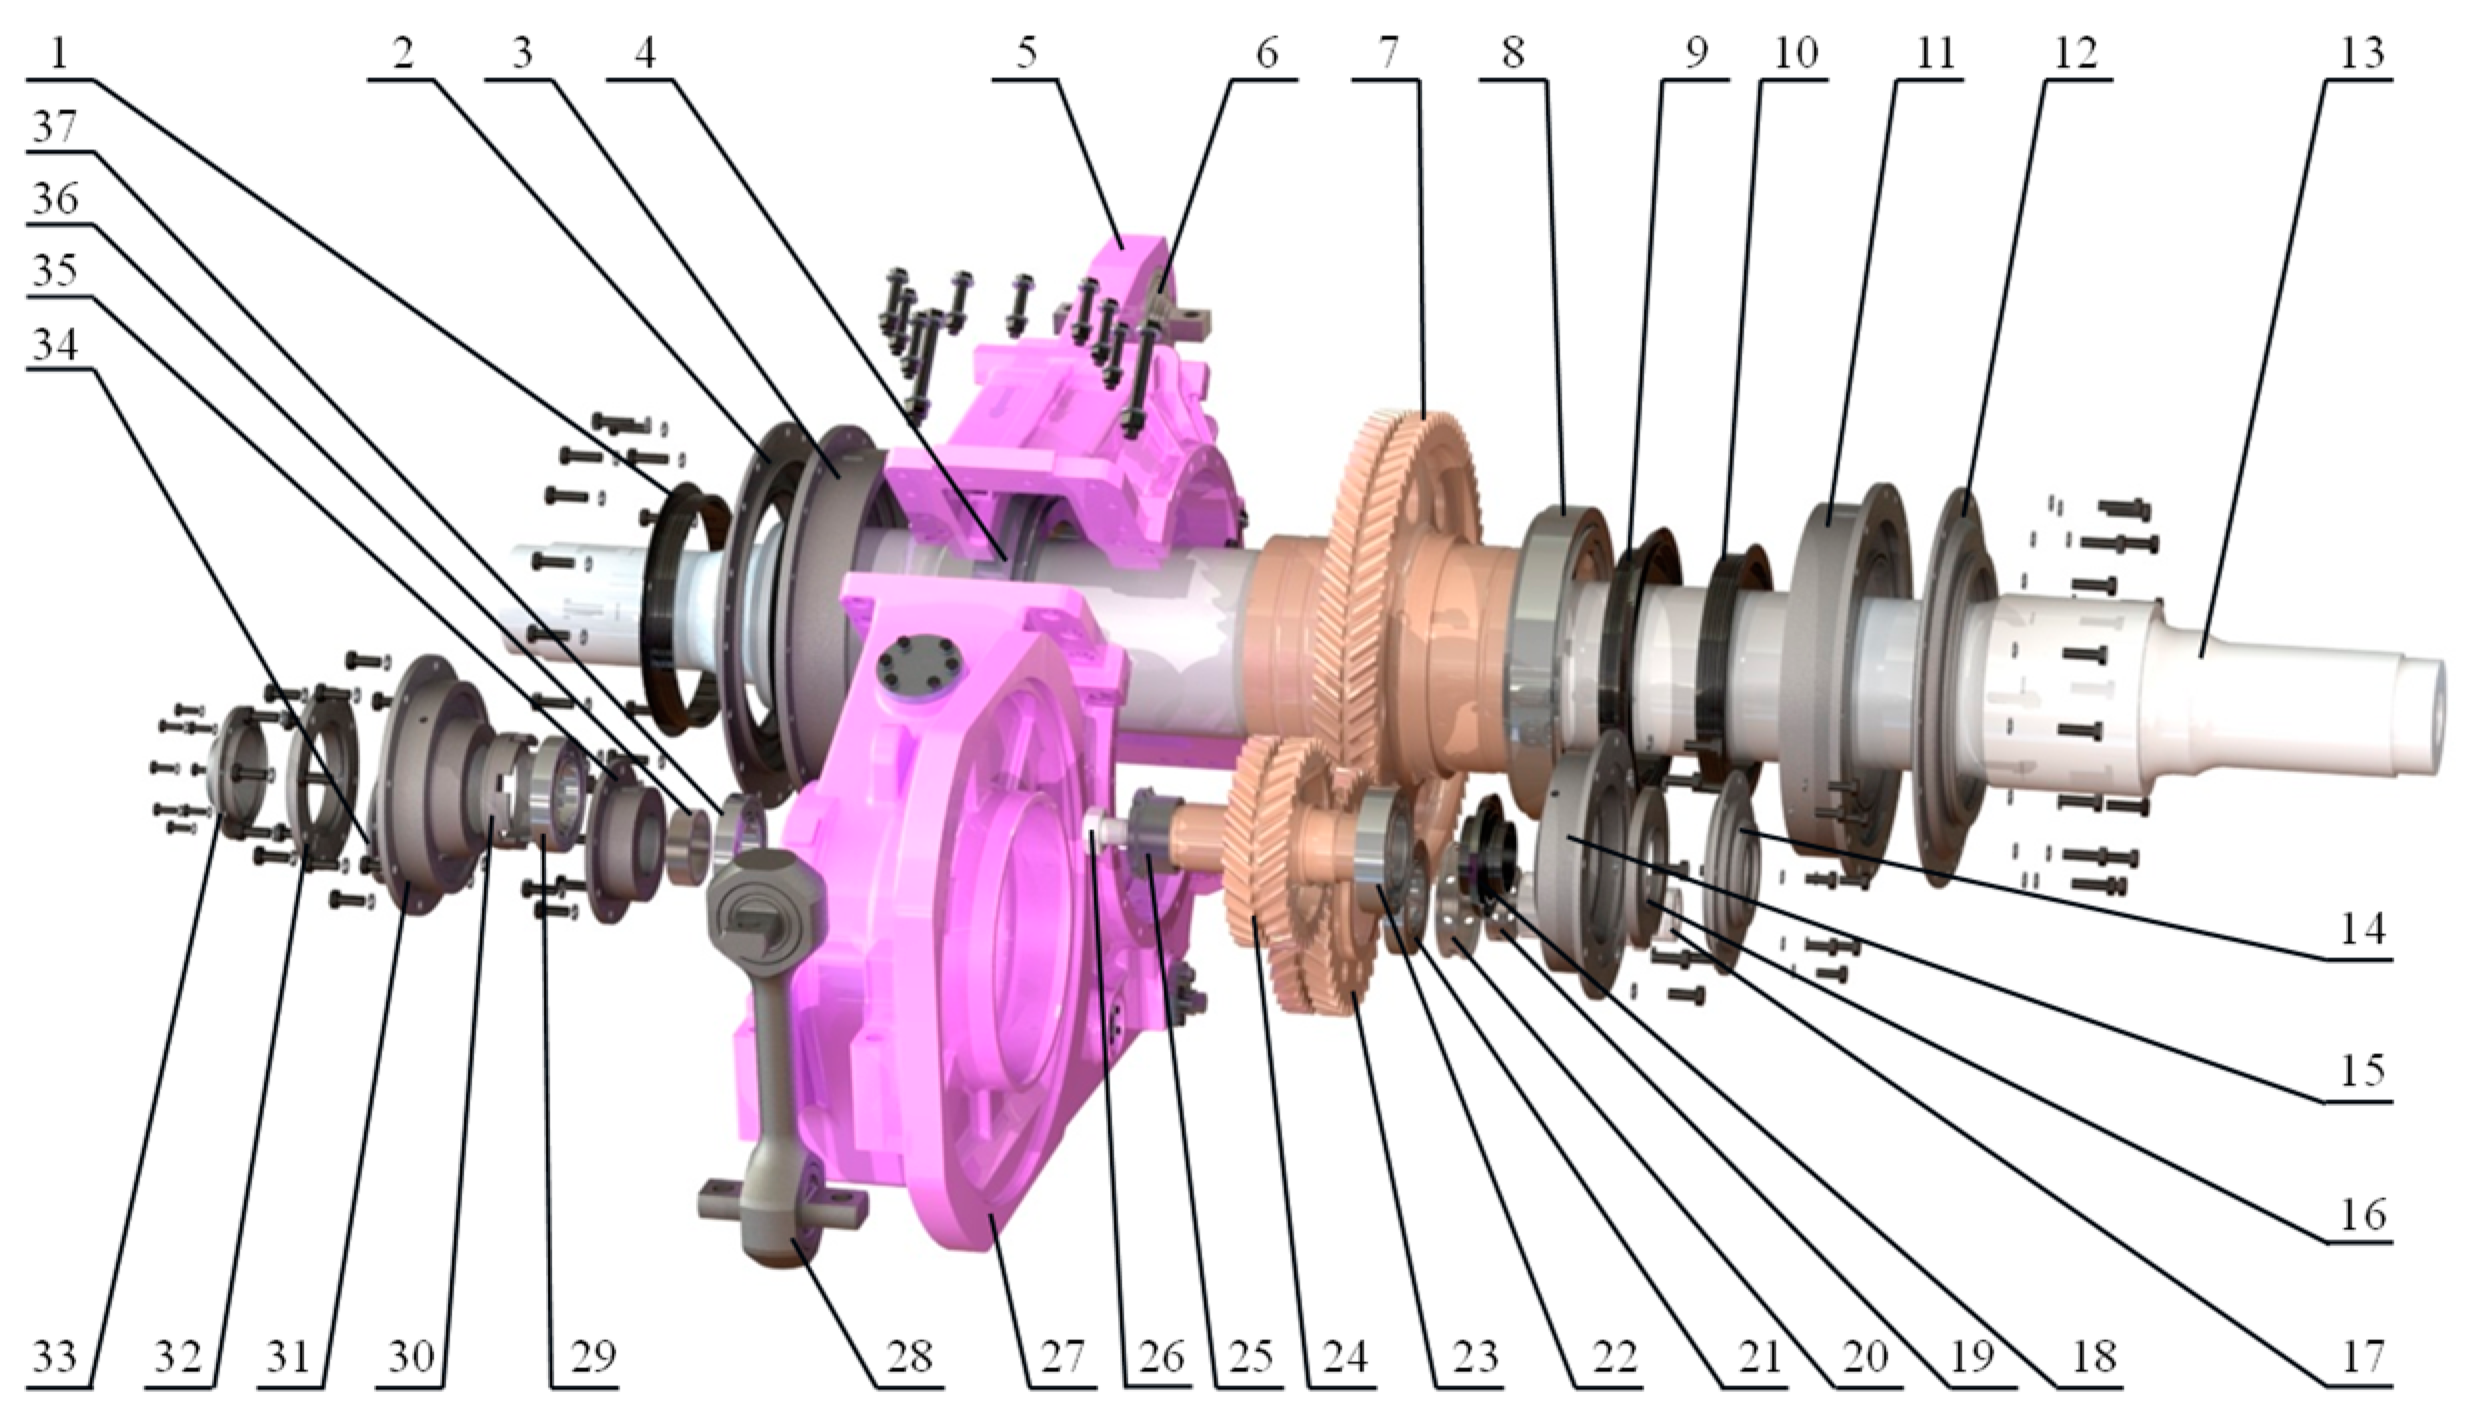
A high-fidelity CAD model of a parallel axis herringbone gear transmission gearbox for high-speed trains is established for the first time, according to the author’s knowledge. Figure 4 illustrates the components of the herringbone gear transmission gearbox, which include an input pinion, an idle gear, an output gear, an upper casing, a lower casing, and a series of shaft end attachments.
The gearbox is lubricated by splash lubrication, and the idle gear and the output gear are partially immersed in the lubricant as the churning gear. The main design parameters of the herringbone transmission gears are presented in Table 1. This transmission system consists of two stages with fixed ratios: the first stage has a ratio of 29:35, and the second stage has a ratio of 35:73. The geometric characteristics of the transmission gears and the inner wall of the casing are crucial factors affecting the lubrication characteristics and are fully preserved in the established model. Removing the holes, chamfers, and other features on the outer surface of the casing is beneficial to improving the computational efficiency and has no effect on the lubrication characteristics.

3.2. CFD Model of a High-Speed Train Gearbox

The gearbox CAD model is imported into the shonDy [45,46] based on MPS to create the CFD model, which reflects the flow field of the gearbox. The simulation duration is configured as 3 s in the CFD model, where 0~1 s represents the tilt accelerating phase and 1~3 s represents the steady running phase. The inclined acceleration stage is used to eliminate errors in the flow field results caused by severe lubricant fluctuations due to sudden gear rotation. Based on the transmission ratio of the drive gears and the movement relationship of the bearings [47], the motion of each gear and bearing is defined, ignoring the self-rotation of the bearing rollers.
n m = 1 2 n i 1 D b c o s α d m ,
where nm denotes the revolution speed of the roller, ni denotes the rotating speed of the bearing cone, Db denotes the diameter of the roller, α denotes the contact angle of the bearing, and dm denotes the pitch diameter of the bearing.
The lubricant type is 75W-90, and the material characteristics of this lubricant can be found in Table 2. By taking into account the viscosity–temperature characteristics of the lubricant, the algorithm provided in AGMA 925 A03 can be used to estimate the viscosity and density of the lubricant at various temperatures [48]. These values are presented in Table 3.
l g l g ν + 0.7 = A B × l g ( θ + 273.15 ) ,
ρ = 876 0.6 × θ ,
where ν is the kinematic viscosity of the lubricant, mm2·s−1; A and B are the lubricant constants, A ≈ 8.04 and B ≈ 3.10; and θ is the lubricant temperature, °C.
The continuous phase lubricant is discretized using lubricant particles, as shown in Figure 5. As an important parameter in the CFD model, theoretically, the smaller the size of the lubricant particle, the more accurate and realistic the flow field results obtained. The diameter of the lubricant particles is defined as 1 mm, taking into account the current computing time and cost.
CFD simulations consume a considerable amount of resources, including not only computational power but also a large amount of time and manpower. Setting an appropriate time step may dramatically reduce the amount of time it takes to compute and boost the convergence. The appropriate time step Δt is determined based on the following formula [49]:
t = m i n t i , K l 0 u m a x , 1 2 d i l 0 2 ν + ν m a x ,
where Δt is the time step, Δti is the initialization time step, K is the courant number, l0 denotes the particle diameter, umax denotes the maximum velocity of the particle, di denotes the diffusion coefficient, ν denotes the dynamic viscosity of the fluid, and νmax represents its maximum value.
The running speed of a high-speed train, its initial lubricant volume, and its lubricant temperature are crucial operating parameters of a gearbox. To delve into the relationship between these operating parameters and lubrication characteristics, several CFD simulation models of the gearbox were established, as shown in Table 4. Models 1~4 investigate the influence of gear rotating speed, which is the running speed of the high-speed train, on the lubrication characteristics. In the numerical simulation process, the rotation directions of each gear are shown in Figure 5. Models 5~7 and Model 3 examine how lubricant temperature affects the lubrication characteristics. Models 8~10 along with Model 3 explore the influence of initial lubricant volume on the lubrication characteristics. In Models 8, 3, 9, and 10, the oil levels are adjusted to immerse the output gear at different heights: 1 ht in Model 8, 1.5 ht in Model 3, 2 ht in Model 9, and 2.5 ht in Model 10. The quantity of lubricant particles needed to discretize the lubricant at different levels using 1 mm particles are 697,674, 818,323, 909,672 and 1,027,081, respectively. ht represents the tooth height of the output gear, with ht = 13.7 mm.
All numerical simulation models are executed on a Dell workstation (graphics card: NVIDA RTX A4000; CPU: Intel Gold 9258R; RAM: 1.75 TB). The simulation time for each model is approximately 5~6 days. And, the simulation time is determined by the quantity of lubricant particles, lubricant physical properties, and gear rotating speeds.

4. Experiment Verification

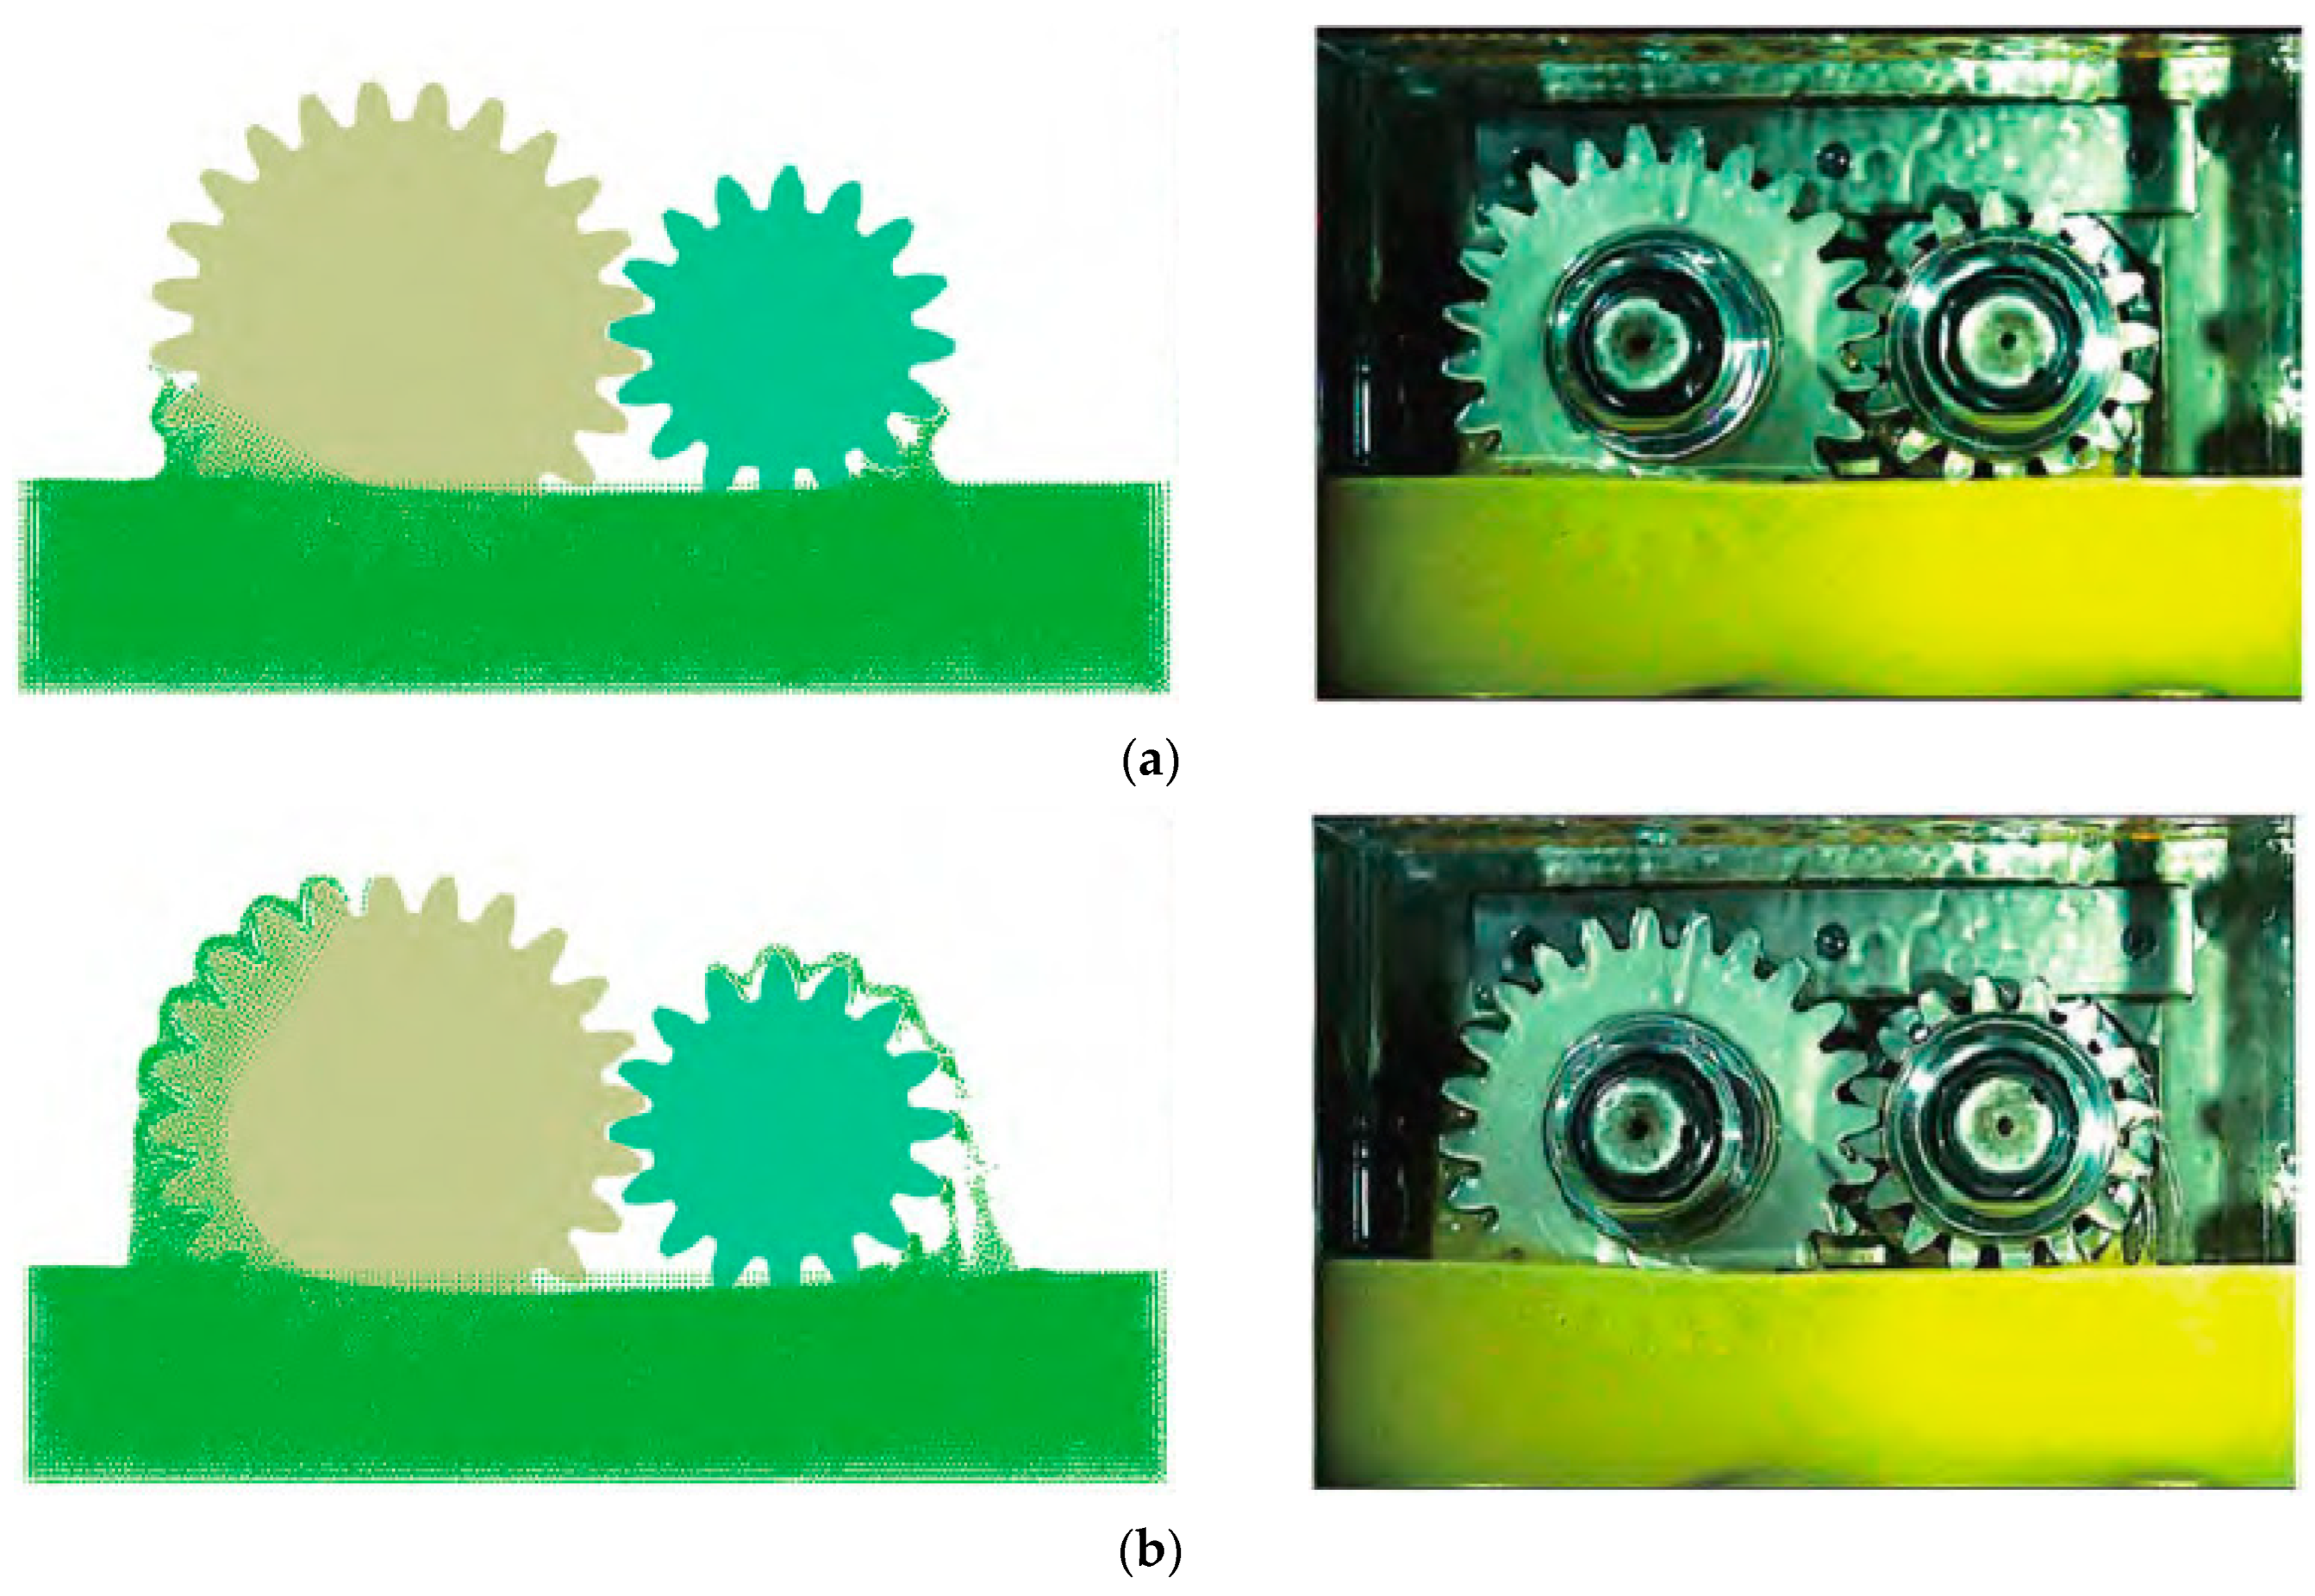
Due to the limitation of the experimental conditions, the same geometric model as the gearbox in reference [5] is established. The geometry dimensions of the gear pair are displayed in Table 5. The gearbox dimensions are 274 × 56 × 175 mm. The CFD simulation model was created using the shonDy, with the lubricant physical properties and gear speeds set the same as in reference [5], as detailed in Table 6. Condition 1 is used to verify the oil distribution, while conditions 2~7 are used to verify the churning torque. A comparison of the experiment and simulation results is depicted in Figure 6 and Figure 7.
As seen in Figure 6, when the pinion rotates 50°, the teeth initially immersed in the lubricant rotate three teeth. Due to the oil viscosity, a clear oil trail is formed. The gear rotates at a low speed and turns about two teeth. The lubricant churned up by the gear accumulates in the lower left of the gear, without forming a clear oil path. When the pinion rotates 100°, four oil trails form on the tooth side, with the outermost two almost overlapping. The centrifugal force acting on the lubricant churned up by the gear is about 2/3 that on the pinion. Due to the viscosity, the lubricant still accumulates in the lower left of the gear. The amount of lubricant churned up is also much more than when the pinion gear is rotated by 50°.
Figure 7 presents the simulated churning torque values predicted by MPS and the experiment churning torque values reported in reference [5]. Overall, the churning torque predicted by MPS and the experiment values both indicate an increase in churning torque as the pitch line velocity of the gear rises. Although there is a numerical deviation of about 30% between the results predicted by MPS and the experiment data, the overall trend displayed by both is consistent. This may be due to differences in the material characteristics of the lubricant or numerical errors caused by using discrete lubricant particles instead of a continuous phase. At both high and low pitch line velocities, the churning torque estimated through MPS demonstrates satisfactory concurrence with the experimental results. The comparison shows a strong agreement between the oil distribution and churning torque predicted by MPS and the experimental measurements. This demonstrates the capability of MPS to accurately forecast the oil distribution and churning torque in a gearbox.

5. Results and Discussions

5.1. Flow Field Simulation Results

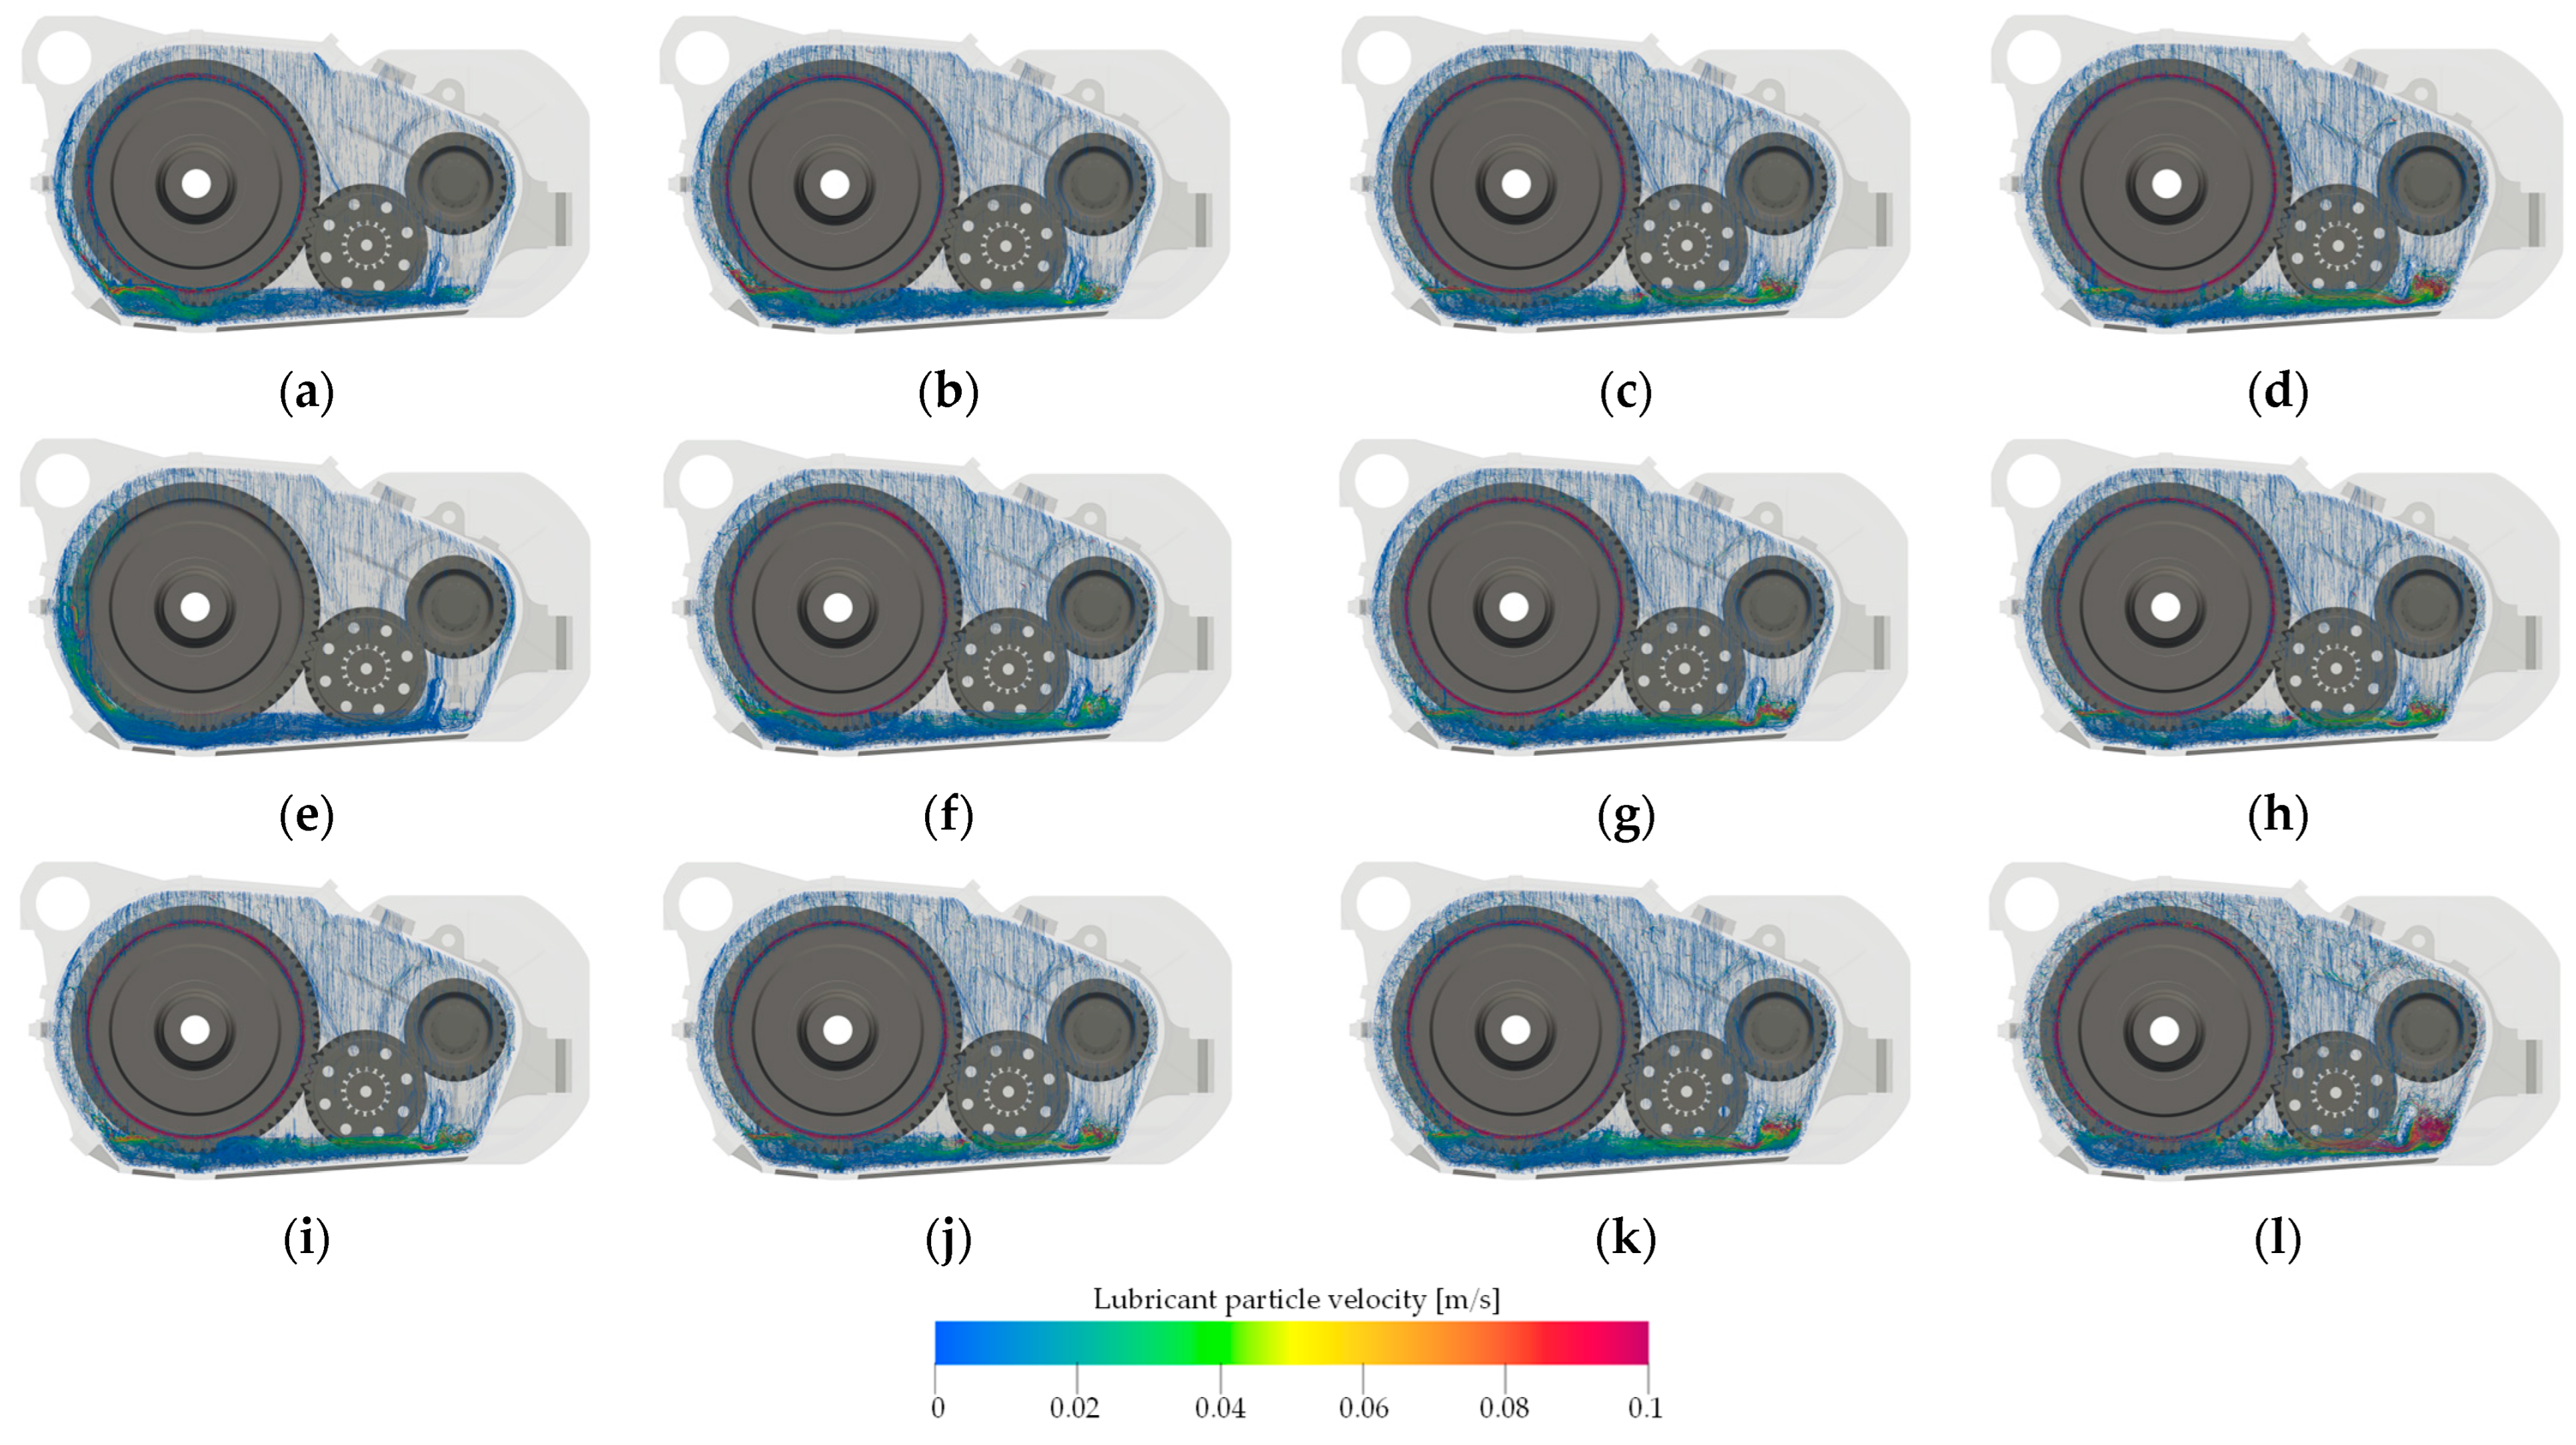
By post-processing the simulation results of the CFD models in Table 4, the motion morphology and physical characteristics of the lubricant particles under different working conditions were obtained. Figure 8 displays the particle velocity field of various models. All particles near the casing inner wall have relatively low velocities, while those near the gear surface have higher velocities. As can been seen from Models 1~4, as the gear rotating speed increases, the quantity of agitated lubricant particles increases and so does their initial velocity, leading to greater inertial forces on the lubricant particles. Under the agitation of the rapidly rotating gears, a greater number of lubricant particles reach the top of the casing and continue to splash onto the upper parts of the input pinion and idle gear. Models 5~7 and Model 3 reflect the impact of lubricant temperature on the splashing characteristics. Compared to Model 3 with the highest lubricant temperature, the quantity of lubricant particles in the casing upper part of Model 5 is significantly reduced, while Model 7 shows no particularly noticeable difference. The lubricant is approximately 163 times more viscous at −10 °C than it is at 80 °C, whereas the lubricant is approximately three times more viscous at 60 °C than it is at 80 °C. When the lubricant temperature decreases, the viscosity increases, and the lower the temperature, the more significant this increase trend becomes. When the low-temperature lubricant flows, the viscous forces between the lubricant molecules are dominant, and the fluidity of the lubricant is weakened, so the splash action of the lubricant particles becomes undermined. From Models 8~10 and Model 3, it can be seen that as the initial lubricant volume increases, the submergence deepness of the churning gear increases, the amount of lubricant churned by the churning gears also increases, and the lubricant particles in the casing upper part significantly increase. However, since the gear rotating speed and lubricant temperature remain constant, it can be roughly assumed that the inertial and viscous forces on the lubricant particles do not change. At this time, the increase in lubricant particles in the casing upper part depends primarily on the quantity of lubricant particles that are churned up, which will allow more lubricant to participate in lubrication.
Figure 8 further shows that there is no notable disparity in the distribution of lubricant particles at the bottom of the casing. This is mainly because the baffle at the base of the lower casing and on both sides of the gears can separate the gear churning area from the oil storage backflow area. The lubricant flowing down from the upper part of the casing along the side wall of the casing and the lubricant entering the oil storage chamber under the gear can always make the oil storage backflow area on both sides of the baffle be filled with lubricant.
To further analyze the characteristics of backflow and resplash in the gearbox, the simulation results were post-processed to obtain the lubricant particle pathlines, clearly depicted in Figure 9. From Models 1~4, it is evident that the pathline density of the lubricant particles in the oil storage chamber and backflow areas increases significantly as the gear rotating speed goes up, and the pathlines in the oil storage backflow areas become more continuous. The increased pathline density of lubricant particles in the oil storage chamber indicates an increase in the amount of lubricant entering the oil storage chamber. In this herringbone gearbox of a high-speed train, both the output gear and the idle gear act as churning gears. The increase in input pinion rotating speed simultaneously enhances the splashing effect of these two gears on the lubricant. Due to the oil guide plate, most of the lubricant churned up by the idle gear flows into the oil storage chamber. Additionally, some of the lubricant particles churned up by the output gear splash directly into the oil storage chamber. Figure 9e–h show the lubricant particle pathlines at different oil temperatures. Figure 9e shows the lubricant particle pathlines at a temperature of −10 °C. Compared to models at other temperatures, the lubricant fluidity at −10 °C is very weak, forming dense lubricant pathlines in the revolution direction of the output gear. As the temperature increases, the fluidity improves, and these dense lubricant pathlines disappear. Some of them flow back to the oil storage backflow areas, and the lubricant pathlines in the oil storage chamber are significantly denser. The fluidity of the lubricant in the oil storage backflow areas significantly increases, allowing the lubricant to re-participate in lubrication through the oil return holes underneath the output gear. From Figure 9i–l, it is clear that as the lubricant volume grows, the amount of lubricant in the oil storage chamber gradually increases. The increase in lubricant in the oil storage chamber enhances the fluidity of lubricant in the oil storage backflow areas, resulting in a noticeable recirculation at the bottom of the output gear.

5.2. Lubricant Film Distribution Results

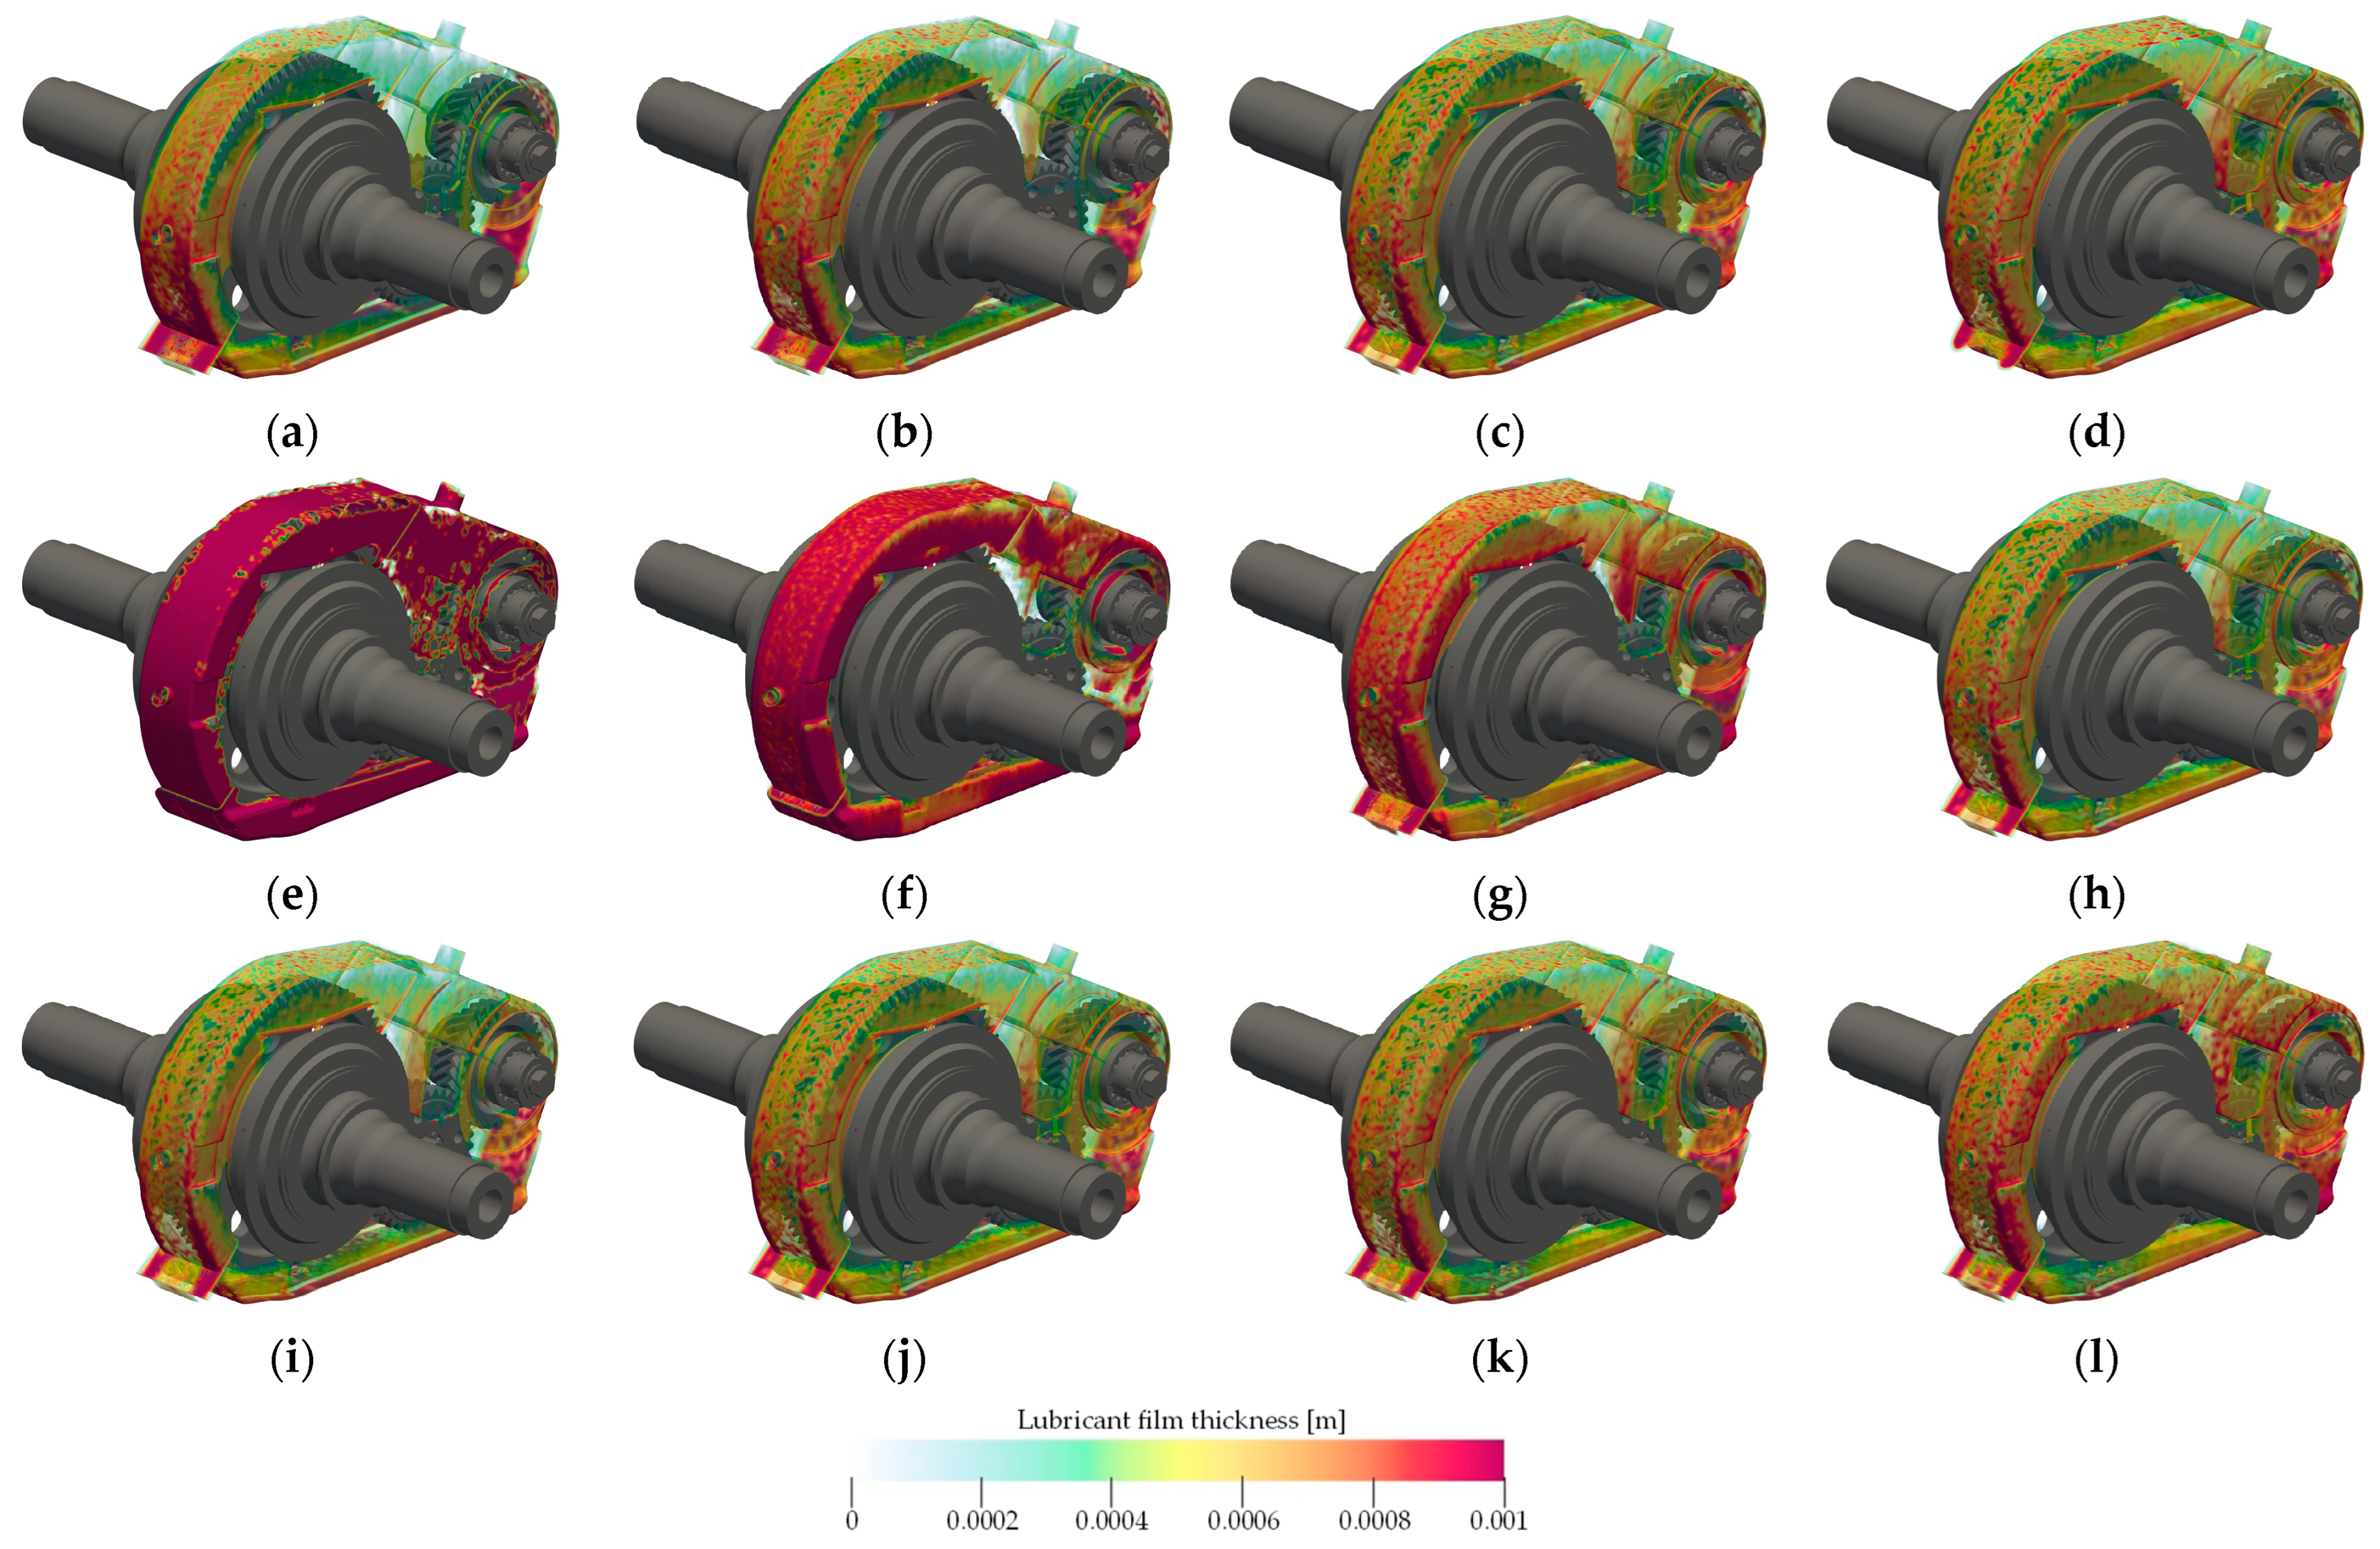
Figure 10 illustrates the lubricant film distribution contours on the inner wall of the casing for different models. The lubricant film thickness on the inner wall surface along the gear circumference is noticeably higher than on the side surfaces. Models 1~4 demonstrate that when the gear rotating speed rises, both the thickness and coverage of the lubricant film on the inner wall of the casing increase. The reason for that is primarily that the lubricant particles splash faster at higher rotating speeds. As the gear rotating speed goes up, the kinetic energy of the lubricant particles rises, leading to a more pronounced splashing effect. The fluidity of the lubricant film on the inner wall of the casing also enhances. The lubricant film thickness and coverage in Model 4 are significantly higher than those in Models 1 and 2. When the input pinion rotating speed increases from 1000 rpm to 4000 rpm, the coverage of the lubricant on the inner wall of the box increases from 37.7% to 47.8%. Figure 10e–h present the distribution contours of the lubricant film at various oil temperatures. A low-temperature lubricant has poor fluidity, and the lubricant film on the inner walls of Models 5 and 6 shows a thick and uneven characteristic. The fluidity of the lubricant is substantially enhanced as the lubricant temperature goes up. This not only makes the lubricant particles more easily reach the inner wall surface of the casing but also significantly improves the fluidity of the lubricant film. Therefore, the lubricant on the inner wall of the casings becomes more uniform, and the cumulative effect of the lubricant is significantly improved. From Figure 10i–l, it is observed that the distribution characteristics of the lubricant film are nearly consistent with the rise in lubricant volume, but the thickness of the lubricant film generally increases. When the submerged tooth amount of the output gear increases from 1 ht to 2.5 ht, the average thickness of the lubricant film rises from 0.07 mm to 0.18 mm, but the lubricant film coverage only increases by 9.9%. It is worth noting that although both the idle gear and the output gear act as churning gears, the distribution of the lubricant film mainly depends on the splashing effect of the output gear.

5.3. Analysis of Lubrication in the Meshing Zone

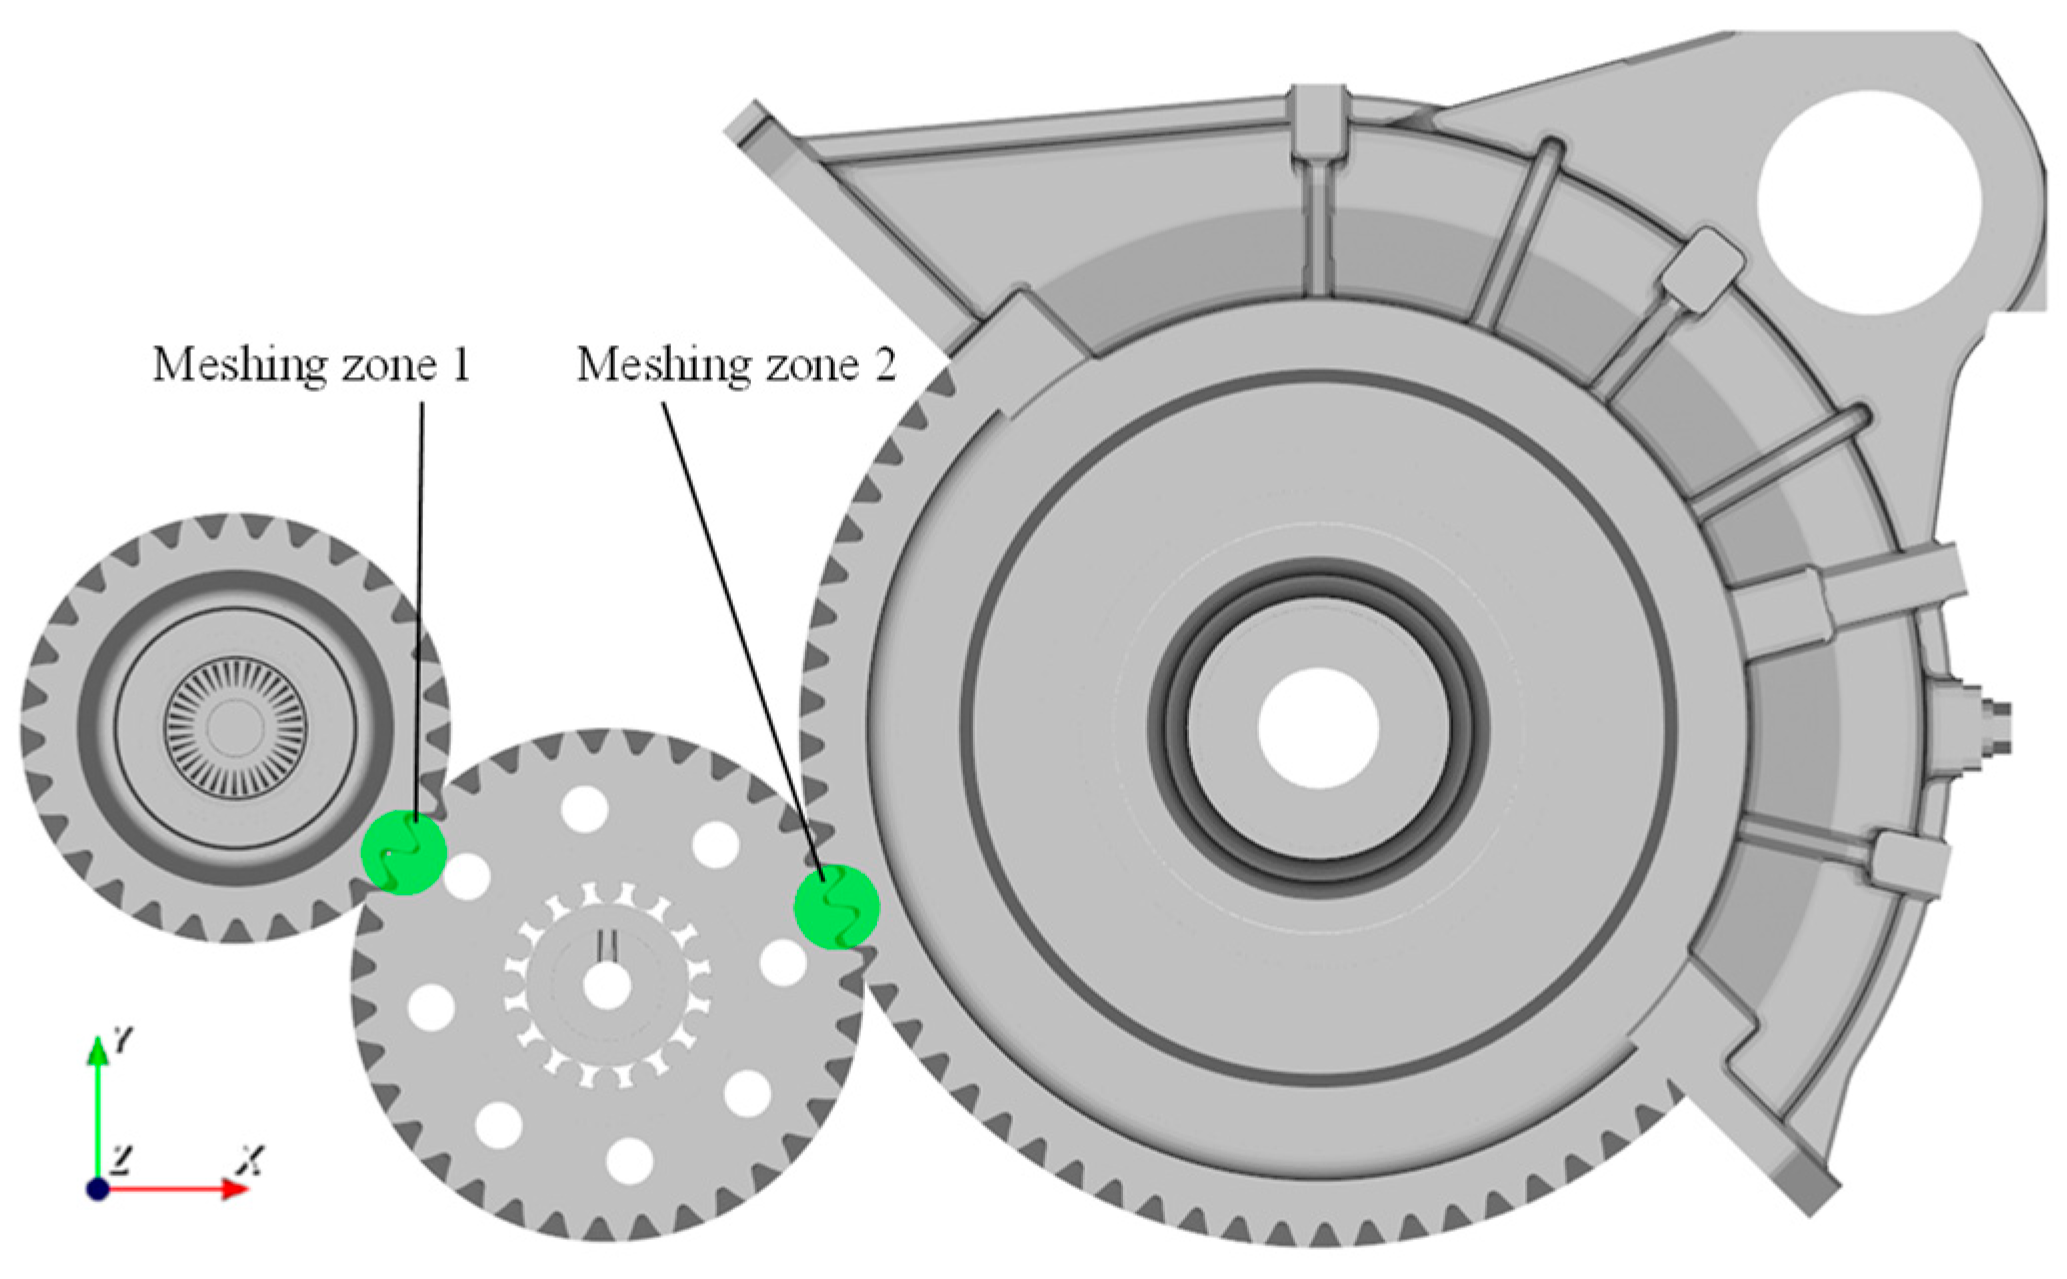
To further analyze the lubrication in the meshing zone, two meshing monitoring zones are set up between the input pinion and the idle gear, and the output gear and the idle gear to detect the quantity of lubricant particles in the meshing area, labeled as meshing zone 1 and meshing zone 2, respectively. The length of the meshing monitoring area is 70 mm, and the radius is 23 mm, precisely covering all the teeth involved in the meshing, as shown in Figure 11.
The average quantity of lubricant particles in the meshing monitoring zones from 2.5 to 3 s is used as the evaluation index of lubrication performance in the gear meshing zone, and the average lubricant particles in the meshing zones of different models is shown in Figure 12. The lubricant particles in meshing zones 1 and 2 decrease when the gear rotating speed goes up. This is mainly because in this herringbone gearbox with an idle gear, the churning effect of the output gear on the lubricant is dominant. As the gear rotates faster, the splashing effect of the gear becomes more pronounced. Although the fluidity of the lubricant is enhanced, the centrifugal force on the lubricant particles due to the high-speed rotating gears is also significant, causing them to splash onto the casing wall and form lubricant film, thereby reducing lubricant particles in the meshing zones.
From Model 5~7 and Model 3, it is evident that the lubrication state in the meshing zone is poor at lower temperatures. When the lubricant temperature rises to 20 °C and continues to increase, the lubricant particles in the gear meshing zones further reduce. At temperatures below 0 °C, the lubricant exhibits a high viscosity and low fluidity. To maintain a consistent splashing effect on the lubricant, the gear speeds are kept relatively high. In Model 5, the splashing effect of the lubricant is very strong, but the viscosity effect is also significant, making it very easy to condense on the inner wall of the casing. Therefore, there are fewer lubricant particles in the meshing zones. At a temperature of 20 °C, the lubricant viscosity decreases significantly, leading to an increase in fluidity. This causes certain lubricant particles to stick to the gear surface, facilitating their entry into the gear meshing zones. When the lubricant temperature further goes up, the fluidity is improved, and the lubricant particles are prone to form a film on the inner wall of the casing, increasing the coverage rate of the lubricant film and reducing the lubricant particles reaching the meshing zones.
The gear rotating speed and lubricant temperature of Models 8~10 and Model 3 are the same, but the volume of lubricant is different. That is, keeping the lubricant viscosity and the splashing effect constant, increasing the volume of lubricant will result in more lubricant particles to be churned by the gears. As a result, as lubricant volume grows, so do the lubricant particles in the gear meshing zones. It is worth noting that in Models 9 and 10, the initial lubricant level surpasses the oil baffle at the base of the lower casing, so some of the lubricant will leap over the oil baffle into the churning area instead of the oil return holes below the output gear. This portion of lubricant is more easily churned up by the idle gear into meshing zone 2 to participate in the lubrication of the idle gear and the input pinion.

5.4. Analysis of Churning Power Loss

The lubrication performance, transmission stability, and financial efficiency of energy-savings from the transmission system are all significantly impacted by gear churning power loss. Investigating the prediction and control methods of gear churning power loss is vital for optimizing the design, saving on energy, and reducing emissions. By post-processing the numerical results, the force exerted by the lubricant on the gear surface is regarded as resistance during the gear churning process, with the product of this force and the lever arm representing the gear churning torque. The churning power loss of the 10 models shown in Table 4 is analyzed, and the churning torque of each gear is recorded every 0.01 s, as shown in Figure 13.
A gradual ramp-up acceleration method is employed in the CFD model to mitigate the lubricant oscillation instability resulting from sudden gear acceleration. During the startup phase, the gear rotates slowly, and the resistance to oil churning is correspondingly modest. Then, as the lubricant enters a phase of intense change, the churning torque increases rapidly. Following an interval of oscillation, the flow field gradually stabilizes, and the gear churning torque also gradually stabilizes with slight oscillations. As shown in Figure 13a, the churning torque goes up with increasing gear rotating speeds, with this trend becoming more pronounced. Figure 13b shows the relationship between lubricant temperature and churning torque. In Model 5, the lubricant temperature is low, the lubricant fluidity is poor, and most of the churned lubricant adheres to the casing walls. Additionally, the flow of lubricant from the oil storage backflow area to the churning area is not smooth, resulting in less churned lubricant and minimal churning power loss. When the lubricant temperature rises above 20 °C, the change in viscosity is much smaller compared to the change from −10 to 20 °C. Therefore, the differences in churning torque among Models 6, 7, and 3 are not significant. From Figure 13c, it is evident that the churning torque goes up slightly with the growth in the immersion depth of the gear.
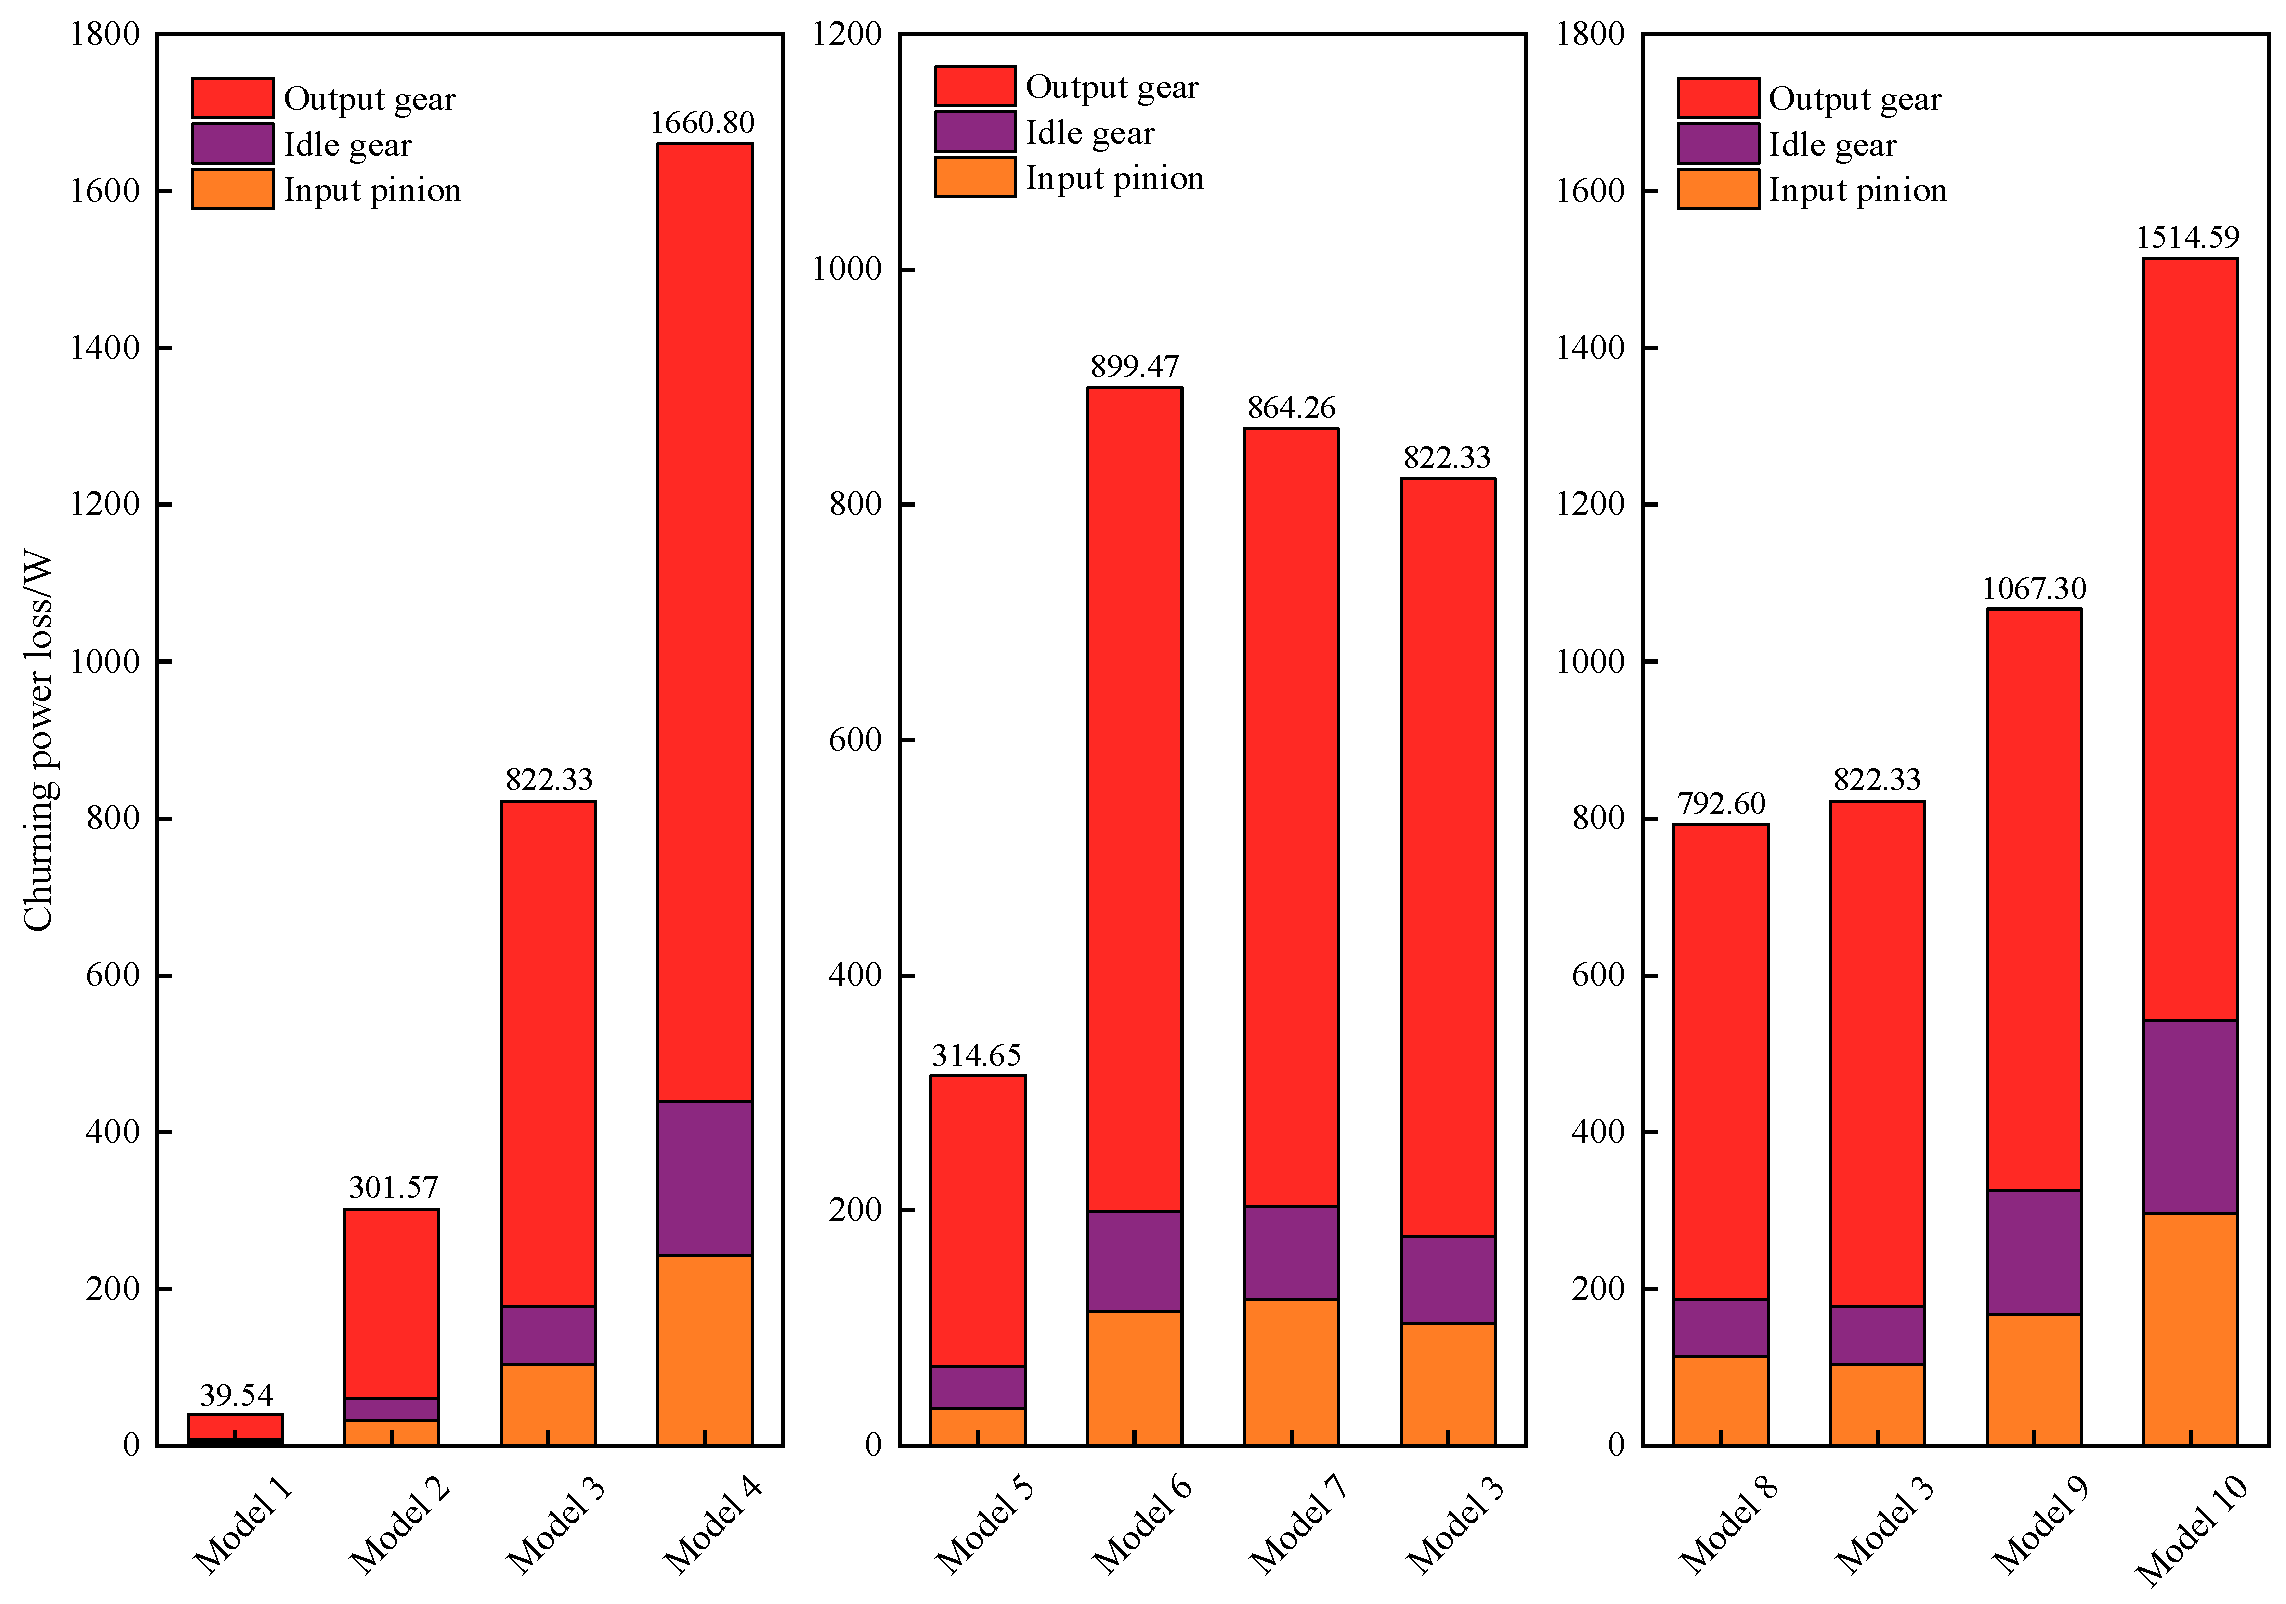
An average churning torque from 2.5 s to 3 s is taken as the churning torque. The churning power loss for different models is calculated using Equation (22), and the results are presented in Table 7. The comparison of churning power losses of the different models is shown in Figure 14.
P = T 1 n 1 + T 2 n 2 + T 3 n 3 9550
where T represents the gear churning torque and n represents the gear rotating speed. Subscripts 1, 2, and 3 represent the input pinion, idle gear, and output gear, respectively.
Based on the data shown in Figure 14 and Table 7, it is evident that the churning power loss ascends as the gear rotating speed and initial lubricant volume rise. Once the lubricant temperature reaches room temperature, further increasing the lubricant temperature will reduce the churning power loss. Notably, churning power loss becomes more sensitive to gear rotating speed, particularly under a high-speed gearbox operation. Compared to medium and low speeds, increasing the gear rotating speed will significantly increase churning power loss. Because of its high viscosity at low temperatures, the flow state of the lubricant is different from that at ordinary temperatures, resulting in lower churning power loss.

6. Conclusions and Future Work

In this paper, 10 high-fidelity CFD simulation models of a herringbone gear transmission gearbox with an idle gear for a high-speed train are established. The effects of gear rotating speed, lubricant volume, and temperature on the lubrication characteristics, lubrication in the meshing zone, and churning power loss are studied with MPS. The major conclusions of the present study are the following:
(1) MPS is utilized for investigating the lubrication characteristics of a herringbone gear transmission gearbox with an idle gear. This offers a novel research approach for the lubrication study of continuous gear transmission and non-convectional gear transmission. The combination of a liquid film flow model and MPS expands the capability of MPS to forecast the distribution of a liquid film on the surface of components and provides new indicators for the evaluation of gearbox lubrication.
(2) The velocity field and lubricant pathline for CFD models are visualized. The results indicate that the lubrication characteristics depend on the splashing effect of rotating gears on the lubricant and the fluidity of the lubricant. Gear rotating speed is the main factor influencing the splashing effect of the lubricant, while the lubricant fluidity is significantly affected by temperature. Increasing the initial lubricant volume not only enhances the splashing effect but also improves the lubricant fluidity.
(3) The distribution of the lubricant film on the inner wall of the casing for each model was analyzed. The results suggest that fast rotating gears enhance the thickness and coverage of the lubricant film on the casing inner wall. The higher the lubricant temperature, the more uniform the lubricant film distribution. Increasing the initial lubricant volume has little effect on the distribution characteristics of the lubricant film but significantly increases its thickness. In this two-stage herringbone transmission gearbox, the distribution of the lubricant film on the inner wall of the casing primarily depends on the splashing effect of the output gear on the lubricant.
(4) The quantity of lubricant particles in the meshing zone correlates positively with gear rotating speed and initial lubricant volume. When the lubricant temperature is above 20 °C, the lubricant particles in the meshing zone are negatively correlated with temperature. If the temperature is too low, the quantity of lubricant particles in the meshing zone will also be minimal.
(5) The gear churning torque of each model is extracted, and the churning power loss is analyzed. This analysis reveals that most of the churning power loss primarily comes from the output gear. As the initial lubricant volume and gear rotating speed increase, the churning torque increases, leading to an increase in churning power loss. When the lubricant temperature is above 20 °C, with the increase in temperature, the viscosity decreases, resulting in a reduction in churning torque and churning power loss. However, low-temperature lubricants have high viscosity and poor fluidity, resulting in low churning power loss.
The MPS method provides an intuitive method for visualizing the flow field in high-speed train gearboxes. Reference [50] employed the Taguchi optimization algorithm and a grey correlation analysis to optimize the parameters of the central gear of a planetary gearbox and evaluated the influence of modulus, tooth width, and material on the safety factor. This is very important to carry out parameter optimization of a high-speed train gearbox transmission system. Next, the State Key Laboratory of Rail Transit Vehicle System at Southwest Jiaotong University, in collaboration with CRRC Qingdao Sifang Co., Ltd., will conduct run-in tests on the high-speed train herringbone gearbox studied in this study. By opening transparent windows or arranging oil collection pipes at reasonable positions in the actual gearbox, the flow field characteristics of the gearbox can be analyzed. Torque sensors will be placed at the shaft ends of the output shaft to measure the resistance torque during gearbox operation. Run-in tests under multiple conditions will be conducted, and the simulation model will be corrected based on the measured data. The relationships between various parameters and churning power loss will be analyzed, and a mathematical model for directly calculating power loss will be derived using a dimensional analysis. In addition, long-term reliability experiments can be conducted to collect and analyze the data on the lubrication performance of gearboxes over time and to study the mechanisms of gear wear and lubricant degradation. This will help to gain a more comprehensive understanding of the performance of gearboxes under actual working conditions.
Author Contributions

S.S.: Conceptualization, methodology, formal analysis, investigation, data curation, writing—original draft preparation, writing—review and editing. K.Z.: Conceptualization, methodology, formal analysis, investigation, data curation, writing—original draft preparation, writing—review and editing, supervision, project administration. Y.Y.: Methodology, validation, supervision, project administration, funding acquisition. Y.L.: Software, data curation, formal analysis. J.Y.: Data curation, visualization, formal analysis, software. Z.X.: Software, resources, data curation, visualization. K.H.: Software, resources, visualization. All authors have read and agreed to the published version of the manuscript.

Funding

This research was funded by the National Natural Science Foundation of China (52372403, U2268211), the National Natural Science Foundation of Sichuan Province (2022NSFSC0034, 2022NSFSC1901), and the Independent Research and Development Projects of State Key Laboratory of Traction Power (2022TPL-T02).

Data Availability Statement

The data are contained within this article.

Conflicts of Interest

Author Zhuangzhuang Xin was employed by the company CRRC Qingdao Sifang Co., Ltd. Author Kuangzhou He was employed by the company Suzhou shonCloud Engineering Software Co., Ltd. The remaining authors declare that the research was conducted in the absence of any commercial or financial relationships that could be construed as a potential conflict of interest.

References

  1. Liang, X.H.; Liu, Z.L.; Pan, J.; Ma, X.; Zuo, M.J. Spur gear tooth pitting propagation assessment using model-based analysis. Chin. J. Mech. Eng. 2017, 30, 1369–1382. [Google Scholar] [CrossRef]
  2. Lu, F.; Wang, M.; Liu, W.; Bao, H.; Zhu, R. CFD-based calculation method of convective heat transfer coefficient of spiral bevel gear in intermediate gearbox under splash lubrication. Ind. Lubr. Tribol. 2021, 73, 470–476. [Google Scholar] [CrossRef]
  3. Hu, S.; Gong, W.; Gui, P. Numerical study on the churning power loss of spiral bevel gears at splash lubrication system. Ind. Lubr. Sci. 2024, 36, 259–276. [Google Scholar] [CrossRef]
  4. Jeong, W.; Seong, J. Comparison of effects on technical variances of computational fluid dynamics (CFD) software based on finite element and finite volume methods. Int. J. Mech. Sci. 2014, 78, 19–26. [Google Scholar] [CrossRef]
  5. Liu, H.; Jurkschat, T.; Lohner, T.; Stahl, K. Determination of oil distribution and churning power loss of gearboxes by finite volume CFD method. Tribol. Int. 2017, 109, 346–354. [Google Scholar] [CrossRef]
  6. Liu, H.; Jurkschat, T.; Lohner, T.; Stahl, K. Detailed investigations on the oil flow in dip-lubricated gearboxes by the finite volume CFD method. Lubricants 2018, 6, 47. [Google Scholar] [CrossRef]
  7. Hildebrand, L.; Dangl, F.; Sedlmair, M.; Lohner, T.; Stahl, K. CFD analysis on the oil flow of a gear stage with guide plate. Forsch. Ing. 2022, 86, 395–408. [Google Scholar] [CrossRef]
  8. Mastrone, M.N.; Hartono, E.A.; Chernoray, V.; Concli, F. Oil distribution and churning losses of gearboxes: Experimental and numerical analysis. Tribol. Int. 2020, 151, 106496. [Google Scholar] [CrossRef]
  9. Hu, X.; Wang, A.; Li, P.; Wang, J. Influence of dynamic attitudes on oil supply for bearings and churning power losses in a splash lubricated spiral bevel gearbox. Tribol. Int. 2021, 159, 106951. [Google Scholar] [CrossRef]
  10. Jiang, Y.; Hu, X.; Hong, S.; Li, P.; Wu, M. Influences of an oil guide device on splash lubrication performance in a spiral bevel gearbox. Tribol. Int. 2019, 136, 155–164. [Google Scholar] [CrossRef]
  11. Mastrone, M.N.; Concli, F. A multi domain modeling approach for the CFD simulation of multi-stage gearboxes. Energies 2022, 15, 837. [Google Scholar] [CrossRef]
  12. Ouyang, T.; Mo, X.; Lu, Y.; Wang, J. CFD-vibration coupled model for predicting cavitation in gear transmissions. Int. J. Mech. Sci. 2022, 225, 107377. [Google Scholar] [CrossRef]
  13. Liu, Y.Y.; An, K.; Liu, H.; Gong, J.G.; Wang, L.Q. Numerical and experimental studies on flow performances and hydraulic radial forces of an internal gear pump with a high pressure. Eng. Appl. Comp. Fluid 2019, 13, 1130–1143. [Google Scholar] [CrossRef]
  14. Mithun, M.G.; Koukouvinis, P.; Karathanassis, I.K.; Gavaises, M. Numerical simulation of three-phase flow in an external gear pump using immersed boundary approach. Appl. Math. Model. 2019, 72, 682–699. [Google Scholar] [CrossRef]
  15. Liu, H.; Arfaoui, G.; Stanic, M.; Montigny, L.; Jurkschat, T.; Lohner, T.; Stahl, K. Numerical modelling of oil distribution and churning gear power losses of gearboxes by smoothed particle hydrodynamics. Proc. Inst. Mech. Eng. Part J J. Eng. Tribol. 2019, 233, 74–86. [Google Scholar] [CrossRef]
  16. Ji, Z.; Stanic, M.; Hartono, E.A.; Chernoray, V. Numerical simulations of oil flow inside a gearbox by smoothed particle hydrodynamics (SPH) method. Tribol. Int. 2018, 127, 47–58. [Google Scholar] [CrossRef]
  17. Legrady, B.; Taesch, M.; Tschirschnitz, G.; Mieth, C.F. Prediction of churning losses in an industrial gear box with spiral bevel gears using the smoothed particle hydrodynamic method. Forsch. Ing. 2022, 86, 379–388. [Google Scholar] [CrossRef]
  18. Liu, H.; Xie, C.; Li, D.; Wang, J. Flow field distribution of splash lubrication of gearbox and churning gear torque loss. J. Zhejiang Uni. (Eng. Sci.) 2021, 55, 875–886. [Google Scholar]
  19. Guo, D.; Chen, F.; Liu, J.; Wang, Y.; Wang, X. Numerical modeling of churning power loss of gear system based on moving particle method. Tribol. Trans. 2020, 63, 182–193. [Google Scholar] [CrossRef]
  20. Deng, X.; Wang, S.; Wang, S.; Wang, J.; Liu, Y.; Dou, Y.; He, G.; Qian, L. Lubrication mechanism in gearbox of high-speed railway trains. J. Adv. Mech. Des. Syst. Manuf. 2020, 14, JAMDSM0054. [Google Scholar] [CrossRef]
  21. Deng, X.; Wang, S.; Hammi, Y.; Qian, L.; Liu, Y. A combined experimental and computational study of lubrication mechanism of high precision reducer adopting a worm gear drive with complicated space surface contact. Tribol. Int. 2020, 146, 106261. [Google Scholar] [CrossRef]
  22. Deng, X.; Wang, S.; Qian, L.; Liu, Y. Simulation and experimental study of influences of shape of roller on the lubrication performance of precision speed reducer. Eng. Appl. Comp. Fluid 2020, 14, 1156–1172. [Google Scholar] [CrossRef]
  23. Shao, S.; Zhang, K.; Yao, Y.; Liu, Y.; Gu, J. Investigations on lubrication characteristics of high-speed electric multiple unit gearbox by oil volume adjusting device. J. Zhejiang Univ. Sci. A 2022, 23, 1013–1026. [Google Scholar] [CrossRef]
  24. Hildebrand, L.; Liu, H.; Paschold, C.; Lohner, T.; Stahl, K. Classification of numerical, experimental, and analytical approaches for gearbox oil flow and no-load gear power loss. Eng. Sci. Technol. 2024, 53, 101661. [Google Scholar] [CrossRef]
  25. Bagal, D.K.; Barua, A.; Jeet, S.; Acharjya, D.; Pattanaik, A.K.; Panda, S.N. Tribological investigation of quality of the industrial speed reducer synthetic lube oil used in material handling industry. Mater. Today Proc. 2022, 50, 1918–1922. [Google Scholar] [CrossRef]
  26. Liu, H.; Liu, H.; Zhu, C.; Parker, R.G. Effects of lubrication on gear performance: A review. Mech. Mach. Theory 2020, 145, 103701. [Google Scholar] [CrossRef]
  27. Macias, A.; Litwinski, M. Assessment of motor oil wear in trucks. J. Balk Tribol. Assoc. 2021, 27, 21–40. [Google Scholar]
  28. Bukvić, M.; Gajević, S.; Skulić, A.; Savić, S.; Ašonja, A.; Stojanović, B. Tribological application of nanocomposite additives in industrial oils. Lubricants 2023, 12, 6. [Google Scholar] [CrossRef]
  29. Xiao, Z.; Shi, X.; Wang, X.; Ma, X.; Han, Y. Lubrication analysis and wear mechanism of heavily loaded herringbone gears with profile modifications in full film and mixed lubrication point contacts. Wear 2021, 477, 203790. [Google Scholar] [CrossRef]
  30. Mo, S.; Zeng, Y.; Wang, Z.; Zhang, W. Nonlinear Dynamic Analysis of Herringbone Gears Transmission. J. Vib. Eng. Technol. 2024, 12, 5811–5833. [Google Scholar] [CrossRef]
  31. Li, Z.; Wang, S.; Li, L.; Li, F.; Liu, L.; Zou, H. Study on multi-clearance nonlinear dynamic characteristics of herringbone gear transmission system under optimal 3d modification. Nonlinear Dynam. 2023, 111, 4237–4266. [Google Scholar] [CrossRef]
  32. Kuczyk, M.; Jędrzejewski, P.; Załuski, P. The construction of suspended rail vehicle bogie. Rail. Vehicles 2021, 4, 1–13. [Google Scholar]
  33. Xie, Y. A modern mobility solution for urban transit with the latest generation of the INNOVIA system. In Proceedings of the 14th International Conference on Automated People Movers and Automated Transit Systems, Phoenix, AZ, USA, 21–24 April 2013. [Google Scholar]
  34. Pak, C.; Han, P.; Ri, K.; Ri, Y.; Hwang, I. Numerical analysis of the nonlinear free surface flow around an advancing ship using moving particle semi-implicit method. AIP Adv. 2021, 11, 035106. [Google Scholar] [CrossRef]
  35. Wang, Z.; Matsumoto, T.; Duan, G.; Matsunaga, T. Compact moving particle semi-implicit method for incompressible free-surface flow. Comput. Methods Appl. Mech. Eng. 2023, 414, 116168. [Google Scholar] [CrossRef]
  36. Wu, W.; Wei, C.; Yuan, S. Numerical simulation of ball bearing flow field using the moving particle semi-implicit method. Eng. Appl. Comp. Fluid 2022, 16, 215–228. [Google Scholar] [CrossRef]
  37. Xie, F.; Zhao, W.; Wan, D. Overview of moving particle semi-implicit techniques for hydrodynamic problems in ocean engineering. J. Mar. Sci. Appl. 2022, 21, 1–22. [Google Scholar] [CrossRef]
  38. Li, G.; Wen, P.; Feng, H.; Zhang, J.; Yan, J. Study on melt stratification and migration in debris bed using the moving particle semi-implicit method. Nucl. Eng. Des. 2020, 360, 110459. [Google Scholar] [CrossRef]
  39. Koshizuka, S.; Oka, Y. Moving-particle semi-implicit method for fragmentation of incompressible fluid. Nucl. Sci. Eng. 1996, 123, 421–434. [Google Scholar] [CrossRef]
  40. Zhao, L.; Punetha, M.; Ma, W.; Konovalenko, A.; Bechta, S. Simulation of melt spreading over dry substrates with the moving particle semi-implicit method. Nucl. Eng. Des. 2023, 405, 112229. [Google Scholar] [CrossRef]
  41. Liu, X.; Morita, K.; Zhang, S. Direct numerical simulation of incompressible multiphase flow with vaporization using moving particle semi-implicit method. J. Comput. Phys. 2021, 425, 109911. [Google Scholar] [CrossRef]
  42. Daneshvar, F.A.; Rakhshandehroo, G.R.; Talebbeydokhti, N. New modified gradient models for MPS method applied to free-surface flow simulations. Appl. Ocean Res. 2017, 66, 95–116. [Google Scholar] [CrossRef]
  43. Monaghan, J.J. Simulating free surface flows with SPH. J. Comput. Phys. 1994, 110, 399–406. [Google Scholar] [CrossRef]
  44. Vita, P.; Gschaider, B.F.W.; Prieling, D.; Steiner, H. Thin film flow simulation on a rotating disc. In Proceedings of the European Congress on Computational Methods in Applied Sciences and Engineering, Vienna, Austria, 10–14 September 2012. [Google Scholar]
  45. Wei, C.; Wu, W.; Gui, P.; Zou, T.; Yuan, S.; Zhou, J. Analysis of churning losses distribution of hydraulic pump in engineering vehicles using MPS method. Proc. Inst. Mech. Eng. Part D J. Automob. Eng. 2023, 237, 1947–1958. [Google Scholar] [CrossRef]
  46. Wei, C.; Wu, W.; Hou, X.; Nelias, D.; Yuan, S. Research on flow pattern of low temperature lubrication flow field of rotating disk based on MPS method. Tribol. Int. 2023, 180, 108221. [Google Scholar] [CrossRef]
  47. Harris, T.A.; Kotzalas, M.N. Rolling Bearing Analysis, 5th ed.; Taylor & France Group: Boca Raton, FL, USA, 2008; p. 182. [Google Scholar]
  48. AGMA 925-A03; Effect of Lubrication on Gear Surface Distress. American Gear Manufacturers Association: Alexandria, VA, USA, 2003; pp. 9–10.
  49. De Moura, C.A.; Kubrusly, C.S. The Courant-Friedrichs-Lewy (CFL) Condition: 80 Years after Its Discovery; Birkhäuser: Basel, Switzerland, 2013. [Google Scholar]
  50. Miladinovic, S.; Velickovic, S.; Stojanovic, B.; Nikolic, R. Optimization of parameters of a planetary gearbox using the taguchi-grey relational analysis. Commun. Sci. Lett. Univ. Zilina 2018, 20, 30–35. [Google Scholar] [CrossRef]
Figure 1. Failure modes of gearbox: (a) gear pitting; (b) bearing high-temperature burnouts.
Lubricants 12 00270 g001
Figure 2. Schematic diagram of fluid–solid boundary particles.
Lubricants 12 00270 g002
Figure 3. Two-dimensional approximate thin film flow model.
Lubricants 12 00270 g003
Figure 4. Exploded view of a herringbone gearbox. 1—GW seal ring, 2—GW end cup, 3—GW bush, 4—GW bearing, 5—casing up, 6—elastic node, 7—output gear, 8—GM bearing, 9—GM seal ring A, 10—GM seal ring B, 11—GM bush, 12—GM end cup, 13—output axis, 14—PM end cup, 15—PM bush, 16—PM retaining ring, 17—idle axis, 18—PM seal ring, 19—IM inner retaining ring, 20—IM outer retaining ring, 21—IM bearing, 22—PM bearing, 23—idle gear, 24—input pinion, 25—PW axis retaining ring, 26—input axis, 27—casing down, 28—hanger rod, 29—PW bearing, 30—PW retaining ring, 31—PW bush, 32—PW end cup A, 33—PW end cup B, 34—IW end cup, 35—IW bush, 36—IW retaining ring, 37—IW bearing.
Lubricants 12 00270 g004
Figure 5. Schematic diagram of initial lubricant particles.
Lubricants 12 00270 g005
Figure 6. Oil distribution comparison at startup after 50° and 100° pinion rotations: (a) after 50°; (b) after 100°.
Lubricants 12 00270 g006
Figure 7. Comparison between the churning torque predicted by MPS and the experiment results: (a) oil level = 21.6 mm beneath the midpoint, θ = 60 °C; (b) oil level = 20.0 mm beneath the midpoint, θ = 90 °C.
Lubricants 12 00270 g007
Figure 8. Lubricant particles’ velocity field of different models: (a) Model 1; (b) Model 2; (c) Model 3; (d) Model 4; (e) Model 5; (f) Model 6; (g) Model 7; (h) Model 3; (i) Model 8; (j) Model 3; (k) Model 9; (l) Model 10.
Lubricants 12 00270 g008
Figure 9. Lubricant particle pathlines of different models: (a) Model 1; (b) Model 2; (c) Model 3; (d) Model 4; (e) Model 5; (f) Model 6; (g) Model 7; (h) Model 3; (i) Model 8; (j) Model 3; (k) Model 9; (l) Model 10.
Lubricants 12 00270 g009
Figure 10. Lubricant film distribution contours under different working conditions: (a) Model 1; (b) Model 2; (c) Model 3; (d) Model 4; (e) Model 5; (f) Model 6; (g) Model 7; (h) Model 3; (i) Model 8; (j) Model 3; (k) Model 9; (l) Model 10.
Lubricants 12 00270 g010
Figure 11. Schematic diagram of meshing monitoring zones.
Lubricants 12 00270 g011
Figure 12. Quantity of lubricant particles in meshing zones of different models.
Lubricants 12 00270 g012
Figure 13. Churning torque of different models: (a) Models 1–4 with different gear rotating speeds; (b) Models 5–7 and Model 3 with different lubricant temperatures; (c) Models 8–10 and Model 3 with different lubricant volumes.
Lubricants 12 00270 g013
Figure 14. Churning power loss of different models.
Lubricants 12 00270 g014
Table 1. Main design parameters of a herringbone gearbox.
Input PinionIdle GearOutput Gear
Normal model [mm]444
Number of teeth293573
Tooth width [mm]707070
Pressure angle [°]202020
Center distance [mm]242405
Helical angle [°]383838
Table 2. Basic material characteristics of 75W-90.
Density at 15 °C ρ15 [kg·m−3]Flash Point θf [°C]Pour Point θp [°C]Kinematic Viscosity at 40 °C ν40 [mm2·s−1]Kinematic Viscosity at 100 °C ν100 [mm2·s−1]Viscosity IndexGrade
867220−5011616.6160APIGL5
Table 3. The viscosity and density of 75W-90 at different temperatures.
Temperature θ [°C]Kinematic Viscosity ν [mm2·s−1]Density ρ [kg·m−3]
−103480.97882
20342.55864
5074.36846
8025.85828
Table 4. CFD model parameters of the herringbone gearbox.
Research VariablesRotating Speed of Input Pinion [rpm]Submerged Teeth Height [ht]Lubricant Temperature [°C]
1Gear rotating speed10001.580
220001.580
330001.580
440001.580
5Lubricant temperature30001.5−10
630001.520
730001.550
330001.580
8Lubricant volume3000180
330001.580
93000280
1030002.580
Table 5. The geometry dimensions of the gear pair in the FZG gearbox.
Gear Center Distance [mm]Tooth NumberModule [mm]Pressure Angle [°]Modification CoefficientGear Face Width [mm]Tip Diameter [mm]
Pinion91.5164.5200.1821482.46
Gear240.171118.36
Table 6. FZG gearbox operating conditions.
Lubricant Temperature θ [°C]Distance between the Oil Level and the Midpoint of the Gear [mm]Gear Rotating Speed [rpm]Pitch Line Velocity [m/s]
14036.74072.3
26021.63482.0
36021.614448.3
46021.6347420.0
59020.03482.0
69020.014448.3
79020.0347420.0
Table 7. Churning torque and power loss of different models.
Churning Torque of Input Pinion [Nm]Churning Torque of Idle Gear [Nm]Churning Torque of Output Gear [Nm]Churning Power Loss [W]
10.04280.04150.756339.54
20.15140.16172.9064301.57
30.33220.28215.1649822.33
40.57960.56507.34381660.80
50.10190.13661.9799792.60
60.36230.32655.61461067.30
70.39490.30465.29631514.59
80.36080.28194.8550314.65
90.33220.28215.1649899.47
100.94480.94267.7924864.26
Disclaimer/Publisher’s Note: The statements, opinions and data contained in all publications are solely those of the individual author(s) and contributor(s) and not of MDPI and/or the editor(s). MDPI and/or the editor(s) disclaim responsibility for any injury to people or property resulting from any ideas, methods, instructions or products referred to in the content.