Abstract
The aim of this work is to verify the applicability of thermography as a non-destructive technique to quantify the wear performance of several high-entropy alloy coatings. Thermal profiles obtained from passive and active thermography were analyzed and the results were correlated with the classical tribological approaches defined in standards. HEA coatings made of several chemical compositions (AlxCoCrCuFeNi and MnCoCrCuFeNi) and realized by using different cold spray temperatures (650 °C, 750 °C, and 850 °C) were tested in a pin-on-disk configuration, with a dedicated pin developed for the wear tests. Then, the wear performances of each sample were analyzed with the hardness and wear parameter results. The thermal profiles of passive and active thermography allowed a complete characterization of the wear resistance and performance analysis of the coatings analyzed. The results are also compared with those presented in the literature.
1. Introduction
The remarkable mechanical properties, fatigue resistance, and ability to withstand high temperatures of traditional materials such as nickel, cobalt, and titanium-based alloys are widely applied in high-temperature scenarios, such as aeroengines, gas turbines, and the nuclear industry.
However, these materials may fail prematurely under extreme environmental conditions due to their insufficient resistance to friction and wear [1,2,3,4,5,6]. It is estimated that maintenance and replacement expenses as a result of this wear and tear can amount to approximately 1–2% of the GDP of industrialized nations.
In order to improve engineering components’ performance, dependability, and longevity, it is imperative to develop materials which are mechanically strong and exhibit superior wear resistance.
Previous research has suggested that materials possessing favorable mechanical qualities, such as high hardness, elastic modulus, and fracture toughness, can lead to improved tribological performance in various applications [7,8]. High-entropy alloys (HEAs), a recent advancement in alloy development, have garnered considerable interest due to their potential properties [9,10,11,12,13].
HEAs are alloys comprising five or more primary elements in equimolar or near-equimolar ratios [9,11,14]. These alloys can exhibit outstanding characteristics which surpass those of traditional alloys, including superior strength and hardness, notable resistance to wear, exceptional resilience under high-temperature conditions, robust structural stability, and excellent resistance to corrosion and oxidation [15].
The tribological characteristics of HEAs are of large significance in industrial applications, leading to extensive research into their friction and wear performances under various conditions. For example, studies have investigated the adhesive wear behavior of AlxCoCrCuFeNi HEAs under atmospheric conditions [16]. These findings have revealed that higher aluminum concentrations are associated with increased hardness, resulting in significantly enhanced wear resistance [17]. Wu and colleagues [16] examined the adhesive wear characteristics of AlxCoCrCuFeNi high-entropy alloys and found that at aluminum fractions of 0.05 and 1.0 molar ratios, the predominant wear mechanism was delamination wear. However, increasing the aluminum content to a 2.0 molar ratio shifted the wear mechanism to predominantly oxidative wear. Similarly, Hsu et al. [18] analyzed the effect on sliding wear resistance of adding iron to AlCoCrFeXMo0.5Ni. They noted a reduction in wear rate with increasing iron content, attributed to heightened oxidation and sigma phase formation [19].
The coating quality plays a significant role in determining the mechanical properties and wear resistance of coated contacts [20,21]. It is possible to investigate the characterization of coatings using a variety of methodologies depending on the type, composition, and thickness of the coating and its substrate. A destructive technique can be used to directly characterize materials. To estimate mechanical properties and superficial qualities, measurements of hardness and roughness are widely used. In recent decades, active thermography (AT) techniques have become increasingly popular due to their non-contact nature and the ability to cover a wide area. Thermography has been used in many research fields related to coatings over the years, both in passive and active configurations, with the aim of investigating mechanical properties or coating quality. Using passive thermography (PT), it has been possible to assess the quality and performance of several plasma sprayed coatings on the contact fatigue life [21,22]. In these papers, the temperature of the contact point was chosen as the optimal infrared signal since it is only the preheating that is associated with the failure of the coating. The authors of [21,23] and [21,24] discuss interesting topics related to AT, such as microscopic cracks and coating adhesions. Accordingly, [23] highlighted how thermal maps generated by vibrothermography stimulated by ultrasound can be used to detect microcracks.
The purpose of this research is to investigate the feasibility of using AT techniques to characterize the wear performance of HEA coatings as an innovative process. A variety of HEA coatings (AlxCoCrCuFeNi and MnCoCrCuFeNi) deposited at different cold spray temperatures (650 °C, 750 °C, and 850 °C) were analyzed. The wear performance of HEA coatings using a pin-on-disk configuration and using PT and AT was analyzed. Thermal profiles were analyzed and correlated with classical tribological approaches as defined by standards.
2. Materials and Methods
Samples adopted in this study are made of a substrate and an HEA coating deposited with a cold spray technique. In particular, the substrate utilized for each sample is magnesium, while the HEA coating is generated with several HEA chemical composition and cold spray deposition temperatures. Figure 1 shows the tested samples and also a scheme of the coating geometry over the substrate, while in Table 1 the geometrical, chemical, and process parameters are summarized.

Figure 1.
Tested samples (left side) and geometrical shape (right side).

Table 1.
Process parameters and geometrical dimensions.
A detailed characterization of the hardness and roughness of the same coatings tested in this work was performed in [15] by the same authors.
Wear tests were performed by using a tribometer with a setup close to a classical pin-on-disk configuration. A dedicated device similar to a pin was designed with the aim to ensure the clamping of tested samples and to guarantee the visibility of the contact surfaces during PT acquisitions. Concerning the counterpart utilized during the wear tests, disks were made of quenched 100Cr6 steel with a grinding surface. A hardness of 850 HV with a roughness of 0.05 (Ra) was obtained for all counterparts.
Figure 2 illustrates the designed pin with the corresponding 3D CAD geometry and also the experimental setup utilized during the wear tests. Wear testing parameters are illustrated in Table 2 and the tests were performed with a unidirectional rotation in ambient conditions.
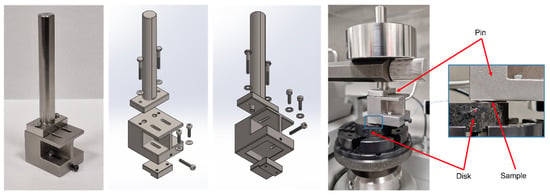
Figure 2.
Designed pin and experimental setup during wear tests.

Table 2.
Wear testing parameters.
The wear volume computation for the tested samples was realized by using a digital microscope with a resolution of 0.01 μm. The mean value of the surface profile was generated by considering 60 lines equally spaced over the 3D surface of the sample. This procedure was carried out before and after the wear test acquiring the surface of the sample by using the 3D Stitching function available in the digital microscope. This way, the wear area (ΔArea) is computed as the difference between surface profiles before and after the wear test conditions. The corresponding wear volume (ΔVolume) was obtained by multiplying the ΔArea with the length of the sample. Figure 3 shows, as an example for Sample 5, the ΔArea comparison (left side) and the coating surfaces (right side) before and after the wear test. The same results for each sample are shown in Supplementary Materials.
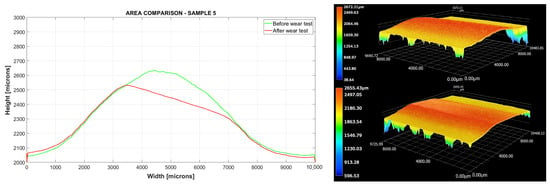
Figure 3.
Area (left side) and 3D optical microscope comparison (right side) for Sample 5.
The mass reduction in the HEA samples, generated by the wear process, was also evaluated by means of a balance with a resolution of 0.0001 g. The coating was properly cleaned after the wear test to avoid debris during the mass measurement.
The wear characterization was obtained by using the well-known parameters such as the wear rate, the Archard’s coefficient, and the wear resistance [25,26]. The specific wear rate parameter is very useful for comparing experimental results obtained in case of different wear testing conditions [27]. More in detail, the formula is illustrated in Equation (1):
where is the specific wear rate in [mm3/Nm], is the wear volume in [mm3], is the normal load in [N], and is the sliding distance in [mm]. The wear resistance is its reciprocal. In the literature [28,29], the wear resistance is related to the hardness of the sample. This way, the comparison between the wear resistance and the structure of the coating, which is related to the production process, can be investigated. The Archard’s coefficient allows evaluation of the wear resistance of coating during tests. This parameter considers both tested materials and wear testing conditions, and can be computed as in Equation (2):
where is the dimensionless Archard’s coefficient and is the less hard material in [MPa].
The wear characterization with AT and PT was realized with thermal profiles extracted from thermograms. The PT approach was used to compare the temperature increment generated during the wear test with the corresponding coefficient of friction (COF) measured with the tribometer. For what concerns the AT approach, it was investigated to evaluate its feasibility as non-destructive technique for the wear volume estimation by comparing the thermal responses of the same ROI from the thermograms obtained before and after the wear damage. Thermography analyses were performed by means of two different thermal cameras.
Figure 4 and Figure 5 show experimental setups during PT and AT. An example of the thermogram during PT is illustrated on the right side of Figure 4. In particular, an IR Thermal camera (NETD 0.08 °C) was utilized to acquire thermal profiles and the reference specimen was allowed to control the environmental temperature during the test. Thermal profiles were extracted with a cursor located in the contact point between the disk and the tested sample. The absolute temperature was directly used for the analysis since no relevant environmental temperature variations were observed during the wear tests.
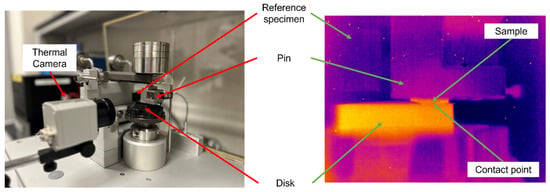
Figure 4.
Passive thermography experimental setup.

Figure 5.
Active thermography equipment and experimental setup.
AT response was acquired by means of another IR thermal camera with a sensitivity lower than 20 mK and a 3–5 μm spectral range. The heating source was a laser beam with a maximum power of 50 W. The reflection mode configuration was adopted, and samples were located 440 mm distance from the thermal camera. The maximum frame rate acquisition was selected, corresponding to 785.67 Hz. Environmental conditions (room temperature and humidity) were monitored during each test, while the corresponding reflected temperature was estimated according to the standard [30]. The pulsed technique was utilized and an energy contribution made of a pulse period of 250 ms and a laser power of 30 Watt were utilized for each sample. The diameter of the laser spot was 6 mm and the laser power distribution over the spot had a Gaussian distribution. Then, a region of interest (ROI) with 4288 pixels was chosen to extract thermal profiles in radiance unit measurements. Thanks to the same superficial aspect of each sample, radiance was adopted instead of temperature to avoid emissivity problems related to its computation. Four replications were performed and then the corresponding mean value was computed.
The substrate zone was chosen as the heated zone since it remained undamaged before and after wear tests. As a matter of fact, the samples were tested by AT before and after the wear tests with the aim to characterize wear behavior by means of a non-destructive technique. The same testing conditions were adopted for both parts of the analysis (before and after wear tests).
This way, PT was used for online thermal characterization in conjunction with COF measurements, while AT was adopted for the wear damage characterization. In the specific case of PT, thermal responses obtained from the thermogram were adopted directly for the analysis. On the other hand, a dedicated data procedure was developed for the AT technique. More in detail, the samples were at first tested with the pulsed technique (before-wear condition), then the wear damage at the tribometer was realized and, subsequently, the samples were tested again with pulsed AT (after-wear condition). Four replications were conducted of each measurement and absolute radiance profiles were extracted from the target laser ROI.
Then, the relative radiance profile was computed for each replication as the difference between the absolute radiance profile and the environmental radiance. The environmental radiance was directly estimated from thermal responses, and it corresponds to the radiance value before the heating profile. Then, the corresponding mean value of the four replications was computed, obtaining the averaged relative radiance profile. The wear characterization was analyzed by following two different approaches.
The first considers all tested samples while, in the second case, the wear characterization is classified on the basis of the chemical composition of the coating.
For what concerns the first approach, once the averaged relative radiance profiles for both the before-wear and after-wear conditions are evaluated, the normalization with respect to each maximum value is generated. Figure 6 shows, as an example for samples 2 (left side) and 7 (right side), the normalized relative radiance profiles for the before-wear and after-wear conditions. This way, the wear damage in terms of thickness decrease, which means a volume reduction, is emphasized on both the heating and cooling phases of the thermal profiles.
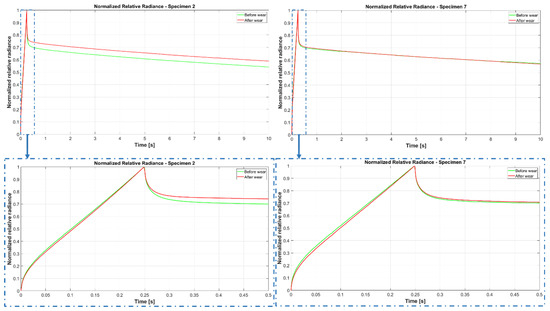
Figure 6.
Normalized relative radiance profiles for samples 2 and 7.
The difference between the thermal area ( parameters was chosen to quantify this difference since it is easy to calculate and to correlate with respect to a wear volume reduction. More in detail, the computation with respect to a certain time is illustrated in Equation (3).
In particular, corresponds to the initial time, corresponds to the final time, is the normalized relative radiance for the after-wear test condition, and is the normalized relative radiance for the before-wear test condition. The final time, , considered in this study is 10 s and it was properly chosen with the aim of measuring for a long time the differences between the before-wear and after-wear conditions during the cooling phase.
A second approach was also proposed, and it is based on the chemical composition of the coating. In this case, the wear characterization is performed by using the bare cooling phase obtained from the thermal response. Also in this case, the difference between the area of the cooling phases () was utilized as the thermal parameter.
3. Results and Discussion
In this section, results regarding the wear tests and the thermography characterization are illustrated and commented on.
The wear tests results are shown in Figure 7 and in Table 3. In particular, variations in terms of volume (ΔVolume) and area (ΔArea) were calculated as the difference between the corresponding before-wear and after-wear conditions. Volume and area were calculated as illustrated in the Section 2 (see Figure 3). In particular, Figure 7 illustrates the ΔVolume and ΔArea comparison on the left side, while the corresponding abraded mass is shown on the right side. From the analysis in Figure 7, a similar trend can be observed for both wear test results, except in the case of samples 6 and 7. As illustrated in Supplementary Materials, samples 6 and 7 show a similar ΔVolume and ΔArea, but in sample 6, an imprecise deposition of the coating can be appreciated. Probably, this non-uniform coating deposition affects the results of the removed mass.
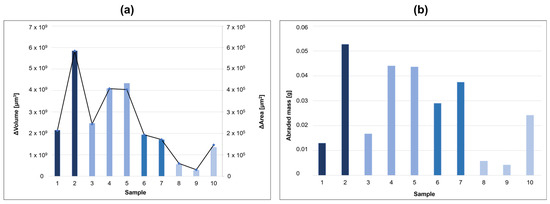
Figure 7.
Measured ΔVolume (column) and ΔArea (line) (a) and abraded mass (b) for different samples.

Table 3.
Wear tests result.
Wear parameters (the wear rate, the Archard’s coefficient, and the wear resistance) were calculated according to Equations (1) and (2); the results are illustrated in Table 4. More in detail, the left side of Figure 8 compares both the wear rate and the Archard’s coefficient of each sample. Moreover, the wear resistances were correlated with the corresponding hardness and the results are illustrated on the right side of Figure 8. In Figure 8a it can be observed that with increasing process temperature the wear rate and the Archard’s coefficient increase for Al samples, while for Mn samples an oscillating trend is obtained. The only difference is observed in samples 6 and 7 (Al0.5 samples) which show a behavior similar to the Mn samples.

Table 4.
Wear parameters.
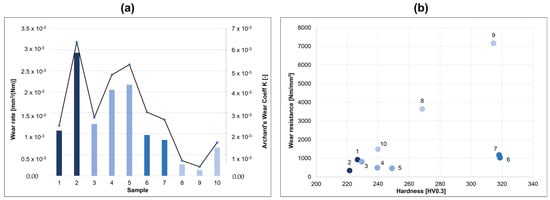
Figure 8.
Wear rate (column) and Archard’s coefficient (line) (a); wear resistance vs. hardness (b).
In Figure 8b the HV and the wear resistance show a coherent behavior for all samples and, in particular, for Mn samples it can be observed that there is a process temperature which optimizes the parameters, corresponding to 750 °C. This optimal temperature is not obtained for the Al samples where the investigated parameters increase with increasing process temperature. In particular, for the Al0.5 samples the increment of wear rate with process temperature is not so evident. According to [31], Al and Mn are usually added to improve strength, hardness, high temperature wear, fatigue resistance, corrosion resistance, etc. Al is especially added to improve the wear resistance of the CoCrCuFeNi HEA.
According to Archard’s wear law, there is an inverse relation between microhardness and wear volume in a tribological test. This relation is confirmed for coatings, abrasive coatings [32], and for HEA coatings. In Figure 8 it can be observed that, for the investigated HEA coatings, the wear behavior increases with the average microhardness, thanks to better microstructural characteristics. The adhesive wear resistance is related to the wear coefficient. In fact, materials with high wear resistance require high energy to be removed by means of wear processes. In Table 4, the small wear coefficient is related to higher wear resistance. In the same Table 4, it can be observed that the wear coefficient decreases when the aluminum percent increases. If observing the relation between the aluminum content and wear coefficient, increasing the aluminum content five times results in a seven-times decrement in wear coefficient. For what concerns the relation between the wear coefficient and microhardness, according to [33], the wear coefficient of AlxCoCrCuFeNi HEA alloys is related to their hardness in transition from the FCC phase to BCC phase. In fact, in [33], it is reported that, generally, the wear resistance of materials is proportional to their Vickers hardness. The BCC phase is harder than the FCC phase and, as such, the wear resistance increases with increasing volume in the BCC phase, as can be observed in Al0.5 HEA.
SEM images at the end of the wear tests, for each sample and the 100Cr6 disks, were also analyzed.
Figure 9 shows, as an example for samples 1 and 2, the abraded aspect of the coating surface, while in Figure 10 the superficial aspect of two 100Cr6 disks are illustrated. The same results for each sample are shown in the Supplementary Materials (Figure S4). For what concerns the SEM observation, obvious differences in wear surface morphology are seen as a function of aluminum content. With increasing aluminum content, the surface roughness and the degree of deformation decrease (compare these with Figure 8 and Figure S2). In Figure S4, the SEM worn surfaces are reported. All of them show groove and plastic deformation along the wear grooves. A similar result is reported in [16] where the typical delamination wear mechanism of ductile materials is shown. According to [16], a higher aluminum content, as in samples 3, 4, 5, 6, and 7 compared to samples 1 and 2, gives a smoother worn surface. In the same paper [16], the oxidative wear is shown to be more effective for a higher content of Al. Samples 6 and 7 show coherently a higher wear resistance since the hard BCC phase resists to plastic deformation and the oxidized layer prevents delamination.
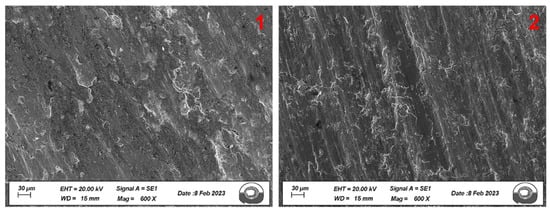
Figure 9.
SEM images for samples 1 and 2.
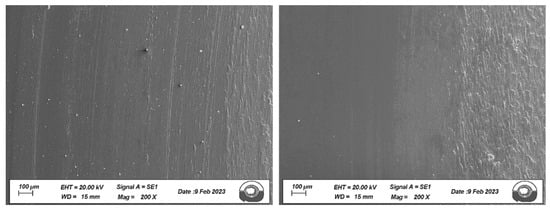
Figure 10.
SEM images for 100Cr6 disks.
Moreover, the sliding wear behavior and mechanisms can be also analyzed. More in detail, observing Figure S2, samples 8 and 9, similar to what was found in [34], both the abrasive and adhesive wear mechanisms are observed in tribological tests between AlCrCuFeNi2 and Si3N4. The shape of the grooves confirms this result, according to [34]. Similar to [17], wear particles can be observed along the sliding direction, as for example in Figure S2, samples 6, 8, 9, and 10, allowing the “three body abrasion” to take place. In Figure 9, sample 2, and in Figure S2, samples 4 and 5, a change in mechanism, according to [17], that is from abrasive to delamination and plastic deformation involving oxidation, is pointed out. This result is confirmed by the heating trend of samples during the wear tests (see Figure 11, sample 2, and Figure S3) and confirmed by the friction coefficients. For all specimens and tests, as one surface is curved, with increasing sliding distance the contact surface increases, and the phenomenon is larger for higher applied loads. With increasing sliding distance micro-scaled and material removal cutting can be observed, as in Figure S2. This phenomenon is also reported in [35]. The increase in applied load can increase the localized coating detachment, as reported in the literature.
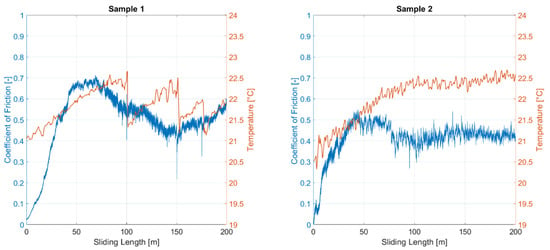
Figure 11.
Coefficients of friction and temperature profiles.
Furthermore, for an HEA coating, wear cracks can also initiate and propagate in the coating surface and, therefore, the amount of wear debris can accordingly increase. The localized coating removal/detachment also can occur for higher wear loads due to the further propagation of surface cracks. These findings are in accordance with other investigations on the wear behavior of HEA coatings with a dual-phase BCC + FCC structure.
Results obtained from the PT characterization are now presented. In particular, Figure 11 shows the COFs and thermal profiles, as an example for samples 1 and 2, for all the sliding lengths. The same results are shown for each sample in the Supplementary Materials (Figure S5). Moreover, a comparison between the corresponding maximum temperature increment and the mean value of the COF for each test is illustrated in Figure 12. On the basis of the results obtained, it can be emphasized that both the chemical composition and the shape of the coating influence heat propagation during tribological tests, making a direct comparison between the maximum temperature rise and the wear performance of the coatings impossible. Furthermore, the sliding distance and rotation speed, appropriately tuned for wear analysis, do not allow an appreciable temperature increment and do not keep it stable for a large part of the sliding distance. The COF curves show a typical trend: an initial rapid increase in COF to a peak value and then a gradual decrease to a steady value. In Figure S5, the COFs of all samples show this behavior. The initial peak value is justified by the curved surfaces of the samples that are then gradually abraded and become flat contact surfaces in the following part of the COF curve. The friction curves of the Al0.5CoCrCuFeNi HEA alloy show a peak value of COF of about 0.65 and a steady value of about 0.48 (Figure 11 and Figure S5). The Al0.5CoCrCuFeNi HEA alloy exhibits a relatively large fluctuation in COF which can be caused by many phenomena. According to [16], the main ones are the periodic localized fracture of the coating surface and the accumulation of debris on the wear surface which is periodically eliminated. From the analysis of these results, it can be pointed out that in the COFs in Figure 11, Figure 12 and Figure S5, these phenomena are evident and moreover the relation of COF and temperature increment due to friction phenomena, plastic deformation, oxidation, and subsequent decrement in adhesive forces are reported. The conditions of the tribological test influence the generation of metal debris. As also illustrated in [36], the heat flow generated during the test increases with increasing loads and speed. These test conditions generate a higher contact surface temperature with a higher heat of friction. As a result, a faster oxidation film rate is generated. The temperature reached during the tribological tests also influences the adhesive forces. In fact, adhesive forces tend to decrease when the temperature of the contact interface reaches a critical value and, consequently, an overall temperature increment occurs. In addition, an increase in COF is observed and the wear rate also increases rapidly in accordance with the increase in temperature reached during tribological tests. It is important to note that the wear resistance is proportional to the hardness, as illustrated in Table 4. This behavior is also described in [17].
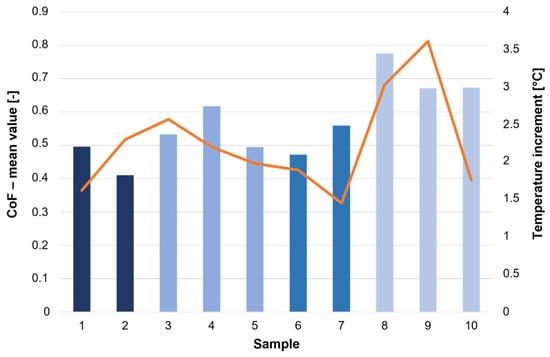
Figure 12.
Coefficients of friction (mean value) and maximum temperature increments.
Results regarding the AT characterization are illustrated in Table 5, and Figure 13 and Figure 14. The normalized relative radiance profiles for the before-wear and after-wear conditions, for each sample, are reported in the Supplementary Materials (Figure S6). Thermal area computations, according to Equation (3), are illustrated in Table 5, also with the corresponding before-wear and after-wear areas. From the analysis of Table 5, it can be observed that sample 10 generates a negative value of . This result can be assumed as 0 as it falls into the uncertainty of the measurement accuracy of the thermal measurement. In particular, the IR camera discriminates 0.08 °C. As illustrated in Figure S6 (see sample 10), the before-wear condition follows an opposite trend with respect to the other tested specimens. For what concerns sample 7, the ΔAcooling is also negative and the same assumption is made.

Table 5.
Thermal area results.
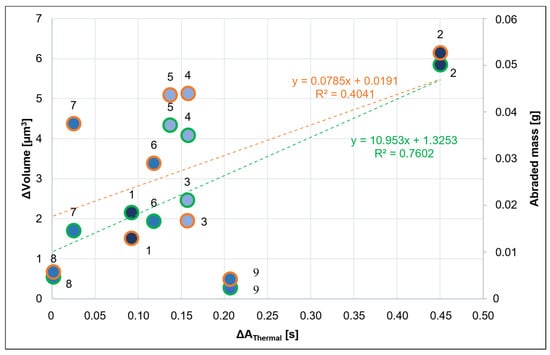
Figure 13.
ΔVolume (orange) and abraded mass (green) vs.
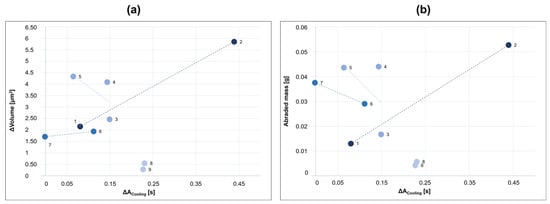
Figure 14.
ΔVolume (a) and abraded mass (b) vs.
Figure 13 compares the AT results with the classical tribological analysis results; that is, the linear regression models between and the corresponding wear volume results (ΔVolume and abraded mass) are illustrated. The R2 results are lower than 0.8 thus indicating a low linear correlation between the selected parameters if all the samples are analyzed together. In Figure 14, the same parameters are grouped related to each HEA coating composition. Again, no apparent relation between composition, process temperature, and wear testing temperature increment is observed. Nevertheless, it can be observed that for almost all samples the thermal cooling transition shows a positive change before and after wear test. This can be related to a change in surface composition, structure, and roughness.
In the Supplementary Material section, the initial and final sample profiles are reported before and after the tribological tests. For all samples, the orientation of the profiles with respect to the center of rotation of the disk is preserved. It can be observed that a sort of anisotropic wear process took place thus possibly justifying this irregular behavior.
4. Conclusions
The following conclusions can be drawn from the presented results:
- *
- The coating after the wear test shows microcracks and wear debris indicating HEA coating resistance to sliding stress.
- *
- The HEA coatings show a mixed wear mechanism, both abrasive and adhesive. The temperature reached during the tests affects the adhesive forces and the COF.
- *
- Passive thermography (PT) appears to be able to follow the transition between abrasive and adhesive wear processes where plastic deformation phenomena take place and can therefore be a useful tool for defining the type of friction as well as for estimating the COF.
- *
- Active thermography (AT), however, to measure the abraded volume requires more in-depth studies and still remains a useful tool for distinguishing the different materials subjected to abrasive phenomena.
Furthermore, the two methods of data analysis provided acceptable and comparable results. To improve the accuracy of the method it is important to control the geometry of the sample.
Supplementary Materials
The following supporting information can be downloaded at: https://www.mdpi.com/article/10.3390/lubricants12060222/s1, Figure S1. Wear area comparison (left side) and coating surfaces (right side). Figure S2. Wear area comparison (left side) and coating surfaces (right side). Figure S3. Wear area comparison (left side) and coating surfaces (right side). Figure S4. SEM images for tested samples. Figure S5. Coefficient of frictions and thermal profiles. Figure S6. Normalized relative radiance profiles for the before-wear and after-wear conditions.
Author Contributions
Conceptualization: R.S., L.C. and N.S.; Supervision: R.L.; Methodology: L.C. and N.S.; Validation: R.S.; Writing—Original Draft Preparation: R.S., L.C. and S.Ö. All authors have read and agreed to the published version of the manuscript.
Funding
This research is funded by the European Commission, REA through its Marie Swklodowska Curie European Individual Fellowship to one of the authors (SÖ), Project No: 101018482 (November 2021–October 2023), which is gratefully acknowledged. This publication is part of the project PNRR-NGEU which has received funding from MUR—DM 352/2022.
Data Availability Statement
Data is contained within the article or supplementary material.
Conflicts of Interest
The authors declare no conflict of interest.
References
- Patel, P.; Nair, R.B.; Supekar, R.; McDonald, A.; Chromik, R.R.; Moreau, C.; Stoyanov, P. Enhanced wear resistance of AlCoCrFeMo high entropy coatings (HECs) through various thermal spray techniques. Surf. Coat. Technol. 2024, 477, 130311. [Google Scholar] [CrossRef]
- Dong, H. 3—Tribological properties of titanium-based alloys. In Woodhead Publishing Series in Metals and Surface Engineering—Surface Engineering of Light Alloys; Hanshan, D., Ed.; Woodhead Publishing: Sawston, UK, 2010; ISBN 9781845695378. [Google Scholar] [CrossRef]
- Stoyanov, P.; Dawag, L.; Goberman, D.G.; Shah, D. Friction and wear characteristics of single crystal Ni-based superalloys at elevated temperatures. Tribol. Lett. 2018, 66, 47. [Google Scholar] [CrossRef]
- Stoyanov, P.; Dawag, L.; Joost, W.J.; Goberman, D.G.; Ivory, S. Insights into the static friction behavior of Ni-based superalloys. Surf. Coat. Technol. 2018, 352, 634–641. [Google Scholar] [CrossRef]
- Harrington, K.M.; Miller, E.C.; Frye, A.; Stoyanov, P. Tribological insights of Co-and Ni-based alloys in extreme conditions. Wear 2021, 477, 203827. [Google Scholar] [CrossRef]
- Holmberg, K.; Erdemir, A. Influence of tribology on global energy consumption, costs and emissions. Friction 2017, 5, 263–284. [Google Scholar] [CrossRef]
- Hong, S.; Mei, D.; Wu, J.; Lin, J.; Wu, Y.; Li, J.; Zheng, Y. Hydro-abrasive erosion and cavitation-silt erosion characteristics of HVOF sprayed WC-Ni cermet coatings under different flow velocities and sand concentrations. Ceram. Int. 2023, 49, 74–83. [Google Scholar] [CrossRef]
- Stoyanov, P.; Harrington, K.M.; Frye, A. Insights into the Tribological characteristic of Cu-based coatings under extreme contact conditions. JOM 2020, 72, 2191–2197. [Google Scholar] [CrossRef]
- Meghwal, A.; Anupam, A.; Murty, B.S.; Berndt, C.C.; Kottada, R.S.; Ang, A.S.M. Thermal spray high-entropy alloy coatings: A review. J. Therm. Spray Technol. 2020, 29, 57–893. [Google Scholar] [CrossRef]
- Cantor, B.; Chang, I.T.H.; Knight, P.; Vincent, A.J.B. Microstructural development in equiatomic multicomponent alloys. Mater. Sci. Eng. A 2004, 375, 213–218. [Google Scholar] [CrossRef]
- Patel, P.; Roy, A.; Sharifi, N.; Stoyanov, P.; Chromik, R.R.; Moreau, C. Tribological performance of High-Entropy Coatings (HECs): A review. Materials 2022, 15, 3699. [Google Scholar] [CrossRef]
- Ranganathan, S. Alloyed pleasures: Multimetallic cocktails. Curr. Sci. 2003, 85, 1404–1406. [Google Scholar]
- Bhaskaran Nair, R.; Supekar, R.; Morteza Javid, S.; Wang, W.; Zou, Y.; McDonald, A.; Mostaghimi, J.; Stoyanov, P. High-entropy alloy coatings deposited by thermal spraying: A review of strengthening mechanisms, performance assessments and perspectives on future applications. Metals 2023, 13, 579. [Google Scholar] [CrossRef]
- Murty, B.S.; Yeh, J.-W.; Ranganathan, S.; Bhattacharjee, P.P. High-Entropy Alloys; Elsevier: Amsterdam, The Netherlands, 2019. [Google Scholar] [CrossRef]
- Sesana, R.; Sheibanian, N.; Corsaro, L.; Ozbilen, S.; Lupoi, R.; Artusio, F. Cold spray HEA coating surface microstructural characterization and mechanical testing. Results Mater. 2024, 21, 100540. [Google Scholar] [CrossRef]
- Wu, J.M.; Lin, S.J.; Yeh, J.W.; Chen, S.K.; Huang, Y.S.; Chen, H.C. Adhesive wear behavior of AlxCoCrCuFeNi high-entropy alloys as a function of aluminum content. Wear 2006, 261, 513–519. [Google Scholar] [CrossRef]
- Chen, M.; Lan, L.; Shi, X.; Yang, H.; Zhang, M.; Qiao, J. The tribological properties of Al0.6CoCrFeNi high-entropy alloy with the sphase precipitation at elevated temperature. J. Alloys Compd. 2019, 777, 180–189. [Google Scholar] [CrossRef]
- Hsu, C.Y.; Sheu, T.S.; Yeh, J.W.; Chen, S.K. Effect of iron content on wear behavior ofAlCoCrFexMo0.5Ni high-entropy alloys. Wear 2010, 268, 653–659. [Google Scholar] [CrossRef]
- Haghdadi, N.; Guo, T.; Ghaderi, A.; Hodgson, P.D.; Barnett, M.R.; Fabijanic, D.M. The scratch behaviour of AlXCoCrFeNi (x = 0.3 and 1.0) high entropy alloys. Wear 2019, 428–429, 293–301. [Google Scholar] [CrossRef]
- Wu, D.-Y.; Zhou, X.; Li, L.P.; Zhai, G.F. Microstructure, mechanical properties and tribological behaviors of gold coating determined by surface quality. Surf. Coat. Technol. 2023, 462, 129463. [Google Scholar] [CrossRef]
- Sesana, R.; Corsaro, L.; Sheibanian, N.; Özbilen, S. Application of NDT active thermography for the characterization of the cold spray process of high entropy alloys (Submission: 246712725). submitted.
- Ma, R.; Dong, L.; Wang, H.; Guo, W. Research on the Contact Fatigue Failure of Thermal Sprayed Coating Based on Infrared Thermography. Nondestruct. Test. Eval. 2020, 35, 73–97. [Google Scholar] [CrossRef]
- Piau, J.-M.; Bendada, A.; Maldague, X.; Legoux, J.G. Nondestructive testing of open microscopic cracks in plasma-sprayed coatings using ultrasound excited vibrothermography. Nondestruct. Test. Eval. 2008, 23, 109–120. [Google Scholar] [CrossRef]
- Rachidi, R.; Elkihel, B.; Delaunois, F.; Deschuyteneer, D. Effectiveness of Phased Array Focused Ultrasound and Active Infrared Thermography Methods as a Nondestructive Testing of Ni-WC Coating Adhesion. Nondestruct. Test. Eval. 2019, 34, 205–220. [Google Scholar] [CrossRef]
- ASTM G99; Standard Test Method for Wear Testing with a Pin-on-Disk Apparatus. ASTM International: West Conshohocken, PA, USA, 2006; Volume 5, pp. 1–6.
- ISO 18535:2016; Diamond-Like Carbon Films—Determination of Friction and Wear Characteristics of Diamond-Like Carbon Films by Ball-on-Disc Method. International Organization for Standardization: Geneva, Switzerland, 2012; pp. 1–24.
- Nasirpouri, F.; Alipour, K.; Daneshvar, F.; Sanaeian, M. Electrodeposition of Anticorrosion Nanocoatings. In Micro and Nano Technologies; Elsevier: Amsterdam, The Netherlands, 2020; pp. 473–497. [Google Scholar] [CrossRef]
- ASTM G133; Standard Test Method for Linearly Reciprocating Ball-on-Flat Sliding Wear 1. ASTM International: West Conshohocken, PA, USA, 2011; Volume 5, pp. 1–10.
- ISO 4287:1997; Geometrical Product Specifications (GPS)—Surface Texture: Profile Method—Terms, Definitions and Surface Texture Parameters. International Organization for Standardization: Geneva, Switzerland, 1997; pp. 1–38.
- ISO 18434; Condition Monitoring and Diagnostics of Machine Systems Thermography, Part 2: Image Interpretation and Diagnostics. International Standard Organization: Geneva, Switzerland, 2019.
- Verma, A.; Tarate, P.; Abhyankar, A.C.; Mohape, M.R.; Gowtam, D.S.; Deshmukh, V.P.; Shanmugasundaram, T. High temperature wear in CoCrFeNiCux high entropy alloys: The role of Cu. Scr. Mater. 2019, 161, 28–31. [Google Scholar] [CrossRef]
- Sesana, R.; Lupoi, R.; Pessolano Filos, I.; Yu, P.; Rizzo, S. Abrasion Power of Ti and Ni Diamond-Coated Coatings Deposited by Cold Spray. Metals 2022, 12, 1197. [Google Scholar] [CrossRef]
- Khruschov, M.M. Principles of Abrasive Wear. Wear 1974, 28, 69–88. [Google Scholar] [CrossRef]
- Gwalani, B.; Torgerson, T.; Dasari, S.; Jagetia, A.; Nartu, M.S.K.K.Y.; Gangireddy, S.; Pole, M.; Wang, T.; Scharf, T.W.; Banerjee, R. Influence of fine-scale B2 precipitation on dynamic compression and wear properties in hypo-eutectic Al0.5CoCrFeNi high-entropy alloy. J. Alloys Compd. 2021, 853, 157126. [Google Scholar] [CrossRef]
- Löbel, M.; Lindner, T.; Mehner, T.; Lampke, T. Microstructure and Wear Resistance of AlCoCrFeNiTi High-Entropy Alloy Coatings Produced by HVOF. Coatings 2017, 7, 144. [Google Scholar] [CrossRef]
- Ghadami, F.; Ghadami, S.; Davoudabadi, M.A. Sliding Wear Behavior of the Nanoceria-Doped AlCrFeCoNi High-Entropy Alloy Coatings Deposited by Air Plasma Spraying Technique. J. Therm. Spray Technol. 2022, 31, 1263–1275. [Google Scholar] [CrossRef]
Disclaimer/Publisher’s Note: The statements, opinions and data contained in all publications are solely those of the individual author(s) and contributor(s) and not of MDPI and/or the editor(s). MDPI and/or the editor(s) disclaim responsibility for any injury to people or property resulting from any ideas, methods, instructions or products referred to in the content. |
© 2024 by the authors. Licensee MDPI, Basel, Switzerland. This article is an open access article distributed under the terms and conditions of the Creative Commons Attribution (CC BY) license (https://creativecommons.org/licenses/by/4.0/).