Article

Comparative Research in the Field of the Parametric Effect of Lubricant Cavitation Initiation and Development on Friction and Wear in Piston Ring and Cylinder Liner Assemblies

by
Polychronis Dellis
Biomedical Systems Laboratory, Department of Mechanical Design and Automatic Control, School of Mechanical Engineering, National Technical University of Athens (NTUA), Zografou Campus, 9 Iroon Polytechniou Str., 15772 Athens, Greece
Lubricants 2024, 12(12), 460; https://doi.org/10.3390/lubricants12120460
Submission received: 18 November 2024 / Revised: 11 December 2024 / Accepted: 18 December 2024 / Published: 20 December 2024

Abstract

:
This research follows closely previous findings in flow characteristics and phenomena that take place in the piston ring and cylinder liner interface during motoring and firing engine operation, and also compares results between different optical engine set-ups. Cavitation visualisation in a simulating lubrication single-ring test rig and oil transport and cavitation visualisation in custom made cylinder assemblies of optical engines are the tools used to quantify the transport process under the piston ring and cylinder liner. Simplification of the interface is an essential technique that enhances the researcher’s confidence in results interpretation. Engine complexity and severe oil starvation are impeding the analysis of the experimental results. Visualisation experiments constitute an effective way to test various lubricant types and assess their overall performance characteristics, including their properties and cavitation behaviour. The repeatability of the visualisation method establishes the parametric study effects and offers valuable experimental results. As a further step towards the lubricant composition effect, a link between the lubricant formulation and the operating conditions could be established as the oil performance is assessed with a view to its transport behaviour. Image processing is used to quantify the impact of cavitation on piston ring lubrication in conjunction with varied operating and lubricant parameters. The characteristics of the lubricant and the working environment have an impact on these types of cavities. Viscosity, cavitation, oil film thickness (OFT), lubricant shear-thinning characteristics and friction are all linked.

1. Introduction

Cavitation is the main mechanism that causes performance degradation in most engineering applications. Regarding its impact in piston ring lubrication, it changes oil film thickness as it is being developed with reciprocating speed and changes the oil film pressure profile, which is generated due to the wedge geometry of the piston ring and liner interface. An area of the piston ring surface is void; this area corresponds to sub-atmospheric pressures that initiate the phenomenon, and thus impacting the load capacity of the piston ring. The viscosity of non-shear-thinning mineral lubricants would result in greater friction power loss when compared with shear-thinning fluids. The load-carrying capacity of the interface is the integral of the pressure distribution, the lubricant film thickness, the friction force and the lubricant flow rate [1]. The viscosity of the lubricant at the piston ring cylinder liner interface varies during the cycle as the shear rate experienced by it changes [2].
Previous studies have focused on providing a simplified version of the lubrication at the interface together with modelling of the equations describing lubricant flow [3,4,5,6,7,8,9]. A single-ring simulating test rig is the basic tool with the necessary measurement sensors and modifications to support this research [3,4,5,7,8]. On the engine side, tests in both motored and firing engines were utilised to assess the lubricant flow and compare the simplified test rig results to real engine ones [6,8,9].
Polymer addition was found to increase the cavitation inhibition effect for the base oils. The effect of OFT on cavitation should be also considered in parallel to the evaluation of viscosity influence on cavitation [2]. The different lubrication regimes during the stroke make their own contribution to friction profiles and total power losses. Extensive parametric study of different lubricants was carried out in [10] where the effect of different lubricants, viscosity, high-temperature high-shear viscosity properties (HTHS viscosity) and piston ring geometry was parametrically studied. The influence of cavitation effects in OFT has been presented in the past, with higher temperatures leading to lower viscosity and affecting the signals. OFT and its load-carrying capacity decrease to a great degree as oil temperature increases [5]. Test rig geometry and its dynamics play an important role as lubrication is affected. Along with friction, OFT measurements (both with laser-induced fluorescence (LIF) sensors and capacitance), oil film pressure measurements and visualisation, and various shapes of cavitation have been identified and classified, for the case of the simulating test rig, that have lubricant rheological effects [4,7].
Cavities’ development influences the oil film pressure in the thin lubricant film and its load capacity, the latter being subject to cavitation initiation points and the cavitation region, which was altered in size because of the piston rings’ geometry and lubricant properties [4,5,10]. In the wedge geometry of the piston ring/cylinder liner interface, the load-carrying hydrodynamic pressures are built in the convergent wedge, and conversely, in the divergent side, cavitation reformation influences to a great degree the peak pressure in the full film region and the area of cavitation. This latter phenomenon is particularly evident when high oil film pressure appears on the divergent wedge of the piston ring specimen [5].
In engine testing, friction results showed that the lubrication in the boundary region contributes significantly to the total friction power losses in the case of the twin-land oil control ring [11]. Other researchers used LIF techniques to visualise the lubricant film, taking two-dimensional images in their specially modified IC engines and charge-coupled device cameras (CCD) [12,13,14,15,16,17].
A theoretical model to study the lubrication of twin-land oil control rings was developed considering the shear-thinning effects of multigrade oils, with both oil squeezing and asperity contact included for their interaction [14]. Increasing oil temperature, a simultaneous effect of liner surface temperature, reduces the viscous film friction. Close to the dead-centres of the stroke, where the lubrication regime is boundary, increased friction is the main contributor to power losses, reducing at the same time the effect of liner surface temperature [18].
Lubrication models have also included more parameters to achieve a better degree of validation when compared to experiments. The cavitation of compressible fluid was included in the mass flow equations, and this interpretation was further verified [19]. Another group implemented a computational fluid dynamics (CFD) model along with limited experiments for a thin compression ring of a single-cylinder firing engine, regarding friction. For modelling purposes, they used a two-phase flow and a gas blow-by model in the mixed lubrication region [20,21,22]. Another aspect that was studied was the effect of a piston ring profile after substantial hours of testing in a diesel engine. Deposits led to a worse sealing behaviour [22].
Nouri et al. [23] argued that the cavities’ initiation dynamics were demonstrated in images showing time-dependent initiation of cavitation, with shapes varying from fern cavities and bubbles, to fissure-shaped cavities and, when fully developed, to sheet and string cavities. These images were taken at a liner velocity of approx. 0.17 m/s. With increasing speed in the simulating single-ring test rig, the number and the length of string cavities increased, as the oil film is fully developed with higher speed and according to lubrication theory. Two different cameras were used to capture video images at high speed with high-intensity light sources, and these images were analysed; the images were introduced to a custom-built computer program so that further analysis of the cavitation images could be undertaken and cavitation statistics could be delivered. The temperature parametric effect was also studied at the engine test rig, which showed that cavitation was intensified. At higher temperatures, cavitation intensity increases but bubbles collapse, reducing its overall area on the piston ring. Speed parametric tests had a dramatic increase in the cavitating area, which was evident at even higher speeds, this time limited. After that engine speed threshold, there was a smaller increase in the cavitation area, with similar intensity and distribution across the ring [9].
Modelling work extracts matrices with cavity length, cavity width, area of cavitation and number of cavities present under the piston ring and the cylinder liner [8,9]. This more-controlled experiment introducing a specially modified engine cylinder block, tried to extend and solidify the findings of a simulated single-ring test rig [5,7], and undertook partial imaging from the size-limited windows of a Lister–Petter engine [5,6].
According to Taylor [24], the important and useful property of squeeze films is their ability to provide increased load capacity even if for a short period of time when the lubricating interface is suddenly under high loads. The squeeze effects have a significant impact on OFT, and also affect friction, as it differs depending on the sliding direction. Squeeze film acts as a saviour at low speeds as there is a substantial film capable of handling load, with its appearance changing in terms of crank angle (CA) according to lubricant properties and operating conditions [25]. On the one hand, the squeeze film acts as a saviour in the mixed/boundary region and, on another hand, initiation of cavitation happens at similar CAs where friction force reaches its peak value. With the use of oils with different properties, the friction peaks varied as well. Various lubricants affect the squeeze film [26]. There are differences at top dead centre (TDC) and bottom dead centre (BDC) at high temperatures and high loads, this time appearing in the signals as a slight shift towards dead centres. Squeeze film measurements are altered as a result of test rig dynamics and the rig’s geometrical characteristics. In the minimum oil film thickness (MOFT), measurements appear as an asymmetry [26].
A focus on interpreting the results obtained from each lubricant under different operating conditions was achieved. Lubricant properties influenced MOFT measurements (capacitance sensor) and cavitation with the laser-induced fluorescence (LIF) method [7]. Without considering lubricant degradation, different lubricants were measured in the test rig and it was established that, for the same testing conditions, cavitation and OFT varied according to their properties. Motored engine experiments [5,6,8,25] complemented the test rig findings. These modifications allowed for extensive research of oil transport, cavitation initiation and development, and the effect of varying temperature, in a detailed study on engine lubrication. Results were validated with findings taken from the parallel working test rigs.
A few previous works used optical engines to visualise the oil film flow, which will be analysed further.
Lubrication optimisation is the principal objective in this research. It includes optimising lubrication of the piston/liner interface, which always requires balancing between competing factors, such as the viscous losses and effective lubrication. The main focus is highlighting the parametric results and their combination in lubricant flow, towards suggesting an optimal piston ring/cylinder liner design that enhances the theoretical lubrication regimes at all engine operating modes and simultaneously minimises friction power losses. Various experimental test rigs contributed to this thorough study, which effectively turned into a comparison of results taken from these rigs, whether being simplified versions of the piston ring/cylinder liner interface or modified single-cylinder engines at different time intervals. An extensive visualisation process with computer-based image analysis followed the initial phase of results. A comprehensive analysis was conducted on the formation and development of cavitating lubricant flow between the piston ring and cylinder liner assembly, and gives the parameters needed to compare the degree of cavitation in the various experimental test rigs.

2. Experimental Set-Up and Methods

The importance of these investigations emerges when experimental results from investigations of cavitation initiation and its development after the dead centres of the stroke are combined. Lubricant formulation with the use of different additives plays an important role because at higher temperatures the additives have a different interaction with contacting surfaces, and in this manner the resulting effect of asperity contact is either increased or reduced. The challenging nature of achieving visualisation in engine set-ups is combined with serious manufacturing limitations of visualisation windows. Oil starvation causes further implications. Handling combustion pressures that accompany firing experiments is another particular challenge. Image acquisition is limited as extensive cleaning is a prerequisite.
In previous research, different lubricant properties affected MOFT measurements, applied either with the LIF technique or with a capacitance sensor. A specially designed liner was used for mounting an ultra-miniature pressure transducer, so that the identified cavitation results could be further quantified and verified [27]. Blow-by phenomena were captured by the imaging process.
The effect of cavitation is quantified with results derived through image processing. As already pointed out and carried out in previous research, the operating conditions and lubricant properties influence cavitation [4,5,6,7,8,9,10,23,25,26,27].
Three experimental test rigs were used: two optical engines, specially modified to capture lubricant film and transport imaging, and the simplified single-ring test rig.

2.1. Single-Ring Simulating Test Rig

The simulating test rig minimises operating uncertainties and is focused on studying the fundamental aspects and physics of piston ring lubrication. This simplified test rig consists of a steady piston ring section having a 5 mm width, fixed under a flat liner moving section, with its motion being inverted. It was initially developed by Arcoumanis et al. [3]. Various sensors are used for oil film pressure, MOFT (optical—LIF and electrical—capacitance), and friction, and extensive liner modifications allow imaging and provide parametric data of speed, load, temperature and piston ring geometry, for various lubricant grades. As the liner reaches TDC or BDC, the lubrication at the interface is mixed; contact between the interacting surfaces is achieved through surface asperities while friction power losses increase up to the lubrication regime change to boundary. The squeeze film effect has its own beneficial support close to the dead centres [6,25,26]. Squeeze films provide increased load capacity, although temporary. With liner movement away from TDC or BDC, oil film develops, decreasing asperity interaction and frictional losses at the same time, while the lubrication regime changes from boundary to elastohydrodynamic, and then hydrodynamic when the full fluid film has developed close to the liner’s highest speed.
A custom made LABVIEW program was used to process the results over degrees of CA. Repeatability issues required selecting a number of 50 cycles, and error analysis for MOFT, LIF, friction and pressure data was also provided. In Figure 1a–d, the test rig schematic and sensors can be seen.

2.2. Optical Engines

This section presents relevant previous work on heavily modified single-cylinder engines, methods and findings on oil film visualisation before the research methods used in this project.

2.2.1. MIT Research on Oil Transport

MIT researchers [11,13,14] used two engines to visualise the oil flow:
(a)
A Kubota single-cylinder engine;
(b)
A PSA single-cylinder engine.
(a) Kubota engine: A quartz window was installed in the removable liner of the Kubota engine. The window was designed with a trapezoidal section in both vertical and horizontal directions to better support the combustion pressure. The window was located in the anti-thrust side (Figure 2).
Quartz provides:
  • Good optical quality (excellent transmittance of the visible wavelength);
  • Good mechanical properties (very scratch resistant);
  • Inexpensive raw material and low-cost machining.
The engine incorporated a relatively small window in a well-cooled cast iron cylinder liner. It was located below the mid-stroke position and therefore not exposed to the very high temperatures encountered during the combustion process.
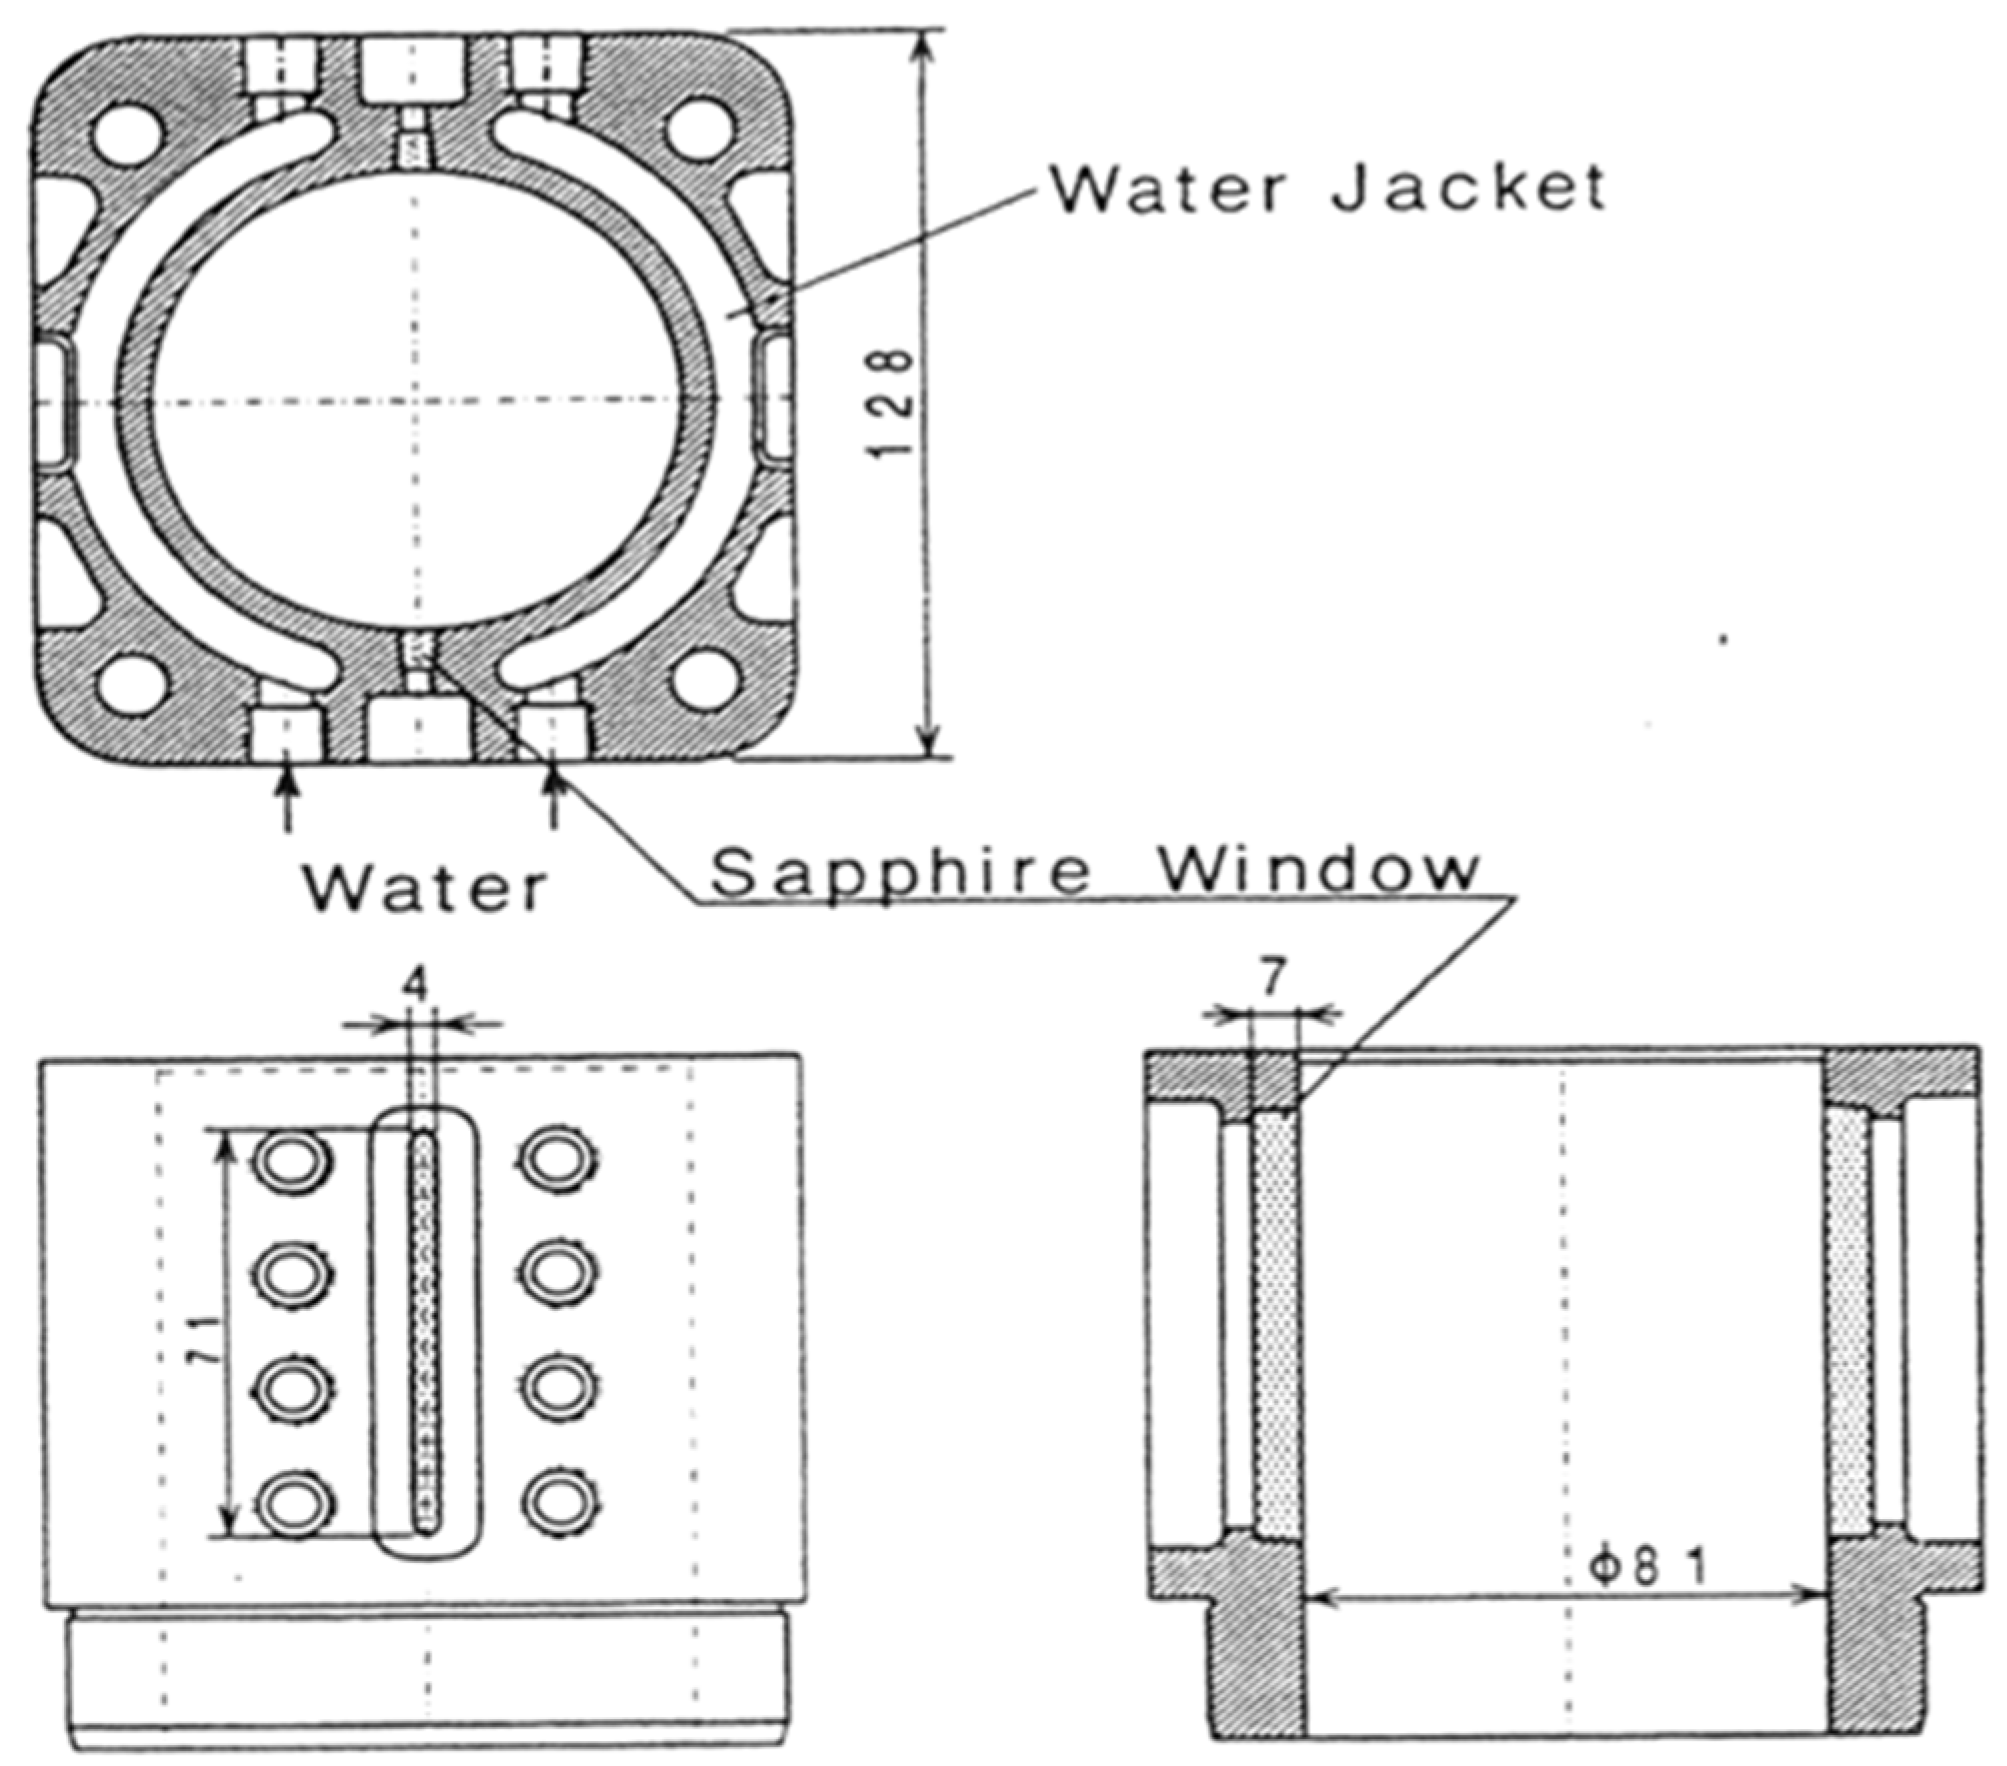
(b) PSA engine: To verify experimentally more aspects of piston ring oil transport, a spark ignition engine was equipped with extensive optical access in the form of a long window having 104.5 mm × 18 mm dimensions, as shown in Figure 3. The window was made of sapphire, which has superior mechanical properties and is therefore more likely to resist the stresses induced by the combustion chamber pressure. Since sapphire and cast iron have very similar thermal expansion coefficients, it is expected that with a sapphire window, the gap between the window and the liner will not increase as temperature rises, minimising the risk of leakage. High-temperature-resistant and high-thermal-conductivity epoxy glue was used to fix the window in its place. Both windows were polished on the outside and honed on the inside.
A visualisation system using multiple-dye LIF was implemented to observe oil displacement among various regions of the piston ring pack in both engines. The two-dimensional oil distribution measuring system was developed using a pulsed laser. Special fluorescent dyes were used to minimise the sensitivity of the LIF signal to oil temperature. An intensified CCD camera was used. High resolution images and video recordings of the oil distribution were acquired over a range of running conditions representative of passenger car engine operation.
On the piston lands, oil was observed to move in both the axial and circumferential directions. The axial oil displacement was found to be driven by the inertia forces resulting from the piston alternating motion. The circumferential flow appeared to result from the dragging action of the blow-by gases. Inertia forces dictate the oil repartition along the axial direction of the piston lands. It forces oil to repeatedly accumulate against the rings and spread over the piston surface. The predictions were in good agreement with the oil distribution profile measured during engine operation, providing considerable help in simulating and developing oil transport models. Two major mechanisms were found to be responsible for oil flows from the piston lands to the ring grooves: the ring pumping, which was observed experimentally, and the lateral motion of the piston relative to the rings. By changing the second ring and third land geometry, it was experimentally proven that the amount of oil that accumulates in front of the lower clearance of the second ring groove greatly affects the oil flow rate through the back of the scraper ring.

2.2.2. Toyota Researchers

Inagaki et al. [17] used a single-cylinder spark ignition engine and two types of cylinder liners. For the motoring test, a whole optical glass transparent cylinder was used. For the firing test, a cast iron liner having a pair of tapered slit holes in the axial direction at the thrust and anti-thrust side was used (Figure 4). The researchers used a Xe-flash lamp (blue filter), a filtered CCD video camera, a PC-based signal analyser and fluorescent dye in the lubricating oil. A fluorescent dye was used and its emission had an intensity appropriate to the OFT through two-dimensional images. Under high speed (5000 rpm), oil spouts were observed from the first ring gap. The measured oil consumption rate agrees with the variation in the rate of spouted OFT, as very clear images of the OFT distribution on the piston skirt, piston lands and piston rings were obtained under both motoring and firing operating conditions.

2.2.3. Noticeable Optical Engine and Test Rig Simulations

Sanda et al. [12] used LIF to capture two-dimensional images of the oil film. Kim et al. [28] manufactured an experimental test rig that would be able to simulate the piston ring/liner lubrication, measure oil film pressure, visualise cavitation and categorise its shapes. The rig consisted of a reciprocating flat plate with a straight bar test piece loaded on top of it. The researchers tried to investigate cavitation with this optical technique. Another group of researchers inserted a 5 mm thick transparent quartz cylinder [29]. A red dye was added to the lubricant and a video camera was used to record the characteristics of the oil flow through the ring pack. When the piston ring gaps were in line, greater oil flow was observed. In a later publication [30], the oil flow was increased by a higher pressure difference, greater oil temperature and engine speed, and lower oil ring tension, and it was observed that the lubrication oil was flowing through the ring gaps. The main oil flow paths were observed to be through the ring gaps and along the lands. In 1999, the same researchers found that a triangular step joint in the top piston ring reduced the oil flow [31]. Yoshida et al. [32] investigated the oil flow to the combustion chamber through a V-shaped groove into the second land and stated that it was greatly reduced.
Schäffer et al. [33] developed a measuring system for the visualisation of the oil film between the piston liner of a gasoline engine, reporting that the oil flow to the combustion chamber changes significantly with engine speed and load. For operating conditions with a closed throttle during high engine speed, a large amount of oil enters the combustion chamber. The transition from fired to motored engine operation is associated with increased oil consumption.
Azetsu et al. [34] utilised an optical engine in an experimental design using photochromic dye dissolved in the oil, illuminated with ultraviolet light. The engine was a motored single-cylinder, 4-stroke engine. The quartz cylinder liner allowed full access to visualise the lubrication according to piston movement. An ester-based, 5W-30 oil was used. Low operating temperatures (30 °C) avoided the effect of the fading reaction, and low engine speed (600 r/min) enabled imaging at intervals of 1° CA. The researchers concluded that this new visualisation technique can be implemented successfully, and the next steps would be to utilise this technique over a wide variety of engine operating conditions to investigate oil flow and the basic route for oil consumption and dilution in the fuel [34].
Regarding oil mist investigations, because the presence of oil droplets (mist) in the gas that flows through the piston assembly and crankcase of an ICE has important implications for performance, particularly lubricant supply to the upper piston assembly, oil consumption and lubricant degradation, an experimental test rig was developed to simulate the gas and lubricant film interaction at the top piston ring gap, where flow conditions are most severe (see Figure 5) [35]. Lubricant viscosity had a significant effect and the viscosity modifiers contributed to oil droplet formation. This triggered a detailed study of a set of viscosity modifiers, which tried to establish the fundamentals of lubricant chemistry on viscoelasticity and mist formation.

2.2.4. Leeds University Research on Optical Engines

Gamble [15] dealt with the modelling of the piston ring pack and monitored the lubricant condition. An extensive description of the oil transport mechanisms in the piston ring assembly was given so that the lubricant degradation can be studied more effectively. Modelling work was divided into two sections: (a) piston ring pack and (b) piston.

2.3. Single-Ring Test Rig Sensor and Optical Engine Set-Up

In this project, two single-cylinder engines were used: a single-cylinder Lister–Petter PHW1 diesel engine and a single-cylinder Ricardo HYDRA engine. Ideally, the engines, after the motoring tests, would be used for evaluation of firing conditions [25].
Optical access to the ring/liner interface along the stroke length can provide lubricant flow details for the proposed investigations and allow direct comparison with the respective operating conditions of mass-produced engines [9]. In Figure 6, the Lister–Petter modifications and optical set-up for visualisation experiments can be seen. Drawing details accompany this figure to provide a representation of the preparation work needed to proceed with the first phase of modifications, which include high precision window sections fitted after special machining on the cast iron liner body.
A large amount of important information on lubricant flow properties is gathered from the test rig, which, in turn, leads to understanding of the flow in a conventional engine assembly. Eventually, characterisation of the lubricant transport phenomena in the piston ring pack of production engines [8,9], along with a link, via a parametric study, to the effect of lubricant properties in oil film characteristics [5,7,8,10,23,27], was achieved. In Figure 7, the piston ring details for the Lister–Petter PHW1 engine can be seen.
The nature of the simulating single-ring test rig interface with simplified assembly and reassembly processes enabled extensive parametric lubricant testing acquired from the installed measurement sensors. Engine in-cylinder uncertainties resulting from its inherent complexity (ring dynamics, thermal and elastic deformation of the rings, starved lubrication, circumferential ring variations, lubricant degradation and blow-by) were avoided [6,25].
The investigations of the oil flow characteristics and cavitation incipience in the idealised test rig are dependent on the implementation of numerous measurement techniques. Improvements and measurement method optimisation at the test rig were a prerequisite to ensure that the simulation at the piston ring and the liner interface was achieved in the best possible manner. OFT, through employing the capacitance method and friction force measurements by a piezoresistive force sensor, was successfully acquired. The optical liner was integrated into the test rig allowing the imaging of cavitation development through a still CCD camera. The integration of a high-speed video system allowed the acquisition of meticulous flow images. Furthermore, the measurement of oil film pressure with a miniature pressure transducer supported the cavitation findings and provided an insight into the flow behaviour at the piston ring and liner interface, with an emphasis on the change in pressure profiles due to operating conditions, combined with the area of cavitation at the diverging wedge of the piston ring.
The extensive investigation of the cavitating oil flow was captured with high-speed cameras and high frame rates that, in turn, were established as an essential tool in identifying the highly transient lubricant flow. The single-ring test rig acted as the medium that enhanced the confidence in interpreting the results. The transfer of knowledge acquired in measuring the oil film pressure in the test rig, to that of the engine, eventually allowed the direct assessment of engine imaging. At first, in the test rig, the parametric results enhanced the ability to quantitatively interpret the cavitation development at the ring/liner interface and, at a later stage, the two engine test rigs acted as the field of implementing the initial interpretations. The converging–diverging wedge of the moving liner relative to the steady piston ring section constructs a positive lubricant pressure at the converging wedge of the ring, and therefore, an adequate hydrodynamic film that, in turn, can withstand the load acting on the ring surface. In contrast, in the diverging wedge, negative pressures arise, and this relationship is combined with different boundary conditions when modelled [25].
The modified single-cylinder Lister–Petter PHW1 engine used for visualisation imaging in motoring tests results could be directly compared to the respective ones from the test rig with a view to cavitation stage development [5,6]. As in the case of the simplified test rig, pressure and LIF measurement stations were prepared in the engine liner with their respective engine block fittings, but neither sensor was fitted due to failure during their machining process [25].
The two modified engines tried to shed light on the lubrication occurring during the whole of the stroke. The Lister–Petter motoring tests were conducted for a direct comparison to the single-ring test rig results. In the next phase, Vasilakos [8] modified the Ricardo engine and managed to obtain visualisation results that quantified the cavitation as recognised by the imaging process, and eventually led to the results that are going to be discussed in the following sections. The Ricardo HYDRA engine, with an extended viewing area, produced solid results, which were compared to the respective ones from the test rig and coupled to the images taken from the Lister–Petter engine [25].
The modifications of the cylinder block can be seen in Figure 8. The machining specifications were the same as for the original HYDRA block, with the extra use of special honing tools so that a very smooth inner cylinder surface could be achieved. This was an important process in terms of achieving the same surface roughness. A very important aspect of the machining was to make sure that the optical design can support firing operation forces, temperatures and pressures, without interfering in terms of tolerances with the cast iron fitting [9].

3. Results

3.1. Single-Ring Test Rig Experimental Results

Visualisation results are presented in Figure 9 for the upstroke and Figure 10 for the downstroke, with the initiation stages of cavitation observed at the test rig, and at a few degrees of crank angle just after the TDC. Characteristic shapes appear as cavitation develops that have already been identified as ferns, fissures, strings and bubble cavities, and classified for the simulating test ring in [4,5].
Then, the corresponding pressure profiles for the respective images that identify, quantify and interpret the initiation and development of cavitation are presented side by side to shed light on the conditions that dictate the appearance of cavities, their initiation close to the stroke reversals, and development when lubrication changes from elastohydrodynamic to hydrodynamic. When the oil film is fully developed, extensive parametric study showed how different test cases, ring geometries and various lubricants affect the oil film pressure profile; see Figure 11 and Figure 12 for speed and load tests, respectively [27].
One can notice that in Figure 11 test case (g), the oil film pressure reading was outside the transducer measurement limit. As the sensor was pre-loaded but within its measurement range as stated by the manufacturer (Kulite XCQ-080-500 Psia, Leonia, NJ, USA), the transducer was reading the oil film pressure peaks and identified the cavitation either under absolute zero atmospheric pressure or even at the limits of lubricant tensile stresses. Figure 12 shows the respective load parametric tests combined with the pressure readings. This time, the images and pressure focused on the flow reversal points close to the dead centres. Again, as already mentioned, the oil film pressure readings seem to identify and “read” the tensile stresses of the liquid, but outside the transducer measurement limit (TML) [4,5].
In Figure 13, the oil film pressure profiles are superimposed on the upstroke and downstroke to show the effect of different geometries on the pressure readings.
Figure 14a shows that there is also an oil film peak pressure offset that follows the speed tests affecting the open-form cavitation areas, while in Figure 14b the different cavitation areas of open and closed form appear, while cavitation reformation affects the pressure profile. Figure 14c shows a clear trend for the pressure profiles as we move towards higher loads; cavitation affects the pressure profiles and the effective oil film pressure width shrinks at low load [27].
Parametric study of imaging allowed the investigation of cavitation initiation points at different speeds and loads (Figure 15a), while at the same time, in Figure 15b at mid-stroke, the number of cavities per mm with speed and load shows how the operating parameters affect the appearance of cavitation strings. For higher load, fern cavities appear earlier in the stroke and they are smaller-sized. At higher speeds, later in the stroke, the string cavities appear and their size grows. A string cavity number estimation per mm shows that, at mid-stroke, there is a stable condition, whereas at higher loads, the number of string cavities increases and at the same time the width of the strings decreases. The number of string cavities decreases at higher speeds while the width of the strings increases [7].
The initial evidence of cavitation was derived from the LIF measurements, where an oil film breakage point was identified under the piston ring profile, as shown in Figure 16. Various test cases for the possible cavitation stages are shown over one measuring cycle (downstroke) for the LIF experiments [7]. The fibre optic probe as a point measurement can detect a string itself, or the distance between strings or a mixed region of both strings and oil striations. Thus, the LIF measuring technique measures either:
  • A cavity;
  • Lubricant striation in between the string cavities;
  • A mixed region derived by both of the above.
The cavities’ location was identified with the LIF measurements. Consecutive cycles showed that the cavitation structures have an inconsistent and random appearance [7].
Figure 17 shows the friction force measurements for different oils at TDC, at crank angles of flow reversal and the boundary lubrication region, and Figure 18a shows, for a specific oil (6E), the temperature effect on MOFT and squeeze film variation at 400 rpm and 1159 N/m load. Figure 18b shows the slight shift in squeeze film at BDC, depending on the lubricant properties of the various lubricants tested. Table 1 shows the tested lubricant properties.

3.2. Lister–Petter Experimental Engine Results

Experimental verification requires examination of more aspects of piston ring/liner oil transport and cavitation. The Lister–Petter PHW1 diesel engine was equipped with extensive optical access in the form of two pairs of windows for the anti-thrust side and front engine side, with dimensions as in Figure 6e. The windows were made of quartz, which has superior mechanical properties and is therefore more likely to resist the stresses induced by the combustion chamber pressure. Since quartz and cast iron have similar thermal expansion coefficients, it is expected that with the quartz window, the gap between the window and the liner will not increase as temperature rises, thus minimising the risk of leakage. It should be mentioned that the windows were glued to the liner with high-temperature-resistant and high-thermal-conductivity epoxy glue. Both windows were specially machined and polished on the outside and inside with the lateral surfaces left unpolished, just to be glued to the cast iron liner. During the Lister–Petter engine visualisation experiments, better images were taken from the lower windows, at both the anti-thrust side and front side [5].
During the experiments, the quartz windows were unable to seal against the liner at temperatures encountered even during the motoring tests. For coolant exit temperature reaching 50 °C and above, the oil film on the liner was coming out of the window–liner limit. Thus, the coolant temperature had to be lowered, so that no leaking would occur during testing. Ideally, a coolant temperature of 15 °C was maintained, so that the liner would not expand.
Visualisation results showed some interesting forms on the piston ring surface, which were interpreted as cavitation, based on the test rig experiments. In Figure 19, different magnifications, from low (1.4×) to high (6.8×), were used to capture the piston ring surface through the quartz window section of the Lister–Petter modified cylinder liner. The same crank angle is used but different cycles are used for repeatability checks.
The following set of visualisation images shows the piston rings (top compression, second compression and scraper ring) as well as the window itself without the piston behind it, with oil droplets appearing on the photos. In this series of experimental data, the oil film that can be visualised, as seen on the surface of the piston ring, shows conditions of oil starvation. The darker area on the surface of the top compression ring is a polished region (Figure 20), which has been derived from the interaction, during operation, between the ring and the liner as the piston reciprocates. This area is getting bigger at certain areas of the piston ring. The reason behind this is that the tangential tension of the piston ring gets bigger towards the edge of the ring next to the ring gap and the oil film is being squeezed. Eventually, the ring and liner surfaces are prone to more friction close to the gaps.
Figure 21 shows string cavities formed with the piston moving downstroke on the surface of the top compression ring.
In Figure 22, the second compression piston ring (flat ring) is visualised, and an oil film region can clearly be seen, leaving a minimum area uncovered at the upper edge of the second piston ring specimen. Oil droplets are also visualised, but they can be also confused with marks and scratches on the window surfaces that can act as lubricant micro-reservoirs.
Images taken from the engine anti-thrust side windows show somewhat similar forms of cavitation. Figure 23a shows oil film breakage as there is a big “gap”—a cavity on the surface of the top compression ring, resembling an irregular shape of the string-shaped cavities. In Figure 23b, oil droplets appear on the top compression ring side clearance. Again, Figure 23c,d provide the shape of more irregularly shaped string cavities. The strings do not appear on this image, as they have been expanded and appear as a larger cavity, which spreads to a comparatively greater length on the piston ring surface.
The strings do not appear on this image, as they have been expanded and appear as a larger cavity which spreads to a comparatively greater length on the piston ring surface. The second compression piston ring (flat ring) is visualised, and an oil film region can clearly be seen, leaving a minimum area uncovered, at the upper edge of the second piston ring specimen. Oil droplets are also visualised [5]. Figure 24a,b show the effect of ring tension on the oil film, which becomes evident, caused along with ring twist irregularly shaped cavities on its surface, and emerging from diminishing string cavities.
Figure 25a–c show droplets gathered at the top and bottom of the piston ring side clearance. There is also a quite unclear appearance of a string cavity on the surface of the top compression ring at the engine front side in Figure 25d. These string cavities appear to be more even in shape than the cavities noticed in Figure 19 and Figure 21. Since the magnifications used in the images are not producing clear enough images, it is unsafe to draw any further conclusions.
In Figure 26, this set of images uses the highest magnification of the available CCD camera lenses. Figure 26a,b show the piston skirt and oil mist generated by the oil control ring, as the piston moves towards BDC. In both of the following images, a “lubricant cloud” is evident. Lubricant is transported, forming oil mist.
The identification of oil droplets in general can be directly compared to the research that was presented by Inagaki et al. [17]. They captured droplets in their images and oil spouts that are being transferred towards the combustion chamber as the piston moves downstroke. In this way, oil is transported towards TDC and is verified as one of the oil transport mechanisms. The oil mist generation can be explained as it is complemented with images that capture droplets emerging from the ring groove. In Figure 26a–c, oil mist is observed in the high-magnification images. This is possible when the gas is travelling with a high enough velocity that droplets of oil may be sucked from the surface of the oil film as it passes. Droplet entrainment from the oil film on the cylinder wall to the ring gaps, where the gas velocity is high, should also be considered [36]. A greater amount of oil mist generation is likely to occur at the piston ring gap due to the faster-flowing blow-by gas at this point.

3.3. Cavitation Inception and Development: Parametric Experimental Identification in Piston Rings

The research approach to understanding cavitation that was clearly identified in Figure 19a–e, Figure 21, Figure 23a–d and Figure 24a,b followed imaging research study of the single-ring test rig. The simulating test rig was a large-scale model, with its 5mm width ring supporting this role and, on the other side, the real-sized single-cylinder engine rig. Large-scale test rig results showed that the ring was covered with string cavities in the majority of the stroke. At the dead centres, where flow reverses, the first stage of cavitation is fern-shaped; with their subsequent growth, these cavities form bigger-sized ferns and another type of cavity, fissures. The next stage, as linear speed rises, is string-shaped cavities that continue to grow until they reach the ring’s trailing edge and eventually appear as open-form cavitation.
However, in the case of the engine, the size of the visualisation window has made it difficult to image lubricant flow at the reversal points near the dead centres of the stroke. Although the cavitation images acquired for the single-ring test rig were similar to those produced by the quartz-sectioned engine liner, their overall size and span relative to the engine stroke length are insufficient to analyse the overall length of the engine stroke in a representative manner. It was clear from the visualisation parametric analysis for the simulating single-ring test rig that the fern cavities form later in the stroke as speed increases and similar behaviour is noticed in the event of load decrease. Clear pictures of the squeeze film effect, which is already discussed in Section 3.1, and how cavitation initiation changes as speed and load increase, were not achievable for the engine motoring experiments. Even while the speed was kept at relatively modest levels, the engine tests did not record its beginning. No obvious signs were found for higher speed imaging, where cavitation appears later on in the stroke. However, it should be noted that in the case of the front and anti-thrust side windows, different cavitation initiation points in the stroke should be taken into consideration for the same speed and load, since the stress on the ring varies along its circumference; this is an effect of piston tilt and dynamics.
Figure 27 shows a schematic of the most probable cavitation development in the engine. Imaging results support this representation. The stages derived take into account experimental imaging from the engine and test rig, and also lubricant starvation.
There are three cavitation stages. Figure 27A,B show the possible cavitation stages that lead to the latest cavitation development in Figure 27C, which is visualised in the experiments (string cavities and irregular shapes). This graphic representation also combines the probable oil film pressure for the cavities in every stage. As in the case of the single-ring test rig, incipient cavitation is the result of negative or sub-atmospheric pressures, hypothetically; it was not possible to acquire engine oil film pressure measurements. At the front edge of the piston ring, the pressure reading is the combustion chamber’s, and at the diverging wedge, the respective value would be that of the second land’s. Later in the stroke (Figure 27B—irregular fern growth) the ferns grow, and they are combined with sub-atmospheric oil film pressure at the diverging wedge of the piston ring. Again, the pressure reading ends with the pressure measurement of the second land. The string cavities (Figure 27C) reach the trailing edge of the piston ring or they can be cut midway. The visualised cavity shapes are not uniform. The pressure reading at the diverging wedge is that of the third land. Figure 27 refers to the compression stroke.
Evidence of the interference in the lubricant flow, across the length of the liner and along its circumference, is seen as follows: Surface roughness measurements of the liner surface show that there are relatively big gaps in every window and liner limit even if special machining methods were used for the windows and for their specific tolerances. The range of the gap is between 40 and 650 microns. Those big gaps affect the lubrication as the piston reciprocates. The link between the surfaces is not uniform. It was also noticed that with the removal of the engine block and liner after the experiments, the window’s surface was no longer as clear as it had been during fitting. The interaction of the piston rings and window made the surface look blurred. The Talysurf surface profilometry was unable to provide a profile of the circumference of the liner due to geometrical restrictions. The surface profiles are shown in Figure 28a–d.
The test rig is considered a large-scale simulating rig for studying the lubrication aspects of the real-size piston-cylinder engine assembly, and thus, any mathematical relationship between these experiments requires a “cavitation factor” (CF) coefficient to be determined. It is derived as the ratio of the width or the length of the string cavities divided by the piston ring width measured or given for every case. In Table 2, the different testing conditions are presented for the simulating test rig and the Lister–Petter engine [5,25].
Cavitation   factor 1 = width   of   string width   of   piston - ring
Following the measurement scale of the images, the string distances for every case (for the test rig in Figure 29a and for the engine in Figure 29b) are presented as averaged values to compare their cavitation factors (CFs). The issue of repeatability is, of course, a matter of substantial significance, as in the case of the engine, at least, the string cavity shapes do not appear to have the uniform shapes that appear on the simulating piston ring surface. It is, however, important to stress that the surface of the piston ring corresponds to a cavitation area comparable to the images taken at the same CA position at different cycles, with the starved lubrication conditions contributing the most to the appearance of these irregularly shaped cavities.
For every test case, the images are used to extract string distance measurements; then the average value is used for the calculations. The mean measured string cavities distances are:
  • For the single-ring test rig: 0.268 mm, standard deviation σ = 0.056 mm;
  • For the Lister–Petter engine: 0.463 mm, standard deviation σ = 0.090 mm.
For the Lister–Petter engine, the cavitation factor 1 derived for the average string distance–width, as calculated from Equation (1), is:
Cavitation factor1 = CF1engine = 0.194
whereas for the single-ring test rig it is again calculated as CF1test rig = 0.054
and CF1engine is 72.16% greater than CF1test rig, the relative increase being (CF1engine CF1test rig)/CF1engine × 100 (%).
Another comparison of the cavitation factors derived from imaging will be made, using Equation (4), this time looking at the length of the string cavities compared to the width of the piston ring. For the single-ring test rig, there are differences between the upstroke and downstroke as far as the length of the strings is concerned. The downstroke case is examined:
Cavitation   factor 2 = CF 2 = length   of   string width   of   piston   ring
The mean measured string cavities lengths are:
  • For the single-ring test rig: 2.536 mm, standard deviation σ = 0.233 mm;
  • For the Lister–Petter engine: 2.137 mm, standard deviation σ = 0.116 mm.
The cavitation factors respectively are:
CF2engine = 0.898
Single-ring test rig:
CF2test rig = 0.507
The lengths of the string cavities cover most of the piston ring surface, as the engine imaging showed. For the test rig, it is approximately 50% of the piston ring length and has a very uniform shape, due to the limited factors affecting the lubrication of the simplified test rig. CF2engine is 43.5% greater than CF2test rig, the relative increase being (CF2engine − CF2test rig)/CF2engine × 100 (%). For the structures described above, it is worth calculating the residence time of the string cavities for both cases for which experimental data were acquired [5].
For the testing conditions described in Table 2, the residence time of the string cavities’ formation can be easily derived for the test rig. The residence time is calculated as the time from the corresponding CA that they appear to reach the trailing edge of the piston ring specimen, up to the respective crank angle that they start diminishing on the same stroke. For the single-ring test rig, the string cavities reach the trailing edge of the piston ring specimen at approximately 88° CA and they start diminishing at 192° CA. The residence time of the cavities, calculated for the sinusoidal liner movement, is:
tres test rig = 58 ms
For the engine, the pulses that were used for the image acquisition triggered by the software gave the CA of the piston position as it moves from BDC to TDC. These structures were noticed at 215.28° CA and at 318.24° CA. The residence time of the string cavities, calculated for the piston movement, is:
tres engine = 43 ms
At the anti-thrust side of the Lister engine, more evidence of the appearance of the oil mist became clear. The following figures show the top compression ring. In Figure 30a, there is no sign of oil droplets at the induction stroke, 44.28° CA, 3.67 cm from top edge. After one revolution, oil droplets emerge from the ring side clearances; see Figure 30b–d.
The oil mist that is captured in the images in front of the piston rings is generated by the oil droplets at the bottom ring side clearance. During the expansion stroke, the oil droplets that are located under the piston ring at the ring side clearance and at the piston grooves are emerging, creating a “cloud” of droplets that is moving towards the combustion chamber. The droplets are squeezed out of the lower side clearance with the aid of the high combustion chamber pressure that prevails during the expansion stroke. Greater lubricant transport can be attributed to the oil mist, as it might entrain more oil during its upstroke movement, as already stated. The oil spouts identified in [17] at higher engine speeds and for lower-magnification imaging should be derived by the droplets as shown in the images above. Higher speeds should intensify the entrainment process, which is covering a larger area of the stroke. The above consideration for the engine, though, puts the calculated residence time at risk. The estimation of the time span in the engine stroke in which the string cavities appear through the visualisation images is not accurate, but it considers the approach limited by the overall viewing area of the window. As far as this is concerned, the cavity shapes appear at both edges of the windows, from the lower part of the lower window to the upper part of the upper window. It is therefore important to stress that the accuracy of the calculation should be further enhanced with the aid of a larger window area, which will enable the coverage of the whole stroke length and not part of it, as it applies to the existing sectioned liner modifications [5].
More imaging analysis, helping the repeatability of the imaging experiments, shows the developed oil film on the ring surface and droplets underneath the piston ring, at the lower piston ring side clearance. Figure 31 shows the droplets under the lower surface of the second compression ring and also some irregular string cavitation shapes.
In Figure 32, oil droplets are combined with oil mist.
Figure 33 shows oil droplets at the lower surface of the piston ring while string cavities on the surface of the ring are a bit harder to discern due to the lighting method used, i.e., the fibre optics lighting triggered by a custom software program at the desired crank angle, same as in Figure 32, Figure 33 and Figure 34.
Figure 34 shows more bubbles appearing at the lower surface of the second compression ring and, again, irregularly shaped string cavities at the diverging wedge of the piston ring as it moves upstroke during the compression stroke.

3.4. Ricardo Single-Cylinder Optical Engine

The engine used for the testing is a Ricardo HYDRA gasoline, spark ignition, port-injected model custom made for lab use, as shown in Figure 8. An electric motor coupled to the engine enables it to reach speeds of up to 3500 r/min for motored tests [9]. In addition, the new window housing was considerably smoother, ensuring the best window fit possible between the housing and the cylinder and preventing leakages or pressure losses. Another important factor compared to the previous tests was the ease of dismounting and reassembling of the window area when cleaning was required, without having to dismantle the cylinder head [8].
In these tests, the cavitation coverage percentage compared to the total (in the image) compression piston ring surface was extracted with image analysis. Figure 35 shows the cavities on the top compression ring upstroke at 30 °C and 40 °C, 800 rpm, and the respective percentage of the piston ring coverage.
As cavitation is not clear in the images during the intake/exhaust cycle, it was assumed that this can be partially because during these two strokes the in-cylinder pressure is approximately atmospheric pressure with marginal or no pressure difference across the rings. Cavities will not be initiated and developed. The converging–diverging wedge is not solely effective at producing the lubricant pressure required to generate any forms of cavities. Figure 36a–d show the piston speed effect on cavitation for same testing conditions and temperature of 70 °C. A low speed of 208 r/min was chosen, with very small visible cavitating bubbles expanding to an area of 5.5%. Then, for the higher-speed test case of 800 r/min, the cavitating bubbles increased, covering 57.8% of the area of the ring. Even higher engine speeds, of 1000 and 2000 r/min, are combined to create a greater cavitating area, as this time it increased to 76.4% and 77.7%, respectively. From 208 to 1000 r/min, large differences are noticed in contrary to the increase in engine speed from 1000–2000 r/min, as it seems that there is little to no effect; similar cavitating areas appear in the images, as well as similar distribution and intensity. Higher speeds (motoring experiments > 2000 r/min) have a small impact on cavitation [9].
As already analysed, the ring/liner gap plays its role in the various engine strokes. The sealing ability of the piston rings increases with high in-cylinder pressure, providing a better combustion chamber and engine sump isolation; as a result, a thinner lubricant film develops. On one hand, while the MOFT during intake/exhaust has a greater value than that of the power cycle, the lubricant during the power cycle is forced to squeeze at the interface. The fluid develops a higher velocity and, at the same time, a lower oil film pressure value. On the other hand, during the power cycle, imaging supported the presence of cavitation at the contacting interface, during both the upstroke and the downstroke piston movements [9].
Figure 37a,b show the blow-by through the gaps of the first, second and third pinned piston rings, for gap alignment purposes. The lubricant’s main passage was the gaps between the rings, which was the main passage of oil transport between the oil sump and the combustion chamber. The lubricant will pass through the gaps between the rings and, with the kinetic energy introduced by the piston along with the pressure differential, the lubricant will find its way into the combustion chamber [9], contributing to particulate emissions through fuel absorption in the generated oil film. In Figure 37, the mechanisms that allow lubricant transport are evident, as the gaps are transmuted to paths towards the combustion chamber. The sequence of images illustrates the repeatability of the occurrence of blow-by where lubricant passes though the ring gaps.

4. Discussion

Oil transportation mechanisms have been evaluated and associated with different cavitation stages. Extensive parametric study helps in identifying squeeze film and cavitation initiation according to the measured friction peaks at the boundary lubrication region. These friction peaks are produced as a function of piston ring geometry operating characteristics, such as speed, load and temperature, and lubricant properties, namely the high-temperature high-shear (HTHS) viscosity of the lubricant [10]. These results of the cavitation images, and the outcome of this processing, show how cavitation initiation, the squeeze film effect shift and the cavitation area on the piston surface can be put together in interpreting the observed rheological phenomena [25]. Kinematic viscosity and friction in the test rig are linked to the cavitation images. Image processing extracts the geometrical values of the cavities and a correlation to lubricant properties is derived. Initiation, development and diminishing of cavitation is strongly influenced by lubricant formulation. As shown in cavitation figures, cavitation initiation and the area during fully developed hydrodynamic flow changes, regardless of evaluating images from the engine piston rings or the simulation test rig, as the produced images show. The lubricant without a viscous modifier shows longer cavities, and a smaller-sized cavitation area is linked to a greater kinematic viscosity value [8].
The squeeze film effect takes place close to the stroke reversal points, where the lubrication is boundary and cavities start forming. Low frictional losses are combined with low-viscosity oils, increasing efficiency and emissions as the path towards the combustion chamber is easier to follow [6]. Load increase shifts the flow reversal closer to stroke reversal, as the squeeze film appears. With an increase in speed for a constant load, friction force peaks develop a lower value while appearing at a greater distance from the dead centres [26].
Cavitation damage is the outcome of fluid impact on the interacting surfaces as the cavities formed at low oil film pressure collapse. It is expected that the collapse velocity will be lower in a Newtonian lubricant than in a shear-thinning lubricant; the same applies for the cavitation zone, i.e., it is larger in the shear-thinning ones. Shear-thinning affects cavitation behaviour, its effect being OFT change [2,5,6]. Shear-thinning multigrade lubricants, as well as thin monograde oils, tend to reduce friction power losses, while at the same time increasing cylinder wear [6]. The effect of OFT on cavitation behaviour should be also considered while assessing the influence of viscosity and cavitation damage. At the same time, the load effect on starved surfaces should be assessed [25]. Shear-thinning fluids having lower tensile strength influence cavitation behaviour [2]. Initiation, development and disappearance of cavities are linked directly to the properties of the tested lubricant, with change in OFT being an indirect change [6].
The forms of cavitation, such as string cavities, were verified. Friction force arising in the region of oil film breakage should be evaluated to assess the impact on wear; as shown, friction peaks shift closer to or further from the dead centre of the stroke, and their magnitude varies according to the lubricant properties [10,26]. Cavitation shortens the effective load piston ring area, deteriorating load capacity, even in the hydrodynamic lubrication region with substantial oil film pressures [25]. Different lubricants, operating conditions and piston ring geometries should be considered and, at the same time, the effect of the squeeze film and its shift due to operating conditions and property changes should be included. Simultaneously, when collapsing at the stroke reversal points, the development of friction peaks prevails at the boundary lubrication region. This is evidence of wear development [6].
Starvation, together with cavitation, significantly reduces the amount of load supported by the ring. An effective load region amounts to 15-40% of the nominal region of the ring [34], which, following the results of Equation (3) for the top compression ring, is in good accordance with the lowest percentage. Additionally, the flatter ring is linked to extensive hydrodynamic lubrication, even if it is weakened in the middle of the stroke, as shown in the oil film pressure experiments (lower peak film pressure value). It generates a smaller cavitation area than the barrel-faced one, i.e., rings with a smaller radius of curvature. A curved profile will strengthen the hydrodynamic film lift, extending the cavitation area and deteriorating the load-carrying capacity of the piston ring. More effective load support comes with a flat-face ring rather than a curved one. The load capacity of the piston is a major mechanism contributing to engine wear [37].
Both Thirouard [13] and Gamble [15] mention the contribution of oil mist to oil transport through the ring pack. The experimental visualisation data showed that oil could be transported out of the ring gap as oil mist. Other identified mechanisms that drive oil film from the lands to the ring groove clearance were identified as follows:
  • Ring squeezing;
  • Lateral motion of the piston relative to the rings.
Inertia force generates a pressure gradient which, in turn, transports oil only in the oil control ring. The oil transport rate, resulting from the above mechanisms depends on the following:
  • Ring and piston dynamics, which consequently vary with engine speed and load;
  • The amount of available lubricant in the vicinity of the ring groove clearances.
The ideal situation of the single-ring test rig is confronted with the real-size engine test rig experiments, where more parameters affect the piston ring pack during reciprocation.
Higher MOFT can by itself explain why the string cavities might offer a smaller length or width, with the former being in favour of the lubricant with the viscous modifier [9,23].
Hydrodynamic oil film pressure measurements were taken within a range of 500 to ≈1200 kPa, and linked to operating conditions and piston ring geometry. This increased with higher speed and higher loads. In contrast, higher temperatures reduce the peak pressures and, in terms of piston ring geometry, a smaller piston ring radius clearly developed higher oil film pressures. Open-form cavitation significantly influences oil film peak pressures in the hydrodynamic region. Increasing speed, load and temperature showed that film pressure peaks are shifted to the diverging wedge of the piston ring [27].
Considering that cavitation during the intake and exhaust strokes is not evident, the in-cylinder pressure stands out as the main mechanism behind the appearance and control of cavitation [9]. Cavitation wear, along with shockwaves, can erode the piston ring/cylinder liner interface. The small volumes of liquid, when the cavitation bubbles collapse, result in many small high-pressure and high-temperature spots [8]. Bubbles are formed as gas is released and has a near-zero or negative oil film pressure. When a bubble collapses against a solid surface, very high stresses reaching 0.5 GPa in some cases are generated, and this will cause wear [38]. Eventually, load capacity is reduced when compared to the values calculated by hydrodynamic theory assuming no cavitation effects [6]. According to Stachowiak and Batchelor [38], if a significant quantity of bubbles is formed in the lubricant film, load capacity is reduced. A decrease in lubricant viscosity reduces friction power losses, but at the same time this increases the boundary friction in the case of the expansion stroke. The friction characteristics are affected by the shear-thinning effect when multigrade lubricants are used [36]. The reduced viscosity of shear-thinning lubricants should lead to large-sized cavities. In [35], it was found that the effect of lubricant viscosity was particularly important and viscosity modifiers were found to have the greatest effect on droplet formation. In particular, when additives were included in the base oil, the viscosity modifier was shown to be the major factor causing this reduction in misting tendency. This tendency should be explored further in future engine visualisation experiments.
On the piston lands, oil was observed to move in both axial directions and along the ring circumference. The axial oil displacement was found to be driven by the inertia forces. The circumferential flow appeared to result from the dragging action of the blow-by gases as the fluid speed is approx. 2 mm/s (second piston land). Oil can move with the gas as it is dragged by the shear stress forces. This process takes the lubricant out of the second land region through the ring gaps. Through experimental observation, it was established that the inertia forces dictate the oil repartition along the axial direction of the piston lands. This forces oil to repeatedly accumulate against the rings and spread over the piston surface [36]. Oil loss from the ring pack into the combustion chamber is dominated by reverse blow-by [15]. Furthermore, it was found from engine test results and analytical calculations that the actual gas flow resulting from ring fluttering has little effect on the land oil distribution. The experimental observation further suggested that the direction of the oil flows through the back of the rings was linked to the main oil supply location towards the ring groove. Typically, because more oil was supplied to the lower clearance of the ring grooves, oil flowed from the lower to the upper land. The ring/groove relative angle, which affects the squeezing process and the flutter-induced gas flow, appeared to affect the rate at which the oil was flowing through the ring grooves, but not the total transport value direction [39]. By changing the geometry of the second ring and third land, it can be argued that the amount of oil that accumulates in front of the lower clearance of the second ring groove (Figure 38) greatly affects the lubricant flow rate through the back of the scraper ring [39].
The influence of geometrical parameters on the shaping of the lubrication wedge, taking into account liquid microflows on curved surfaces and coating micro-geometries in a friction loss analytical model, was assessed by Wróblewski and Kachel [40]. It was also found that micro-irregularities influence the distribution of oil film thickness at peak cylinder pressure, which is critical for the piston ring sealing process [40]. The same group of researchers studied the effect of lubricant chemistry on the oil film formation process through the coating of engine parts, affecting both load-carrying capacity and the ability to form a lubricating film. Physical and chemical parameters of the coatings of the parts at the lubricating interface were assessed, as the value of the contact angle of the liquid on the surface of the coating depends on the value of the intermolecular force of attraction [41]. This research provides further evidence of the effect of geometrical considerations on oil film build-up and transport, as well as the influence of physical and chemical lubricant properties.

5. Conclusions

With the different experimental methods used, a picture of the parameters affecting lubrication and piston ring performance could be drawn. The parameters extend from the operating range and lubricant properties, to piston ring/liner interface geometry. All of these parameters, when measured with the different sensors and optical techniques, contribute, on their own part and in accordance between them, to supporting the visualisation findings. The aim was to shed light on the parametric effect of lubricant cavitation, its initiation and development, and on friction and wear in piston ring lubrication. The cavity measurements (size of the microscopic forms, area, length and width) taken from imaging can correlate with the lubricant formulation.
There is an agreement with the results presented by other research groups in the past. Images taken from the second compression ring, as well as images from the third ring, show a fully developed oil film on the surface of the rings.
The visualisation images show the string cavities with different magnification lenses. Oil mist can also be noticed with the higher magnification lenses, as well as oil droplets on top of the piston rings and at the ring side clearance. Oil droplets were also noticed when the piston was at BDC and in front of the second compression ring, the scraper ring and the top piston land. The oil droplets and their source of appearance was captured, though, and higher magnification provided good imaging quality of how these droplets emerge through the ring side clearances. The most probable explanation is that these droplets adhere to the inner surface of the window.
Cavitation striations were observed mainly on the surface of the top compression ring. There are images, however, that show oil film developed on the top compression ring surface, as well as the second compression and scraper ring, but no string cavities were visualised. A possible reason for the appearance of the film on one hand, and the strings on the other (for the same piston ring but in different strokes and distances from TDC), is ring fluttering, which causes oil to pump into the ring groove, thus affecting the oil availability at the converging wedge. So, as the piston ring changes position, oil is squeezed or enters the side clearances.
The outcome of the ring/window interaction is the development of a rough surface. Surface profilometry results showed a groove depth up to 8 μm after the visualisation testing. The inner surface of the window has long linear grooves/scratches that are formed across the circumference of the liner. With the piston reciprocating, oil can penetrate the groove, producing droplets depending on the local depth of the groove. So, the corresponding figures indicate how the lubricant inside these cracks is shaped as droplets. Images taken from a cracked region of a visualisation window (long and deep groove) showed that larger oil droplets were formed inside these crevices.
Two major mechanisms were found to be responsible for oil flows from the piston lands to the ring grooves: the ring pumping, which was observed experimentally, and the lateral motion of the piston relative to the rings. The amount of oil in the grooves depended on the amount of oil in front of the ring groove clearances during ring lift and/or the piston lateral movement. Accordingly, it can be concluded that the rate at which oil from the lands is supplied to the grooves of the top two rings is strongly dependent on the timing of the inertia-driven oil displacement and the piston/ring interface dynamics.
The oil flows from the ring grooves to the piston lands appeared to be governed by the ring squeezing action and the dragging effect of the gases flowing through the ring groove clearances; this latter mechanism combined with ring flutter. The experimental observations of the land oil distribution during top ring fluttering clearly showed that gas flows resulting from ring instability could remove most of the oil accumulated in the top ring groove, preventing oil from flowing to the crown land.
Cavitation is directly linked to lubricant viscosity. An increase in temperature results in an MOFT decrease, as well as an oil film pressure peak decrease. Parametric study of temperature in the simulating test rig advanced the initiation of the cavitation towards the dead centre of the stroke and enhanced its intensity. After 60 °C, the cavitation area decreased as bubbles collapsed at higher oil temperatures. Bubbles, in general, were found to diminish at high temperatures (greater than 60 °C).
Formulation significantly affects the initiation and development of the various cavitation shapes, this being an effect of various parameters. Observations related to the chemistry of the lubricants can promote novel techniques in additive design and future research composing, optimising and improving (new) lubricant properties, promoting piston ring load-carrying capacity, improving efficiency, and limiting wear over a wider operating range.
This constitutes an evolutionary point for evaluating the basic lubrication performance aspects via study using a large-scale simulation single-ring test rig fitted with the various sensors, and with the aid of a custom-made visualisation window that enables visualisation of cavitation and its properties through the reciprocating cycle. This parametric study, at a second stage, was implemented in the engine cylinder, where complexity and a vast number of interconnecting unknowns have a small or detrimental effect on the operating lubrication interface.

Funding

This research was funded by Greek State Scholarship foundation 80077.06.4 and CASTROL UK at Reading provided the lubricants for the experiments.

Data Availability Statement

The original contributions presented in this study are included in the article. Further inquiries can be directed to the corresponding author.

Acknowledgments

I would like to thank Castrol/BP, J.M. Nouri and Y. Yan at City University and I. Vasilakos for supporting and extending this research work. Also, many thanks are due to C. Arcoumanis for providing the necessary support and means to promote the lubrication research, first at Imperial College and then at City, University of London.

Conflicts of Interest

The author declares no conflicts of interest. The funders had no role in the design of the study; in the collection, analyses, or interpretation of data; in the writing of the manuscript; or in the decision to publish the results.

References

  1. Priest, M.; Dowson, D.; Taylor, C.M. Theoretical modelling of cavitation in piston-ring lubrication. Proc. Inst. Mech. Eng. Part C J. Mech. Eng. Sci. 2000, 214, 435–447. [Google Scholar] [CrossRef]
  2. Rastogi, A.; Gupta, R.K. Effect of shear thinning on cavitation in lubricant films. SAE Tech. Pap. 1992, 922286. [Google Scholar] [CrossRef]
  3. Arcoumanis, C.; Duszynski, M.; Flora, H.; Ostovar, P. Development of a piston-ring lubrication test-rig and investigation of boundary condition for modelling lubricant film properties. SAE Trans. 1995, 104, 1433–1451. [Google Scholar]
  4. Dellis, P.; Arcoumanis, C. Cavitation development in the lubricant film of a reciprocating piston–ring assembly. Proc. Inst. Mech. Eng. Part J J. Eng. Tribol. 2004, 218, 157–171. [Google Scholar] [CrossRef]
  5. Dellis, P. Aspects of Lubrication in Piston Cylinder Assemblies. Ph.D. Thesis, Department of Mechanical Engineering, Imperial College London, London, UK, 2005. [Google Scholar]
  6. Dellis, P.S. Piston-ring performance: Limitations from cavitation and friction. Int. J. Struct. Integr. 2019, 10, 304–324. [Google Scholar] [CrossRef]
  7. Dellis, P. Laser-induced fluorescence measurements in a single ring test rig: Evidence of cavitation and the effect of different operating conditions and lubricants in cavitation patterns and initiation. Int. J. Engine Res. 2020, 21, 1597–1611. [Google Scholar] [CrossRef]
  8. Vasilakos, I. Cavitation in the Cylinder-Liner and Piston-Ring in a New Designed Optical IC Engine. Ph.D. Thesis, Department of Mechanical Engineering and Aeronautics, University of London, London, UK, 2017. [Google Scholar]
  9. Nouri, J.M.; Vasilakos, I.; Yan, Y. Cavitation between cylinder–liner and piston–ring in a new designed optical IC engine. Int. J. Engine Res. 2022, 23, 1144–1158. [Google Scholar] [CrossRef]
  10. Dellis, P. Effect of friction force between piston rings and liner: A parametric study of speed, load, temperature, piston–ring curvature, and high-temperature, high-shear viscosity. Proc. Inst. Mech. Eng. Part J J. Eng. Tribol. 2010, 224, 411–426. [Google Scholar] [CrossRef]
  11. Tian, T.; Wong, V.W.; Heywood, J.B. A piston–ring pack film thickness and friction model for multigrade oil and rough surfaces. SAE Tech. Pap. 1996, 962032. [Google Scholar] [CrossRef]
  12. Sanda, S.; Saito, A.; Konomi, T.; Nohira, H. C465/014 Development of scanning laser-induced-fluorescence method for analyzing piston oil film behaviour. In Proceedings of the Institution of Mechanical Engineers Conference, Birmingham, UK, 17–18 November 1993; pp. 155–164. [Google Scholar]
  13. Thirouard, B.P. Characterization and Modelling of the Fundamental Aspects of oil Transport in the Piston-Ring-Pack of Internal Combustion Engines. Ph.D. Thesis, Department of Mechanical Engineering, Massachusetts Institute of Technology, Cambridge, MA, USA, 2001. [Google Scholar]
  14. Tian, T.; Wong, V.W. Modelling the lubrication, dynamics, and effects of piston dynamic tilt of twin-land oil control rings in internal combustion engines. J. Eng. Gas. Turbines Power (Trans. ASME) 2000, 122, 119–131. [Google Scholar] [CrossRef]
  15. Gamble, R. The Influence of Lubricant Degradation on Piston Assembly Tribology. Ph.D. Thesis, School of Mechanical Engineering, University of Leeds, Leeds, UK, August 2002. [Google Scholar]
  16. Gamble, R.J.; Priest, M.; Taylor, C.M. Detailed Analysis of Oil Transport in the Piston Ring Assembly of a Gasoline Engine. Trib. Lett. 2003, 14, 147–156. [Google Scholar]
  17. Inagaki, H.; Saito, A.; Murakami, M.; Konomi, T. Development of Two-Dimensional Oil Film Thickness Distribution Measuring System. SAE Tech. Pap. 1995, 952346. [Google Scholar] [CrossRef]
  18. Rahmani, R.; Rahnejat, H.; Fitzsimons, B.; Dowson, D. The effect of cylinder liner operating temperature on frictional loss and engine emissions in piston ring conjunction. Appl. Energy 2017, 191, 568–581. [Google Scholar] [CrossRef]
  19. Almqvist, A.; Wall, P. Modelling cavitation in (elasto)hydrodynamic lubrication. In Advances in Tribology, 1st ed.; Intechopen: London, UK, 2016; Chapter 9; Available online: https://www.intechopen.com/books/5271 (accessed on 4 June 2021).
  20. Zavos, A.; Nikolakopoulos, P.G. Tribology of new thin compression ring of fired engine under controlled conditions-A combined experimental and numerical study. Trib. Int. 2018, 128, 214–230. [Google Scholar] [CrossRef]
  21. Zavos, A.; Nikolakopoulos, P.G. Investigation of the top compression ring power loss and energy consumption for different engine conditions. Tribol.—Mater. Surf. Interfaces 2021, 16, 130–142. [Google Scholar] [CrossRef]
  22. Nikolakopoulos, P.G. Simulation of deposits effect on cylinder liner and influence on new and worn compression ring of a turbocharged DI engine. Simul. Mod. Pract. Theory 2021, 106, 102195. [Google Scholar] [CrossRef]
  23. Nouri, J.M.; Vasilakos, I.; Yan, Y.; Reyes-Aldasoro, C.C. Effect of viscosity and speed on oil cavitation development in a single piston-ring lubricant assembly. Lubricants 2019, 7, 88. [Google Scholar] [CrossRef]
  24. Taylor, R.I. Squeeze film lubrication in piston rings and reciprocating contacts. Proc. Inst. Mech. Eng. Part J J. Eng. Tribol. 2015, 229, 977–988. [Google Scholar] [CrossRef]
  25. Dellis, P.S. Piston ring performance II: Measurement of cavitation shapes in different operating conditions and their link to lubricant properties. Int. J. Str.Integr. 2022, 13, 611–631. [Google Scholar] [CrossRef]
  26. Dellis, P. On the effect of temperature in friction force measurements for a simplified piston cylinder set-up: Squeeze film combined with minimum oil film thickness measurements and viscosity index effect. Proc. Inst. Mech. Eng. Part J J. Eng. Tribol. 2023, 237, 1723–1742. [Google Scholar] [CrossRef]
  27. Dellis, P.; Arcoumanis, C. A parametric study on oil film pressure measurements in a single piston-ring configuration. Int. J. Engine Res. 2013, 14, 122–137. [Google Scholar] [CrossRef]
  28. Kim, S.; Azetsu, A.; Yamauchi, M.; Someya, T. Dynamic behavior of oil film between piston-ring and cylinder liner: Visualization of oil film rupture and measurement of oil film pressure using simulating rig. JSME Int. J. Ser. C Mech. Syst. Mach. Elem. Manuf. 1995, 38, 783–789. [Google Scholar] [CrossRef]
  29. Nakashima, K.; Ishihara, S.; Urano, K. Influence of Piston Ring-Gaps on Lubricating Oil Flow into the Combustion Chamber. SAE Tech. Pap. 1995, 952546. [Google Scholar] [CrossRef]
  30. Nakashima, K.; Ishihara, S.; Urano, K.; Murata, K. Lubricating Oil flow into the Combustion Chamber and its Reduction Method in an Automobile Gasoline Engine. SAE Tech. Pap. 1996, 962034. [Google Scholar] [CrossRef]
  31. Ishihara, S.; Nakashima, K.; Urano, K.; Murata, K. The Designs of Piston and Piston Ring to Reduce Lubricating Oil Flow into the Combustion Chamber. SAE Tech. Pap. 1999, 1999-01-3316. [Google Scholar] [CrossRef]
  32. Yoshida, H.; Kusama, K.; Sugihara, H.; Ariga, S. Effect of Piston Second Land Shape on Oil Consumption. In Tribology and lubrication: Volume 2, Proceedings of the 18th Annual Fall Technical Conference of the ASME Internal Combustion Engine Division (Conf. Code 46132), Fairborn, Ohio, 20–23 October 1996; Caton, J.A., Ed.; Texas A&M University: College Station, TX, USA, 1996; pp. 7–16. [Google Scholar]
  33. Schäffer, J.; Kirner, C.; Härtl, M.; Wachtmeister, G. Development of a Measuring System for the Visualization of the Oil Film between the Piston and Cylinder Liner of a Gasoline Engine. SAE Int. J. Engines 2020, 13, 175–190. [Google Scholar] [CrossRef]
  34. Azetsu, A.; Kitajima, I.; Kuratsuji, K. Development of a new visualization technique using photochromism for transport process of lubricating oil around the engine piston. Int. J. Engine Res. 2019, 20, 777–787. [Google Scholar] [CrossRef]
  35. Dyson, C.J.; Priest, M.; Lee, P.M. Simulating the Misting of Lubricant in the Piston Assembly of an Automotive Gasoline Engine: The Effect of Viscosity Modifiers and Other Key Lubricant Components. Tribol. Lett. 2022, 70, 49. [Google Scholar] [CrossRef]
  36. Thirouard, B.; Tian, T.; Hart, D. Investigation of oil transport mechanisms in the piston ring pack of a single cylinder diesel engine, using two dimensional laser induced fluorescence. SAE Tech. Pap. 1998, 982658. [Google Scholar] [CrossRef]
  37. Yu, B.; Sawicki, J.T.; Dunaevsky, V. Analytical Solution of Piston Ring Pack Lubrication for Truck Air Brake Compressor. SAE Tech. Pap. 1999, 1999-01-3769. [Google Scholar] [CrossRef]
  38. Stachowiak, G.; Batchelor, A.W. Engineering Tribology, 4th ed.; Butterworth-Heinemann: Oxford, UK, 2014; pp. 525–576. [Google Scholar] [CrossRef]
  39. Thirouard, B.; Tian, T. Oil Transport in the Piston Ring Pack (Part II): Zone Analysis and Macro Oil Transport Model. SAE Tech. Pap. 2003, 2003-01-1953. [Google Scholar] [CrossRef]
  40. Wróblewski, P.; Kachel, S. Novel Approach to Analyzing Friction Losses by Modeling the Microflow of Lubricating Oil between the Piston Rings and Cylinder in Internal Combustion Engines. Energies 2024, 17, 3697. [Google Scholar] [CrossRef]
  41. Wróblewski, P.; Kachel, S. The concept of the contact angle in the process of oil film formation in internal combustion piston engines. Sci. Rep. 2023, 13, 20715. [Google Scholar] [CrossRef]
Figure 1. Simulating single-ring test rig: (a) schematic; (b) the capacitance sensor used for MOFT measurements; (c) the capacitance, friction sensors, piston specimen and the oil jets that flood the piston ring and liner interface with lubricant; (d) schematic of the miniature pressure transducer as fitted on the liner specimen.
Lubricants 12 00460 g001
Figure 2. Modified Kubota engine block with fitted window section [13].
Lubricants 12 00460 g002
Figure 3. PSA spark ignition engine: (a) side view; (b) top view [13].
Lubricants 12 00460 g003
Figure 4. Toyota engine—window layout [17].
Lubricants 12 00460 g004
Figure 5. Lubricant transport mechanisms in the piston assembly of a fired automotive engine [35].
Lubricants 12 00460 g005
Figure 6. Lister–Petter engine modifications, experimental set-up and drawings: (a) Lister–Petter engine with modified block on the dynamometer; (b) liner drawing details; (c) liner and block 3-D drawings; (d) Lister–Petter piston; (e) window drawing details; (f) modified engine drawing details; (g) photo of fitted windows; (h) engine visualisation experimental set-up; (i) camera visualisation set-up; (j) viewing windows, optical fibre probe and pressure transducer fittings in the modified liner [5,25].
Lubricants 12 00460 g006aLubricants 12 00460 g006b
Figure 7. Piston ring pack details for Lister–Petter PHW1 single-cylinder engine [5].
Lubricants 12 00460 g007
Figure 8. The Ricardo HYDRA optical engine: (a) new cylinder design and cooling details; (b) cut-out; (c) custom made quartz visualisation windows; (d) engine side view [9].
Lubricants 12 00460 g008
Figure 9. Upstroke cavitation images from (al) 15° crank angle (CA) to 28.2° CA [23].
Lubricants 12 00460 g009
Figure 10. Downstroke cavitation images from 0° crank angle (CA) to 360° CA [23].
Lubricants 12 00460 g010
Figure 11. Imaging at different CAs for the simulating test rig with the respective oil film pressure readings and different speed tests at 1159 N/m load [4,5].
Lubricants 12 00460 g011
Figure 12. Imaging at different CAs for the simulating test rig with the respective oil film pressure readings and different load tests at 400 rpm [4,5].
Lubricants 12 00460 g012
Figure 13. (a) Vaporous oil film pressure difference between upstroke and downstroke; (b) ring profile as measured by Talysurf surface profilometry [4].
Lubricants 12 00460 g013
Figure 14. Peak oil film pressure signals: (a) offset at different speeds; (b) different cavitation areas at different speeds; (c) cavitation reformation at different loads [27].
Lubricants 12 00460 g014aLubricants 12 00460 g014b
Figure 15. Effect of varying speed and load on (a) cavitation initiation points, different CAs; (b) number of string cavities at mid-stroke [7].
Lubricants 12 00460 g015
Figure 16. Possible cavitation stages for different test cases and location of fibre probe as it travels on top of the piston ring specimen and the cavities: (a) over a lubricant striation at cycle No 1 at 90° CA; (b) over a cavity at cycle No 2 at 90° CA; (c) over a mixed lubricant string cavity region at cycle No 3 at 90° CA [7].
Lubricants 12 00460 g016
Figure 17. The effect of different lubricants’ properties on friction force peaks at 300 r/min, 971 N/m load, 70 °C at TDC [26].
Lubricants 12 00460 g017
Figure 18. Focus on BDC MOFT measurements and squeeze film shift: (a) for different temperatures, oil 6E, 400 r/min and 1159 N/m load; (b) for different lubricants at 600 r/min, 1159 N/m load and high temperature of 70 °C [26].
Lubricants 12 00460 g018
Figure 19. Images taken from the top window at various crank angles. Forms of string cavities are strongly supported by the findings. Camera is fitted 11.17cm from TDC: (a) 576° CA exhaust stroke, cycle A; (b) 576° CA exhaust stroke, cycle B; (c) 576° CA exhaust stroke, cycle C; (d) 576° CA exhaust stroke, cycle D; (e) 576° CA exhaust stroke, cycle E [5].
Lubricants 12 00460 g019
Figure 20. Image taken from the top window at 608.40° CA, exhaust stroke, camera fitted 9.17 cm from top edge, showing (a) oil starvation and surface change on the piston ring; (b) oil spouts extending the second piston land [5].
Lubricants 12 00460 g020
Figure 21. Image of 475.20° CA expansion stroke, camera at 9.17 cm from top edge, string cavities’ formation on top compression ring [5].
Lubricants 12 00460 g021
Figure 22. Images of 615.24° CA exhaust stroke, camera at 9.17 cm from top edge, second compression ring at two different engine cycles: (a) cycle A; (b) cycle B [5].
Lubricants 12 00460 g022
Figure 23. Top window anti-thrust side at 255.24° CA compression stroke, camera at 8.67 cm from top edge: (a) irregular string-shaped cavities, cycle A; (b) appearance of oil droplets on piston ring bottom side clearance, cycle B; (c) more irregular cavitation shapes, cycle C; and (d) another irregular cavity shape, cycle D [5].
Lubricants 12 00460 g023
Figure 24. Top window anti-thrust side: (a) 218.34° CA compression stroke, camera at 11.67 cm from top edge—second compression ring; (b) 218.34° CA compression stroke, camera at 8.67 cm from top edge—top compression ring [5].
Lubricants 12 00460 g024
Figure 25. Images of 124.20° CA induction stroke, camera at 16.07 cm from top edge; (ac) bubbles on the side clearance of the piston ring; (d) shapes resembling string cavity [5].
Lubricants 12 00460 g025
Figure 26. Oil mist on the piston skirt, using the highest magnification lens: (a) 18° CA induction stroke, camera at 9.07 cm from top edge; (b) 48.60° CA induction stroke, camera at 9.07 cm from top edge; (c) 142.20° CA induction stroke, camera at 16.07 cm from top edge [5].
Lubricants 12 00460 g026
Figure 27. Schematic of the possible cavitation stages on the Lister–Petter engine: (A) fern-shaped cavities; (B) irregular fern growth; (C) string cavities [5].
Lubricants 12 00460 g027
Figure 28. Window–liner profile measurements, Lister liner anti-thrust side: (a) upper window, upper side (TDC); (b) upper side of lower window and liner limit; (c) lower side of upper window; and (d) lower side of lower window (BDC) [5].
Lubricants 12 00460 g028aLubricants 12 00460 g028b
Figure 29. Cavitation string measurements, length and width as derived from imaging: (a) single-ring simulating test rig and (b) single-cylinder motored Lister–Petter engine [5]. Orange measurements are the piston ring width and compression ring groove width, blue measurements are the strings’ length and green measurements the strings’ width.
Lubricants 12 00460 g029
Figure 30. Oil mist appearance on the surface of the top compression ring: (a) 44.28° CA, induction stroke 3.67 cm from top (no sign); (b) 403.92° CA, expansion stroke 3.67 cm from top edge; (c) 403.92° CA, expansion stroke 3.67 cm from top edge; and (d) 403.92° CA, expansion stroke 3.67 cm from top edge [5].
Lubricants 12 00460 g030
Figure 31. Image of 254.88° CA compression stroke camera at 8.67 cm from top edge.
Lubricants 12 00460 g031
Figure 32. Image of 255.24° CA compression stroke, camera at 8.67 cm from top edge, cycle A.
Lubricants 12 00460 g032
Figure 33. Image of 255.24° CA compression stroke, camera at 8.67 cm from top edge, cycle B.
Lubricants 12 00460 g033
Figure 34. Image of 255.24° CA compression stroke, camera at 8.67 cm from top edge, cycle C.
Lubricants 12 00460 g034
Figure 35. Cavities on compression ring upstroke: (a) at 30 °C and (b) at 40 °C, 800 rpm [9]. Red highlighted area shows the cavitation area that covers the piston-ring and is calculated by the algorithm. Blue arrow shows upstroke piston movement.
Lubricants 12 00460 g035
Figure 36. Cavitation images on top compression ring of the HYDRA engine motored tests during compression stroke, upstroke at 70 °C, at different speeds; (a) 208 r/min, (b) 800 r/min, (c) 1000 r/min; (d) 2000 r/min [9]. Red highlighted area shows the cavitation area that covers the piston-ring and is calculated by the algorithm.
Lubricants 12 00460 g036
Figure 37. High-pressure gasses act as a medium of the lubricant transport through the ring gaps towards the engine sump during motored tests: (a) 1000 rpm, 70 °C, 6° CA after TDC; (b) 1000 rpm, 70 °C, 6° CA after TDC; (c) 1000 rpm, 70 °C, 12° CA after TDC, higher magnification [8]. Blue arrow shows downstroke piston movement and dotted red arrows show lubricant transport pathways towards the engine sump.
Lubricants 12 00460 g037
Figure 38. Oil pumping at the second land [5]. Black arrows show lubricant pumping process from ring side clearances in the top image as piston moves upstroke and in the bottom image as piston moves downstroke. The orange arrow shows transition from upstroke to downstroke.
Lubricants 12 00460 g038
Table 1. Tested oils from CASTROL for temperature investigations, viscosity index (VI), high-temperature high-shear viscosity (HTHS), grade, viscosity at 50°, 60°, 70°, V100, V40.
Oil Blend Code (CASTROL)003B 006E/02005A/02002A/02
Grade 0W-300W-40 0W-2010W-40
HTHS (mPa·s) 3.303.42.144.05
V100 (cSt)12.1612.86.0414.97
V40 (cSt) 68.9366.83197.8
VI182196146160
Viscosity (cSt) @ 50 °C46.6147.1321.4964.34
Viscosity (cSt) @ 60 °C33.6534.5515.7245.76
Viscosity (cSt) @ 70 °C25.0926.2912.6033.46
Table 2. Test rig and engine experimental conditions comparison.
Test ConditionsSingle-Ring Test RigLister–Petter PHW1 Engine
Speed (rpm)300398
Load (N/m)971motoring
Stroke Length (mm)50110
Linear Velocity (m/s)1.7282.016
Distance from (mm)TDC: 25top edge of top land at TDC: 111.99
Piston ring width (mm)52.36 (1st, 2nd, scraper)
Disclaimer/Publisher’s Note: The statements, opinions and data contained in all publications are solely those of the individual author(s) and contributor(s) and not of MDPI and/or the editor(s). MDPI and/or the editor(s) disclaim responsibility for any injury to people or property resulting from any ideas, methods, instructions or products referred to in the content.

