Article

Effect of Surface Roughness on the Friction Moment in a Lubricated Deep Groove Ball Bearing

by
Harsh Kumar
1,
Vaibhav Gupta
1,
Velamala Bharath
1,
Mayank Tiwari
2,*,
Surajit Kumar Paul
1,
Lokesh Agrawal
3,
Arendra Pal Singh
3 and
Ayush Jain
3
1
Mechanical Engineering Department, Indian Institute of Technology Patna, Patna 801106, India
2
Mechanical Engineering Department, Indian Institute of Technology Palakkad, Kanjikode 678623, India
3
R&D, National Engineering Industries Ltd., Jaipur 302006, India
*
Author to whom correspondence should be addressed.
Lubricants 2024, 12(12), 443; https://doi.org/10.3390/lubricants12120443
Submission received: 20 November 2024 / Revised: 4 December 2024 / Accepted: 9 December 2024 / Published: 11 December 2024
(This article belongs to the Special Issue Recent Advances in Lubricated Tribological Contacts)

Abstract

Deep groove ball bearings (DGBBs) are extensively utilized in industrial machinery, mechanical systems, and household appliances due to their simple design, low maintenance, and ability to operate at high speeds. A critical issue in the performance of these bearings is the power loss by internal friction torque, which adversely affects system efficiency, longevity, and reliability, particularly in demanding applications such as aviation and marine systems. The friction torque in DGBBs is influenced by factors such as load, speed, surface roughness, and lubricant viscosity, making the precise understanding of these elements essential for optimizing system efficiency. Despite its significance, the effect of surface roughness on friction torque in DGBBs remains underexplored. This paper presents an analytical model to evaluate the frictional moments resulting from interactions between the ball–race and ball–cage in lubricated, low-speed DGBBs. This model employs a mixed elastohydrodynamic lubrication approach to determine the friction coefficient at the contact interfaces. This study explores how surface roughness and speed affect both ball–race and ball–cage friction torque, offering a comprehensive analysis of their influence on overall frictional torque. Additionally, the effect of surface roughness on ball–cage contact forces is investigated, enhancing the understanding of its contribution to friction torque. These insights aim to improve DGBB design and operation, maximizing performance and energy efficiency.

1. Introduction

Deep groove ball bearings (DGBBs) are widely used in industrial machinery, mechanical equipment, and household appliances [1]. Single-row DGBBs are particularly popular due to their simple design, high-speed capability, and low maintenance cost. Heat generation from internal friction in rolling-element bearings, like DGBBs, has long been a concern, as it affects the running torque [2]. Friction-induced power loss also impacts the performance, lifespan, and reliability of gyro motors in aviation, aerospace, and marine systems [3]. The friction torque in DGBBs is influenced by various operating factors, including load, speed, surface roughness, and lubricant viscosity. This friction torque significantly impacts the overall system efficiency and power consumption, making it essential for achieving high efficiency and precision. Consequently, accurately understanding and predicting the friction torque is key to optimizing the design and performance of ball bearings.
The frictional moment in ball bearings primarily arises from ball–race and ball–cage contacts. At the ball–race contact, microslip is the main cause of rotational resistance, resulting from either conformity or ball spinning [4,5]. One more phenomenon is observed at the ball–race contact. When motion starts after a load, the resistive moment gradually increases to a steady-state value. Similarly, when the rotation direction reverses, the resistive moment takes time to stabilize, creating hysteresis loops during minor oscillations, which leads to resistance torque due to hysteresis [6,7]. In contrast, the friction torque at the ball–cage contact is mainly due to the sliding of the balls against the cage [8].
Significant research has been conducted to model friction torque in bearings. Jones [9] introduced a quasi-static analytical model based on the raceway control hypothesis (RCH), which incorporates the ball’s gyroscopic moment and centrifugal force. Harris and Mindel [10] later refined this model by incorporating hydrodynamic and elastohydrodynamic lubrication, as well as heat transfer effects. Wang et al. [11] and Popescu et al. [12] developed friction torque models for angular contact ball bearings, focusing on ball–race interactions. More recently, Rivera et al. [13] and Zhao et al. [14] examined the friction torque from both sliding and spinning in ball bearings. Li et al. [15] and Yingjia et al. [16] highlighted the significant role of ball–cage friction. Gupta [17] and Meeks [18,19] created models that explore the dynamic behavior of ball–cage interactions in high-speed bearings, focusing on factors such as traction performance and cage design influence. Houpert’s models [20,21,22] considered centrifugal forces in the ball–race and ball–cage interactions for roller bearings. Although these studies concentrated on high-speed bearings, understanding ball–cage interactions at low speeds is also essential. Jiang et al. [8] and Olaru et al. [23] developed models for low-speed ball bearings, examining how load, speed, and cage design affect overall frictional torque. Most studies [2,3,17,18,19] obtain the friction coefficient either from experiments or empirical relations. However, estimating the coefficient of friction at the contacts is also crucial for the accurate prediction of friction torque in a lubricated bearing. The friction coefficient in lubricated contacts is influenced by several factors, including surface topography, load, speed, lubricant viscosity, and temperature.
Numerous studies have investigated the effect of surface topography and surface textures on friction torque in rolling–sliding contacts. Previous studies have shown that, under lubricated conditions, the interaction between balls and screws is strongly influenced by surface roughness [24]. Surface roughness is key to the formation and stability of the lubricating film, with the lubrication film thickness helping to reduce the direct asperity interactions associated with surface roughness [25]. Deng et al. [26] and Li et al. [27] investigated the influence of surface texture on the lubrication performance of cylindrical roller bearings. Li et al. [28] examined the effects of raceway surface topography with solid lubrication on the temperature rise in hot isostatic pressed silicon nitride (HIPSN) full ceramic ball bearings. Gouda et al. [1] analyzed the impact of inner race micro-texture positioning on the tribodynamic performance of radial ball bearings. Zhang et al. [29] developed a friction torque model for a lubricated ball screw, incorporating surface roughness considerations. Balan et al. [30] investigated the effect of the lubricant film parameter (Λ) on friction torque in thrust ball bearings under mixed IVR (isoviscous rigid) and EHL (elastohydrodynamic) conditions, using ball diameters of 3–6.35 mm, loads of 0.125–0.633 N, and oils with viscosities of 0.08 and 0.05 Pa·s at speeds of 60–210 RPM. The lubricant film parameter (Λ) values ranged from 0.3 to 3.2, mostly indicating mixed lubrication conditions. Shi et al. [31] analyzed the aero ball bearings during start-up and shut-down using TEHL under loads of 85 N and 195 N (Hertz pressures 1977 MPa and 2607 MPa) at 40 °C. As the speed increased from 45 to 450 RPM during start-up, a transition from boundary lubrication to EHL was observed. Cao et al. [32] used a mixed lubrication model to analyze the effect of crowning profiles for a tapered roller bearing subjected to different loads and speeds. Therefore, under low speeds, the contacts in ball bearings predominantly exhibit boundary or mixed lubrication conditions.
The influence of surface roughness on the friction torque in deep groove ball bearings (DGBBs) has been relatively underexplored. This paper introduces an analytical model to calculate the frictional moment from ball–race and ball–cage interactions in a low-speed, lubricated DGBB, using a mixed elastohydrodynamic lubrication (EHL) approach to estimate the friction coefficient at the contacts. This study examines how surface roughness and speed impact ball–race and ball–cage friction torque, and how these factors influence the overall friction torque in a DGBB. Additionally, the effect of surface roughness on various factors contributing to ball–race friction torque is analyzed. Furthermore, the effect of surface roughness on ball–cage contact force is investigated, providing insight into its impact on ball–cage friction torque.

2. Theoretical Model

This section describes the analytical framework for determining friction torque in a lubricated DGBB, as shown in Figure 1. This model is divided into three parts: the first focuses on ball–race interaction, the second on ball–cage interaction, and the third addresses the numerical modeling for calculating the friction coefficient at these contacts. The friction torque from the ball–race interaction ( T b a l l r a c e ) is analyzed statically, while the friction moment from the ball–cage interaction ( T b a l l c a g e ) is analyzed dynamically. A mixed elastohydrodynamic lubrication (EHL) model is employed to predict the coefficient of friction. The total frictional moment ( T t o t a l ) in a DGBB can be expressed as follows:
T t o t a l = T b a l l r a c e + T b a l l c a g e
The following assumptions are made in this paper to simplify the modeling process and exclude less significant factors:
  • The model is designed for open bearings, so the friction moments from seals and dust covers are not considered;
  • The frictional moments from lubricant drag losses, churning, and splashing are ignored;
  • The contact patch at the point of contact is assumed to have a Hertzian elliptical shape and the bodies are assumed to deform elastically at a local level.

2.1. Ball and Race Contact Friction Model

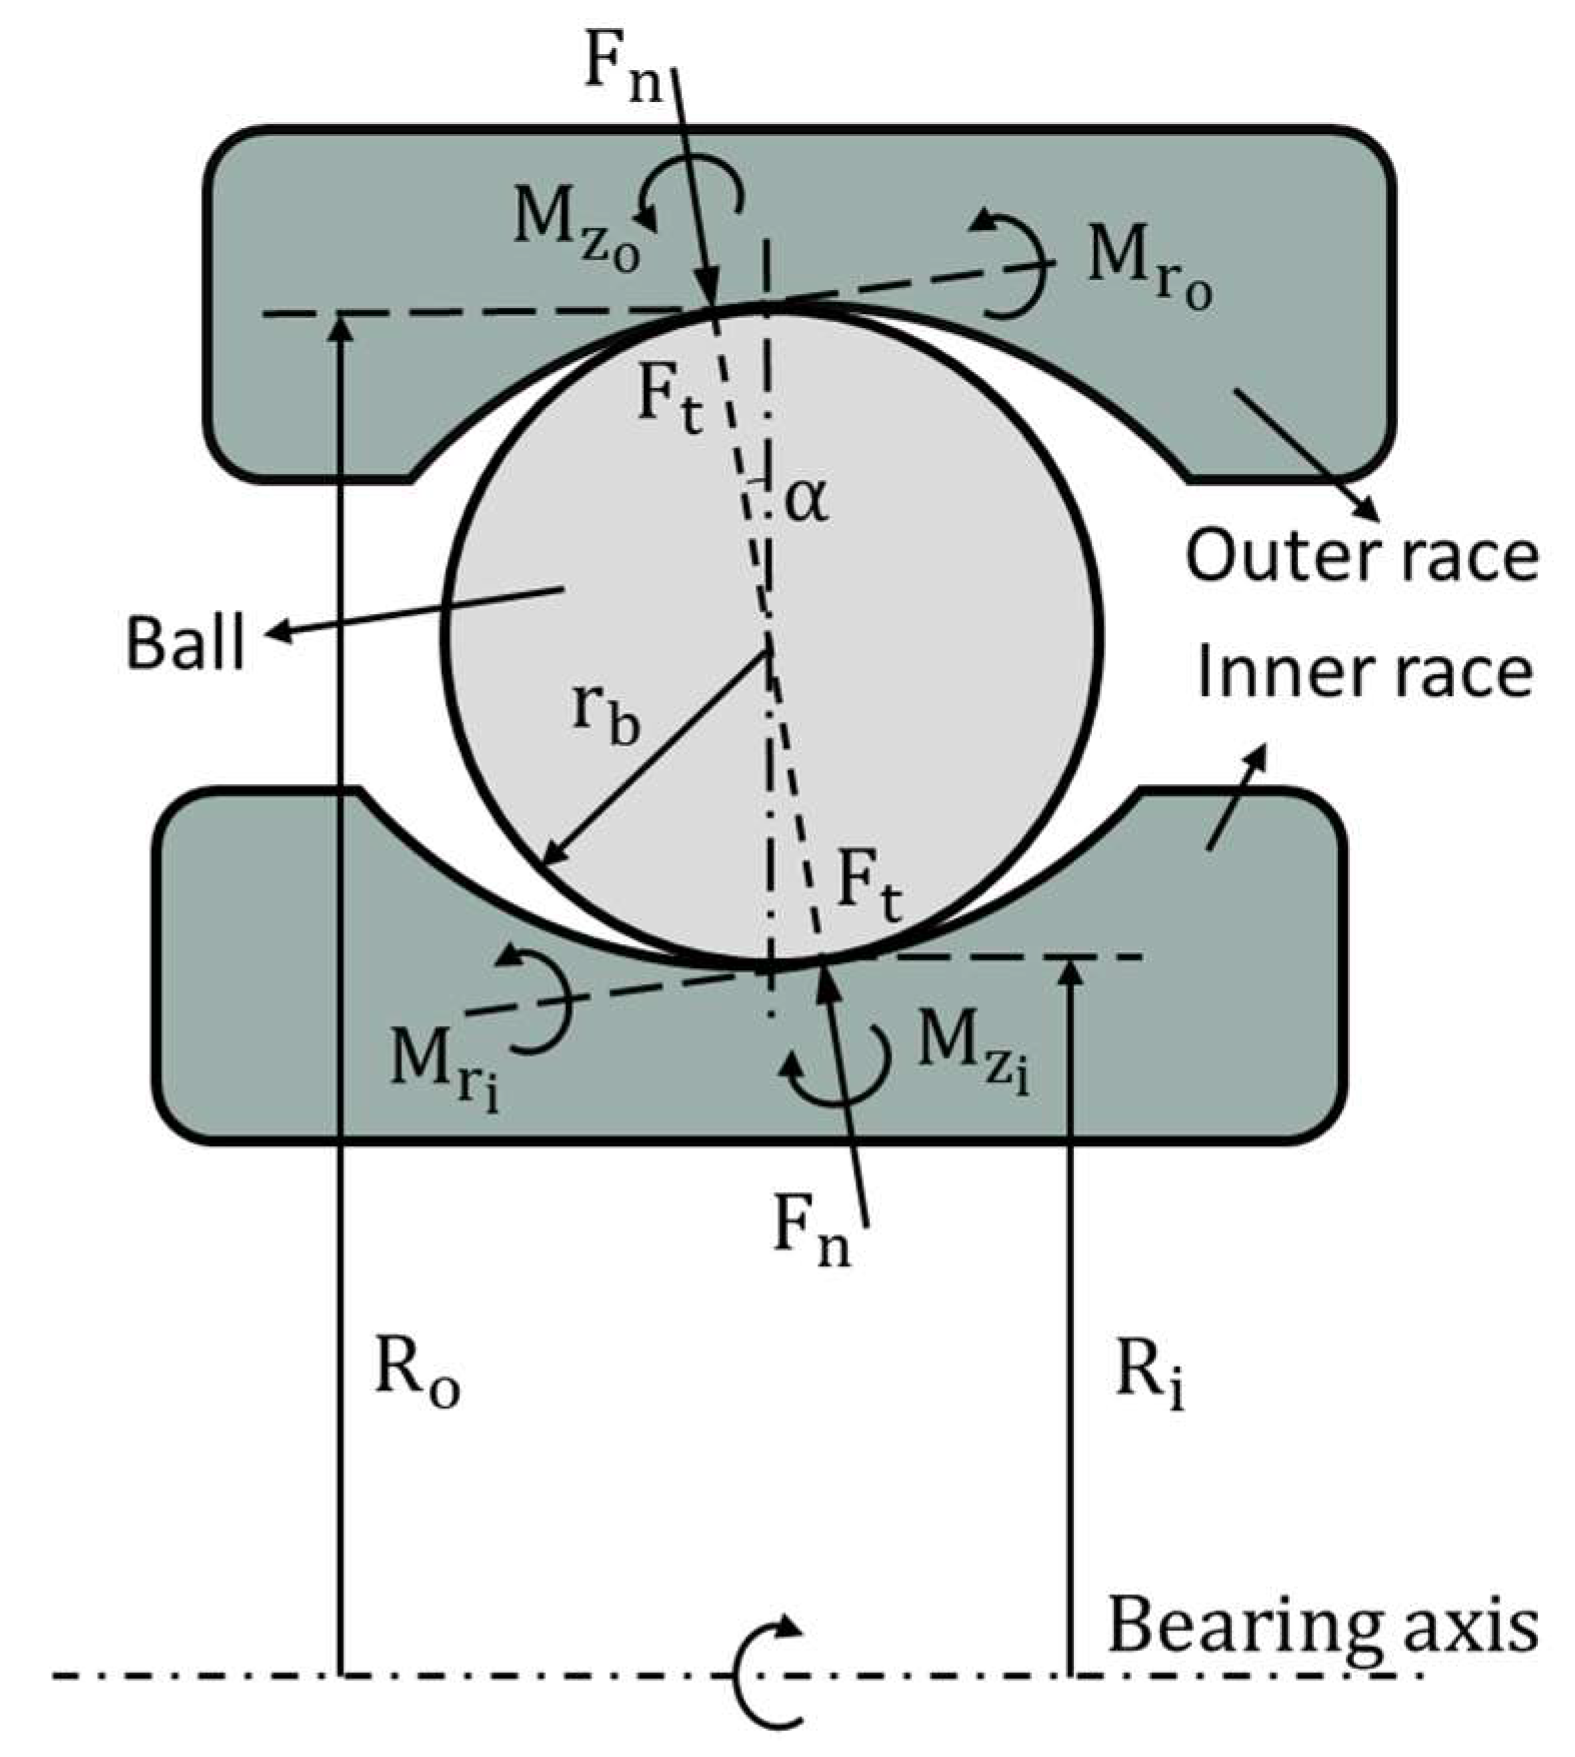
The main source of resistance to motion in DGBBs is the microslip that occurs at the contact points between the balls and races. This microslip occurs in two ways: one is through conformity, referred to as Heathcote slip [5], and the other is due to the spinning motion of the balls relative to the race. Microslip within the contact ellipse produces both the spin moment ( M z ) and the rolling moment from conformity ( M r ), as illustrated in Figure 2. These moments are interdependent, where an increase in one results in a decrease in the other, depending upon the spin-to-roll ratio ( ϵ ) [7].
If ϵ = 0 ,
M z = μ r b F n b 2 4 r b
M r = 0
If 0 < ϵ < 0.5 ,
M z = 3 μ r b F n b 4 γ 1 2 1 γ 1 2 2 γ 2 2 1 γ 2 2 2
M r = μ r b F n b 2 4 r b 2 5 + γ 1 3 1 3 γ 1 2 5 γ 2 3 1 3 γ 2 2 5
If ϵ 0.5 ,
M z = 0
M r = 0.375 μ r b F n b
The friction coefficient at the ball–race contact, μ r b , is estimated using the mixed EHL model, F n is the normal load, and b is the semi-major axis of the contact patch, which is transverse to the rolling direction. The semi-major and semi-minor axes of the elliptical contact patch are determined using formulas derived from Hertzian contact theory (see Ref. [33], pp. 194–195). γ 1 and γ 2 represent the positions of the pure rolling lines (depicted in Figure 3), which can be determined for any given spin-to-roll ratio ( ϵ ) using Equations (8) and (9) [7].
δ 3 3 δ 1 ϵ 2 + 1 = 0
γ 1,2 = ϵ ± δ
Along with the moments from spin and conformity, another phenomenon takes place at the ball–race contact. When a rolling element subjected to compressive force travels along a raceway, the leading edge of the contact surface undergoes compression in the rolling direction, while the material at the rear experiences a reduction in stress. This cyclical stress beneath the rolling tracks results in a rolling friction moment, referred to as a rolling moment due to hysteresis. The equation for estimating this friction moment is provided in Equation (10) (see Ref. [4], p. 285). In Equation (10), α is the hysteresis loss factor, F n is the normal load, and a is the semi-minor axis of the contact patch along the rolling direction.
M h = 3 α F n a 16
Consequently, the friction moment produced is the sum of the rolling moment due to geometry ( T c o n f o r m i t y ), the spin moment generated from pivoting on the contact ellipse ( T s p i n ), and the rolling moment attributed to elastic hysteresis during rolling ( T h y s t e r e s i s ) . To compute the overall friction torque ( T b a l l r a c e ) in a DGBB resulting from the interaction between the ball and the races, Equation (11) is utilized.
T b a l l r a c e = T c o n f o r m i t y + T s p i n + T h y s t e r e s i s
where   T s p i n = Z × M z sin α
T c o n f o r m i t y = Z × M r i R o + M r o R i 2 r b
T h y s t e r e s i s = Z × M h i R o + M h o R i 2 r b
R i = d m 2 r b cos α
R o = d m 2 + r b cos α

2.2. Ball and Cage Contact Friction Model

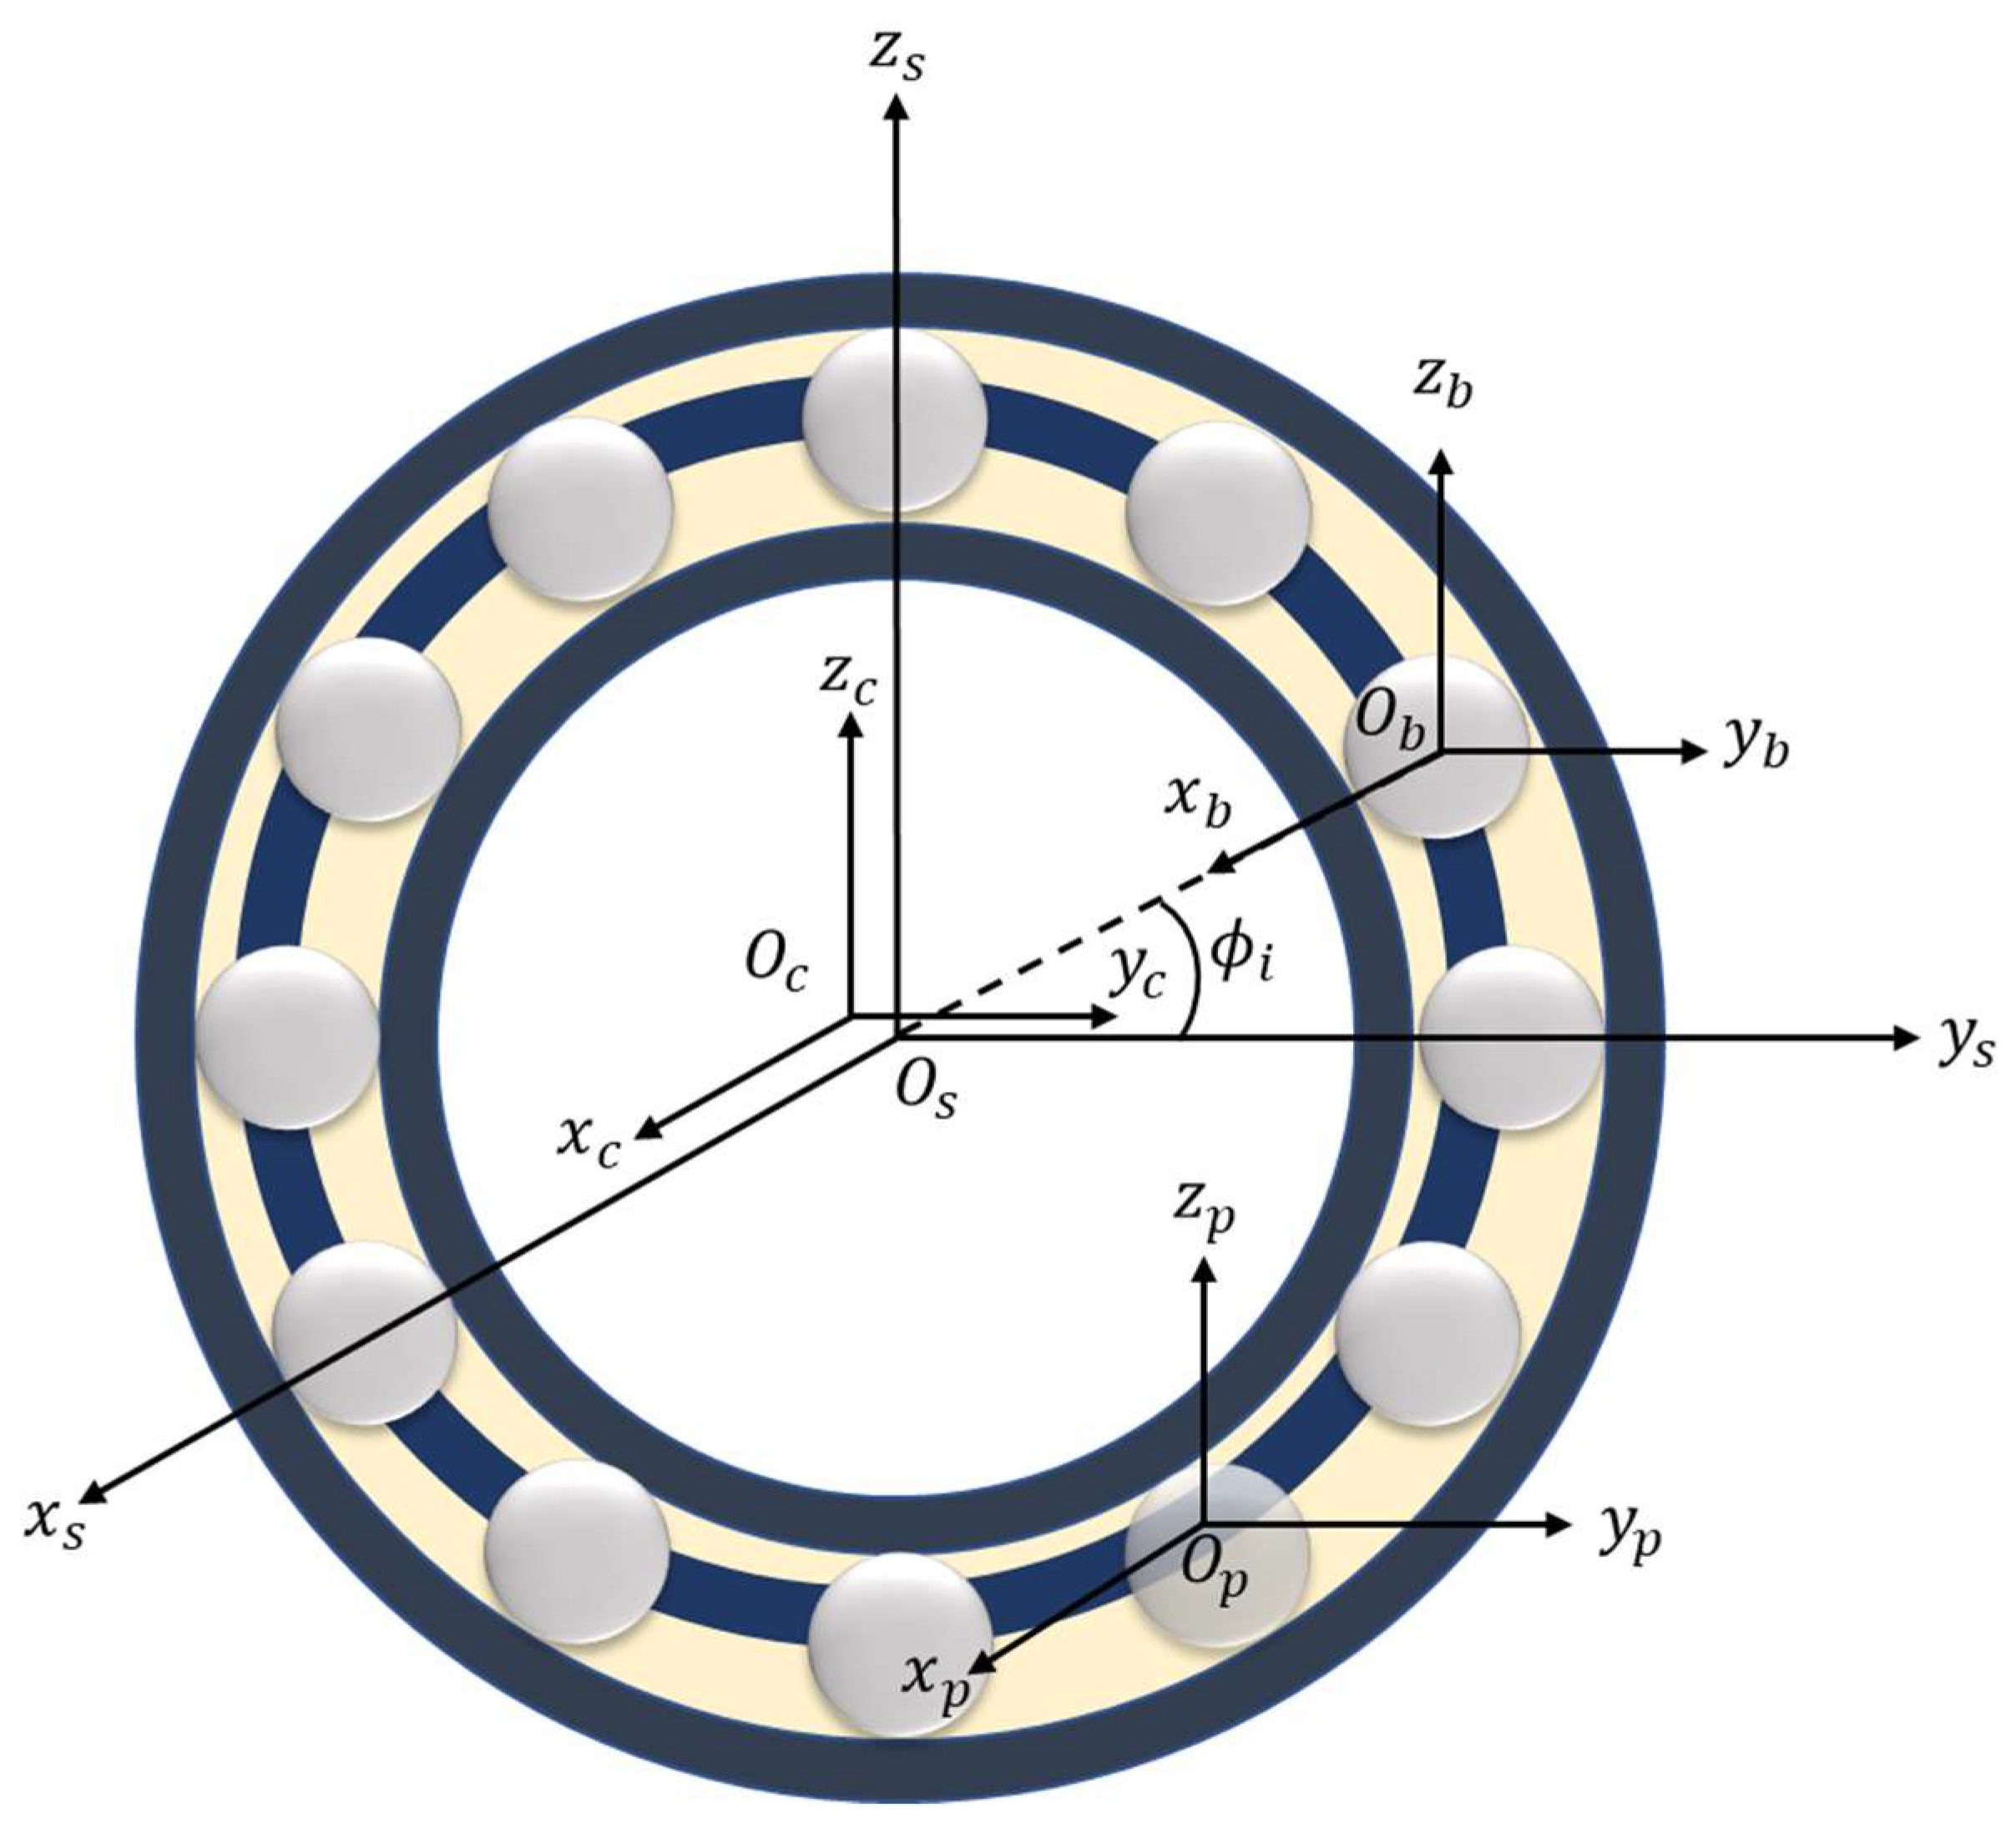
The friction torque model for ball and cage contact is derived from the work of Jiang et al. [8]. It incorporates four reference frames: the stationary frame attached to the bearing axis (frame s ), the cage frame (frame c ), the ball frame (frame b ), and the pocket frame (frame p ), as depicted in Figure 4. The superscripts s , c , b , and p indicate these frames, with positive rotation defined in the counterclockwise direction.
The angular velocities of the cage and rolling element assembly ( ω b c ), as well as the ball spinning angular velocity ( ω b r ), are defined in Equations (17) and (18) (refer to Ref. [33], p. 311). ω i and ω o are the angular velocities of the inner race and outer race about the bearing axis.
ω b c = 1 2 ω i 1 ξ + ω o 1 + ξ
ω b r = d m 2 D b 1 ξ 2 ω o ω i
where
ξ = D b cos α d m
The position of the i t h ball center relative to the bearing axis ( x s ) in the s -frame can be described as follows:
r b s s = 0 d m 2 cos ϕ i + ω b c t d m 2 sin ϕ i + ω b c t
where ϕ i represents the angular position of the i t h ball relative to the bearing axis.
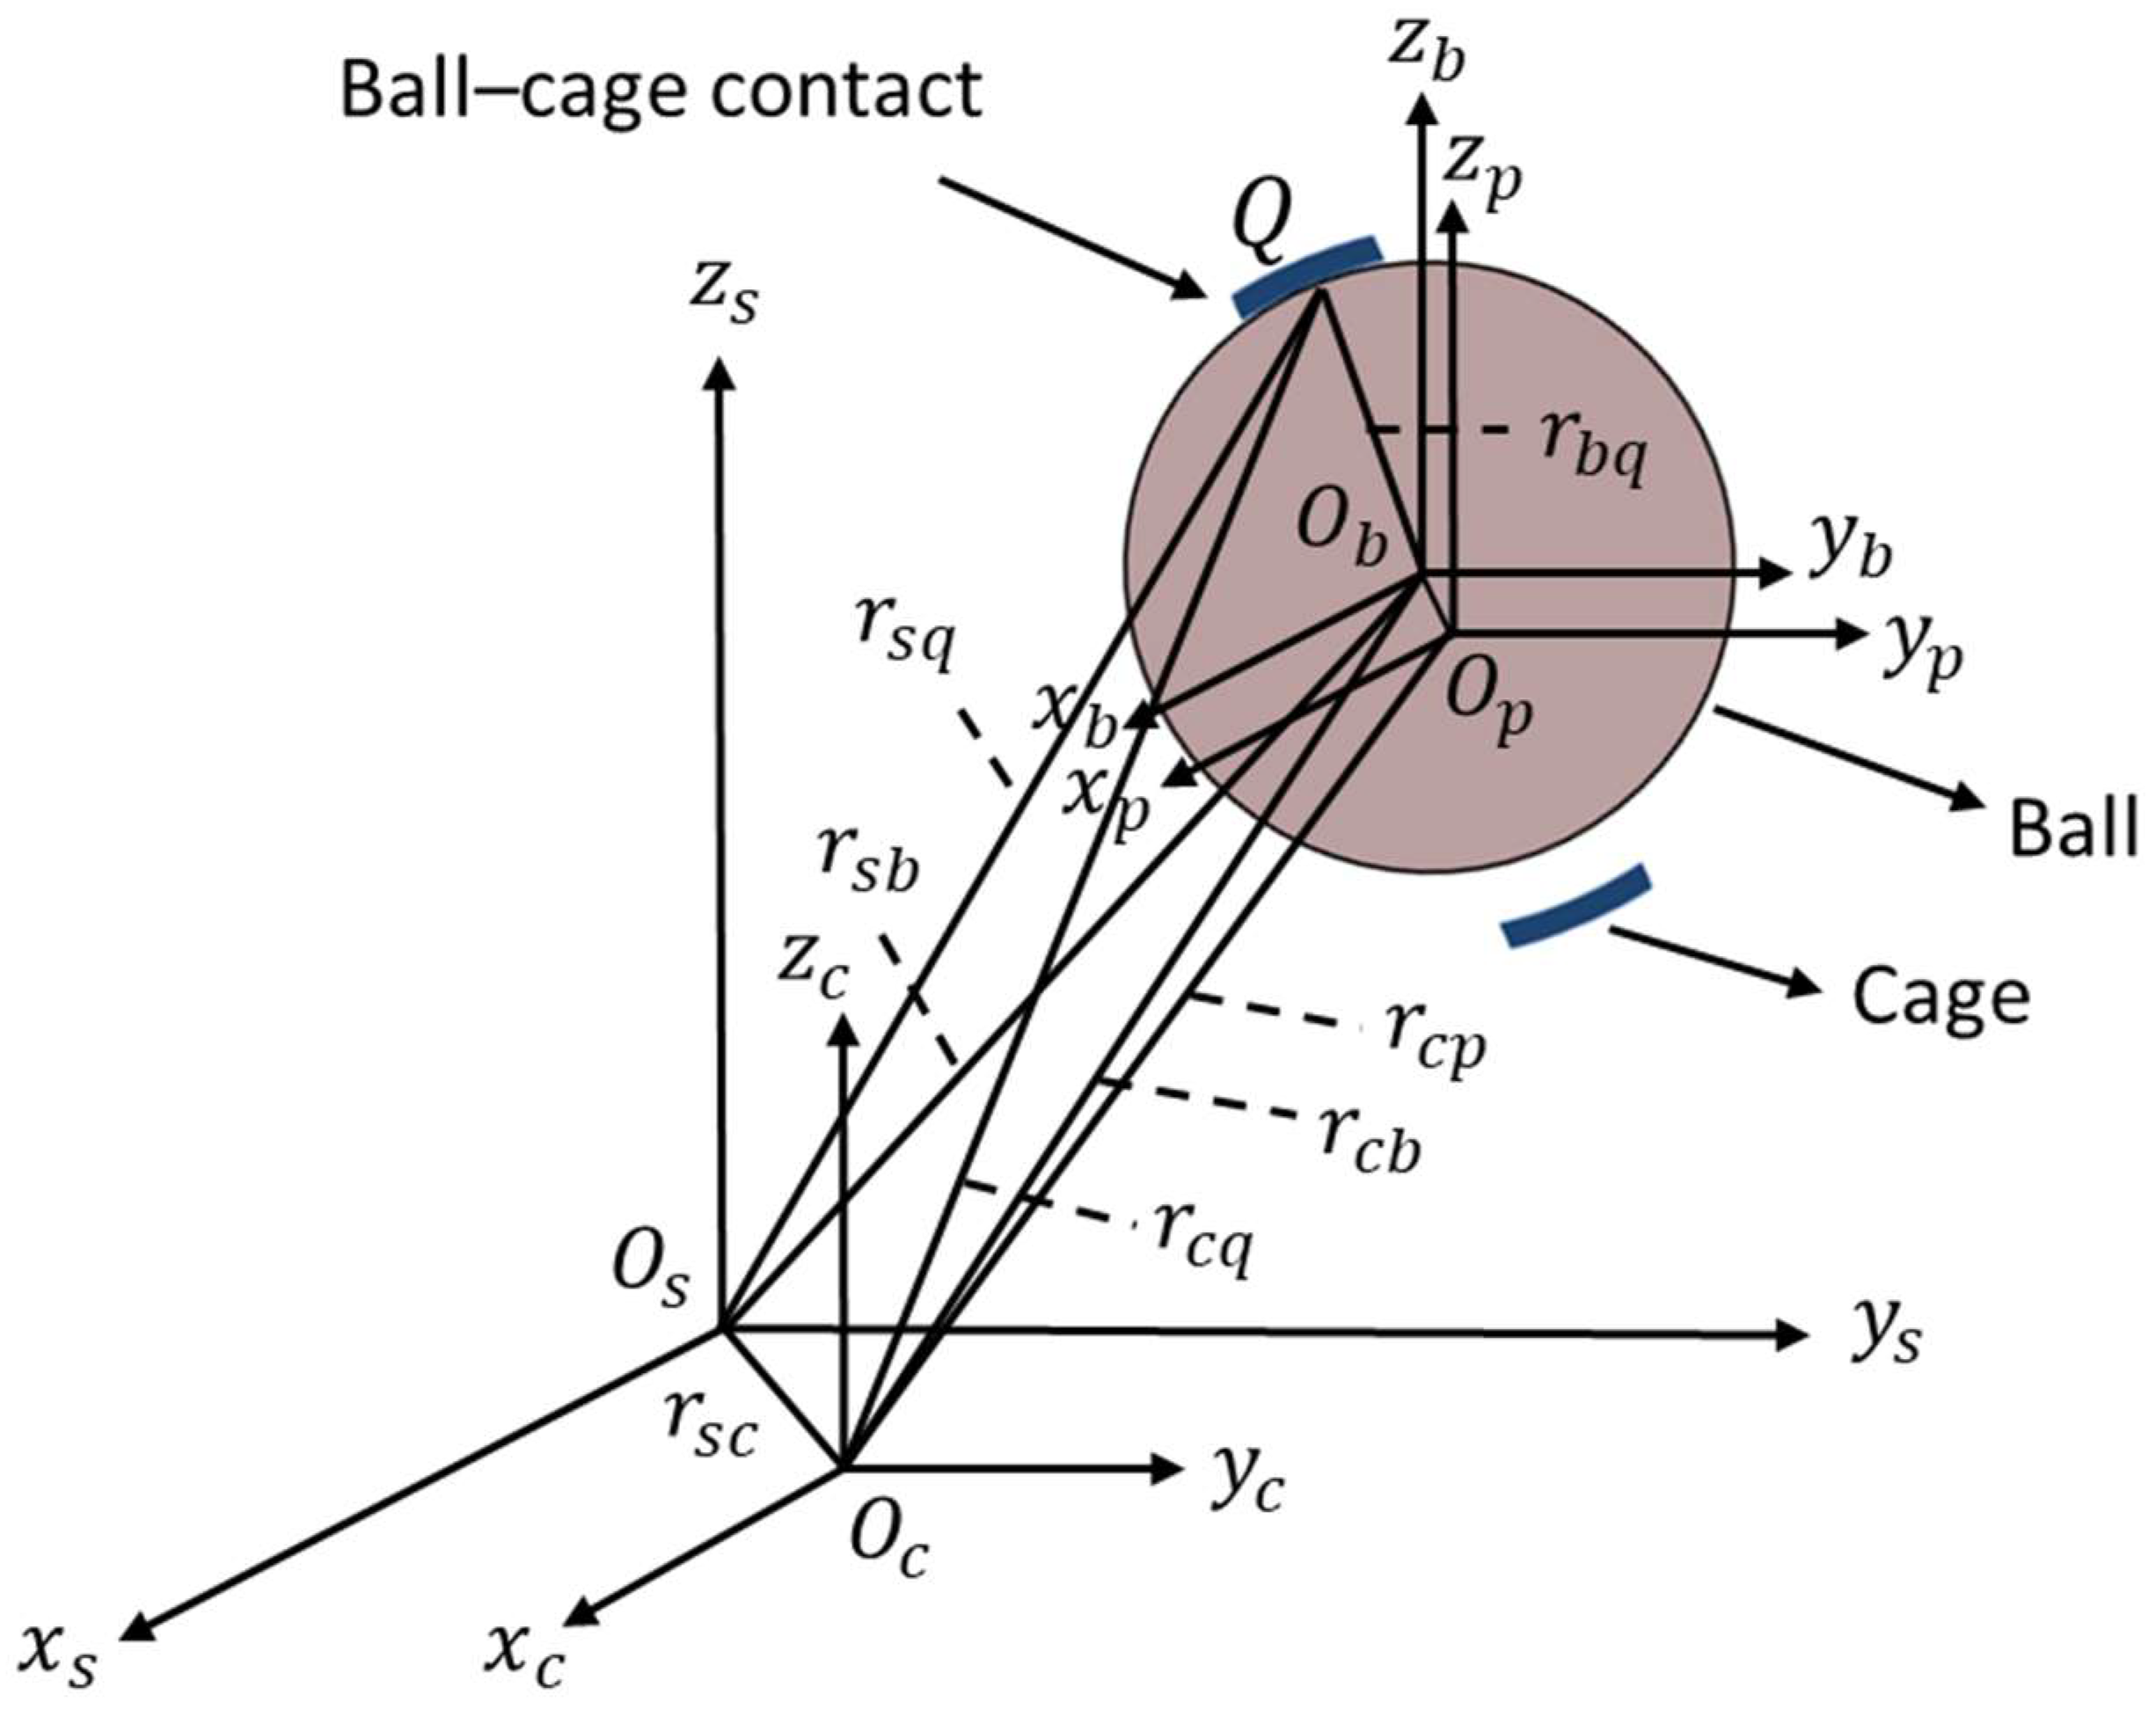
Figure 5 visually depicts the various vectors in the model. In this figure, Q represents the contact point between the ball and the cage, while O b and O p are the centers of the ball and the pocket, respectively. The offset r s c c between the centers O s and O c in frame c is connected to frame s through the equation r s c c = T s c r s c s , where T s c is the transformation matrix that transforms the vectors from frame s to frame c . This matrix is derived by rotating the x s , y s , and z s by the angles θ x , θ y , and θ z , respectively.
T s c = cos θ y cos θ z sin θ x sin θ y cos θ z cos θ x sin θ z cos θ x sin θ y cos θ z + sin θ x sin θ z cos θ y sin θ z sin θ x sin θ y sin θ z + cos θ x cos θ z cos θ x sin θ y sin θ z sin θ x cos θ z sin θ y sin θ x cos θ y cos θ x cos θ y
At the ball–cage interface, three contact types can occur: single-point contact, double-point contact, and no contact, as shown in Figure 6. Single-point contact occurs when ε and x 0 ; double-point contact occurs when ε and x = 0 ; and when ε < , there is no contact between the ball and the cage.
ε = x + D p 2 k 2 + y 2 + z 2
and   = D p 2 D b 2
In a single-point contact, the ball and cage (or pocket) make contact at just one point. The parameter k represents half the width of the pocket, and O p denotes the center of curvature of the pocket. The position vectors for these contact points are determined using Equations (21)–(24).
R o p b p = x i ^ + y j ^ + z k ^
R o p o p p = D p 2 k x ^
R o p b p = R o p b p + D b 2 R ^ o p b p
R b q = D b 2 R ^ o p b p
Similarly, in double-point contact, the ball and cage (pocket) make contact at two points. The position vectors are calculated using Equations (25)–(33). Subscript 1 corresponds to the first contact point, while Subscript 2 refers to the second contact point.
R o p b p = x i ^ + y j ^ + z k ^
R o p o p 1 p = D p 2 k x ^
R o p 1 b p = R o p b p R o p o p 1 p
R o p 1 b p = R o p b p + D b 2 R ^ o p 1 b p
R b q 1 = D b 2 R ^ o p 1 b p
R o p o p 2 p = D p 2 k x ^
R o p 2 b p = R o p b p R o p o p 2 p
R o p 2 b p = R o p b p + D b 2 R ^ o p 2 b p
R b q 2 = D b 2 R ^ o p 2 b p
Equation (34) is used to calculate the angular velocity of the cage.
ω s c c = ω s c c x ω s c c y ω s c c z T = A θ ˙ x θ ˙ y θ ˙ z T
where A = cos θ y cos θ z sin θ z 0 cos θ y sin θ z cos θ z 0 sin θ y 0 1 .
The linear velocities of the ball and cage at point Q in frame p , represented by v b p are v c p , are defined in Equations (35) and (36). The relative linear velocity between the cage and the ball, v c b p , is also expressed in Equation (37).
v b p = T c p i T s c ω b c s × r s q s + ω b p × r b q p
v c p = T c p i r ˙ s c c + T c p i ω s c c × r c q p
v c b p = v c p v b p
where T c p i = 1 0 0 0 cos ϕ i sin ϕ i 0 sin ϕ i cos ϕ i , ω b p = ω b r cos α 0 ω b r sin α T and ω b c s = ω b c 0 0 T .
Once R o p b p is determined, the unit vector normal to the ball and cage ( N p b p ) can be obtained. The tangential relative linear velocity of the cage with respect to the ball in frame p can then be calculated using Equation (38).
v c b T p = v c b p v c b p · N p b p N p b p
where   N p b p = R o p b p R o p b p
Under the assumption of the Hertzian contact for both the ball–race and ball–cage contacts, the magnitude of the normal contact force ( F p b N p ) between the ball and cage is calculated from the contact deformation ( δ p b ) using Equation (39). The normal contact force vector is expressed in Equation (40).
F p b N p = K p b δ p b 3 2
F p b N p = F p b N p N p b p
where δ p b = ε and K p b is Hertzian contact stiffness.
F p b T p is the tangential contact force at the ball–cage contact in frame p , calculated by Equation (41).
F p b T p = μ c b F p b N p v c b T p v c b T p
Here, μ c b represents the friction coefficient at the ball–cage interface, which is estimated using a mixed elastohydrodynamic lubrication (EHL) model.
Now, the resultant ball–cage contact force in frame p is the vector sum of normal and tangential contact force vector, as expressed by Equation (42).
F p b p = F p b N p + F p b T p
Finally, the total force vector ( F c ) and moment vector ( M c ) in frame c are determined by summing the resultant force and moment vectors for each ball–cage contact, as defined by Equations (43) and (44).
F c = i = 1 z T p c i F p b p
M c = i = 1 z T p c i r c q p × F p b p
where T p c i = T c p i 1 .
Once the total force and moment vectors in frame c are calculated, the accelerations can be obtained using Euler’s law. The moments of inertia about the x c , y c , and z c axes are represented as I x , I y , and I z , respectively.
F c = F x c i ^ + F y c j ^ + F z c k ^
F x c m c = d v s c x c d t + ω s c y c v s c z c ω s c z c v s c y c
F y c m c = d v s c y c d t + ω s c z c v s c x c ω s c x c v s c z c
F z c m c = d v s c z c d t + ω s c x c v s c y c ω s c y c v s c x c
M c = M x c i ^ + M y c j ^ + M z c k ^
M x c = I x d ω s c x c d t + I z I y ω s c y c ω s c z c
M y c = I y d ω s c y c d t + I x I z ω s c x c ω s c z c
M z c = I z d ω s c z c d t + I y I x ω s c x c ω s c y c
The equations of motion for the cage, describing both angular and linear velocity, are as follows:
θ ˙ x θ ˙ y θ ˙ z T = A 1 ω s c c x ω s c c y ω s c c z T
v s c c = v s c c x v s c c y v s c c z T = r ˙ s c c = r ˙ s c c x r ˙ s c c y r ˙ s c c z T
Applying the 4th-order Runge–Kutta method for numerical integration to Equations (46)–(48) and Equations (50)–(52) facilitates the determination of the next set of vectors.
v s c c = v s c c x v s c c y v s c c z T , ω s c c = ω s c c x ω s c c y ω s c c z T   r s c c = r s c c x r s c c y r s c c z T , and θ = θ x θ y θ z T .
Finally, the ball–cage friction torque ( T b a l l c a g e ) is obtained by taking the norm of the moment vector ( M c ), as expressed in Equation (55).
T b a l l c a g e = M c = M x c 2 + M y c 2 + M z c 2
After calculating the ball–race friction torque ( T b a l l r a c e ) and the ball–cage friction torque ( T b a l l c a g e ), their combined value provides the total friction torque ( T t o t a l ) in the DGBBs.

2.3. Mixed Elastohydrodynamic Lubrication Model

Several studies have previously modeled the mixed EHL regimes in concentrated contacts [34,35,36,37]. These works utilized the load-sharing concept initially proposed by Johnson et al. [38]. Using this model, the friction coefficient can be estimated for the boundary, mixed elastohydrodynamic, as well as the elastohydrodynamic lubrication regimes. In mixed EHL, the total load ( F T ) is shared between the asperities ( F a ) and the lubricant film ( F h ). According to the load-sharing concept in the mixed EHL regime, a portion of the total load ( F T ) is supported by the contacting asperities ( F T / γ 1 ), and the remaining load is supported by the lubricant film ( F T / γ 2 ), as expressed in Equations (56)–(58), where γ 1 and γ 2 are the scaling factors.
F T = F a + F h
F T = F T γ 1 + F T γ 2
1 = 1 γ 1 + 1 γ 2
The frictional force ( F f ) that arises at the contacting surfaces results from the shearing of both the asperities and the lubricant film. The shear force at the asperities ( F f , a ) is calculated by summing the shear forces of the individual asperities, with the Greenwood and Williamson model [39] used to determine the normal load on each asperity. The ball–race and ball–cage contact produces an elliptical contact patch under the application of the load. Therefore, the film thickness equation derived by Nijenbanning et al. [40] for elliptical contacts is used to determine the lubricant film thickness. The Eyring shear stress is then applied to compute the shear stress, which is multiplied by the hydrodynamic area to calculate the shear force within the film ( F f , h ). Finally, Equation (60) is used to determine the friction coefficient.
F f = F f , a + F f , h
μ = F f F T

2.3.1. Asperity Contact Model

The interaction between two uneven surfaces can be modeled similarly to the interaction between a rough surface and a smooth one [39], as shown in Figure 7. The summit identification (SID) method [41] is employed to determine the surface topography parameters, including the summit density, the summit radius of curvature, the standard deviation of summit height, and the number of asperities in contact. The contact interference of the i t h asperity is expressed by Equation (61), where z ( i ) represents the asperity height above the mean asperity plane, and d is the difference between the film separation ( h s ) and the gap between the mean plane of the equivalent rough surface and the mean asperity plane ( h s s ). h s s is determined through statistical analysis and h s is obtained from Equation (66) using the lubrication model.
ω ( i ) = z ( i ) d
The critical interference criterion outlined in [42] defines three deformation zones: elastic, elastoplastic, and fully plastic. For each asperity, the contact area and load are determined using the corresponding formula, depending on the specific deformation zone (see Appendix A). The total actual contact area and load from the asperity interactions are then obtained by summing the contributions of all the individual asperities, where N p is the total number of asperities in contact obtained using the SID method.
A a = i N p A ( i ) ,   F a = i N p F ( i )
Finally, after estimating the total load carried by asperity, the total frictional force can be calculated using Equation (63).
F f , a = f c F a

2.3.2. Lubrication Model

Nijenbanning et al. [40] developed a film thickness equation for the elliptical point contact, used to determine the central film thickness, as expressed in Equation (64). The key benefit of this equation is its applicability across all load conditions, as it accounts for asymptotic behavior (i.e., curvature ratio (D) ranging from D→0 to D→∞).
H c = H R I 3 2 + H E I 4 + H 00 4 3 8 2 s 3 + H R P 8 + H E P 8 S 8 1 / s
where   s = 1.5 1 + exp 1.2 H E I H R I ,   H 00 = 1.8 D 1 ,   D = R x / R y
H R I = 145 ( 1 + 0.769 D 14 / 15 ) 15 / 7 D 1 M 2
H E I = 3.18 ( 1 + 0.006 ln D + 0.63 D 4 / 7 ) 14 / 25 D 1 / 15 M 2 / 15
H R P = 1.29 ( 1 + 0.691 D ) 2 / 3 L 2 / 3
H E P = 1.48 ( 1 + 0.006 ln D + 0.63 D 4 / 7 ) 7 / 20 D 1 / 24 M 1 / 12 L 3 / 4
M = F T E R x 2 η 0 u s E R x 3 / 4 ,   L = β E η 0 u s E R x 1 / 4
To obtain the dimensional central film thickness from the dimensionless one, Equation (65) is used.
H c = h c R x / a 2
After calculating the dimensional central film thickness, the relation between the central film thickness and film separation by Johnson et al. [38] is used to calculate h s . Here σ is the standard deviation or RMS roughness of the equivalent rough surface, which is equal to σ 1 2 + σ 2 2 .
h c = h s + σ h s σ t h s σ e t 2 2 d t
Equation (67) describes the relationship between shear stress and the shear strain rate, where τ 0 denotes the Eyring shear stress, γ ˙ represents the shear strain rate (calculated as sliding velocity divided by film thickness), and η stands for dynamic viscosity [37].
τ h = τ 0 sinh 1 η γ ˙ τ 0
Following the calculation of the Eyring shear stress, the dynamic viscosity is obtained using the Roelands [43] formula. In this formula, η 0 represents the viscosity at the ambient pressure and temperature, while p h , e f f refers to the effective hydrodynamic pressure, determined by Equation (68).
η = η 0 exp ln η 0 + 9.67 1 + 1 + p h , e f f 1.962 × 10 8 z
p h , e f f = F T γ 2 1 / 2 A n o m
Now, the frictional force generated by the shearing of the lubricant film can be calculated using Equation (70).
F f , h = τ h A h
where   A h = A n o m A a
After determining the shear force due to the asperities in contact ( F f , a ) using Equation (63) and the shear force due to lubricant film ( F f , h ), the total frictional force ( F f ) is calculated using Equation (59). Finally, the coefficient of the friction is obtained using Equation (60).

3. Methodology

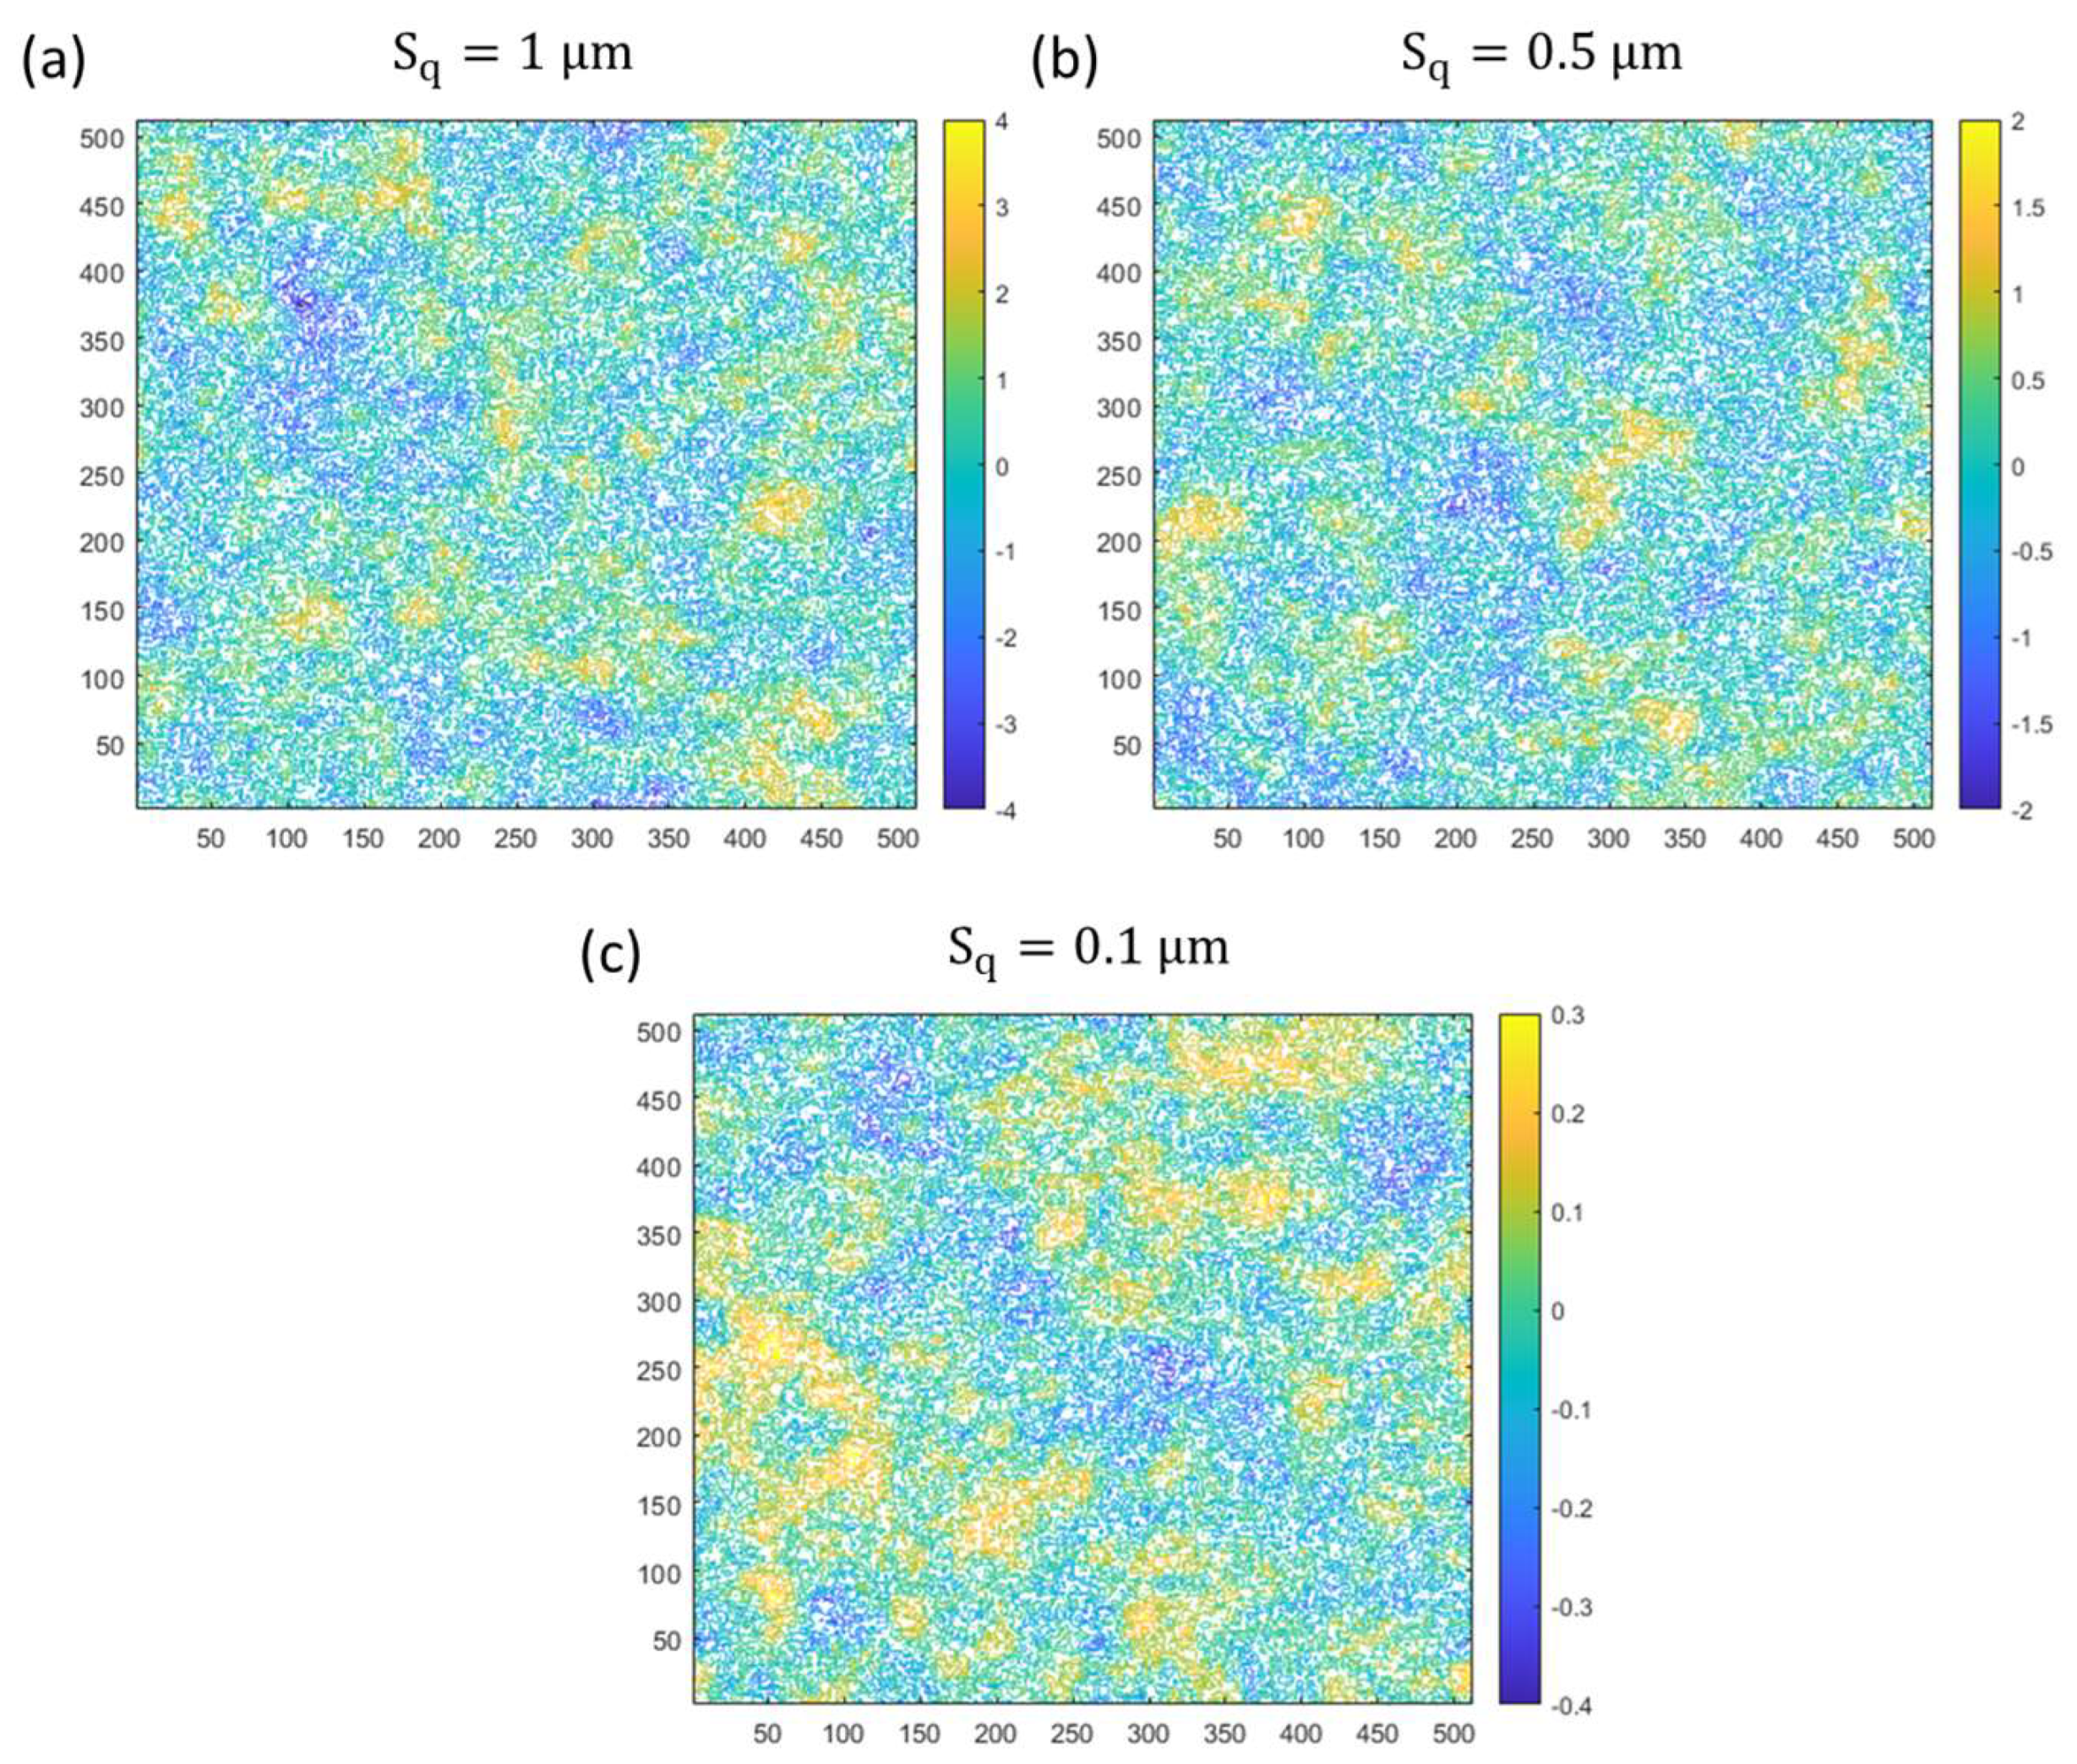
For this analysis, a 6205 ball bearing manufactured by NBC was used. The design parameters for the 6205 ball bearing are provided in Table 1. The friction torque was analyzed through simulations under an axial load of 1000 N, with the speed of the inner race varying from 100 RPM to 500 RPM in increments of 100 RPM, while the outer race remained fixed. Three levels of surface roughness are considered in this study. Gaussian distribution was used for generating rough surfaces, with an autocorrelation length of 10 μm. The numerically generated rough surfaces had RMS roughness values of Sq = 1 μm, Sq = 0.5 μm, and Sq = 0.1 μm, with a grid size of 512 × 512. Figure 8 shows the surface map of the generated rough surfaces. The surface topography for various contacts, along with normal contact forces and speeds, served as an input to the mixed EHL model to predict the friction coefficient at the ball–race and ball–cage contacts. These estimated friction coefficients are used in Equations (2)–(7), (41) for the calculation of friction torque. The input parameters and lubricant properties used in this model are given in Table 2 and Table 3, respectively.
The developed model incorporates the static modeling of the ball–race friction torque and the dynamic modeling of the ball–cage friction torque, resulting in a time-varying friction torque. To analyze the effect of the surface roughness parameter Sq and speed on the friction torque, it was effective to compare the mean values of the time-varying friction torque predicted by the model. Simulations were conducted over a duration of 2 s. Figure 9 presents the time-varying friction torque data obtained through simulation for a rough surface with a surface roughness of Sq = 1 µm, under an axial load of 1000 N and a speed of 100 RPM. The mean value of the time-varying friction torque was calculated, yielding a value of 17.87 N for the specified conditions. Similarly, the mean friction torque was determined for each set of operating parameters.

4. Results and Discussion

In this section, the friction torque of the 6205 ball bearing was estimated, with an analysis of how the surface roughness and speed influenced it. The impact of surface roughness and speed on the estimated friction coefficient was also examined. Additionally, the influence of surface roughness on the various factors contributing to ball–race friction torque was evaluated. Moreover, the effect of the surface roughness on the ball–cage contact force was investigated, offering insights into its role in ball–cage friction torque.

4.1. Effect of Surface Roughness on the Total Friction Torque

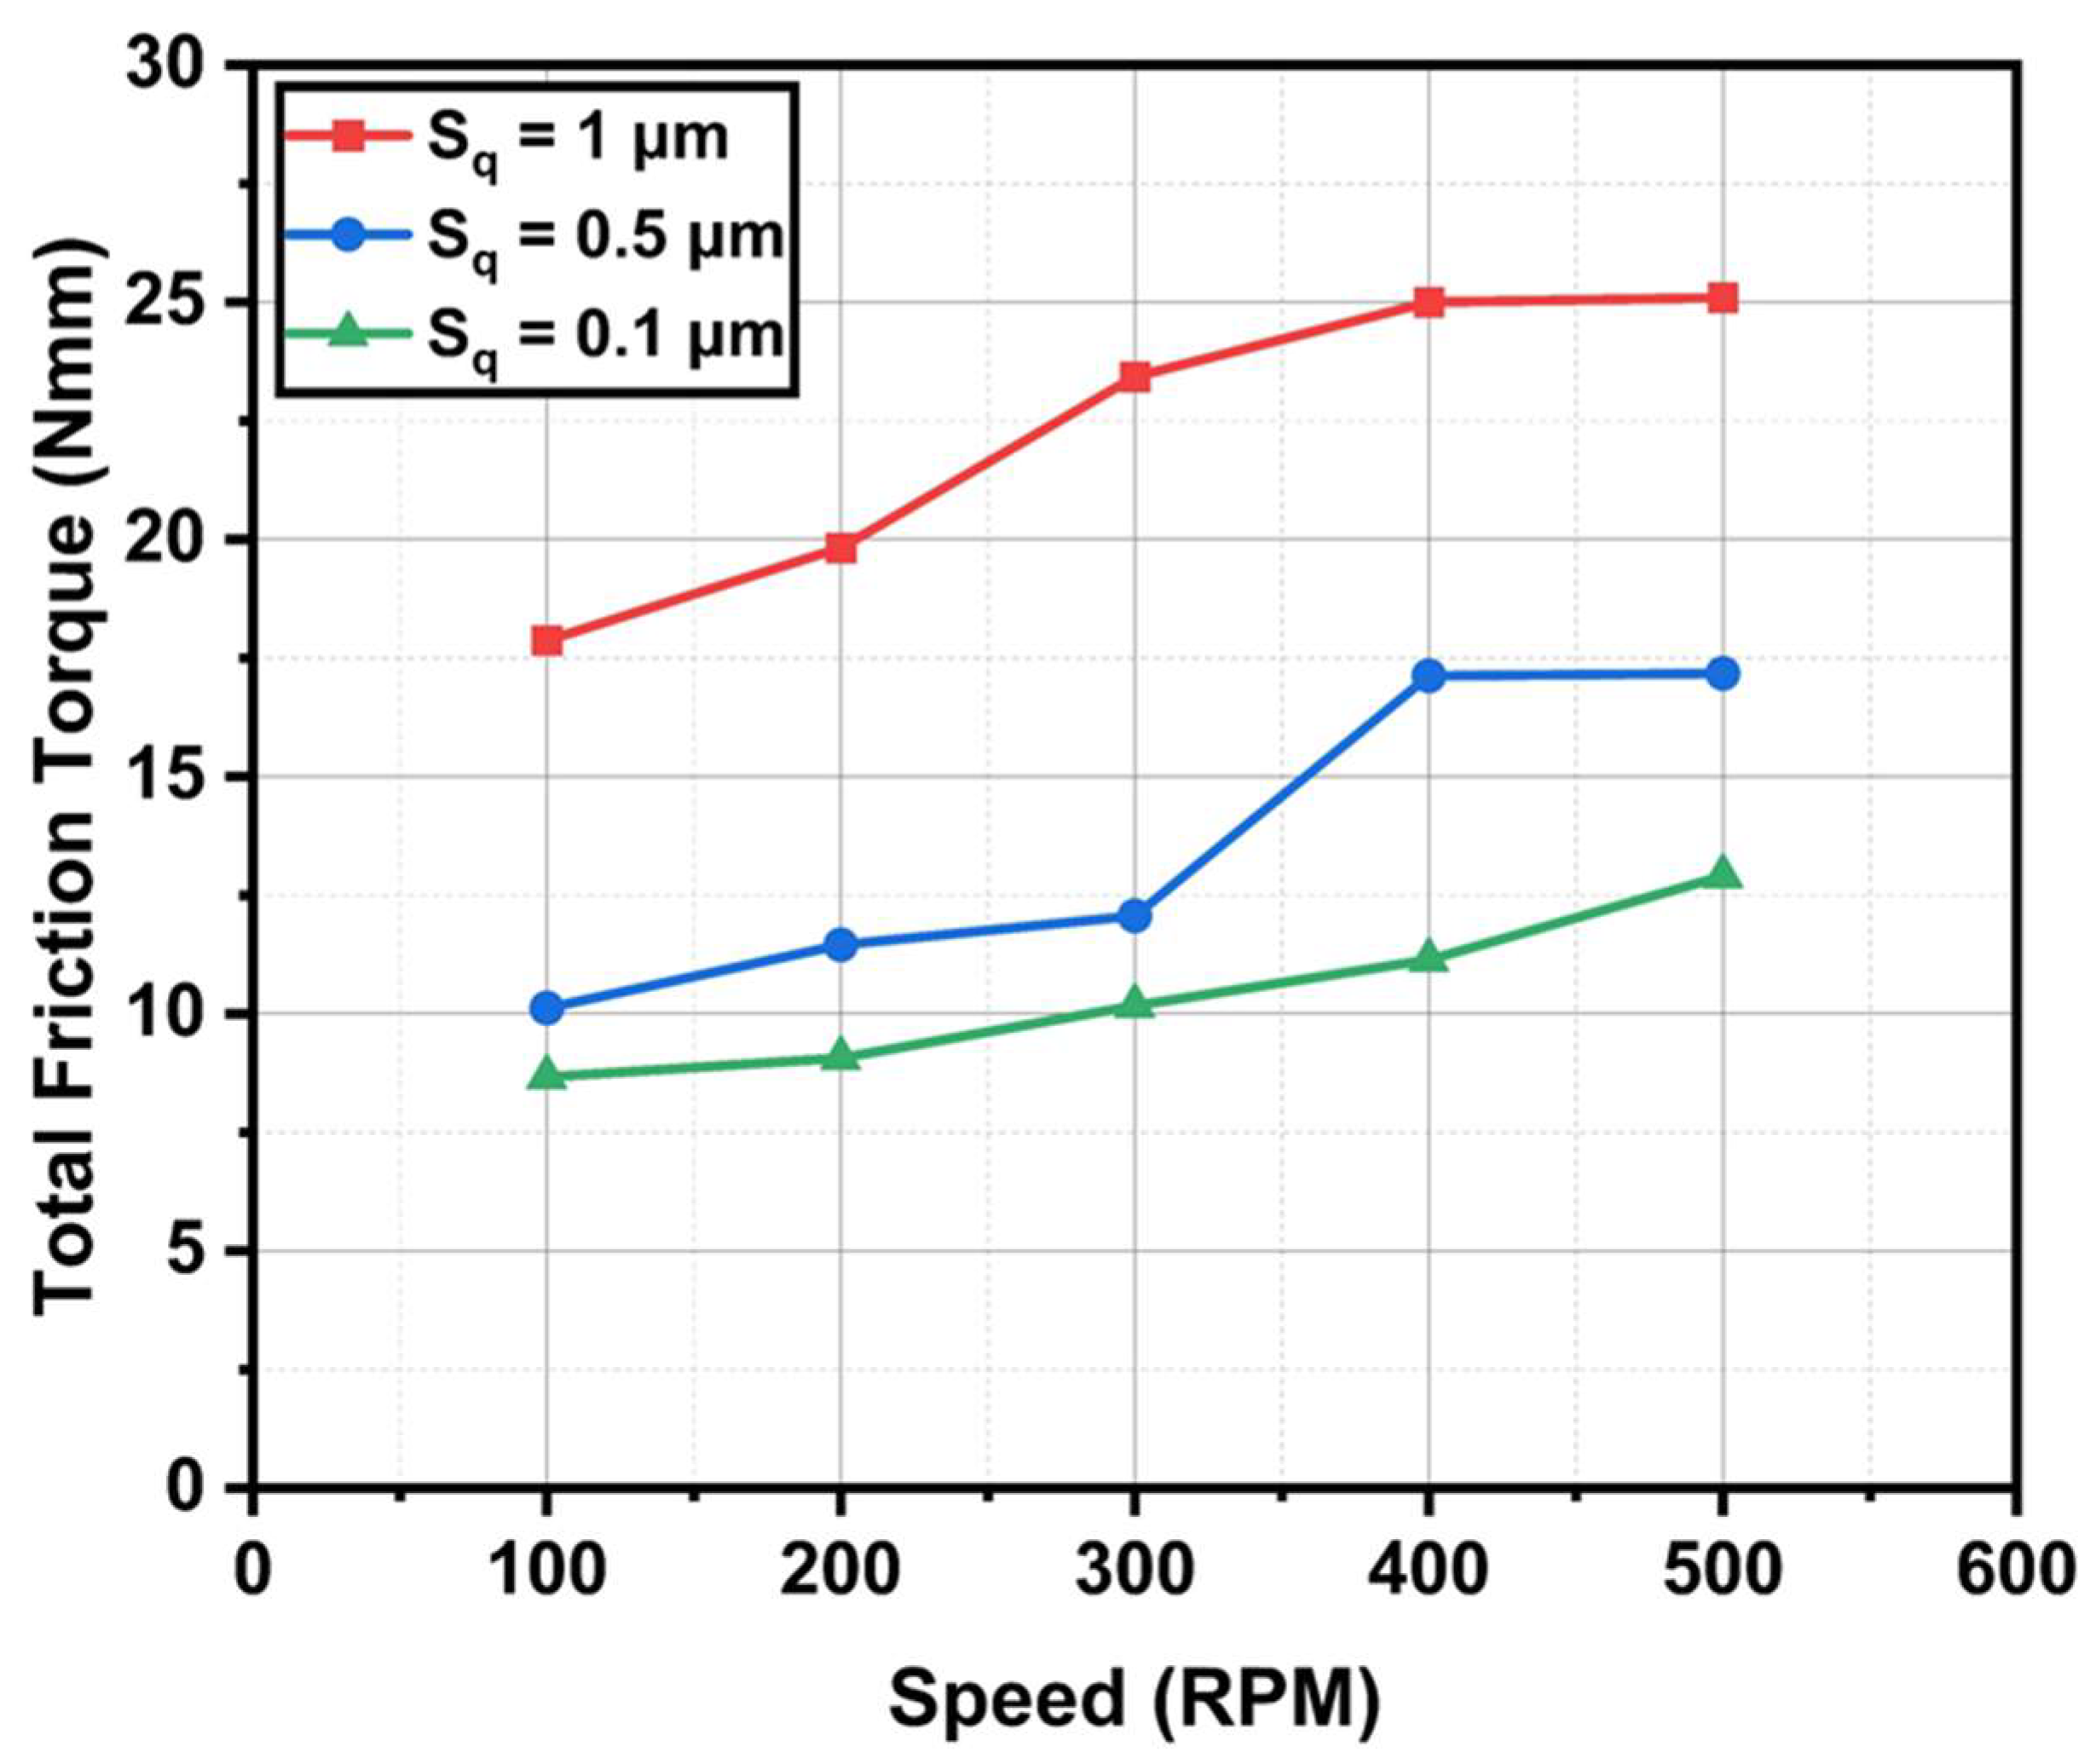
Figure 10 presents the relationship between the total friction torque and rotational speed for a 6205 deep groove ball bearing under varying the surface roughness of Sq = 1 μm, Sq = 0.5 μm, and Sq = 0.1 μm. As indicated by the red, blue, and green lines, respectively, higher surface roughness correlates with increased friction torque. The roughest surface (Sq = 1 μm) produces the highest torque values, while the smoothest surface (Sq = 0.1 μm) produces the lowest torque values across the entire speed range.
Additionally, Figure 10 shows that the friction torque increased with the speed for all the roughness levels. For Sq = 1 μm, the torque increased steadily from approximately 20 N·mm at 100 RPM to almost 30 N·mm at 500 RPM. For Sq = 0.5 μm, the torque also rose consistently with the speed, reaching around 20 N·mm at 500 RPM. In the case of Sq = 0.1 μm, although the increase was less pronounced, the torque still rose from around 8 N·mm to 15 N·mm as the speed increased.
It was observed that higher surface roughness resulted in a greater total friction torque, and the torque consistently increased with speed. This behavior suggests that both the surface roughness and speed are critical factors influencing frictional behavior in DGBBs.

4.2. Effect of Surface Roughness and Speed on Friction Coefficient at Ball–Race and Ball–Cage Contacts

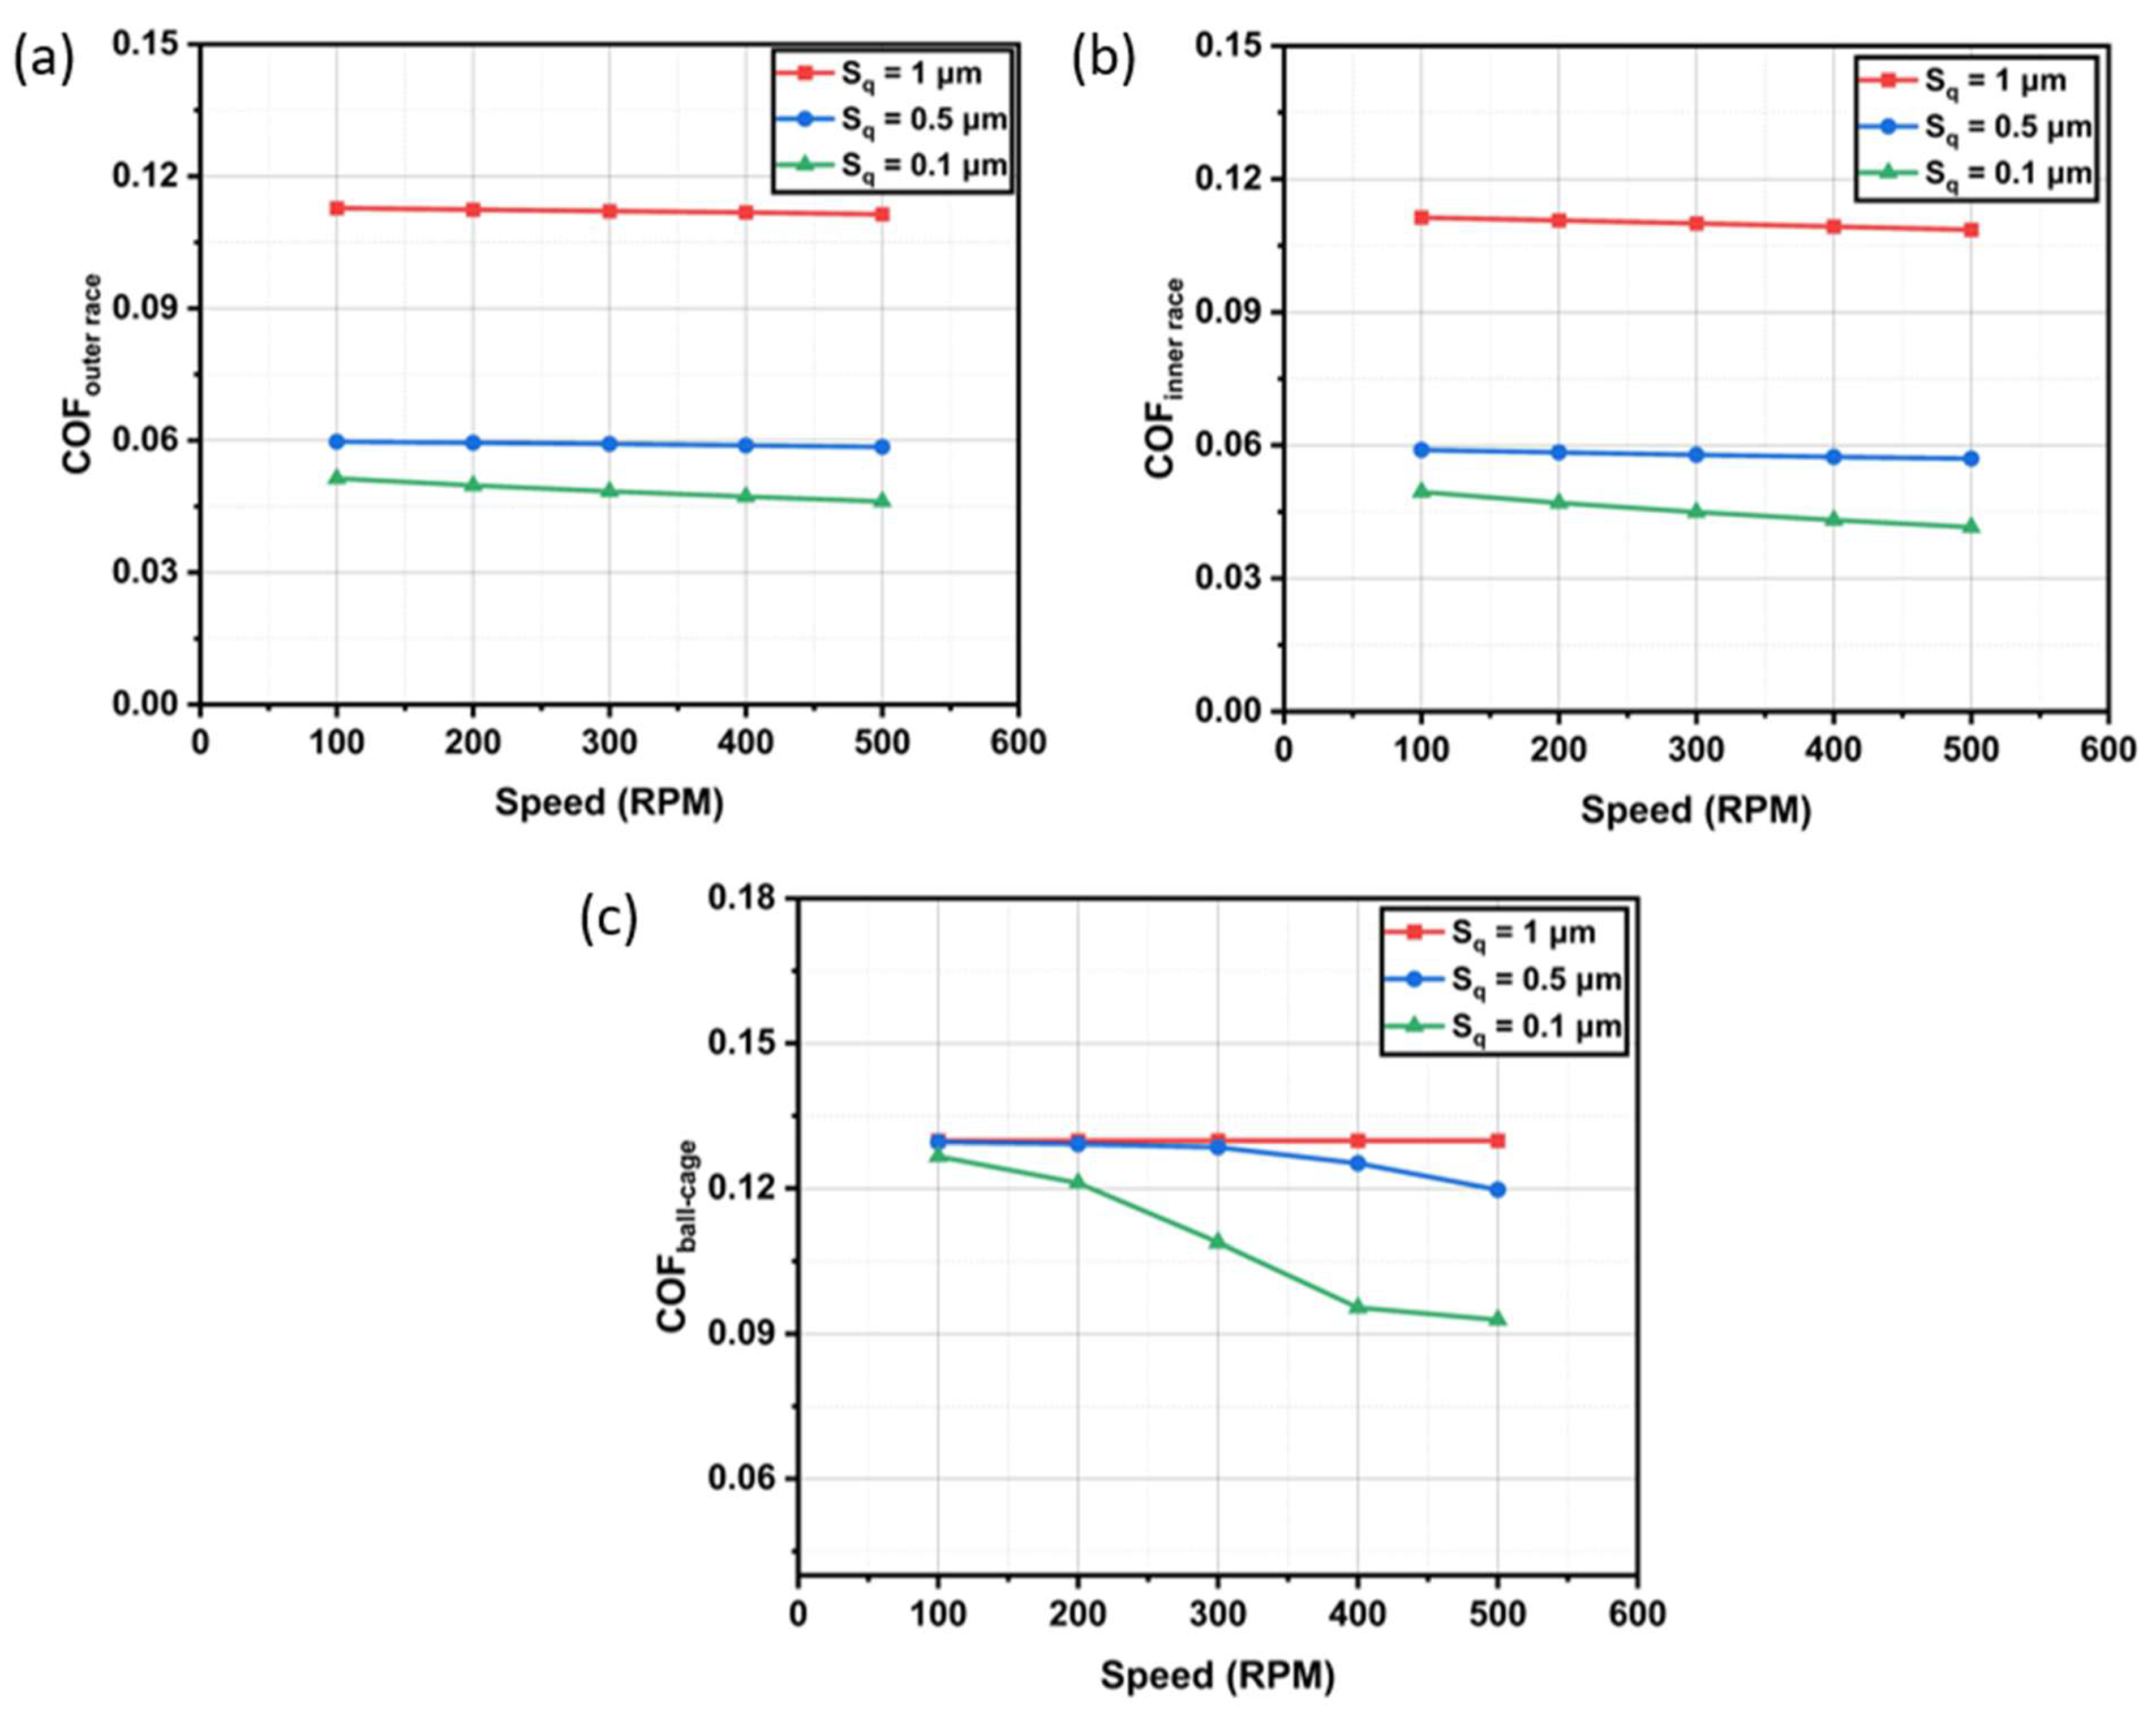
The impact of surface roughness on the coefficient of friction (COF) across different contact points within a DGBB at varying speeds is studied in this subsection. In Figure 11a, the COF between the ball and the outer race is shown to decrease as the surface roughness decreases, with the highest COF observed for the roughness of Sq = 1 μm and the lowest for Sq = 0.1 μm. Speed had little influence on the COF in this contact. Similarly, Figure 11b shows the COF between the ball and the inner race, where lower surface roughness results in a reduced COF, but speed again has minimal effect on the COF across all the roughness levels. In contrast, Figure 11c displays the COF between the ball and the cage, where the impact of the surface roughness and speed is more pronounced. At lower speeds, the COF is higher for the rougher surfaces, but as the speed increases, the COF decreases significantly for the smoother surfaces (Sq = 0.5 μm and Sq = 0.1 μm). This decrease is most pronounced for Sq = 0.1 μm, indicating that higher speeds can effectively reduce the COF for the smoother surfaces in ball–cage contacts. Overall, it was observed that smoother surfaces generally result in lower COF values, particularly at higher speeds, with the exception of ball–outer race and ball–inner race contacts, where speed has a minimal effect on the COF.
To understand the lubrication regime, the lubricant film parameter (Λ) was determined for each operating condition. It was observed that Λ increased with the velocity for both the ball and the inner race contact as well as the ball and the outer race contact. For a roughness of Sq = 0.1 μm, Λ increased from 0.12 to 0.38 for the ball and the inner race contact, and from 0.08 to 0.24 for the ball and the outer race contact, as the speed increased from 100 to 500 RPM. In contrast, for the ball and cage contact, Λ decreased from 0.53 to 0.14 due to the increase in the ball–cage contact force.
Additionally, it was observed that in the ball and raceway contacts, the film parameter improved with the smoother surfaces, leading to a decrease in the friction coefficient for the same load and speed. For instance, for the ball and inner race contact at 100 RPM, Λ was 0.02 for Sq = 1 μm and increased to 0.12 for Sq = 0.1 μm. After calculating Λ for the operating conditions considered in this study, it was found that the contacts were predominantly under the boundary lubrication regime, as the lubricant film parameter varied from 0.016 to 0.98.

4.3. Effect of Surface Roughness and Speed on Friction Torque at Ball–Race and Ball–Cage Contacts

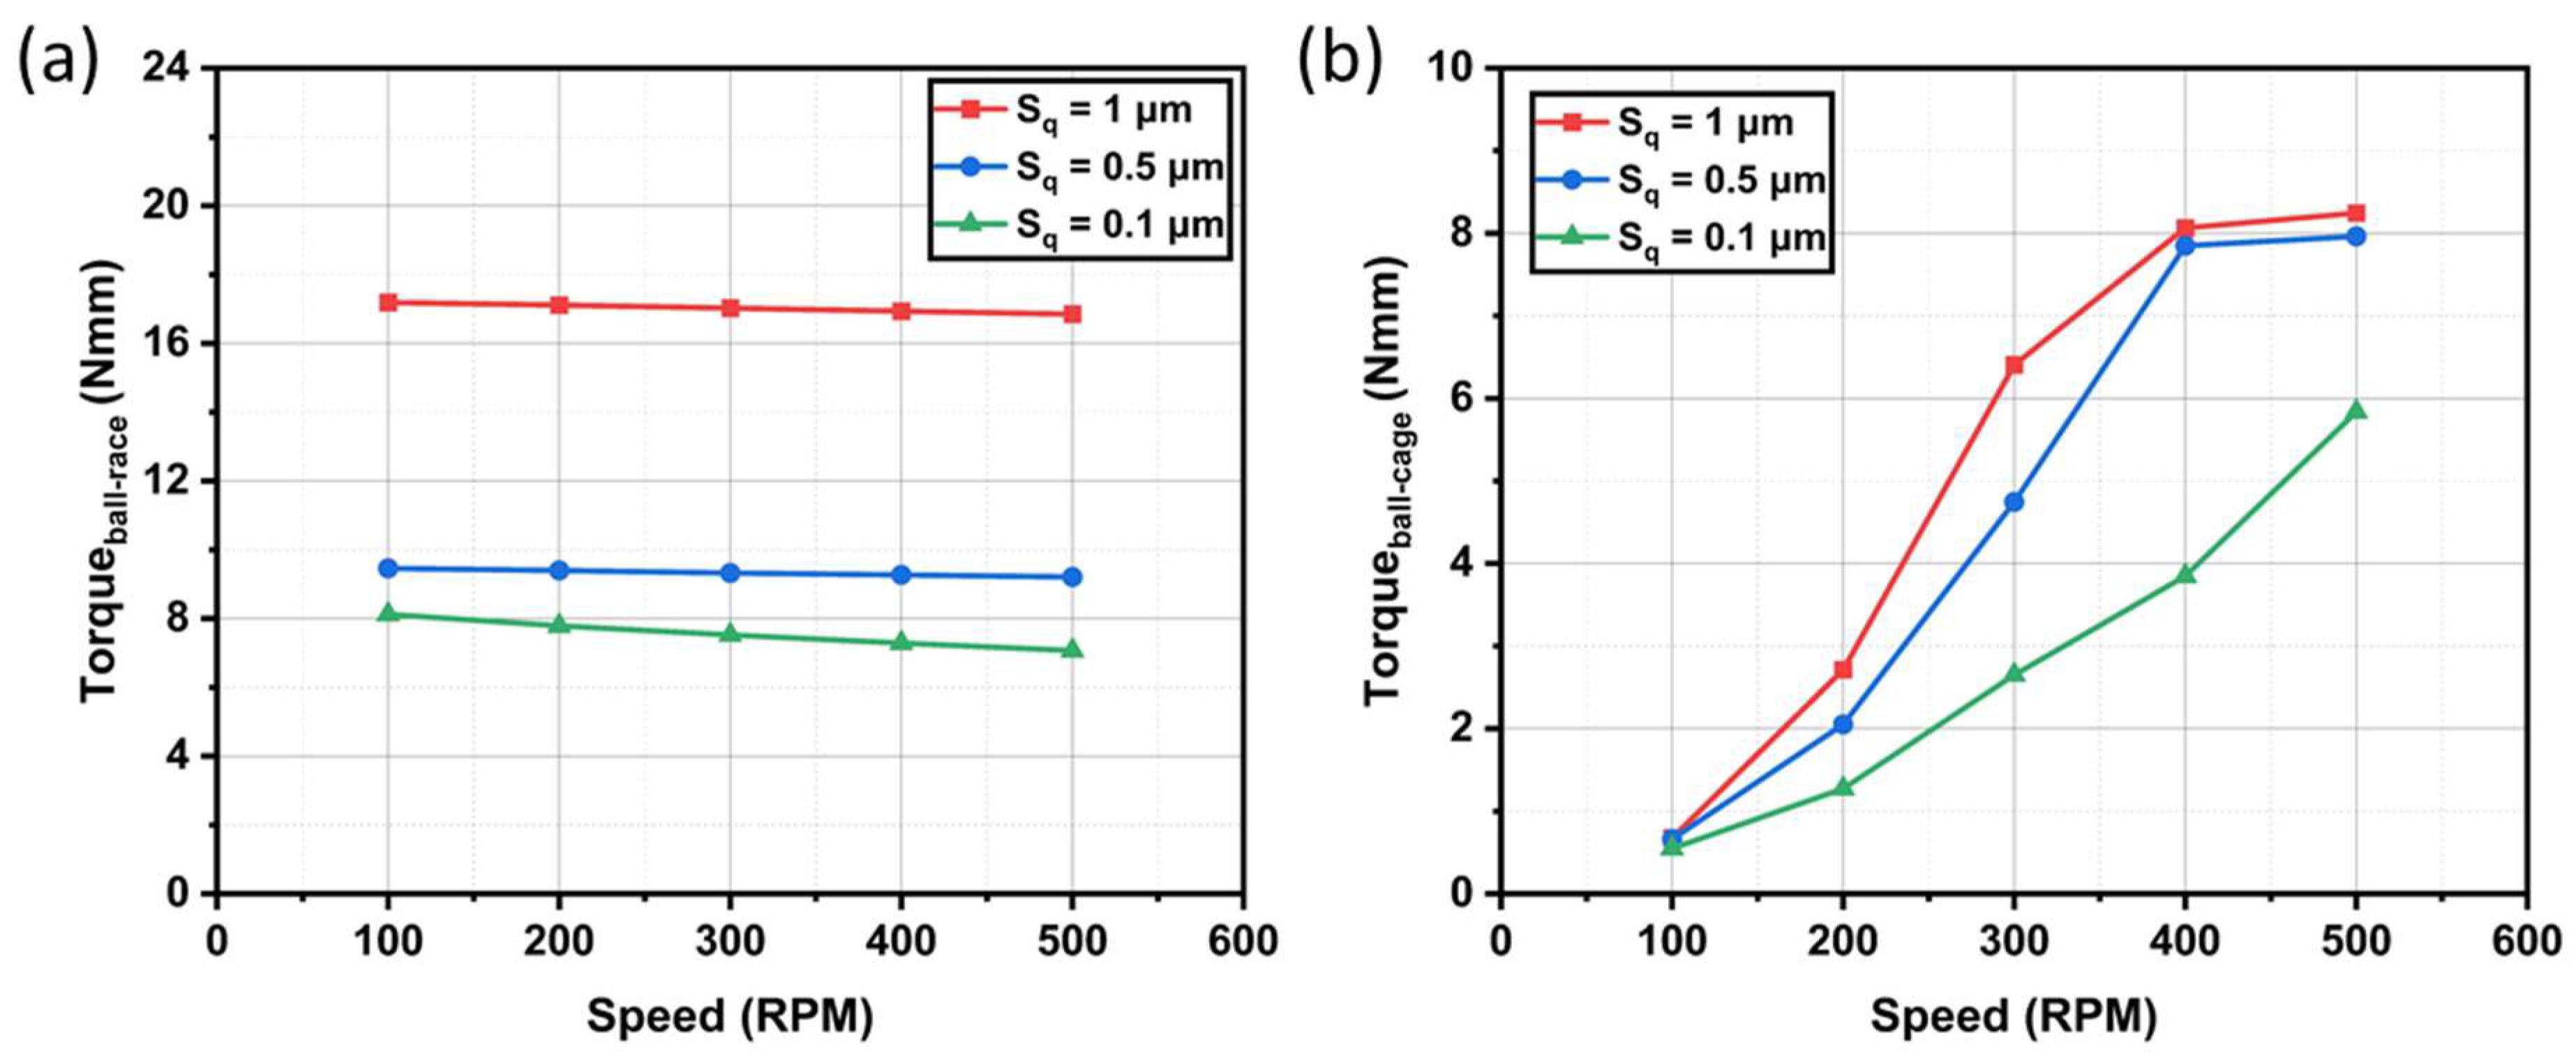
The effect of the surface roughness and rotational speed on the friction torque within a DGBB, focusing on the separate contributions from the ball–race and ball–cage contacts, was analyzed, as shown in Figure 12.
(a)
Ball–Race Friction Torque ( T b a l l r a c e ):
  • At Sq = 1 μm, the torque remained almost constant at around 17 N·mm across all the speeds from 100 RPM to 500 RPM;
  • For Sq = 0.5 μm, the torque was lower, starting at around 9.5 N·mm at 100 RPM and remaining constant at approximately the same value as the speed increased to 500 RPM;
  • At Sq = 0.1 μm, the lowest roughness, the torque started at about 8 N·mm and slowly decreased over the speed range to 7 N·mm;
  • The torque values remained relatively constant across the speed range for each roughness level.
The decrease in the ball–race friction torque was due to the decrease in the coefficient of the friction at the contact, as explained in the previous subsection. Thus, for the ball–race contact, the friction torque decreased as the surface roughness decreased. The reduction was substantial when moving from Sq = 1 μm to Sq = 0.1 μm, where the torque was more than 50% lower at the same speed.
(b)
Ball–Cage Friction Torque ( T b a l l c a g e ):
  • At Sq = 1 μm, the torque started at around 0.6 N·mm at 100 RPM but rapidly increased to approximately 8.2 N·mm at 500 RPM;
  • For Sq = 0.5 μm, the initial torque at 100 RPM was close to 0.6 N·mm, but it increased more slowly compared to the rougher surface, reaching around 8 N·mm at 500 RPM;
  • At Sq = 0.1 μm, the torque at 100 RPM was about 0.5 N·mm and increased to 6 N·mm at 500 RPM;
  • The rougher surfaces produced higher torque values at all the speeds.
Unlike the ball–race contact, the friction torque for the ball–cage contact increased significantly with speed for all the roughness levels. The rougher surface (Sq = 1 μm) exhibited the highest torque at higher speeds, showing a rise of about 7.6 N·mm from 100 RPM to 500 RPM. In contrast, the smoother surface (Sq = 0.1 μm) showed a slower increase, with a rise of only 5.5 N·mm over the same speed range. It is important to note that in this case, while the friction coefficient decreased with the increasing speed and decreasing surface roughness, the friction torque increased due to the rise in ball–cage contact force, as the torque is directly proportional to the force.
This confirms that higher surface roughness leads to increased friction torque for both contact types. Moreover, while the torque at the ball–race contact decreased slightly with the speed for a given roughness, the torque at the ball–cage contact rose, resulting in an overall increase in the total friction torque as the speed and roughness increased. This emphasizes the critical role of both contact points and their respective reactions to speed and roughness in determining the overall frictional torque behavior in the DGBB.

4.4. Effect of Surface Roughness on Different Factors Contributing to the Ball–Race Friction Torque

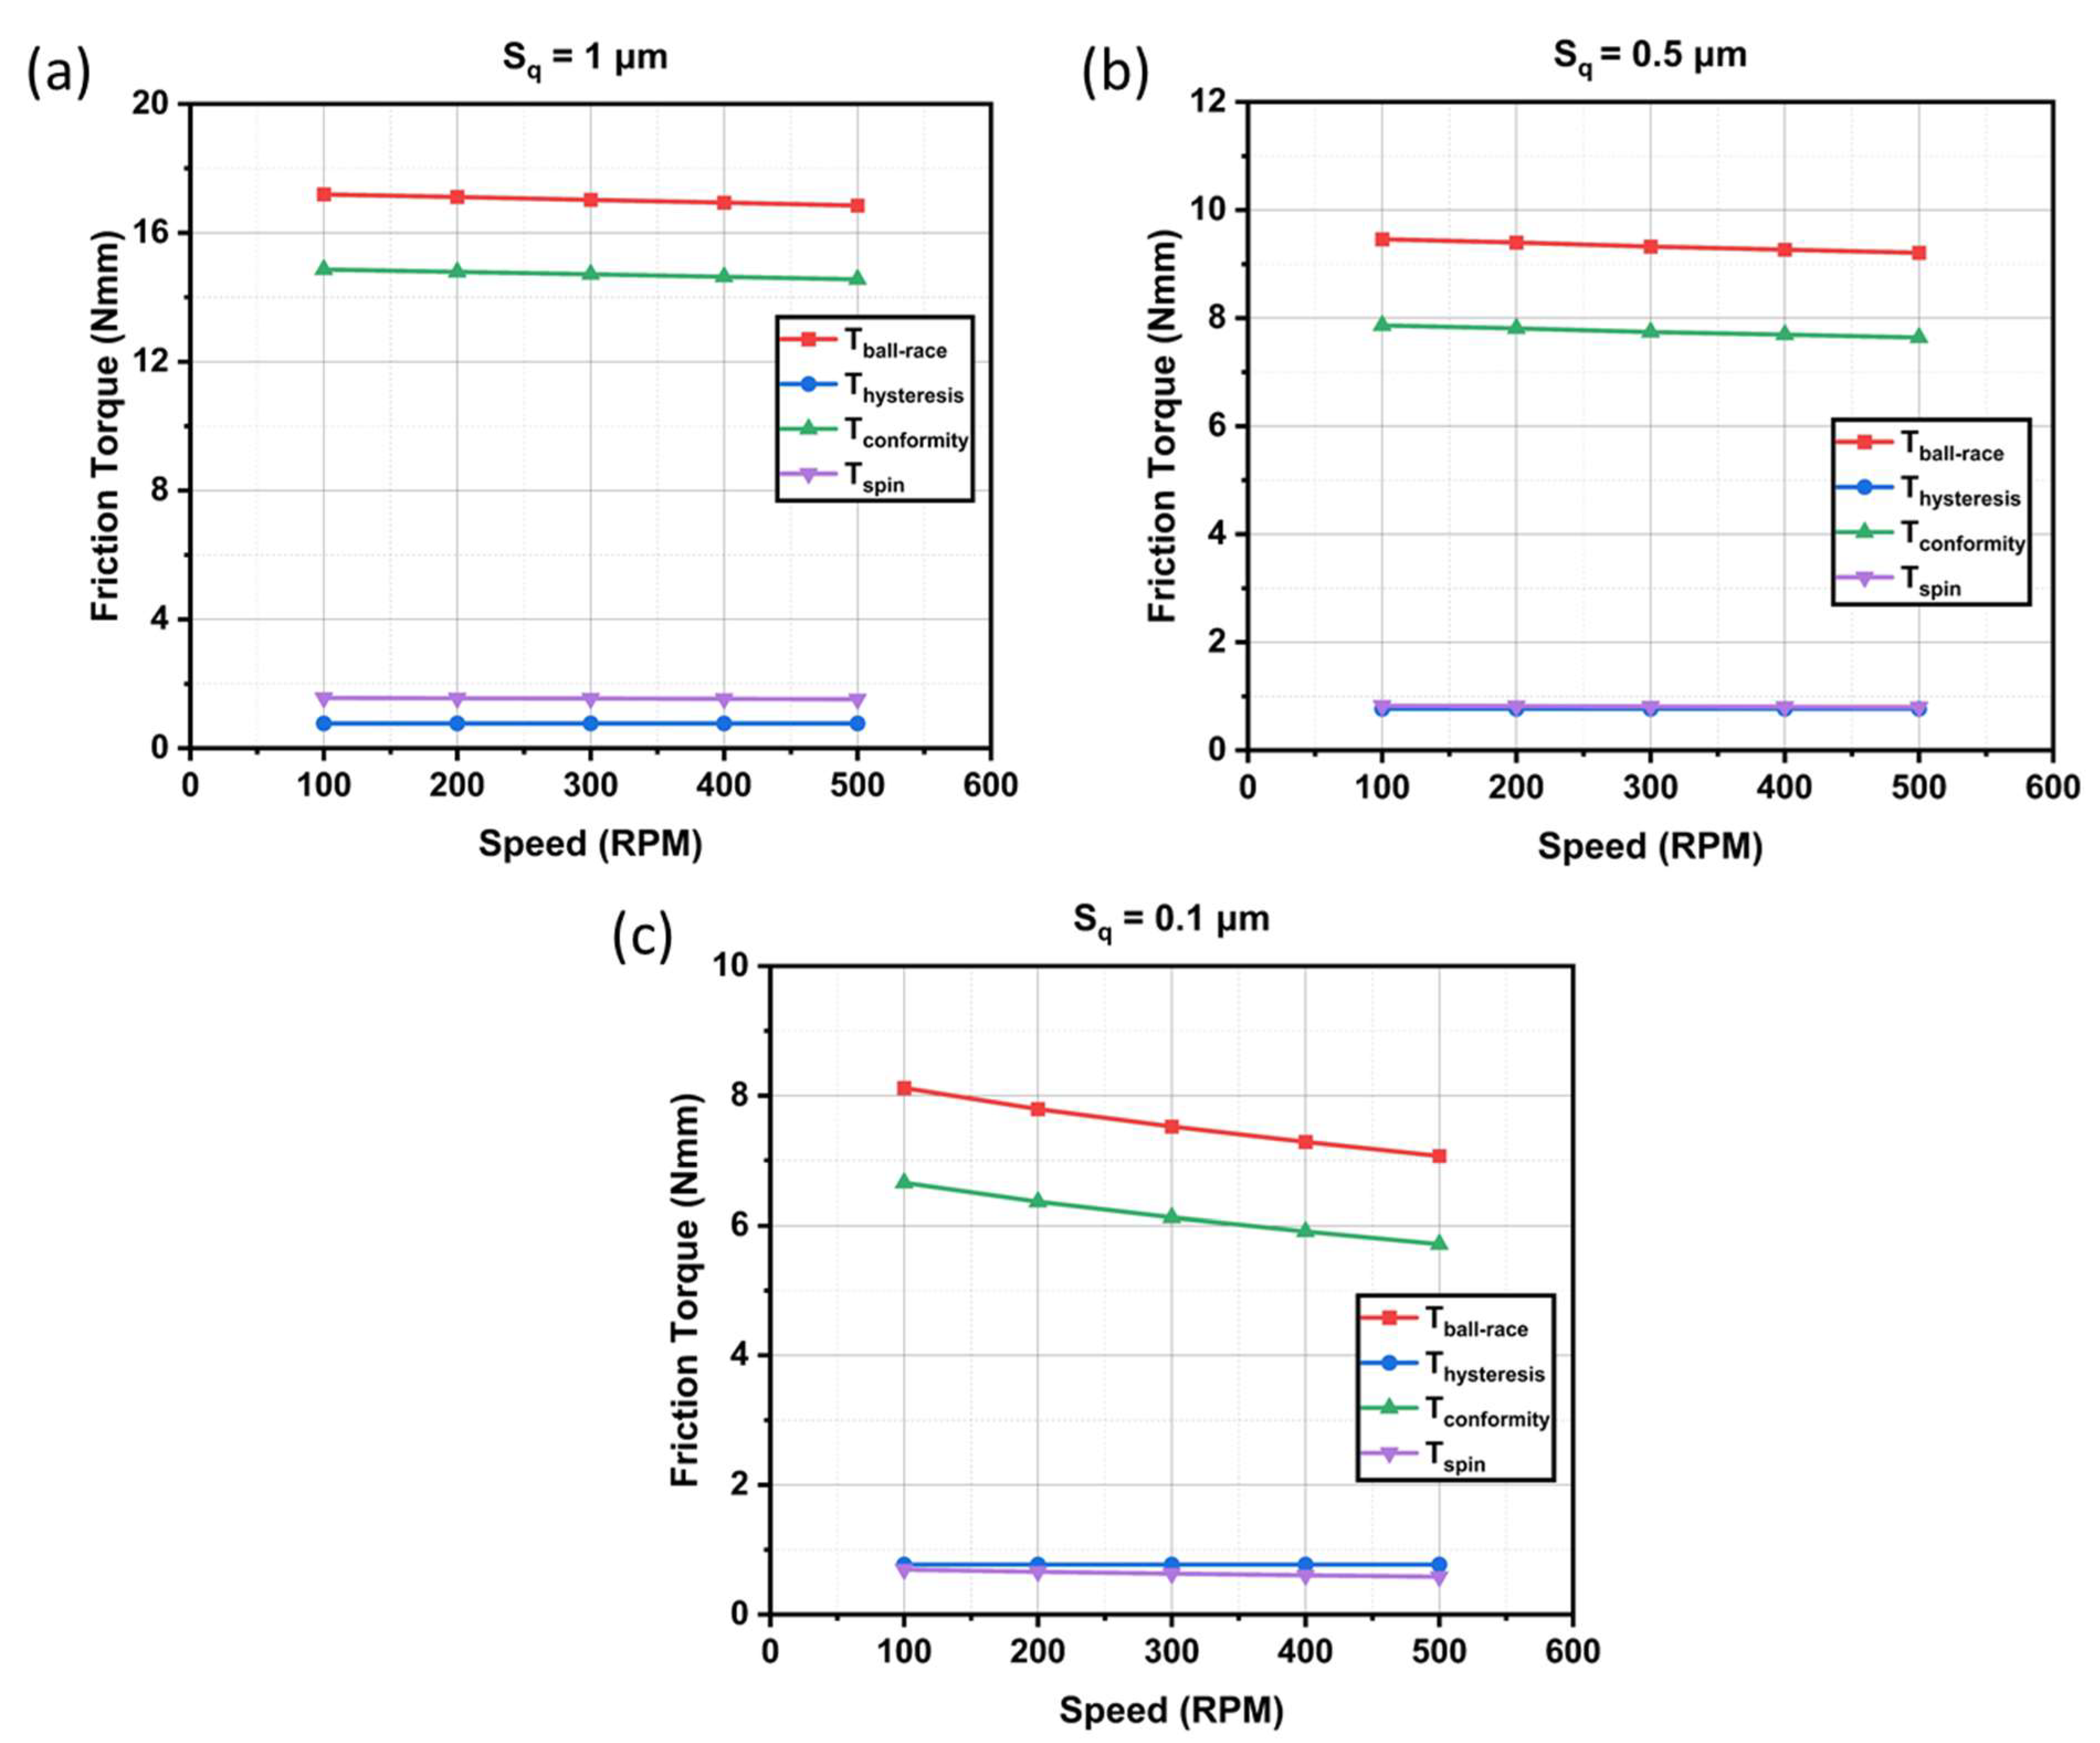
Figure 13 explains how speed and surface roughness affect the components of ball–race friction torque. For the roughest surface, Sq = 1 μm, the conformity torque ( T c o n f o r m i t y ) was the dominant component, remaining nearly constant across all the speeds, while the hysteresis torque ( T h y s t e r e s i s ) and spin torque ( T s p i n ) contributed minimally to the overall torque. As surface roughness decreased to Sq = 0.5 μm, T c o n f o r m i t y continued to be the primary contributor, but it, along with T s p i n , showed a slight decrease with the increasing speed. For the smoothest surface, Sq = 0.1 μm, both T c o n f o r m i t y and T s p i n decreased with the speed, resulting in an overall reduction in the ball–race torque. Throughout, T h y s t e r e s i s remained nearly unaffected by speed or surface roughness, as it depended solely on the load (see Equation (10)). Overall, as the surface roughness decreased, the total friction torque also decreased, with T c o n f o r m i t y remaining the main contributor and showing a slight decline with speed. This indicates that smoother surfaces generally produce lower friction torques, especially at higher speeds, due to the reduction in both T c o n f o r m i t y and T s p i n .

4.5. Effect of Surface Roughness on the Ball–Cage Contact Force

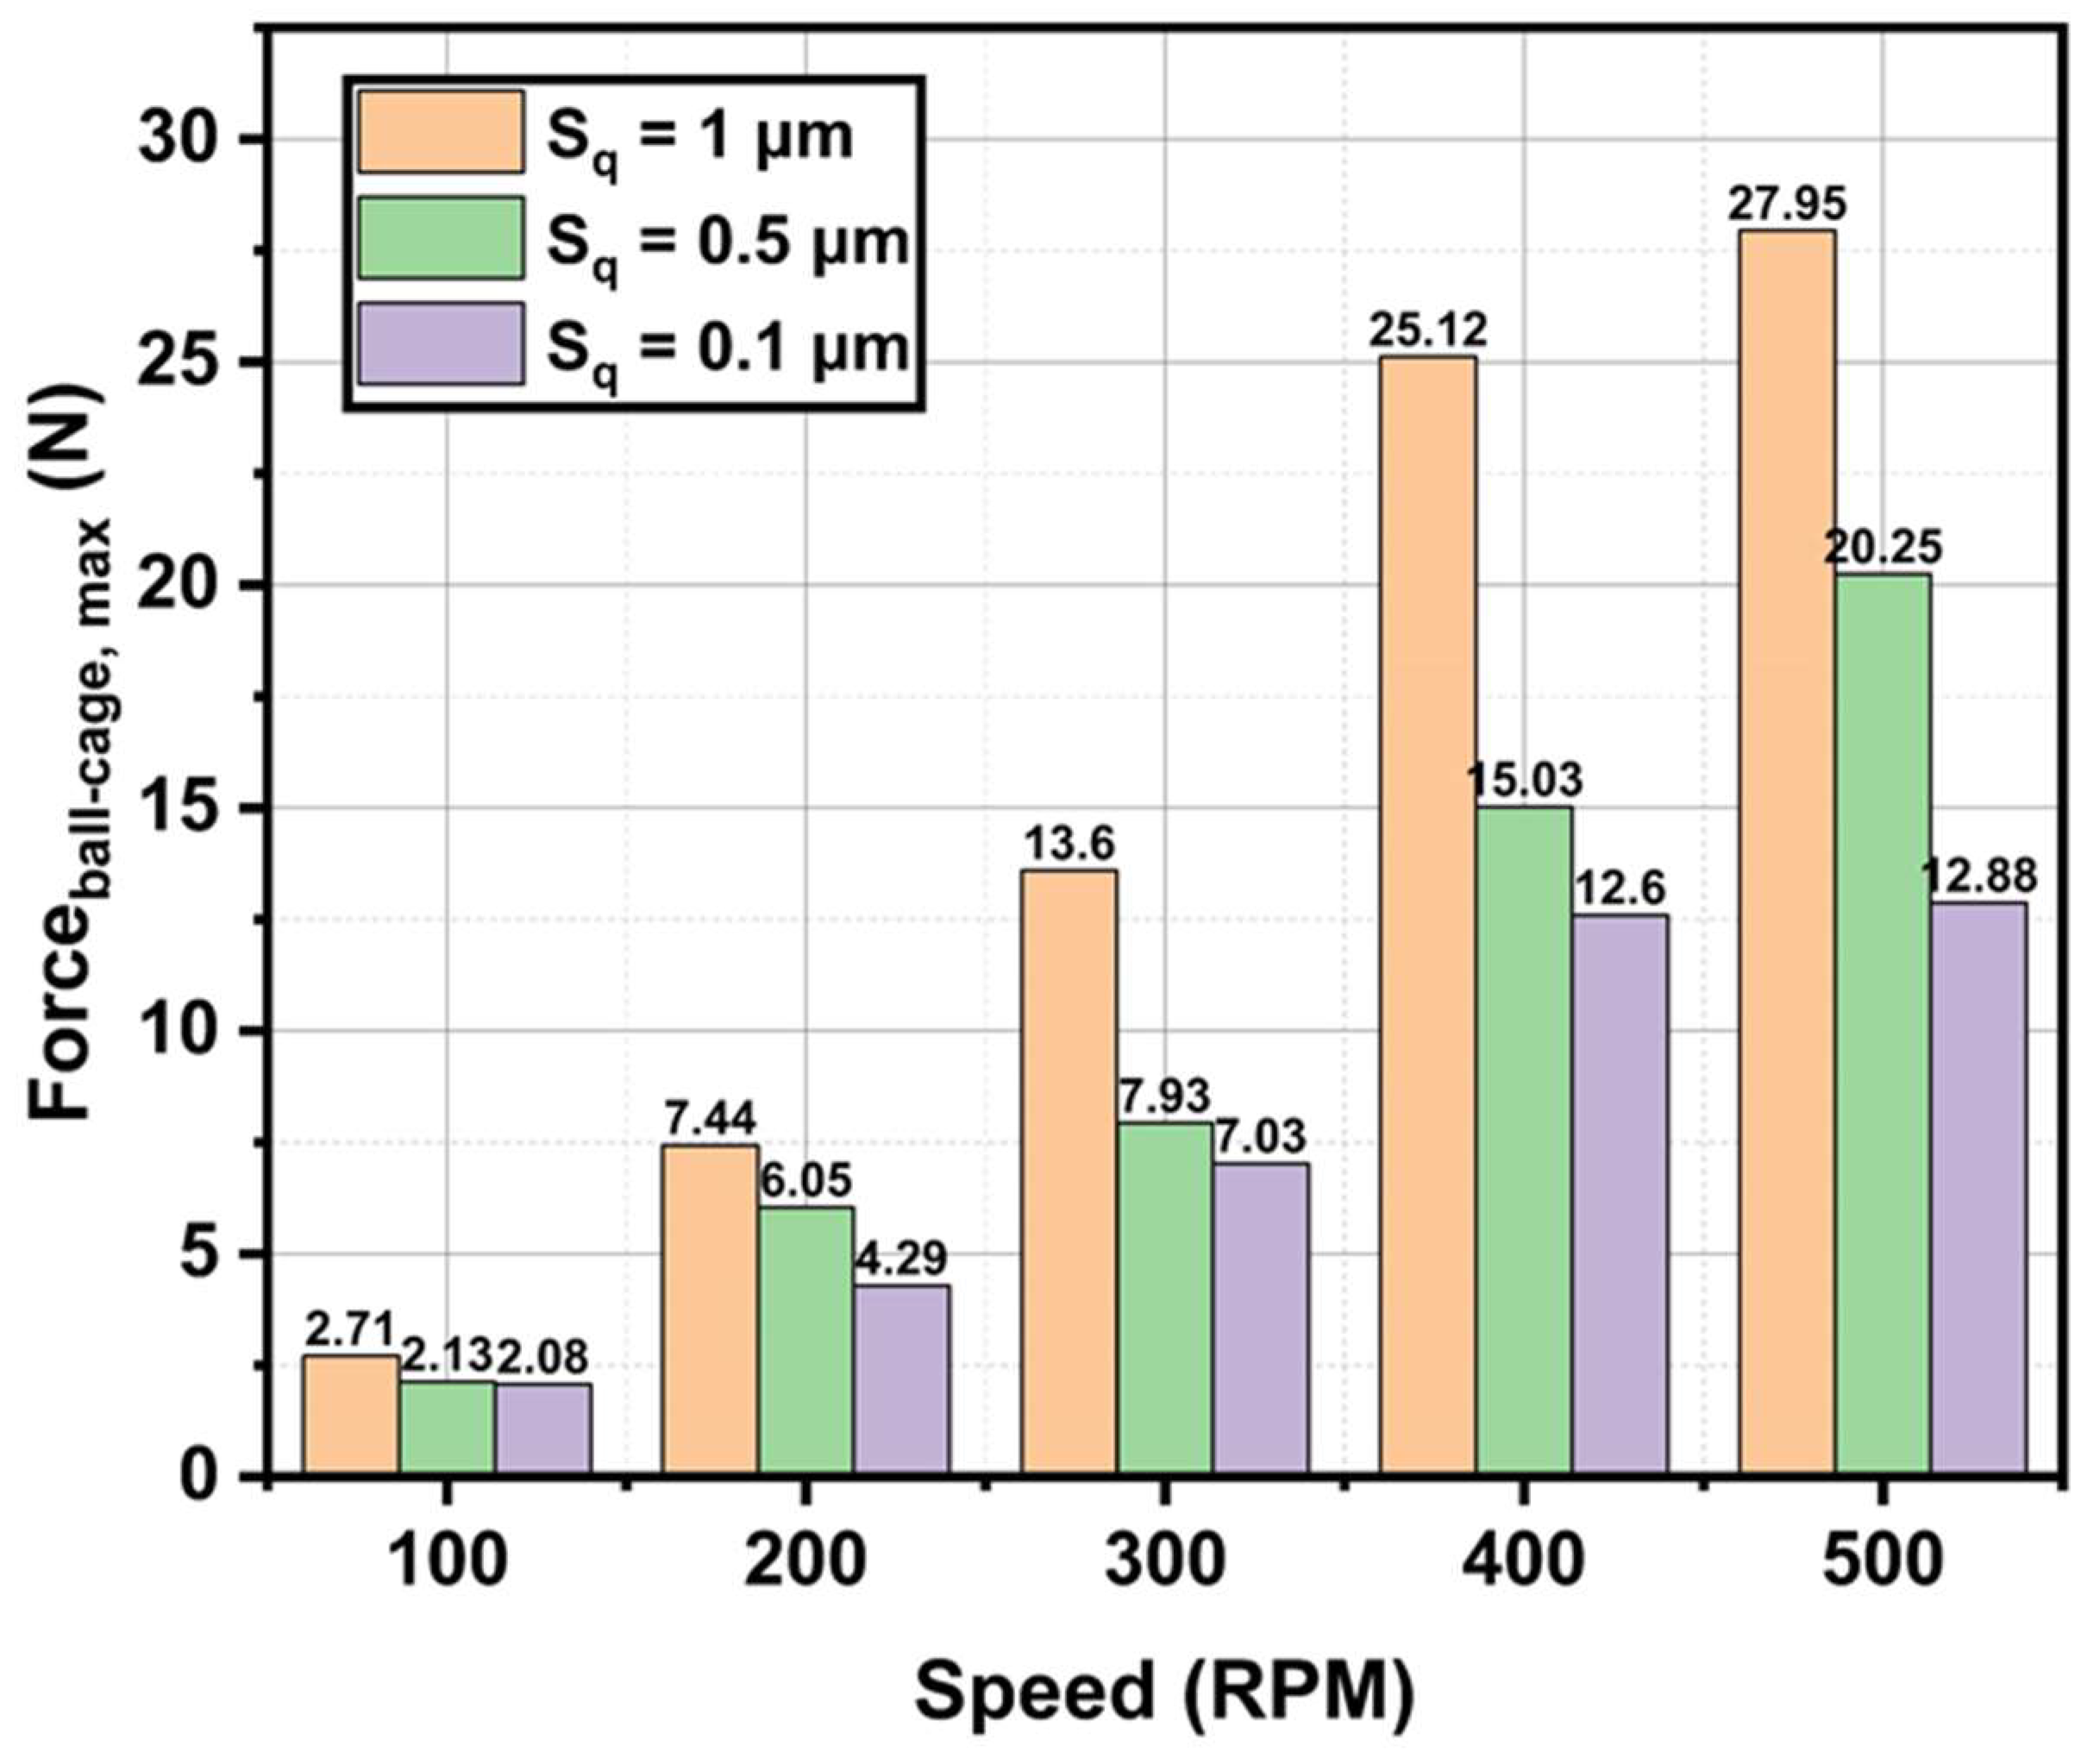
The variation in the maximum contact force at the ball–cage interface with rotational speed (RPM) and surface roughness (Sq) in the ball bearing is shown in Figure 14. As the speed increased, the contact force rose for all the surface roughness levels. For example, at 100 RPM, the contact force ranged from 2.08 N to 2.71 N, while at 500 RPM, it increased significantly, reaching between 12.88 N and 27.95 N depending on the surface roughness. Additionally, higher surface roughness leads to greater contact forces. At 500 RPM, the contact force for Sq = 1 μm was 27.95 N, compared to 12.88 N for Sq = 0.1 μm. This trend was consistent across all the speeds, indicating that both the higher speeds and rougher surfaces resulted in increased contact forces. Consequently, this increase in contact force led to higher friction torque at the ball–cage interface, as the friction torque was directly influenced by the contact force in the ball bearings.

4.6. Validation

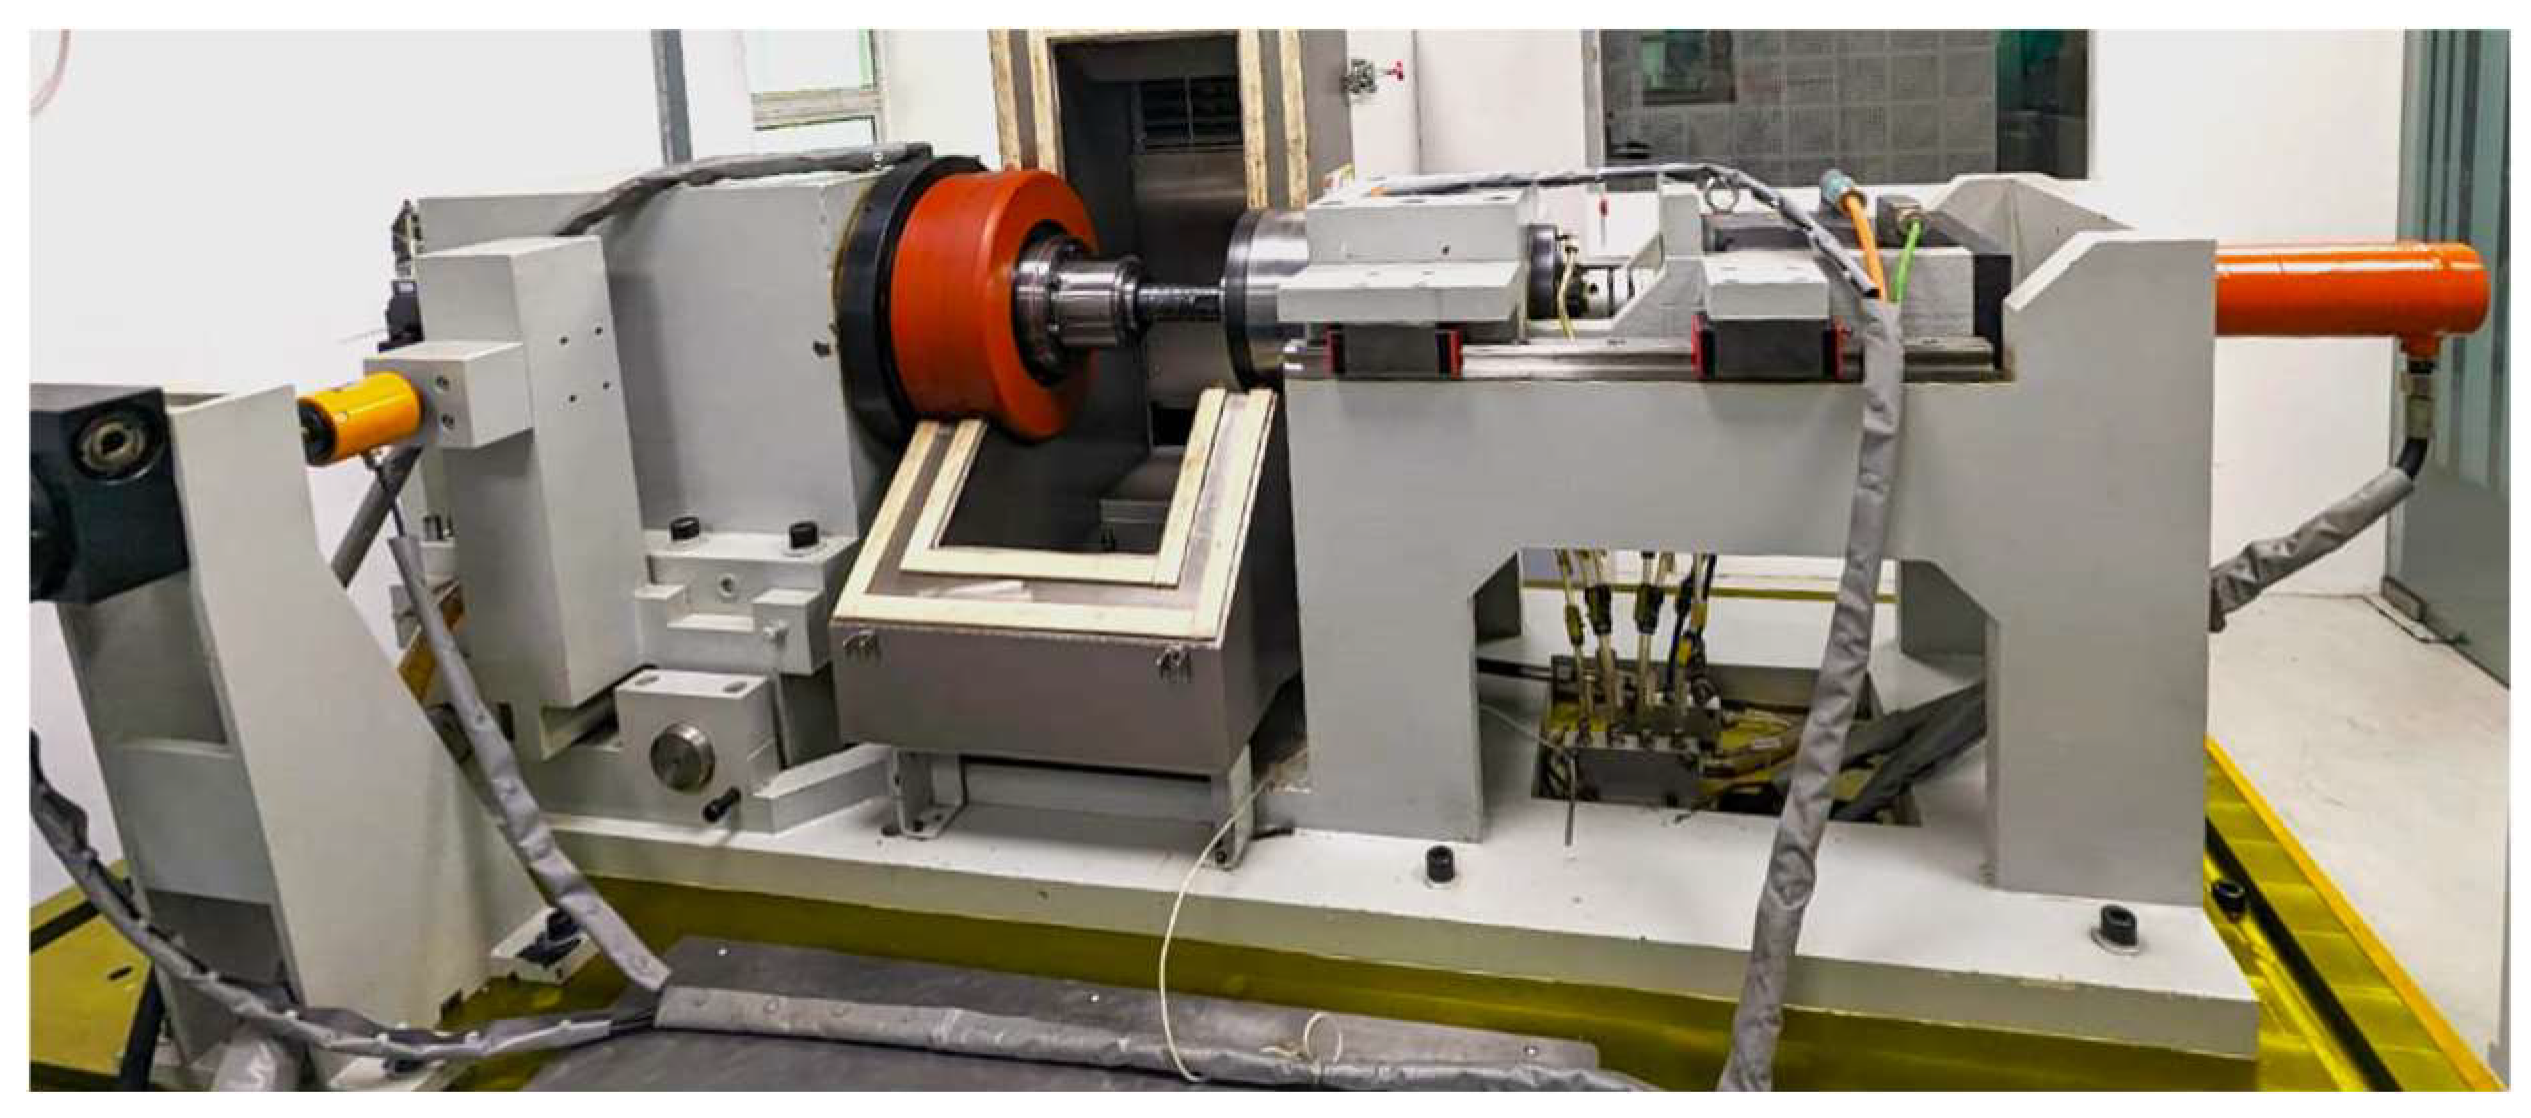
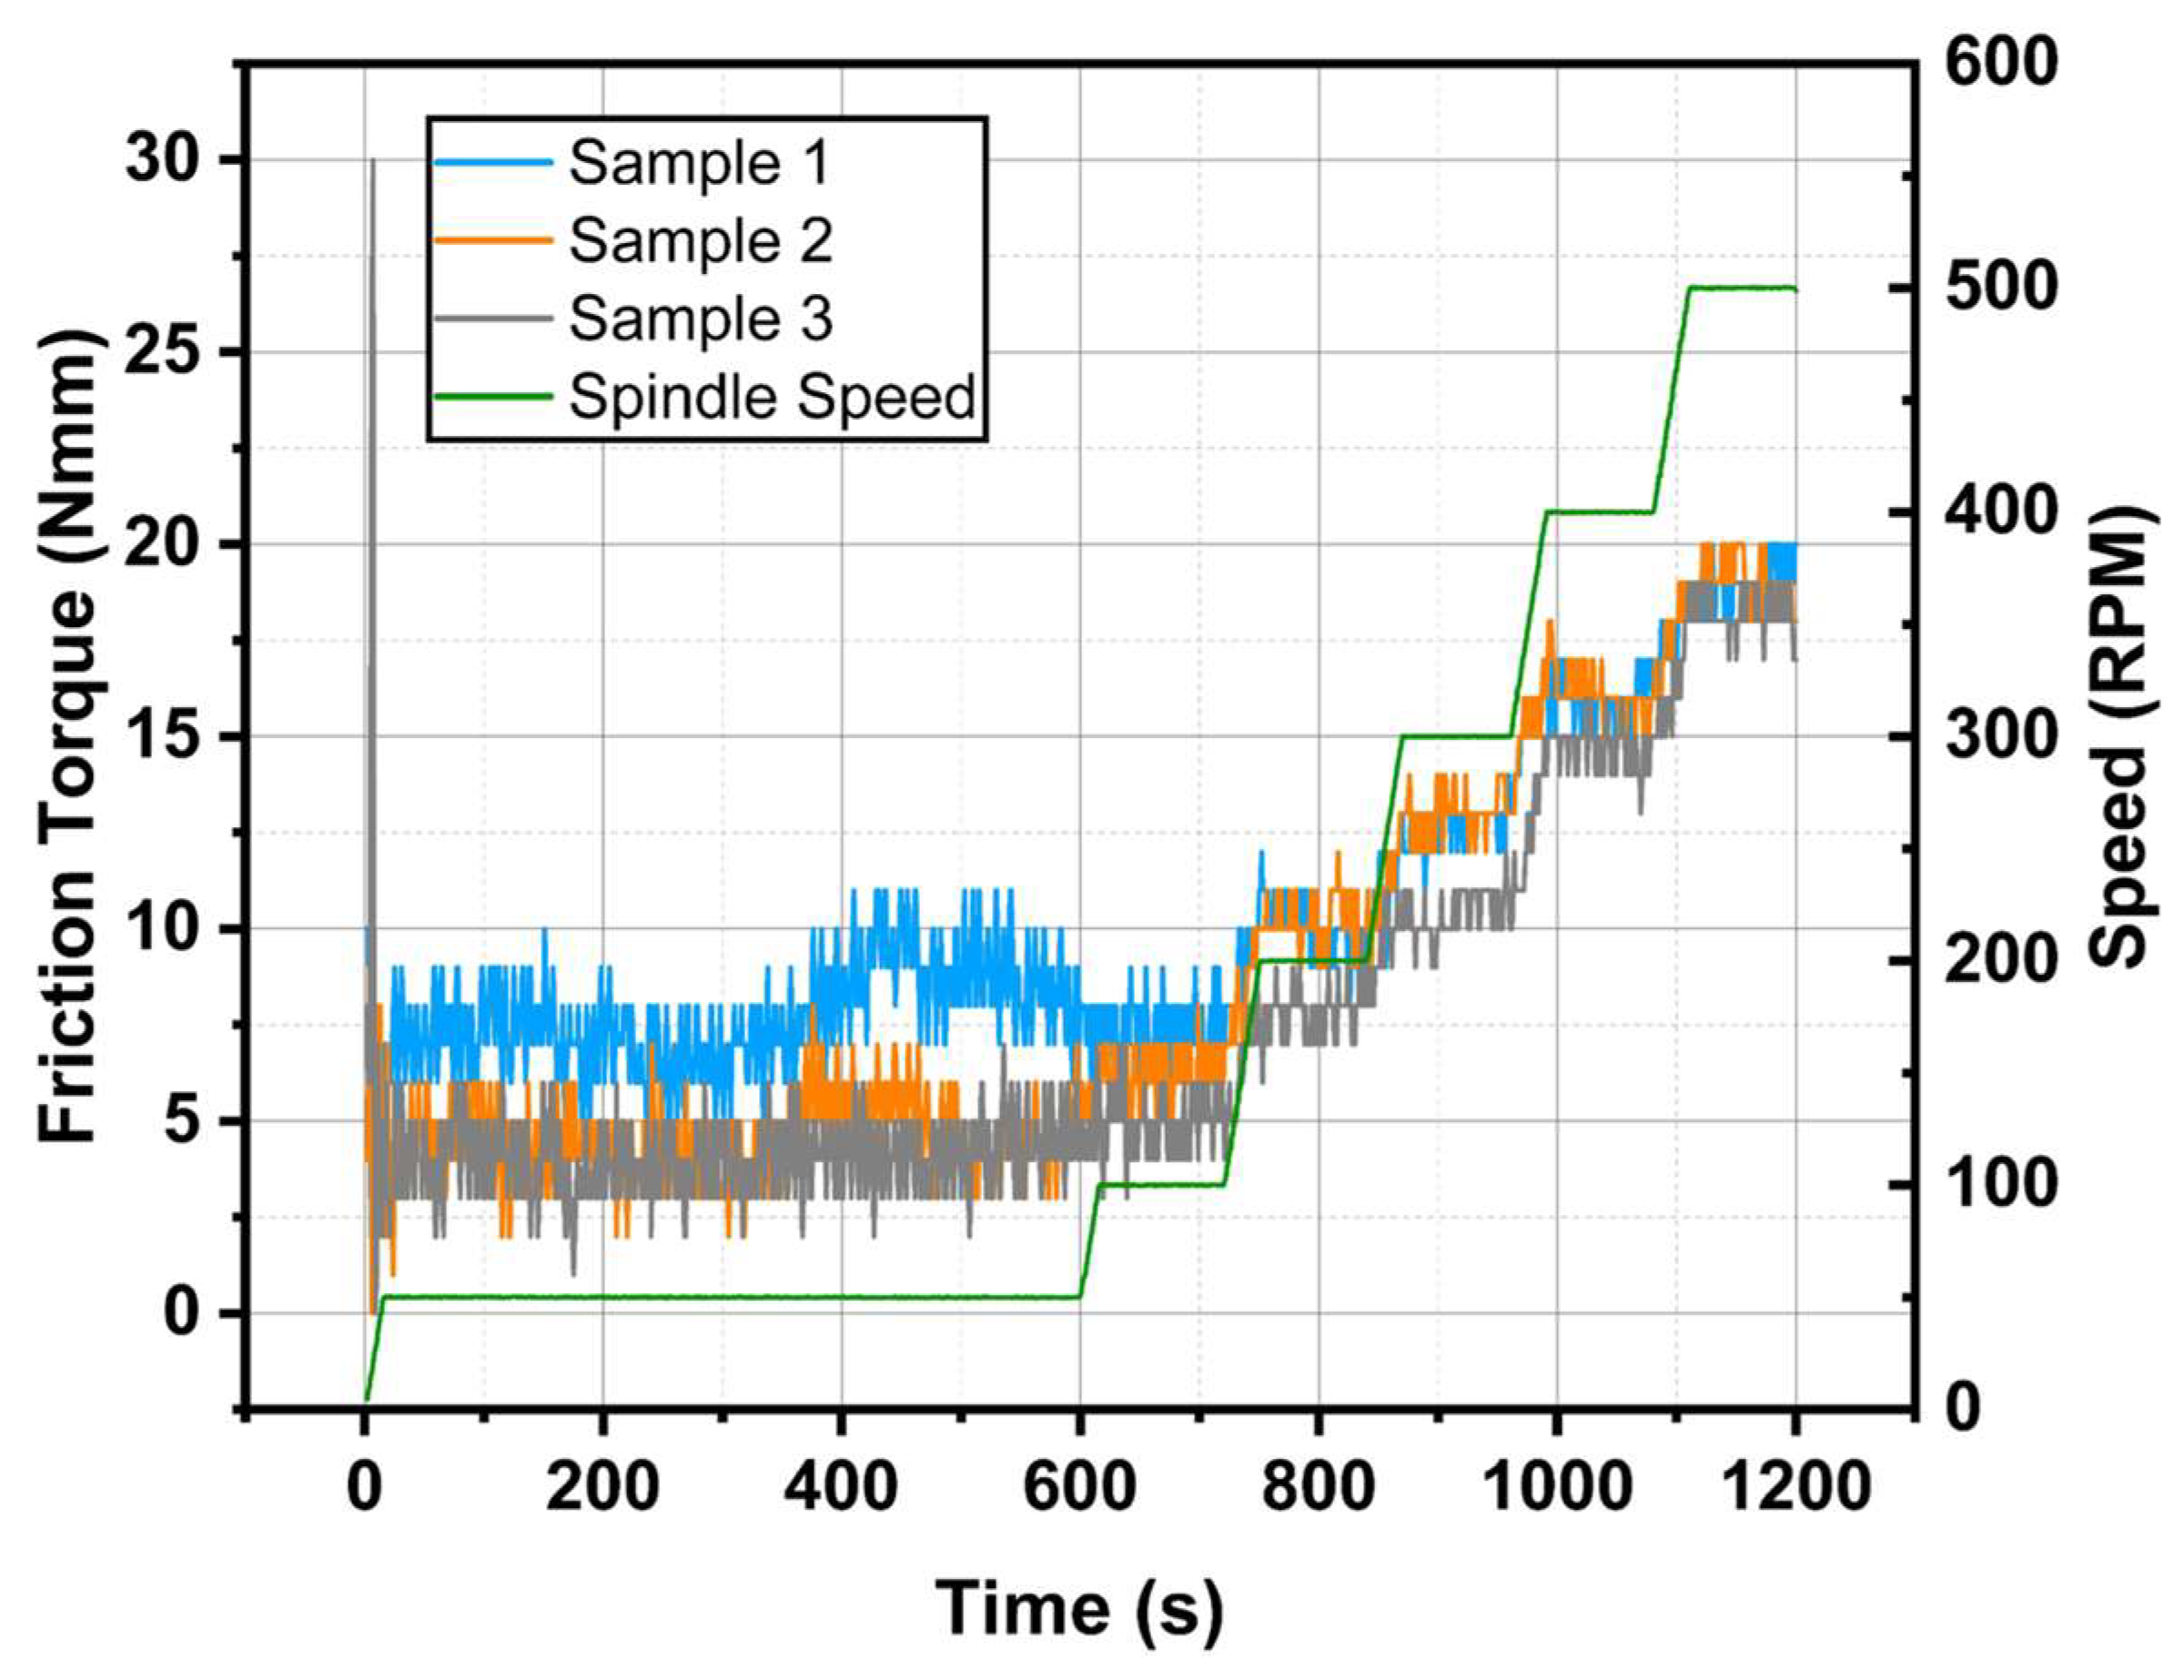
Experiments were conducted using the NEI Torque Rig at National Engineering Industries Limited in Jaipur. Figure 15 shows the actual setup of the NEI Torque Rig. For the experiment, an open type 6205 deep groove ball bearing with a steel cage was utilized, featuring an outer diameter of 52 mm, an inner diameter of 25 mm, and a width of 15 mm. The radial clearance was maintained within the C3 clearance range. The bearings underwent ultrasonic cleaning with Exxsol D80 solvent to remove dirt particles, then were mounted onto a precise spindle with the outer part secured by an adaptor, ensuring bearing shaft runout below 10 microns. Lubrication were performed using ISO VG 32 oil, with the oil flow adjusted to a minimum of 11.11 mL/min to minimize the drag force. The temperature of the oil was maintained at approximately 40 °C. An axial load of 1000 N was applied. Stabilization was achieved by rotating the bearing clockwise for 10 min at a zero load and 50 RPM at room temperature. The RPM was then incrementally increased from 100 to 500 RPM in 100-step increments, with torque readings taken for 2 min at each step. To ensure the accuracy of the model validation, the experiments were repeated three times. The raw data acquired from the high-speed data acquisition card is presented in Figure 16, while the data with error bars, representing the mean and standard deviation for each speed, is shown in Figure 17.
For the simulation, the surface topography of the ball, race, and cage surfaces was measured using an optical profilometer (MFT5000 Tribometer, Rtech Instruments, San Jose, CA, USA). Figure 18 illustrates the equivalent rough surfaces of the ball–race and ball–cage contacts, derived from the measured surface topography of the contacting surfaces. Since the surface topography of the inner and outer races was identical, the equivalent rough surface was the same for the ball–inner race and ball–outer race contacts. The obtained equivalent rough surfaces for the various contacts served as inputs to the mixed EHL (elastohydrodynamic lubrication) model, along with normal contact forces and speeds, to predict the friction coefficient.
The total friction torque estimated from the model was compared to the experimental data presented in Figure 19. The results show a strong correlation between the friction torque values obtained from the model and the experiments, indicating a direct proportionality between the friction torque and speed. At an axial load of 1000 N, the simulated friction torque ranged from 13.86 N·mm to 19.66 N·mm as the speed increased from 100 to 500 RPM, whereas the experimental friction torque ranged from 6.2 N·mm to 18.77 N·mm. The difference in the friction torque was more significant at lower speeds (100 and 200 RPM) and decreased at higher speeds (300–500 RPM). This discrepancy may have arisen from the assumptions made in the mixed EHL model. Olaru et al. [23] suggested that variations in friction torque could result from approximations in the film thickness within the hydrodynamic models. Additionally, the accuracy and precision of the torque sensors used in the experiments could influence the measurement of the friction torque. Overall, the friction torque estimated by the model showed good agreement with the experimental results.

5. Conclusions

The analysis of the bearing system highlights several key observations regarding the effects of surface roughness and rotational speed on friction torque and the coefficient of friction (COF). Higher surface roughness resulted in greater total friction torque, with the roughest surface (Sq = 1 μm) generating the highest torque values, and the smoothest surface (Sq = 0.1 μm) producing the lowest. Additionally, the total friction torque consistently increased with the speed across all the roughness levels, with the most substantial torque rise observed for Sq = 1 μm. These findings highlight the critical role of both surface roughness and speed in determining the total frictional torque behavior of DGBBs.
For the ball–race contact, the friction torque decreased as the surface roughness decreased, with the highest torque observed at Sq = 1 μm and the lowest at Sq = 0.1 μm, where the torque remained fairly constant across the speed range. In contrast, for the ball–cage contact, the friction torque increased significantly with the speed for all the roughness levels, with the rougher surfaces producing higher torque values. Additionally, the COF between the different contact points also revealed that smoother surfaces generally result in lower COF values, especially at higher speeds, except in ball–race contacts where the speed has a minimal effect on the COF.
Moreover, conformity torque was identified as the primary contributor to the total friction torque in the ball–race contact, while the spin torque and hysteresis torque played a minor role. As the surface roughness decreased, both the conformity and the spin torque declined, leading to an overall reduction in the friction torque at higher speeds. In contrast, the hysteresis torque remained unaffected by both the speed and surface roughness as it is primarily dependent on load.
The trends in the maximum contact force at the ball–cage interface further reinforced the relationship between the speed, surface roughness, and friction torque. Higher speeds and rougher surfaces lead to greater contact forces, which in turn result in increased total friction torque. This confirms that both contact types and their respective reactions to surface roughness and speed play a critical role in determining the overall frictional torque performance of a DGBB.
In conclusion, this study demonstrates that both surface roughness and rotational speed significantly impact the total friction torque in a DGBB.

Author Contributions

Conceptualization, H.K.; Software, H.K., V.G. and V.B.; Validation, H.K.; Resources, A.J.; Writing—original draft, H.K.; Writing—review & editing, M.T.; Supervision, M.T., S.K.P., L.A. and A.P.S.; Project administration, M.T. and S.K.P. All authors have read and agreed to the published version of the manuscript.

Funding

The authors acknowledge the financial support from the Science and Engineering Research Board (SERB) and the National Engineering Industries Ltd. Jaipur, through Grant Project No. R&D/SP/ME/SERB/2019-20/413.

Data Availability Statement

The raw data supporting the conclusions of this article will be made available by the authors on request.

Conflicts of Interest

Authors Lokesh Agrawal, Arendra Pal Singh and Ayush Jain were employed by R&D, National Engineering Industries Ltd. The remaining authors declare that the research was conducted in the absence of any commercial or financial relationships that could be construed as a potential conflict of interest.

Nomenclature

a Semi minor axis of elliptical contact (m)
b Semi major axis of elliptical contact (m)
d m Pitch circle diameter (m)
D b Diameter of the ball (m)
E * Equivalent Young’s Modulus (Pa)
K p b Hertzian contact stiffness
M z Spin moment (N·m)
M r Rolling moment due to conformity (N·m)
M h Rolling moment due to hysteresis (N·m)
F n Normal load at point of contact (N)
F t Tangential load at point of contact (N)
r b Radius of the ball (m)
R i , R o Distance of inner and outer contacts from the bearing axis (m)
R r Radius of curvature at contact point (m)
T r b Friction moment at ball–race contact (N·m)
T c b Friction moment at ball–cage contact (N·m)
T b b Total friction moment (N·m)
Z Number of balls
α Contact angle of bearing (rad)
α Hysteresis loss factor
ϕ i Angular position of the i t h ball (rad)
ε Complete elliptic integral of second kind
ϵ Spin-to-roll ratio
κ Ratio of major and minor axis length
k Half width of the cage pocket (m)
μ r b ,   μ c b Friction coefficient at ball–race and ball–cage contact
ω i ,   ω o Angular velocity of inner race and outer race (rad/s)
F T Total load at contact (N)
F a Load carried by asperity (N)
F h Load carried by lubricant film (N)
F f Friction force at contact (N)
F f , a Friction force due to asperity (N)
F f , h Friction force due to lubricant film (N)
h s Lubricant film separation (m)
h s s Gap between mean plane of equivalent rough surface and asperity (m)
A a Total actual contact area of asperity (m2)
f c Boundary friction coefficient
H c Dimensionless central film thickness
h c Central film thickness (m)
R x Reduced radius of curvature in x direction ( 1 R x = 1 R x 1 + 1 R x 2 ) (m)
R x 1 ,   R x 2 Radius of curvature of surface 1 and surface 2 in contact in x direction (m)
R y Reduced radius of curvature in y direction ( 1 R y = 1 R y 1 + 1 R y 2 ) (m)
R y 1 ,   R y 2 Radius of curvature of surface 1 and surface 2 in contact in y direction (m)
u s Sum of the velocity of surface 1 and surface 2 at the contact (m/s)
η 0 Dynamic viscosity of oil at ambient pressure and temperature (Pa·s)
E Equivalent Young’s Modulus ( 2 E = 1 ν 1 2 E 1 + 1 ν 2 2 E 2 ) (Pa)
E 1 ,   E 2 Young’s Modulus of surface 1 and surface 2 in contact (Pa)
ν 1 ,   ν 2 Poisson’s ratio of surface 1 and surface 2 in contact

Appendix A

Zhao et al. [42] established criteria for three different deformation zones of the asperity depending on the critical interference ω e for the contact between the rough surfaces.
ω e i = 0.95 H E e q 2 R i ,   i f   ω i < ω e i ,   e l a s t i c   d e f o r m a t i o n
i f   ω e i < ω i < ω p i ,   e l a s t o p l a s t i c   d e f o r m a t i o n
ω p i = 54 ω e i ,   i f   ω i > ω p i ,   f u l l y   p l a s t i c   d e f o r m a t i o n
The equation for determining the real contact area and normal contact force for the i t h asperity, taking into consideration all three stages of deformation, is as follows
A i = A e i   o r   A e p i   o r   A p i
F i = F e i   o r   F e p i   o r   F p i
Equations (A3)–(A8) present the formulas used to compute F e , F e p , and F p , as well as A e , A e p , and A p , for the i t h asperity.
A e i = π R ( i ) ω ( i )
A e p i = π R i ω i 1 2 ω i ω e i ω e i ω p i 3 + 3 ω i ω e i ω e i ω p i 2
A p i = 2 π R ( i ) ω ( i )
F e i = 4 3 E e q R ( i ) 1 / 2 ω ( i ) 3 / 2
F e p i = H 0.6 H ln ω i ln ω e i ln ω p i ln ω e i A e p i
F p i = H A p i
where R ( i ) denotes the summit radius of the i t h asperity, and H represents the hardness of the material.
Finally, the total real contact area and total asperity contact load can be calculated by adding together all the partial components.

References

  1. Gouda, B.; Tandon, N.; Pandey, R.K.; Babu, C.K. Effects of positioning of inner race micro-textures on the tribodynamic performances of radial ball bearings. Mech. Syst. Signal Process 2025, 223, 111908. [Google Scholar] [CrossRef]
  2. Jin, C.; Wu, B.; Hu, Y. Heat generation modeling of ball bearing based on internal load distribution. Tribol. Int. 2012, 45, 8–15. [Google Scholar] [CrossRef]
  3. Wang, Y.S.; Liu, Z.; Zhu, H.F. Heat generation of bearing. In Key Engineering Materials; Trans Tech Publications Ltd.: Bäch, Switzerland, 2011; pp. 962–967. [Google Scholar]
  4. Johnson, K.L. Contact Mechanics; Cambridge University Press: Cambridge, UK, 1987. [Google Scholar]
  5. Mindlin, R.D. Compliance of elastic bodies in contact. J. Appl. Mech. 1949, 259–268. [Google Scholar] [CrossRef]
  6. Dahl, P.R. A Solid Friction Model; The Aerospace Corporation: Chantilly, VA, USA, 1968; Volume 18, pp. 1–24. [Google Scholar]
  7. Todd, M.J.; Johnson, K.L. A model for coulomb torque hysteresis in ball bearings. Int. J. Mech. Sci. 1987, 29, 339–354. [Google Scholar] [CrossRef]
  8. Jiang, S.; Chen, X.; Gu, J.; Shen, X. Friction moment analysis of space gyroscope bearing with ribbon cage under ultra-low oscillatory motion. Chin. J. Aeronaut. 2014, 27, 1301–1311. [Google Scholar] [CrossRef]
  9. Jones, A.B. A General Theory for Elastically Constrained Ball and Radial Roller Bearings Under Arbitrary Load and Speed Conditions. J. Basic Eng. 1960, 82, 309–320. [Google Scholar] [CrossRef]
  10. Harris, T.A.; Mindel, M.H. Rolling Element Bearing Dynamics; Elsevier Sequoia S.A: Amsterdam, The Netherlands, 1973. [Google Scholar]
  11. Wang, W.Z.; Hu, L.; Zhang, S.G.; Zhao, Z.Q.; Ai, S. Modeling angular contact ball bearing without raceway control hypothesis. Mech. Mach. Theory 2014, 82, 154–172. [Google Scholar] [CrossRef]
  12. Popescu, A.; Houpert, L.; Olaru, D.N. Four approaches for calculating power losses in an angular contact ball bearing. Mech. Mach. Theory 2020, 144, 103669. [Google Scholar] [CrossRef]
  13. Rivera, G.; Tong, V.-C.; Hong, S.-W. Improved Formulation for Sliding Friction Torque of Deep Groove Ball Bearings. J. Korean Soc. Precis. Eng. 2022, 39, 779–789. [Google Scholar] [CrossRef]
  14. Zhao, Y.; Ma, Z.; Zi, Y. Skidding and spinning investigation for dry-lubricated angular contact ball bearing under combined loads. Friction 2023, 11, 1987–2007. [Google Scholar] [CrossRef]
  15. Li, J.H.; Deng, S.E.; Ma, C.M. Analysis on influence factors of friction torque of sensitive bearing of gyro frame. Bearing 2006, 1, 4–7. [Google Scholar]
  16. Xi, Y.; Ruan, W.; Li, H. Development of low friction torque of bearings. Bearing 2002, 10, 13–27. [Google Scholar]
  17. Gupta, P.K. Some dynamic effects in high-speed solid-lubricated ball bearings. ASLE Trans. 1983, 26, 393–400. [Google Scholar] [CrossRef]
  18. Meeks, C.R.; Ng, K.O. The dynamics of ball separators in ball bearings—Part I: Analysis. ASLE Trans. 1985, 28, 277–287. [Google Scholar] [CrossRef]
  19. Meeks, C.R. The dynamics of ball separators in ball bearings—Part II: Results of optimization study. ASLE Trans. 1985, 28, 288–295. [Google Scholar] [CrossRef]
  20. Houpert, L. CAGEDYN: A contribution to roller bearing dynamic calculations part I: Basic tribology concepts. Tribol. Trans. 2010, 53, 1–9. [Google Scholar] [CrossRef]
  21. Houpert, L. CAGEDYN: A Contribution to roller bearing dynamic calculations Part II: Description of the numerical tool and its outputs. Tribol. Trans. 2009, 53, 10–21. [Google Scholar] [CrossRef]
  22. Houpert, L.U.C. CAGEDYN: A contribution to roller bearing dynamic calculations. Part III: Experimental validation. Tribol. Trans. 2010, 53, 848–859. [Google Scholar] [CrossRef]
  23. Olaru, D.N.; Rodica, M.; Bălan, D.; Tufescu, A.; Cârlescu, V.; Prisacaru, G. Influence of the cage on the friction torque in low loaded thrust ball bearings operating in lubricated conditions. Tribol. Int. 2016, 107, 294–305. [Google Scholar] [CrossRef]
  24. Zhou, C.-G.; Wang, L.-D.; Shen, J.-W.; Chen, C.-H.; Ou, Y.; Feng, H.-T. Wear characterization of raceway surface profiles of ball screws. J. Tribol. 2022, 144, 111701. [Google Scholar] [CrossRef]
  25. Bachchhav, B.; Bagchi, H. Effect of surface roughness on friction and lubrication regimes. Mater. Today Proc. 2021, 38, 169–173. [Google Scholar] [CrossRef]
  26. Deng, L.; Su, J.; Jin, Z. Effect of composite textured rough surfaces on the lubrication performance of cylindrical roller bearings. Ind. Lubr. Tribol. 2024, 76, 852–863. [Google Scholar] [CrossRef]
  27. Li, X.; Liu, Y.; Huang, J.; Sang, D.; Yang, K.; Ling, J. Influence of surface texture on pocket pairs lubrication performance of cylindrical roller bearings. Ind. Lubr. Tribol. 2024, 76, 1085–1097. [Google Scholar] [CrossRef]
  28. Li, S.; Huang, S.; Wei, C.; Sun, J.; Wang, Y.; Wang, K. Effect of raceway surface topography based on solid lubrication on temperature rise characteristics of HIPSN full ceramic ball bearings. Ind. Lubr. Tribol. 2024, 76, 1036–1047. [Google Scholar] [CrossRef]
  29. Zhang, Y.; Zhou, C.; Feng, H. A meticulous friction torque model for a lubricated ball screw considering the surface roughness. Tribol. Int. 2023, 190, 109014. [Google Scholar] [CrossRef]
  30. Bălan, M.R.D.; Houpert, L.; Tufescu, A.; Olaru, D.N. Rolling friction torque in ball-race contacts operating in mixed lubrication conditions. Lubricants 2015, 3, 222–243. [Google Scholar] [CrossRef]
  31. Shi, X.; Wu, J.; Zhao, B.; Ma, X.; Lu, X. Mixed thermal elastohydrodynamic lubrication analysis with dynamic performance of aero ball bearing during start-up and shut-down. Proc. Inst. Mech. Eng. Part J J. Eng. Tribol. 2020, 234, 873–886. [Google Scholar] [CrossRef]
  32. Cao, R.; Bai, H.; Cao, H.; Zhang, Y.; Meng, Y. Mixed lubrication analysis of tapered roller bearings and crowning profile optimization based on numerical running-in method. Lubricants 2023, 11, 97. [Google Scholar] [CrossRef]
  33. Harris, T.A. Rolling Bearing Analysis; Wiley: Hoboken, NJ, USA, 1966. [Google Scholar]
  34. Akbarzadeh, S.; Khonsari, M.M. Effect of surface pattern on Stribeck curve. Tribol. Lett. 2010, 37, 477–486. [Google Scholar] [CrossRef]
  35. Akbarzadeh, S.; Khonsari, M.M. Experimental and theoretical investigation of running-in. Tribol. Int. 2011, 44, 92–100. [Google Scholar] [CrossRef]
  36. Akchurin, A.; Bosman, R.; Lugt, P.M.; van Drogen, M. On a model for the prediction of the friction coefficient in mixed lubrication based on a load-sharing concept with measured surface roughness. Tribol. Lett. 2015, 59, 19. [Google Scholar] [CrossRef]
  37. Prajapati, D.K. Prediction of coefficient of friction for different surface topography in mixed-EHL regime. Surf. Topogr. 2021, 9, 015008. [Google Scholar] [CrossRef]
  38. Johnson, K.L.; Greenwood, J.A.; Poon, S.Y. A simple theory of asperity contact in elastohydro-dynamic lubrication. Wear 1972, 19, 91–108. [Google Scholar] [CrossRef]
  39. Greenwood, J.A.; Williamson, J.B.P. Contact of nominally flat surfaces. Proc. R. Soc. Lond. A Math. Phys. Sci. 1966, 295, 300–319. [Google Scholar]
  40. Nijenbanning, G.; Venner, C.H.; Moes, H. Film thickness in elastohydrodynamically lubricated elliptic contacts. Wear 1994, 176, 217–229. [Google Scholar] [CrossRef]
  41. He, Y.F.; Tang, J.Y.; Zhou, W.; Liao, D.R. Research on the obtainment of topography parameters by rough surface simulation with fast fourier transform. J. Tribol. 2015, 137, 031401. [Google Scholar]
  42. Zhao, Y.; Maietta, D.M.; Chang, L. An asperity microcontact model incorporating the transition from elastic deformation to fully plastic flow. J. Trib. 2000, 122, 86–93. [Google Scholar] [CrossRef]
  43. Roelands, C.J.A. Correlational Aspects of the Viscosity-Temperature-Pressure Relationship of Lubricating Oils. 1966. Available online: http://resolver.tudelft.nl/uuid:1fb56839-9589-4ffb-98aa-4a20968d1f90 (accessed on 12 March 2024).
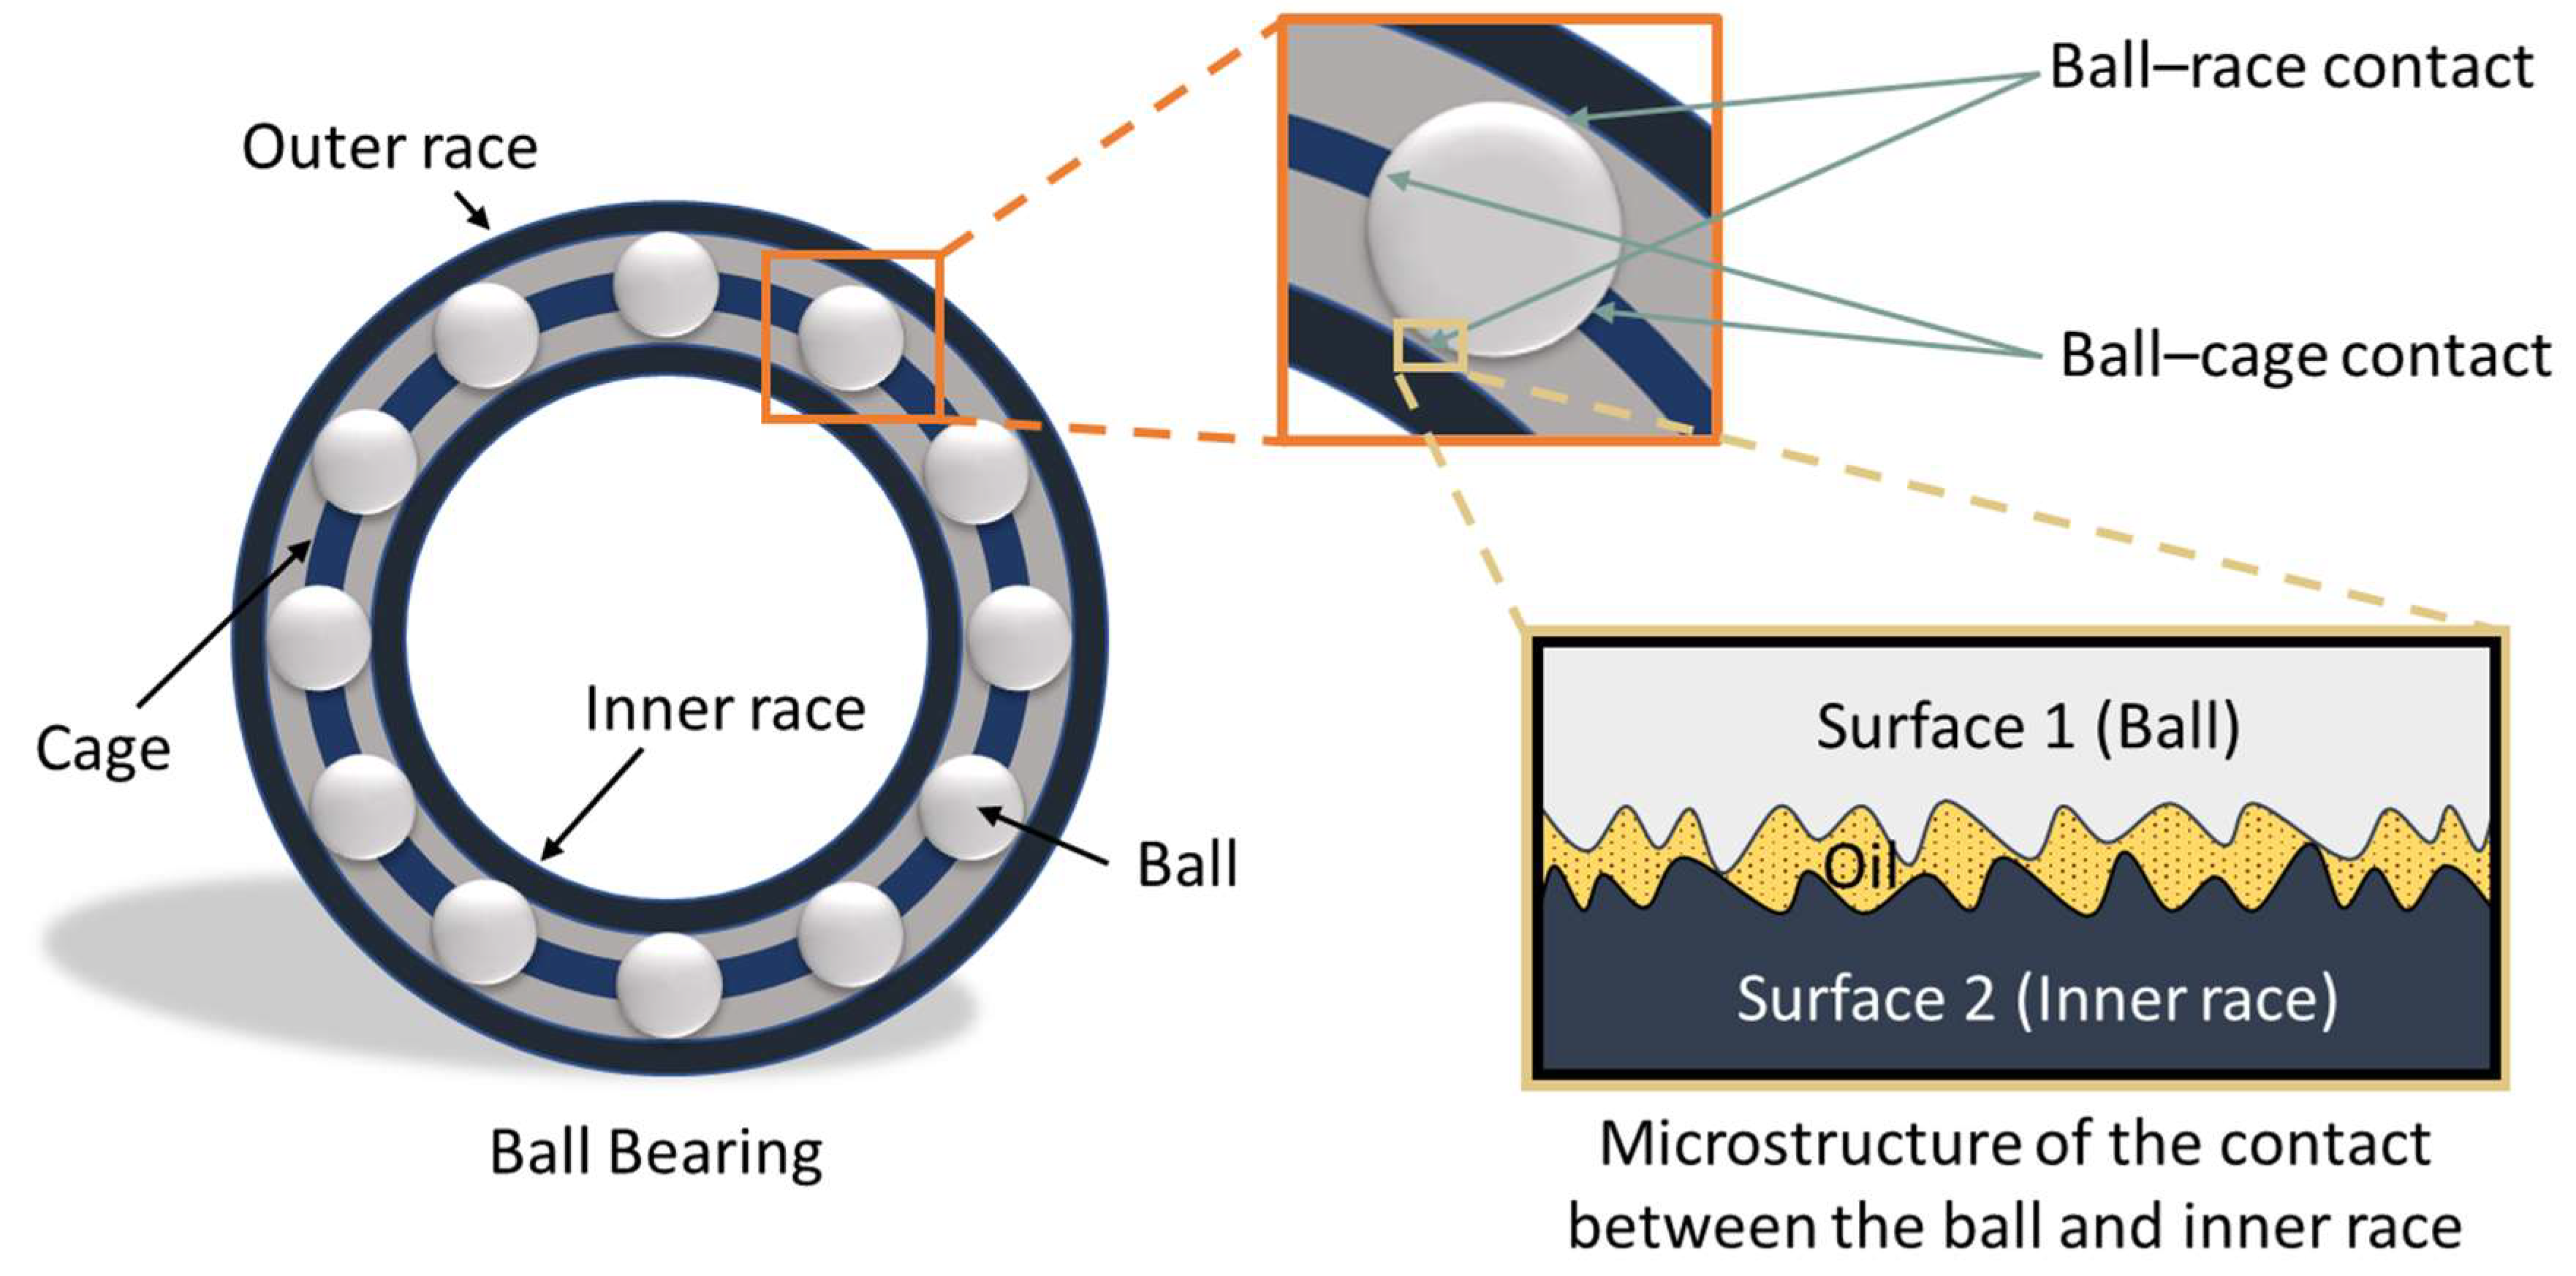
Figure 1. A schematic diagram to represent the contacts between different elements of a lubricated DGBB.
Lubricants 12 00443 g001
Figure 2. A cross-sectional diagram of a ball bearing showing the forces and moments.
Lubricants 12 00443 g002
Figure 3. Influence of the spin-to-roll ratio on moments resulting from conformity and spin.
Lubricants 12 00443 g003
Figure 4. Reference frames in a ball bearing.
Lubricants 12 00443 g004
Figure 5. Vector representation of ball center ( O b ), pocket center ( O p ) and contact point ( Q ) across various reference frames.
Lubricants 12 00443 g005
Figure 6. Schematic of a (a) single point contact, (b) double point contact, and (c) no contact.
Lubricants 12 00443 g006
Figure 7. Schematic of the micro-contact between two surfaces under lubrication.
Lubricants 12 00443 g007
Figure 8. Numerically generated Gaussian rough surface of 512 × 512 grid size with the RMS surface roughness (Sq) of (a) 1 μm, (b) 0.5 μm, and (c) 0.1 μm.
Lubricants 12 00443 g008
Figure 9. Time-varying friction torque data for surface roughness of Sq = 1 µm at 1000 N axial load and 100 RPM speed.
Lubricants 12 00443 g009
Figure 10. Friction torque vs. speed for different surface roughness.
Lubricants 12 00443 g010
Figure 11. The estimated friction coefficient for the contact between the (a) ball–outer race, (b) ball–inner race, and (c) ball–cage.
Lubricants 12 00443 g011
Figure 12. Friction torque with different rough surfaces measured at 100–500 RPM speed for (a) ball–race contact, (b) ball–cage contact.
Lubricants 12 00443 g012
Figure 13. Effect of speed and surface roughness on the components of ball–race friction torque.
Lubricants 12 00443 g013
Figure 14. Maximum contact force at ball–cage contact with speed for different surface roughness.
Lubricants 12 00443 g014
Figure 15. NEI Torque Rig.
Lubricants 12 00443 g015
Figure 16. Friction torque data acquired for 1000 N axial load.
Lubricants 12 00443 g016
Figure 17. Friction torque data showing mean and standard deviation at 1000 N axial load for speed 100–500 RPM.
Lubricants 12 00443 g017
Figure 18. The equivalent rough surface of the (a) ball–race contact (Sq = 0.48 μm, Ssk = −0.18, Sku = 3.3) and the (b) ball–cage contact (Sq = 0.58 μm, Ssk = −0.86, Sku = 9.85).
Lubricants 12 00443 g018
Figure 19. Comparison of the friction torque derived from the model and the experimental results at an axial load of 1000 N, with the speeds ranging from 100 to 500 RPM.
Lubricants 12 00443 g019
Table 1. Design parameters of 6205 ball bearing.
ParametersValue
Number   of   balls ,   Z 9
Mass   of   ball ,   M b (gm)2.04
Mass   of   cage ,   m c (gm)6.58
Ball   diameter ,   D b (mm)7.94
Mass of inner race (gm)38.63
Mass of outer race (gm)54.21
Radius of inner race (mm)15.53
Radius of outer race (mm)23.48
Groove radius of inner race (mm)4.13
Groove radius of outer race (mm)4.21
Pocket diameter (mm)13.9
Pocket depth (mm)6.81
Table 2. Input parameters used in simulation.
ParametersValue
Young’s modulus (GPa)230
Poisson’s ratio0.3
Hysteresis loss factor (%)0.5
Contact   angle ,   α (rad)0.18
Boundary friction coefficient0.13
Axial load (N)1000, 3000
Speed (RPM)100, 200, 300, 400, 500
Table 3. Lubricant properties.
ParametersValue
Viscosity at 40 °C (mPa·s)20
Pressure viscosity index0.65
Eyring Shear Stress2.5
Pressure viscosity coefficient (Pa−1)2.0 × 10⁻⁸
Disclaimer/Publisher’s Note: The statements, opinions and data contained in all publications are solely those of the individual author(s) and contributor(s) and not of MDPI and/or the editor(s). MDPI and/or the editor(s) disclaim responsibility for any injury to people or property resulting from any ideas, methods, instructions or products referred to in the content.