1. Introduction
The railroad, as a significant pillar underpinning economic and social development, undertakes the crucial task of facilitating the efficient circulation of people and materials. Turnouts, serving as key connecting components within the railroad track system, are of vital importance for the safe and seamless alteration of train tracks and are recognized as one of the three most vulnerable links in the railroad infrastructure [
1].
The switch sliding baseplate constitutes a key part of the turnout structures. Its appearance is depicted in
Figure 1, and it extends throughout the entire length of the tip rail of the turnout. Its principal function lies in providing support and guiding the sliding movement of the basic and pointed rails along its surface [
2]. When a train traverses a turnout, the switch sliding baseplate is exposed to a high-pressure and high-friction environment. Prolonged and repetitive loading and usage can consequently result in surface wear on the switch sliding baseplate. In the early stages of wear, the switch sliding baseplate primarily exhibits micro-cutting defects, which encompass fatigue spalling and adhesive wear in the form of small wear flaws. These defects possess rather complex morphological and characteristic features and are prone to evolving into cracks over time [
3]. Micro-cutting defects can curtail the service life of the switch sliding baseplate and may lead to alterations in its geometric shape and surface quality. This, in turn, affects the functionality of the turnout, heightens the operational risks for trains entering and exiting the turnout, and thereby poses a threat to the safety of the entire railroad system.
Given that micro-cutting represents micron-level defects, traditional detection techniques such as ultrasound-, eddy current-, image-, and sound-based methods are incapable of detecting them. Currently, the nanometer-resolution scanning electron microscope (SEM) is the predominant method employed for detection purposes. Regarding the detection of micro-cutting defects within SEM images, the existing approaches mainly include manual detection and traditional image processing methods [
4]. Manual detection primarily relies on professional technicians to identify and count the defects, yet it suffers from drawbacks such as high labor costs, low efficiency, and poor stability. In an attempt to address these issues, researchers have resorted to traditional image processing methods like edge detection and connected domain analysis to assist in defect detection. However, due to the complexity of the surface features of the switch sliding baseplate, these methods still fall short in effectively differentiating micro-cutting defects from environmental noise or other image characteristics. In summary, the traditional SEM image detection methods for wear defects lack pertinence and fail to be tailored to the specific requirements of detecting micro-cutting defects on the switch sliding baseplate [
5].
In the wake of the continuous advancement of information technology, deep learning has offered substantial assistance in the detection of tiny targets. With its outstanding detection performance and efficient data processing capabilities, it can overcome the shortcomings of traditional experience-based manual detection. Yang L et al. [
6] put forward a novel non-destructive defect detection network aimed at defects like cracks in products caused by factors such as collisions, uneven stress, and welding parameters, with the intention of enhancing the segmentation of tiny defects. Experimental results have demonstrated that this segmentation network surpasses other related models. Zhang D et al. [
7] designed an efficient lightweight convolutional neural network (CNN) model to address issues regarding the accuracy of small target detection and the difficulty of implementing deep convolutional neural networks on embedded devices. Nevertheless, the early CNN models are characterized by a cumbersome training and learning process and insufficient recognition accuracy, failing to meet the requirements for defect detection in SEM images.
The YOLOv5 (you only look once version 5) model integrates the advantages of existing deep learning algorithm models. It not only exhibits a better detection accuracy but also features a smaller and more flexible structure, enabling faster image inference and aligning more closely with the actual application needs [
8]. It tackles the challenges encountered in defect detection within SEM images by virtue of its excellent detection performance and efficient problem-solving capabilities. Bappaditya Dey et al. [
9] improved random defect detection in SEM images based on the improved YOLOv5. By combining custom-trained models with YOLOv5, this approach enhances the average accuracy metrics of defect classes as well as the overall
mAP accuracy. Moreover, it can be utilized for high-resolution, high-speed metrology to quickly and more reliably identify defects. However, this kind of simple combination of models fails to make targeted improvements to the network’s architecture and loss function. In the face of micro-cutting defects with complex features, it remains insufficient in accurately identifying such defects in SEM images of the switch sliding baseplate.
Given that the existing research methods regarding the wear defects of the switch sliding baseplate are inadequate and that the analysis of SEM images mainly relies on artificial experience, this paper introduces deep learning methods into the research on wear defects on the switch sliding baseplate. Through an in-depth study of the features in SEM images of switch sliding baseplate specimens, the extraction of defects contained therein, and the application of target detection algorithms, the identification of wear defects in SEM images is achieved. Furthermore, through simulated wear experiments, the dataset required for model training is accurately collected, and then this dataset is expanded. Based on YOLOv5, a network model that can efficiently and accurately identify the wear defects of the switch sliding baseplate is established. Subsequently, comparative experiments and ablation experiments are conducted on the proposed network model, which verify the validity of the algorithms proposed for the detection of wear defects on the switch sliding baseplate.
2. Data Acquisition
2.1. Preparation of Experimental Samples
In the present experiment, the tip rail was fabricated from U75V steel, while the switch sliding baseplate was made of a copper-based nickel-coated graphite composite material (Ni-@Gr/Cu composite material). Specifically, for the copper-based nickel-coated graphite composites, Ni-coated graphite powder served as the raw material. This powder had a flake shape, with an average size of approximately 45 μm, a thickness close to 5 μm, and a purity of 99.9%. The size of the Cu powder was around 37.5 μm, and its purity was also 99.9%. The content of Ni-@Gr was 4 wt.%, that of Ni was 8 wt.%, and the remainder was Cu [
10].
Table 1 presents the principal experimental equipment utilized both before and after the experiments. The details provided include the name of each piece of equipment, its specification model, as well as the relevant technical parameters.
After sample preparation, a series of procedures were carried out, which consisted of five steps. Firstly, ball milling was conducted for a duration of 15 h. Subsequently, press molding was performed at a pressure of 600 MPa. Then, sintering was carried out at a temperature of 1123 K for 1 h. After that, re-pressing was implemented once again at 600 MPa. Finally, an additional sintering process was executed at 1073 K for 30 min.
Following these steps, the material was polished. Subsequently, the disk specimen was fixed onto the working disk that supported the friction and wear tester by means of screws. The working disk with the fixed specimen was then placed on top of the friction and wear tester, and the specimen itself was secured in the slot beneath the friction and wear tester using a fixing pin. Subsequently, the parameters of the equipment were adjusted. For each group of experiments, it was necessary to record the quality of both the quality and the images of the microscopic defects. Moreover, after the completion of the two groups of experiments, the front and back sides of the disk specimen needed to be re-processed. Specifically, after the two groups of experiments had been carried out, re-polishing was required, and further wear experiments could be carried out after the polishing process was completed.
2.2. Image Dataset Creation
In the exploration of wear damage on the switch sliding baseplate, this study adopted image acquisition techniques at both macroscopic and microscopic levels to, respectively, investigate the damage characteristics of the material under friction.
At the macroscopic level, a camera was utilized for surface wear image acquisition. This approach could offer macroscopic visual information regarding the overall wear, but the limited resolution of the camera made it arduous to observe the minute details and microstructural changes on the material’s surface. Consequently, this restricted our ability to form a comprehensive understanding of the wear mechanism. To surmount this limitation, a micro-analysis method was selected, specifically using a scanning electron microscope (SEM) to acquire images of wear defects. An SEM functions by exciting the sample and collecting physical signals from the interaction of an electron beam with the sample’s surface. These signals are then amplified and processed to ultimately generate a high-resolution image of the sample’s surface. Among the electrons employed for imaging purposes, back-scattered electrons (BSEs) and secondary electrons (SEs) are two key types. In this experiment, wear images obtained through these two imaging methods were acquired simultaneously. After conducting a comparative analysis, the secondary electron images, which were found to be more capable of characterizing the wear defects, were chosen to construct the dataset.
To facilitate a more in-depth analysis of the wear process, it was essential to employ measurement methods capable of quantifying wear. Hence, the weighing method was adopted, which involved calculating the material loss due to wear by measuring the difference in mass of the specimen before and after the wear process. This ensured that measurement of the mass lost through wear for each specimen was consistent.
During the wear experiments, with other parameters kept constant, the wear experiments were carried out under test forces of 5 N, 10 N, 15 N, 20 N, 25 N, and 30 N. After conducting the wear tests under these different intensities of test force, in order to analyze the wear on the surface of the switch sliding baseplate in detail, experiments were performed using three imaging techniques to capture images of the wear defects on the specimen’s surface.
A digital camera was employed to capture the changes in the appearance of the surface after wear and tear, and the images captured are presented in
Figure 2.
As depicted in
Figure 2, it is evident that with the increase in the test force, the wear marks on the surface of the specimen became increasingly conspicuous. This is manifested through the presence of deeper scratches and broader wear areas on the surface. Nevertheless, digital cameras possess certain limitations when it comes to capturing these microscopic details. As a result, it becomes challenging to examine minute wear defects. Consequently, the accuracy of the wear images obtained using a camera is rather insufficient, and thus, the scanning electron microscope (SEM) is indispensable as it can supply higher resolution images for the purpose of conducting in-depth analysis.
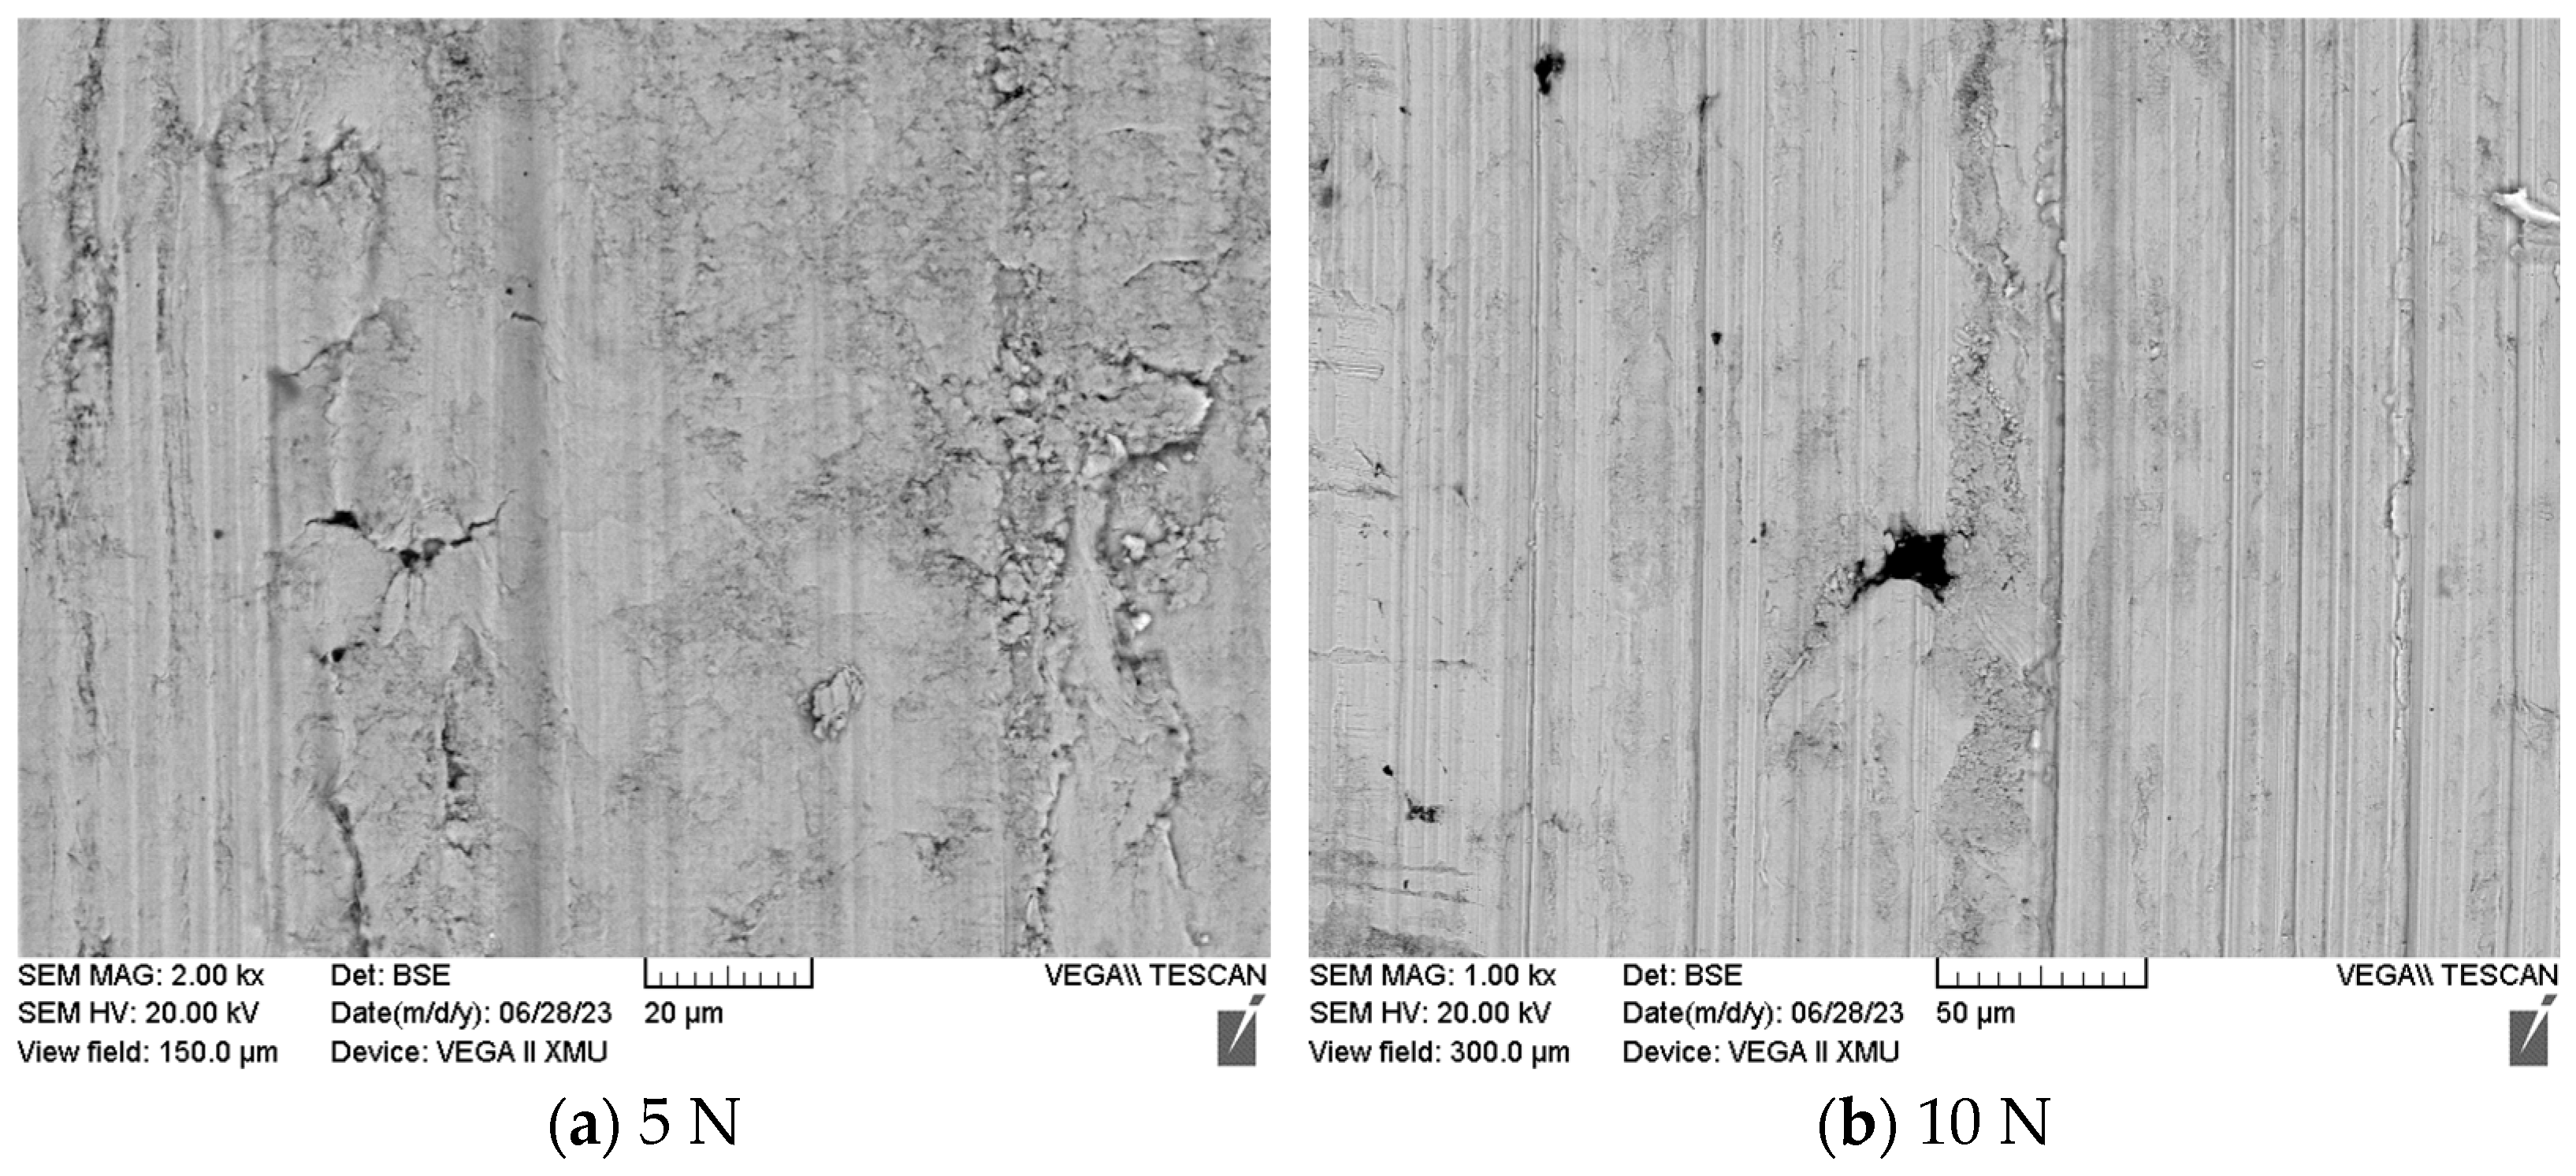
Subsequently, the back scattered electrons (BSE) of the worn surface were photographed by means of SEM, and the captured image is presented in
Figure 3.
As can be seen in
Figure 3, the back-scattered electron (BSE) images prove to be inadequate for clearly presenting the micro-cutting defects in the switch sliding baseplate caused by wear. Moreover, they fall short in effectively characterizing the specific details of wear defects. Hence, BSE images are unable to meet the requirements of the analysis of wear defects. Consequently, the scanning electron microscope (SEM) was further utilized to obtain secondary electron images of the wear surface.
Figure 4 showcases a series of images of wear defects on the worn surfaces that were captured in the form of the secondary electron images using the SEM at six distinct magnifications, namely 300x, 500x, 1kx, 2kx, 3kx, and 5kx.
The characteristics of the images of micro-cutting, which is a typical wear defect, can be clearly seen in
Figure 4. This clearly demonstrates that secondary electron (SE) images captured through SEM equipment are capable of effectively characterizing the wear defects of the switch sliding baseplate. Moreover, it further validates the feasibility of conducting research on the detection wear defects on the switch sliding baseplate by utilizing a dataset generated from such images.
As the test force increases, the wear grindings on the surface of the specimen become more conspicuous, as manifested by the appearance of deeper scratches and broader wear areas. However, digital cameras are subject to limitations when it comes to capturing these microscopic details. Consequently, it becomes rather challenging to reveal small wear defects like fatigue spalling and micro-cutting. Back-scattered electron (BSE) images are unable to clearly display micro-cutting defects on the switch sliding baseplate resulting from wear and are also incapable of accurately characterizing the specific details of wear defects. In contrast, secondary electron images allow for a clear observation of the characteristics of micro-cutting as a wear defect. Hence, this verifies that SE images obtained using SEM equipment can be employed to examine the wear defects on the switch sliding baseplate and also confirms the viability of using the dataset produced from this type of image for the detection of wear defects on the switch sliding baseplate.
3. Defect Detection Model
YOLO (You Only Look Once) represents a target detection algorithm whose core concept lies in treating the target detection task as a single regression problem. By doing so, it can achieve rapid and precise target localization as well as classification [
11].
YOLOv5 constitutes a significant advancement within the YOLO series. It not only inherits the advantages of prior versions but also incorporates numerous innovative elements. The algorithm utilizes a lightweight feature extraction network along with an adaptive model scaling strategy. This results in a faster detection speed and a lower consumption of computational resources, rendering it highly suitable for environments with stringent real-time requirements. During the training process, YOLOv5 integrates a variety of efficient data enhancement techniques, such as Random Image Enhancement and Mosaic Data Enhancement. These techniques serve to enhance the robustness and generalization ability of the model. In the post-processing stage, the accuracy and stability of detection are improved through methods like the adopted Non-Maximum Suppression (NMS) and dynamically adjusted category confidence thresholds.
YOLOv5 encompasses several variants, namely YOLOv5s, YOLOv5m, YOLOv5l, and YOLOv5x. Among them, YOLOv5s, as a small model, is especially well-suited for the real-time or near real-time inspection applications. Its lightweight nature also enables it to operate on resource-constrained devices, including mobile devices or embedded systems. Additionally, YOLOv5s is designed to possess a wide applicability across a diverse range of different target detection tasks and application scenarios. Thus, it strikes an optimal balance between speed, accuracy, applicability, and lightweight characteristics, making it an ideal choice.
The YOLOv5 model was chosen for the detection of micro-cutting defects arising from wear on the switch sliding baseplate. Given the specific characteristics of the collected image data, in order to identify these defects more effectively, the network structure was optimized in this regard to enhance its performance. For instance, the images of wear defects collected by the scanning electron microscope (SEM) might contain complex backgrounds, and the wear defects in the switch sliding baseplate could exist at multiple scales. Consequently, the YOLOv5 network model was improved through the optimization of three components: the backbone network, the neck network, and the detection head.
For the backbone network, integrating the Convolutional Block Attention Module (CBAM) into the original structure, as depicted in
Figure 5, proves to be highly beneficial. This integration empowers the model to recognize and learn key features more effectively. By focusing the model’s attention on the crucial aspects within the input data, it can better capture the relevant information for identifying the micro-cutting defects on the switch sliding baseplate. This way, the overall efficiency of the model in feature recognition and learning is significantly enhanced.
In the neck network, the adoption of a weighted bidirectional feature pyramid network (BiFPN) design within the existing structure, as illustrated in
Figure 6, plays a vital role. This design optimizes the integration of defective features at different scales. It enables the network to combine and utilize the feature information from various levels in a more refined manner. As a result, the network’s ability to extract the features of the micro-cutting defects on the switch sliding baseplate is strengthened, facilitating a more accurate detection of these specific defects.
Moreover, replacing the prediction frame loss function with the EIOU loss function constitutes an important improvement. The EIOU loss function is designed to provide a more accurate measure of the discrepancy between the predicted and actual bounding boxes. This helps in better localizing the micro-cut defects during the detection process, reducing errors in positioning and ultimately enhancing the performance of the model in accurately identifying and marking these defects on the switch sliding baseplate.
The integration of the CBAM (Convolutional Block Attention Mechanism) module into the YOLOv5s model plays a crucial role in retaining more valuable information. By incorporating this attention mechanism, the model can focus more effectively on the key features within the input data, thereby enhancing its overall performance in detecting relevant targets.
In the neck structure of the original YOLOv5s model, a specific design that combines the Feature Pyramid Network (FPN) and the Path Aggregation Network (PAN) was adopted. In this combined design, the FPN employs a top-down strategy for information transfer. Specifically, up-sampling techniques are utilized to transfer and merge the semantic features from the higher layers to the lower layers. Subsequently, the prediction task is carried out on the fused feature maps. This hierarchical approach to feature transfer and its combination with the neck structure helps with integrating information from different levels of the feature hierarchy, enabling the model to make more accurate predictions by leveraging the complementary nature of features from various layers.
CIOU (Complete Intersection over Union), as a frequently utilized loss function, fails to take into consideration the specific disparities between width and height as well as target confidence. Such a treatment might lead to difficulties for the model in effectively identifying similarity features during the optimization process.
To address this challenge, the decision was made to adopt the
EIOU (Enhanced Intersection over Union) loss function in lieu of the original one.
EIOU builds upon
CIOU by independently considering the difference between width and height, rather than just focusing on the aspect ratio. This additional consideration enables it to offer a more precise measurement regarding the degree of matching between bounding boxes. The formula for
EIOU is presented as follows:
where
wc and
hc denote the width and height of the minimum bounding box that encompasses the two boxes in question. The
EIOU loss function plays a crucial role in enhancing the accuracy of model training, as it is capable of evaluating the degree of matching between the two bounding boxes in a more precise manner.
Rather than being confined to merely considering the simple distance between the two boxes, as is the case with conventional approaches, the EIOU loss function delves deeper into the geometrical properties of the two boxes. Specifically, it takes into account their dimensional differences, with particular emphasis on width and height. This refined approach exhibits remarkable advantages in optimizing the accuracy of small target detection. By reducing the number of False Positives, it effectively bolsters the recognition ability of the model, enabling it to perform more accurately and reliably in identifying the target objects within the given dataset.
4. Experimental Validation
4.1. Experimental Parameters
All of the network model testing experiments were carried out within a laboratory server.
Table 2 presents specific details regarding the hardware configuration, providing essential insights into the computational resources and setup utilized during the experimental process.
The Pytorch framework was employed to implement both the YOLOv5 model and the improved YOLOv5 model for the purpose of conducting testing experiments. The specific details of the software environment are presented in
Table 3 below, which offers crucial information regarding the programming environment and related software settings utilized throughout the experimental process.
In the training phase of the model, the selection of appropriate training parameters plays a pivotal role in determining the final performance of the model. The learning rate, which acts as the step size when the optimizer updates the weights, has a direct impact on the model’s performance. If the learning rate is set at a relatively low value, it will lead to a slow learning process for the model, necessitating a greater number of iterations to achieve the optimal result. Conversely, an overly high learning rate may cause the model to exhibit fluctuations or even fail to converge properly. Hence, a reasonable adjustment of the learning rate is of utmost importance to ensure stable learning and the rapid convergence of the model. Moreover, the number of iterations of the model determines the termination point of the training process. Halting the training too prematurely might result in the model being unable to adequately learn the features of the data. On the other hand, excessive training could trigger overfitting, thereby impairing the model’s generalization ability on new data. The number of samples processed in a single batch is typically constrained by hardware resources. While increasing the number of iterations can enhance the training efficiency, this must be carried out within the limits of the system’s resources. Taking all these factors into account, this study configured the training parameters of the network model as shown in
Table 4.
4.2. Performance Evaluation Indicators
Target detection is a comprehensive task that occupies a significant position within the realm of computer vision. It entails not only recognizing the target categories in an image and assigning confidence scores to them but also precisely determining the exact location of the targets. This task differentiates itself from simple image categorization as it demands that multiple dimensions be taken into account when evaluating the performance of a target detection network. To guarantee the validity and credibility of the experimental results, this study employs a set of scientific evaluation criteria to quantify the performance of the model. In the experiments, evaluation metrics such as the precision rate, recall rate, and mean Average Precision (mAP) are utilized to objectively assess and compare the performance of different models.
Among the evaluation criteria for target detection, TP (True Positive), TN (True Negative), FP (False Positive), and FN (False Negative) are the crucial metrics for evaluating the performance of classification models. Specifically, TP represents True Positives, which refers to correctly recognized positive samples. TN stands for True Negative, signifying correctly predicted negative samples. FP indicates False Positives, meaning misclassified positive negative samples. FN represents False Negatives, denoting misclassified negative positive samples. The meanings of these four classification results are presented in
Table 5 below:
Precision is defined as the ratio of the number of samples that are correctly identified as positive to the total number of instances that are judged to be positive. Mathematically, it can be calculated using the following formula:
Recall represents the ratio of the number of positive samples that are correctly predicted as positive samples to the total number of instances where the true result is a positive sample. Its calculation is presented by the formula below:
Average Precision (AP) constitutes a key factor when carrying out target identification. This factor is not determined by a single precision and recall value but is derived by constructing the area under the Precision–Recall Curve (PR Curve). In the graphical representation of the PR Curve, the recall rate is plotted along the horizontal axis, while the precision rate is plotted along the vertical axis.
The
AP metric serves as a statistical measure of a model’s recognition performance. It reflects the overall performance of the model in accurately detecting targets across different confidence thresholds. The details of its calculation process can be expressed in the following manner:
Mean Average Precision (
mAP) is indeed one of the key evaluation metrics. It represents the mean value of the average precision across all categories and is employed to measure the accuracy of the network model in detecting targets across all categories. The formulation of
mAP is specifically as follows:
MAP@0.5 indicates the composite average of the individual category accuracies when the Intersection over Union (IOU) threshold is set to 0.5. In contrast, mAP@0.5:0.95 represents the reconciled mean of the accuracies of each category that are calculated under a series of IOU thresholds. These thresholds range from 0.5 and increment in steps of 0.05 up to 0.95.
4.3. Improved Validation Experiments Based on Wear Defect Datasets
The addition of the CBAM attention mechanism to the backbone network was intended to enhance the extraction of key information while suppressing the interference from irrelevant information. The experimental data obtained through comparative experiments conducted on the dataset of microscopic cutting defects in the switch sliding baseplate reveal that after incorporating the CBAM attention mechanism, the model witnessed improvements in several evaluation metrics. The Precision (P) increases by 0.76%, the Recall (R) by 0.23%, mAP@0.5 by 0.32%, and mAP@0.5:0.95 by 0.39%. These outcomes confirm that integrating the CBAM attention mechanism can enhance the effectiveness of the backbone network to a certain extent.
Regarding the convergence of the mAP@0.5 curve before and after the improvement of the backbone network, it essentially converges around 200 iterations. The mAP@0.5:0.95 curve converges at approximately around 250 iterations, with the average mean accuracy gradually reaching the optimal value. Moreover, after 250 iterations, the superiority of the improved model becomes increasingly evident, as the mAP@0.5 and mAP@0.5:0.95 values obtained from the improved model are higher than those of the original model. This demonstrates the feasibility and effectiveness of adding the CBAM attention mechanism to the backbone network.
In the neck network part, the adoption of the BiFPN network structure improves upon the PANet structure used in the original model. The aim here is to fuse more feature information without overly increasing the computational cost while maintaining the processing speed of the model. Comparative experiments on the dataset of microscopic cutting defects in the switch sliding baseplate show that with the introduction of the BiFPN structure, the model achieves significant enhancements in key performance metrics such as precision (P), recall (R), mAP@0.5, and mAP@0.5:0.95. Specifically, P improves by 1.49%, R by 4.68%, mAP@0.5 by 7.59%, and mAP@0.5:0.95 by 6.92%. This verifies the significant advantages of applying the BiFPN structure to the neck network.
Both models before and after the neck network improvement generally converge around 250 iterations, and the average mean accuracy gradually reaches the optimal value. Additionally, after 50 iterations, the mAP@0.5 and mAP@0.5:0.95 values of the improved model are much higher than those of the original model. This indicates that using the BiFPN structure in the neck network substantially improves the model’s performance and proves the superiority of the proposed neck network improvement.
The replacement of the CIOU loss function in the original model with EIOU aims to achieve more accurate bounding box regression and reduce the localization error through the added penalty term, thereby enhancing the model’s performance and robustness in the target detection task. Comparative experiments on the dataset of microscopic cutting defects in the switch sliding baseplate demonstrate that the introduction of the EIOU loss function leads to significant improvements in the evaluation metrics of Precision (P), Recall (R), mAP@0.5, and mAP@0.5:0.95. Specifically, P is improved by 1.09%, R by 4.54%, mAP@0.5 by 7.11%, and mAP@0.5:0.95 by 6.47%. This confirms that adopting the EIOU loss function effectively boosts the model’s performance, resulting in the better performance of the improved model on the switch sliding baseplate micro-cutting defect dataset.
The mAP@0.5 curve before and after the loss function improvement basically converges around 200 iterations, and the mAP@0.5:0.95 curve converges around 250 iterations, with the average mean accuracy gradually reaching the optimal value. Meanwhile, after 50 iterations, the green curve (representing the improved model) is significantly higher than the red curve (representing the original model), indicating that both the mAP@0.5 and mAP@0.5:0.95 values obtained by the improved model are much higher than those of the original model. This proves the effectiveness and superiority of replacing the loss function with EIOU. Furthermore, the improved test experiments were also carried out based on the NEU-DET dataset.
4.4. Improved Test Experiments Based on the NEU-DET Dataset
In order to further validate the effectiveness and generalization ability of the aforementioned improvement strategy, we opted to utilize the NEU-DET dataset from Northeastern University for the improved test experiments. This dataset was chosen because it bears greater similarity to the defect images in this paper, making it suitable for conducting performance tests on the improved method. The NEU-DET dataset encompasses gray-scale images of six different defects present on the surface of hot rolled steel strips, with a cumulative total of 1800 defects.
Three sets of test experiments were carried out under identical configurations and training parameters. Specifically, the performance on this dataset was tested both before and after the improvement of the backbone network, before and after the improvement of the neck network, and before and after the improvement of the loss function, respectively.
Table 6,
Table 7 and
Table 8 separately compare the test results of the original model with those of the models after the improvement of the backbone network, neck network, and loss function. These comparisons provide a clear and objective basis for evaluating the impact of each improvement measure on the model’s performance when dealing with the NEU-DET dataset.
Figure 7 presents the variation curves for mAP@0.5 during the training process for both the YOLOv5s model and the YOLOv5s + CBAM model. These curves can offer insights into how the addition of the CBAM attention mechanism affects the performance of the YOLOv5s model in terms of mAP@0.5 as the training progresses.
Figure 8 showcases a change curve for mAP@0.5 during the training for the YOLOv5s model and the YOLOv5s + BiFPN model. By observing this curve, one can analyze the impact of incorporating the BiFPN structure into the YOLOv5s model on its mAP@0.5 performance throughout the training.
Figure 9 displays the variation curves for mAP@0.5 during the training for the YOLOv5s model and the YOLOv5s + EIOU model. Through these curves, it becomes possible to understand how replacing the loss function with
EIOU influences the mAP@0.5 performance of the YOLOv5s model during the training phase.
The test results mentioned above were derived from comparisons made before and after the improvements were implemented, utilizing the public dataset NEU-DET. Looking at the three tables presented previously, it is evident that the four key indicators, namely Precision (P), Recall (R), mAP@0.5, and mAP@0.5:0.95, for the model’s test results have all witnessed improvements following the three improvement measures. Furthermore, by observing the three comparison graphs of mAP@0.5 before and after the improvements, it can be seen that after 250 rounds of iteration, the enhanced performance of the improved models gradually becomes more prominent. In all cases, the values of these improved models are higher than those of the original model. This clearly demonstrates the effectiveness and generalization ability of the three improvement strategies that have been proposed. Simultaneously, from these three comparison graphs, it is noted that the variation in the curves throughout the entire training process is relatively large. This is primarily due to the relatively smaller number of samples in this dataset. A smaller sample size can lead to greater fluctuations in the training process and result in more significant variations in the curves, which reflects the influence of the dataset’s characteristics on the model training and performance evaluation.
4.5. Ablation Experiments
To thoroughly assess the effectiveness and accuracy of the three optimization strategies proposed for the YOLOv5s model, further ablation tests were carried out on a specifically prepared dataset of microscopic cutting defects in a switch sliding baseplate. The purpose of these ablation tests was twofold. Firstly, they aimed to test each improvement measure separately to understand its individual impact on the model’s performance. Secondly, they were designed to evaluate how the combination of two different improvement strategies would affect the performance. In this study, all three optimization strategies were integrated into the network model, and then experimental verification was conducted to confirm the positive effects these improvements had on the model’s performance. Specifically, in the proposed improved model, the CBAM attention mechanism was added to the basic network architecture of the YOLOv5s model. In the neck network part, the original PANet structure was replaced with the BiFPN feature fusion structure. Additionally, for the detection head, the CIOU loss function was replaced with the EIOU loss function. Through these modifications, it was ultimately determined that the model incorporating the combination of these three improvement methods achieved the best results. The experimental results obtained from these efforts are presented in
Table 9, which provides a detailed and objective basis for analyzing and understanding the specific performance enhancements brought about by these improvement strategies and their combination.
From the table in question, it can be seen that the average Mean Precision mAP@0.5 of the original model YOLOv5s is 0.6353. The second, third, and fourth rows of the table, respectively, showcase the optimization results achieved by the three improvement strategies within the original model’s network structure. It is evident that regardless of which improvement measure is applied to which part of the original model, the detection results are correspondingly enhanced, and these enhancement effects are quite pronounced. At the same time, based on the data in the table, it is clear that the performance improvement is most significant after the introduction of the BiFPN feature fusion structure. Consequently, the subsequent experiments were carried out with the neck network replaced by the BiFPN structure. Optimization experiments were then conducted on its backbone network, and improvement experiments were performed on the loss function, respectively. The experimental results indicate that, when the neck network is replaced by the BiFPN structure, adding either the CBAM attention mechanism to the backbone network or replacing the loss function with EIOU can enhance the detection performance of the model to a certain extent. Among these, the YOLOv5s + BiFPN + EIOU model has the most significant effect on improving the accuracy rate for P.
The experimental results further demonstrate that the comprehensively improved model, namely YOLOv5s + BiFPN + CBAM + EIOU, attains the optimal levels in key metrics such as recall R, average precision mean mAP@0.5, and mAP@0.5:0.95. Compared to the original YOLOv5s model, this improved model witnesses an increase in precision P by 1.26%, recall R by 5.6%, mAP@0.5 by 9.13%, and mAP@0.5:0.95 by 8.92%.
Overall, the YOLOv5s + BiFPN + CBAM + EIOU model combines the advantages of the three improvement measures and exhibits a superior performance. To vividly display the outstanding performance of the proposed improved model, the entire training process is presented.
Figure 10 and
Figure 11, respectively, illustrate the performance curves of the different models mentioned above in relation to the number of iterations for the mAP@0.5 and mAP@0.5:0.95 metrics. These figures can help with visually comparing and analyzing the performance differences among the models during the training process and further confirm the superiority of the comprehensively improved model.
By observing these graphs, one can clearly identify that all the network models display similar convergence patterns. Specifically, in terms of the mAP@0.5 metrics, they generally reach a stable state after approximately 200 iterations. For the mAP@0.5:0.95 metrics, they tend to stabilize after around 250 iterations. Moreover, it is quite evident that the YOLOv5s + BiFPN + CBAM + EIOU model performs significantly better than the other network models when it comes to both evaluation metrics. This fact verifies that implementing the BiFPN feature fusion strategy within the neck network plays a crucial role in enhancing the model’s performance. Additionally, it shows that the fusion model, which combines the three improvement methods, achieves an even more outstanding performance. As a result, the improved model, YOLOv5s + BiFPN + CBAM + EIOU, is highly suitable for detecting the micro-cutting defects that arise from wear on the switch sliding baseplate.
Furthermore,
Figure 12 and
Figure 13 illustrate the trends of the loss for each of the network models mentioned above during both the training phase and the validation phase. These figures can provide valuable insights into how the loss values change over time for different models, which can further assist in analyzing and understanding the training process and the performance stability of these models.
Through the analysis of the figure, it can be observed that during both the training and validation phases of the model, the curves of the target loss and those of the target frame loss display the same trend. The optimized YOLOv5s + BiFPN + CBAM + EIOU model showcases lower loss values and a faster convergence speed. This phenomenon comprehensively demonstrates the superior performance of the improved network model in detecting micro-cutting defects in the switch sliding baseplate. In the initial training phases, it can be noticed that the loss profile of the validation process is on the rise. Typically, this can be ascribed to the insufficient size of the validation dataset. A relatively small validation dataset might not provide a comprehensive representation of the data distribution, resulting in fluctuations in the loss during the validation stage.
From the ablation experiments, the combination of the three improved models, denoted as YOLOv5s-BCE, was identified as the best improvement measure. To more vividly illustrate the actual detection effectiveness of the improved models for micro-cut defects on the switch sliding baseplate, another picture of the worn area was taken and then compared with the detection results of the original model, as depicted in
Figure 14. From this figure, it can be seen that the confidence level of the proposed YOLOv5s-BCE model for defect detection is more accurate. Meanwhile, the leakage and false detection rates of the original model have been reduced. These outcomes further verify the effectiveness of the improvement, highlighting that the enhanced model is indeed more capable of precisely identifying the micro-cutting defects and reducing errors compared to the original model.
4.6. Practical Validation Experiments
Since the current micro-defect detection for the switch sliding baseplate primarily relies on random sampling methods, it becomes necessary to verify the advantages of the improved algorithm in comparison to the traditional approaches for detecting micro-cutting defects in the switch sliding baseplate. To achieve this, a new set of wear and tear experiments was conducted. These experiments were carried out under different test loads, and the results of using the random sampling method and the improved detection algorithm for detecting micro-cutting defects were compared.
The chosen comparison method was simple random sampling, which involves selecting each defective region with an equal probability. For a wear-defective region of the switch sliding baseplate, if the image dataset of all wear defective regions captured by the Scanning Electron Microscopy (SEM) contains N samples and the number of samples to be sampled is n, the specific program implementation process is as follows. Firstly, a sample is randomly selected from the image dataset and placed into the sample collection. Secondly, the next sample is randomly chosen from the dataset, and if this sample is not already in the sample collection, it is added to it. Finally, the previous step is repeated until the sample collection contains n samples. The number of micro-cutting defects in a part of the image is then used to infer the number of micro-cutting defects in a section of the switch sliding baseplate.
For this experiment, six different sets of test loads, namely 5 N, 10 N, 15 N, 20 N, 25 N, and 30 N, were selected to conduct the new wear experiment. One specimen was used for each test load in the experiment. For the worn specimens obtained, images of the wear region were collected using an SEM. Specifically, 40 SEM images were collected for each specimen, and these images encompassed all the wear regions. By manually labeling the number of micro-cutting defects in these 40 images, the actual number of micro-cutting defects obtained from these six sets of experiments was compared with the results obtained by the random sampling method and those obtained by the improved YOLOv5s-BCE algorithm proposed here, respectively. A comparison of the results is presented in
Table 10.
Additionally, the differences between the detection results obtained by the different methods and the actual value were plotted for a comparative analysis, as shown in
Figure 15. These visual and tabular representations can help in clearly understanding the performance differences among the different detection methods and evaluating the superiority of the proposed improved algorithm in accurately detecting the micro-cutting defects under various test loads.
As can be observed from the figure, although there are instances where the results of the random sampling method are quite similar to the actual number of micro-cuttings, there are numerous groups where the error is substantial. Moreover, the fluctuations across different experiments are overly large. This indicates that this method possesses a high degree of randomness. In practical scenarios, the defects on the switch sliding baseplate are typically distributed unevenly. There are certain areas that may have a clustering of defects, while other areas might have very few defects. Such a distribution pattern results in significant deviations in the outcomes obtained through random sampling. Furthermore, random sampling relies on manual identification. This reliance not only demands a significant amount of human effort but can also greatly augment the computational cost and time overhead. As a consequence, it is further demonstrated that the algorithm proposed in this study offers an efficient solution for detecting micro-cutting defects in a switch sliding baseplate. It can overcome the drawbacks associated with random sampling methods, such as excessive randomness and high costs, and is thus more reliable and practical for accurately identifying and quantifying these micro-cutting defects.
4.7. Comparative Experiments of Different Algorithms
The optimal improved fusion model, YOLOv5s-BCE, was derived through the ablation experiments detailed in the previous section. In order to conduct a more comprehensive evaluation of the performance of this improved model, comparative experiments were carried out. These experiments involved comparing the improved model, YOLOv5s-BCE, with several other mainstream target detection algorithms on a self-made image dataset that consisted of microscopic cutting defects in a switch sliding baseplate. The outcomes of these comparison experiments are presented in
Table 11, which serves as a valuable resource for analyzing and understanding how the YOLOv5s-BCE model fares against other prevalent algorithms in terms of detecting specific micro-cutting defects within a given dataset.
From
Table 11 and
Figure 16, it can clearly be seen that the Precision (P), Recall (R), mAP@0.5 and mAP@0.5:0.95of the YOLOv5s model on the defect dataset outperform those of YOLOv4, YOLOv3, and Faster R-CNN. Moreover, its performance has become comparable to that of the YOLOv9 in terms of detection ability. This fact effectively showcases the superior performance of the YOLOv5s model when it comes to the task of detecting micro-cutting defects in the switch sliding baseplate. Meanwhile, the YOLOv5s-BCE model, which was obtained through improvements based on the YOLOv5s model, exhibits the highest indexes among them. For instance, the mAP@0.5 can reach up to 72.66%. Compared to other algorithms, this is 20.12% higher than Faster R-CNN, 13.63% higher than YOLOv3, 10.71% higher than YOLOv4, and 9.13% higher than the original YOLOv5s. Consequently, the proposed improved model, YOLOv5s-BCE, demonstrates a high accuracy rate. In contrast to the other algorithms, it presents a significantly reduced number of both false detections and missed detections. It also possesses a more accurate and comprehensive recognition ability to recognize micro-cutting defects in the switch sliding baseplate, making it a highly effective solution for this specific defect detection task.
Another image of the wear region was captured, and then the detection results of the improved model were compared with those of several mainstream algorithms, as depicted in
Figure 17. Looking closely at the figure, it becomes evident that the proposed YOLOv5s-BCE model presents significant advantages in the detection of micro-cutting defects. When compared with Faster R-CNN, YOLOv3, YOLOv4, and the original YOLOv5s, this model not only demonstrates better confidence in identifying the defects but also exhibits the lowest leakage and false detection rates. These characteristics further confirm the superior performance of the improved model, YOLOv5s-BCE. It showcases its enhanced capabilities to accurately detect micro-cutting defects and its superiority over other commonly used algorithms in this particular application scenario, highlighting its value and effectiveness for the task of identifying such defects on the switch sliding baseplate.


