Article

Thermodynamic Analysis Based on the ZL205A Alloy Milling Force Model Study

School of Mechanical Engineering, North University of China, Taiyuan 030051, China
*
Author to whom correspondence should be addressed.
Lubricants 2023, 11(9), 390; https://doi.org/10.3390/lubricants11090390
Submission received: 17 August 2023 / Revised: 5 September 2023 / Accepted: 6 September 2023 / Published: 11 September 2023
(This article belongs to the Special Issue Friction and Wear of Cutting Tools and Cutting Tool Materials)

Abstract

:
The ZL205A aluminum alloy is mostly used in automobiles, aircraft, aerospace, and other mechanical components, but now, it focuses on the study of its casting performance, and there is still a lack of research on its cutting performance. In this paper, the milling ZL205A aluminum alloy was milled for testing and simulation analysis. The milling test showed that the impact of the axial cutting depth, radial cutting depth, feed, and cutting speed on the milling force was successively reduced. A thermodynamic analysis model is proposed to evaluate the cutting force and tool design in milling. The model considers the front angle and friction angle of the tool, in which the friction angle is adjusted by the friction coefficient, the variable is the cutting parameter, the constant is fitted through the milling experiment, and the effectiveness of the model is verified to predict the milling force. The pre-grinding test was carried out before the experiment, and the stability of the test was proved by observing the macroscopic shape of the chip and the wear of the cutting edge. The model comprehensively considers the tool angle and quickly calculates the minimum load on the milling cutter based on the optimal geometric parameters, which can be used to optimize the milling cutter structure and provide a theoretical basis for the preparation of ZL205A aluminum alloy mechanical components.

1. Introduction

Since the 20th century, aluminum–copper cast aluminum alloys have been widely used in automotive, aircraft, and aerospace mechanical components [1,2]. Because of its good room temperature performance and high temperature resistance, ZL205A is an aluminum alloy with a tensile strength of up to 500 MPa and an elongation of up to 10% [3,4]. It has excellent comprehensive properties, such as mechanical processing, electroplating, stress corrosion resistance, etc. It is suitable to produce large-forced structural parts [5]. Due to the complex content of ZL205A material alloy elements, and with a wide crystallization range and various uncertainties in the casting process, various defects often occur, resulting in organizational performance that does not reach the service requirements [6,7]. Most researchers have carried out research on how to improve the strength of aluminum alloys [8,9]. However, the component has plane, hole, and other cutting structures, resulting in a direct impact on the service performance of the component in the application process [10,11]. Therefore, it is of great practical significance and engineering value to carry out research on the machinability of aluminum alloys.
There are numerous problems in milling, such as the breakage of the milling cutter, the vibration of milling, etc., which are largely caused by the action of milling force [12]. In the milling process, the milling force will directly affect the generation of cutting heat and have an impact on tool wear, machining accuracy, and the workpiece-processed surface quality [13]. Therefore, it is of great significance to study and establish a mathematical model of the cutting force of the Z205A aluminum alloy. The research on milling force is mainly divided into empirical models based on experimental verification [14], finite element models [15], and analytical models [16].
The American scholar Merchant [17] established a cutting theory with shear slip as the main feature of right-angle free cutting as the basic model. E.H. Lee and B.W. Shaffer [18] deduced the calculation formula of the shear angle by constructing a sliding line field model of right-angle free cutting. P.L.B. Oxley [19] studied the strain rate and strain hardening of the material in the cutting process and proposed a cutting model with a parallel quadrilateral cutting surface. E.D. Doyle [20] established a cutting model considering knife-chip friction. Zhang, X. [21] discussed the influence of tool geometry parameters on milling force by establishing an empirical model considering quadratic polynomial factors. Zhu, S. [22] proposed a milling force prediction model based on the Taylor factor to study the influence of different milling parameters on the evolution of surface organization. Chen, Y.H. [23] proposed a tool radial jump milling model considering the static jump of the tool for batch precision machining. Su, X. [24] proposed a milling force model applied to complex contour milling cutters. Over the years, most scholars have focused on analyzing milling models from multiple cutting angles, but this inevitably increases the complexity of prediction, so this study is committed to proposing a fast and effective milling force model. In addition to the influence of friction on material properties [25,26,27], friction in milling cannot be ignored [28], so this study adjusted the friction angle by adjusting the friction coefficient.
This study proposes a milling force model in the ZL205A aluminum alloy based on thermodynamic analysis and verifies the effectiveness of the model through milling tests. The model considers material properties and tool structure (tool front angle, friction angle), where the friction angle is calculated by the friction coefficient. This research provides a theoretical basis for optimizing the tool structure of the milling cutter and provides a theoretical basis for the preparation of mechanical components for automobiles, aircraft, and aerospace with the ZL205A aluminum alloy, making the use of the material more convenient.

2. Experimental Woke

The milling test was carried out to analyze the cutting process of the ZL205A aluminum alloy. The following will introduce the workpiece materials, milling cutters, NC machine tools, dynamometers, and the tests that were carried out.

2.1. Workpiece Materials
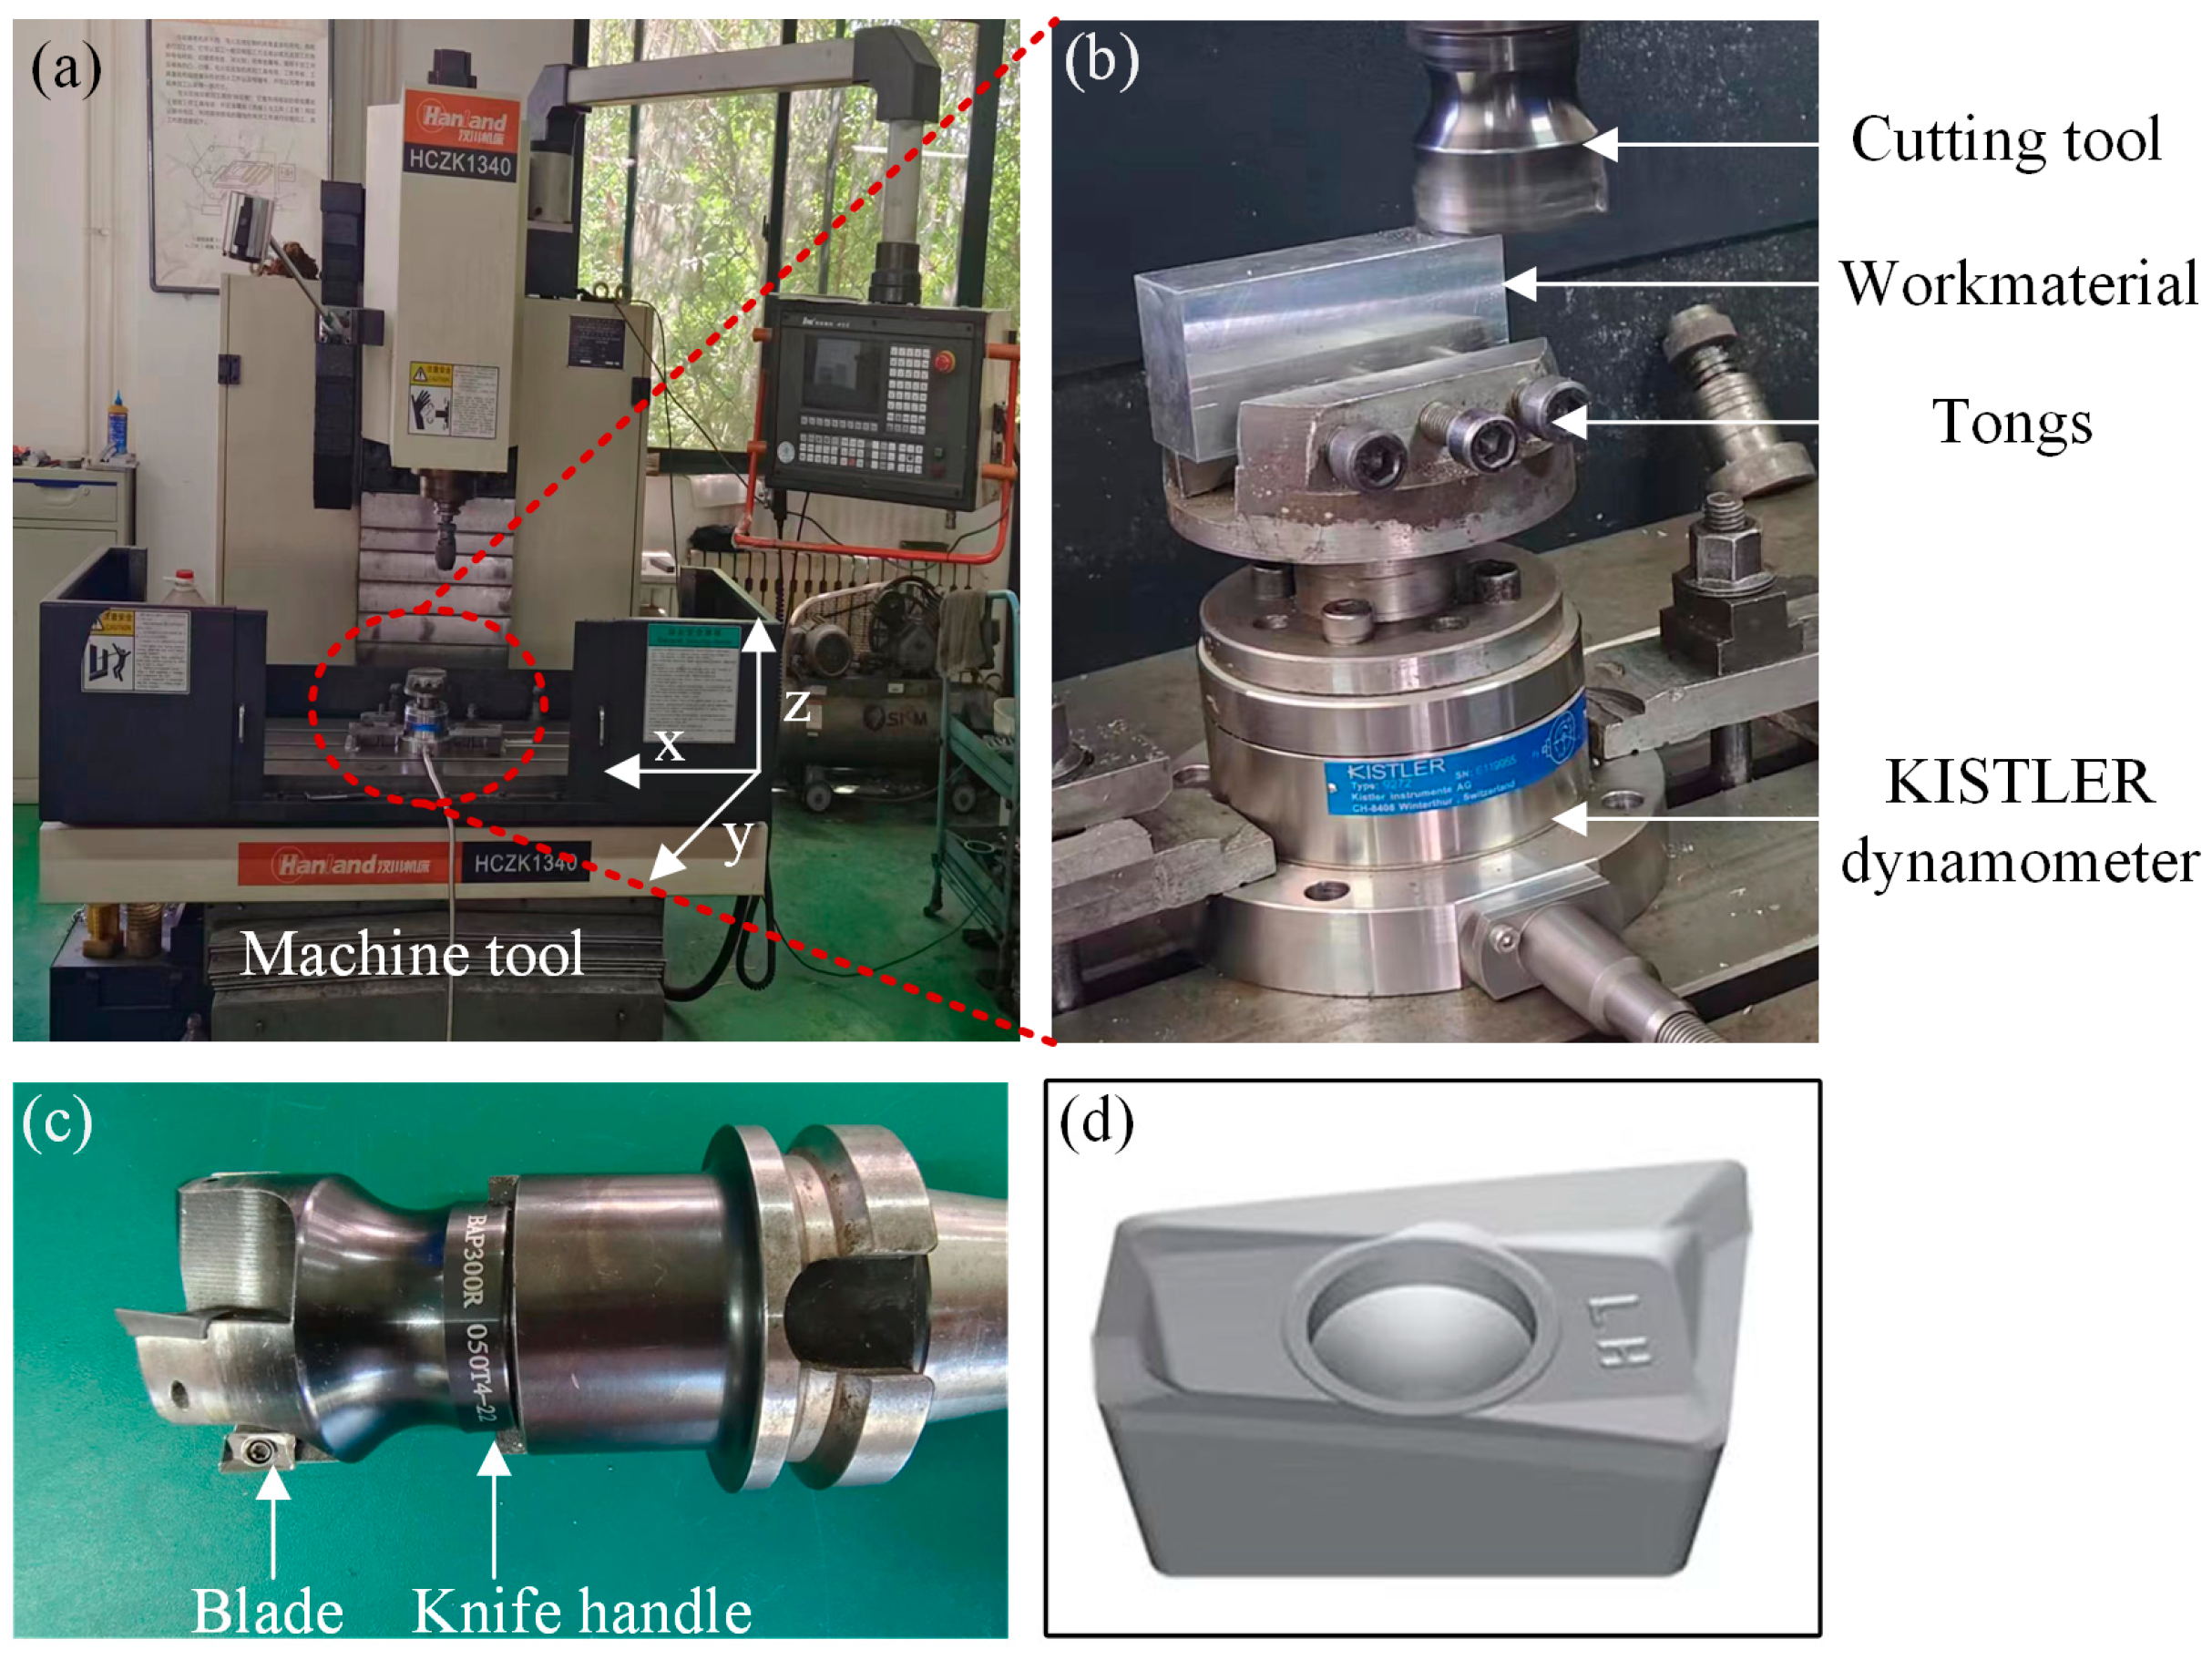
The mechanical characteristics of the ZL205A aluminum alloy are shown in Table 1. The Johnson–Cook constitutive model and Johnson–Cook damage model were established for quasi-static tensile, Hopkinson rod, and high-temperature tensile tests. Considering the impact of adiabatic temperature rise, parameter C was corrected. The model was verified by quasi-static smooth stretching, Hopkinson rod, and high-temperature tensile tests, and the maximum error of the model did not exceed 4%. The chemical composition of the ZL205A aluminum alloy is shown in Table 2.

2.2. Milling Test

The CNC machine tool adopts HCZK1340 machine tool designed by Zhengdang Precision Machinery Co., LTD., Shenzhen City, Guangdong Province, China; as shown in Figure 1a, the tool handle adopts WINIO Winon BAP300R 050T4-22 CNC cutter head from Taiwan Province, China; as shown in Figure 1c, the tool adopts APKT11T308-LH milling cutter of Diamond Factory, Zhuzhou City, Hunan Province, China; as shown in Figure 1d, the dynamometer adopts the Swiss KISTLER four-part measurement system by installing the KISTLER four-part dynamometer on the CNC machine tool, using a fixture to connect the dynamometer to the workpiece, as shown in Figure 1b. Water soluble cutting fluid from Dr. You of Shenzhen City, Guangdong Province, China was used in the test.

2.3. Measure the Axial Force

The purpose of this experiment is to identify the relatively stable cutting range in the milling process of a given tool/workpiece material. The milling test is carried out by changing the cutting parameters of the cutting speed, feed speed, axial cutting depth, and radial cutting depth. The cutting parameters are designed according to the cutting conditions recommended by the tool manufacturer. For the ZL205A aluminum alloy, the cutting speed, feed per tooth, axial cutting depth, and radial cutting depth are 200 m/min, 0.3 mm/r, 2 mm, and 15 mm, respectively. The milling tests carried out are shown in Table 3. Each set of tests is repeated 4 times, and new blades are used each time. No tool acceleration or early grinding was detected during all testing processes, and conventional chips were formed. Therefore, the milling test can be regarded as stable cutting.
The axial cutting force was recorded by the KISTLER four-component dynamometer. Figure 2 shows the variation trend of the axial cutting force with cutting speed, feed rate per tooth, axial cutting depth, and radial cutting depth. The axial milling force increases with the increase in cutting speed, feed rate, axial cutting depth, and radial cutting depth.

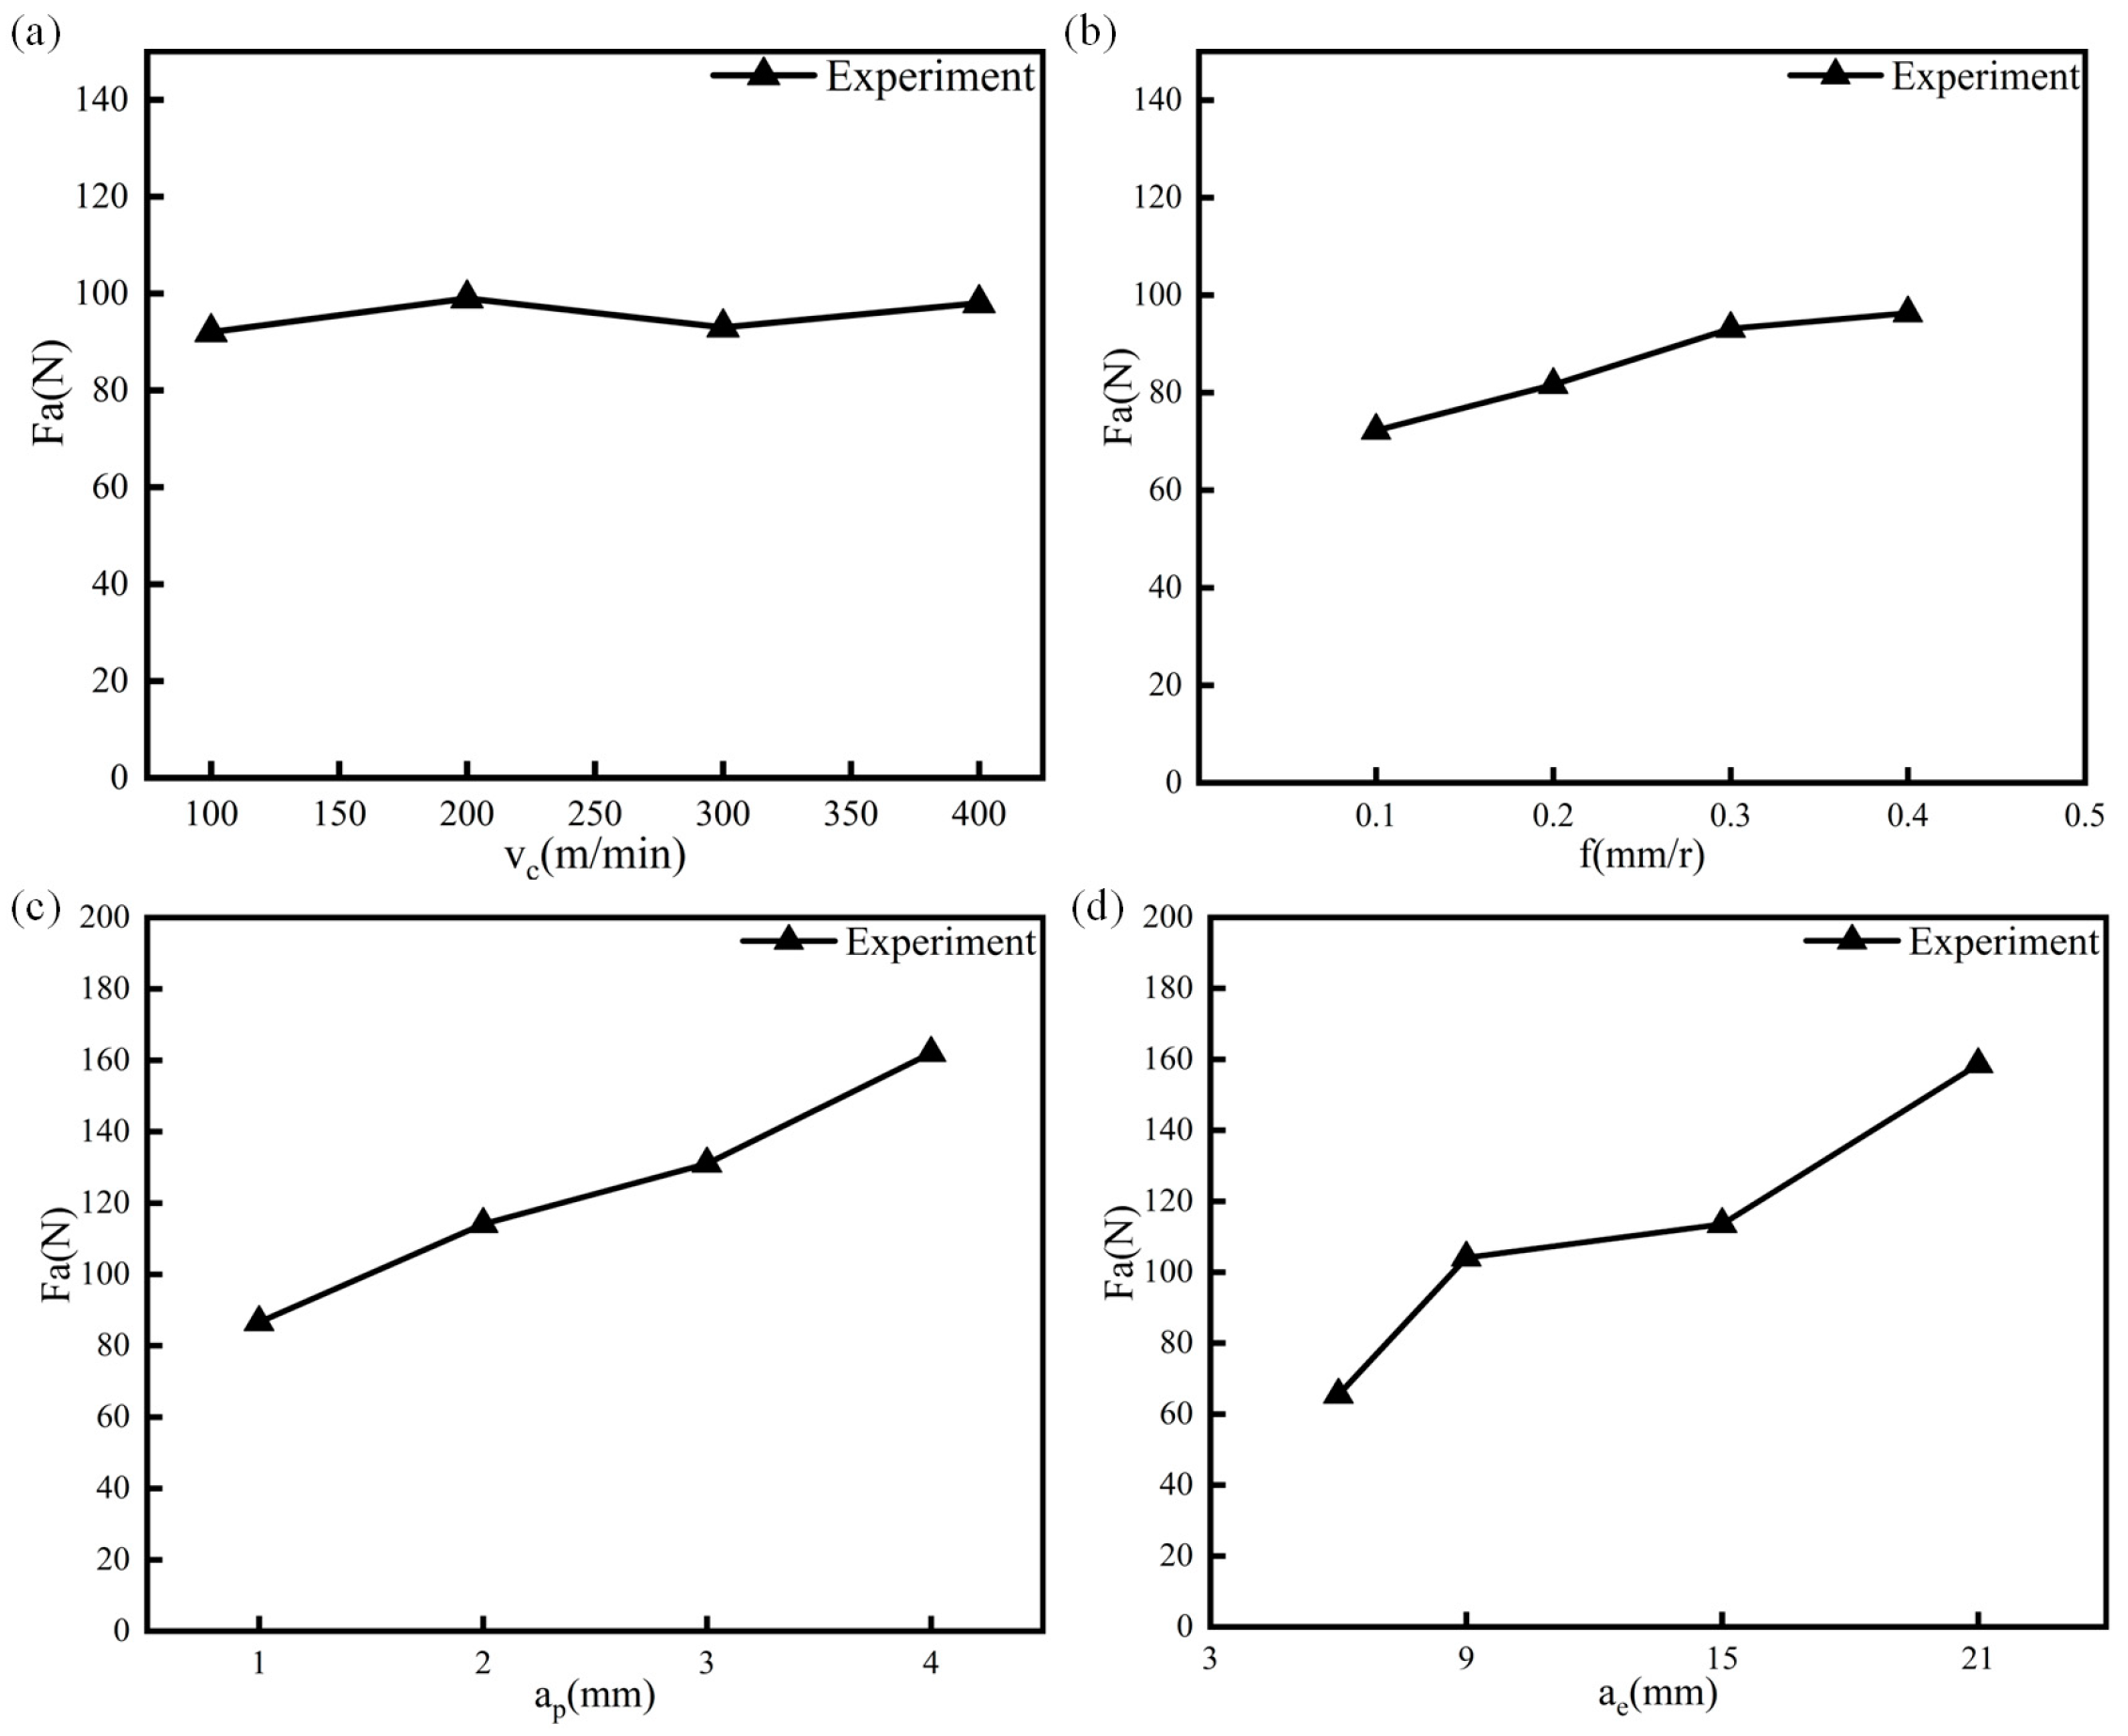
2.4. Cutting Performance

By observing the chip shape and tool wear, the stability of the milling process in each milling experiment is verified using Japan’s KEYENCE ultra-depth-field microscope to observe chips. Figure 3 shows the change in chip macroscopic morphology with the change in parameters, and the number in the figure corresponds to the experimental number in Table 3.
The influence of the radial cutting depth, axial cutting depth, feed volume, and cutting speed on the chip is successively reduced. The ZL205A aluminum alloy will generate continuous chips under the cutting parameters of the test design. Even if the cutting speed increases, the macroscopic change in the chips is not obvious (Figure 3a). Increasing the feed (Figure 3b) and cutting depth (Figure 3c,d) will increase the cutting speed in the unit and the removal amount. As a result, the extension length of the chip in the cutting area increases so the chip length becomes longer, and the length deformation coefficient lessens (Figure 3b). When the axial cutting depth increases, it causes greater cutting force and cutting heat, which will affect the cutting force distribution and chip formation mode in the cutting area.
Figure 4 shows tool wear. The new blade (Figure 4a) is compared with the blade used in the milling test (Figure 4b). The four blades are all stable.

3. Thermoviscoelastic Model for Predicting Milling Forces

The mathematical model of cutting force is often limited by the workpiece material, tool, etc., and is effective within the range of the available data. Therefore, the verification of the mathematical model of cutting force should be completely based on the test data. The thermodynamic analysis model established in this paper, combined with the material performance parameters, tool structure, and cutting parameters, can quickly evaluate the cutting force of the milling ZL205A aluminum alloy. The analysis method involves the material performance and the law of contact/friction, and the equation is established based on certain assumptions.

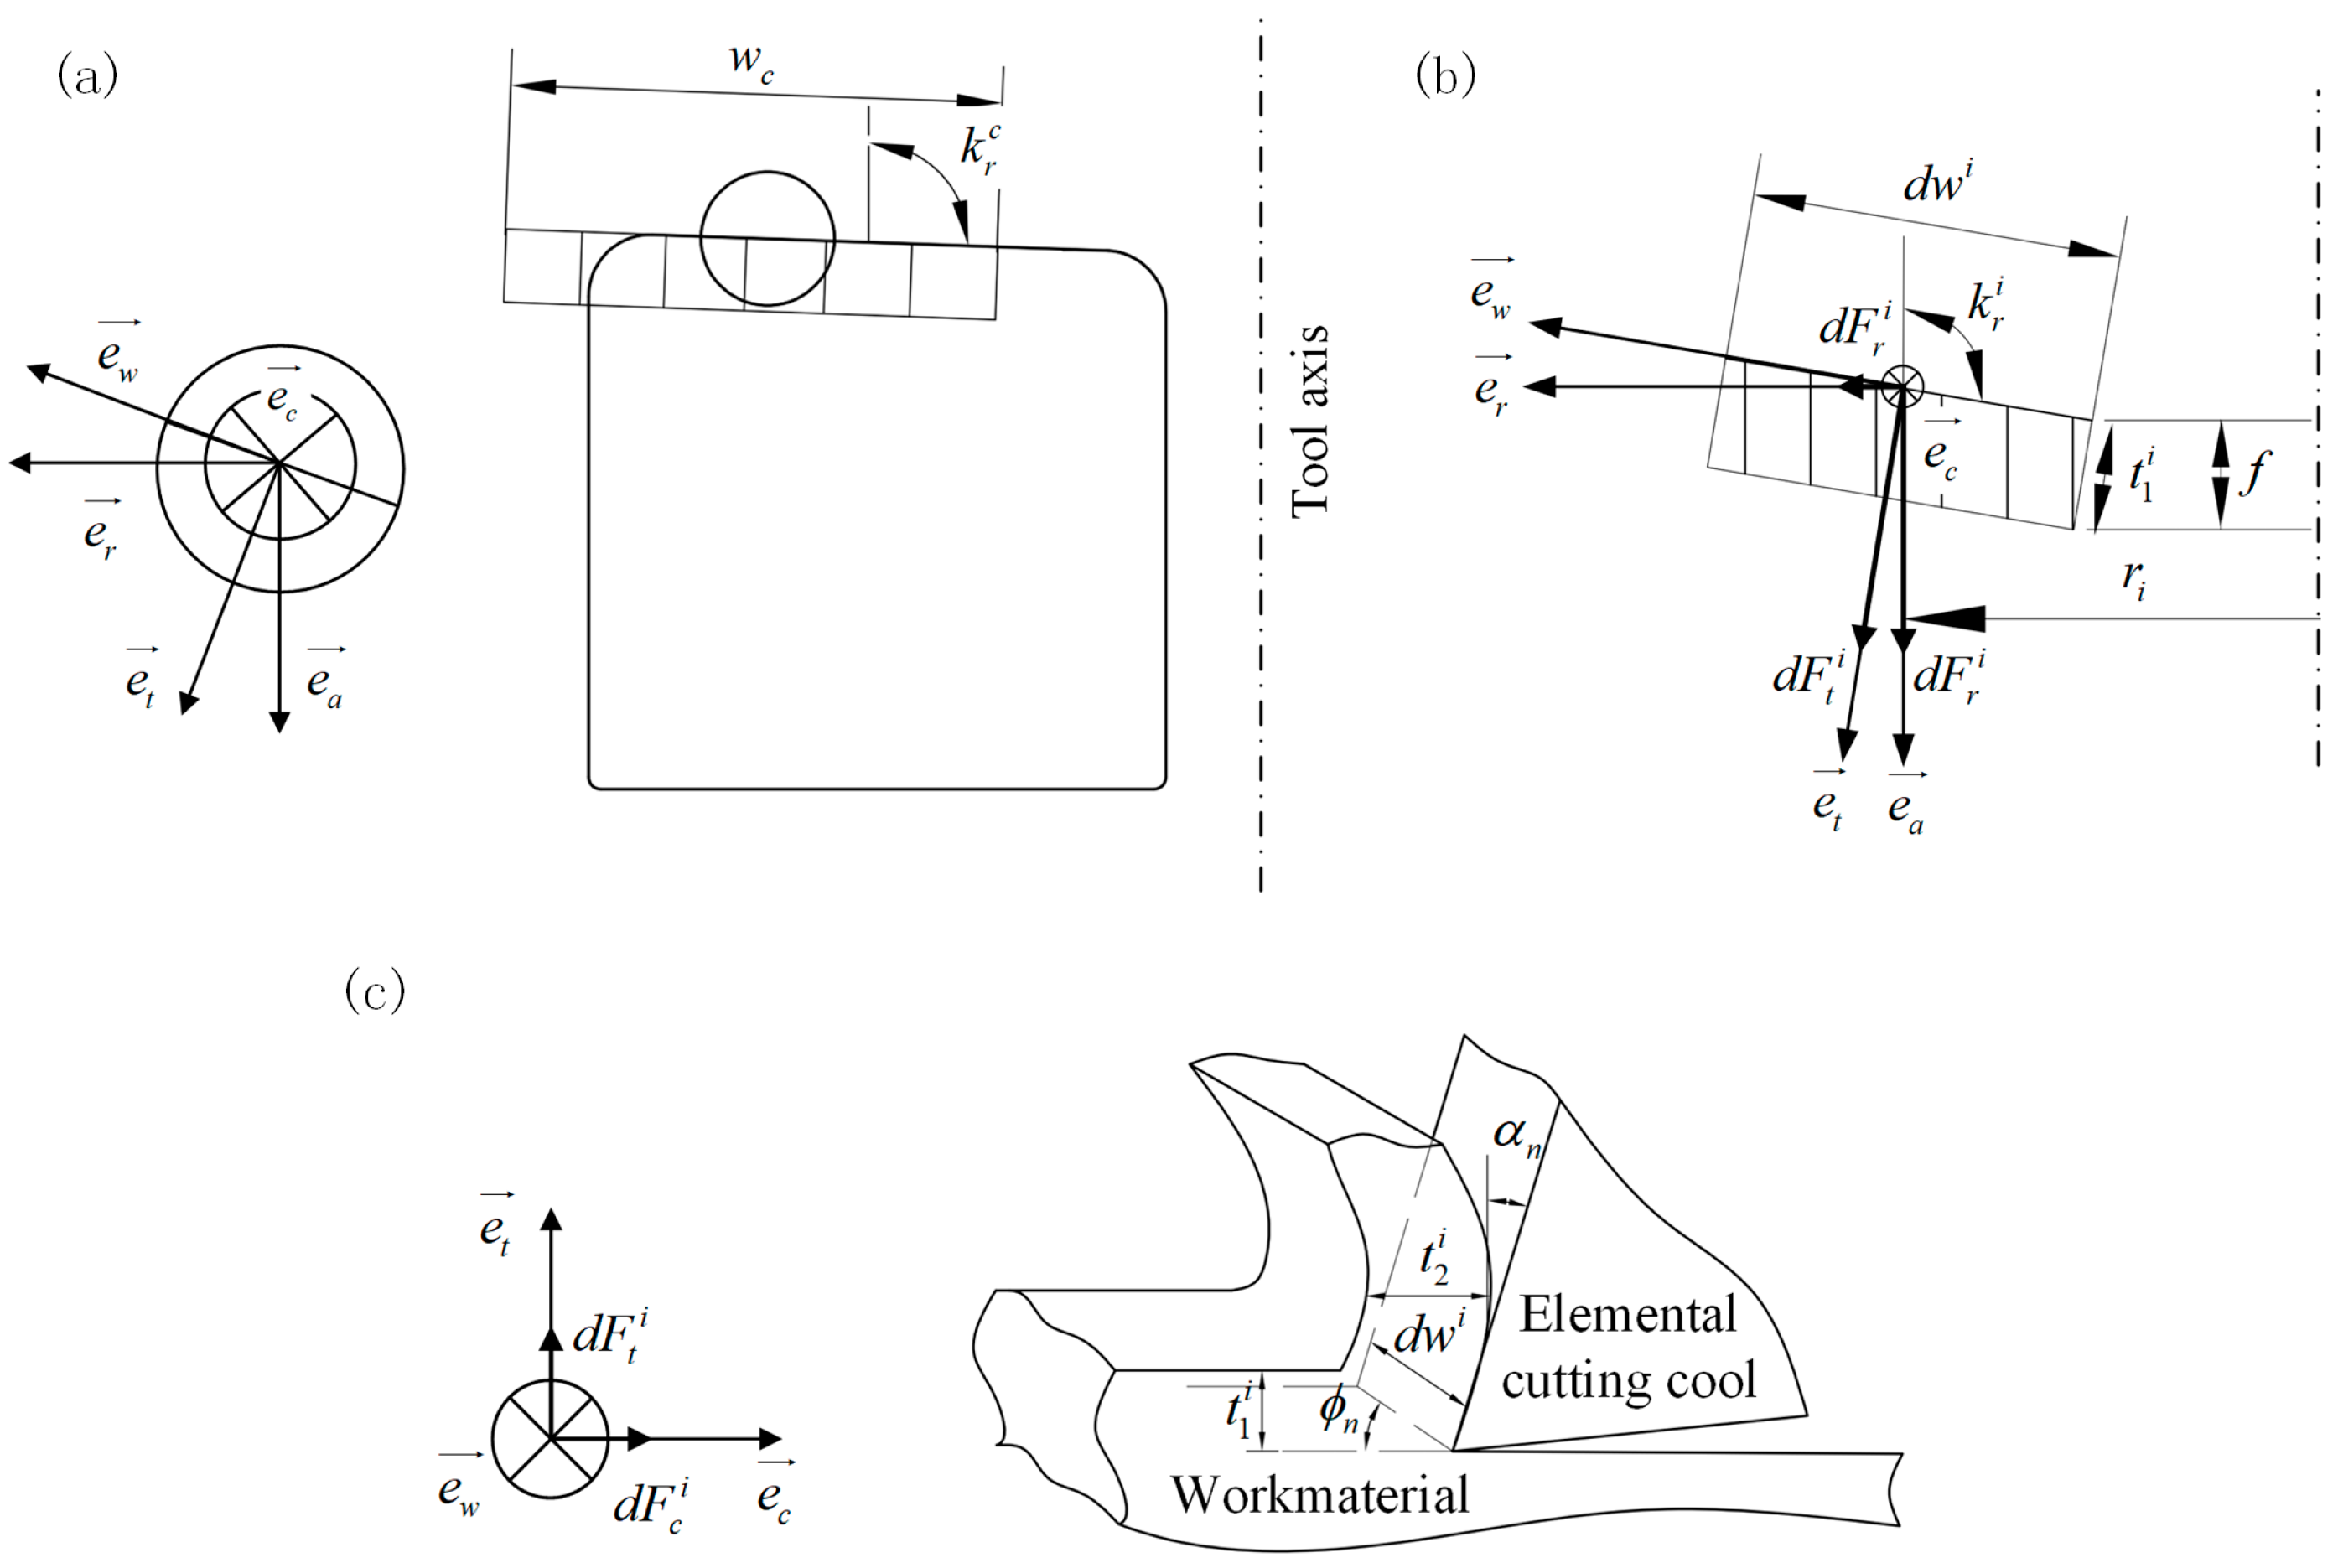
3.1. Modeling of Cutting Forces

During the milling process, the cutting layer and internal workpiece undergo elastic and plastic deformation resistance, chip outflow, and friction between the workpiece movement and the tool. These combined forces acting on the tool can be decomposed into three parts. It is assumed that lubrication during milling is indirectly considered by adjusting the friction coefficient in the mathematical model of milling forces.
By discrediting the milling cutter, the local coordinate system Oxyz of the tool is established, with the center of the circle on the base of the milling cutter as the coordinate origin, the direction of the milling cutter axis as the z-axis and upward as the positive direction, and the direction of the intersection of the cutting edge on the base circle of the milling cutter from the origin pointing to a certain cutting edge as the y-axis. Based on the idea of discrete milling edges, the spiral milling edge cutting into the workpiece part is divided axially into a certain number of micro-element cutting edges, i.e., the dz section in the diagram. The cutter teeth are numbered j. The cutting edge with the starting point on the y-axis is recorded as blade number 1 and is numbered sequentially in the direction of the helix, and the cutter teeth micro-elements are numbered i and are numbered sequentially in the direction of the helix, with a maximum number of N.
The force applied to the workpiece is derived from the force applied to each micro-element of the workpiece. The component of the combined force applied to the workpiece is calculated by calculating the component of the combined force for each micro-element. Figure 5 illustrates the micro-element of the milling cutter edge and the applied force.
The results applied to the workpiece can be expressed in terms of tangential milling forces, radial milling forces, and axial milling forces as follows:
F c = j = 1 4 F c j , F r = j = 1 4 F r j , F a = j = 1 4 F a j
where F c , F r , F a are tangential, radial, and axial forces, respectively.
Where the components of the milling synthesis force ( F c j , F r j , F a j ) can be calculated by integrating the components of the milling force. This is shown below:
F c j = d F c , F a j = d F a , F r j = d F r
By discrediting the edges of the milling cutter, the synthetic components of each cutting edge are summed as follows:
F c j = i = 1 N Δ F c j , F r j = i = 1 N Δ F r j = i = 1 N Δ F r j Δ F f i , Δ F c i , F a j = i = 1 N Δ F a j = i = 1 N Δ F a j Δ F f i , Δ F c i
Equation (3) is used to predict the combined force component for each cutting edge, which is then substituted into Equation (2). However, here, it is necessary to calculate Δ F f i and Δ F c i . This is performed in the analytical thermodynamic model for right-angle cutting, which is described in the next section.

3.2. Elemental Cutting Force Modeling

During milling, for radial (Figure 5), an infinitesimal milling micro-element, given by the milling length, produces a chip from a right-angle and is modeled using thermal methods. The cutting conditions corresponding to the milling micro-element are therefore given by the following:
t 1 = f sin k r ,   v c = w r ,   α n   and   d w
where t1 (mm), f (mm/r), w (rad/s), vc (mm/min), α n ( ) and dw (mm) are the cutting thickness, feed, angular speed, cutting speed, tool front angle, and cutting width.
For chip formation under right-angle cutting, the shear zone is defined as a shear zone of constant thickness within which the chip deforms, characterized by a planar shear angle perpendicular to the cutting edge. The secondary shear zone at the tool–chip and the flow of the complex material at the edge of the tool material are not considered. The analysis is restricted to stationary flow and has no time dependence, and the material flow within the primary shear zone is modeled using a one-dimensional approach. Therefore, all variables are dependent only on the normal coordinates along this range. These variables are determined by the thermodynamic behavior of the material, the cutting conditions, the thickness shear angle, and the average friction coefficient of the front tool face [11]. Furthermore, the shear in the band is adiabatic, and the normal shear angle is determined by minimizing the minimum of the basic cutting energy.
Metal cutting deformation is a large strain non-linear elastic–plastic deformation; although the cutting process is accompanied by elastic deformation, compared with the amount of plastic deformation, it can be neglected. High-speed cutting materials have a high temperature, a large strain, and a large strain rate for elastic–plastic deformation. Fast cutting materials into chips in a very short time, reflecting the cutting area at each point of the strain, strain rate, and temperature on the material dynamic stress of the intentional equation in the numerical simulation calculation analysis, which is extremely critical. On balance, the Johnson–Cook model was chosen as the intrinsic model to describe the deformation behavior of the material [29], where the workpiece material should be isotropic, rigid, and viscoelastic, and it is described by the Johnson–Cook law as follows:
τ = 1 3 A + B γ 3 n 1 + m I n γ γ 0 1 T T r T m T r v
where A is the yield strength of the material (MPa), B is the strain reinforcement factor (MPa), n is the strain reinforcement index, m is the strain rate reinforcement factor, γ is the current shear strain of the mass, γ is the current shear strain rate of the mass (1/s), γ 0 is the reference strain rate (1/s) and takes the value of 0.001/s, T is the current temperature of the mass (K), Tr is the room temperature (K), Tm is the melting temperature of the material (K) and the melting point, v is the thermal softening index, and τ is the shear stress of the mass (MPa). The three square brackets in Equation (5) successively represent the strain strengthening term, the strain rate term, and the temperature term. When a set of strain, strain rate, and temperature data is given, the corresponding mass flow stress can be obtained from Equation (5). The Johnson–Cook flow stress parameters for the ZL205A aluminum alloy are shown in Table 4.
In the main shear zone, the distributions of shear stress ( γ ) and temperature (T) are obtained from the solutions of the equations of motion and heat (via a one-dimensional formulation assuming smooth and adiabatic conditions), respectively. Note that the details of the equations are shown in [30,31], and only the solutions are as follows:
τ = ρ v c sin ϕ n 2 γ + τ 0
T = T w + β ρ c ρ v c sin ϕ n 2 γ 2 2 + τ 0 γ
where β , c, ρ , ϕ n , and τ 0 are the Taylor–Quincy coefficient, heat capacity, material density, shear angle, and flow stress at the start of the cut.
From the Johnson–Cook principal structure, Equation (5), it follows that
γ = γ 0 exp g γ g ( γ ) = τ 3 m A + B γ / 3 n 1 T T r / T m T r v 1 m
Combining Equations (5)–(7), we can note that the shear strain rate is a function of shear strain and shear stress. Therefore, Equation (8) can be written as follows:
γ = γ γ , τ 0
The distribution of this strain is controlled by the following first-order differential equation:
γ = D γ D t = v c sin ϕ n d γ d y
where D γ / D t is the derivative of the strain rate in the shear zone, and y is the coordinate along the axial direction.
The shear band bandwidth is h, and shear strain occurs within this range resulting in the following [32]:
0 γ h v c sin ϕ n γ γ , τ 0 d γ h = 0
The shear stress can be calculated using Equation (11). It is important to focus on the fact that the shear strain only occurs within the shear zone, and therefore, the boundary conditions for this shear strain are as follows:
γ h = cos α n sin ϕ n cos ϕ n α n
The micro-element cutting forces d F c i and feed forces d F f i are determined by the following equations:
d F c = cos α n + tan λ sin α n sin ϕ n cos ϕ n α n tan λ sin ϕ n α n d w t 1 τ h d F f = sin α n + tan λ sin α n sin ϕ n cos ϕ n α n tan λ sin ϕ n α n d w t 1 τ h
Substituting Equation (12) into Equation (6) gives the following:
τ h = ρ v c sin ϕ n 2 cos α n sin ϕ n cos ϕ n α n + τ 0
where α n is a normal rake angle.
In Equation (4), the milling length is defined by the microtitration (by the specified geometrical parameters), where the feed to the cutting layer and the approach angle are related as follows:
t 1 = f sin k r j
The shear and front angles and friction angles are related as follows:
ϕ n = 35 + 1 2 α n λ
Elemental cutting forces are as follows:
Δ F c i = cos α n + tan λ sin α n sin 35 + 1 2 ( α n λ ) cos 35 1 2 ( α n + λ ) tan λ sin 35 1 2 ( α n + λ ) Δ w f sin k r j τ h Δ F f i = sin α n + tan λ sin α n sin 35 + 1 2 ( α n λ ) cos 35 1 2 ( α n + λ ) tan λ sin 35 1 2 ( α n + λ ) Δ w f sin k r j τ h
The calculation can be made by combining the tool front angle, the friction angle, and the material parameters. The combined component of the milling force can be obtained by integrating the components in the radial direction, given by Equation (3).

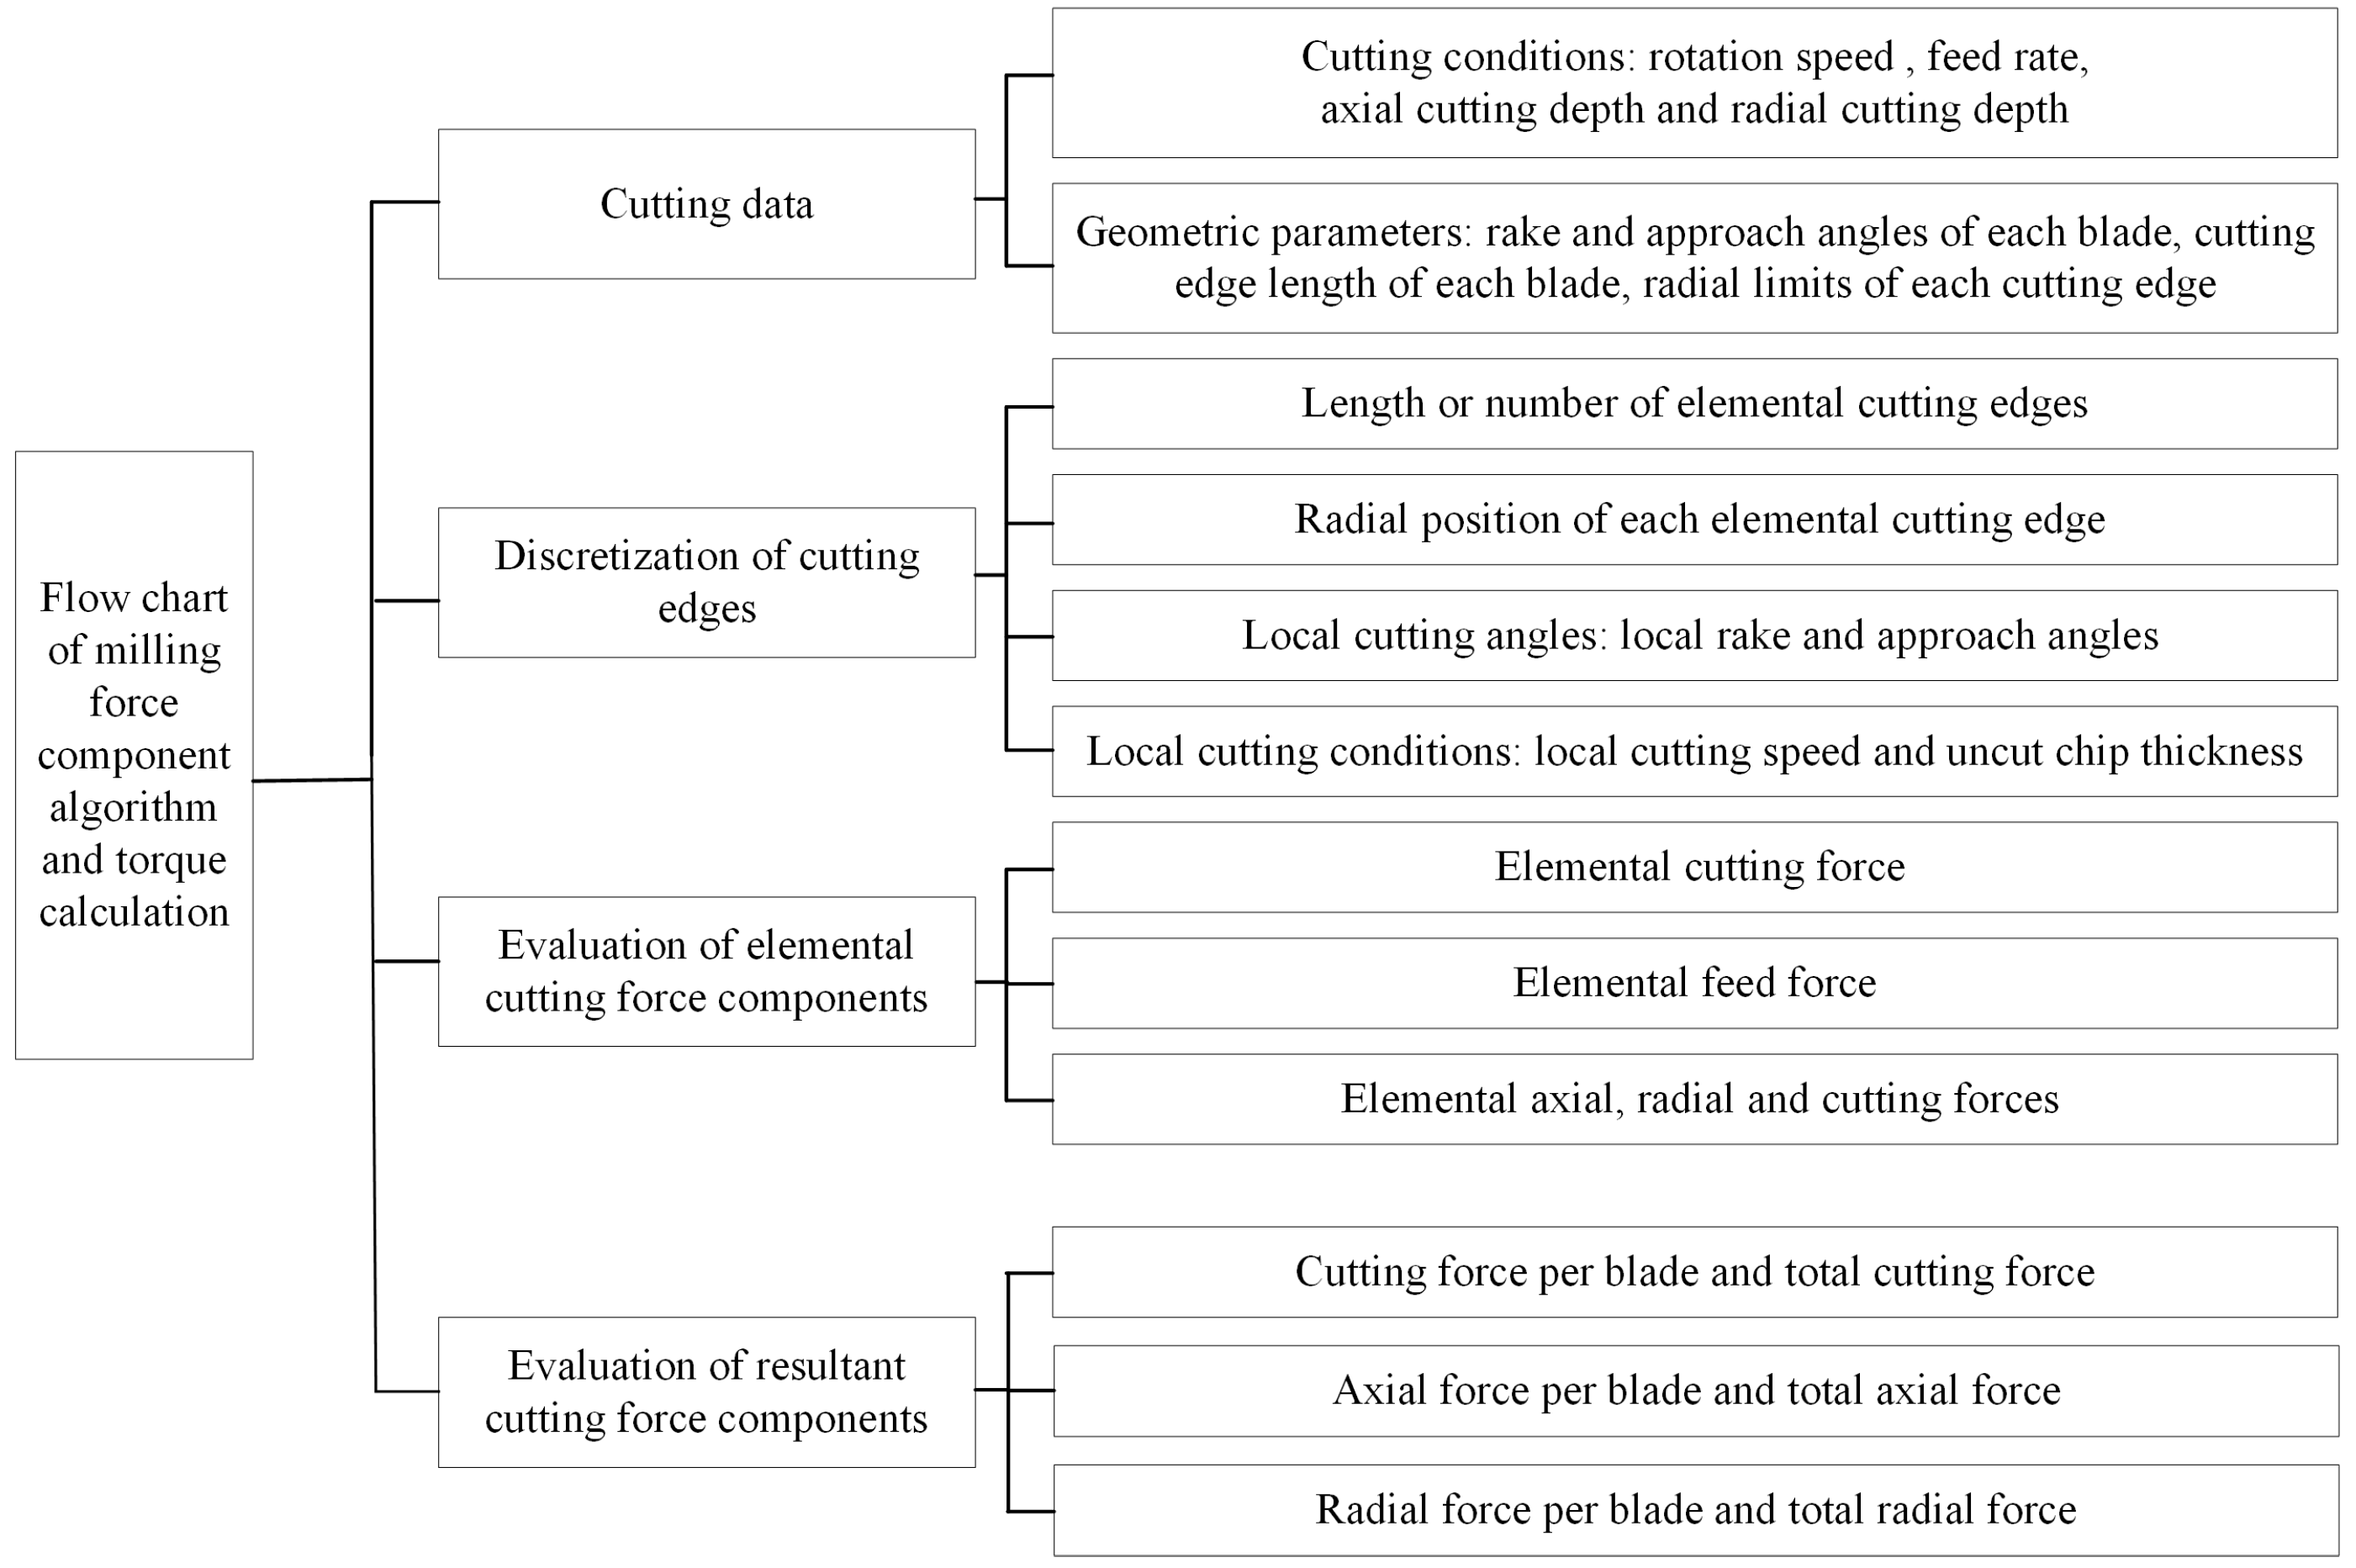
3.3. Thermodynamic Analysis Process

The analysis steps of calculating the milling force component of the milling ZL205A aluminum alloy are shown in Figure 6. First, design the cutting parameters and tool structure required for the test. Secondly, to micro-localize the cutting edge, it is necessary to understand the length of the cutting edge, the cutting position of each micro-element, the local cutting angle, and the local cutting conditions. Then, the axial force, tangent force, and radial force of each microfilm are calculated. Finally, the axial force, tangent force, and radial force, as well as the total axial force, tangent force, and radial force of each blade are predicted, respectively.

4. Results and Discussion

4.1. Milling Parameter Fitting

Orthogonal milling tests were carried out with the milling parameters, cutting speed (from 100 to 450 m/min), feed (from 0.1 to 0.45 mm/r), axial depth of cut (from 0.5 to 4.5 mm), and radial depth of cut (from 3 to 24 mm). This range includes the range of parameters designed for milling tests to verify machining stability (see Table 3). Figure 7 shows the average of the tangential and radial forces from the force gauge measurements.
Figure 7 shows the average value of the tangent force and radial force measured by the dynamometer. The horizontal coordinate of the figure is the cutting parameter; the left vertical coordinate is the tangent force; and the right coordinate is the feed force. With the increase in cutting speed, both the tangent force and the feed force are reduced (Figure 7a). The increase in the cutting speed reduces the friction coefficient, increases the shear angle, reduces the deformation coefficient, and indirectly reduces the cutting force. On the other hand, the melting point of the aluminum alloy is low, and the cutting force is greatly affected by the temperature. With the increase in the cutting speed, the cutting temperature also increases. so that the strength and hardness of the aluminum alloy are reduced, thus reducing the cutting force, but the temperature has less impact on the cutting force. With the increase in the cutting speed, the contact length also decreases, and the aluminum alloy has good ductility. With the increase in the cutting temperature, the shear strength of the retention layer decreases. As a result, the cutting force decreases with the increase in the cutting speed.
Figure 7b shows the change in tangential force and radial force with the feed. Figure 7c shows the change in tangential force and radial force with axial cutting depth. Figure 7d shows the change in tangential force and radial force with the radial cutting depth. Both the tangential force and the radial force increase with the increase in the cutting parameters, but the degree of influence varies. For the tangential force, the impact of the axial cutting depth, radial cutting depth, and feed is reduced in turn. For the radial force, the impact of the axial cutting depth, feed, and radial cutting depth is reduced in turn. The increase in the cutting depth and feed directly increases the cutting area, thus increasing the deformation resistance, so the cutting force also increases. However, the increase in the feed volume also proportionally increases the cutting thickness. The increase in the cutting thickness reduces the deformation coefficient and the friction coefficient, thus reducing the cutting force. As a result of the positive and negative effects, the cutting force increases with the increase in the feed, but the impact of the feed on the cutting force is less than the impact of the cutting depth on the cutting force. The correctness of this conclusion is also verified by the test and prediction results.
For each set of tests, a coefficient of friction (COF) can be calculated, which can be adjusted by the friction angle to better predict the milling forces using the mathematical model of milling forces (see Figure 7). The corresponding coefficient is obtained by fitting the equation:
μ = a 1 f + a 2 a e + a 3 a p + a 4 v c λ = tan 1 μ
The results of the fitting were substituted into the mathematical model of milling forces 17, where the cutting edge of each micro-element has a corresponding cutting speed, feed, axial depth of cut, and radial depth of cut. The coefficients of the friction law Equation (18) are shown in Table 5.
Figure 8 and Figure 9 show the radial and tangential force test values compared to the predicted values, and the friction coefficients were fitted by radial and tangential forces, so the average error between the two forces was small. The average error for the radial force is 4.5%, and the average error for the tangential force is 9.92%.

4.2. Milling Model Verification

Through milling force analysis, the calculation data of the thermodynamic model are compared with the measurement results of the milling data, and the axial force is used to verify the feasibility of the model. Within the milling range, the friction parameter Set 1 is also a good way to predict the milling cutting force data, with an average error of 17% (Figure 10). The influence of the radial cutting depth, axial cutting depth, feed volume, and cutting speed axial force is reduced in turn. With the increase in the cutting speed, the friction heating in the milling process increases, which softens the chips and increases the deformation rate of the material. The high deformation rate will lead to changes in the stress state and deformation characteristics of the material, so the axial force decreases with the increase in the cutting speed. However, increasing the radial cutting depth, axial cutting depth, and feed directly increases the cutting area, so that the deformation resistance increases and the internal friction force increases, and so the axial force also increases, but the impact of the feed on the axial force is far less than the impact of the cutting depth on the axial force. Therefore, when milling the ZL205A aluminum alloy, to improve the milling efficiency, improve the processing quality, and extend the tool life, the processing purpose of CNC milling can be achieved by adopting the cutting process parameters of large cutting width, small cutting depth, and appropriate feed volume.

5. Conclusions

Combined with the cutting parameters, material mechanical characteristics, and tool structure, using the material performance and contact/friction law analysis method, the friction coefficient in the milling model is fitted with the test results, and a thermodynamic analysis model of milling force is established.
(1)
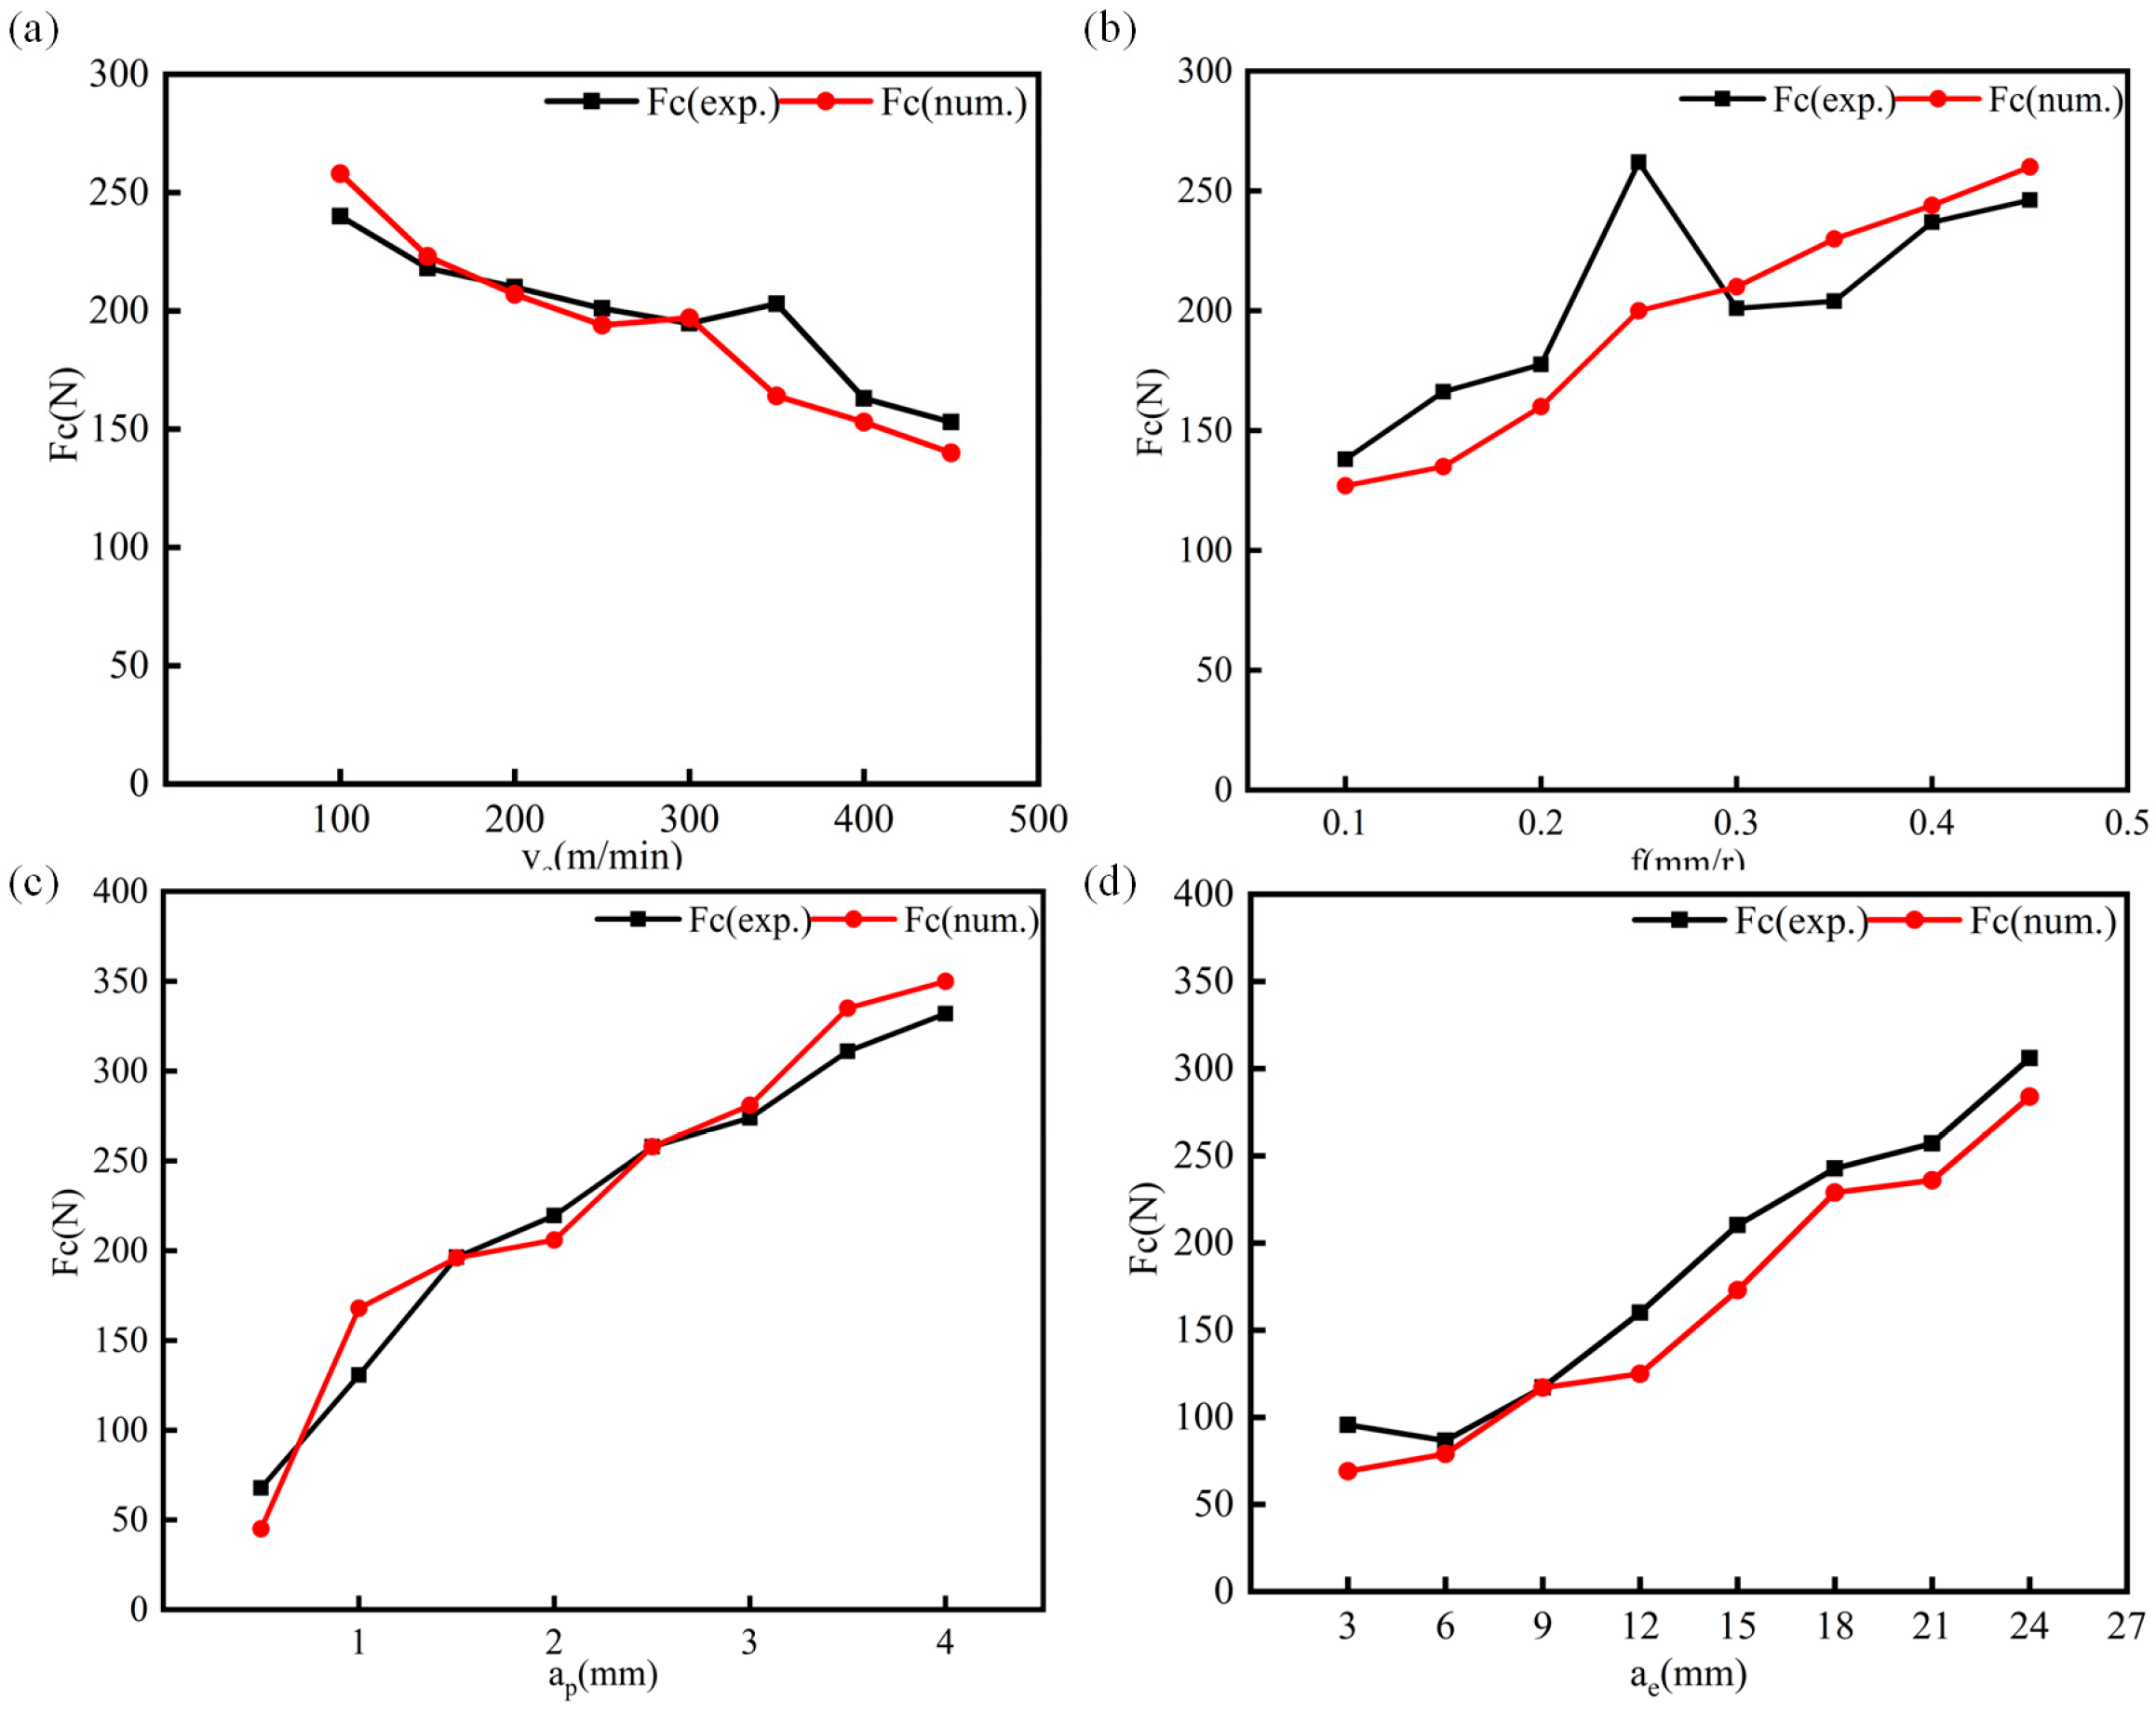
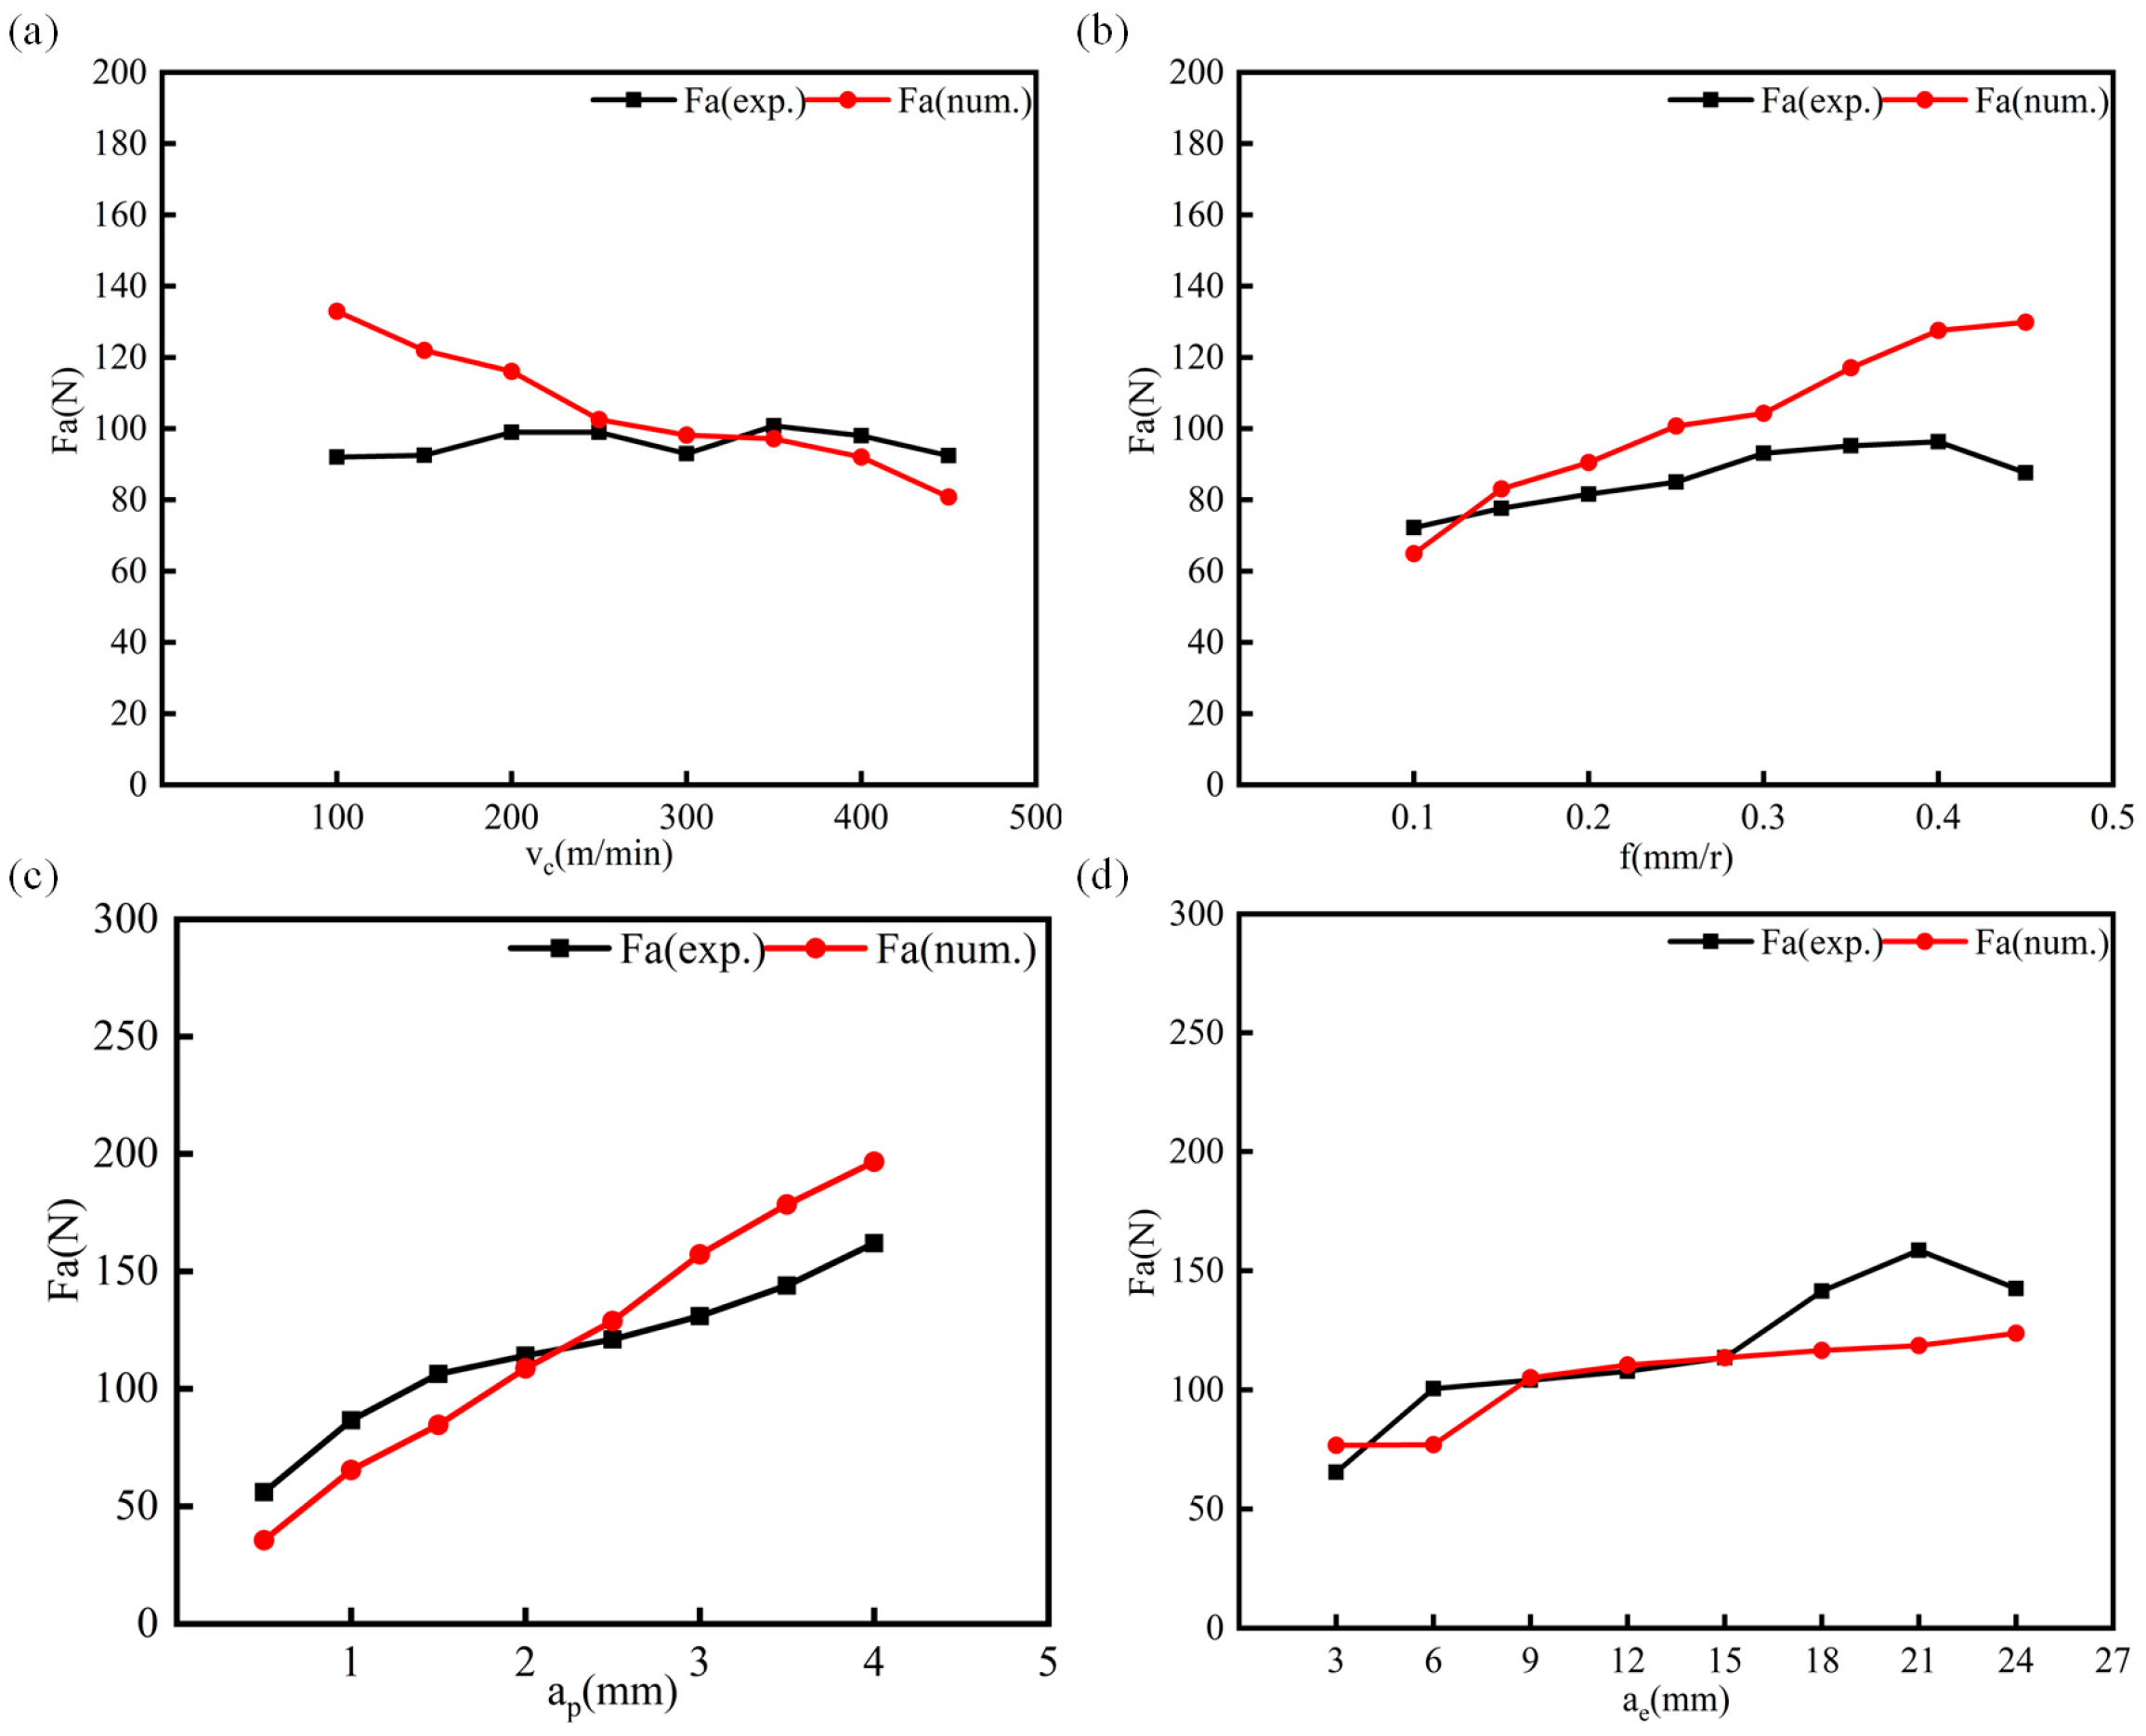
According to the test results, the influence of the axial cutting depth, radial cutting depth, feed, and cutting speed on the milling force is successively reduced. Based on the comprehensive analysis of roughness and milling force, the better milling parameters are 350 m/min cutting speed, 3.5 mm axial cutting depth, 15 mm radial cutting depth, and 0.15 mm/r feed.
(2)
By improving the thermodynamic analysis model, the ZL205A aluminum alloy milling force prediction model based on thermodynamic analysis is established. The model predicts that the radial force and tangents are more sensitive, with an average error of 4.5% and a tangent force error of 9.92%. However, the sensitivity of axial force to cutting speed is relatively low, with an average error of 17%. The experimental results show that the milling force can be predicted by adjusting the friction coefficient.
(3)
Based on the optimal cutting angle and cutting conditions, the milling model is used to predict the blade load, and the smaller load is used for cutting to improve the tool life, which can also be used to optimize the milling cutter structure. It provides a theoretical basis for the preparation of mechanical components with the ZL205A aluminum alloy.

Author Contributions

Methodology, Z.X. and X.H.; milling test, J.C. and Y.S.; data analysis, J.C. and B.S.; writing—original draft, formal analysis, data curation, J.C.; writing—review and editing, X.S. and H.L. All authors have read and agreed to the published version of the manuscript.

Funding

This work was financially supported by the National Natural Science Foundation of China (Grant Nos. 52105408 and 52075503).

Data Availability Statement

The original contributions presented in the study are included in the article, further inquiries can be directed to the corresponding author.

Conflicts of Interest

The authors declare no conflict of interest.

References

  1. Wang, H.M.; Yi, Y.P.; Huang, S.Q. Investigation of quench sensitivity of high strength 2219 aluminum alloy by TTP and TTT diagrams. J. Alloys Compd. 2017, 690, 446–452. [Google Scholar] [CrossRef]
  2. Wang, R.J.; Wu, S.P.; Chen, W. Mechanism of burst feeding in ZL205A casting under mechanical vibration and low pressure. Trans. Nonferrous Met. Soc. China 2018, 28, 1514–1520. [Google Scholar] [CrossRef]
  3. Ren, L.; Wang, Z.; Wang, S.; Li, C.; Wang, W.; Ming, Z.; Zhai, Y. The Effect of Cu Content on the Microstructure and Properties of the Wire Arc Additive Manufacturing Al-Cu Alloy. Materials 2023, 16, 2694. [Google Scholar] [CrossRef] [PubMed]
  4. Jiang, H.; Zhang, L.; Zhao, B.; Sun, M.; He, M. Microstructure and Mechanical Properties of ZL205A Aluminum Alloy Produced by Squeeze Casting after Heat Treatment. Metals 2022, 12, 2037. [Google Scholar] [CrossRef]
  5. Shaga, A.; Shen, P.; Xiao, L.G.; Guo, R.F.; Liu, Y.B.; Jiang, Q.C. High dam-age-tolerance bio-inspired ZL205A/SiC composites with a lamellar-interpenetrated structure. Mater. Sci. Eng. A 2017, 708, 199–207. [Google Scholar] [CrossRef]
  6. Guo, T.B.; Sun, Q.Z.; Li, K.Z.; Huang, D.W.; Wang, J.J.; Tai, X.Y. Effect of Temperature Gradient and Cooling Rate on Solidification Structure and Properties of ZL205A Alloy. Rare Metal Mater. Eng. 2022, 51, 2400–2408. [Google Scholar]
  7. Luo, L.; Luo, L.S.; Su, Y.Q.; Su, L.; Wang, L.; Guo, J.J.; Fu, H.Z. Optimizing microstructure, shrinkage defects and mechanical performance of ZL205A alloys via coupling travel-ling magnetic fields with unidirectional solidification. J. Mater. Sci. Technol. 2021, 74, 246–258. [Google Scholar] [CrossRef]
  8. Zhang, Z.H.; Liu, J.H.; Chen, J.M.; Wen, F.L.; Jia, R.; Ma, Q.X. Optimization of residual stress in low-pressure casting of ZL205A alloys. J. Manuf. Process. 2023, 99, 338–350. [Google Scholar] [CrossRef]
  9. Luo, L.; Xia, H.Y.; Luo, L.S.; Su, Y.Q.; Cai, C.J.; Wang, L.; Guo, J.J.; Fu, H.Z. Eliminating shrinkage defects and improving mechanical performance of large thin-walled ZL205A alloy castings by coupling travelling magnetic fields with sequential solidification. Trans. Nonferrous Met. Soc. China 2021, 31, 865–877. [Google Scholar] [CrossRef]
  10. Xu, H.Y.; Gong, Q.M.; Zhou, X.X.; Yang, F.W.; Han, B. Influence of the assisted kerf depth on cracks pattern and cutting performance of TBM cutter. Int. J. Rock Mech. Min. Sci. 2023, 170, 105516. [Google Scholar] [CrossRef]
  11. Prajapati, P.K.; Biswas, P.; Singh, B.K.; Bapanapalle, C.O.; Ghosh, R.; Mandal, N. Rein-forcing potential of MWCNTs on mechanical and machining performance of hot-pressed ZTA-MgO ceramic cutting inserts. Diam. Relat. Mater. 2023, 138, 110202. [Google Scholar] [CrossRef]
  12. Yuan, X.; Wang, S.T.; Mao, X.Y. Forced vibration mechanism and suppression method for thin-walled workpiece milling. Int. J. Mech. Sci. 2022, 230, 107553. [Google Scholar] [CrossRef]
  13. Liu, T.; Wang, Q.; Wang, W. Micro-Milling Tool Wear Monitoring via Nonlinear Cutting Force Model. Micromachines 2022, 13, 943. [Google Scholar] [CrossRef]
  14. Duan, Z.; Li, C.; Ding, W. Milling Force Model for Aviation Aluminum Alloy: Academic Insight and Perspective Analysis. Chin. J. Mech. Eng. 2021, 34, 18. [Google Scholar] [CrossRef]
  15. Zang, P.; Yue, X.J.; Han, S.F. Experiment and simulation on the high-speed milling mechanism of aluminum alloy 7050-T7451. Vacuum 2020, 182, 109778. [Google Scholar]
  16. Sun, Y.; Sun, J.; Wang, G. A modified analytical cutting force prediction model under the tool crater wear effect in end milling Ti6Al4V with solid carbide tool. Int. J. Adv. Manuf. Technol. 2020, 108, 3475–3490. [Google Scholar] [CrossRef]
  17. Merchant, E. Basic mechanics of the metal cutting process. Appl. Mech. Trans. ASME 1944, 66, 160–168. [Google Scholar] [CrossRef]
  18. Lee, E.H.; Shaffer, B.W. The theory of plasticity applied to a problem of machining. Int. J. Appl. Mech. 1951, 18, 405–413. [Google Scholar] [CrossRef]
  19. Oxley, P.L.B.; Humphreys, A.G.; Larizadeh, A. The influence of rate of strain-hardening in machining. Proc. Inst. Mech. Eng. 1961, 175, 881–891. [Google Scholar]
  20. Doyle, E.D.; Horne, J.G.; Tabor, D. Frictional interactions between chip and rake face in continuous chip formation. Proceedings of the Royal Society of London. Ser. A Math. Phys. Sci. 1979, 366, 173–183. [Google Scholar]
  21. Zhang, X.; Zhang, J.; Zhou, H.; Ren, Y.; Xu, M. A novel milling force model based on the influence of tool geometric parameters in end milling. Adv. Mech. Eng. 2018, 10, 9. [Google Scholar] [CrossRef]
  22. Zhu, S.; Zhao, M.; Mao, J.; Liang, S.Y. A Ti-6Al-4V Milling Force Prediction Model Based on the Taylor Factor Model and Microstructure Evolution of the Milling Surface. Micromachines 2022, 13, 1618. [Google Scholar] [CrossRef]
  23. Chen, Y.H.; Lu, J.; Deng, Q.L. Modeling study of milling force considering tool runout at different types of radial cutting depth. J. Manuf. Process. 2022, 76, 486–503. [Google Scholar] [CrossRef]
  24. Su, X.; Wang, G.; Yu, J. Predictive model of milling force for complex profile milling. Int. J. Adv. Manuf. Technol. 2016, 87, 1653–1662. [Google Scholar] [CrossRef]
  25. Zhou, Q.; Luo, D.W.; Ye, W.T.; Li, S.; Zou, Q.G.; Chen, Z.Q.; Wang, H.F. Design and characterization of metallic glass/graphene multilayer with excellent nanowear prop-erties. Friction 2022, 10, 1913–1921. [Google Scholar] [CrossRef]
  26. Ren, Y.; Huang, Z.B.; Wang, Y.C.; Zhou, Q.; Yang, T.; Li, Q.K.; Jia, Q.; Wang, H.F. Fric-tion-induced rapid amorphization in a wear-resistant (CoCrNi)88Mo12 dual-phase medium-entropy alloy at cryogenic temperature. Compos. Part B-Eng. 2023, 263, 110833. [Google Scholar] [CrossRef]
  27. Ye, W.T.; Xie, M.D.; Huang, Z.B.; Wang, H.M.; Zhou, Q.; Wang, L.; Chen, B.; Wang, H.F.; Liu, W.M. Microstructure and tribological properties of in-situ carbide/CoCrFeNiMn high entropy alloy composites synthesized by flake powder metallurgy. Tribol. Int. 2023, 181, 108295. [Google Scholar] [CrossRef]
  28. Emine, S. Evaluation of tribological performance of MQL technique combined with LN2, CO2, N2 ecological cooling/lubrication techniques when turning of Hastelloy C22 superalloy. Tribol. Int. 2023, 188, 108786. [Google Scholar]
  29. Haddag, B.; Nouari, M.; Moufki, A. Experimental analysis of the BTA deep drilling and a new analytical thermomechanical model for assessment of cutting forces and BTA drill design. Int. J. Adv. Manuf. Technol. 2020, 106, 455–469. [Google Scholar] [CrossRef]
  30. Moufki, A.; Dudzinski, D.; Molinari, A.; Rausch, M. Thermoviscoelastic modelling of oblique cutting: Forces and chip flow predictions. Int. J. Mech. Sci. 2000, 42, 1205–1232. [Google Scholar] [CrossRef]
  31. Moufki, A.; Devillez, A.; Dudzinski, D.; Molinari, A. Thermomechanical modelling of oblique cutting and experimental validation. Int. J. Mach. Tool. Manu. 2004, 44, 971–989. [Google Scholar] [CrossRef]
  32. Chen, Z.J.; Qian, L.Y.; Ji, B.P. Investigation into thermodynamic behavior of LA103Z MgLi alloy during turning based on modified Johnson—Cook model. J. Manuf. Process. 2023, 87, 260–272. [Google Scholar] [CrossRef]
Figure 1. Test equipment diagram. (a) Machining center; (b) KISTLER dynamometer; (c) tool handle; (d) blade.
Lubricants 11 00390 g001
Figure 2. Measuring the axial force of milling. (a) The change in the axial force of milling with the cutting speed. (b) The change in the axial force of milling with the feed of each tooth. (c) The change in milling axial force with axial cutting depth. (d) The change in milling axial force with radial cutting depth.
Lubricants 11 00390 g002
Figure 3. Macroform of chip. (a) Change in chips with cutting speed. (b) Change in chips with feed. (c) The change in chip with axial cutting depth. (d) The change in chip with the radial cutting depth.
Lubricants 11 00390 g003
Figure 4. Tool wear. (a) New blade. (b) Milling cutter blade four blades.
Lubricants 11 00390 g004
Figure 5. Illustration of (a) the resultant component of the milling force acting on the milling cutter; (b) the elemental component of the milling force acting on the cutting edge; and (c) shows the right-angle cutting corresponding to each micro-element.
Lubricants 11 00390 g005
Figure 6. Thermodynamic analysis flow chart.
Lubricants 11 00390 g006
Figure 7. Tangential and radial forces for different cutting parameters. (a) The change in the tangential and radial forces of milling with the cutting speed. (b) The change in the tangential and radial forces of milling with the feed of each tooth. (c) The change in milling tangential and radial forces with axial cutting depth. (d) The change in milling tangential and radial forces with radial cutting depth.
Lubricants 11 00390 g007
Figure 8. Orthogonal milling: experimental and predicted tangential. (a) The change in the tangential force of milling with the cutting speed. (b) The change in the tangential force of milling with the feed of each tooth. (c) The change in milling tangential force with axial cutting depth. (d) The change in milling tangential force with radial cutting depth.
Lubricants 11 00390 g008
Figure 9. Orthogonal milling: experimental and predicted radial forces. (a) The change in the radial force of milling with the cutting speed. (b) The change in the radial force of milling with the feed of each tooth. (c) The change in milling radial force with axial cutting depth. (d) The change in milling radial force with radial cutting depth.
Lubricants 11 00390 g009
Figure 10. Axial force prediction and test. (a) The change in the axial force of milling with the cutting speed. (b) The change in the axial force of milling with the feed of each tooth. (c) The change in milling axial force with axial cutting depth. (d) The change in milling axial force with radial cutting depth.
Lubricants 11 00390 g010
Table 1. Mechanical characteristics of ZL205A aluminum alloy.
ρ (g/cm3)H
(HRC)
Rp0.2
(T°: Ambient)
(MPa)
Rp0.2
(T°: 623 K)
(MPa)
Rpm
(T°: Ambient)
(MPa)
2.855297.94111.38417.76
Table 2. Chemical composition of ZL205A aluminum alloy (wt.%).
ElementCuMnTiZrCdBVAl
Cont.4.950.40.250.1250.20.0350.175Bal.
Table 3. Milling test design of ZL205A aluminum alloy.
Test No.Cutting Speed
(m/min)
Feed Rate
(mm/r)
Axial Depth
of Cut
(mm)
Radial Depth of Cut
(mm)
1st Phase11000.3215
22000.3215
33000.3215
44000.3215
2nd Phase52000.1215
62000.2215
72000.3215
82000.4215
3rd Phase92000.2115
102000.2215
112000.2315
122000.2415
4th Phase132000.223
142000.229
152000.2215
162000.2221
Table 4. JC flow stress parameters for ZL205A aluminum alloy.
A (MPa)B (MPa)nCmTr (K)Tm (K) ε 0
297.94735.560.660.006721.3028229386210−3
Table 5. Determining friction law parameters.
a1a2a3a4
Set 1 0.5407 2 . 8527 × 10 - 5 5 . 3830 × 10 - 6 1 . 1303 × 10 - 6
Disclaimer/Publisher’s Note: The statements, opinions and data contained in all publications are solely those of the individual author(s) and contributor(s) and not of MDPI and/or the editor(s). MDPI and/or the editor(s) disclaim responsibility for any injury to people or property resulting from any ideas, methods, instructions or products referred to in the content.

