Abstract
By setting textures on the side walls of a rotor, based on SST k-ω turbulence and the mixture model, the effects of depth-to-diameter ratio, shape, and rotational speed on interface temperature are analyzed. Local Nu number, flow field in textures, and gas distribution are used to verify the conclusion. When rotational speed increases, there are three different stages on the surface: liquid-dominated, mixed two-phase, and gas-dominated. This leads to a big difference in heat transfer on the side wall and causes the temperature on the seal face to increase when cavitation is considered. The distribution of the gas phase is explained through drag reduction, which has a high correlation with the velocity gradient near the surface. For several common shapes, heat transfer enhancement of textures is compared under high speed. The key influencing factor is the depth-to-diameter ratio, which causes flow stratification and reduces heat transfer. Flow stratification leads to different results of maximum temperature on the seal face when cavitation is considered. Results show that at high speed, a deep, circular texture is better when cavitation does not occur, and a shallow triangular texture is recommended when cavitation occurs; a textured side wall can reduce the maximum temperature of the seal face by about 10 °C.
1. Introduction
The mechanical seal is an important part of rotating machinery that is widely assembled on pumps, compressors, kettles, and other equipment [1,2]. The space in the astronautical high-speed turbopump is limited, the linear velocity of the seal set on the shaft is high, and there is no additional flushing system. These special conditions often lead to thermal failure leakage caused by overheating of the seal interface [3,4]. Additionally, high-speed turbopump has high-speed and low-pressure conditions that easily cause cavitation in the medium when flow regulation and fluid excitation occur [5,6,7]. The presence of a gas phase around the side wall affects the heat transfer of the seal ring, increasing the risk of thermal failure on the seal interface. Thus, how to improve the heat transfer of the ring and reduce fluid cavitation around the ring are key issues in the research of high-speed turbopumps.
Recent studies have shown that thermal deformation is one of the main factors in the wear failure of seals or bearings used in rotating machinery [8]. When the thermal effect is taken into account, the impact of the axial movement on bearing performance is greater [9]. Research on finger seals has also shown that leakage and wear are much more serious when thermal deformation occurs [10], and the sealing performance of reciprocating seals is also sensitive to temperature. When the temperature is too high or too low, friction might be several times that of normal temperature [11]. These studies show that high temperatures on surfaces with relative motion affect the tribological behavior between surfaces, and reducing the temperature of the contact surface has great significance in improving the friction condition on the surface.
Changing the shape of the seal interface is widely used in non-contact mechanical seals to reduce wear and control the temperature in the interface. Many types of grooves, including spiral grooves [12] and herringbone grooves (HG) [13], are set in seals to reduce the temperature and wear. Notch is also widely used to reduce excessive thermal deformation and wear [4]. However, this method increases leakage and decreases the temperature at the same time, and the leakage of high-speed turbopumps must be maintained within a very small range; thus, many researchers have tried to find another method that is suitable for turbopumps.
Recently, processing texture on the side wall of seal rings has attracted attention due to its good heat transfer performance and small resistance loss [14,15,16]. Some researchers [17,18] set textures of different shapes and different arrangements on a plate, measured the temperature and velocity distribution inside the texture through experiments and found a slight variance in temperature distribution between different cases with similar Nusselt numbers (Nu number). Nian et al. [14] were the first researchers to use a seal with textured side walls to reduce the temperature of the seal face. Their experimental results showed that this technology can reduce the temperature of the seal face by about 10% at low speed and pressure. Subsequently, they [15] studied the influence of texture arrangement and geometric parameters on heat transfer enhancement at low speed and found that small-sized textures with a dense arrangement are better. Zhou et al. [16] studied the heat transfer effect of various textures. The equilateral triangular texture with a rotation angle of 90° had the best heat transfer, while the rectangular texture had the worst heat transfer.
Cavitation inevitably occurs in turbopumps due to the high-speed or ultra-high-speed working conditions. Cavitation has unacceptable effects on the mechanical seal. First, cavitation can cause the collapse of the bubble, which interferes with the reliability of the mechanical seal [19]. Second, due to the poor heat transfer performance of the gas medium, heat exchange between the seal and the fluid is weakened. Many researchers have established numerical models for predicting the generation of cavitation. The Elrod Model [20,21] is one of the classical and widely used models. It has been used in mechanical seals for many years. However, the Elrod Model has some simplified assumptions, for example, that the surface is smooth [22], which makes it unavailable in many situations. Thus, some researchers have used business software to calculate cavitation [23,24] and gotten relatively precise results. A series of studies have also been carried out on the cavitation. An image processing method has been developed by Ge et al. [25], and the unsteady cavitation characteristics and shedding dynamics of cavitating flows at different temperatures were investigated using a visual system with a small-scale venturi-type section. The influence of thermodynamic effects on cavitation intensity and dynamic behaviors has also been studied using PIV measurements and modal decompositions [26]. Ge et al. [27,28] also proposed the recommended ranges for many parameters of Venturi-type cavitation reactors. These studies are of great significance in industrial production. Li et al. [29] developed a cavitation model consisting of vapor bubble growth rate and vapor bubble number density. Surface tension-controlled, inertia-controlled, intermediate, and heat transfer-controlled cavitation regimes are also included in the model. Their model is very useful, but the model constants are not optimized and are not validated for unsteady cavitating flows.
The above work shows that the textures can take into account both the high heat transfer and the low resistance loss and do not require additional space. It is an ideal method for improving heat transfer in high-speed turbopumps. But until now, most research on textures has been based on infinite plate and microchannel heat exchangers that are obviously different from the flow and heat transfer in traditional seal chambers. Secondly, as the increase of rotational speed, cavitation may occur, causing the gas–liquid mixture phase in the seal chamber. Many existing studies on heat transfer of textured side walls only focus on single-phase fluids. The influence of the gas phase on the heat transfer of textured surfaces is also a key problem to solve. Therefore, the SST k-ω model and mixture model are used in this paper to calculate the flow field, temperature field, and gas distribution of high-speed seals with textured side walls. The difference in heat transfer at different rotational speeds is analyzed when cavitation is taken into account. The effect of depth-to-diameter ratio and texture shape on heat transfer is also investigated, and the heat transfer mechanisms of textures under two-phase flow conditions are revealed.
2. Numerical Models and Boundary Conditions
2.1. Geometric Model
Figure 1 shows the typical structure of a high-speed mechanical seal with a textured rotor used in the turbopump. To increase computational efficiency, 1/36 of the entire ring is considered to be the computational domain, including the rotor, stator, and fluid. The sealing medium is water, the ambient temperature is 140 °C, and the cavitation pressure is 0.46 MPa. Other boundary conditions and geometric and physical parameters are shown in Figure 1 and Figure 2 and Table 1, Table 2, Table 3 and Table 4. To simplify the analysis, make the following assumptions: (1) no slip on the side wall of the seal ring; (2) no thermal and force deformation on the seal face; (3) physical properties remain unchanged except for the specific heat capacity of gaseous water; (4) thermal radiation is ignored; leakage and its influence on temperature are ignored due to the low leakage of contact mechanical seal.
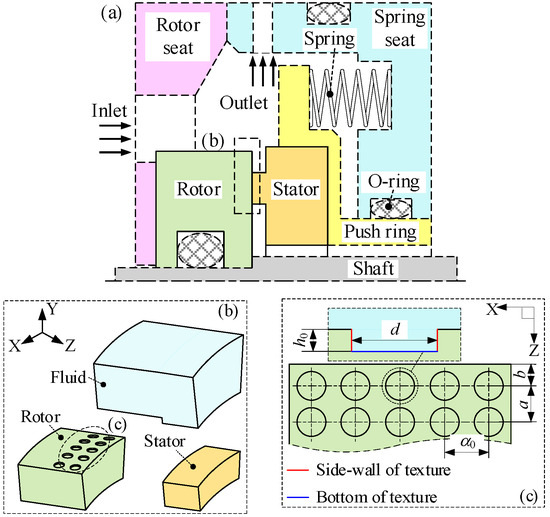
Figure 1.
Geometric diagram. (a) Schematic diagram of high-speed turbopump mechanical seal. (b) Schematic diagram of seal ring and fluid. (c) Schematic diagram of textured circumference surface.
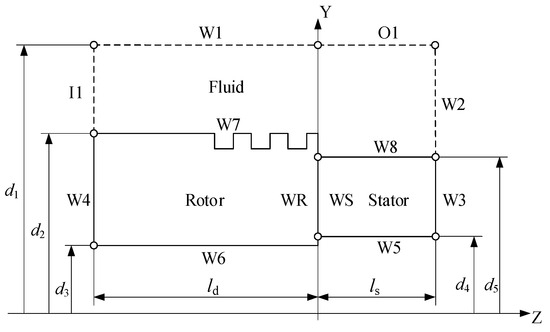
Figure 2.
Boundary condition diagram.

Table 1.
Geometric parameter.
Table 2.
Boundary conditions.
Table 3.
Constant of SST model.
Table 4.
Physical parameters.
2.2. Governing Equation
Due to the rotation of the textured rotor, fluid in the seal chamber is easy to be in a turbulent state. Thus, the SST k-ω turbulence model is used to calculate the flow field and velocity in the texture, and the energy equation is used to simulate heat transfer and temperature. Considering the loading rate of particles and Stokes number, the Mixture Model is used as a multiphase flow model to calculate the generation and movement of the gas phase. Finally, taking into account the existence of an interface on the side wall, the coupled algorithm is used to ensure the correctness and accuracy of results. Equations are considered to be convergent when the residual is less than 1 × 10⁻³, except that the residual of the energy equation is set to 1 × 10⁻⁶.
The steady-state format of the SST model is shown as
In Equations (1) and (2), ρ is density; k0 is turbulent kinetic energy; ω0 is turbulent dissipation rate; Γk0, Γω0 are effective diffusion terms of k0 and ω0 respectively; Gk0, Gω0 are k-equation and ω-equation; Yk0, Yω0 are divergent term of k0 and ω0 respectively; Dω0 is orthogonal divergence term; Sk0, Sω0 are User-define source terms; xi, xj are tensor representation of coordinate direction, i and j are dummy index; ui is tensor representation of velocity, subscripts are dummy index, too. By changing the constants of the SST model, the turbulence model can be adjusted. Except for the constants listed in Table 3, the rest are the default settings of fluent.
The continuity equation and momentum equation of the Mixture Model are:
In Equations (3) and (4), ρm is the density of the mixed phase, calculated as Equation (5), μm is the dynamic viscosity of the mixed phase, calculated as Equation (6).
In Equations (5) and (6), ρl is the density of liquid, ρv is the density of the gas, μl is the dynamic viscosity of the liquid, μv is the dynamic viscosity of the gas, and VF is gas volume fraction.
In addition, a gas–liquid phase transition equation is needed to describe the mass transfer between gas and liquid phases:
In Equation (7), is the source term of mass transfer, indicates that the liquid phase is converted into the gas phase, and is the opposite.
The energy equation is the default option of ANSYS Fluent, which does not need to be explained. The constants involved in the SST model are shown in Table 3. F1 and F2 are intermediate values used in the calculation of each parameter ϕ, ϕ = ϕ1F + ϕ2 (1 − F), F is a model decision parameter, taking 1 in the near-wall region, taking 0 in the turbulent zone. a is the ratio of shear stress to turbulent kinetic energy inside the boundary layer; β is the constant of the dissipation term used in k-equation; σk, σω is the constant of the diffusion term used in k-equation and ω-equation.
Depth-to-diameter ratio (γ) is a very important geometric parameter in this paper. It will greatly affect the heat transfer of textured surfaces. Therefore, it is necessary to explain the definition of γ, shown in Equation (8).
In Equation (8), γ is the depth-to-diameter ratio, h0 is the depth of texture, d is the hydraulic diameter of different textures.
In this paper, it is also necessary to discuss the mechanism of drag reduction on the side wall, and Equation (9) is used to explain it. According to Refs. [30,31], one of the mechanisms of drag reduction on textured surfaces is: The reverse vortex inside textures causes fluid–fluid contact, replacing flow-solid contact, which will significantly reduce the velocity gradient. Equation (9) is the transport equation for the vorticity of incompressible flow.
In Equation (9), ω is vorticity, is velocity vector, n is kinematic viscosity, is Hamiltonian. means that as long as the velocity gradient exists, the vorticity will be changed. is the viscous diffusibility of the vorticity. It shows that the velocity gradient will cause distortion of the vortex. The more the vortex is produced, the higher the velocity is induced, and the high velocity will cause large turbulent kinetic energy loss. This means that a small velocity gradient is equal to a low energy loss, and a low energy loss is equal to a drag reduction around the wall.
2.3. Boundary Conditions
According to the actual installation characteristics of the high-speed turbopump mechanical seal, the inlet of the fluid in the seal chamber is located at the back of the rotor, and the outlet at the outside of the stator, as shown in Figure 1. The common flushing flow rate is 8–25 L/min, so the calculation selects the intermediate value (16 L/min) to ensure safety and universality, and the calculated result of inlet velocity is 0.9 m/s. The frictional heat is calculated and loaded on the WR and WS surfaces shown in Figure 2, according to the method proposed by Nian [14] et al. Given the influence of high speed on friction coefficient, the chosen friction coefficient f is 0.15. Additionally, due to the small gap between the inner diameter of the seal ring and shaft and the large heat transfer coefficient of the side wall at high speed, the convective heat transfer at the inner diameter is ignored. Specific boundary conditions are shown in Table 2, and material physical parameters are shown in Table 4.
2.4. Grid Independence Validation and Model Validation
Fully structured and hexahedral units are used for meshing; mesh quality is guaranteed between 0.517 and 1, and mesh skewness is guaranteed between 0 and 0.472. In common CFD software, good results can be obtained when mesh quality is greater than 0.2, and mesh skewness is less than 0.5. Therefore, the calculation results of these grids are reliable. Furthermore, the y+ of the side wall is controlled by setting the number of grid layers in the boundary layer, and the definition of y+ can be found in Ref. [32]. The specific rules of encryption are: (1) ensuring y+ ≤ 10; (2) at least 10 layers of grids are set in the boundary layer; and (3) the growth rate of the grid size in the boundary layer is 1.2–1.4, and the closer to 1.2, the better. The mesh generation results are shown in Figure 3, whereas the circular texture uses the O-block, and the triangular texture uses the Y-block.
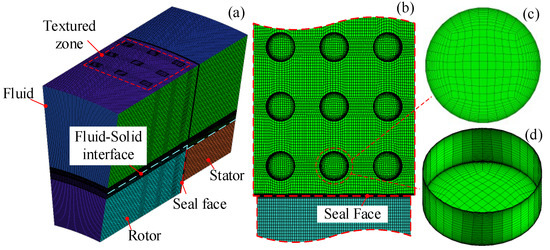
Figure 3.
Schematic diagram of mesh. (a) Global grid; (b) mesh on textured side wall; (c) mesh on the bottom surface of texture; (d) mesh on the side wall of texture.
Figure 4 shows the results of grid-independence validation, where the maximum grid size is 6 × 10⁻⁵ m, 5 × 10⁻⁵ m and 4 × 10⁻⁵ m, respectively. During validation, local encryption ensures that y+ near the coupled surface [33,34,35] is less than 10. And the grid number obtained is 1.2 × 10⁶, 1.9 × 10⁶, and 3.4 × 10⁶, respectively. The criterion for mesh independence is the radial temperature of the seal face. The result shows that when the number of grids increases from 1.2 × 10⁶ to 1.9 × 10⁶, the deviation of the temperature curve is about 0.5–1 °C, and when the number of grids increases from 1.9 × 10⁶ to 3.4 × 10⁶, the deviation of the temperature curve is less than 0.1 °C. However, the calculation time using the third grid is about twice that using the second. Based on the cost of time and accuracy, the second grid is chosen, i.e., the maximum grid size is 5 × 10⁻⁵ m, and the grid number is 1.9 × 10⁶.

Figure 4.
Grid independence validation.
Figure 5 shows the validation of the model. The numerical results of the radial temperature at three different axial positions (z = 1.2 mm, 1.73 mm, 3.51 mm) are compared with the experimental and numerical results in Ref. [36]. Temperature differences in all locations are below 0.5 °C, so the thermal model is validated. Compared to Ref. [36], the k-ε model is modified to the SST model. When the flow is simple, the k-ε model can reduce the computing resources required. But for cross-scale flow, the SST model is better.
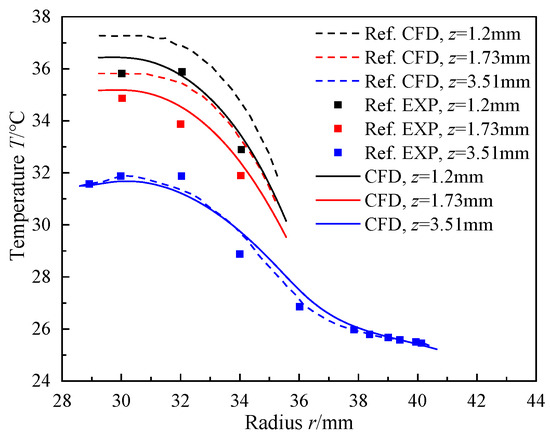
Figure 5.
Model validation with experiment and numerical simulation of Merati [36].
2.5. Sampling Location Description
As shown in Figure 6, five sampling positions on the side wall with different textures (circular and triangular) are selected, and the reasons for choosing them will be explained in this section. Z = 0.5 mm is the center section of the textures closest to the seal face (First row of textures, FRT). Since the circumferential velocity of the fluid near the side wall is much greater than the axial velocity at high-speed conditions (at 20,000 rpm, the circumferential velocity is about 23 m/s, and the axial velocity is about 1 m/s), Z = 0.5 mm can be considered to be the central section of main flow direction in the texture. X = 0 is the symmetrical axis section of the entire ring that can be used to observe the flow field and gas phase distribution in the seal chamber. Then, the central FRT for analysis and three relative depths inside the texture are selected. At each relative depth, the starting point (φ = 0°) is the intersection of X = 0 and the depth section near the seal face, and the endpoint (φ = 360°) is the counterclockwise rotation (shown in Figure 6a,b).
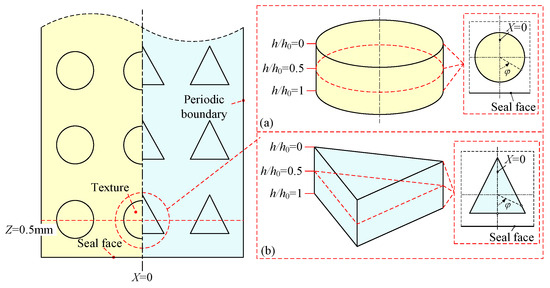
Figure 6.
Sampling location diagram. (a) Circular texture; (b) triangular texture.
3. Results and Discussion
3.1. Influence of Rotational Speed on the Maximum Temperature of Seal Face
As the rotational speed increases, cavitation occurs on the side wall of the seal ring, which greatly increases the maximum temperature of the seal face. Therefore, it is necessary to study when considering cavitation. It should be noted that the increase of the maximum temperature on the seal face will lead to a series of thermal failures. So, how the maximum temperature on the seal face changes when cavitation occurs is also one of the key points to be discussed.
Figure 7 shows the maximum temperature on the seal face at different rotational speeds. As the rotational speed increases, the temperature on the seal face increases. The temperature of the textured surface (γ = 0.4 and γ =2.0) gradually becomes higher than the plane surface when n ≥ 14,000 rpm and cavitation is considered. Additionally, when n = 20,000 rpm, the temperature suddenly increases. This indicates that cavitation begins to influence temperature when n = 14,000 rpm, and the most significant effect occurs when n = 20,000. Therefore, it is necessary to investigate the difference in heat transfer between cavitation and non-cavitation on three surfaces at high speed. Additionally, the three colored blocks are divided by the gas phase volume fraction, which will be discussed later.
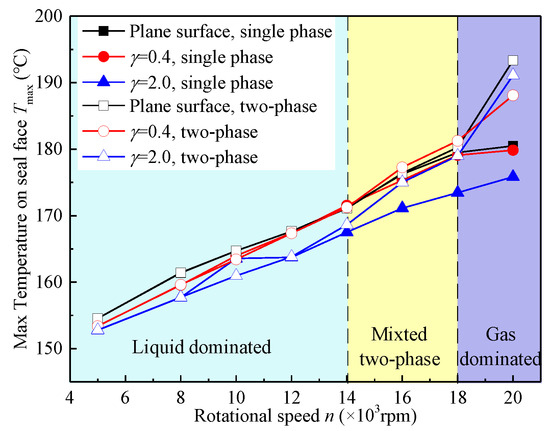
Figure 7.
Maximum temperature on seal face.
Figure 8 shows the maximum temperature differences between different surfaces. The most important turning points of the curve appear at 14,000 rpm and 18,000 rpm. The law of the turning points in Figure 7 and Figure 8 is consistent. When n < 14,000 rpm, cavitation does not affect the temperature differences (∆T). When 14,000 rpm ≤ n ≤ 18,000 rpm, ∆T is much larger when cavitation is ignored, indicating that cavitation causes reduced heat transfer in these situations. When n = 20,000 rpm, the ∆T of the textured surface is different when the depth-to-diameter ratio γ changes, which means textures with different γ cause different results. The mechanisms of these results will be explained later.
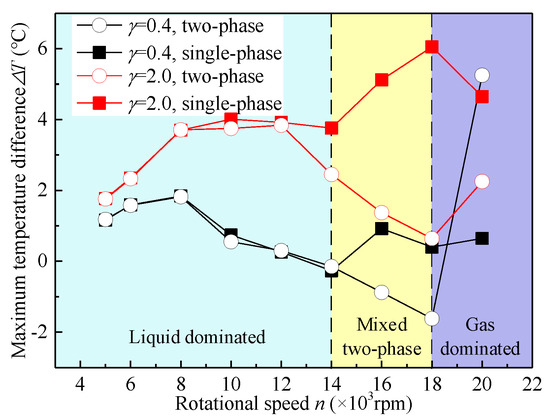
Figure 8.
Temperature differences between textured side wall and plane surfaces.
Figure 9 shows the average volume fraction curve and area ratio curve of VF > 0.1. The reason for selecting 0.1 as a threshold is that the gas phase is treated as a dispersed phase and does not participate in the coupled analysis when VF < 0.1. Additionally, when VF < 0.1, the physical properties of the two-phase fluid are similar to those of a single phase, then the influence of the gas phase can be ignored. As shown in Figure 9, when n < 14,000 rpm, the average gas volume fraction (AGVF) of the side wall is less than 0.1, and the area ratio of VF > 0.1 is less than 0.2. So, the gas phase is considered to be a discrete phase, with little effect on the liquid phase, and ∆T of the three surfaces is basically independent of cavitation. When 14,000 rpm ≤ n ≤ 18,000 rpm, AGVF begins to increase in all three cases. The AGVF of the plane surface increases faster, but the gas phase distribution area of the textured side wall is larger. In other words, the cavitation intensity of the textured side wall increases slowly, but the range of cavitation is wider. At this time, the presence of texture causes cavitation in areas where cavitation does not occur on the plane surface, so the AGVF and AF of the textured side wall are larger than those of the plane surface. However, because of the lack of drag reduction, the growth rate of energy dissipation rate on the plane surface will be greater than that on the textured side wall as the rotational speed increases, resulting in the faster increase of AGVF and AF on the plane surface. Large AGVF and AF on the textured surface result in a weaker heat transfer when considering cavitation at 14,000 rpm ≤ n ≤18,000 rpm. The situation of two kinds of textures is different at n = 20,000 rpm. When γ = 0.4, heat transfer with cavitation is stronger than that without cavitation. When γ = 2.0, heat transfer with cavitation is weaker than that without cavitation. This is determined by the gas phase distribution and flow field, which will be analyzed later.
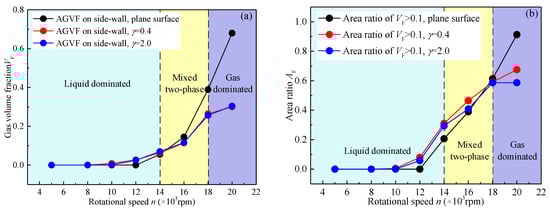
Figure 9.
(a) AGVF on three surfaces at different rotational speeds. (b) Area ratio of VF > 0.1 on three surfaces at different rotational speeds.
According to the previous analysis, a diagram of the gas volume fraction on the side wall at n = 14,000–20,000 rpm is extracted and shown in Figure 10. With the increase of rotational speed, gas volume fraction increases significantly. However, the textured surface effectively suppresses the growth of the gas phase. This phenomenon is more obvious when n = 18,000 rpm and 20,000 rpm. Since the area with a high gas phase is still small at n = 18,000 rpm, the reduction of VF in the textured region (from 0.7 to 0.6) leads to an insignificant effect on the maximum temperature of the seal face. At 20,000 rpm, the decrease of the gas phase begins to be different when γ changes. When γ = 2.0, VF between two rows is almost not reduced (Figure 10(c-4), orange and yellow area). And VF near the seal face (its position is shown in Figure 10(a-4)) is not weakened, either. That means if γ becomes too large, the cavitation intensity between textures will increase. The reason for this phenomenon is that the Velocity Gradient in the Z-direction on the textured surface gradually increases when γ = 2.0.
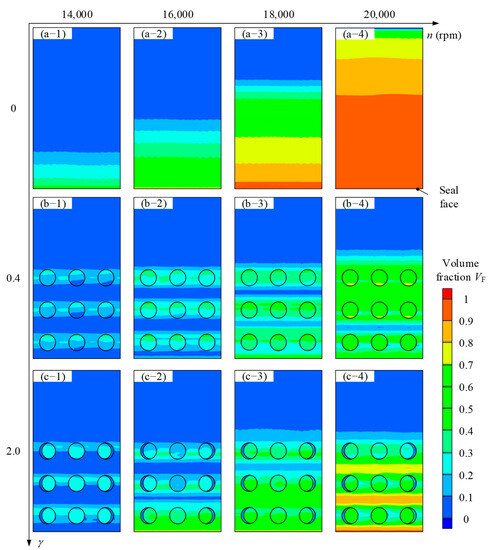
Figure 10.
Gas volume fraction diagram on side wall. (a-1–a-4) Plane surface. (b-1–b-4) Circular texture, γ = 0.4. (c-1–c-4) Circular texture, γ = 2.0.
The average velocity gradient (VG) of the textured surface and the plane surface at different rotational speeds is shown in Figure 11. As rotational speed increases, VG in X-direction of γ = 0.4 increases from 0.8 × 10⁵ s−1 to 14.6 × 10⁵ s−1, VG in X-direction of γ = 2.0 increases from 2 × 10⁵ s−1 to 11 × 105 s−1, and VG in X-direction of plane surface increases from 0.8 × 10⁵ s−1 to 22 × 105 s−1. VG in Y-direction of γ = 0.4 increases from 0.2 × 10⁵ s−1 to 1.2 × 10⁵ s−1, VG in Y-direction of γ = 2.0 increases from 0.4 × 10⁵ s−1 to 1.7 × 10⁵ s−1, and VG in Y-direction of plane surface increases from 0.6 × 10⁵ s−1 to 1.4 × 10⁵ s−1. VG in Z-direction of γ = 0.4 increases from 0.52 × 10⁵ s−1 to 2.4 × 10⁵ s−1, VG in Z-direction of γ = 2.0 increases from 0.52 × 10⁵ s−1 to 2.4 × 10⁵ s−1, and VG in Z-direction of plane surface increases from 1.5 × 10⁴ s−1 to 1.2 × 10⁵ s−1. These are in good agreement with the gas phase distribution mentioned earlier. That is, when n < 18,000 rpm, the textured side wall will enhance drag reduction, which leads to the increase of gas phase, and when n = 20,000 rpm, the textured side wall will cause different results due to different γ. Additionally, VG in the Z-direction of γ = 2.0 is larger than γ = 0.4, which means the gas inside textures flows more easily to the outside of the texture, causing VF between several textures to increase. This phenomenon is also shown in Figure 12(e-4).
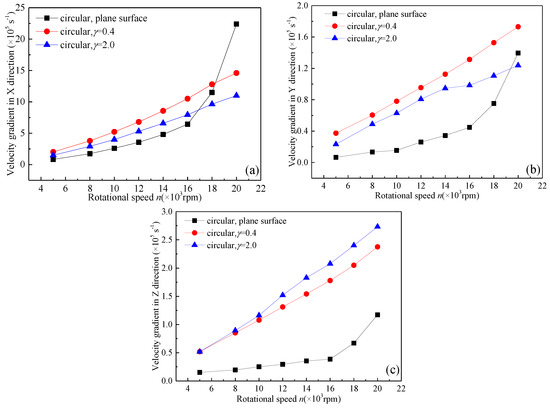
Figure 11.
VG of textured side wall and plane surface. (a) X—direction; (b) Y—direction; (c) Z—direction.
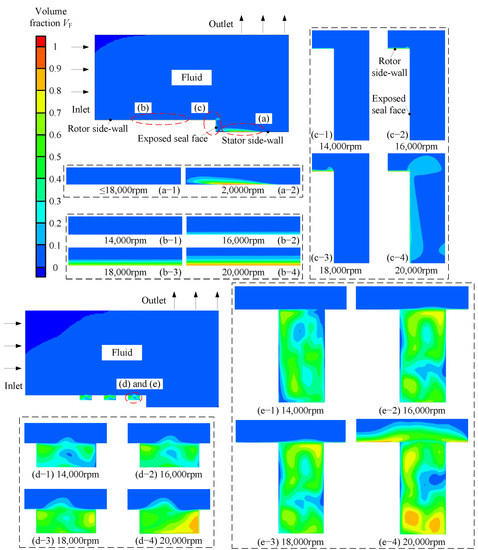
Figure 12.
Gas distribution of seal chamber in X = 0 section. (a) Side wall of stator (plane surface); (b) Side wall of rotor (plane surface); (c) Seal face of rotor (plane surface); (d) Side wall of rotor (circular texture, γ = 0.4); (e) Side wall of rotor (circular texture, γ = 2.0).
Additionally, Ref. [31] shows that drag reduction will be affected by the depth-to-diameter ratio of texture (γ) and velocity near the wall. The maximum drag reduction effect is achieved when velocity is about 24 m/s and γ is about 0.5 [31]. In this study, when n = 20,000 rpm, the velocity of the fluid around the rotor is about 23 m/s, which is close to the best velocity, and γ = 0.4 is also close to the best depth-to-diameter ratio. Importantly, drag reduction leads to less gas phase, which means better heat transfer.
Since the VG of the two textured surfaces is very similar in the three directions, the difference in cooling needs to be further explained by the gas phase distribution at section X = 0. As shown in Figure 12, the gas distribution at the section of X = 0 on the plane surface and textured surface is extracted to explain the necessity of setting texture around the seal ring at high speed. Figure 12a–c are VF contours of three important regions where heat transfer occurs, including the seal face of the rotor, the side wall of the stator, and the side wall of the rotor. From the contours, it can be clearly seen that the VF of the three regions increases rapidly at high speed. And the higher the rotational speed, the faster the VF increases. Moreover, the thickness of the gas layer on the side wall of the rotor also increases when rotational speed increases. The side wall and the exposed seal face of the rotor are almost covered by the gas phase, and the gas phase also appeared on the side wall of the stator at 20,000 rpm. For textured rings, the increase of rotational speed only affects gas distribution inside textures, as shown in Figure 12d,e. With the increase of rotational speed, gas volume fraction in all textures increases. However, it should be noted that the gas range around textures has increased significantly when γ = 2.0, n = 20,000 rpm (Figure 12(e-4)) due to the increase of VG in the Z-direction. This also explains why there is a difference in the VF between γ = 0.4 and γ = 2.0 in Figure 10 at 20,000 rpm.
3.2. Influence of the Shape and the Depth-to-Diameter Ratio of Textures
The above research shows that a textured surface is the most sensitive to drag reduction when n = 20,000 rpm. And the cooling effect of the two kinds of textures is also different at this rotational speed. The difference in cooling effect between the two kinds of textures should be studied further. In addition, it should be discussed whether this phenomenon exists in different shapes of textures.
For these reasons, further exploration is carried out at n = 20,000 rpm. Figure 13 shows the relationship between cooling and γ at n = 20,000 rpm. Figure 13 shows that when cavitation is not considered, the temperature difference between the textured side wall and plane surface gradually increases with the increase of γ. When the fluid is in the liquid phase, textures are equivalent to the heat pipes set in the ring. So, it can be explained that the heat transfer is stronger when the area of the heat pipe increases. Due to the difference in the bottom surface, the side wall area of the triangular is much smaller than that of the circular, so the heat transfer effect is not as good as that of the circular.
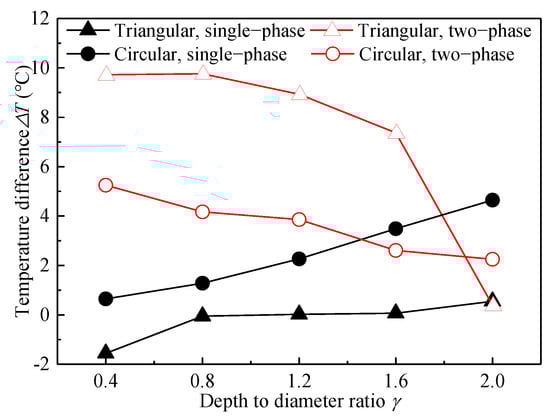
Figure 13.
Temperature reduction at different depth-to-diameter ratios when n = 20,000 rpm.
When cavitation is taken into account, the temperature difference between the textured side wall and plane surface decreases with the increase of γ, and the curve of triangular texture decreases more obviously. This phenomenon is consistent with that found in Figure 11; that is, if γ becomes too large (more than 1.6), the cavitation intensity at the gap between several textures will increase sharply. In addition, the circulation in triangular is more severe than that in circular when γ increases. When gas occurs, the circulation causes a more serious weakening of heat transfer due to small thermal conductivity and specific heat capacity, which makes the temperature of the fluid within the textures higher and the heat transfer between the upper and lower vortex weaker.
The results shown in Figure 14 and Figure 15 represent the Nu number at the bottom of each texture, η is the ratio of the local Nu number on the textured side wall to the average Nu number on the smooth side wall, subscripts c and t represent circular and triangular respectively. There are two high heat transfer regions in the figure: (1) the texture inlet (φ = 270°) and (2) the wake region at the texture outlet (φ = 90°). The distribution of ηc in these regions is related to the local gas volume fraction (LGVF) of the side wall. Figure 10(b-4) shows an area of small LGVF (light blue area) that appears at the wake region of FRT, and Figure 14d also shows a high heat transfer area at the same location, making the wake area of FRT look more asymmetric. However, due to greater local turbulence, the influence of the gas phase needs to be considered together with the local flow field in the texture. In general, when γ < 1.6, the heat transfer of the bottom surface with cavitation is stronger than that without. And when γ > 1.6, things go differently. For both texture shapes, the stratification of the internal flow field is more obvious when γ increases. The mass exchange between the bottom fluid and the main flow is difficult, resulting in a temperature rise of the bottom fluid. For gas, its thermal conductivity is worse, and the specific heat capacity is smaller, causing the temperature of gas near the bottom to become higher than the temperature of liquid when flow fields are similar. And the higher temperature affects the heat transfer of the bottom. This situation is similar to the phenomenon of flow internal circulation near the seal face observed in the study of the pump ring [37]. Observing the bottom heat transfer of both textures at high-speed conditions, the reduction rate of the triangular texture is much higher than the circular texture. It is also caused by the more severe fluid stratification in triangular texture.
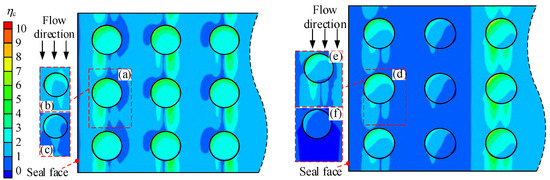
Figure 14.
ηc on the bottom of circular texture at n = 20,000 rpm. (a) Single phase, γ = 0.4; (b) Single phase, γ = 0.8; (c) Single phase, γ = 2; (d) Two-phase, γ = 0.4; (e) Two-phase, γ = 0.8; (f) Two-phase, γ = 2.
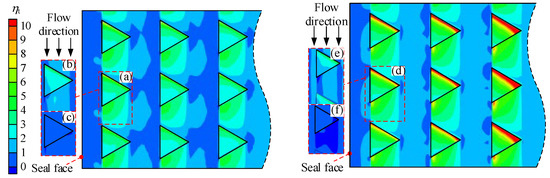
Figure 15.
ηt on the bottom of triangular texture at n = 20,000 rpm. (a) Single phase, γ = 0.4; (b) Single phase, γ = 0.8; (c) Single phase, γ = 2; (d) Two-phase, γ = 0.4; (e) Two-phase, γ = 0.8; (f) Two-phase, γ = 2.
Since the VF of each row of textures is similar, the VF of FRT is extracted to further analyze the influence of γ on heat transfer. As shown in Figure 16, when γ increases, the VF around the texture increases significantly, especially in the triangular texture. This also explains why the heat transfer of each texture decreases after γ increases, while triangular texture decreases much faster than circular texture when γ > 1.6. This is mainly because when γ increases, some effects will be significantly different. First, the jet will enhance the downstream heat transfer when the temperature of the fluid in textures is lower than the outside surface. But when γ increases, the jet weakens, and the fluid in the texture becomes the high-temperature gas, which will weaken heat transfer.
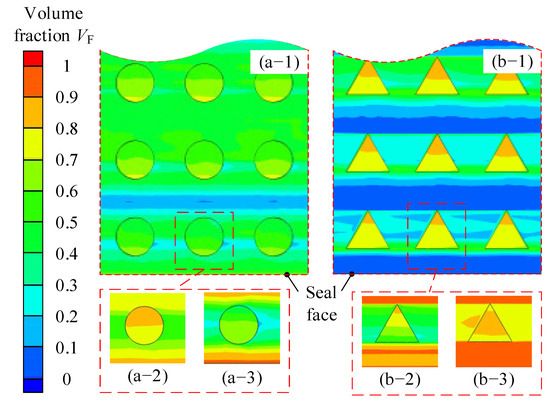
Figure 16.
Gas volume distribution of different textures. (a-1) Circular, γ = 0.4; (a-2) Circular, γ = 0.8; (a-3) Circular, γ = 2.0; (b-1) Triangular, γ = 0.4; (b-2) Triangular, γ = 0.8; (b-3) Triangular, γ = 2.0.
Figure 17 shows the pressure distribution on the side wall of the circular texture at high speed, and the gas volume distribution can be explained by the pressure distribution curve. The pressure distribution of the circular texture at the top (h/h0 = 0) and bottom (h/h0 = 1) is the same when γ changes. The top has two peaks on the outlet side (φ = 0°~180°), corresponding to the wake region and jet flow mentioned above. The jet can place a layer of fluid on the downstream solid wall of textures to reduce drag and cavitation intensity, corresponding to the local gas phase distribution observed previously. However, when γ gradually increases, the pressure difference between the peak and the other angles gradually decreases, indicating that the intensity of the downstream jet flow gradually weakens when γ increases. The bottom pressure distribution is almost the same in different γ and is higher at the outlet side (φ = 0°~180°) due to the vortex distribution in the texture. The vortex near the bottom rotates clockwise in the cross-section of three cases, causing the velocity of the fluid at the outlet side points to the wall and the velocity at the inlet side points away from the wall. This vortex presents a regular curve of the pressure. When γ = 2, it shows a difference in the middle (h/h0 = 0.5) (Figure 17(c-2)). From the streamline diagram shown later, it can be seen that a new vortex is added between the upper and lower vortex that originally existed in texture when γ = 2, which causes pressure peak at φ = 180°~360° disappeared.
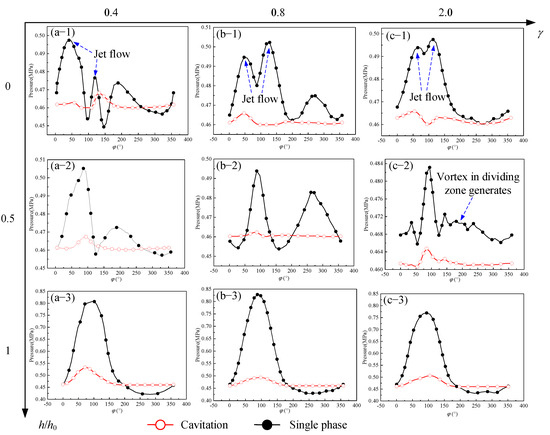
Figure 17.
Pressure distribution on the side wall of circular texture (n = 20,000 rpm).
Figure 18 shows the pressure distribution on the side wall of the triangular texture at high speed. The geometric changes in the triangular textures are sudden, so the local flow field changes suddenly. Therefore, there are 3 points of discontinuity in the pressure distribution curve, which are φ = 60°, 180°, and 300° (called Angle1, Angle2, and Angle3). Angle1 and 2 are the downstream outflow angles of triangular textures, where the fluid has an impact on the surface, so there is a pressure peak. Since the fluid outflow at Angle1 is more than at Angle2, the maximum pressure at Angle1 is higher. Angle 3 is the angle of the inlet, where the fluid has a flow separation phenomenon that results in low pressure. And triangular will also reduce drag and cavitation intensity downstream, just like the circular. Finally, φ = 60°~180° is the boundary of the outlet, and the pressure on this boundary is high.
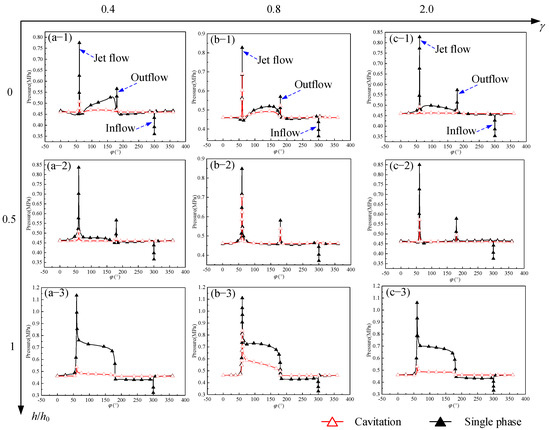
Figure 18.
Pressure distribution on the side wall of triangular texture (n = 20,000 rpm).
Due to the complexity of the flow in the texture, it is necessary to analyze the flow field in the texture. Afterward, the influence of γ and shape on ∆T is revealed from the different flow fields.
Figure 19 shows the flow field in the cross-section of texture. The flow fields in the two kinds of textures are very different. In circular texture, fluid flows evenly into the texture, forming two jet flows and sparse outflows downstream. And in triangular texture, fluid evenly flows into texture, forming vortex1 and vortex2. Vortex1 and vortex2 exchange fluid through the flow near the wall (blue zone). Then, a dense jet flow caused by vortex2 is formed at Angle1 (The jet causes a larger pressure surge at Angle1), and sparse fluid flows out at the edge of the outlet (the sparse flow causes a smaller pressure surge at Angle2). When γ is too large (more than 1.6), VF in the texture is large, leading to excessive fluid temperature. The temperature of the fluid flowing out of the texture is higher than that without cavitation. This reduces the heat transfer downstream in Figure 14 and Figure 15.
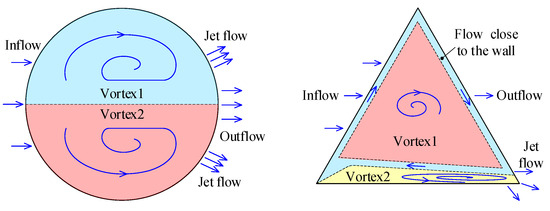
Figure 19.
Flow field on the cross-section of different textures (n = 20,000 rpm).
Figure 20 and Figure 21 represent the streamlines of cross-section (Z = 0.5 mm) with different γ and shapes. It can be seen from the streamline that there is fluid stratification in both shapes, but the specific flow field is different. The flow field of texture under five γ was observed, and three γ were extracted as the analysis objects (γ = 0.4, γ = 0.8, γ = 2.0). The first two show the development of the vortex as γ increases, and the third shows the fluid stratification phenomenon mentioned many times above. The three-dimensional streamlines in the extracted texture are shown in Figure 22. Since the three-dimensional flow fields of circular texture at γ = 0.4 and γ = 0.8 are similar, only the three-dimensional flow fields at γ = 0.8 and γ = 2.0 are extracted. However, the lower vortex of triangular is quite different when γ = 0.8, so the flow field of all three γ is extracted.
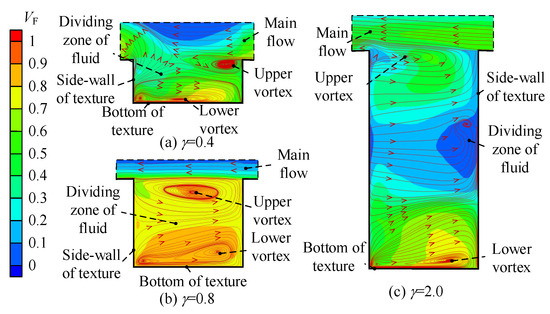
Figure 20.
Streamlines on cross-section Z = 0.5 mm with different γ (circular, 20,000 rpm).
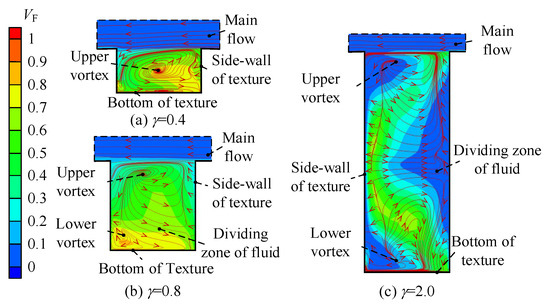
Figure 21.
Streamlines on cross-section Z = 0.5 mm with different γ (triangular, 20,000 rpm).
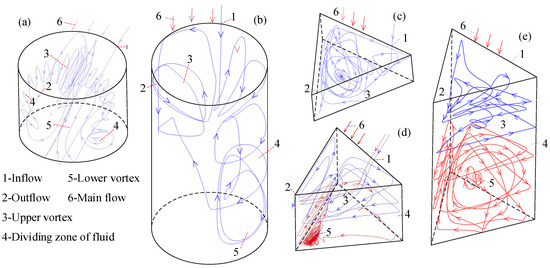
Figure 22.
Three-dimensional streamline at different γ (n = 20,000 rpm). (a) Circular, γ = 0.8; (b) Circular, γ = 2.0; (c) Triangular, γ = 0.4; (d) Triangular, γ = 0.8; (e) Triangular, γ = 2.0.
In the circular textures, when γ is large (more than 1.6), although it is difficult for the mains flow to directly enter the texture, there is a small fluid exchange between the upper and lower vortex. And the stratification of triangular texture is more thorough. This causes the lower vortex to take away heat only by heat convection, while the upper vortex can directly take away the hotter fluid by mass transfer. Therefore, stratification will greatly affect heat transfer.
Figure 20b,c show that after γ of the circular texture increases, there is a partial mass transfer between the lower vortex and upper vortex. Figure 22b also shows that the upper fluid will enter the lower layer. However, when γ is large, the area occupied by the lower vortex gradually increases. Then, the region with high-temperature fluid becomes larger, and the heat transfer at the bottom of the texture is weakened. For triangular texture, Angle1 converges fluid when γ = 0.4, making the heat exchange between the side wall and downstream jet flow more intense. Therefore, the local high heat transfer near Angle1 in Figure 15d is generated. Additionally, Figure 20a and Figure 21a show that the lower fluid has a direct impact on the bottom and flows to the outlet along the surface, which leads to the strongest heat transfer on the inlet side of the bottom and then weakens linearly along the flow direction. As shown in Figure 21c, when γ =2.0, the occupied range of the lower vortex increases, and there is a clear boundary layer between the lower vortex and the upper vortex. Therefore, for triangular texture with large γ, t fluid in the lower part of the texture shows internal circulation under high-speed conditions, which makes it difficult to obtain a mass transfer through the upper vortex or the main flow and is difficult to transfer heat, too. Compared to the two shapes of textures, the triangular texture has a more serious internal circulation of the lower vortex, resulting in a worse heat transfer.
There is a vortex occupying the large space inside the texture when γ = 0.4. After γ increases, the lower vortex begins to become large, and fluid stratification occurs. This phenomenon is the reason for a decrease in the heat transfer in the texture when γ increases. However, the lower vortex in triangular texture rarely exchanges with the upper vortex, while the upper and lower vortex in circular texture still exchange fluid. Therefore, the heat transfer of circular texture is better than that of triangular texture when γ > 1.6.
4. Conclusions
The textured surface is used to weaken the cavitation intensity on the side wall of the seal ring under high-speed conditions, and the maximum temperature of the seal face is effectively reduced. Compared to previous studies, there are two improvements. First, the application of texture is expanded from low-speed, single-phase to high-speed, two-phase. Second, the flow fields inside two kinds of textures are summarized, which provides a useful idea for the design of textures and proposes a new method for controlling the temperature of mechanical seals. The detailed conclusions are shown as follows:
- Cavitation intensity is related to the maximum temperature of the seal face. When the cavitation becomes stronger, the heat transfer of the surface is weakened, and the maximum temperature of the seal face increases;
- The cavitation intensity of the side wall increases with the increase of rotational speed, but the law of cavitation intensity on three surfaces is different. Cavitation intensity on the plane surface occurs at the latest, but it grows fastest, leading to three stages of the gas phase: liquid-dominated, mixed two-phase, and gas-dominated. These stages cause a big difference in heat transfer;
- Cavitation intensity can be explained by velocity gradient. The velocity gradient is positively correlated with turbulent kinetic energy dissipation. At first, the velocity gradient on textured surfaces is smaller than that on plane surfaces but soon catches up with the increase of rotational speed, and the change of cavitation intensity is also the same;
- The increase in depth-to-diameter ratio produces two opposite effects: (1) it increases the area of heat transfer, and (2) it causes fluid stratification in the textures. The first will enhance heat transfer, and the second will weaken heat transfer. In a deep texture (γ = 1.6 or 2.0), the first is dominant when the fluid is mainly liquid, and the second is dominant when the fluid is mainly gas. This is because the smaller specific heat capacity and thermal conductivity of the gas lead to poor heat transfer after stratification, but the liquid is less affected;
- The shape of textures will influence the flow field and pressure field on the textured side wall. First, the fluid stratification inside the triangle is more serious after the depth-to-diameter ratio increases. Second, if the two kinds of textures have similar hydraulic diameter and depth, the circular texture has a larger area of heat transfer. The first reason makes the shallow triangular texture perform better in multiphase, while the second reason makes the deep, circular texture perform better in single-phase;
- According to the previous conclusions, a deep, circular texture is recommended when cavitation will not occur (situations with high pressure and low speed), and a shallow triangular texture is better when cavitation occurs (situations with low pressure and high speed, such as a high-speed turbopump).
Author Contributions
Conceptualization, X.P. and X.M.; methodology, M.Y.; software, M.Y. and Y.M.; validation, X.M. and J.J.; formal analysis, M.Y.; investigation, X.P. and X.M.; data curation, M.Y. and Y.M.; writing—original draft preparation, M.Y.; writing—review and editing, X.P., X.M. and J.J.; supervision, X.P. All authors have read and agreed to the published version of the manuscript.
Funding
The research was financially supported by the Zhejiang Provincial Natural Science Foundation of China (No. LD21E050002), the General Projects of the National Natural Science Foundation of China (No. 52175193), and the Key Program of the National Natural Science Foundation of China (No. U2241246).
Data Availability Statement
Not applicable.
Conflicts of Interest
All authors declare that they have no known competing financial interest or personal relationships that could have appeared to influence the work reported in this paper.
Nomenclature
| a | Axial gap of texture mm |
| b | Spacing to seal face mm |
| cp | Specific heat capacity J·kg−1·K−1 |
| d | Characteristic length of texture mm |
| d1 | Outer diameter of fluid zone mm |
| d2 | Outer diameter of seal face mm |
| d3 | Inner diameter of seal face mm |
| d4 | Outer diameter of stator mm |
| d5 | Inner diameter of stator mm |
| F | Model decision parameter |
| f | coefficient of friction |
| h0 | Depth of texture mm |
| k | Thermal conductivity W·m−1·K−1 |
| k0 | Turbulent kinetic energy m−2·s−2 |
| ld | Rotor length mm |
| ls | Stator length mm |
| n1 | Row number |
| n | rotational speed rpm |
| q | Heat flux on the wall W·m−2 |
| T | Ambient temperature K |
| ∆T | Maximum temperature difference °C |
| Tmax | Maximum temperature on the seal face of ring with cavitation °C |
| tmax | Maximum temperature on the seal face of ring without cavitation °C |
| u | Velocity in a certain direction m·s−1 |
| VF | Gas volume fraction |
| velocity vector m·s−1 | |
| X, Y, Z | Coordinate system directions mm |
| z | z-directions used in Ref. mm |
| y+ | Grid parameters of coupled wall |
| Simplification of nomenclature | |
| AGVF | Average gas volume fraction |
| FRT | First row of textures |
| LGVF | Local gas volume fraction |
| VG | Velocity gradient |
| Greek letters | |
| α | The ratio of shear stress to turbulent kinetic energy inside boundary layer |
| α0 | Circumferential gap of texture ° |
| β | Constant of dissipation term used in k-equation |
| Φ, Φ1, Φ2 | Intermediate values used in the calculation of each parameter |
| γ | Depth-to-diameter ratio of textures |
| η | Ratio of local Nu number and average Nu number on side wall |
| μ | Dynamic viscosity of fluid Pa·s |
| ρ | Density kg∙m−3 |
| σk | Constant of diffusion term used in k-equation |
| σω | Constant of diffusion term used in ω-equation |
| ν | Kinematic viscosity m2∙s−1 |
| ω | Vorticity s−1 |
| ω0 | Turbulent dissipation rate m2∙s−2 |
| Subscript | |
| g, l, m | Gas phase, liquid phase, and mixed phase |
| i, j | Component of the vector in the coordinate direction |
References
- Peng, X.; Jin, J.; Li, D.; Jiang, J.; Meng, X.; Li, J. Analysis of Face Temperature in Mechanical Seal Applied in the High Speed Turbo pump. Tribology 2019, 39, 313–318. [Google Scholar] [CrossRef]
- Cheng, W.; Meng, X.; Wang, Y.; Liang, Y.; Peng, X. Finite Element Model and Tribological Properties Analysis of Textured Mechanical Seals Considering Roughness Effect. Tribology 2019, 39, 523–530. [Google Scholar] [CrossRef]
- Luan, Z.; Khonsari, M. Heat transfer correlations for laminar flows within a mechanical seal chamber. Tribol. Int. 2008, 42, 770–778. [Google Scholar] [CrossRef]
- Qiu, Y.; Meng, X.; Liang, Y.; Peng, X. Thermal mixing effect and heat transfer in U-shaped notch on the mechanical seal face. Proc. Inst. Mech. Eng. Part J J. Eng. Tribol. 2020, 235, 1924–1936. [Google Scholar] [CrossRef]
- Chen, H.; Gui, K.; Li, X.; Han, T.; Xie, X.; Lu, J. Influences of Operating Parameters on Vaporization Characteristics and Properties of Liquid Films for Mechanical Seals. China Mech. Eng. 2021, 32, 2–11. [Google Scholar] [CrossRef]
- Wu, T.Y.T. Cavity and Wake Flows. Annu. Rev. Fluid Mech. 1972, 4, 243–284. [Google Scholar] [CrossRef]
- Zhang, J.; Zhang, J.; Shen, Z.; Chen, Y. Influence of Boundary Pressure Fluctuation on Cavitation and Performance of Liquid Film End Face Mechanical Seal. Chem. Ind. Eng. Prog. 2022, 41, 5175–5187. [Google Scholar] [CrossRef]
- Li, X.; Yang, Z.; Xu, J.; Chen, R.; Yang, H. The fractal leakage model of contact mechanical seals considering wear and thermal deformation. J. Braz. Soc. Mech. Sci. Eng. 2019, 41, 521. [Google Scholar] [CrossRef]
- Li, B.; Sun, J.; Zhu, S.; Fu, Y.; Zhao, X.; Wang, H.; Teng, Q.; Ren, Y.; Li, Y.; Zhu, G. Thermohydrodynamic lubrication analysis of misaligned journal bearing considering the axial movement of journal. Tribol. Int. 2019, 135, 397–407. [Google Scholar] [CrossRef]
- Wang, Q.; Hu, Y.-P.; Ji, H.-H. Leakage, heat transfer and thermal deformation analysis method for contacting finger seals based on coupled porous media and real structure models. Proc. Inst. Mech. Eng. Part C J. Mech. Eng. Sci. 2020, 234, 2077–2093. [Google Scholar] [CrossRef]
- Peng, C.; Ouyang, X.; Schmitz, K.; Wang, W.; Guo, S.; Yang, H. Investigation of the tribological performance of reciprocating seals in a wide temperature range. Proc. IMechE Part J J. Eng. Tribol. 2021, 235, 2396–2414. [Google Scholar] [CrossRef]
- Chávez, A.; De Santiago, O. Experimental measurements of the thermo elastic behavior of a dry gas seal operating with logarithmic spiral grooves of 11° and 15°. Proc. IMechE Part J J. Eng. Tribol. 2020, 235, 1807–1819. [Google Scholar] [CrossRef]
- Meng, X.; Zhao, W.; Shen, M.; Peng, X. Thermohydrodynamic analysis on herringbone-grooved mechanical face seals with a quasi-3D model. Proc. Inst. Mech. Eng. Part J J. Eng. Tribol. 2018, 232, 1402–1414. [Google Scholar] [CrossRef]
- Xiao, N.; Khonsari, M. Thermal performance of mechanical seals with textured side-wall. Tribol. Int. 2012, 45, 1–7. [Google Scholar] [CrossRef]
- Nian, X.; Khonsari, M.M. Improving Thermal Performance of Mechanical Seals with Surface Texturing. Proc. IMechE Part J J. Eng. Tribol. 2015, 229, 350–361. [Google Scholar] [CrossRef]
- Zhou, Y.; Peng, X.; Zhao, W.; Jiang, J.; Meng, X. Study on Heat Transfer Mechanism and Optimization of Circumferential Texture of Mechanical Seal. Tribology 2020, 4, 538–550. [Google Scholar] [CrossRef]
- Afanasyev, V.; Chudnovsky, Y.; Leontiev, A.; Roganov, P. Turbulent flow friction and heat transfer characteristics for spherical cavities on a flat plate. Exp. Therm. Fluid Sci. 1993, 7, 1–8. [Google Scholar] [CrossRef]
- Chyu, M.K.; Yu, Y.; Ding, H.; Downs, J.P.; Soechting, F.O. Concavity Enhanced Heat Transfer in an Internal Cooling Passage. In Proceedings of the ASME 1997 International Gas Turbine and Aeroengine Congress and Exhibition, Orlando, FL, USA, 2–5 June 1997. [Google Scholar] [CrossRef]
- Xu, L.; Wu, J.H.; Wang, Y.; Rafique, F.; Xu, J.; Yuan, X. Lubrication and stability enhancement by attaching superconducting magnetic force on non-contacting mechanical seals for reusable rocket turbopump. Proc. Inst. Mech. Eng. Part J J. Eng. Tribol. 2021, 236, 892–907. [Google Scholar] [CrossRef]
- Elrod, H.G. A cavitation algorithm. J. Lubr. Technol. 1981, 103, 350–354. [Google Scholar] [CrossRef]
- Vijayaraghavan, D.; Keith, T.G. Development and Evaluation of a Cavitation Algorithm. Tribol. Trans. 1989, 32, 225–233. [Google Scholar] [CrossRef]
- Han, Y.; Meng, Q.; de Boer, G. Two-scale homogenization of hydrodynamic lubrication in a mechanical seal with isotropic roughness based on the Elrod cavitation algorithm. Proc. Inst. Mech. Eng. Part J J. Eng. Tribol. 2021, 236, 359–385. [Google Scholar] [CrossRef]
- Guo, Q.; Zhou, L.; Wang, Z.; Liu, M.; Cheng, H. Numerical simulation for the tip leakage vortex cavitation. Ocean Eng. 2018, 151, 71–81. [Google Scholar] [CrossRef]
- Song, Y.; Gu, C.-W. Development and Validation of a Three-Dimensional Computational Fluid Dynamics Analysis for Journal Bearings Considering Cavitation and Conjugate Heat Transfer. J. Eng. Gas Turbines Power 2015, 137, 122502. [Google Scholar] [CrossRef]
- Ge, M.; Petkovšek, M.; Zhang, G.; Jacobs, D.; Coutier-Delgosha, O. Cavitation dynamics and thermodynamic effects at elevated temperatures in a small Venturi channel. Int. J. Heat Mass Transf. 2021, 170, 120970. [Google Scholar] [CrossRef]
- Ge, M.; Manikkam, P.; Ghossein, J.; Subramanian, R.K.; Coutier-Delgosha, O.; Zhang, G. Dynamic mode decomposition to classify cavitating flow regimes induced by thermodynamic effects. Energy 2022, 254, 124426. [Google Scholar] [CrossRef]
- Ge, M.; Zhang, G.; Petkovšek, M.; Long, K.; Coutier-Delgosha, O. Intensity and regimes changing of hydrodynamic cavitation considering temperature effects. J. Clean. Prod. 2022, 338, 130470. [Google Scholar] [CrossRef]
- Ge, M.; Sun, C.; Zhang, G.; Coutier-Delgosha, O.; Fan, D. Combined suppression effects on hydrodynamic cavitation performance in Venturi-type reactor for process intensification. Ultrason. Sonochemistry 2022, 86, 106035. [Google Scholar] [CrossRef]
- Li, W.; Yu, Z.; Kadam, S. An improved cavitation model with thermodynamic effect and multiple cavitation regimes. Int. J. Heat Mass Transf. 2023, 205, 123854. [Google Scholar] [CrossRef]
- Tian, L.M.; Ren, L.Q.; Liu, Q.P.; Han, Z.W.; Jiang, X. The mechanism of drag reduction around bodies of revolution using bionic non-smooth surfaces. J. Bionic Eng. 2007, 4, 109–116. [Google Scholar] [CrossRef]
- Zhao, J. Study of Drag Reduction Capability of the Dimple Bionic Non-Smooth Surface. Masteral Dissertation, Dalian University of Technology, Dalian, China, 2008. [Google Scholar]
- Tao, W. Numerical Heat Transfer; Xi’an Jiaotong University Press: Shaanxi, Xi’an, 2001. [Google Scholar]
- Menter, F.R. Review of the shear-stress transport turbulence model experience from an industrial perspective. Int. J. Comput. Fluid Dyn. 2009, 23, 305–316. [Google Scholar] [CrossRef]
- Wang, Z. Parameter Modification of SST k-ω Turbulence Model Based on Bluff Body Wind Pressure Data. Masteral Dissertation, Harbin Institute of Technology, Harbin, China, 2020. [Google Scholar]
- Robinson, S.K. Coherent Motions in the Turbulent Boundary Layer. Annu. Rev. Fluid Mech. 1991, 23, 601–639. [Google Scholar] [CrossRef]
- Merati, P.; Okita, N.A.; Phillips, R.L.; Jacobs, L.E. Experimental and Computational Investigation of Flow and Thermal Behavior of a Mechanical Seal. Tribol. Trans. 1999, 42, 731–738. [Google Scholar] [CrossRef]
- Warda, H.; Adam, I.; Rashad, A.; Gamal-Aldin, M. Bi-directional integral pumping devices for dual mechanical seals: Influence of mesh type on accuracy of numerical simulations. Alex. Eng. J. 2018, 57, 3255–3264. [Google Scholar] [CrossRef]
Disclaimer/Publisher’s Note: The statements, opinions and data contained in all publications are solely those of the individual author(s) and contributor(s) and not of MDPI and/or the editor(s). MDPI and/or the editor(s) disclaim responsibility for any injury to people or property resulting from any ideas, methods, instructions or products referred to in the content. |
© 2023 by the authors. Licensee MDPI, Basel, Switzerland. This article is an open access article distributed under the terms and conditions of the Creative Commons Attribution (CC BY) license (https://creativecommons.org/licenses/by/4.0/).