Article

Optimization of the Tribological Performance and Service Life of Calcium Sulfonate Complex—Polyurea Grease Based on Unreplicated Saturated Factorial Design

1
School of Mechanical and Electrical Engineering, Wuhan University of Technology, Wuhan 430070, China
2
SAIC GM-Wuling Automobile Co., Ltd., Liuzhou 545007, China
*
Author to whom correspondence should be addressed.
Lubricants 2023, 11(9), 377; https://doi.org/10.3390/lubricants11090377
Submission received: 17 August 2023 / Revised: 31 August 2023 / Accepted: 4 September 2023 / Published: 5 September 2023
(This article belongs to the Special Issue Grease II)

Abstract

:
In order to further extend the service life of calcium sulfonate complex–polyurea grease (CSCPG) while ensuring its tribological performance, this article starts with the production of raw materials and the preparation process of the grease and explores the factors that significantly affect the tribological performance and service life of CSCPG based on unreplicated saturated factorial design (USFD). The Kriging prediction model is used along with the optimization objectives of friction coefficient and service life, and nondominated sorting genetic algorithm II (NSGA-II) was used for a multi-objective optimization solution. The tribological and service life tests were conducted before and after optimization. The results show that the viscosity of the base oil and the content of the nano-solid friction reducers have a significant impact on the tribological properties of CSCPG. The content of polyurea thickeners and antioxidants, as well as the thickening reaction temperature, have a significant impact on the service life of CSCPG. When the friction coefficient and service life are optimized as objectives and are compared to the initial group, the friction coefficient of CSCPG could be reduced by 5.3%, and the service life could be extended by 3.8%. The Kriging prediction model based on USFD has high accuracy and can be used to guide the preparation and performance optimization of CSCPG.

1. Introduction

Bearings are the core supporting components of rotating machinery. With the popularization of ultra-precision machining technology in the field of bearing processing, surface roughness and machining accuracy are no longer the main factors restricting bearing quality. More bearing failures are caused by lubrication failures, and bearing lubrication has gradually become a key factor in the reliability and efficiency of mechanical systems [1]. Therefore, how to improve bearing lubrication status to reduce bearing friction and extend bearing life while meeting the requirements of various extreme working conditions has significant theoretical significance and engineering application value.
The thickening agent system of calcium sulfonate complex grease (CSCG) mainly consists of two parts [2,3]. One part is non-Newtonian overbased petroleum calcium sulfonate, in which calcium carbonate exists in the form of calcite crystals and is encapsulated by a certain concentration of calcium sulfonate to form stable micelles [4]. The other part is composite calcium soap (including fatty acid calcium, borate calcium, etc.), which together form a relatively complex thickening agent system, giving CSCG excellent high- and low-temperature performance, oxidation stability, and lubrication performance [5]. Research has shown that CSCG has a more stable friction coefficient and higher wear resistance when compared to commercial lithium greases [6], and better thermal stability and a higher high-temperature bearing capacity when compared to composite lithium greases [7]. Therefore, in recent years, CSCG has been widely used in bearing lubrication, especially in high-temperature greases, showing unique vitality.
Calcium sulfonate thickener can form a boundary friction film composed of CaCO3, CaO, iron oxide, and FeSO4 on the friction surface [8], which is an important reason for the great wear resistance of CSCG. However, Gao, Y [9] compared the tribological behavior of CSCG and polyurea grease via SRV (Schwingung, Reibung, Verschleiss) experiments and found that CSCG had poorer friction-reducing performance than the latter. Therefore, many researchers have used nano-solid friction reducers to improve the tribological properties of CSCG. WS2 nanoparticles can effectively reduce the friction coefficient of lubricating grease, which is mainly attributed to the adsorption and frictional chemical reactions between WS2 nanoparticles and the matrix [10]. Multiple combinations of nanoparticles are added to CSCG (such as the combination of hexagonal boron nitride and nano-Al2O3 [11] or the combination of MoS2, CuO, SiO2, and Al2O3 nanoparticles [12]). This can not only improve the tribological performance of CSCG but also suppress bearing vibration. The tribological and rheological properties of polyurea greases depend on both the viscosity of the base oil [13,14], and the structure of the used amine [15,16] tetraurea with a granular structure presents optimal physicochemical properties and structural strength; the diurea grease with a rodlike structure presents the optimal tribological properties [17], and its excellent lubrication properties mainly depend on the synergistic effect of the lubricating grease film and the chemical reaction film [18].
The service life of lubricating grease directly affects the service life of bearings. Lubricating grease not only provides lubrication protection for bearings but also serves as a seal to prevent water from entering the bearings [19]. CSCG can be widely used in humid environments due to its unique water absorption performance. CSCG contaminated by water can generate a uniform water calcium sulfonate thickener micelle structure [20,21]. However, during the friction process, water can have an impact on the film-forming ability and film thickness of CSCG [22]. Cyriac, F [23] found that the effect of water on elasto-hydrodynamic lubrication film thickness is related to oil leakage. Unlike lithium grease and polyurea grease, the oil leakage of CSCG decreases after being contaminated with water, leading to an increase in starvation. When compared with uncontaminated grease, the film is thinner.
Experiments based on a factorial design can screen for significant influences among a large number of possible factors, and unreplicated factorial design experiments tend to be saturated when a large number of factors are considered. The USFD method [24,25] requires fewer tests in the factorial design, and a larger number of factors can be examined, which saves both test time and test costs. The Kriging prediction model [26] is an unbiased estimation model that predicts responses for unknown points based on known sample point information. This model converts the positional relationship between sample points in space into a variance relationship and performs an optimal linear unbiased estimation of variables in a limited area. The established prediction model has high fitting accuracy in highly nonlinear situations. NSGA-II [27,28] is an improved version of NSGA, which uses a fast, nondominated sorting technique and the crowding principle to solve the problems of NSGA, such as the complexity being too high and the excellent individuals not being easy to select in the iterative process, which has the advantages of good solution convergence and a fast running speed.
Indeed, significant progress has been made in previous research on the tribological properties and service life of CSCG after water absorption. However, there are still some issues that need further research, such as the poor sensitivity of CSCG to nano-solid friction reducers, and there is relatively little research on how to balance the lubrication performance and service life of CSCG. In response to the above issues, this study started with the production of raw materials and preparation process for lubricating grease and introduced organic polyurea compounds into CSCG to prepare calcium sulfonate complex–polyurea grease (coded CSCPG). Based on USFD, the factors that significantly affect the tribological performance and service life of CSCPG were explored, and a Kriging prediction model of CSCPG was established to optimize the friction coefficient and service life. NSGA-II was used for multi-objective optimization solutions, and the performance of the lubricating grease before and after optimization was compared through tribological tests and life tests. The research work can provide a theoretical and experimental basis for the preparation and optimization of high-temperature lubricating grease.

2. Design and Preparation

2.1. Preparation of CSCPG

As shown in Figure 1, the preparation process of CSCPG is as follows: Firstly, the overbased calcium sulfonate T106A (the total base number ≥ 395 mgKOH/g) and water accounting for 10~20% of the total weight of the overbased calcium sulfonate are added to a reactor containing the base oil for mixing; this is stirred evenly and heated to 80 °C. Then, add the transforming agent (ethylene glycol monomethyl ether) to the reactor and stir evenly; the conversion is carried out at T1 = 90 °C, the conversion time is t1 = 60~90 min, and the temperature is controlled at T2 = 95~100 °C. After that, the saponification reaction is carried out by adding saponification agents (fatty acid, boric acid), and the saponification time is t2 = 60 min. Then, control the temperature T3 = 90~100 °C, add the polyurea thickener (diisocyanate, toluidine) to the above reaction kettle for a constant temperature reaction of t3 = 90 min, rapidly cool to below T4 = 80 °C, add nano-solid friction reducers (WS2 nanoparticles) and antioxidant agent (dialkyl diphenylamine) and stir for t4 = 30 min to mix the additives and lubricating grease evenly. Finally, grind with a three-roller mill grinder to obtain the finished lubricating grease.

2.2. Unreplicated Saturated Factorial Design

From Figure 1, the preparation of CSCPG encounters problems, such as multiple types of raw materials, complex processes, and multiple control points. There may also be mutual influences among the various factors. Even if the raw materials are completely the same, CSCPG batches that have different performances will be prepared due to different process flows. However, the optimization of a single factor often cannot meet the demand for improving the performance of lubricating grease, and it is impossible for all factors to have a significant impact on the performance of lubricating grease. Therefore, it is of great significance to deeply explore the key influencing factors of CSCPG performance. Here, the USFD method is used to identify the significant influencing factors on the performance of CSCPG using as few experiments as possible. The following statistical model is used to describe this problem.
y j = i = 0 p x j i β i + ε j j = 1 , , n
In Equation (1):
(1)
y = (y1, …, yn) T is the observation vector, and n is the number of experiments;
(2)
βi, i = 0, …, p is an unknown set of significant influencing factor parameters, β0 is the general average, and they are all parameters to be estimated, p = n − 1;
(3)
xi = (x1i, x2i, …, xni) T is an orthogonal design matrix, with the column vectors x0, x1, …, xp being known, x0 = 1n being n-dimensional column vectors with all elements 1, x1, …, xp determined by the experimental design;
(4)
ε = (ε1, …, εn) T is the error vector and assumes: εi, i = 1, …, n are independent random variables with the same mean of 0 and the same variance σ2, εi follows a normal distribution, i.e., ε~N(0, σ2In); there are, at most, r(1 ≤ r < p) factors with nonzero effects among the p factors, i.e., at most, the r of β1, …, βp are not equal to zero.
The purpose is to use n observation values y1, …, yn to observe whether there is a significant effect among the p effects. That is, to test the following assumptions:
H0. 
β1 = β2 = … = βp = 0.
H1. 
βi is not all zero.
If H0 is rejected, this indicates the presence of significant factors, and then we determine which factors are significant.

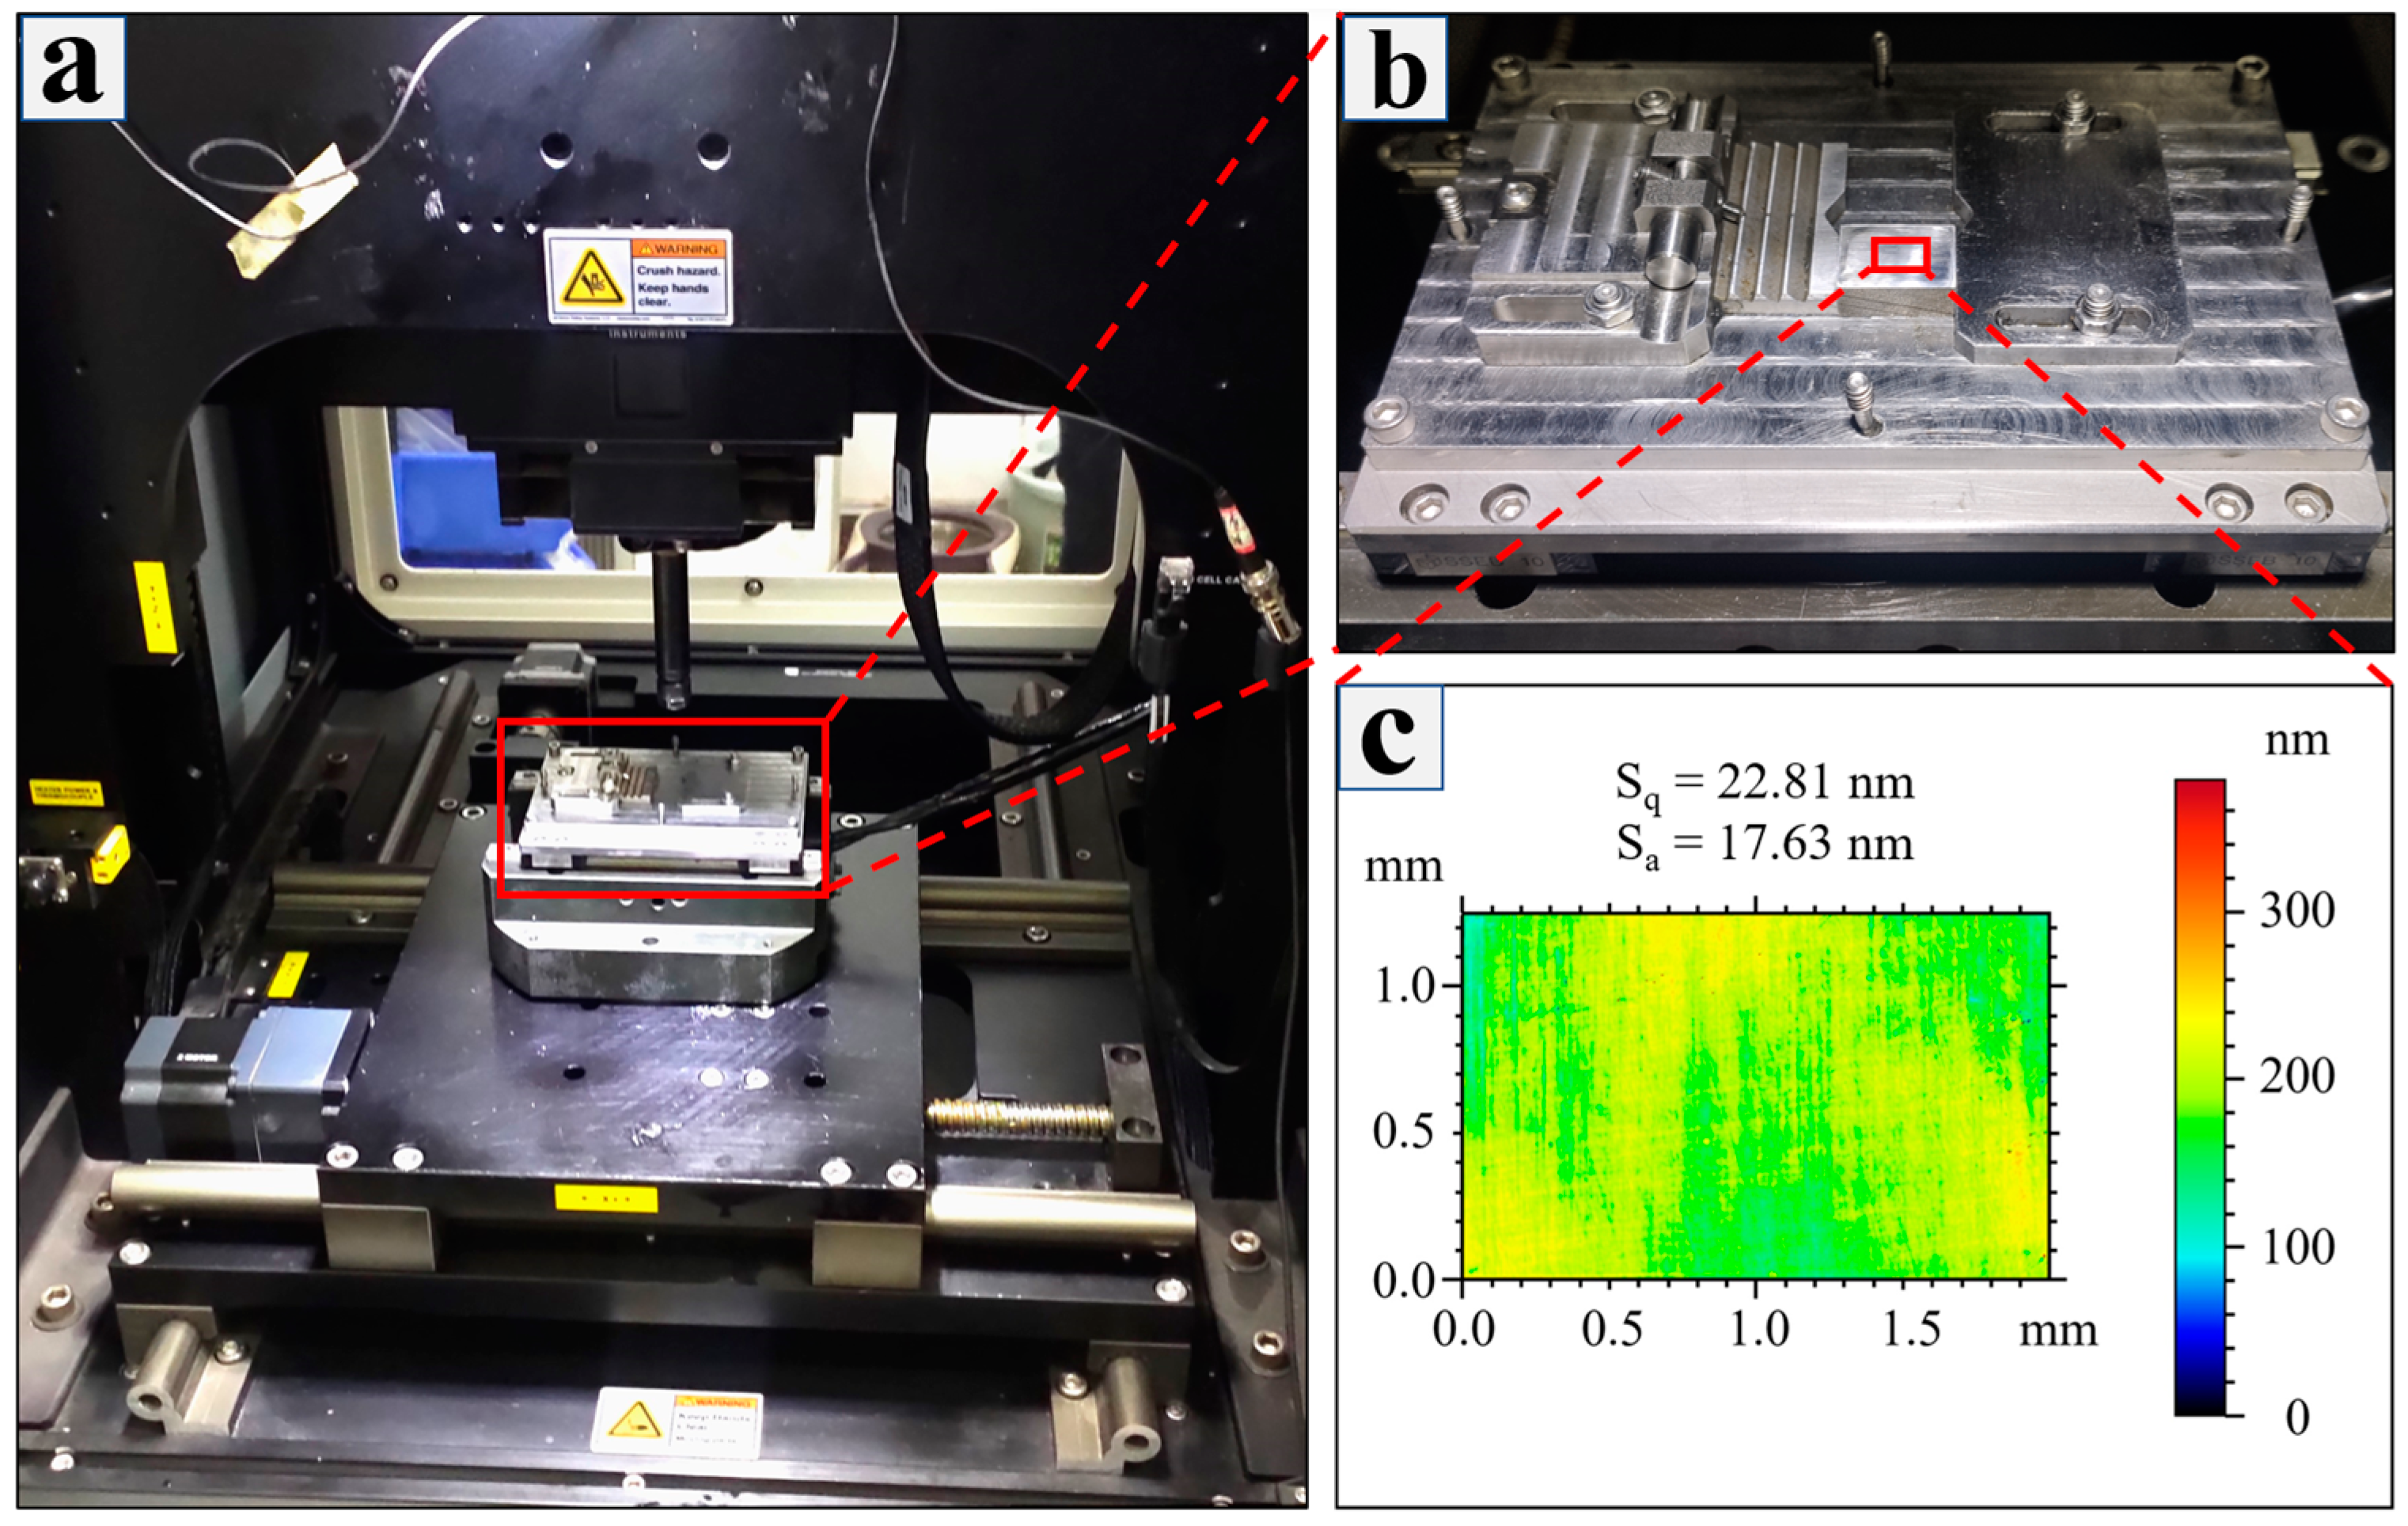
2.3. Tribological Performance Test

The tribological properties of the prepared lubricating grease were studied using an MFT-5000 friction testing machine (Rtec Instruments, San Jose, CA, USA) (Figure 2a). The friction pair samples used in the experiment included AISI E52100 steel (Figure 2b) and Si3N4 balls with a diameter of 7 mm. The Si3N4 ball was fixed on the loader and loaded vertically. The overall size of the AISI E52100 steel sample was 14 mm × 12 mm × 6 mm. We polished the surface of the sample with 1200 # and 2000 # sandpaper for 30 min on a polishing machine to ensure that the surface roughness parameters (the arithmetic mean Sa and root mean square Sq of the absolute value of contour offset) of the sample were less than 0.03 μm (Figure 2b). Finally, we cleaned the sample with alcohol ultrasonic for 10 min, applying a 2 mm thick lubricating grease sample evenly on the surface of the cleaned AISI E52100 steel sample with a ceramic spoon. We then fixed it to a reciprocating moving platform. The test conditions are shown in Table 1. As the moving platform moved horizontally, the real-time values of friction force and load were collected by the sensors of the friction testing machine, with a collection frequency of 100 values per second. We took the average value of the segments as the experimental result of the friction coefficient.
After the friction test, the surface morphology of the wear marks was observed using a three-dimensional optical profilometer (UP-3D Rtec, Rtec Instruments, Silicon Valley, San Francisco, CA, USA), and the wear rate (W, mm3n−1m−1) and amount of wear (V, mm3) of the sample were analyzed. The formula for the amount of wear was as follows: V = A × L. Among them, the cross-sectional area (A, mm2) of the wear marks was calculated using a profiler, and each sample was measured 10 times. The average of the 10 measurements was taken as the result. The length of the wear marks (L, mm) was obtained by calculating the circumference of the friction test trajectory. The formula for wear rate was as follows: W = V/(F × S), where F (N) was the load and S (m) was the total friction distance.

2.4. Service Life Test

The lubrication service life of the prepared lubricating grease was tested using the FE9 Roller Bearing Wear Testing Machine. The test conditions shown in Table 2 refer to the DIN 51,821 standard, and the angular contact ball bearing 7206 was selected as the test bearing. Before the test, the lubricant in the bearing was cleaned with petroleum ether, and after, it was completely dried. The test lubricating grease was evenly filled into the bearing (the lubricating grease should not exceed the surface of the bearing ring) at a temperature of 25 °C and a speed of 1500 RPM. It was pre-run for 2 h under a load of 1500 N to evenly distribute the lubricating grease inside the bearing. When any one or more of the following situations occur in the bearing test, the lubricating grease is considered to have failed: (a) the input power of the main shaft is 300% of the stable value, (b) the temperature value of the outer ring of the bearing exceeds the stable value by 15 °C, (c) the test bearing is stuck or the belt is slipping, or (d) the operating torque of the main shaft is 500% of the stable value.

3. Multi-Objective Optimization Based on USFD

3.1. Experimental Design

As shown in Table 3, the factors that may affect the tribological properties and service life of lubricating grease during the preparation process of CSCPG are listed, including the proportion of three thickening agents [29]: overbased calcium sulfonate T106A (coded A), polyurea thickening agent (coded C), and composite calcium soap (coded D); base oil 40 °C kinematic viscosity (coded B) [14]; the proportion of the content of the two additives: antioxidant (coded E) [30] and nano-solid friction reducers [10,11,12] (coded F); reaction time: conversion reaction time T1 (coded G), thickening reaction time T3 (coded H); reaction temperature: conversion reaction temperature t1 (coded J), thickening reaction temperature t3 (coded K), and grinding gap (coded L) during post-treatment [31]. Table 3 also provides the range of values for each factor, where the initial value refers to the values of each factor before optimization, and the maximum and minimum values are the allowable range of values for each factor obtained based on experience.
From Table 3, the number of factors being considered has reached the maximum number of parameters that need to be estimated. Here, the estimated parameters refer to the parameters that can obtain their unbiased estimates. In order to minimize the number of experiments, the orthogonal saturated factorial design method and Plackett-Burman design were used to conduct n = 12 experiments on the selected p = 11 influencing factors. The friction coefficient is taken as the observation value 1 (coded y1), the service life is taken as the observation value 2 (coded y2), the droplet point is taken as the observation value 3 (coded y3), and the cone penetration is taken as the observation value 4 (coded y4). The experimental results are shown in Table 4; among them, “1” and “−1” represent the maximum and minimum values of the factor, respectively.

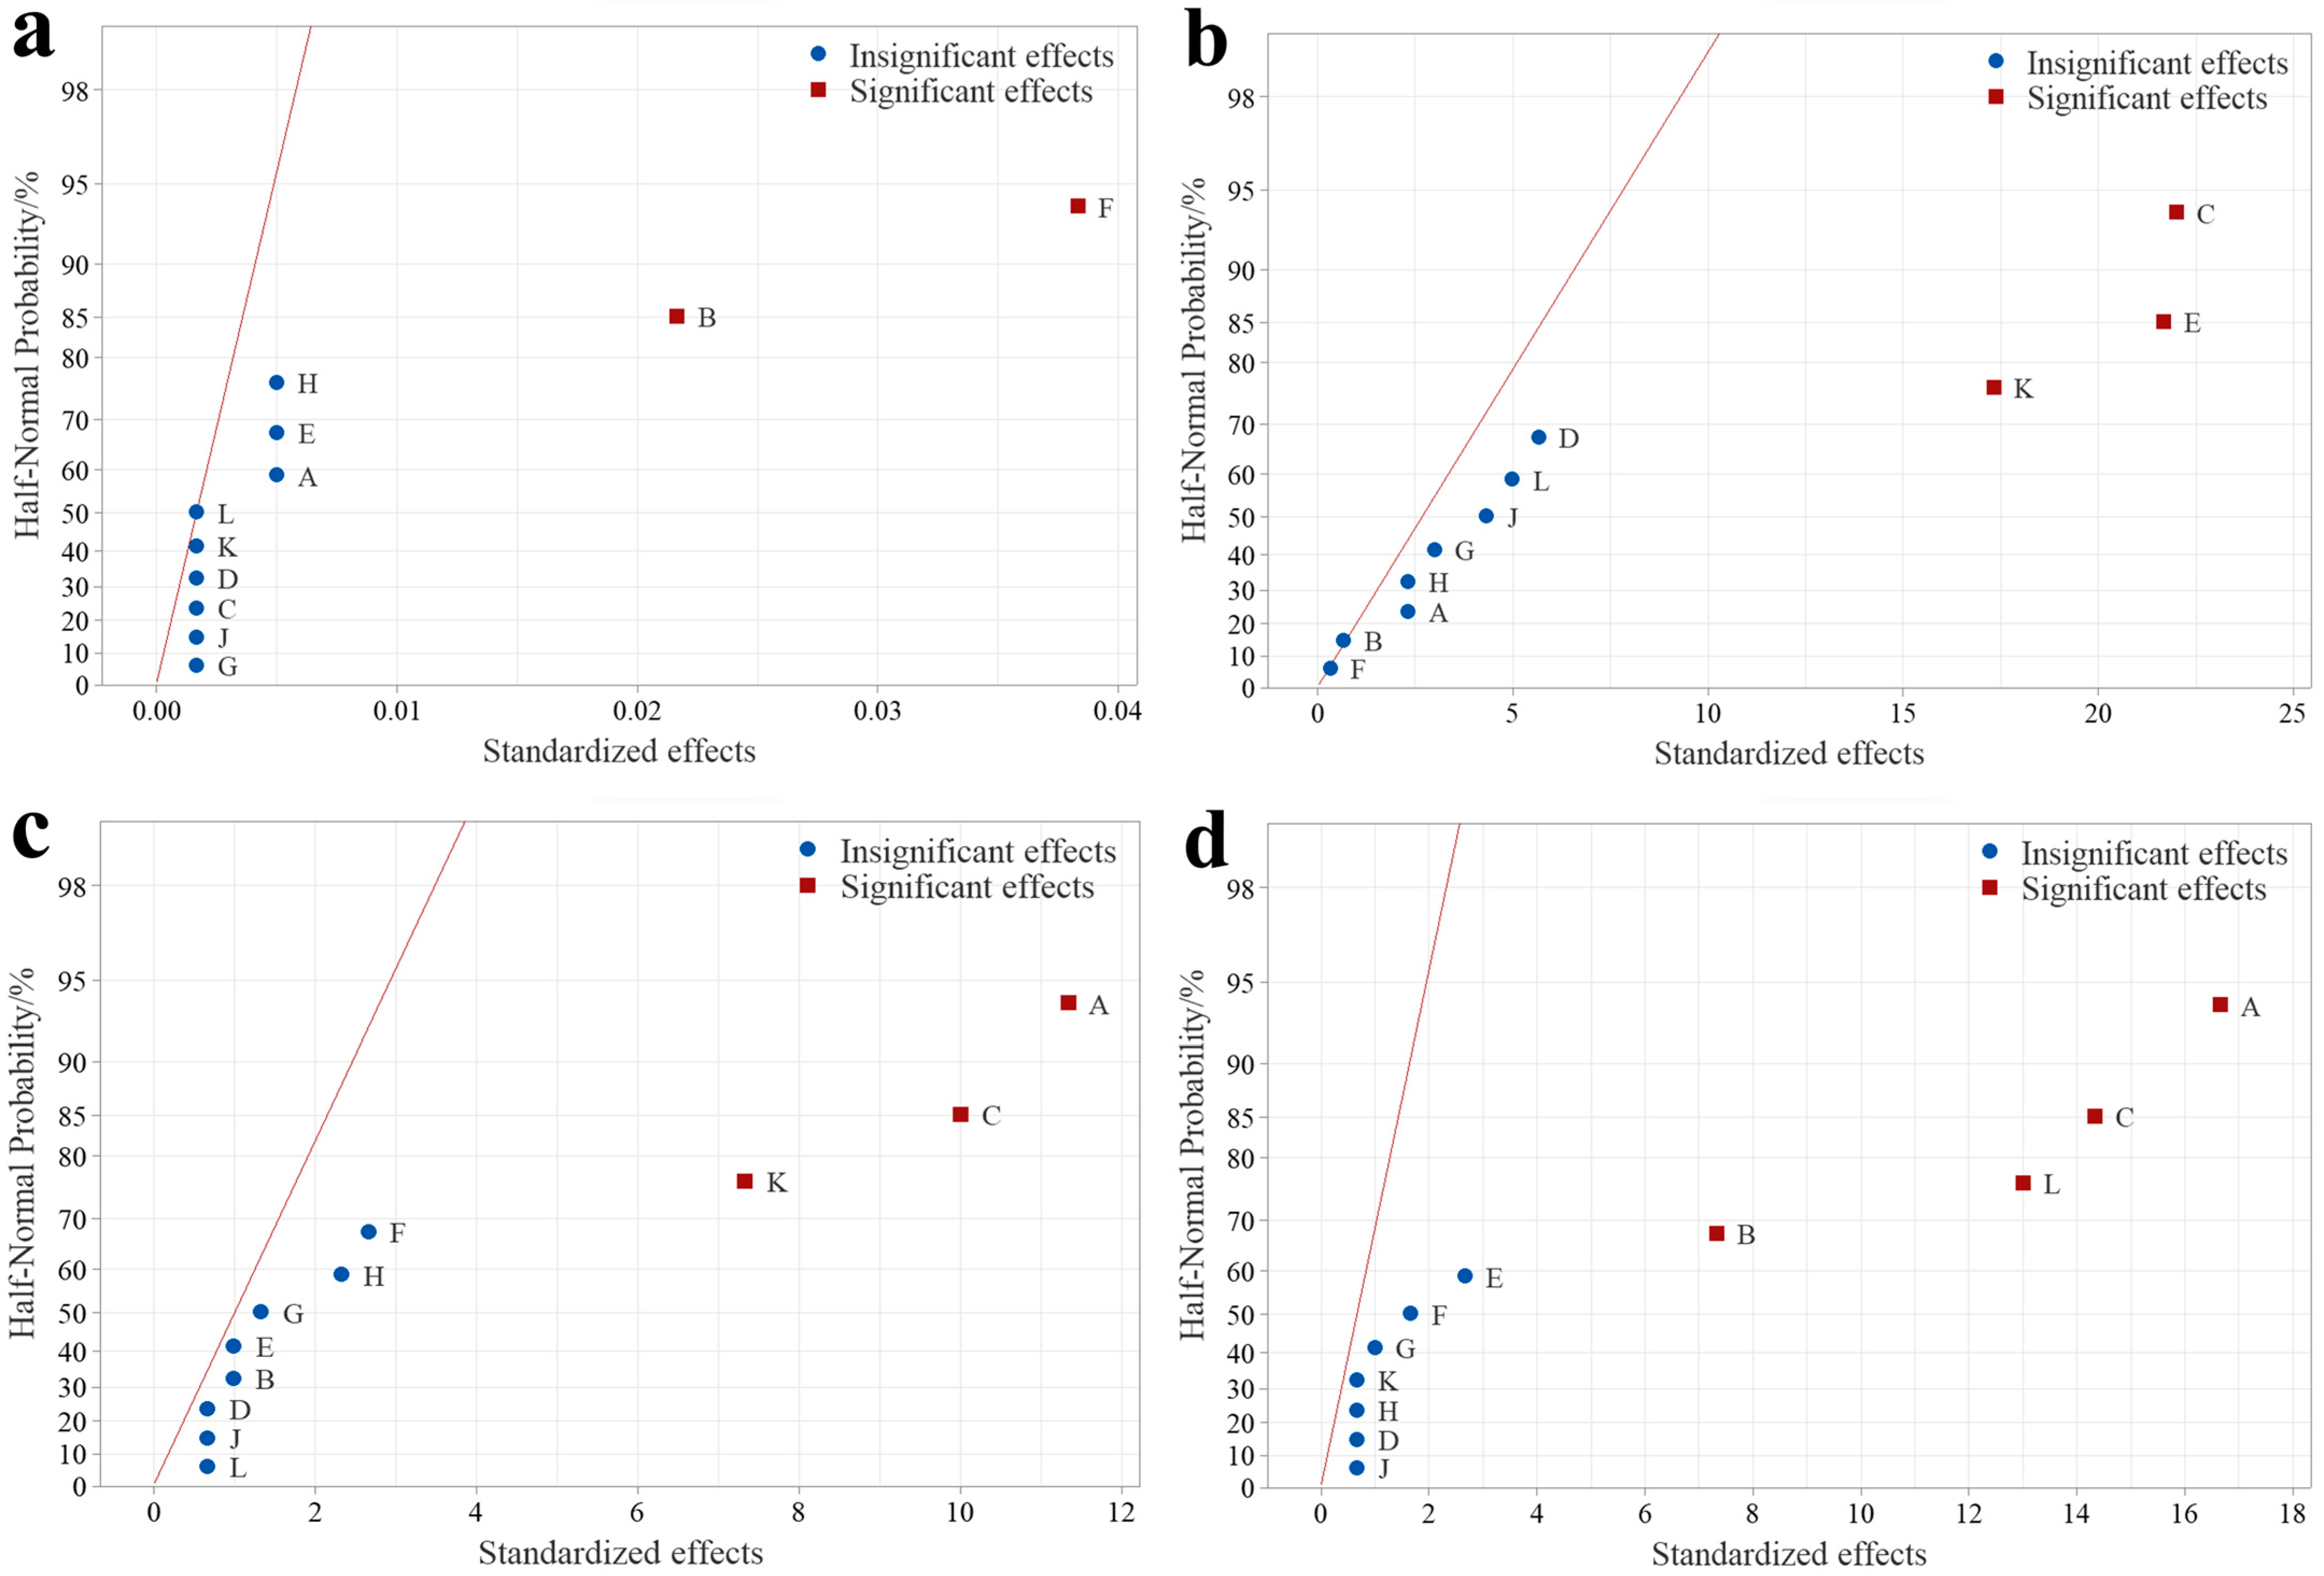
3.2. Screening of Significant Influencing Factors

In the above design, there are 12 sets of observations to estimate the 12 parameters to be estimated (including the general average β0). There is no remaining degree of freedom to estimate the error variance; that is, the sum of the squared errors Se≡0, so it is not possible to use standard deviation analysis (F-test or t-test) for significance testing of influencing factors.
Here, the half-normal plot [32] method is used for the data processing of USFD. Under the assumption that the error is normal, independent, and of the same variance, the estimators of each factor are independent of each other. The estimators with zero influencing factors follow the same normal distribution, and their expected values are zero. On the half-normal plot, their observed values should be located on a straight line passing through the origin, whereas the expected values of the estimators with nonzero influencing factors should deviate from this straight line passing through the origin. As shown in Figure 3, by plotting the estimated values of each influencing factor on a half-normal plot, it is easy to identify the factors that have a significant impact on each observation. The results are summarized in Table 5.

3.3. NSGA–II Multi-Objective Optimization

From Figure 3 and Table 5, the main factors that have a significant impact on the friction coefficient and service life of CSCPG are the viscosity of the base oil, the proportion of polyurea thickeners, antioxidants, and nano-solid friction reducers, and the thickening reaction temperature T3. Calcium sulfonate is the main component of CSCPG’s thickening agent, which determines the basic performance of CSCPG. Therefore, the above six parameters are selected as design variables (Table 6), and a multi-objective optimization model (Equation (2)) is established to optimize the tribological performance and service life of CSCPG, with y1 and y2 as the optimization objectives and y3 and y4 as the constraints.
find   ( x 1 ,   x 2 ,   x 3 ,   x 4 ,   x 5 ,   x 6 ) min   y 1 , y 2 s . t . y 3 300 244 y 4 294 20 x 1 35 90 x 2 300 2 x 3 10 0.5 x 4 3 0.5 x 5 2 100 x 6 130
Due to the large number of design variables and their complex correlation, the optimal Latin hypercube design (OLHD) was used to randomly sample the design space. The OLHD improves the uniformity of the random Latin hypercube design, making all sampling points more evenly distributed in the design space, with excellent spatial filling and balance [33]. Then, the Kriging method is used to predict and model the design space. Table 7 shows 50 sets of sampling points and their observation values collected using the OLHD. The Kriging prediction model was established, as shown in Figure 4, with y1 and y2 as the design objectives and x1~x6 as the design variables.
The accuracy error analysis of the constructed Kriging prediction model is shown in Table 8. The coefficient of determination R2 and the corrected coefficient of determination Radj2 of each Kriging prediction model exceeds 0.9, with a maximum error MRE of less than 0.1, indicating that the model has high accuracy and can be used for subsequent multi-objective optimization research.
By taking y1 and y2 as the optimization objectives, NSGA-II was used to perform a two-objective optimization solution using the Kriging prediction model. The population size was 40, the evolutionary algebra was 200, the hybridization probability was 0.8, the hybridization distribution index was 20, the mutation probability was 0.2, and the mutation distribution coefficient was 20. The Pareto frontier is obtained through 200 iterations, as shown in Figure 5a. Then, y1, y2, and y3 were used as the optimization objectives, and y4 was used as a constraint to perform a three-objective performance optimization on CSCPG. After 200 NSGA-II iterations, the Pareto front was obtained, as shown in Figure 5b,c.

4. Results and Discussions

4.1. Analysis of Significant Influencing Factors

As shown in Figure 3a and Table 5, the analysis of the test results of USFD using the half-normal plot shows that the factors that have a significant impact on the friction coefficient of lubricating grease are the viscosity of the base oil and the content of nano-solid friction reducers. By combining this with Figure 4a, it can be seen that the friction coefficient decreases with the increase in nano-solid friction reducers content, reaching the minimum value when the content reaches about 1.5%, and then the friction coefficient begins to increase, which indicates that the addition of nano-solid friction reducers can effectively reduce the friction coefficient of lubricating grease. However, its content is not the best, which may be related to the increase in grease consistency caused by excessive nano-solid friction reducers. The friction coefficient decreases as the viscosity of the base oil decreases. This is because the thickness of the lubricating oil film is closely related to the viscosity of the base oil. The lower the viscosity of the base oil, the thinner the lubricating oil film formed between the friction pairs, which reduces the relative sliding friction resistance of the friction pairs; that is, it reduces the friction coefficient [34]. The content of the three thickeners in CSCPG has a relatively small impact on the friction coefficient, indicating that under boundary lubrication conditions, the main lubricating agents between the friction pairs are the base oil and nano-solid friction reducers.
As shown in Figure 3b and Table 5, the significant influencing factors on the service life of CSCPG are the content of polyurea thickener and antioxidants, as well as the thickening reaction temperature. As shown in Figure 4b,c, as the content of polyurea thickener and antioxidants increases, the service life of CSCPG increases. This is because the polyurea thickener does not contain metal ions, which avoids the catalytic effect of metal ions in the thickener on the oxidation of the lubricating grease base oil [35]. The addition of antioxidants has a better protective effect on the base oil, allowing CSCPG to remain non-oxidized for a longer period. As shown in Figure 4d, the service life of CSCPG first increases and then decreases with the increase in thickening reaction temperature. When the thickening reaction temperature reaches 125 °C, the service life of CSCPG reaches its maximum value, indicating that the optimal temperature for the thickening reaction is around 125 °C, which may be due to the increase in temperature accelerating the polymerization reaction that forms a thickener, but an excessively high temperature degrades the polyurea chains. As shown in Figure 5a, when y1 and y2 are used as optimization objectives, a set of Pareto solutions can be obtained. In Pareto solutions, the longer the service life of CSCPG, the greater the friction coefficient, with the lowest friction coefficient of 0.07. Currently, the service life of the lubricating grease is about 197 h, and the maximum service life of the lubricating grease can reach 230 h, with a friction coefficient of about 0.12. The shortest distance method [36] is adopted to find the optimal solution in Pareto solutions, which is to calculate the sum of the distances from each non-inferior solution to all other non-inferior solutions in all objective function spaces, and select the non-inferior solution with the shortest distance as the final optimal solution (knee point) for the problem. As shown in Figure 5b, when y1, y2, and y3 are used as optimization objectives, a set of Pareto solutions in three-dimensional space can be obtained. By projecting these solutions onto the y1 and y2 planes, the knee point of Pareto solutions can be obtained (Figure 5c).
As shown in Table 9, when comparing the initial group with the two-objective optimization results (Optimal Prediction-II) and three-objective optimization results (Optimal Prediction-III), when y1 and y2 are used as optimization targets, the optimized friction coefficient can be reduced by up to 5.3% ((0.094 − 0.089)/0.094), and the service life can be increased by up to 3.8% ((220 − 212)/212). When y1, y2, and y3 are used as optimization targets, the optimized droplet point can increase by up to 3.9% (322 − 310)/310), but its friction coefficient slightly increases compared to the initial group.

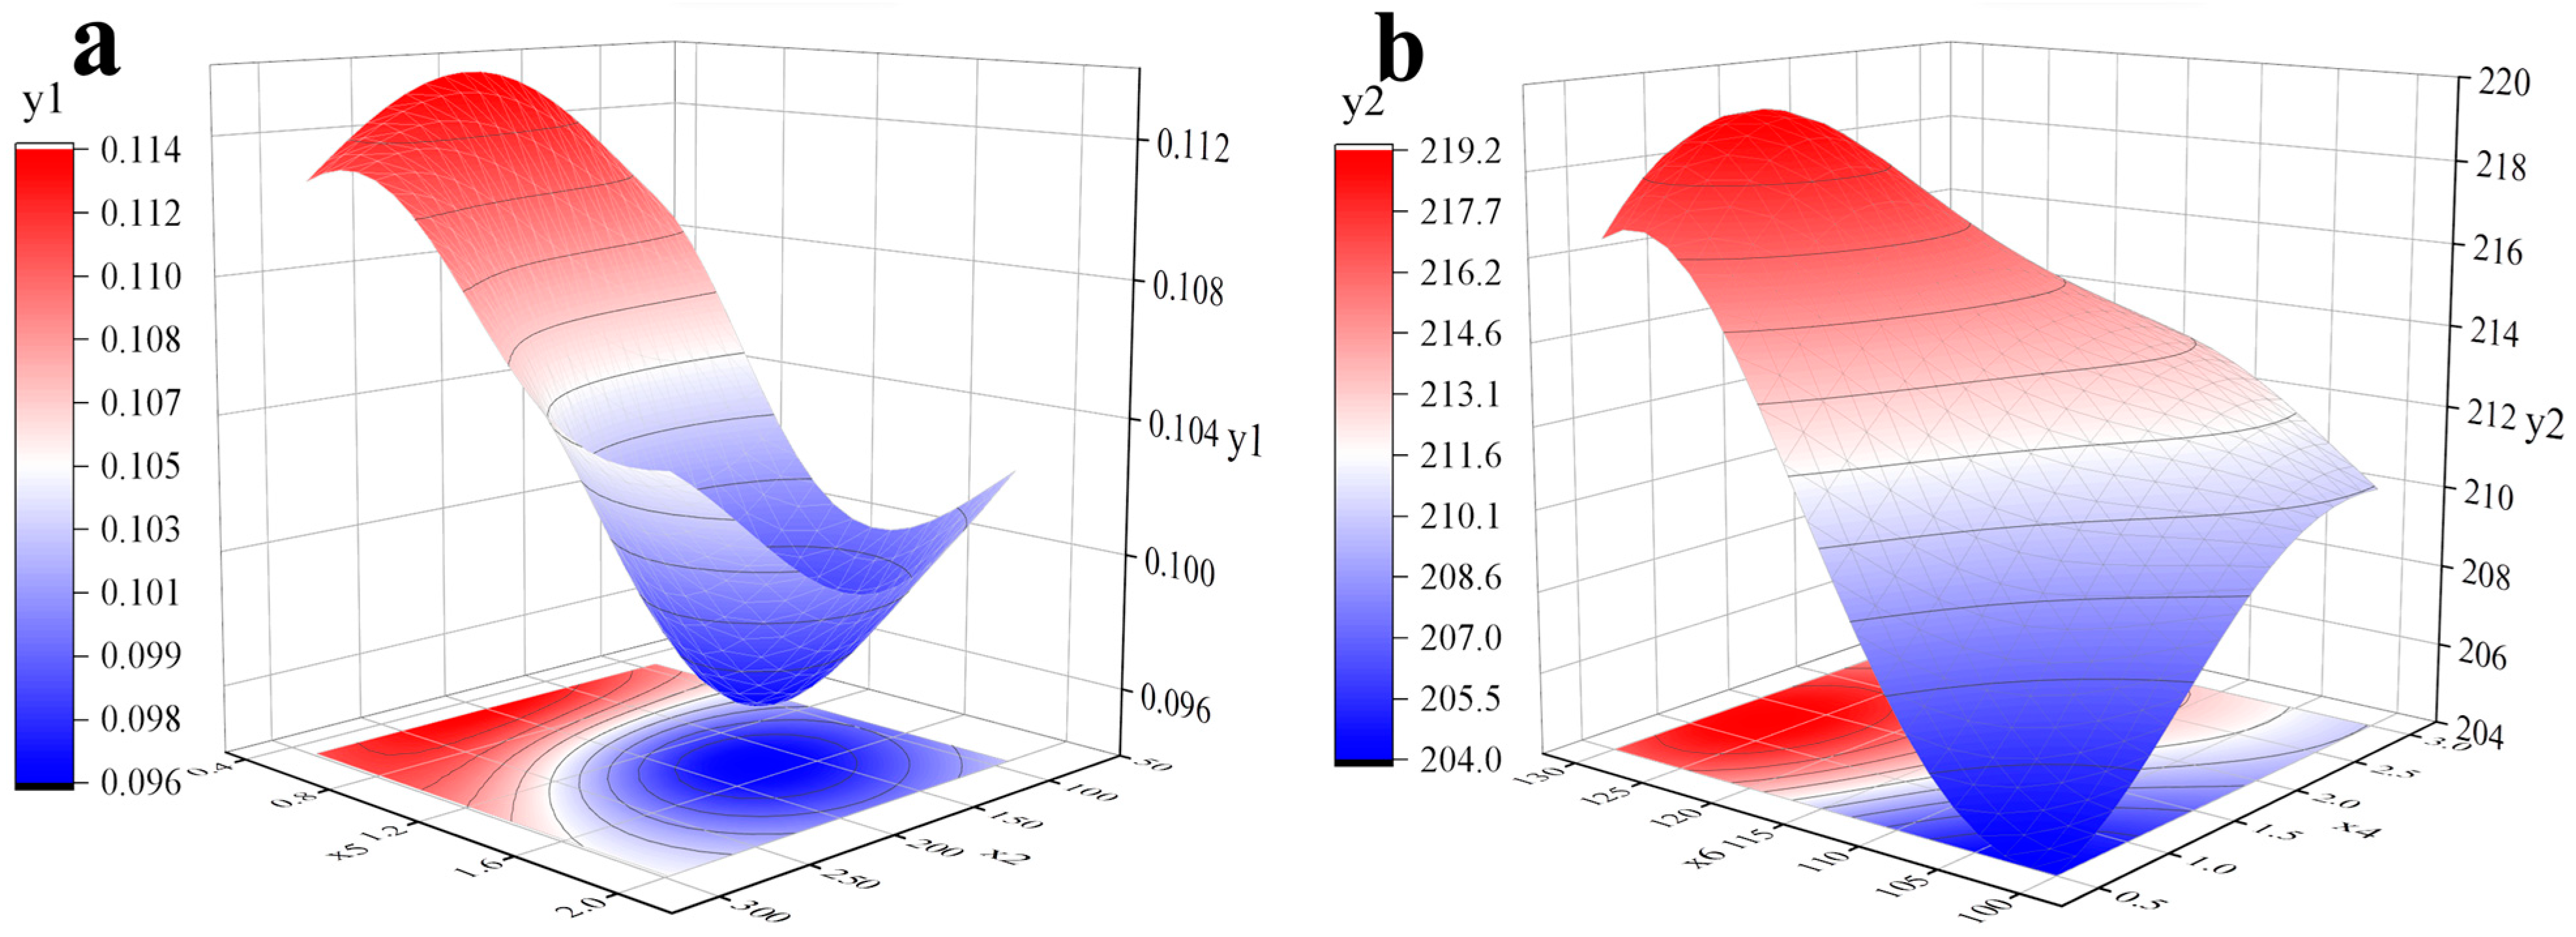
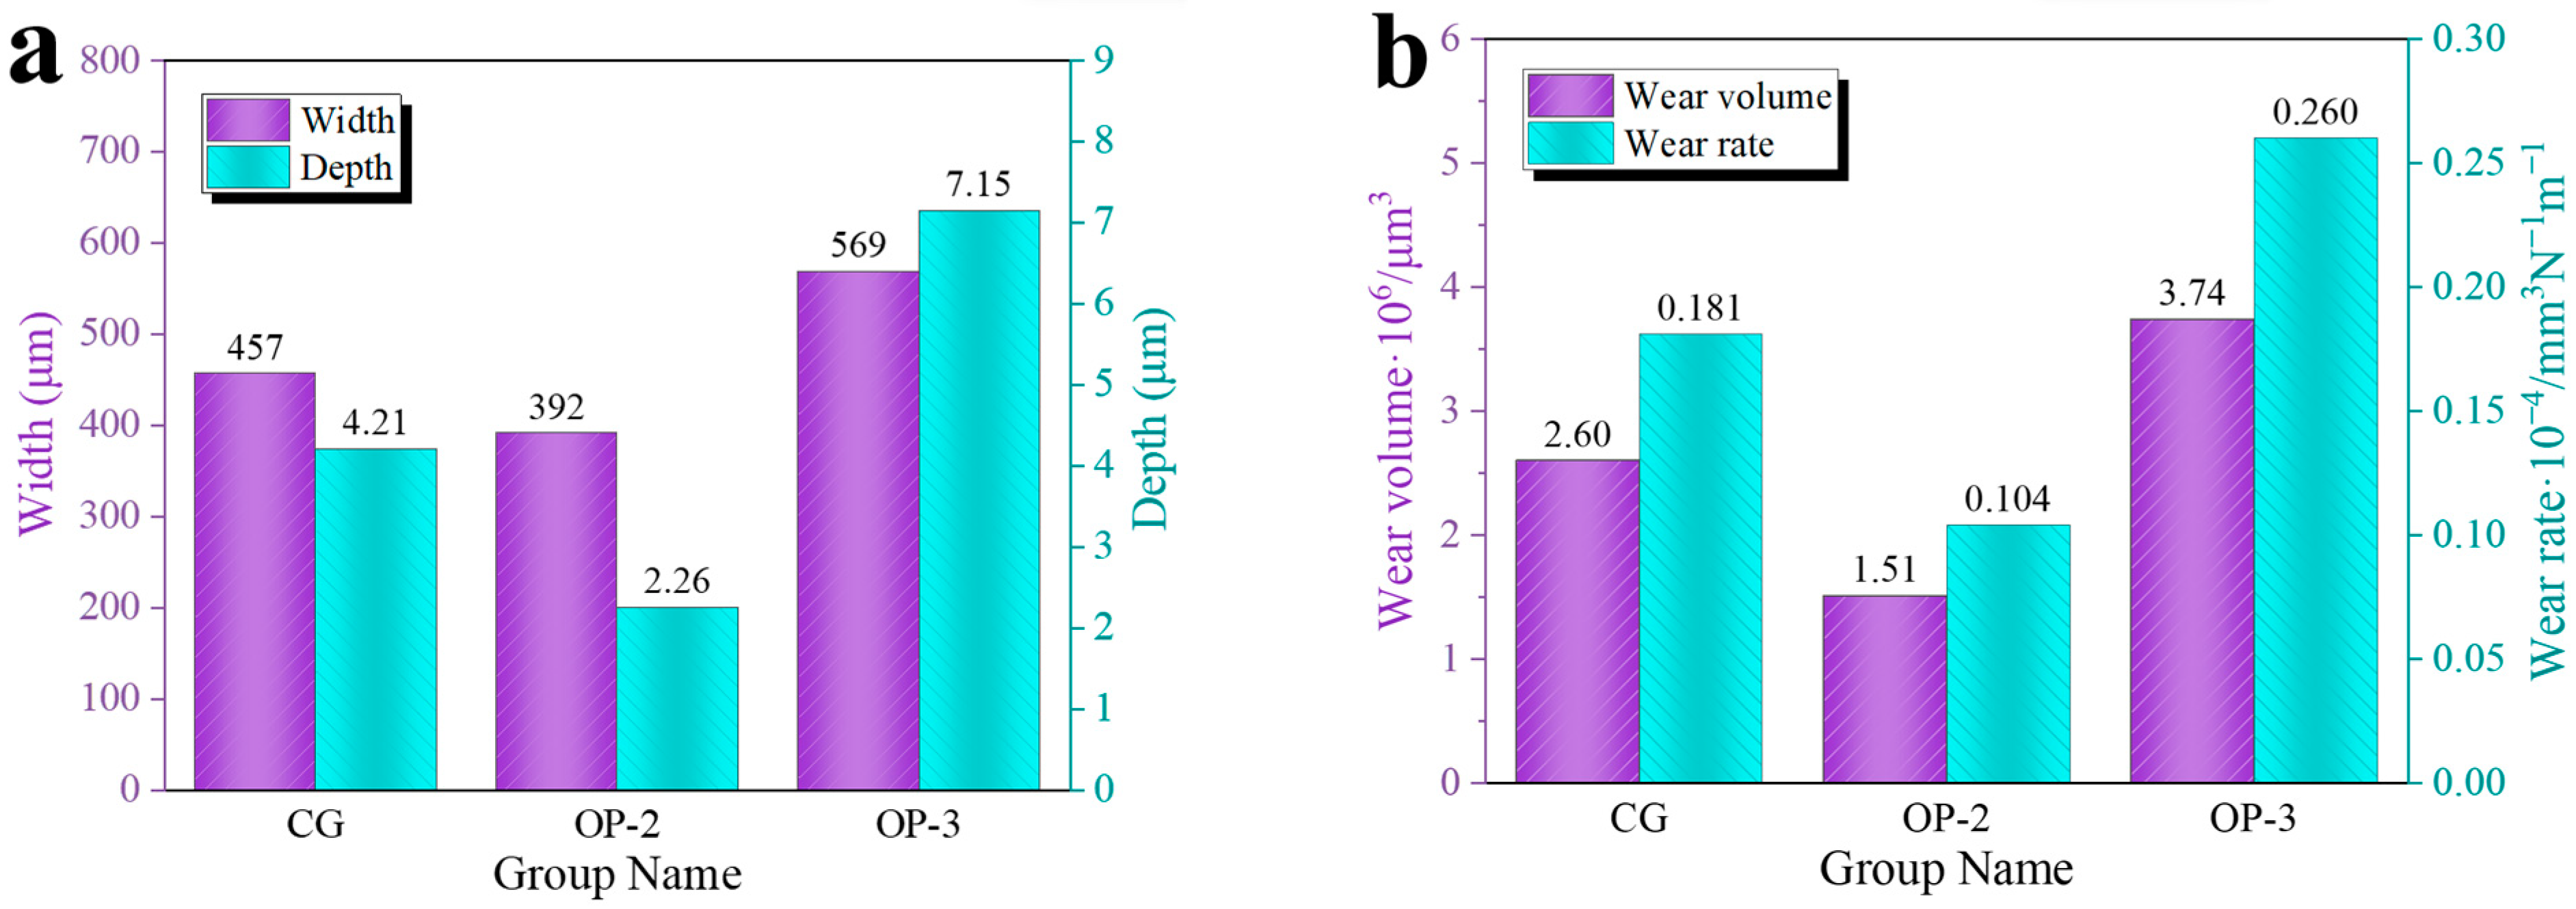
4.2. Optimization Analysis of Tribological Performance

As shown in Figure 6, The friction coefficient and standard deviation of the three groups of tribological tests are obtained with the initial group as the control group (CG), the two-objective optimization result as the optimal prediction 2 group (OP-2), and the three-objective optimization result as the optimal prediction 3 group (OP-3). After multi-objective optimization, the friction coefficient of OP-2 is the smallest (0.088). When compared with the predicted value (0.089), the relative error is only 1.1%, indicating that the prediction model has high accuracy. From the direction of the friction coefficient, all curves first increase, then gradually decrease, and tend to stabilize. After the friction coefficient reaches stability, it still fluctuates within a certain range. Among them, OP-2 has the smallest fluctuation, with a standard deviation of only 0.68 × 10⁻³, indicating that the optimized CSCPG has improved friction reduction performance and its friction process is more stable.
As shown in Figure 7, to further explore the wear situation of CSCPG on the surface of AISI E52100 steel after different optimizations, a three-dimensional optical profilometer (UP-3D, Rtec) is used to observe the surface morphology of the wear marks. Three sets of 3D maps and the surface roughness curves of the wear marks are obtained, as shown in Figure 7a,d,g. There are obvious wear marks on the surface of the three test samples, but the structural dimensions and surface characteristics of the wear marks are different. From the roughness of the wear marks, OP-2 has the smallest surface roughness and less surface damage, indicating that the CSCPG formulated by OP-2 can effectively lubricate and protect the surface of the friction pair [37]. OP-3 has the largest roughness along the direction of the wear marks (yellow line) and perpendicular to the direction of the wear marks (red line). From the roughness curve along the direction of the wear marks (Figure 7h), there are deep convex peaks and furrows on the surface of the wear marks, which indicates that the surface damage is relatively severe, and the lubrication performance of this formula CSCPG is poor.
As shown in Figure 8a, the wear scar width and depth of OP-2 after three sets of tribological tests are the smallest at 392 μm and 2.26 μm, respectively. When compared to CG, the wear scar width decreases by 14.2%, and the wear scar depth decreases by 46.3%. As shown in Figure 8b, OP-2 has the smallest wear volume and wear rate. When compared to CG, the wear volume decreases by 41.9%, and the wear rate decreases by 42.5%, indicating that the optimized CSCPG has a significantly enhanced wear resistance.

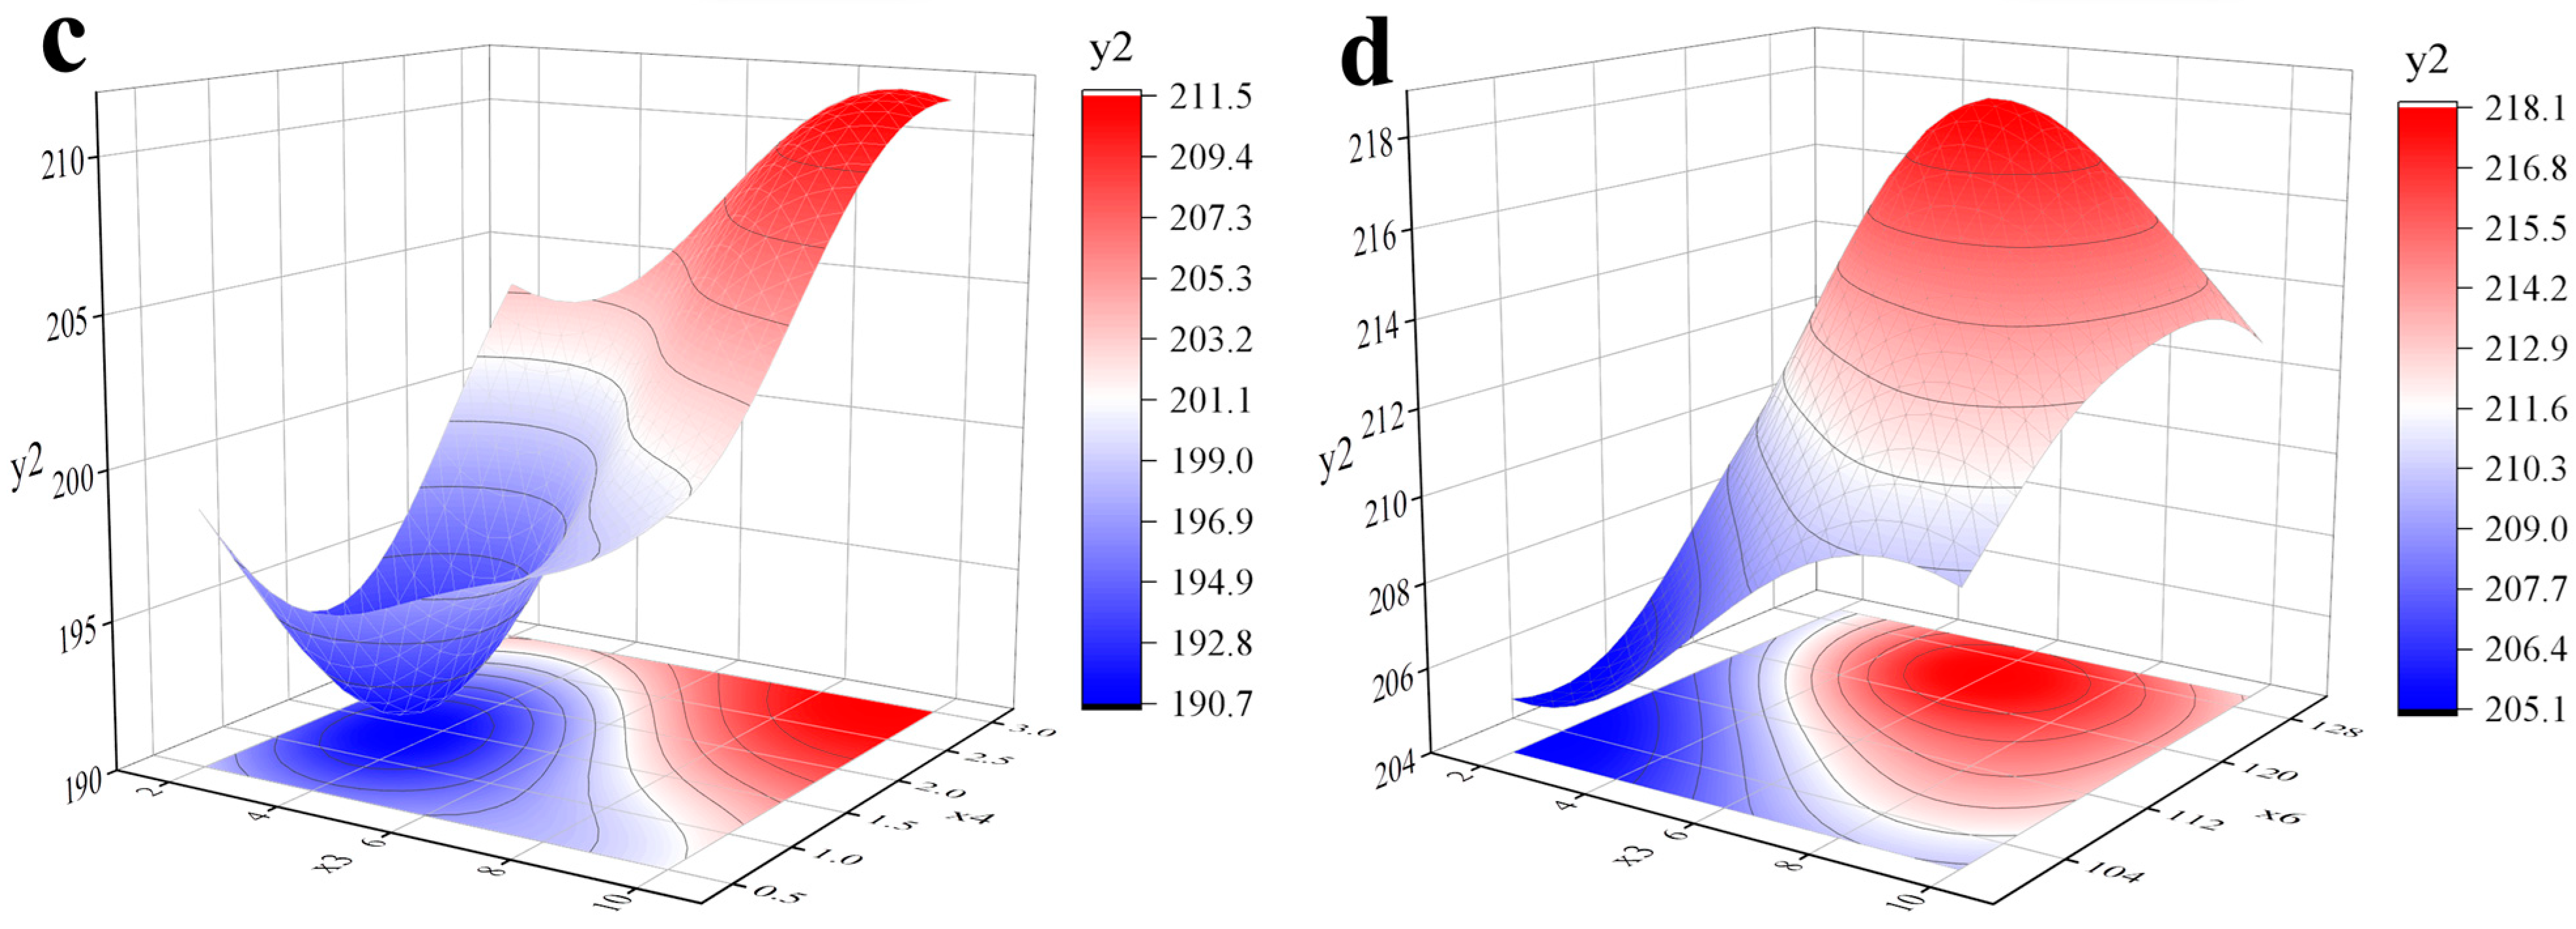
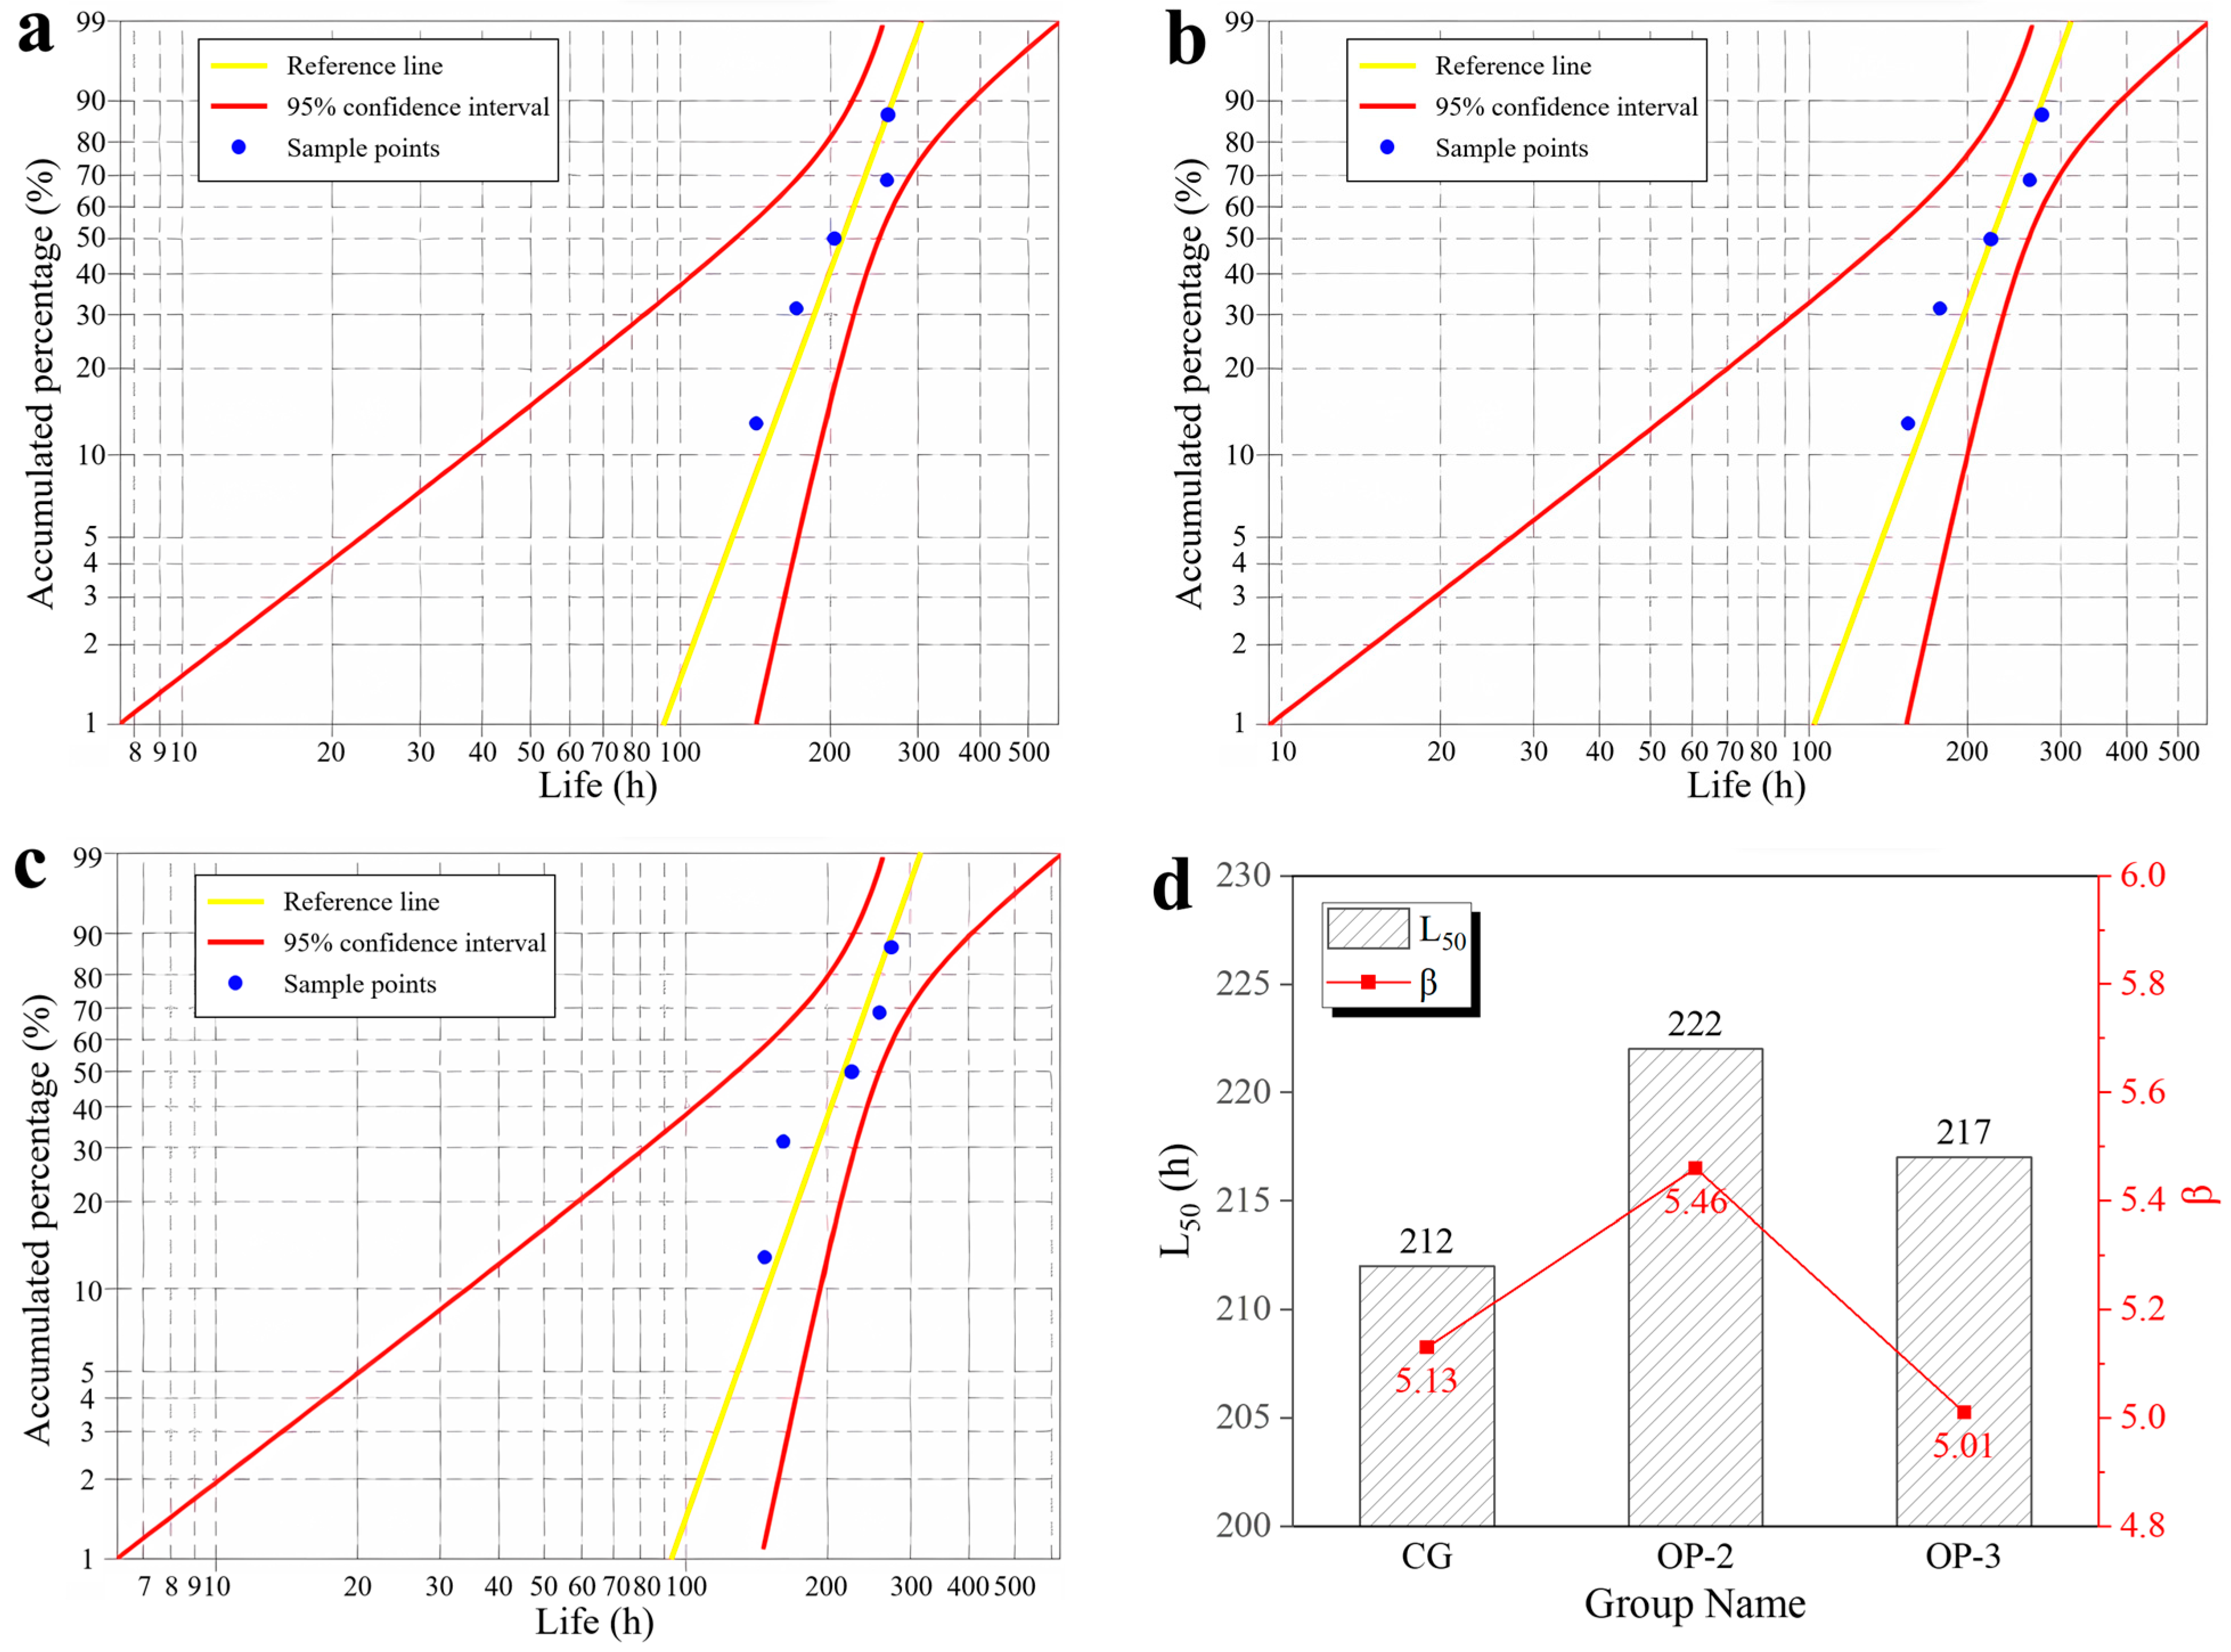
4.3. Optimization Analysis of Service Life

The service life results of the lubricating grease exhibit significant discreteness, as these data do not follow a normal distribution but follow a Weibull distribution [38,39]. Therefore, the distribution testing and parameter estimation of the Weibull distribution can be used to obtain the estimated values of the service life characteristics. When the experimental sample size is less than 25, the best linear unbiased estimation (BLUE) method is usually used to estimate the parameters of the Weibull distribution. As shown in Figure 9a–c, the service life data of the grease samples before and after optimization are all within the 95% confidence interval, indicating that the service life of the grease satisfies the Weibull distribution function. As shown in Figure 9d, the shape parameters (β) of the three grease samples are all >4, indicating that the distribution of the service life results of the lubricating grease represents a negative stress distribution, and the service life of the lubricating grease belongs to the attritional failure problems. Here, a 50% reliability service life (L50) is selected as the estimated service life of CSCPG. The L50 service life of OP-2 is the highest at 222 h, with a relative error of only 0.9% when compared to the predicted value (220), indicating that the prediction model has high accuracy. When compared with CG, the L50 service life of OP-2 has increased by 4.7%, indicating that the optimization scheme can effectively extend the service life of CSCPG.

5. Conclusions

This article screened out those factors that had a significant impact on the tribological performance and service life of CSCPG based on USFD. A Kriging prediction model for the tribological performance and service life of CSCPG was established based on the significant influencing factors. NSGA-II was used to optimize the production of raw materials and the preparation process of CSCPG. The tribological performance and service life of CSCPG before and after optimization were compared, and the following conclusions were obtained:
(1)
The USFD method was used to screen those factors that may affect the tribological properties and service life of CSCPG during the preparation process. It was found that the viscosity of the base oil and the content of nano-solid friction reducers had a significant impact on the tribological properties of CSCPG, whereas the content of the polyurea thickeners and antioxidants, as well as the thickening reaction temperature, had a significant impact on the service life of CSCPG;
(2)
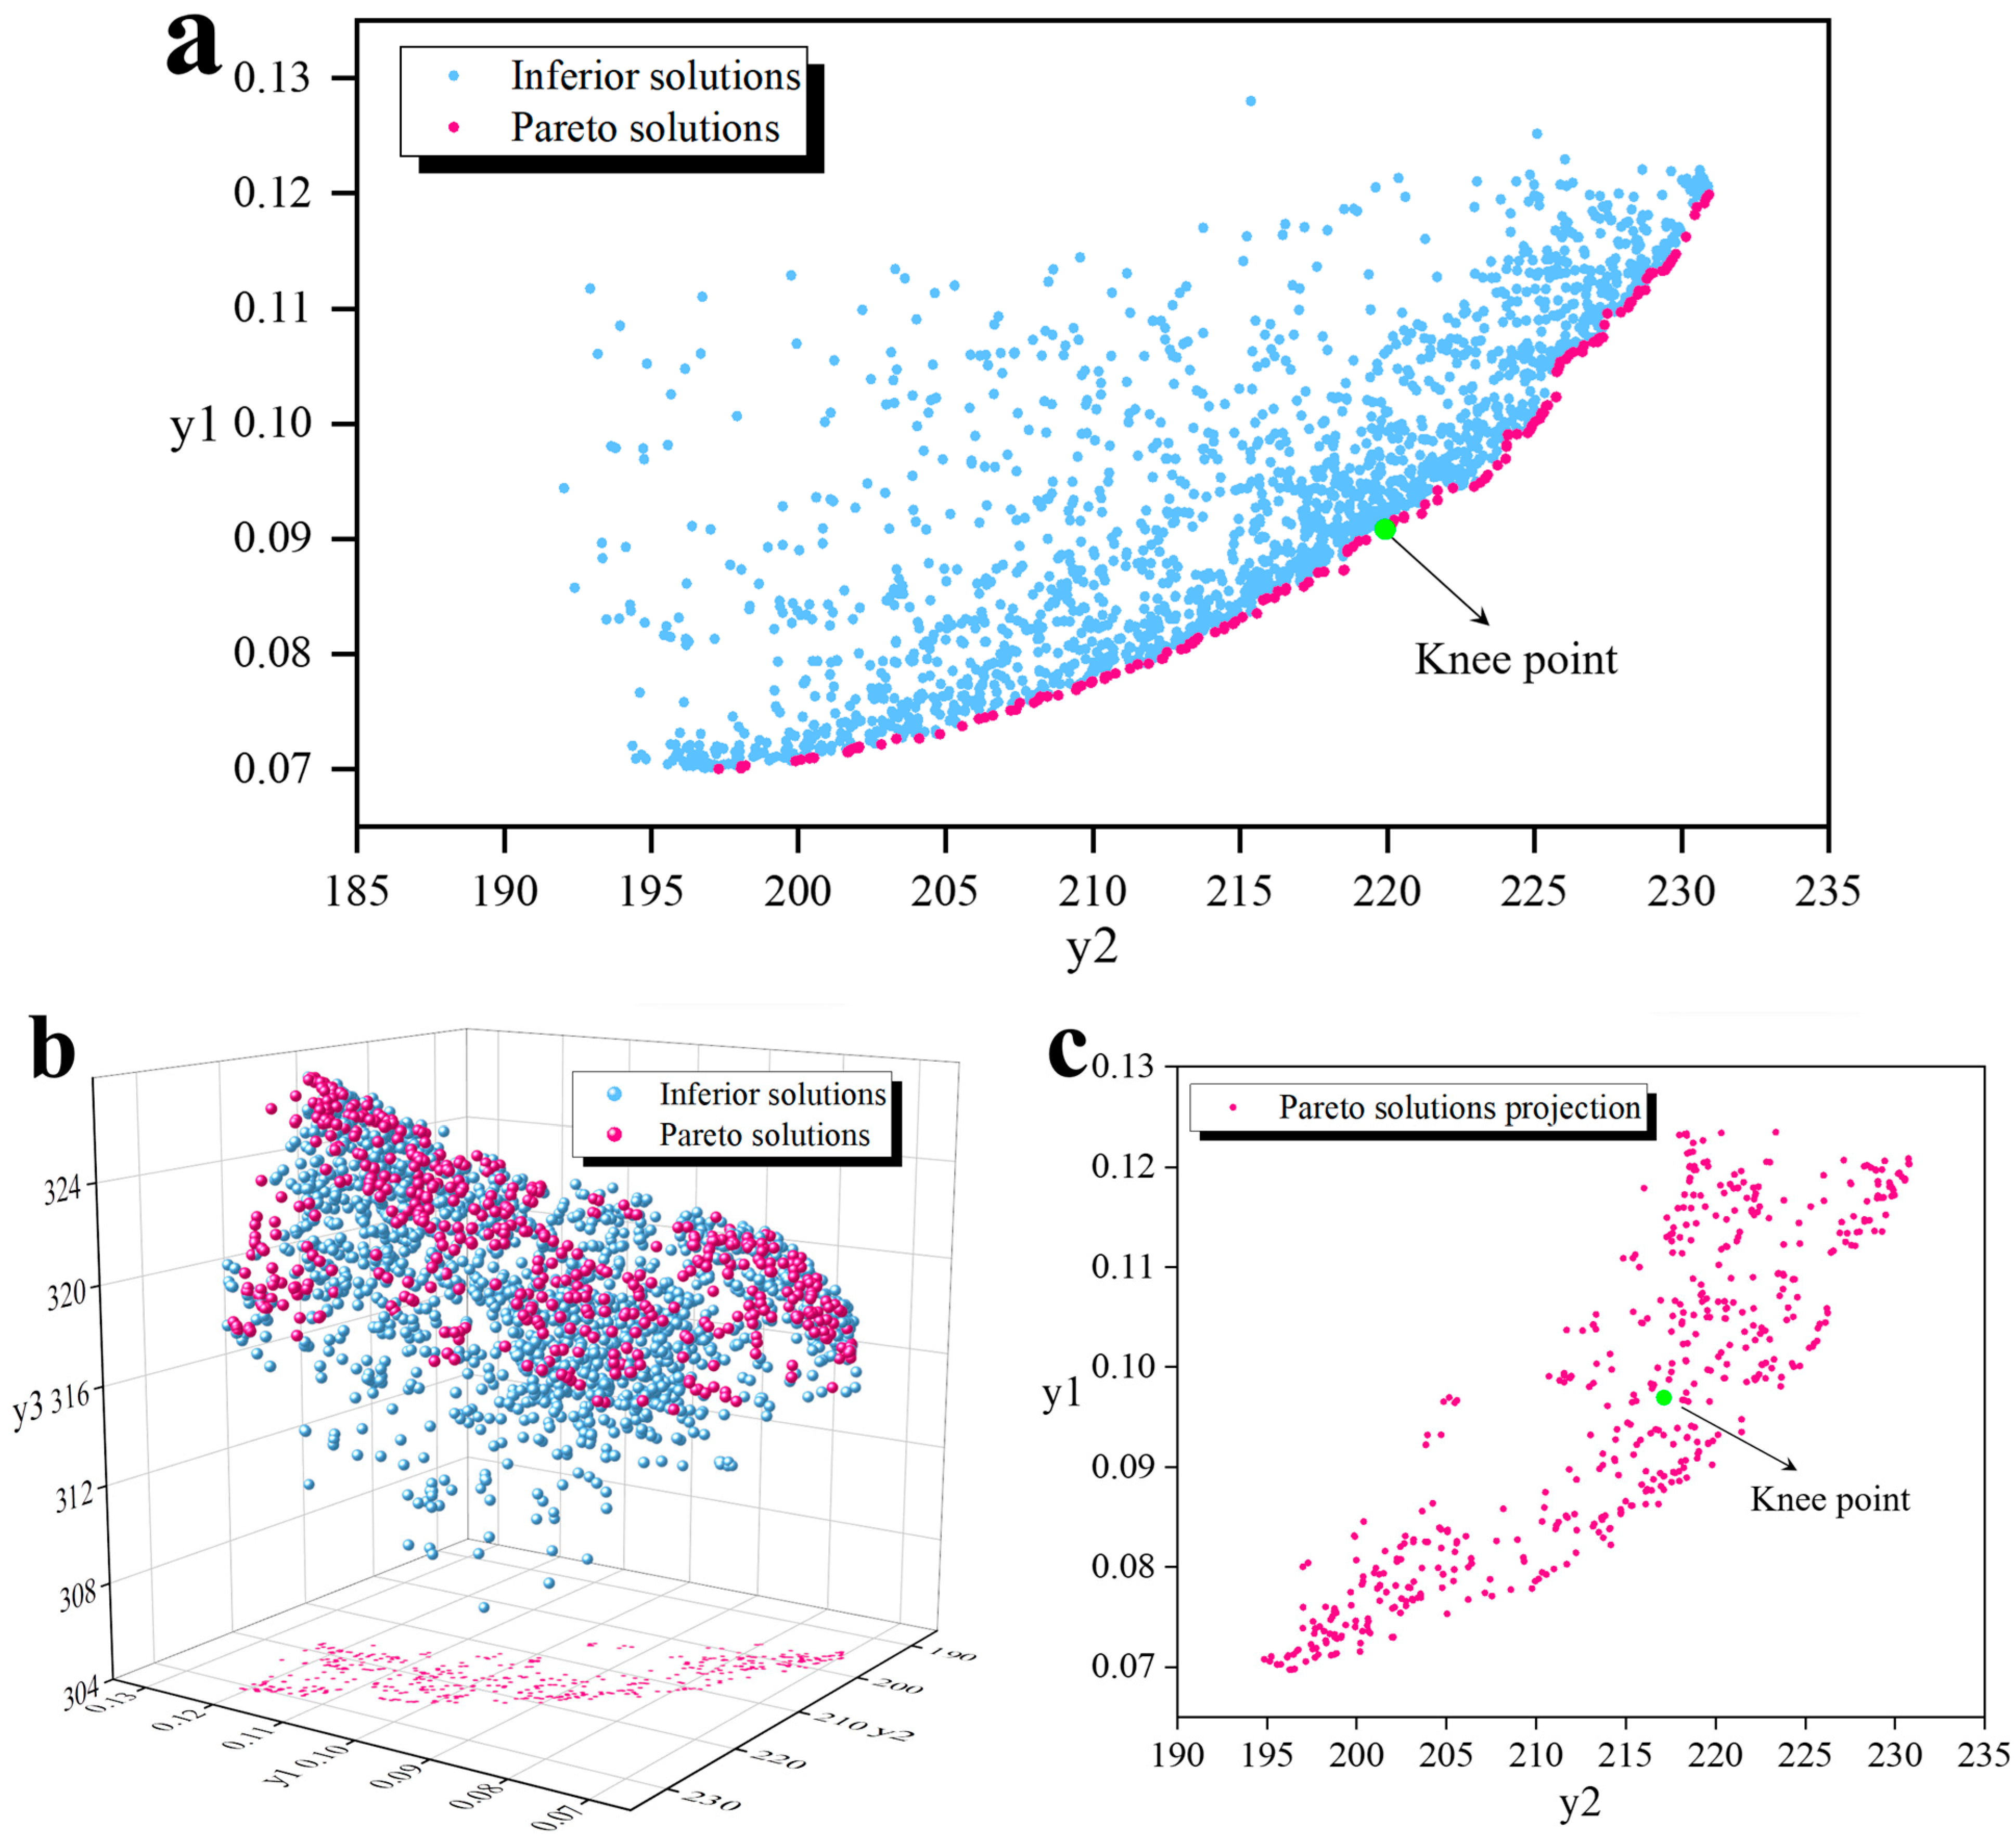
By optimizing the significant influencing factors of CSCPG through NSGA-II, a set of Pareto solutions can be obtained. When the friction coefficient and service life were used as the optimization objectives, the friction coefficient of the initial group of CSCPG could be reduced by 5.3%, and the service life could be extended by 3.8%. When increasing the droplet point as the third optimization objective, the friction coefficient increases;
(3)
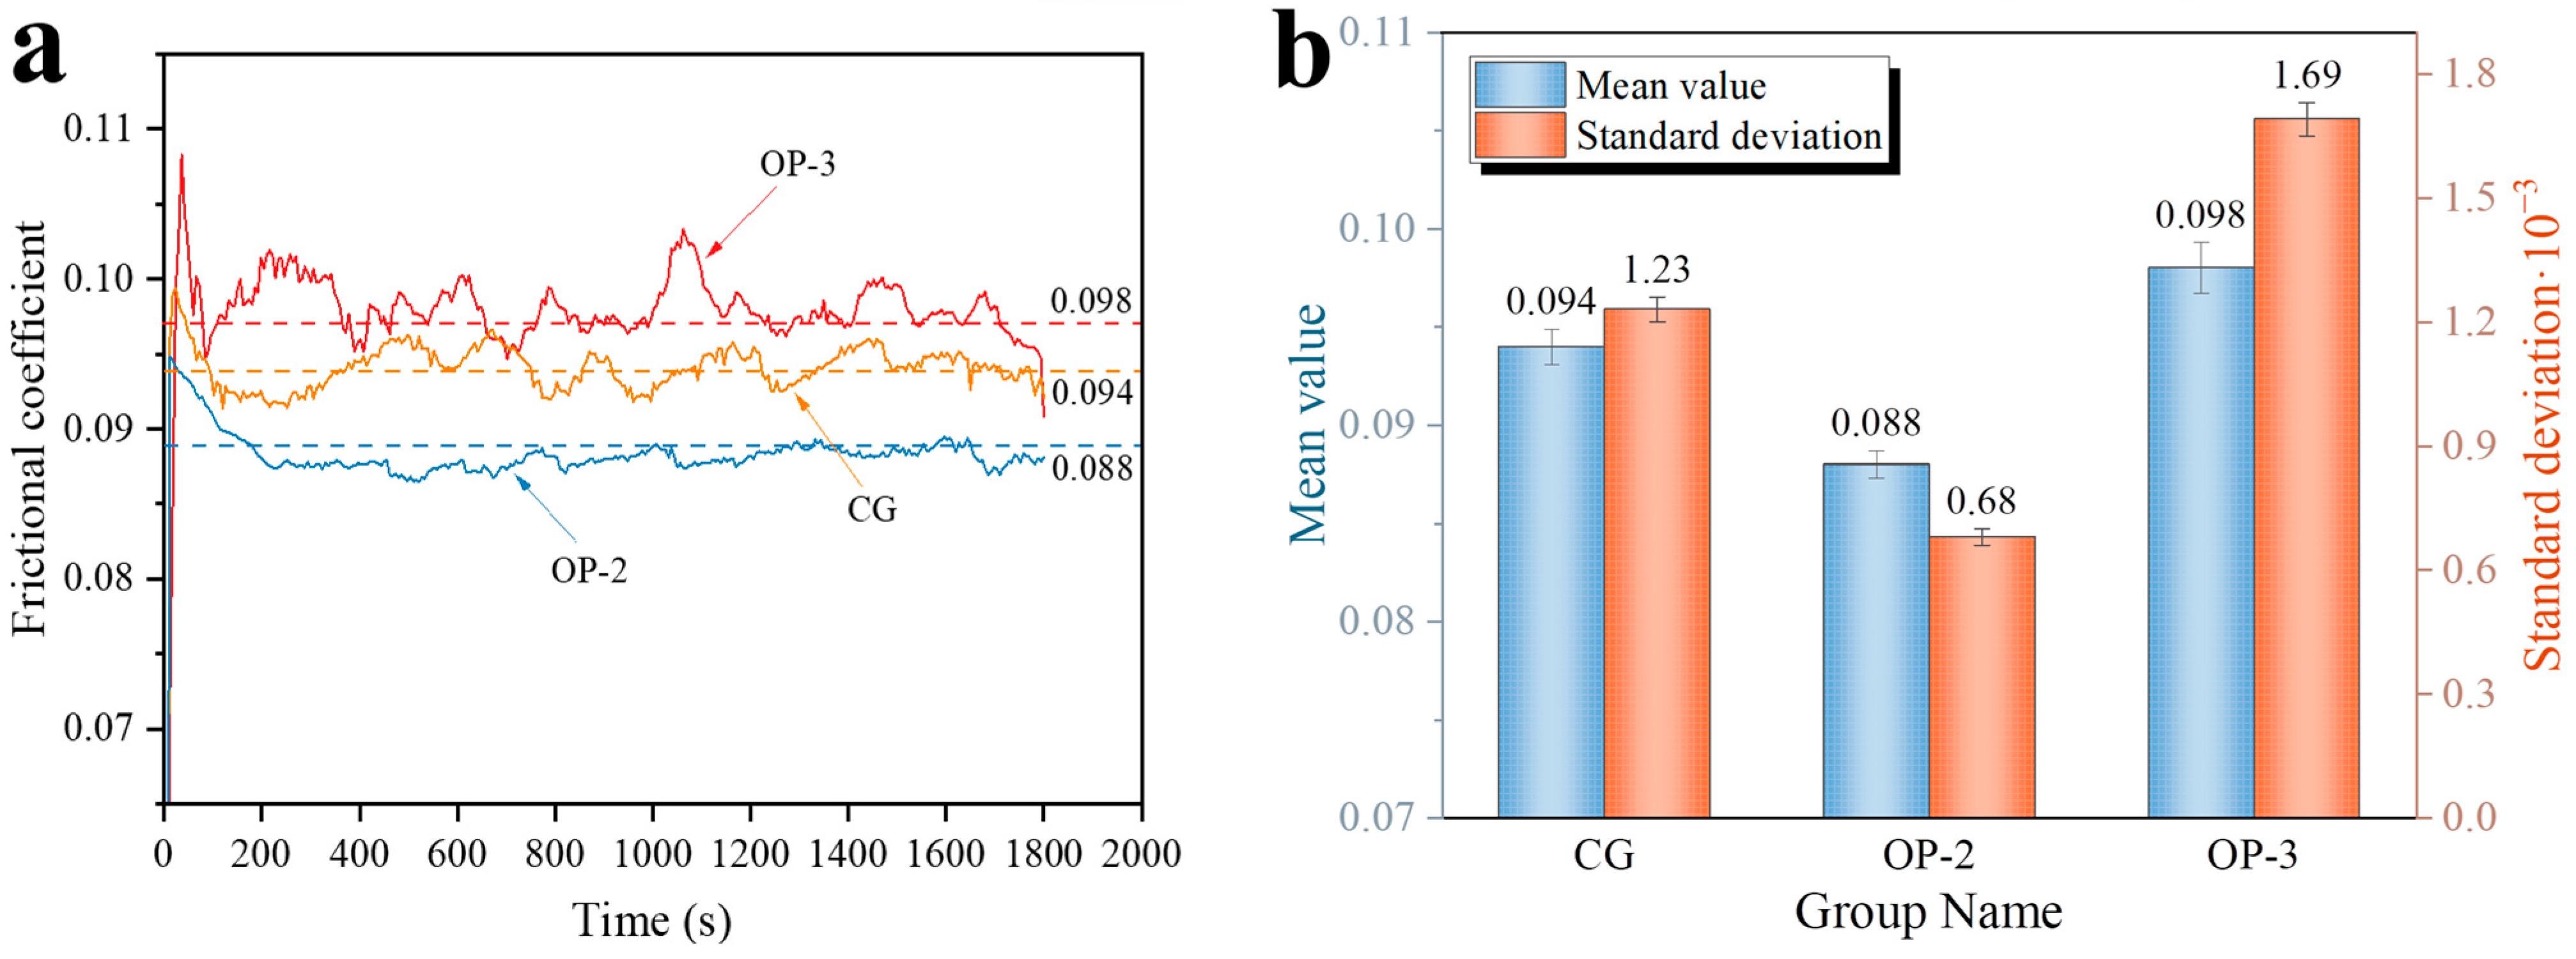
The results of the tribological and life tests indicate that the Kriging prediction model has high accuracy. When compared to the predicted results, the relative error of the friction coefficient is only 1.1%, and the relative error of the service life is only 0.9%. This can be used to guide the preparation and performance optimization of CSCPG.

Author Contributions

Conceptualization, H.Z. and Y.M.; Data curation, H.Z. and Y.M.; Formal analysis, H.Z. and Q.L. (Qingchun Liu); Funding acquisition, Y.M.; Investigation, Q.L. (Qingchun Liu) and J.W.; Methodology, H.Z. and Y.M.; Project administration, Q.L. (Qian Li); Resources, Q.L. (Qian Li); Software, H.Z. and Q.L. (Qingchun Liu); Supervision, Y.M.; Validation, H.Z., J.W. and Q.L. (Qian Li); Visualization, J.W.; Writing—original draft, H.Z.; Writing—review & editing, Y.M. All authors have read and agreed to the published version of the manuscript.

Funding

This research received no external funding.

Data Availability Statement

The data presented in this study are available in this article.

Conflicts of Interest

The authors declare no conflict of interest.

References

  1. Allmaier, H. Increase Service Life for Rail Wheel Bearings—A Review of Grease Lubrication for This Application. Lubricants 2022, 10, 36. [Google Scholar] [CrossRef]
  2. Bakunin, V.N.; Aleksanyan, D.R.; Bakunina, Y.N. Calcium Carbonate Polymorphs in Overbased Oil Additives and Greases. Russ. J. Appl. Chem. 2022, 95, 461–471. [Google Scholar] [CrossRef]
  3. Sniderman, D. Calcium sulfonate complex greases. Tribol. Lubr. Technol. 2016, 72, 28. [Google Scholar]
  4. Kobylyanskii, E.V.; Kravechuk, G.G.; Makedonskii, O.A.; Ishchuk, Y.L. Structure of ultrabasic sulfonate greases. Chem. Technol. Fuels Oils 2002, 38, 110–114. [Google Scholar] [CrossRef]
  5. Fan, X.; Li, W.; Li, H.; Zhu, M.; Xia, Y.; Wang, J. Probing the effect of thickener on tribological properties of lubricating greases. Tribol. Int. 2018, 118, 128–139. [Google Scholar] [CrossRef]
  6. Wen, Z.; Xia, Y.; Feng, X. Tribological Properties of the Overbased Calcium Sulfonate Complex Greases. In Advanced Materials Research; Zhao, H., Ed.; Mechanical and Electronics Engineering III, PTS 1-5; Trans Tech Publications, Ltd.: Zurich, Switzerland, 2012; Volume 130–134, pp. 891–894. [Google Scholar] [CrossRef]
  7. Woo, J.; Lee, D.; Ryong, H.K. Studies on the synthesis and characteristics of calcium sulfonate complex grease. J. Korea Acad.-Ind. Coop. Soc. 2019, 20, 8–15. [Google Scholar] [CrossRef]
  8. Liu, D.; Zhao, G.; Wang, X. Tribological Performance of Lubricating Greases Based on Calcium Carbonate Polymorphs Under the Boundary Lubrication Condition. Tribol. Lett. 2012, 47, 183–194. [Google Scholar] [CrossRef]
  9. Gao, Y.; Ge, X.; Wen, Z.; Xia, Y. Comparison Friction and Wear Properties of Overbased Calcium Sulfonate Complex Grease and Polyurea Grease. In Advanced Materials Research; Wu, J., Lu, X., Xu, H., Nakagoshi, N., Eds.; Resources and Sustainable Development, PTS 1-4; Trans Tech Publications, Ltd.: Zurich, Switzerland, 2013; Volume 734–737, p. 2484. [Google Scholar] [CrossRef]
  10. Zhang, H.; Mo, Y.M.; Lv, J.C.; Wang, J. Tribological Behavior of WS2 Nanoparticles as Additives in Calcium Sulfonate Complex-Polyurea Grease. Lubricants 2023, 11, 259. [Google Scholar] [CrossRef]
  11. Wu, C.; Hong, Y.; Ni, J.; Teal, P.D.; Yao, L.; Li, X. Investigation of mixed hBN/Al2O3 nanoparticles as additives on grease performance in rolling bearing under limited lubricant supply. Colloid Surf. A-Physicochem. Eng. Asp. 2023, 659, 130811. [Google Scholar] [CrossRef]
  12. Wu, C.; Liu, Z.; Ni, J.; Yang, K.; Yang, H.; Li, X. Improved tribological and bearing vibration performance of calcium sulfonate complex grease dispersed with MoS2 and oxide nanoparticles. Proc. Inst. Mech. Eng. Part C-J. Eng. Mech. Eng. Sci. 2023, 237, 1941–1955. [Google Scholar] [CrossRef]
  13. Venkataramani, P.S.; Srivastava, R.G.; Gupta, S.K. High temperature greases based on polyurea gellants: A review. J. Synth. Lubr. 1987, 4, 229–244. [Google Scholar] [CrossRef]
  14. Lyadov, A.S.; Maksimova, Y.M.; Ilyin, S.O.; Gorbacheva, S.N.; Parenago, O.P.; Antonov, S.V. Specific Features of Greases Based on Poly-alpha-olefin Oils with Ureate Thickeners of Various Structures. Russ. J. Appl. Chem. 2018, 91, 1735–1741. [Google Scholar] [CrossRef]
  15. Maksimova, Y.M.; Shakhmatova, A.S.; Ilyin, S.O.; Pakhmanova, O.A.; Lyadov, A.S.; Antonov, S.V.; Parenago, O.P. Rheological and Tribological Properties of Lubricating Greases Based on Esters and Polyurea Thickeners. Pet. Chem. 2018, 58, 1064–1069. [Google Scholar] [CrossRef]
  16. Liu, L.; Sun, H.W. Impact of polyurea structure on grease properties. Lubr. Sci. 2010, 22, 405–413. [Google Scholar] [CrossRef]
  17. Ren, G.; Zhou, C.; Fan, X.; Zheng, M.; Wang, S. Investigating the rheological and tribological properties of polyurea grease via regulating ureido amount. Tribol. Int. 2022, 173, 107643. [Google Scholar] [CrossRef]
  18. Ren, G.; Sun, X.; Li, W.; Li, H.; Zhang, L.; Fan, X.; Li, D.; Zhu, M. Improving the lubrication and anti-corrosion performance of polyurea grease via ingredient optimization. Friction 2021, 9, 1077–1097. [Google Scholar] [CrossRef]
  19. Cyriac, F.; Lugt, P.M.; Bosman, R. Impact of Water on the Rheology of Lubricating Greases. Tribol. Lubr. Technol. 2017, 73, 56–70. [Google Scholar] [CrossRef]
  20. Zhou, Y.; Bosman, R.; Lugt, P.M. On the Shear Stability of Dry and Water-Contaminated Calcium Sulfonate Complex Lubricating Greases. Tribol. Trans. 2019, 62, 626–634. [Google Scholar] [CrossRef]
  21. Bosman, R.; Lugt, P.M. The Microstructure of Calcium Sulfonate Complex Lubricating Grease and Its Change in the Presence of Water. Tribol. Trans. 2018, 61, 842–849. [Google Scholar] [CrossRef]
  22. Sun, L.; Ma, R.; Zhao, Q.; Zhao, G.; Wang, X. The Impact of Water on the Tribological Behavior of Lubricating Grease Based on Calcium Carbonate Polymorphs. Lubricants 2022, 10, 188. [Google Scholar] [CrossRef]
  23. Cyriac, F.; Lugt, P.M.; Bosman, R.; Venner, C.H. Impact of Water on EHL Film Thickness of Lubricating Greases in Rolling Point Contacts. Tribol. Lett. 2016, 61, 23. [Google Scholar] [CrossRef]
  24. Xu, J.; Wang, P.; Ma, X.; Qian, Y.; Chen, R. Parameters studies for rail wear in high-speed railway turnouts by unreplicated saturated factorial design. J. Cent. South Univ. 2017, 24, 988–1001. [Google Scholar] [CrossRef]
  25. Hou, S.; Dong, D.; Ren, L.; Han, X. Multivariable crashworthiness optimization of vehicle body by unreplicated saturated factorial design. Struct. Multidiscip. Optim. 2012, 46, 891–905. [Google Scholar] [CrossRef]
  26. Kleijnen, J. Kriging metamodeling in simulation: A review. Eur. J. Oper. Res. 2009, 192, 707–716. [Google Scholar] [CrossRef]
  27. Deb, K.; Pratap, A.; Agarwal, S.; Meyarivan, T. A fast and elitist multiobjective genetic algorithm: NSGA-II. IEEE Trans. Evol. Comput. 2002, 6, 182–197. [Google Scholar] [CrossRef]
  28. Li, H.; Zhang, Q.F. Multiobjective Optimization Problems with Complicated Pareto Sets, MOEA/D and NSGA-II. IEEE Trans. Evol. Comput. 2009, 13, 284–302. [Google Scholar] [CrossRef]
  29. Ren, G.; Zhang, P.; Li, W.; Fan, X.; Zhang, L.; Li, H.; Zhu, M. Probing the Synergy of Blended Lithium Complex Soap and Calcium Sulfonate Towards Good Lubrication and Anti-Corrosion Performance. Tribol. Lett. 2020, 68, 99. [Google Scholar] [CrossRef]
  30. Qi, P.; Wang, S.; Li, J.; Li, Y.; Dong, G. Synergistic lubrication effect of antioxidant and low content ZDDP on PFPE grease. Ind. Lubr. Tribol. 2021, 73, 830–838. [Google Scholar] [CrossRef]
  31. Dai, X.Z.; Guo, P.; Hong, D.M.; Hui, J.D.; Hui, Z.M.; Geng, F. The effect of preparation and characterisation of polyurea grease. Mater. Res. Innov. 2015, 19, 588–591. [Google Scholar] [CrossRef]
  32. Jang, D.; Anderson-Cook, C.M. Examining robustness of model selection with half-normal and LASSO plots for unreplicated factorial designs. Qual. Reliab. Eng. Int. 2017, 33, 1921–1928. [Google Scholar] [CrossRef]
  33. Skrypnyk, R.; Ekh, M.; Nielsen, J.C.O.; Palsson, B.A. Prediction of plastic deformation and wear in railway crossings—Comparing the performance of two rail steel grades. Wear 2019, 428, 302–314. [Google Scholar] [CrossRef]
  34. Garshin, M.V.; Porfiryev, Y.V.; Zaychenko, V.A.; Shuvalov, S.A.; Kolybelsky, D.S.; Gushchin, P.A.; Vinokurov, V.A. Effect of Base Oil Composition on the Low-Temperature Properties of Polyurea Greases. Pet. Chem. 2017, 57, 1177–1181. [Google Scholar] [CrossRef]
  35. Knothe, G.; Steidley, K.R. The effect of metals and metal oxides on biodiesel oxidative stability from promotion to inhibition. Fuel Process. Technol. 2018, 177, 75–80. [Google Scholar] [CrossRef]
  36. Sanchez-Gomez, J.M.; Vega-Rodriguez, M.A.; Perez, C.J. Comparison of automatic methods for reducing the Pareto front to a single solution applied to multi-document text summarization. Knowl.-Based Syst. 2019, 174, 123–136. [Google Scholar] [CrossRef]
  37. Wang, Z.; Xia, Y.; Liu, Z. The rheological and tribological properties of calcium sulfonate complex greases. Friction 2015, 3, 28–35. [Google Scholar] [CrossRef]
  38. Zhang, F.S.; Liu, T.T.; Liu, J.T.; Cui, F.K. Research on Bearing Life Prediction Based on Three Parameters Weibull Distribution. In Advanced Materials Research; Zuo, D., Guo, H., Xu, H.L., Su, C., Liu, C.J., Jin, W., Eds.; Frontier in Functional Manufacturing Technologies; Trans Tech Publications, Ltd.: Zurich, Switzerland, 2010; Volume 136, pp. 162–166. [Google Scholar] [CrossRef]
  39. Poplawski, J.V.; Peters, S.M.; Zaretsky, E.V. Effect of roller profile on cylindrical roller bearing life prediction—Part I: Comparison of bearing life theories. Tribol. Trans. 2001, 44, 339–350. [Google Scholar] [CrossRef]
Figure 1. Preparation flowchart of CSCPG.
Lubricants 11 00377 g001
Figure 2. MFT-5000 friction and wear testing machine. (a) Testing machine body; (b) tested sample; (c) surface topography and the values of the basic surface roughness parameters of the sample.
Lubricants 11 00377 g002
Figure 3. Half-normal plots of four observations. (a) y1; (b) y2; (c) y3; (d) y4.
Lubricants 11 00377 g003
Figure 4. Kriging prediction model for friction coefficient and service life. (a) y1 vs. x2 and x5; (b) y2 vs. x4 and x6; (c) y2 vs. x3 and x4; (d) y2 vs. x3 and x5.
Lubricants 11 00377 g004aLubricants 11 00377 g004b
Figure 5. NSGA-II multi-objective optimization results. (a) Two-objective optimization solution; (b) Three-objective optimization solution; (c) projection of three-objective optimization solution in the y1 and y2 plane.
Lubricants 11 00377 g005
Figure 6. Tribological performance of CSCPG before and after optimization. (a) Dynamic curve of friction coefficient; (b) the average and standard deviation of the friction coefficient during the stable stage.
Lubricants 11 00377 g006
Figure 7. Three-dimensional maps, roughness along the direction of wear scars (yellow), and roughness of the cross-section (red) of the CSCPG wear marks before and after optimization. (ac) CG; (df) OP-2; (gi) OP-3.
Lubricants 11 00377 g007aLubricants 11 00377 g007b
Figure 8. Wear performance of wear marks before and after optimization. (a) The width and depth of wear marks; (b) wear volume and wear rate of wear marks.
Lubricants 11 00377 g008
Figure 9. Comparison of the service life of CSCPG before and after optimization. (a) CG; (b) OP-2; (c) OP-3; (d) L50 service life and the shape parameter β.
Lubricants 11 00377 g009
Table 1. Test conditions for tribological test.
Reciprocating Distance/mmReciprocating Frequency/HzTest Load (Fz)/NTest Time/min
812030
Table 2. Test conditions for service life test.
Axial Load/NBearing Speed/RPMTemperature/°C
15006000120
Table 3. Initial values and value ranges of influencing factors.
NumberA/%B/mm2/sC/%D/%E/%F/%G/minH/minJ/°CK/°CL/mm
Initial value261508421.590100901300.2
Minimum2090230.50.56060801000.1
Maximum35300106321201201001300.4
Table 4. Plackett-Burman design table and observations based on L12 (211).
No.ABCDEFGHJKLy1y2y3y4
1−111−11−1−1−11110.14240316278
2111−111−11−1−1−10.1227321248
3−1−1111−111−11−10.11239318256
411−111−11−1−1−110.14194310274
511−11−1−1−1111−10.13191322260
6−1111−111−11−1−10.09197307263
7−1−1−1111−111−110.07193298286
81−1−1−1111−111−10.08218313256
91−111−11−1−1−1110.08215326253
101−11−1−1−1111−110.11194321249
11−11−1−1−1111−1110.09195306289
12−1−1−1−1−1−1−1−1−1−1−10.11189300268
Table 5. Significant influencing factors of four observations.
ObservationsSignificant Effects
y1B, F
y2C, E, K
y3A, C, K
y4A, B, C, L
Table 6. Selection of design variables and their initial values.
Significant FactorsDesign VariablesInitial Value
Ax126
Bx2150
Cx38
Ex42
Fx51.5
Kx6130
Table 7. Sampling points and observation values based on OLHD.
No.x1x2x3x4x5x6y1y2y3y4
12721281.511070.112207318263
235281321.51240.110205312267
333152931.51110.098224323254
4322407211280.118220314260
521147621.51010.091204310272
62217262.511230.109220307270
7331154111010.102188317257
83429841.51.51000.109189321265
92622772.51.51170.103219313268
1034127930.51020.120220326249
112815632.51.51050.094200313268
122524891.51.51160.102214314264
13261424111130.103194310267
143120340.50.51200.123194313262
1523187421.51250.096210304273
1620911010.51190.110216312262
172727321.511090.116192310275
18272685311250.121222311270
1922259621.51150.103211310275
202226360.511120.113197311271
213113682.511210.108223318255
2227122821.51120.091214315260
233117082.50.51260.124226315258
24342111020.51080.128215327250
25231839121070.081206313263
263219421.50.51290.124202309267
27332455111270.116204313262
282411851.511220.101209308267
292412970.521060.074196311264
30342355121050.089192320262
31212941011.51280.106221310268
32322543211300.119210309267
333025690.521030.089198323259
342815972.521060.083211314262
35331108121080.076203320253
362017681.51.51220.093215309270
3730101711.51170.088204314256
382427962.511140.120213311272
392910442.521030.077201312266
40292203111260.113199309270
412520751.521150.084204308271
4228182420.51170.122206312267
432998930.51210.118230316256
442219870.51.51290.095210308267
4525230230.51100.128206308276
463029082.511110.124217319263
472528732.51.51190.108208307278
48291633221180.083203308268
492122151.511040.110197309275
502313761.51.51130.090205309269
Table 8. Error analysis of Kriging prediction model.
Design ObjectivesMRER2Radj2
y10.08460.9210.910
y20.06950.9520.945
Table 9. Comparison of NSGA-II multi-objective optimization before and after.
x1x2x3x4x5x6y1y2y3
Initial group26150821.51300.094212310
Optimal Prediction-II32130831.71130.089220317
Optimal Prediction-III3414382.71.51030.097217322
Maximum optimization------5.3%3.8%3.9%
Disclaimer/Publisher’s Note: The statements, opinions and data contained in all publications are solely those of the individual author(s) and contributor(s) and not of MDPI and/or the editor(s). MDPI and/or the editor(s) disclaim responsibility for any injury to people or property resulting from any ideas, methods, instructions or products referred to in the content.

