Article

Key Parameters and Experimental Study of High-Speed Rotating Meshing Gear Injection Lubrication Based on Moving Particle Semi-Implicit Method

1
Beijing Institute of Technology, Beijing 100081, China
2
China North Vehicle Research Institute Key Laboratory of Vehicle Transmission, Beijing 100072, China
3
Ministry of Education Key Laboratory for Cross-Scale Micro and Nano Manufacturing, Changchun University of Science and Technology, Changchun 130022, China
*
Author to whom correspondence should be addressed.
Lubricants 2023, 11(9), 366; https://doi.org/10.3390/lubricants11090366
Submission received: 11 May 2023 / Revised: 9 August 2023 / Accepted: 14 August 2023 / Published: 31 August 2023
(This article belongs to the Special Issue Advances in Gear Tribology)

Abstract

:
With the rapid development of China’s manufacturing industry, products are changing toward better energy efficiency and precision. Reducing transmission energy waste, enhancing transmission lubrication, and increasing transmission efficiency have all become critical concerns. The moving particle semi-implicit particle approach is utilized in this study to create a high-speed rotating meshing gear lubrication model and conduct a simulation analysis of transmission gears by studying the influence law of sensitive parameter injection diameter on lubrication. The oil distribution state on the gear surface, the gear tooth surface heat dissipation effect, and the degree of gear operating stability are all calculated by computing the gear surface fluid coverage and convective heat transfer coefficient. According to the numerical simulation results, increasing the liquid injection diameter can greatly enhance fluid coverage and convective heat transfer coefficient on the gear surface, hence improving lubrication. However, when the injection diameter reaches a critical value, the contact area between the liquid and the gear is maximized, and additional increases in the injection diameter will not improve the lubricating effect. Experiments have revealed that the liquid injection diameter is the most critical factor influencing gears. The gear torque dramatically increases as the liquid injection diameter increases. According to a rigorous analysis, the gear lubrication effect is optimal when the liquid injection diameter is 2.0 mm. This provides a theoretical foundation for transmission system lubrication design.

1. Introduction

With the rapid expansion of the machinery manufacturing industry, power transmission devices are widely employed in a variety of mechanical equipment, such as aerospace, ships, metallurgy, chemical industry, transportation machinery, agricultural machinery, and engineering machinery. Large devices are applied to helicopters, wind power equipment, large machine tools, marine reducers and other national economic construction and defense equipment; small devices are applied to cars, home appliances, watches and other household items. Gear transmission is undoubtedly the most extensive application. It has the advantages of a relatively accurate transmission, high efficiency, compact structure, reliable work and long life. Lubrication is an important means of preventing and retarding wear and other forms of failure of parts. Lubrication technology plays an important role in the operation and maintenance of mechanical transmission drives, affecting the performance, accuracy and life of the equipment. In gear transmission, lubrication can not only reduce friction and wear, but also plays a role in cooling, noise reduction, improving the working conditions of gears and extending their service life. As a result, the exploration of the role of gear injection lubrication in ensuring good driveline operation and low energy consumption has been a key focus within the industry [1,2].
Many scholars have carried out studies ofntransmission gear lubrication. Satya Seetharaman et al. proposed a simplified hydrodynamics-based model for predicting wind-resistance power losses in running gear pairs under injection lubrication. The findings of metric research were provided to quantify the impact of key system parameters as well as the individual contribution of each component to overall wind-resistance power loss [3]. Nicolas Voeltzel et al. investigated the power losses caused by the rotation of helical gears in pure air based on experimental results and computational fluid dynamics models. The simulated flow patterns were discovered to be significantly different from those computed for spur gears, with tooth width and helix angle both having an influence [4]. Fernandes et al. created the temperature finite element simulation of a polymer gear in order to calculate the flash temperature rise during gear-meshing and the gear’s body temperature field. The model can calculate the temperature field of gears whether lubricated with oil injection, splash lubrication, or dry friction [5]. Mohammadpour presented a thermal EHL analysis of hypoid gears, which includes an analysis of high contact loads and shear rates in order to predict the temperature variations [6]. Massini Daniele et al. designed a new test rig to investigate the power loss caused by a single spur gear rotating in a free-oil environment. By calculating Reynolds-averaged Navier–Stokes (RANS) simulations in the context of reproducing standard eddy viscosity models, the experiment obtains high agreement for all rotational speeds [7]. Ruzek Michal et al. addressed the wind resistance power loss (WPL) of rotating pinion pairs in air and employed a specific test to measure the WPL of numerous discs, spur gears, and helical gears, which was created from a WPL measurement device initially used for a single pinion or disc. Experiments demonstrated that while some couplings could be discovered between two rotating gears, the overall WPL could be approximated as the sum of each individual component [8]. Andersson et al. used back-to-back gear tests to compare the effect of immersion and oil-injection lubrication on gearbox efficiency. The experimental results show that oil injection lubrication provides significantly higher gearbox efficiency at higher speeds. Lower bearing temperatures and power losses were obtained due to oil injection lubrication compared to immersion lubrication [9]. Dai studied and analyzed the flow characteristics of the new nozzle using CFD methods to predict the effect of nozzle shape and size on pressure and velocity distribution [10]. Chang developed a mathematical model for spur gear-meshing hybrid lubrication. The model was used to analyze the performance of high-load and high-speed gear systems with varying degrees of mixed lubrication. The results show that, in earlier studies, good lubrication conditions were obtained using low modulus gears and high-pressure angle gears [11]. Gan proposed a numerical method that combines a hybrid elastohydrodynamic lubrication model with a finite element method based on thermal analysis [12]. D. Croccolo, M. De Agostinis et al. collected gear designs and offer guidance, as well as providing a numerical example that finds the optimal solution for fitting a certain space while maximizing the transferable torque to weight ratio of two mating spur gears [13]. Tiancheng Ouyang, Guicong Huang et al. investigated the lubrication and dynamics of high-speed spur gears by introducing a new model based on the theory of friction dynamics. The simulation results indicate that it is necessary to utilize a tribo-dynamic model to assist in the lubrication design and vibration control of spur gear under high-speed conditions [14].
Based on the research of the aforementioned scholars, this paper proposes investigating the influence of various factors on gear lubrication in high-speed meshing gears in order to determine the effect law of a sensitive parameter incidence diameter on gear lubrication. The effect of an oil covering on gear surface and the heat transfer abilities of the gear tooth surface are investigated by comparing different incidence diameter sizes to disclose the influence law of gear lubrication. By building a test bench, the lubrication theory is researched and confirmed, exposing the lubrication law of meshing gears and providing theoretical support for the design of lubrication parameters.

2. Gear Lubrication Theory

The moving particle semi-implicit method (MPS) is a method proposed by Koshizukal of the University of Tokyo in 1996. The most important feature of this method is that it does not require meshing, which greatly increases the speed of calculation and is suitable for complex fluid motion and multiphase flow [15]. The MPS method is a fluid calculation method based on the Lagrangian system and a large number of scholars have become interested in this method. As a result, the moving particle semi-implicit method has been substantially improved. One outstanding improvement was made by Khayyer and Gotohl, who proposed the higher-order source term model and the improved pressure gradient model, which have led to substantial improvements in the numerical stability and accuracy of the moving particle semi-implicit method. It is widely used in engineering problems and is particularly suitable for flow calculations of incompressible fluids [16]. It can be used to predict the lubrication of systems with rotating shafts and gears, and to analyze the forces and torques of each component of the system, enabling the high-performance simulation of realistic geometries.
The basic principle of the MPS method is that the fluid substance in the calculation area is discretized into a number of moving particle cells, and physical quantities such as velocity, temperature and pressure are stored at the point of the moving fluid substance. Each particle contains different corresponding flow information, and the Lagrangian equations are used as the basis for solving the equations for the interaction relations between the particles and the discrete fundamental flow equations. Because of the mutual coupling between the physical fields of particles, the flow information of the particles at one moment can be predicted and corrected for the next moment. As the time step progresses, information on the dynamic flow of the entire flow field can be obtained.

2.1. Moving Particle Semi-Implicit Method

The MPS provides the equations for the conservation of mass and conservation of energy under a Lagrangian fluid.
Conservation of mass equation:
d ρ d t + ρ μ = 0
Conservation of momentum equation:
ρ d μ d t = p + μ 2 μ + ρ f
Formulas 1 and 2: μ present the fluid velocity vector; ρ is the fluid density; p is the pressure; μ is the fluid dynamic viscosity coefficient; f (N) is the external force vector acting on a unit mass of fluid. The left-hand ends of the equations are all expressed in the Lagrangian time differential form, with the convective term included.
In the MPS, the particle interacts with the surrounding particles through the nuclear function. The kernel function was established by Shakibaeinia et al. [17].
w r 0 = r e r 0 1   r 0 < r e   0   r 0 r e  
Formula 3: r 0 is the distance between the particles; r e is called the radius of particle action. It can be seen from Equation (3) that when r 0 r e , there is no interaction between the particles. The particles only interact with particles located in their particle radius of action r e , so the nuclear function has the tight-branching property. Therefore, in order to ensure uniformity of distribution and isotropy in the placement of neighbouring particles, the appropriate value for the effective radius is between two and four times the length of the initial particle distance.
The particle number density model, the gradient vector model and the Laplace model are as follows:
< n > i = j i w r i r j
< Φ > i = d n 0 j i Φ i Φ j r i r j 2 r i r j w r i r j
< 2 Φ > i = 2 d ζ n 0 i j ( Φ i Φ j ) w ( | r i r j | )
In Formulas 4, 5 and 6: d is the spatial dimension of the solution problem; n 0 is the particle number density constant; Φ is the scalar value of the particle physics parameter; ζ is the correction factor. The particle radius of action r e   ( m ) is not required to be the same for each of the above models.

2.2. Theoretical Analysis of Heat Dissipation

In the lubrication process, the main forms of heat dissipation in the transmission system is convective heat exchange [18]. The lubricant fluid flows over the solid surface and the heated tooth surface for heat exchange, thus taking away a lot of heat generated by the gears rubbing against each other. Convection heat exchange is one of the basic forms of heat transfer although there heat is conducted between gears and connections, the conduction method can only transfer heat through the contact medium, making heat conduction insufficient to take away more heat, so convection heat exchange is the main heat dissipation method of the transmission system.
The basic equation for convective heat transfer was proposed by Newton [19]. Newton’s law of cooling is as follows:
q = h t w t f
In Formula 7, q is the heat flow density ( w / m 2 ); h is the convective heat transfer coefficient ( w · K / m 2 ); t w is the solid wall temperature ( K ); t f is the fluid characteristic temperature ( K ) .
In the oil injection cooling process, the cooling power from the macroscopic convective heat transfer can be calculated according to the following formula.
  P = C ρ Q Δ
In Formula 8, C is the specific heat capacity of the cooling medium (J/(kg·K)); ρ is the density of the cooling medium (kg/m3); Q is the flow rate (L/min); Δ is the temperature difference between the inlet and outlet oil.
Equation (8) shows that the oil injection reached the steady state when the lubricant temperature was determined. The difference between the solid wall temperature and the characteristic fluid temperature remains constant and there is a strong correlation between the heat flow density and the convective heat dissipation coefficient. The higher the convection heat dissipation coefficient, the greater the heat exchange capacity between the fluid and the solid, and the better the heat dissipation effect.

3. Numerical Simulation of Gear Lubrication

3.1. Numerical Simulation Model Construction

This study investigates a pair of spur gears, with the major gear having a module of 1.5 and 42 teeth and the pinion having a module of 1.5 and 35 teeth. The specific parameters of the gears are shown in Table 1:
The 3D gear modeling based on gear data parameters. As shown in Figure 1.

3.2. Numerical Simulation of Boundary Conditions

An investigation of jet pressure at 0.3 MPa for jet lubrication simulation analysis is presented in this work. The main wheel was the pinion gear, and the driven wheel was the large gear; the pinion gear’s speed was set to 5000 r/min, and the large gear’s speed was set to 4200 r/min to assure the high speed of the gear in the numerical computation process. For numerical calculations, the shondy software was used in this paper. The selected lubricant grade was 10w-40; the kinematic viscosity was 0.0000208 m2/s; the specific heat capacity was 4431 J/kg; the thermal conductivity was 0.173 W/mk and the coefficient of expansion was 0.0007709. The simulation of injection lubrication was carried out at an oil temperature of 40 degrees Celsius. The simulation will open the heat transfer model, the turbulence model and the fluid flow model. The momentum equation type was chosen as the explicit method, calculated using a gas–liquid two-phase flow model.

3.3. Numerical Simulation Analysis of Large Gears

The results of Shondy software simulation calculation using data from Paraview software, after selecting the lubricant and gear tooth contact component of the cloud map processing, are as follows.

3.3.1. Coverage Analysis

Coverage is a measure of test completeness and effectiveness. Under actual conditions, gear coverage correctly expresses the effectiveness of gear lubrication and heat dissipation. The data result file imported into Paraview software was read, the large gear surface oil distribution area was selected, and the coverage distribution cloud was obtained as shown in Figure 2.
The cloud diagram in Figure 2 clearly shows that as the incidence diameter rose, the area covered by the gear surface grew progressively greater and its color deepened. When the incidence diameter was increased from 1.5 mm to 2.0 mm, the gear surface coverage cloud changed significantly, the coverage area grew, and the cloud hue deepened. Incidence diameter, lubrication flow, and lubricant surface area in contact with the gear all increased. As a result, coverage expanded dramatically. The coverage area of the gear surface rose somewhat when the incidence diameter grew from 2.0 mm to 2.5 mm, and the cloud color deepened slightly. The change in coverage of the gear surface was limited when the injection diameter was raised from 2.5 mm to 3.0 mm, and there was essentially no change in either the area or color of the covering. The gear surface’s coverage grew as the incidence diameter grew, but there was a limit to how much it could grow. When the incidence diameter increased to a critical value, the contact area between the oil and the gear reached its limit, at which point the incidence diameter increased again and the coverage no longer increased. The increased flow of lubricant only increased the burden on the lubrication system and did not effectively contribute to lubrication. The data extracted from the large gear oil distribution region in Paraview waereexported, and the resulting csv data file was imported into origin to construct the line graph shown in Figure 3.
The pattern of change in coverage over time can clearly be seen in Figure 3. Although the curves are generally balanced, there are small fluctuations up and down. This is due to the fact that the gears are constantly moving during rotational meshing, and the contact area between the oil and the gear surface changes in real time. However, the dynamic balance will be maintained in the primary after stable operation. It was clear from the data reflected in the curves that when the gear diameter increased from 1.5 mm to 2.0 mm, the value of the gear coverage curve very significantly increased. When the incidence diameter was increased to 2.5 mm, the coverage value approached its maximum and then increased very slightly as the incidence diameter was further increased. As a result, the gear’s lubrication limit was set at 2.5 mm incidence diameter. The curves also showed that when the incidence diameter was 2.0 mm, the jets’ coverage values were considerable, and the total lubricating effect was optimal.

3.3.2. Convective Heat Transfer Coefficien (HTC) Analysis

The HTC mode was selected in the visualization interface and the cloud diagram analysis was carried out to investigate the influence of internal heat dissipation during the meshing of high-speed rotating gears, as illustrated in Figure 4.
The cloud diagram in Figure 4 clearly showed that the HTC area of the gear surface grew progressively larger and its color deepened as the incident diameter increased, but the path in change was different. The HTC cloud diagram on the gear surface appeared to change significantly as the incident diameter increased from 1.5 mm to 2.0 mm, with the cloud area expanding and the color intensifying. The lubricant flow rate increases as the injection diameter increases, as does the surface area of the gears in contact with the lubrication fluid, leading to a very considerable increase in HTC. This indicates that as the incidence diameter increases, so does the contact area between the gear and the lubricant; therefore, the heat transfer capacity is further enhanced. The HTC cloud area on the gear surface was slightly extended when the incidence diameter increased from 2.0 mm to 2.5 mm. The change in HTC on the gear surface from 2.5 mm to 3.0 mm is very small, and there is almost no change in either the cloud area or color, indicating that when the incident diameter reaches a critical value, the heat transfer capacity of the oil and the gear product reaches its limit. The incidence diameter was increased again at this time, but the HTC was no longer increased; additional lubricant flow just adds to the stress on the lubrication system and does not help to ensure effective lubrication and heat dissipation.
Similarly, in HTC mode, take the large gear oil contact region and collect the data, which can be imported into the origin to generate the image shown in Figure 5. Figure 5 clearly illustrates the pattern of change in HTC throughout time. From the data reflected in the curve, it is clear that when the gear diameter increased from 1.5 mm to 2.0 mm, the value of the HTC curve of the gear increased very significantly. The value of coverage increased to near maximum when the incidence diameter was increased to 2.5 mm. The HTC remained virtually unaltered while the incidence diameter increased. As a result, the gear’s lubrication limit was discovered to be 2.5 mm incidence diameter. When the diameter of the gears was increased from 1.5 mm to 2.0 mm, the HTC on the gear surface significantly increased, suggesting that the effect of increasing the diameter was visible and may effectively improve the heat dissipation of the lubricant and gears. When the incidence diameter was increased to 2.5 mm, the heat dissipation reaches its limit.
The findings of examining the distribution of the area covered by the liquid on the gear surface revealed that when the liquid injection diameter was 2.0 mm, the large gear surface was more lubricated. The heat transmission effect of the large gear was best when the injection diameter was 2.5 mm, according to an analysis of its convective heat transfer coefficient (HTC). When the injection diameter of 2.0 mm is chosen, the best overall heat dissipation effect of the large gear can be accomplished, considering the practicality of the actual machining process and the cost-effectiveness of the product.

3.4. Numerical Simulation Analysis of Small Gears

The results of incoorperating Shondy software simulation calculation data into Paraview software, selecting the lubricant and gear tooth contact component of the cloud map processing, are as follows.

3.4.1. Coverage Analysis

Coverage is a measure of test completeness and effectiveness. Under actual conditions, gear coverage correctly expresses the effectiveness of gear lubrication and heat dissipation, as indicated in Figure 6. The data resultdate file imported into Paraview software was read, the small gear surface oil distribution area was selected, and the coverage distribution cloud was obtained, as shown in Figure 6.
The pinion gear changes in a similar pattern to the large gear. It is clear from the cloud diagram shown in Figure 6 that as the incident diameter increased, the area covered by the gear surface become progressively larger in general and its color gradually deepened. The coverage cloud on the gear surface changed significantly as the incident diameter increased from 1.5 mm to 2.0 mm, including an increase in coverage area and a deepening of the cloud color. The incident diameter increased, lubrication flow increased, and lubricant surface area in contact with gears increased, resulting in a significant increase in coverage. The gear surface area grew marginally and the cloud color slightly deepened when the incident diameter increased from 2.0 mm to 2.5 mm. When the incident diameter increased from 2.5 mm to 3.0 mm, there was barely any difference in the area or color of the coverage on the gear surface. The coverage of the gear surface increased as the incidence diameter increased, but there was a definite upper limit to this increase. The limit of the contact area between the oil and the gear was reached when the incidence diameter increased to the critical value. The coverage was no longer increasing at this point, although the incidence diameter had increased once more. Increasing the flow of grease did not help with lubrication; instead, it put more strain on the lubrication system.
The data extracted from the small gear oil distribution region in Paraview were exported, and the resulting csv data file was imported into origin to construct the line graph shown in Figure 7.
From the data reflected in the curves, the gear is in constant motion during rotational meshing, and the contact area between the oil and the tooth surface changes in real time, but after the operation is stabilized, the dynamic balance is generally maintained. The data in the curve clearly show that as the gear diameter increases from 1.5 mm to 2.0 mm, the value of the gear coverage curve dramatically increases. When the injection diameter is increased to 2.5 mm, the coverage value approaches the maximum. The magnitude of the rise is greatly reduced at this point, and the increase in coverage is very small when the injection diameter is further increased. As a result, the incidence diameter of 2.5 mm was determined to be the gear’s lubricating limit. The same curve also reveals that when the incidence diameter is 2.0 mm, the jet’s coverage value is large and the total lubricatng effect is best.

3.4.2. Convective Heat Transfer Coefficient (HTC) Analysis

The HTC mode was selected in the visualization interface and a cloud diagram analysis was carried out to investigate the influence of internal heat dissipation during the meshing of high-speed rotating gears, as illustrated in Figure 8.
It is evident from the cloud diagram shown in Figure 8 that the HTC area of the gear surface generally became progressively larger and its color gradually deepened as the incident diameter increased, but the trend of change was different. As the incident diameter increased from 1.5 mm to 2.0 mm, there was a noticeable change in the HTC cloud on the gear surface, with an increase in the cloud area and a deepening of the color. Because the incidence diameter increased and the lubricant flow rate increased, the surface area of the lubricating fluid in contact with the gears increased, resulting in a very large rise in HTC. This demonstrates that the extra oil from the larger diameter considerably enhanced the contact surface between the gear and the lubricant, as well as its heat transfer ability. The HTC cloud region on the gear surface was slightly extended when the incidence diameter was raised from 2.0 mm to 2.5 mm. The change in HTC on the gear surface was minor when the incidence diameter was increased from 2.5 mm to 3.0 mm, with little change in either cloud area or color. This demonstrated that when the incident diameter reached a critical threshold, the heat transmission capacity of the oil and gear reached its limit. The incidence diameter was increased again at this time, but the HTC was no longer increased. The increased flow of lubricant only increased the burden on the lubrication system and did not effectively contribute to the lubrication and heat dissipation.
Similarly, in HTC mode, data from the small gear oil contact region were collected, which were imported into the origin to generate the image shown in Figure 9. Figure 9 clearly depicts the pattern of change in HTC throughout time. The data in the curve clearly reveal that as the gear diameter increased from 1.5 mm to 2.0 mm, the value of the HTC curve increased dramatically. As the incidence diameter reached 2.5 mm, the value of coverage increased to near-maximum and the incidence diameter continued to increase, while the HTC remained almost stable. As a result, an incidence diameter of 2.5 mm can be calculated as the gear’s lubrication limit. When the diameter of the gears was raised from 1.5 mm to 2.0 mm, there was a significant increase in the HTC on the gear surface.
The findings upon examining the distribution of the area covered by the liquid on the gear surface revealed that when the liquid injection diameter was 2.0 mm, the small gear surface was more lubricated. The heat transmission effect of the small gear was best when the injection diameter was 2.5 mm, according to an analysis of its convective heat transfer coefficient (HTC). When the injection diameter of 2.0 mm is chosen, the best overall heat dissipation effect of the small gear can be accomplished, considering the practicality of the actual machining process and the cost-effectiveness of the product.

4. Lubrication Test Analysis

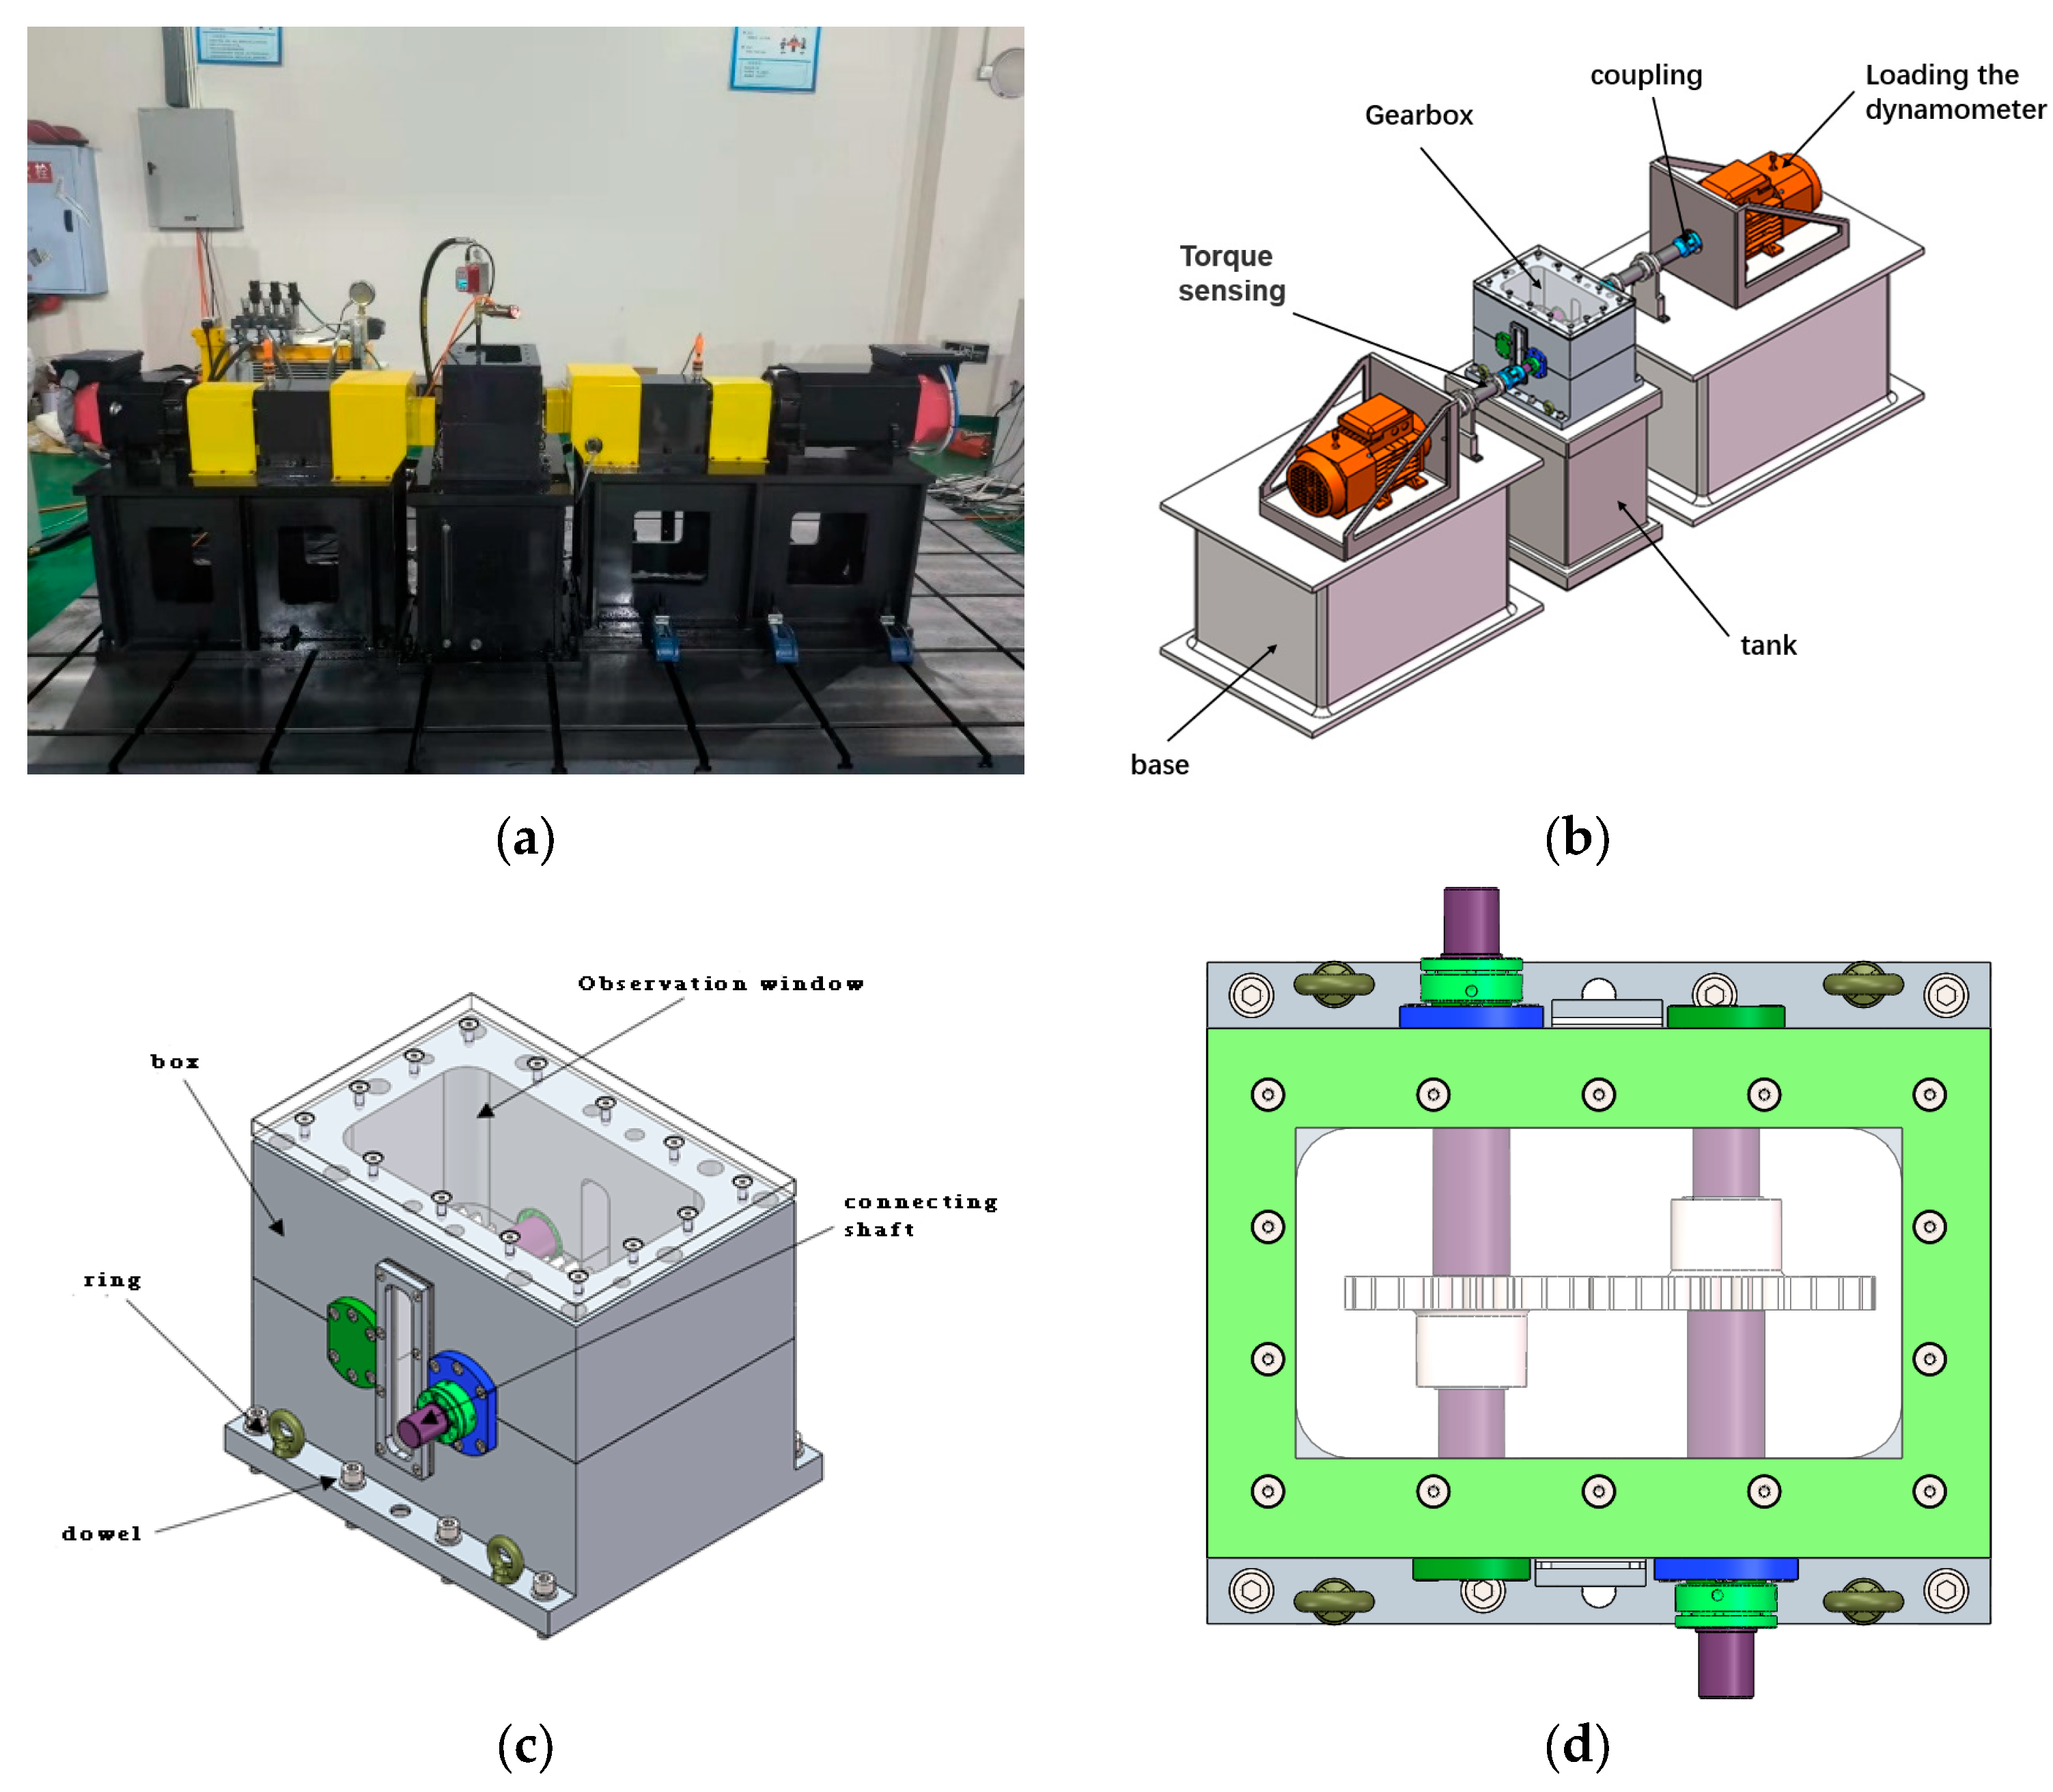
The power loss test rig for injection lubrication required an accurate measurement of the power loss of gears during the process of injection lubrication, as well as reliable and robust equipment. The test stand consists of the following components: power input and output devices, various sensors, gearboxes, transmission gears, loads, data acquisition and processing programs, hydraulic stations, etc. The test rig is illustrated in Figure 10.
The torque is transmitted to the transmission system by the motor, and the torque changes in the gears are registered by torque sensors at both ends of the gears, while the injection system injects oil into the revolving moving gears. The test system will continuously record the data from the gears and appraise the operation of the lubrication system by comparing the data values detected at both ends. The test data will be exported to assist subsequent analyses using the test system’s internal data processing software.
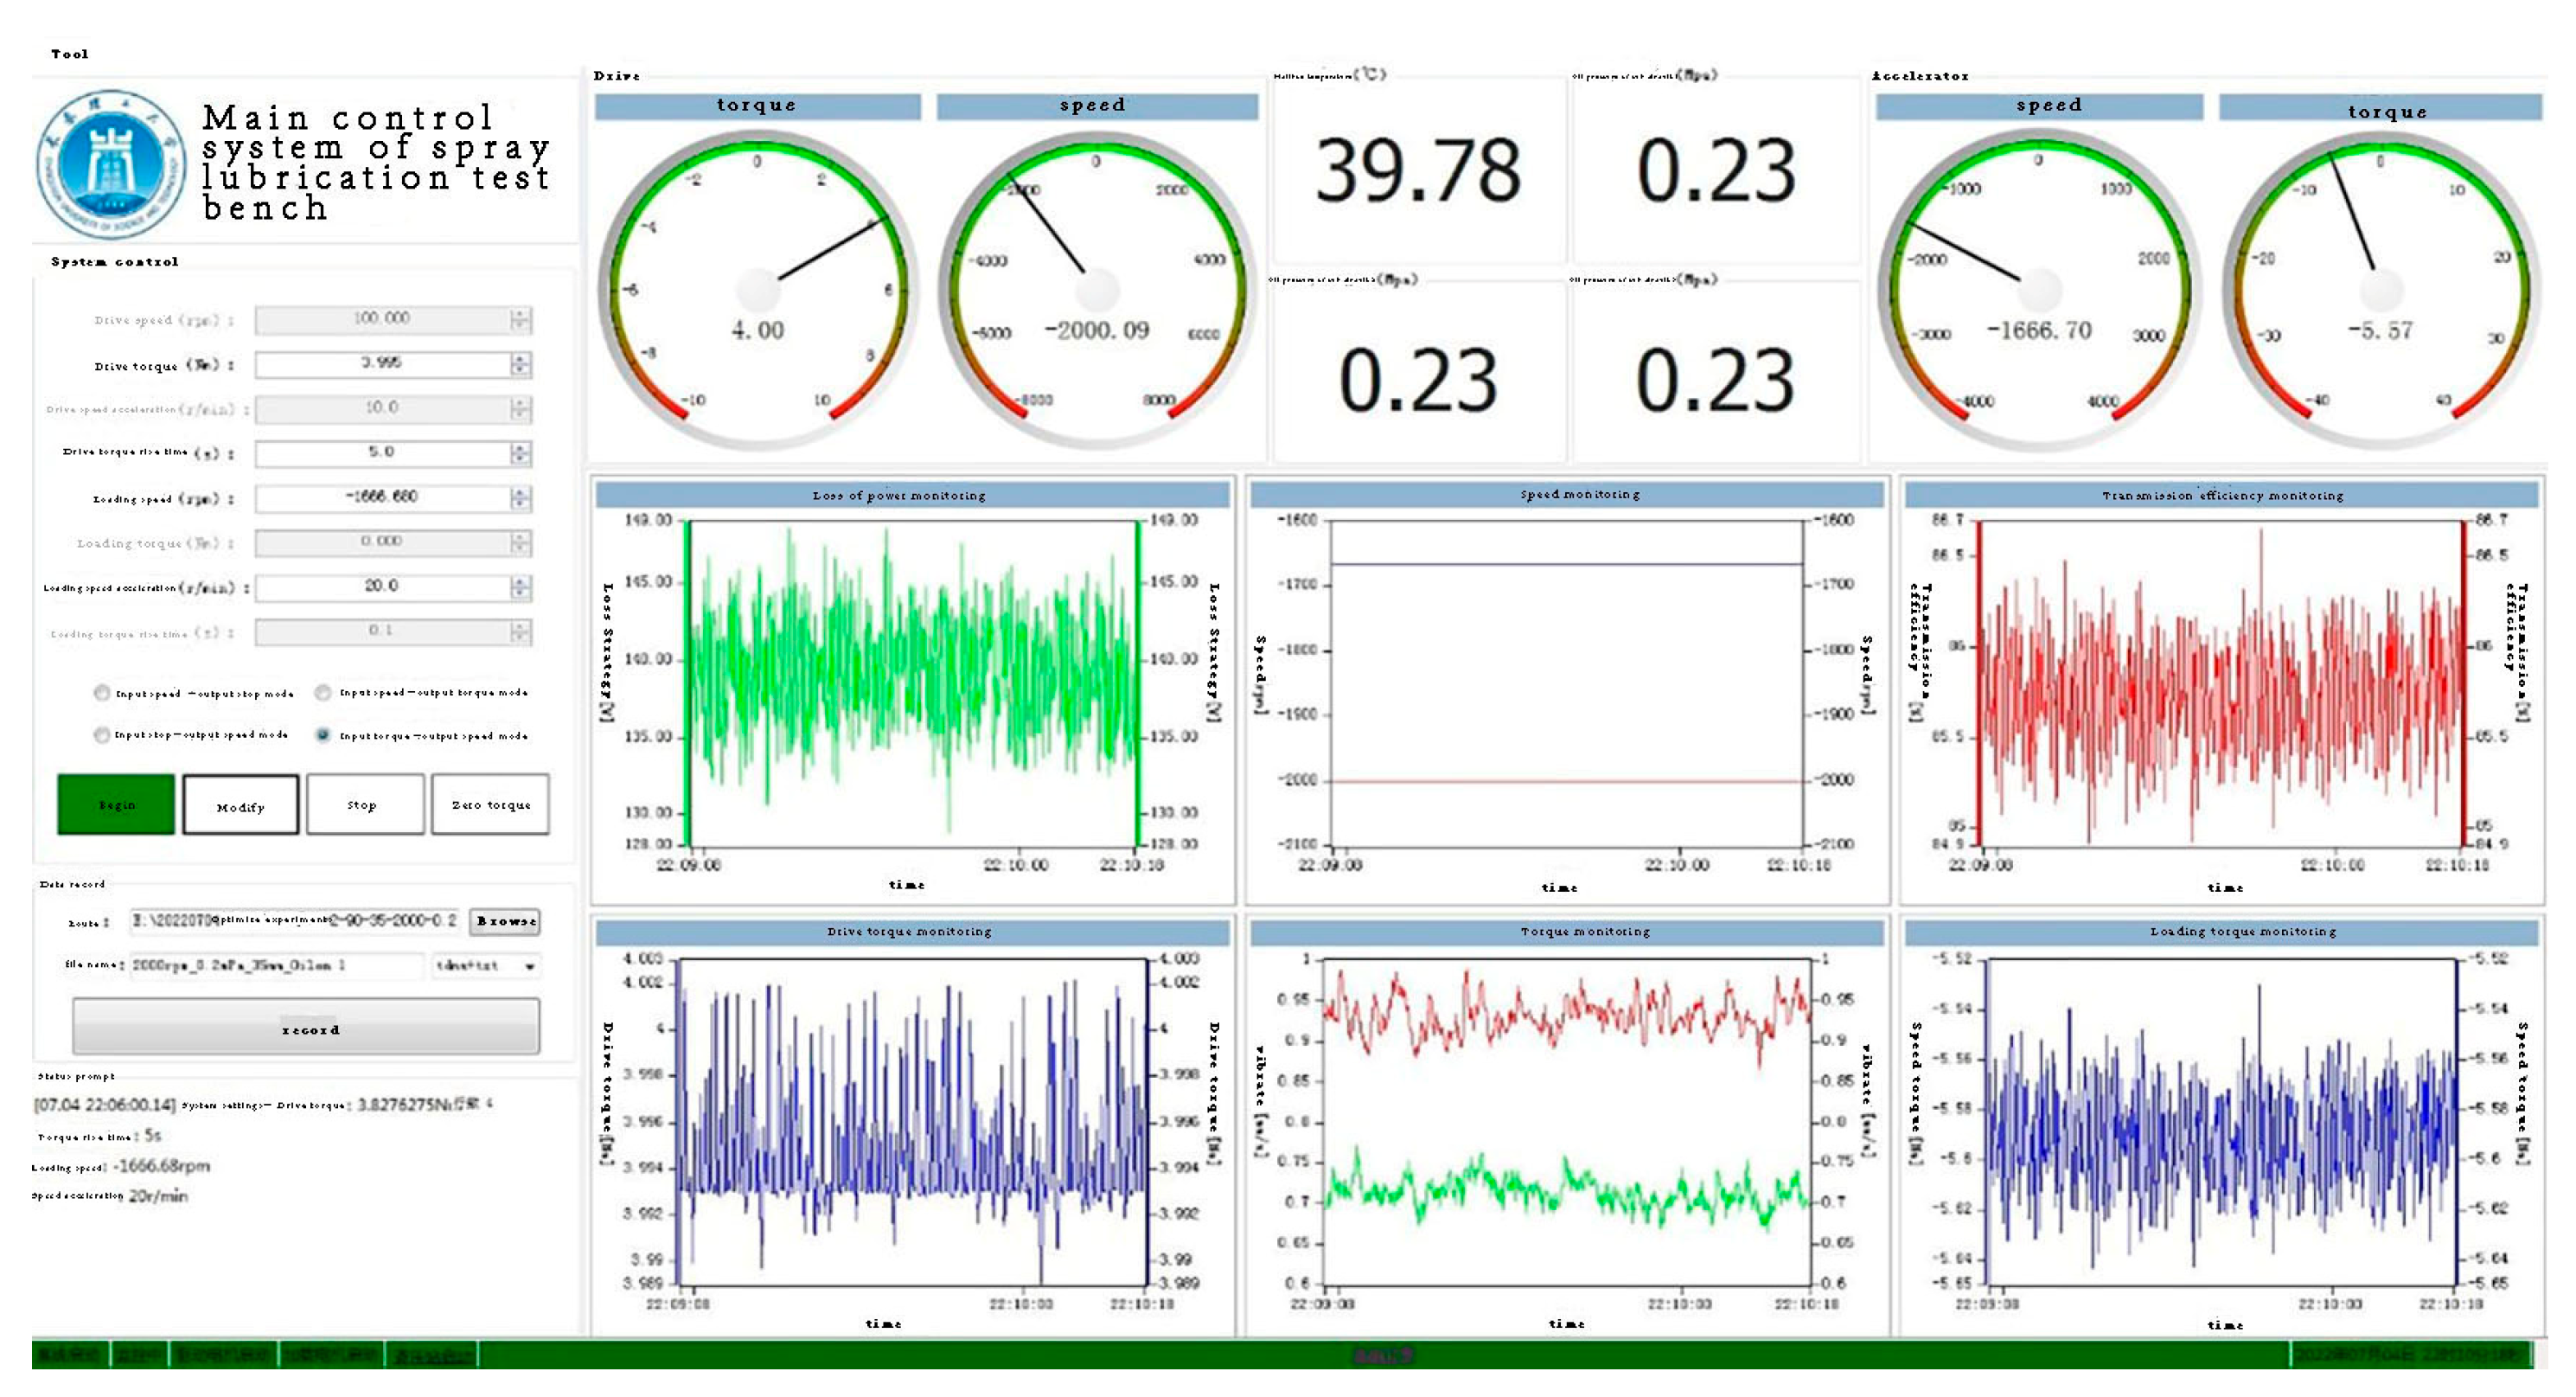
To make the experiment more general, a data acquisition system corresponding to the experiment was produced, as shown in Figure 11. The high-speed rotating gear injection lubrication software test system includes a drive system and a loading system, as well as a highly reliable frequency converter, PLC, and high-precision torque sensor, can achieve a maximum control speed of 8000 r/min. The software test system can monitor the testing process in real time. The software test system can be used to start and stop the drive motor to set the speed, turn the pressure control system on and off, set the loading torque, detect table system vibration, and obtain real-time transmission efficiency and vibration data to ensure the table’s stable operation and the reliability of the test data.
All of the information in the lubrication test can be viewed from the test system’s main page. The injection lubrication system’s control page is on the left side. You can regulate the lubrication table’s gear speed, acceleration, oil pump switch, and other parameters in real time. It can also record and save test results. The parameter page of the lubrication system is on the right side, the clock disk clearly shows the change in gear speed, and there are six small windows to record the transmission system’s lost power, speed, transmission efficiency, vibration, loading torque, and driving torque.
The purpose of this experiment was to investigate the effect of incidence distance, incidence angle, incidence diameter and rotational speed on the lost power.
(1) Before the test data started to be recorded, the equipment was installed and commissioned to change the incidence diameter by switching the nozzles. The angle of incidence was controlled by mounting on the specially made top cover, and the distance of incidence was determined by actual calculations using vernier caliper measurements. The test stand was switched on and the speed was adjusted by modifying the commands via the console.
(2) After (1) the installation and commissioning were completed, the hydraulic station was in working condition and was to be worked smoothly. The control system was monitored to achieve a dynamic balance of loading torque, speed, transmission efficiency and vibration. At this point, the data under this condition started to be recorded; each set of data was recorded 10 times to take the average value.
(3) On the basis of (2), the hydraulic station was switched off and the gears were idle. In order to exclude power losses caused by the gearbox bearings, gear meshing and other components during the test, the gears were covered with an oil film on the surface when the hydraulic station was working in front of them. When in steady state, the data were recorded at this moment. Each set of data was recorded five times to take the average value.
(4) In (2), the data measured in the oil-injection state were subtracted from (3) the data measured in the no-oil-injection state; the result was the power loss of the gear due to injection lubrication.
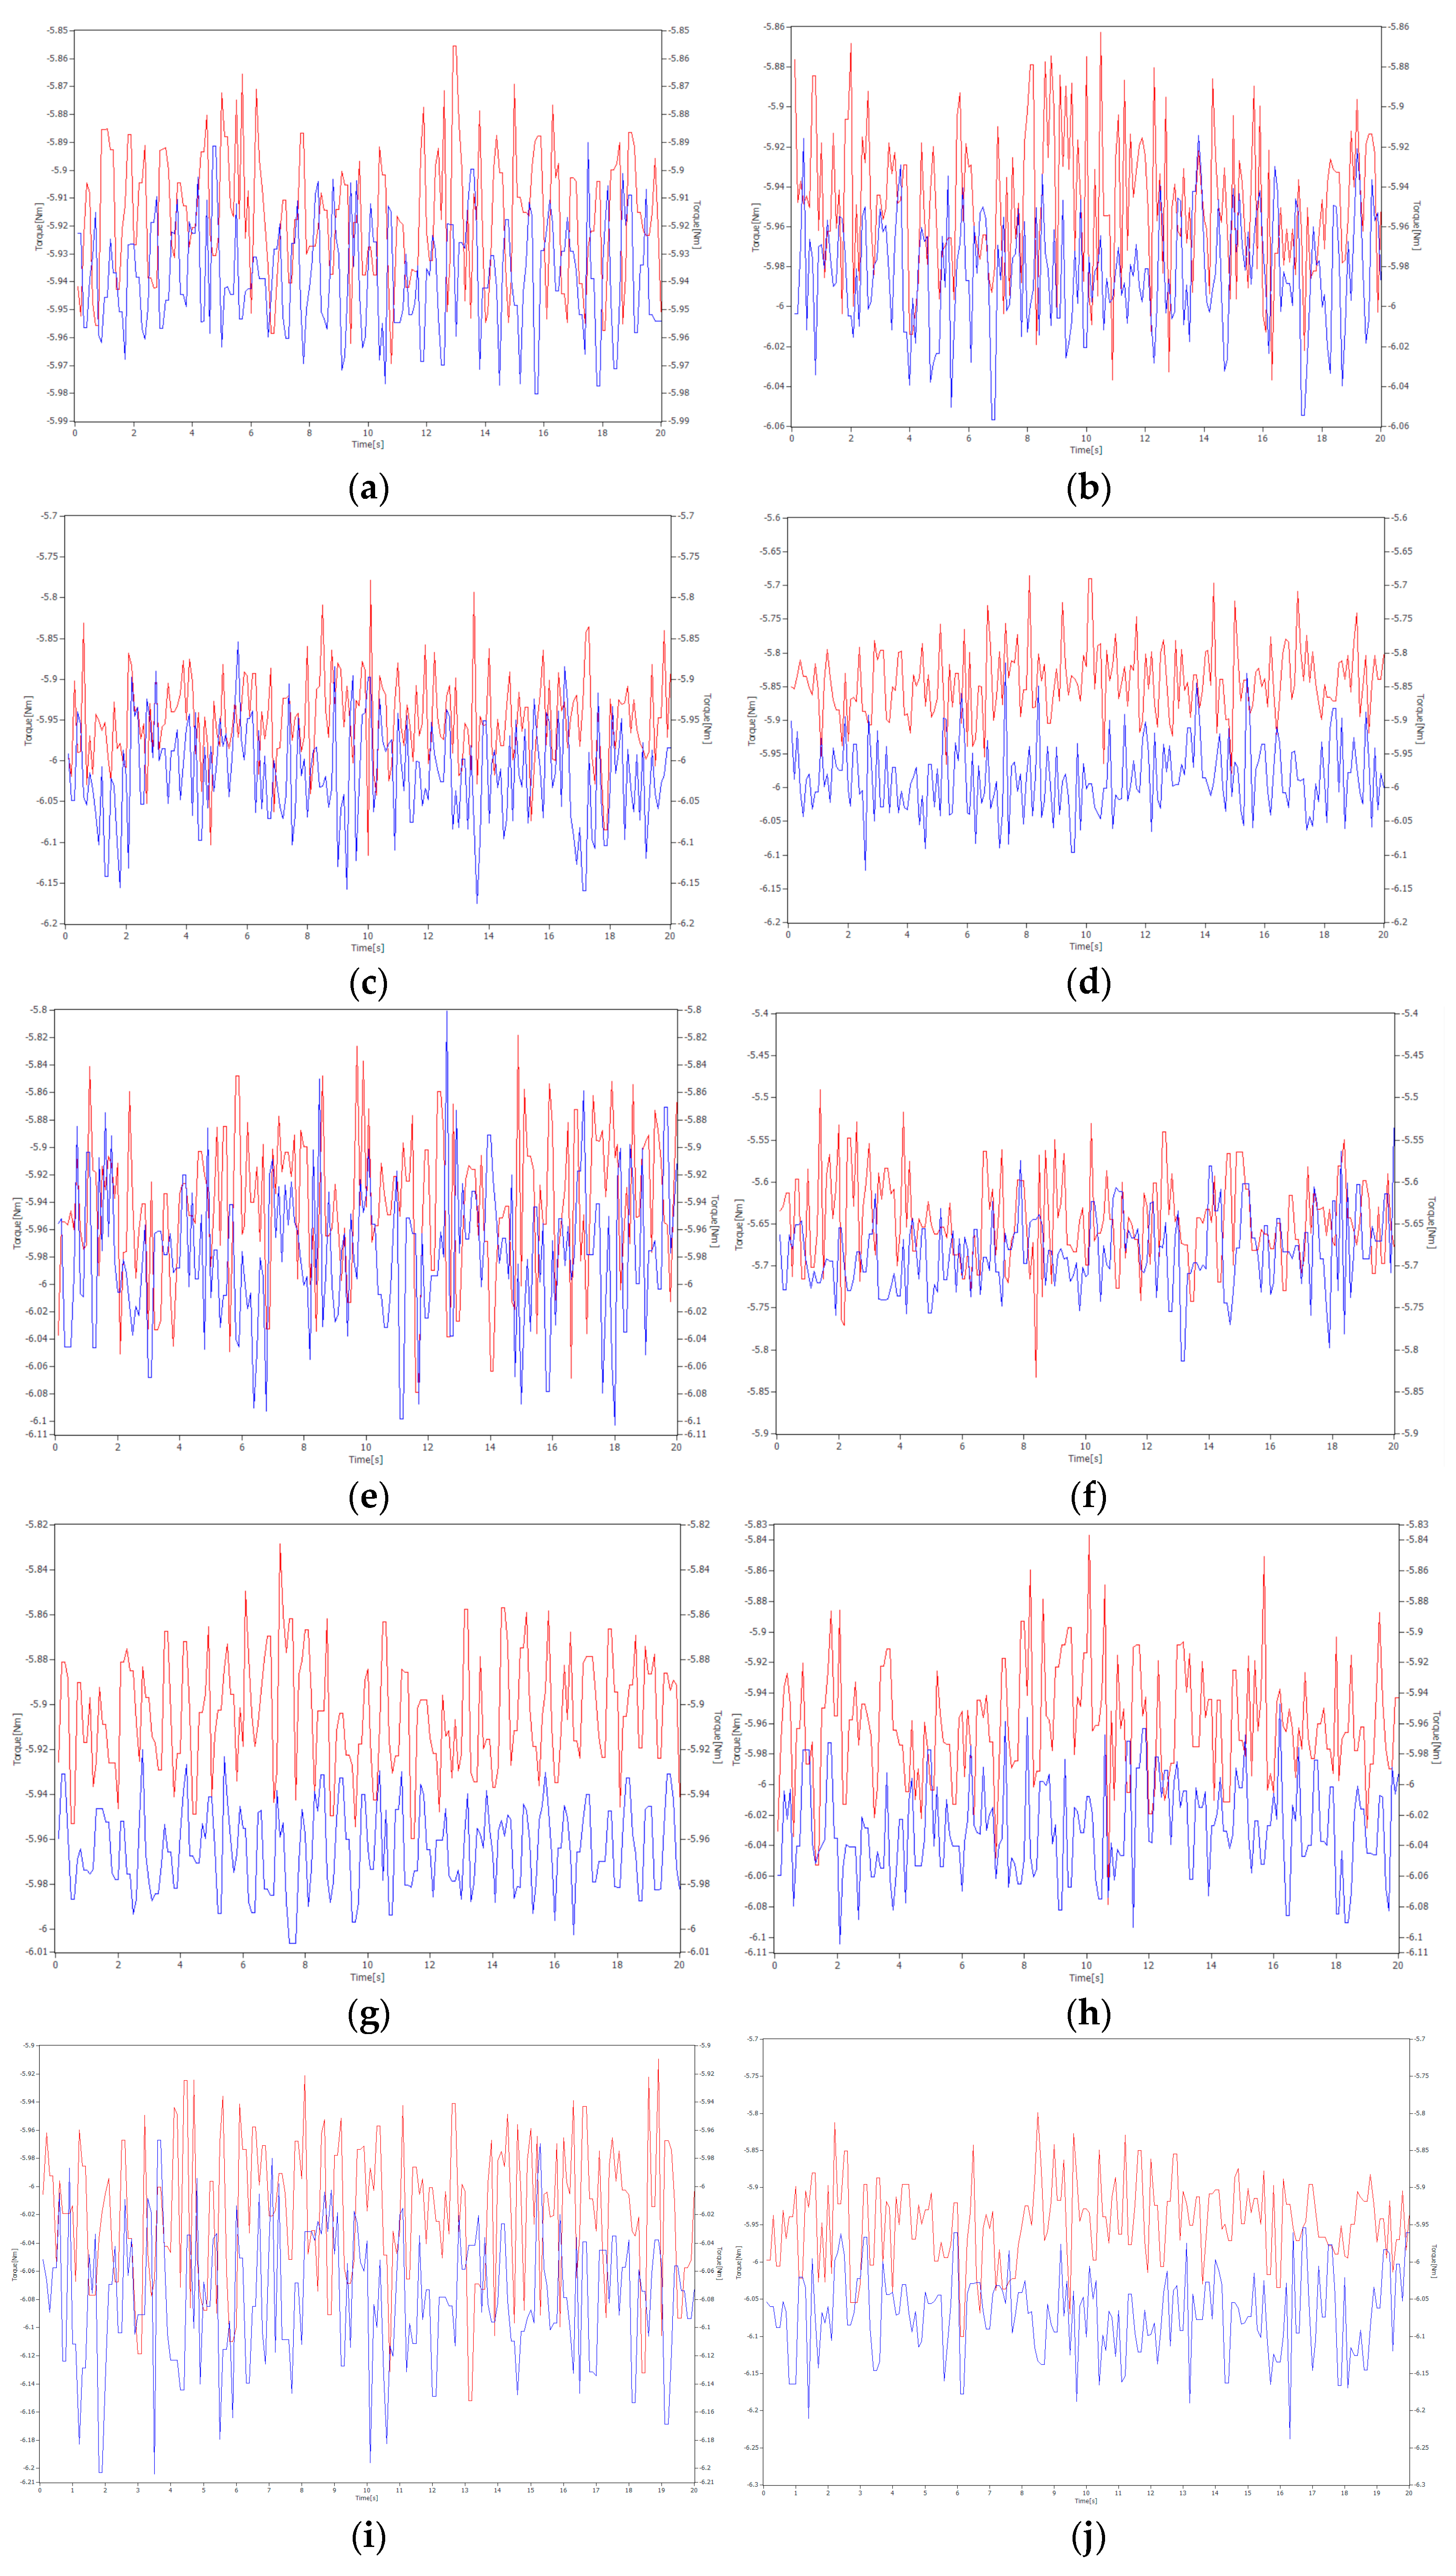
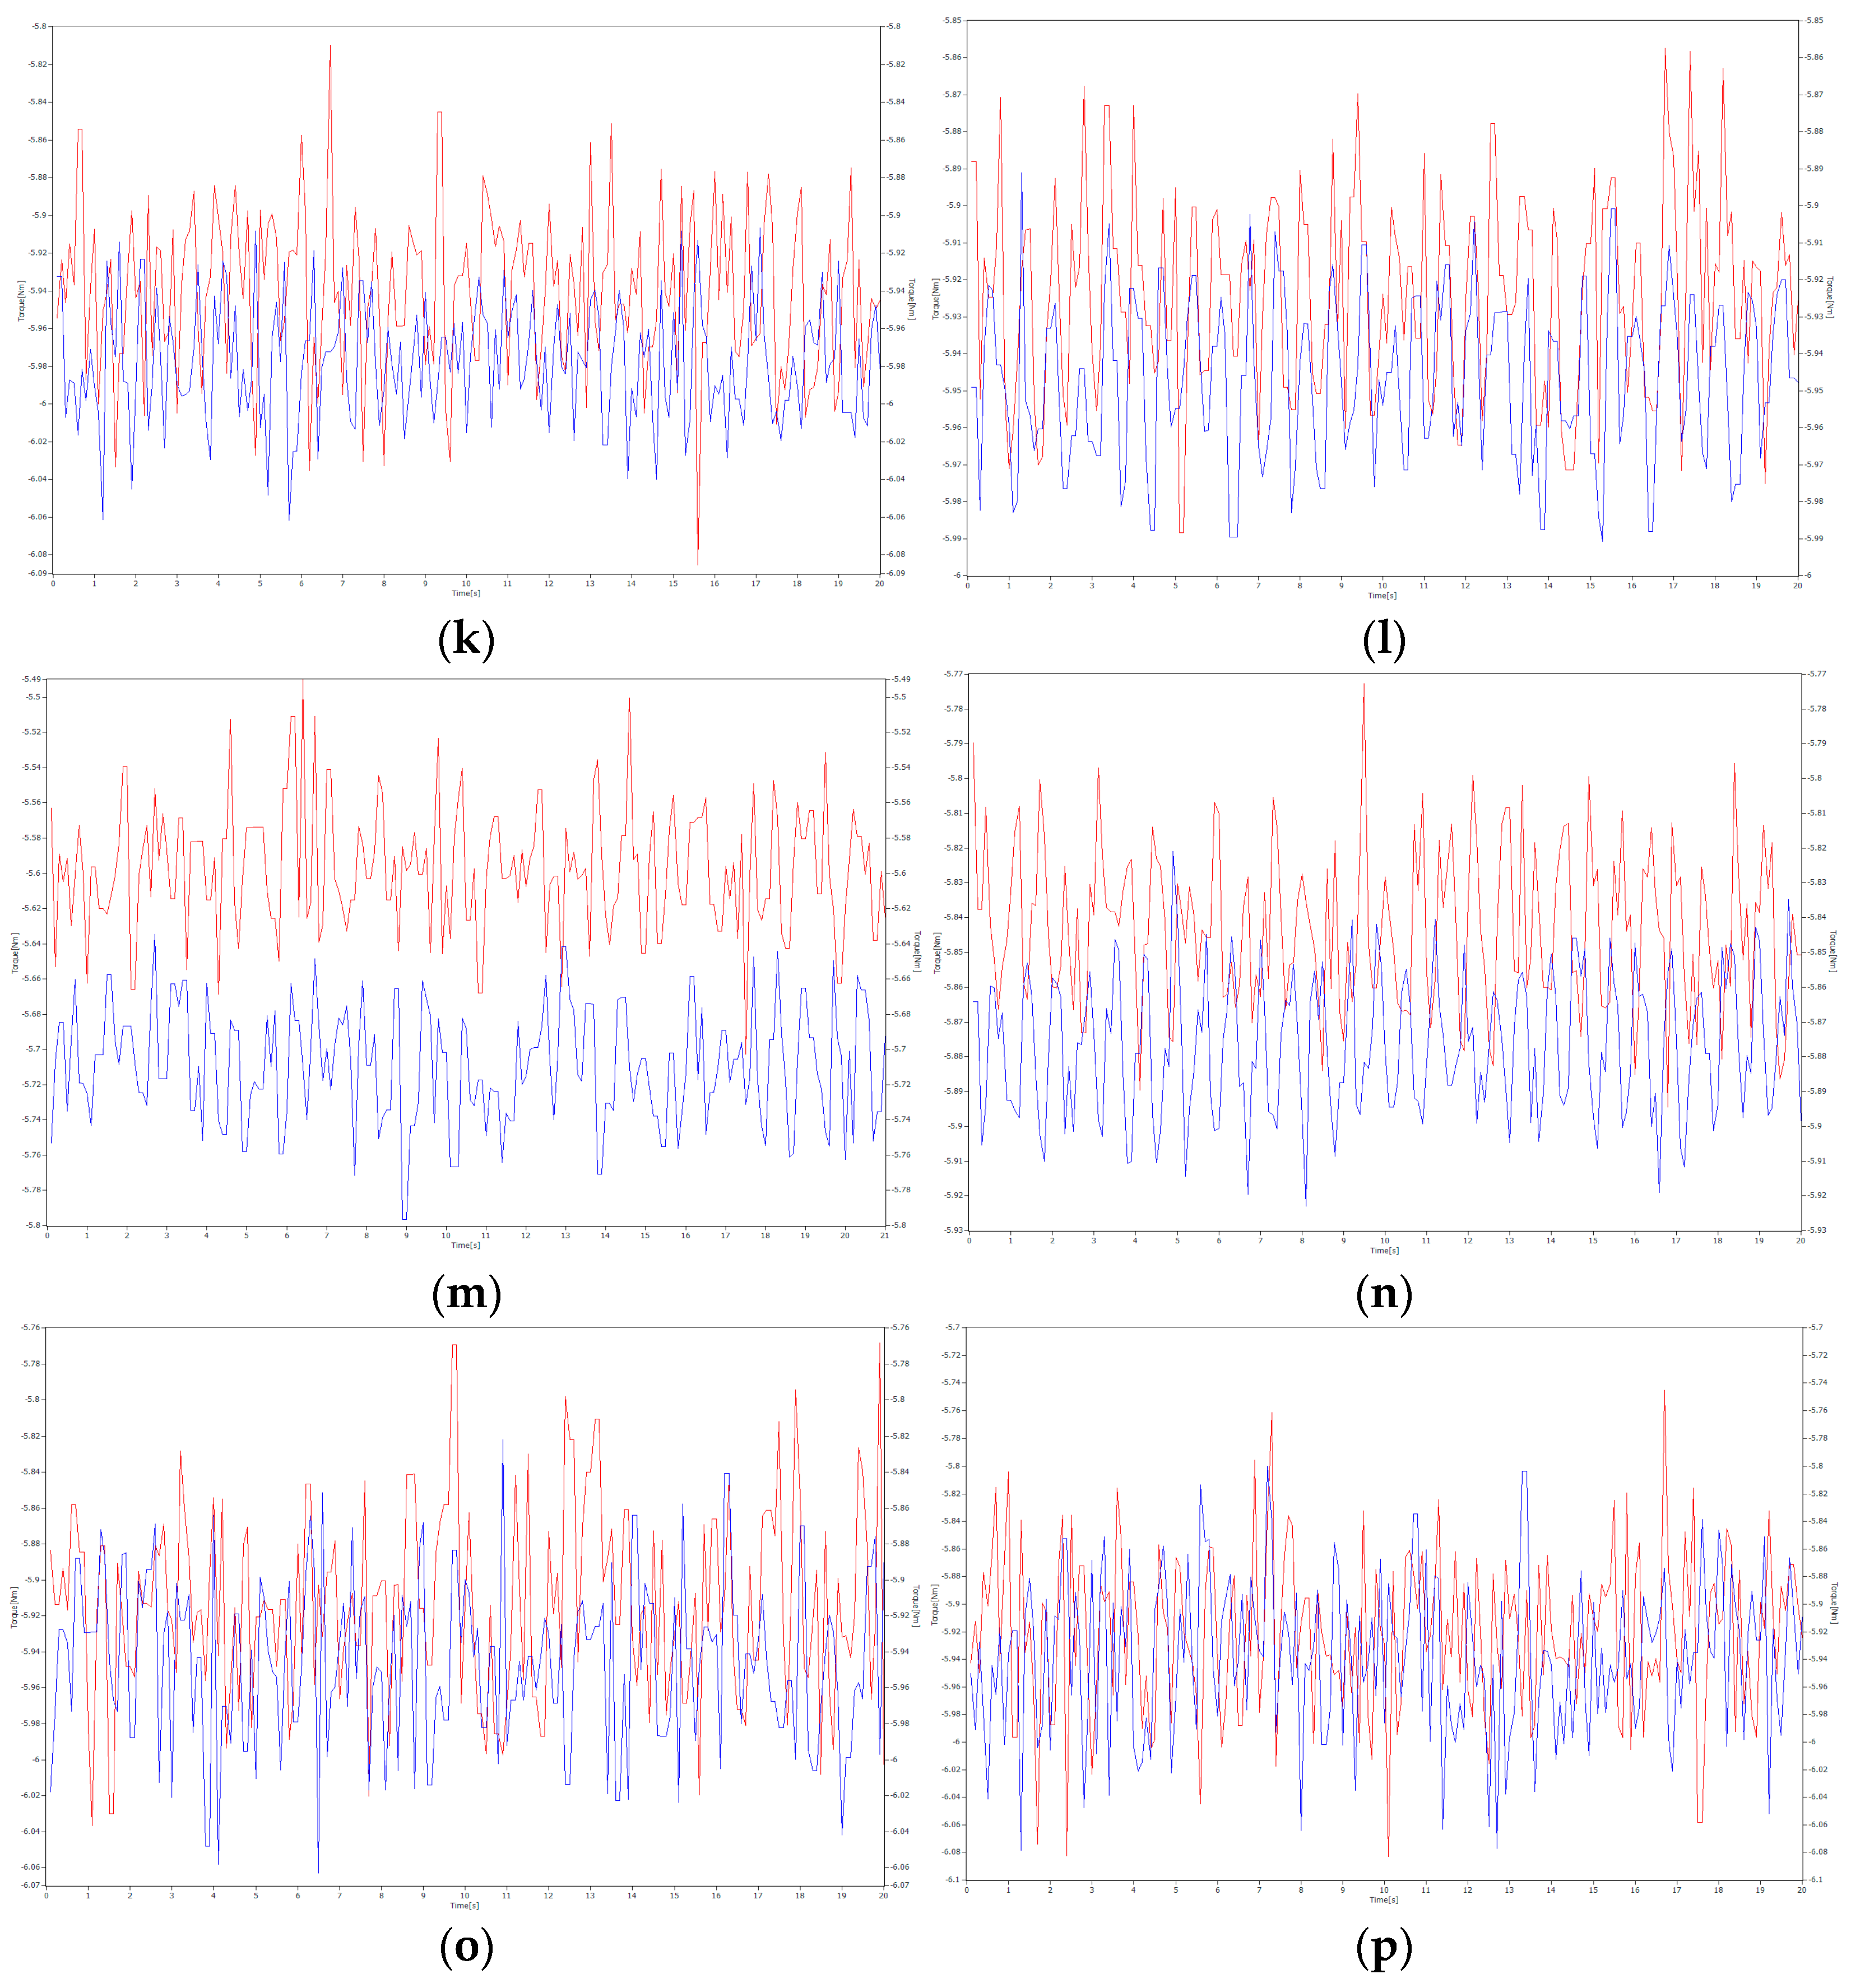
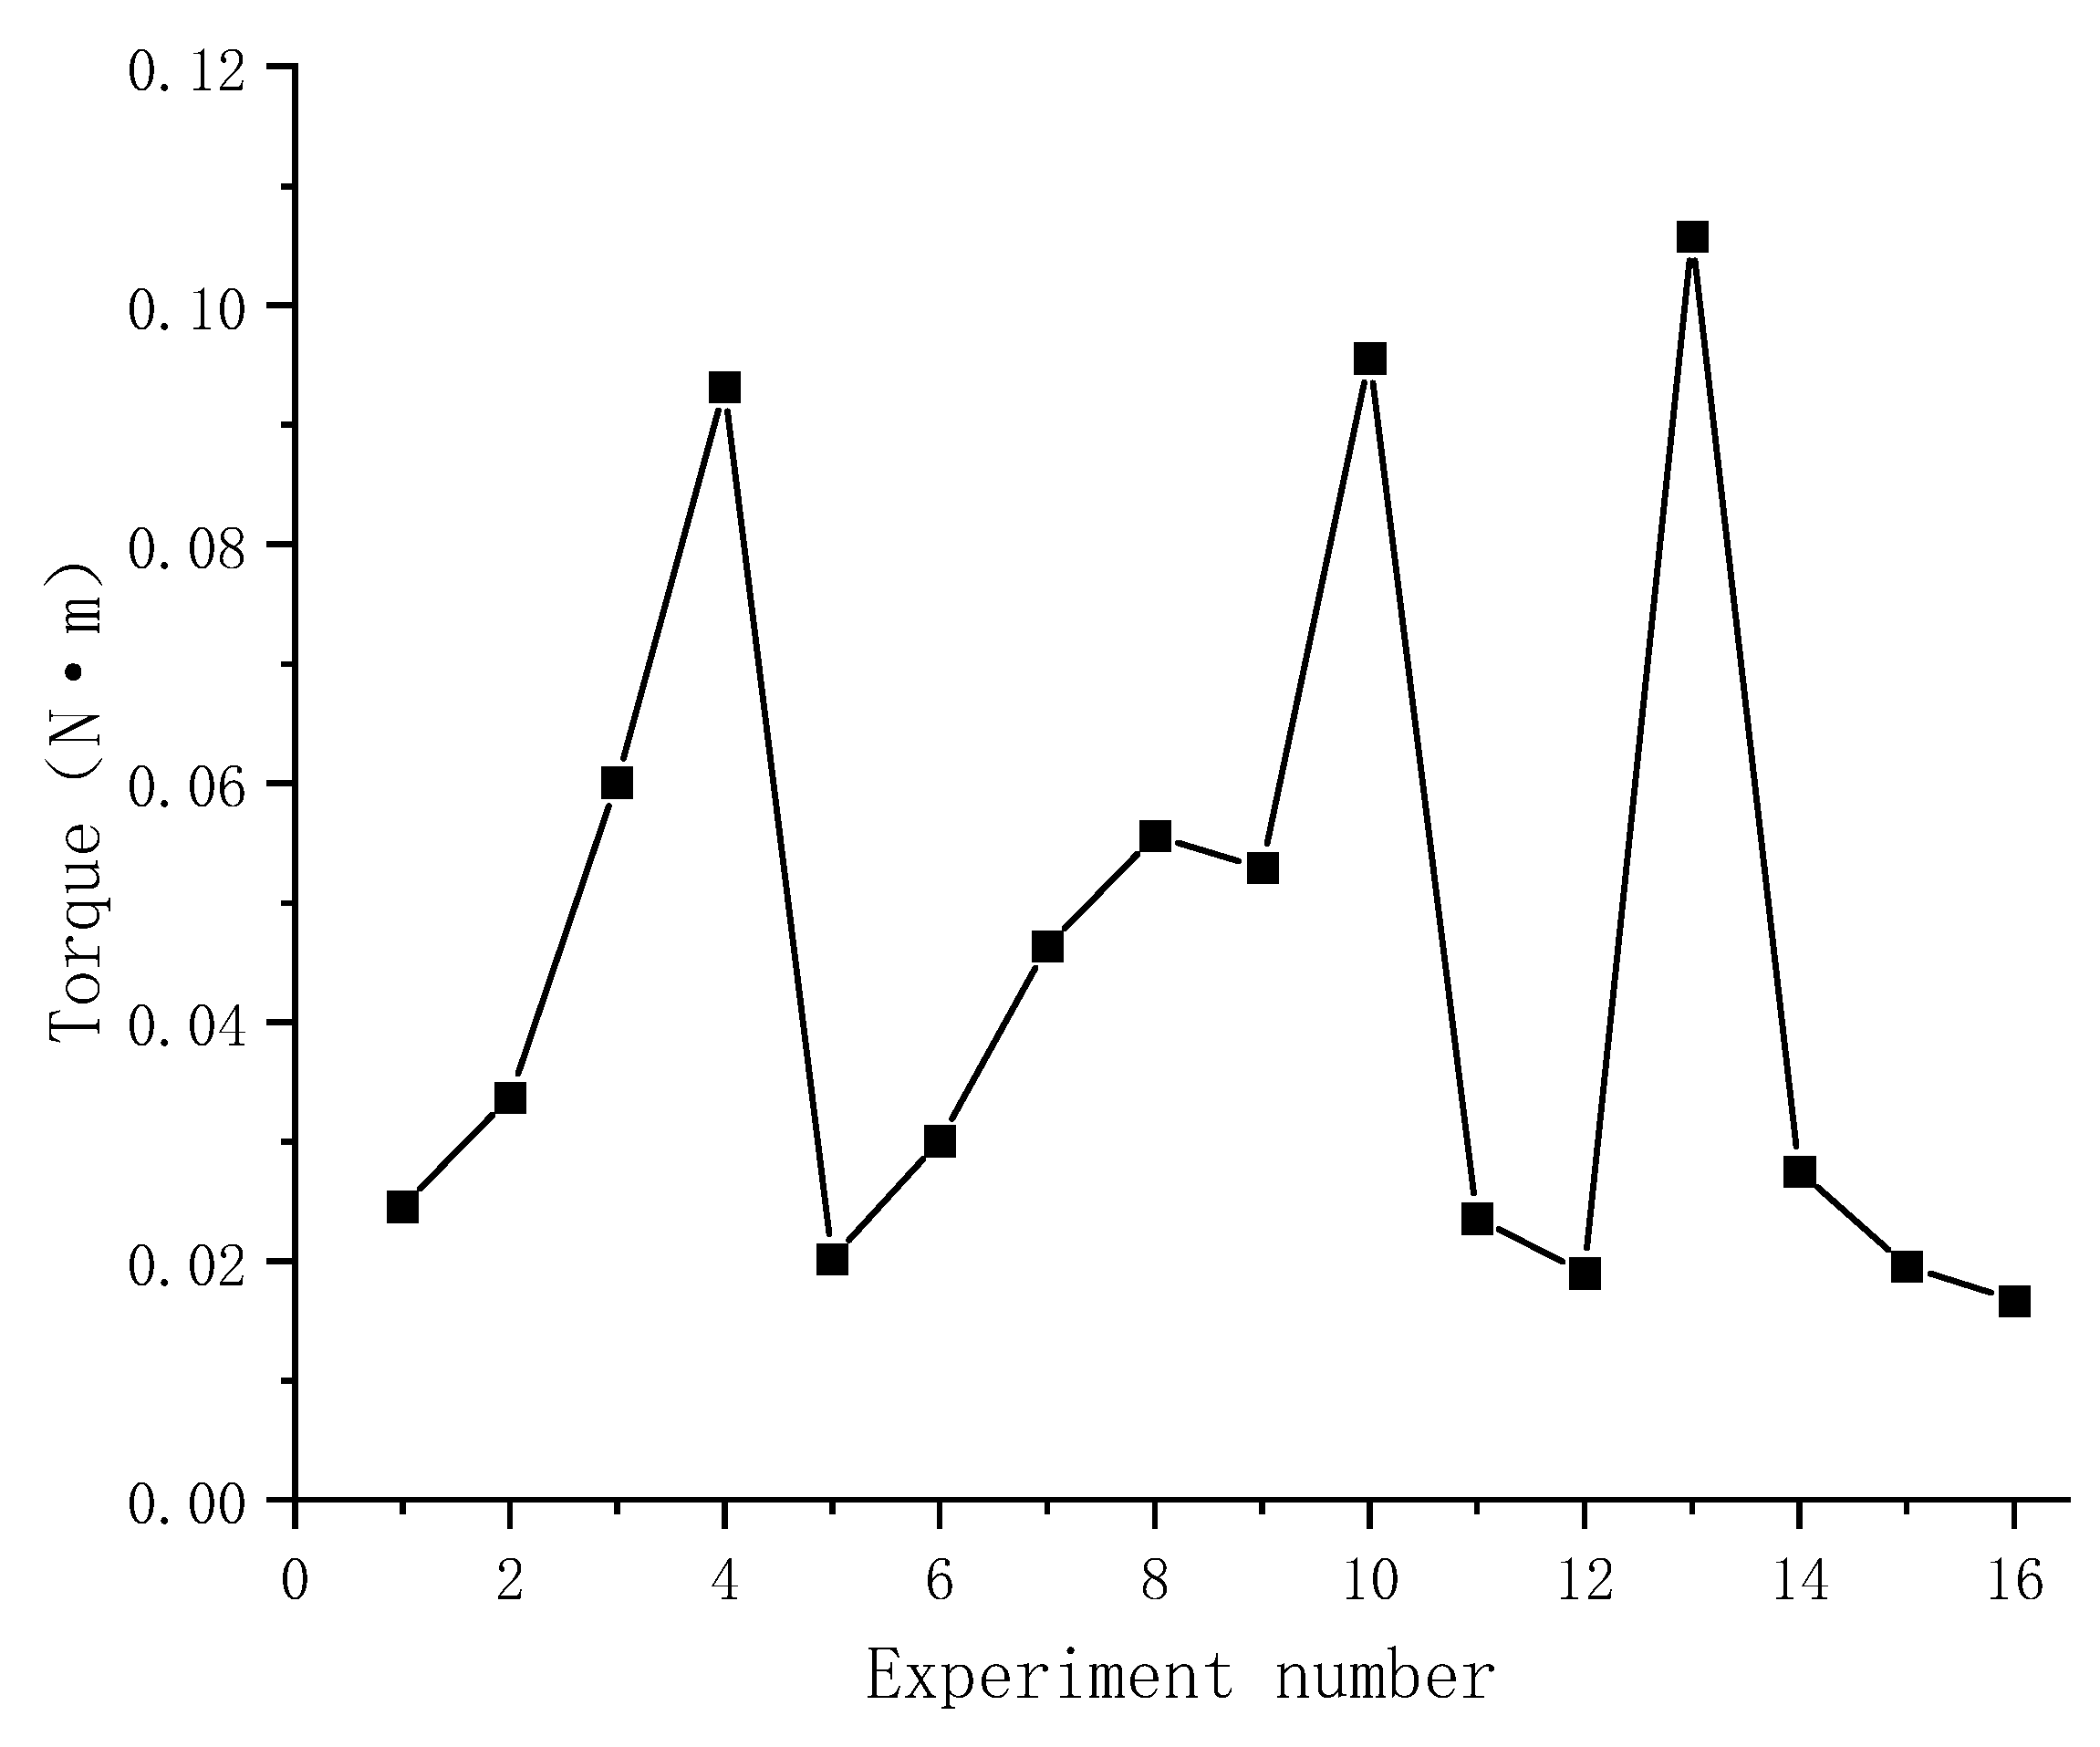
By recording and sampling the data for 20 s, 16 sets of raw data were collated as follows:
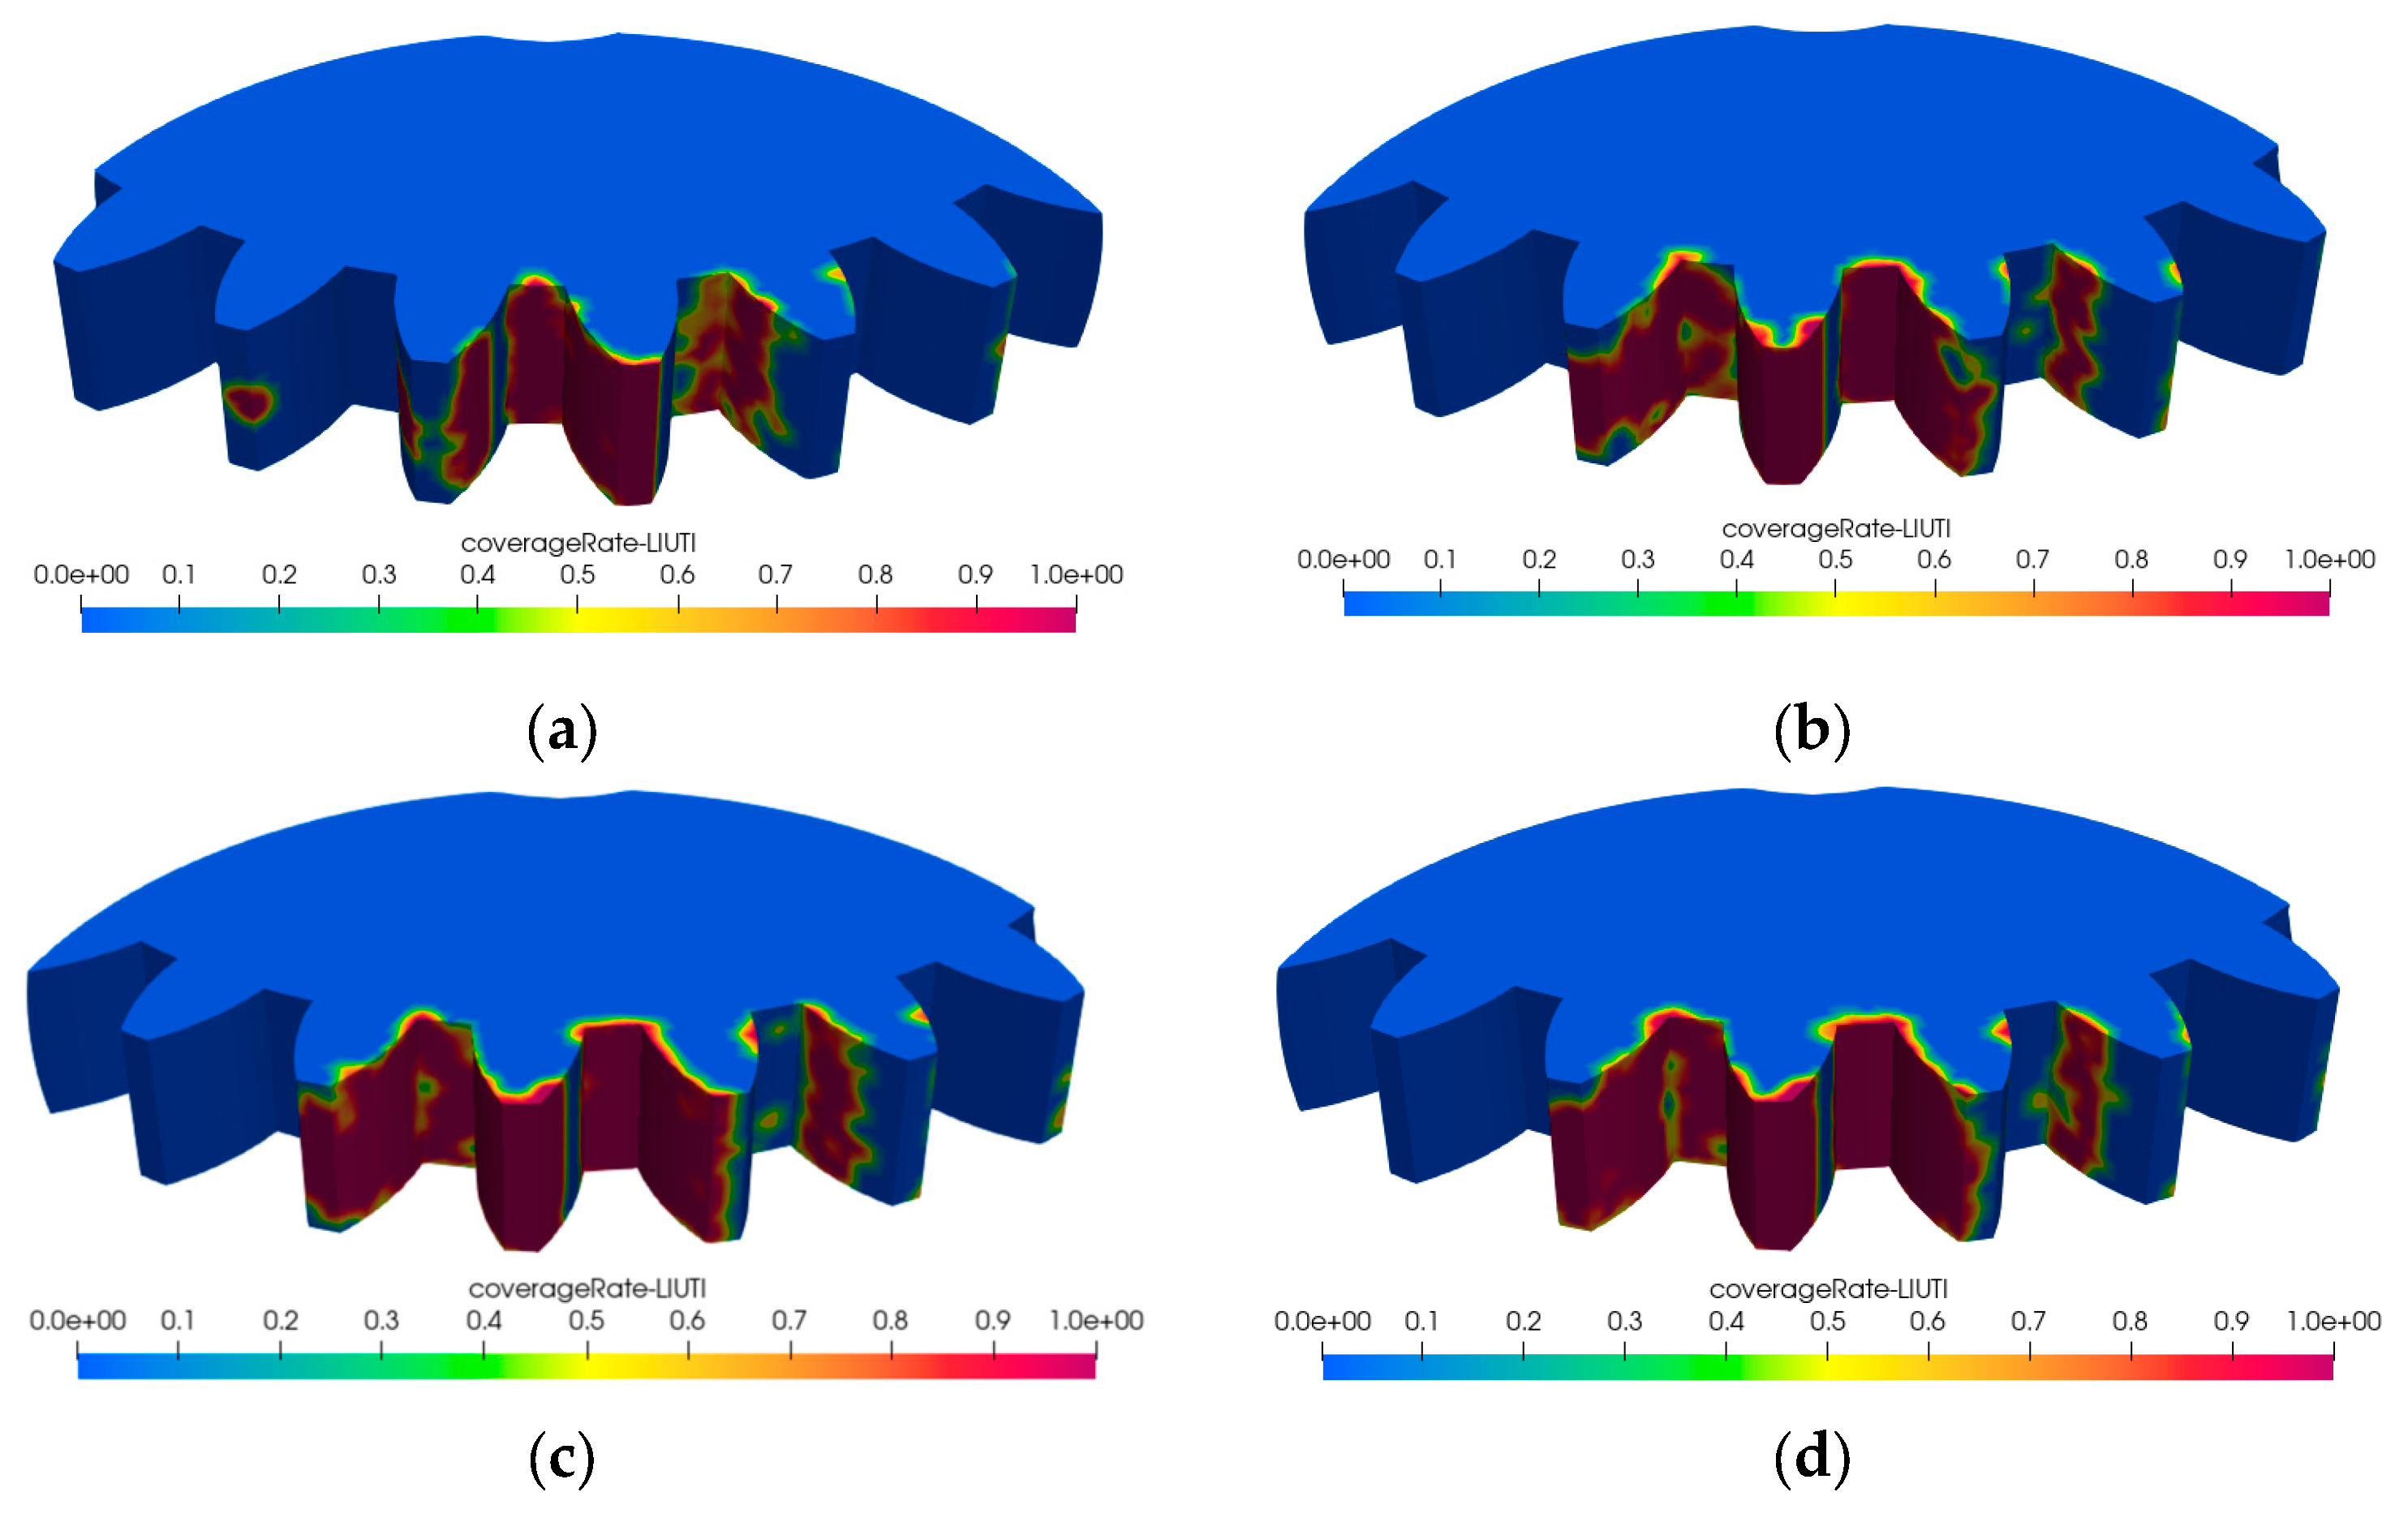
Figure 12 shows the original data from 16 sets of gear injection lubrication orthogonal tests. To facilitate the observation of patterns, the torque statistics for the injection lubrication test were collated and are presented in Table 2.
To more clearly observe the variation in torque with different parameters, Figure 13 depicts the torque variation curve for the injection lubrication examination, which is plotted according to Table 2.

4.1. Analysis of Extreme Differences

The orthogonal analysis of variance table presented in 
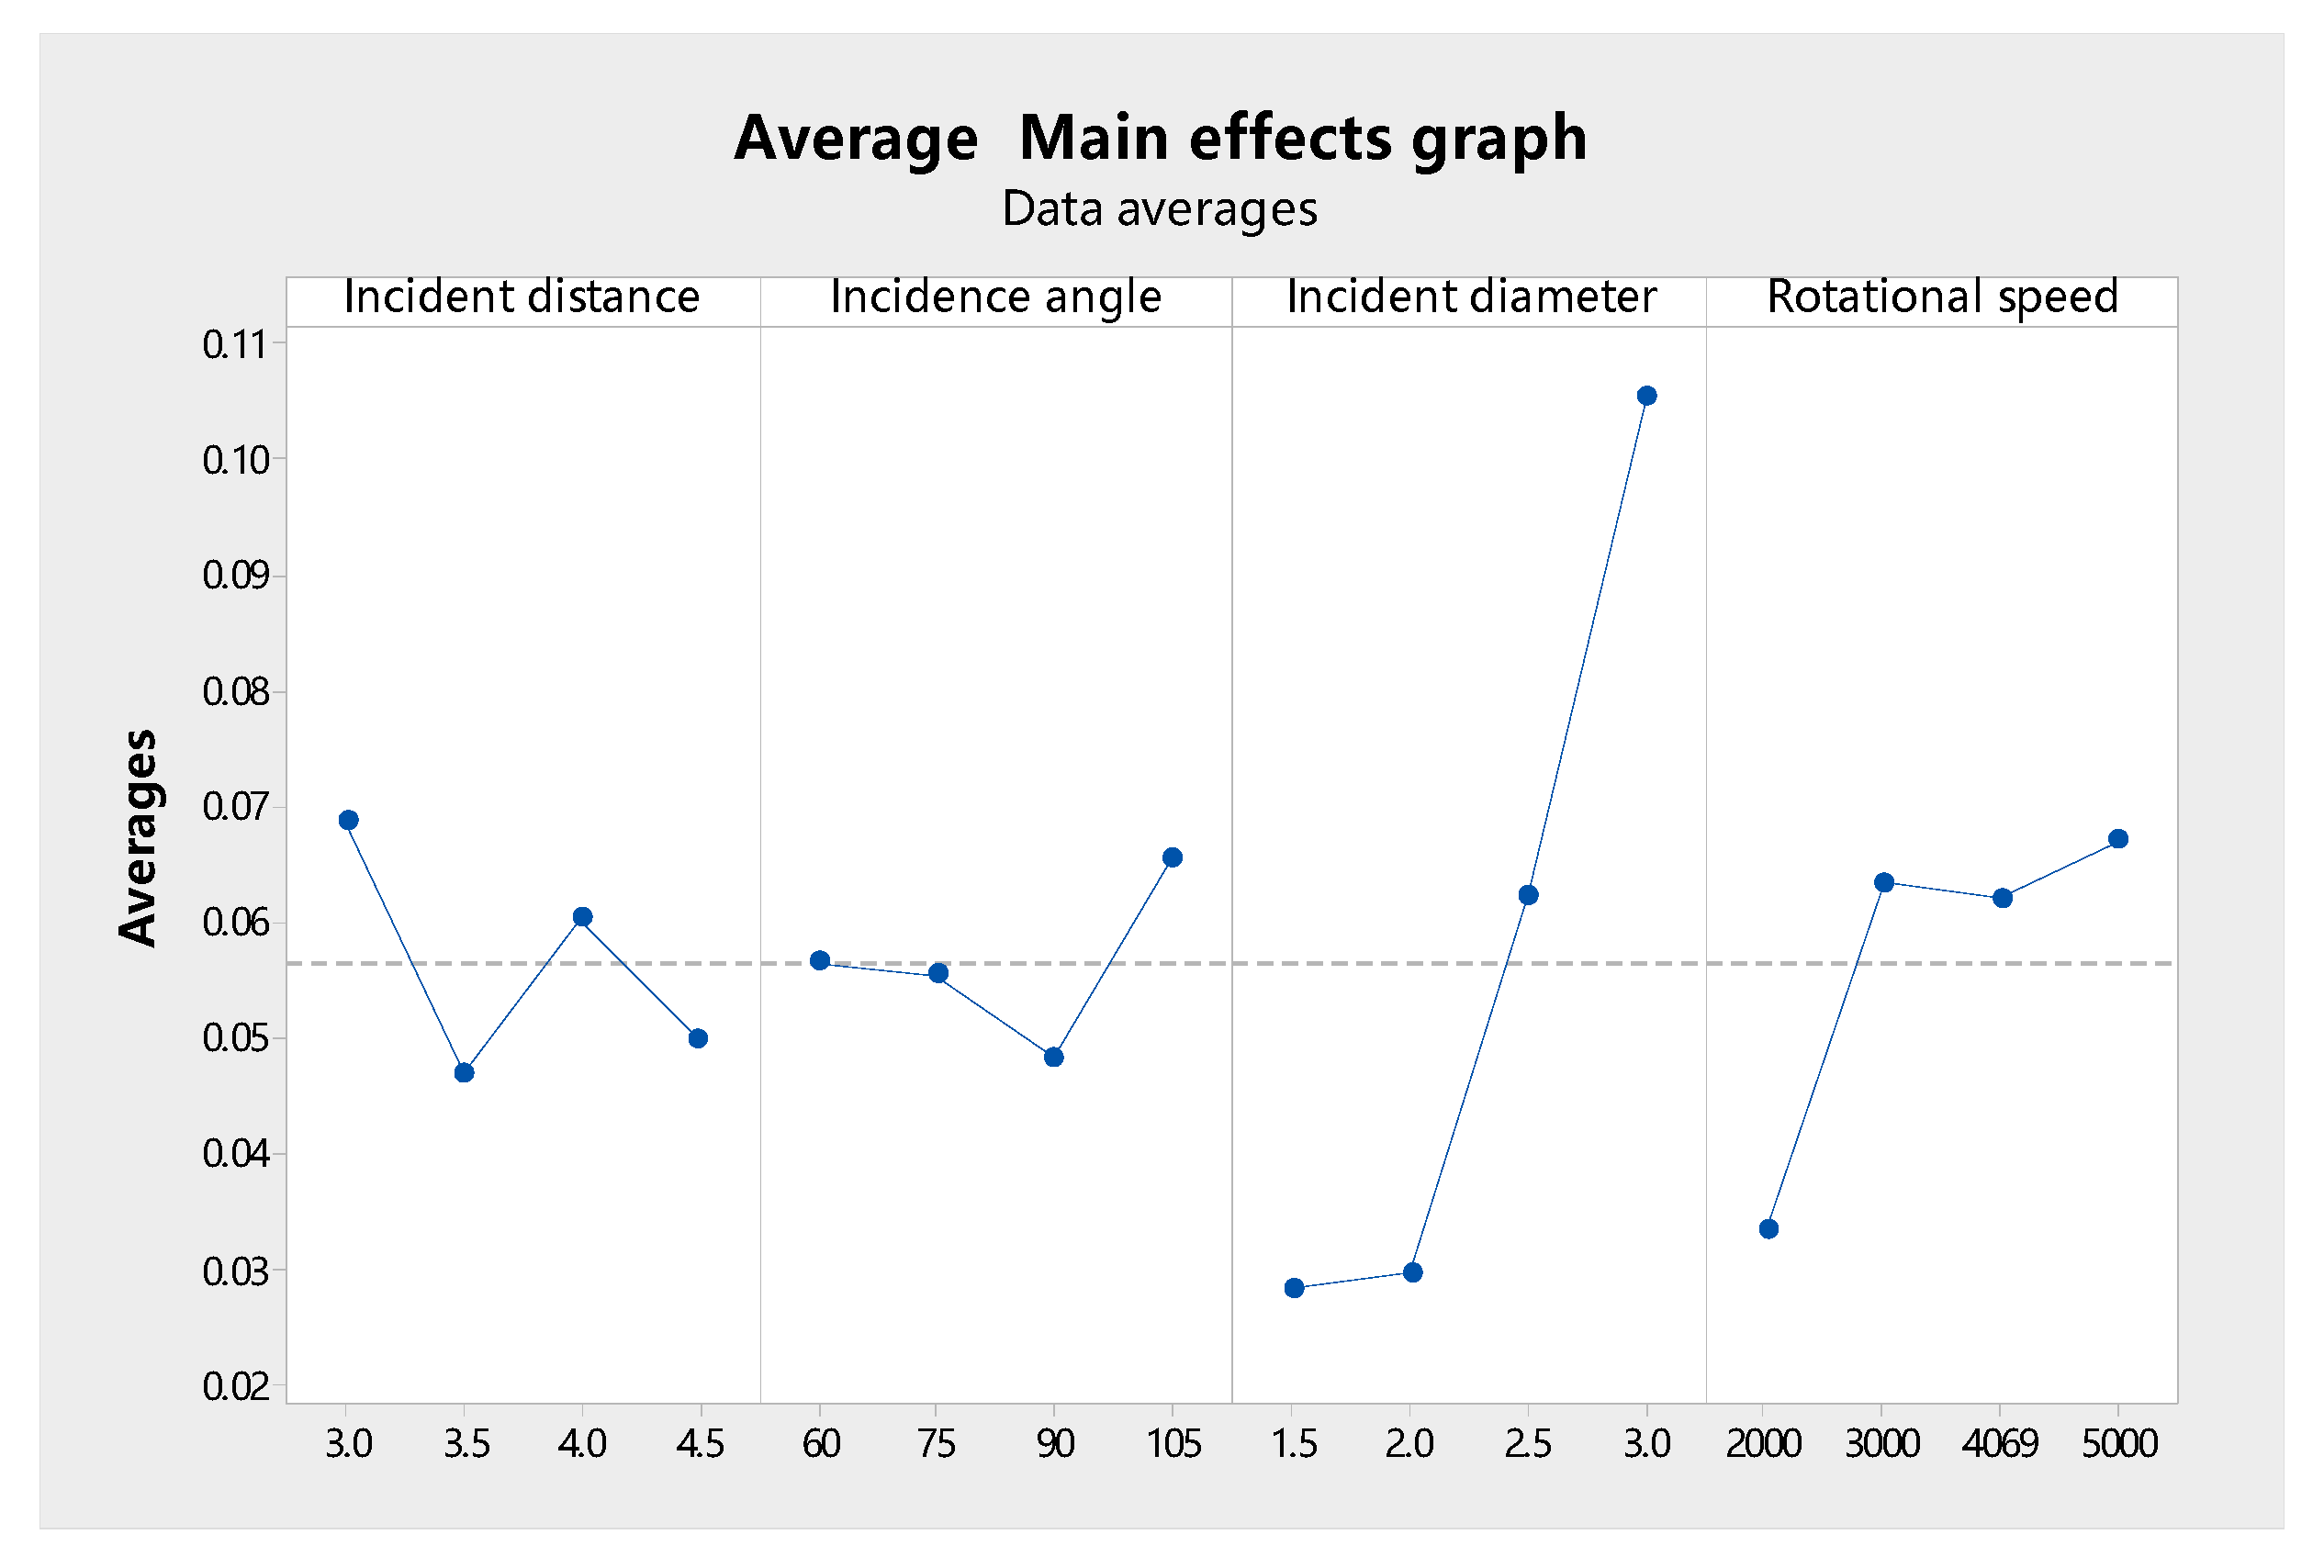
Table 3 was created by summarizing and calculating according to the designed orthogonal test table in order to achieve the scientifically ideal combination of parameters. The influencing factors among the parameters can be clearly seen in the analysis table, while the variance table can be used to create the mean main effect diagram, and the variation law of each factor can be clearly seen in the main effect diagram.
In order to analyze the influence of different parameters on injection lubrication, the 16 sets of experimental data need to be calculated and compared, and the significant characteristics and influence of each factor can be derived. In Table 3, K j shows the average of test results from the same level in the corresponding column; the larger the K j the stronger the torque at that level. For injection diameters of 1.5 mm, 2 mm, 2.5 mm, and 3 mm, the corresponding K j 
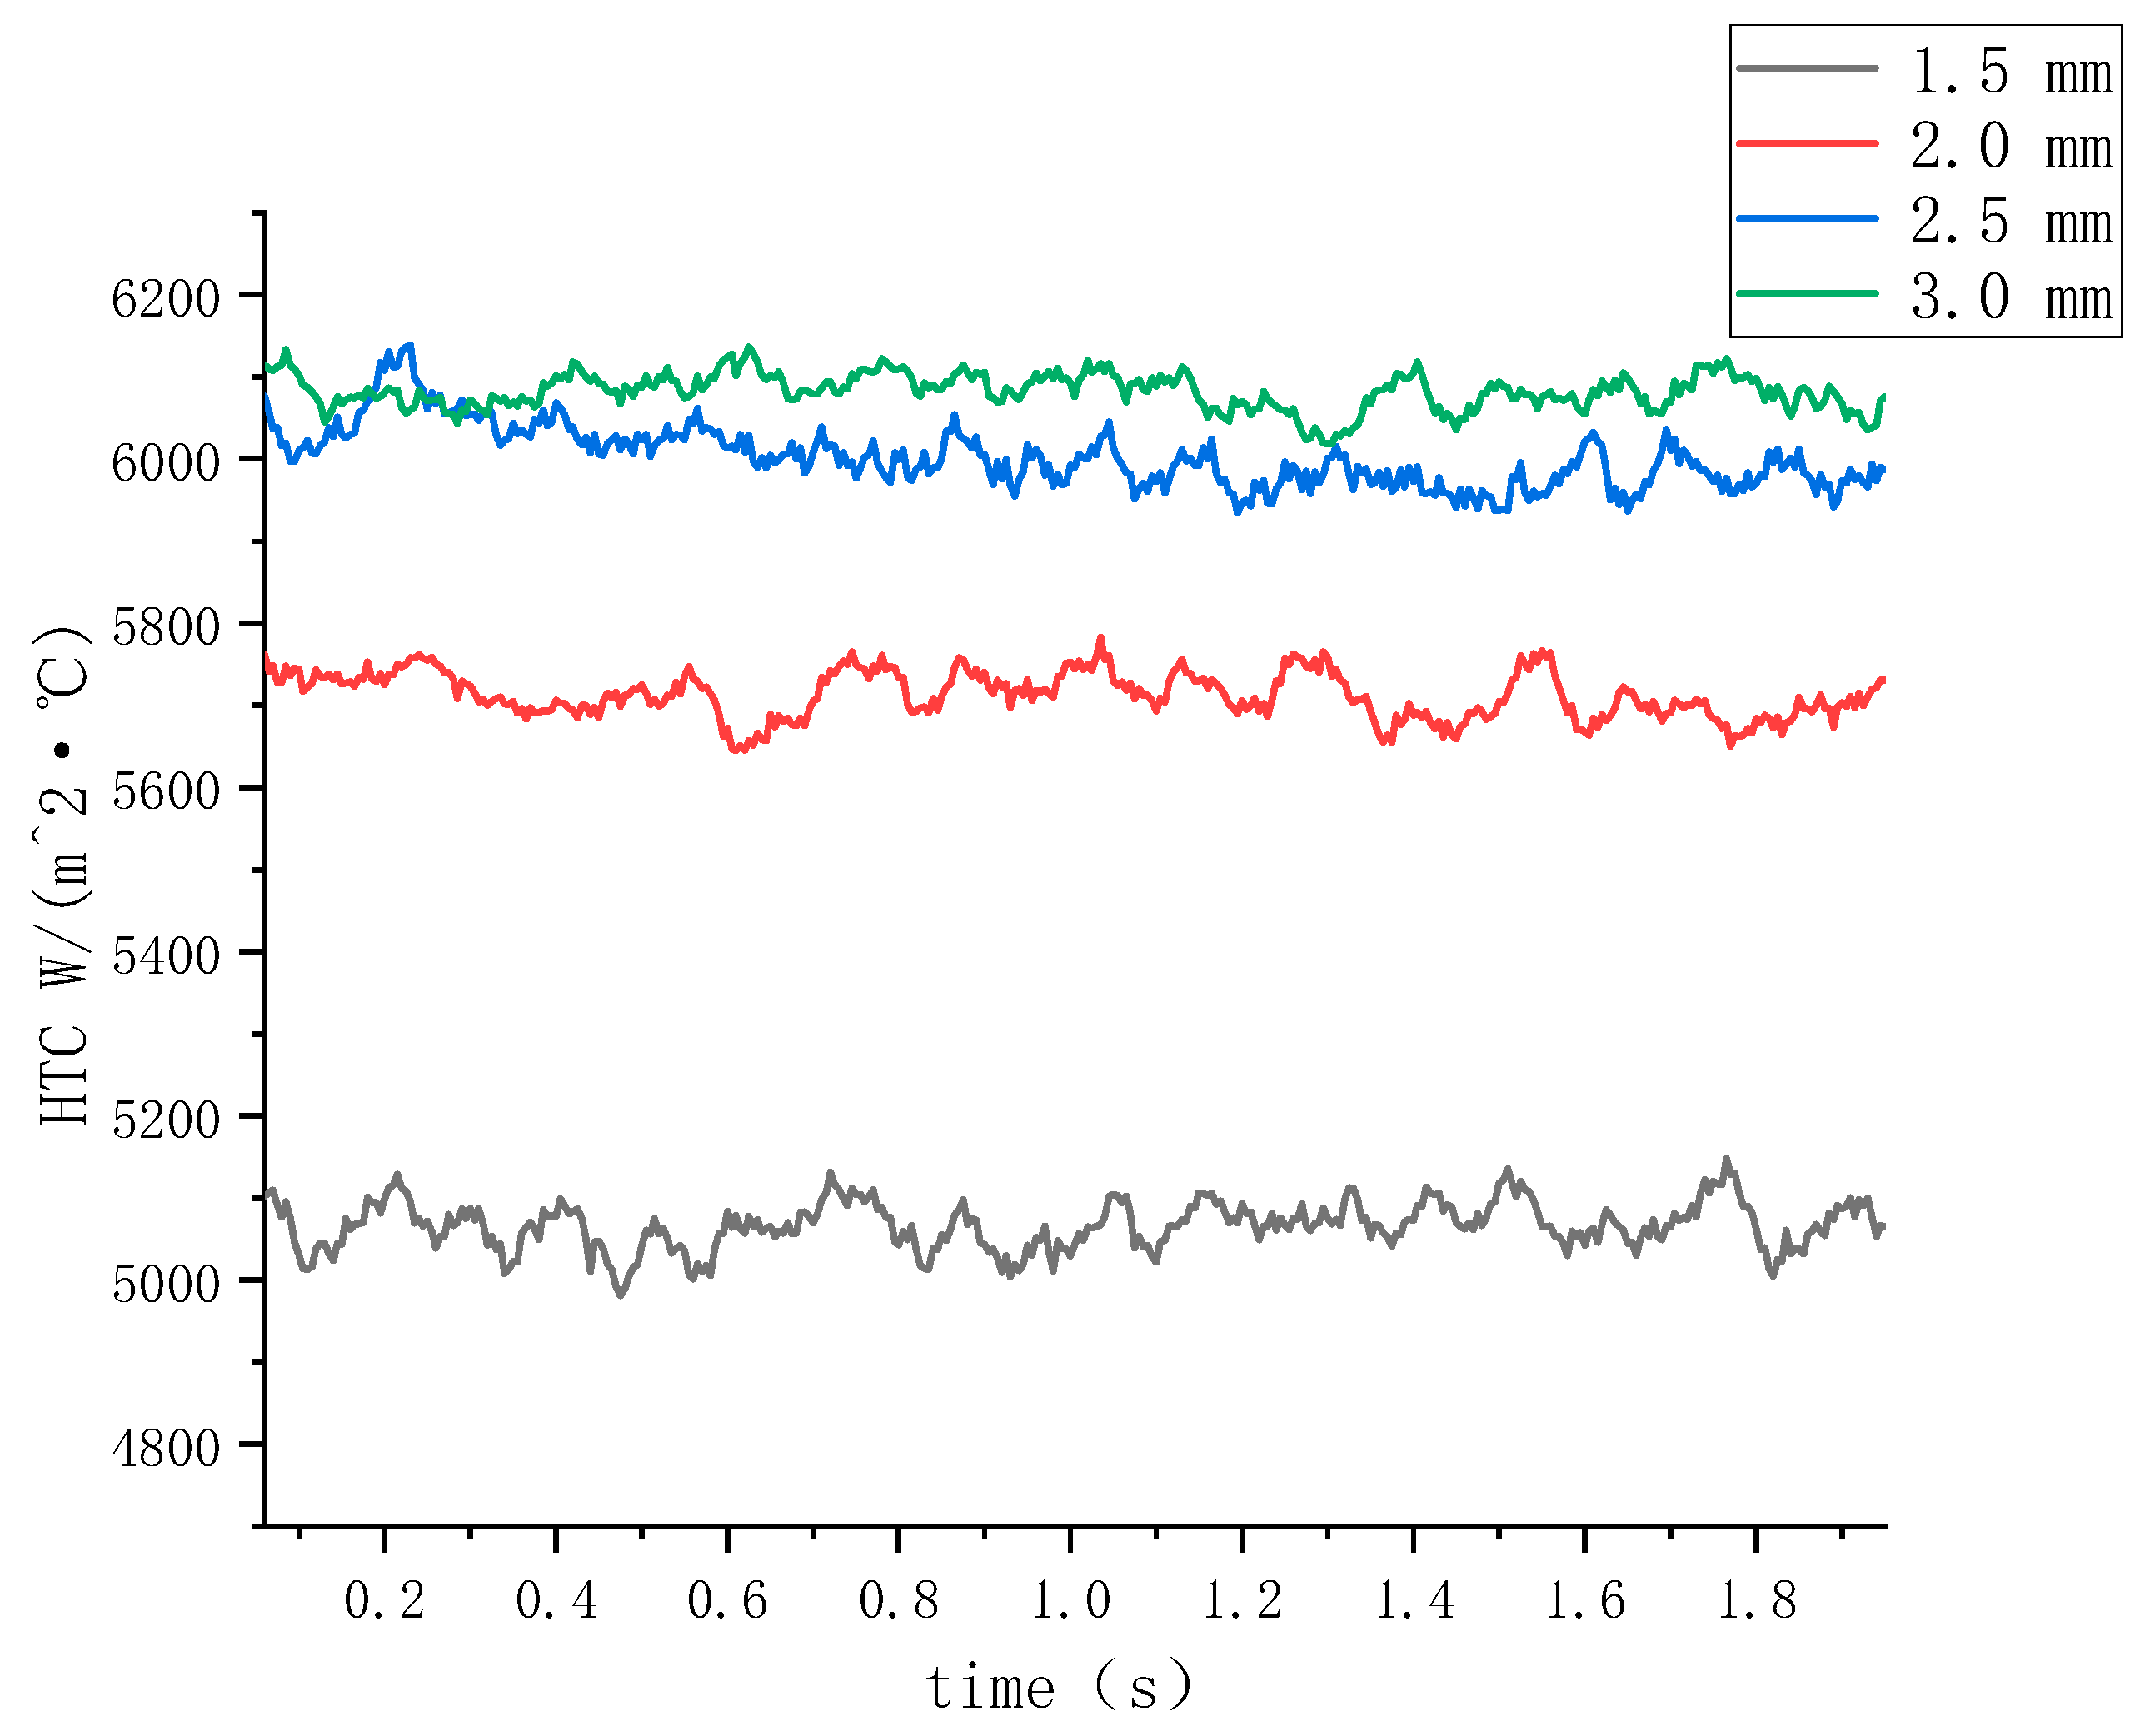
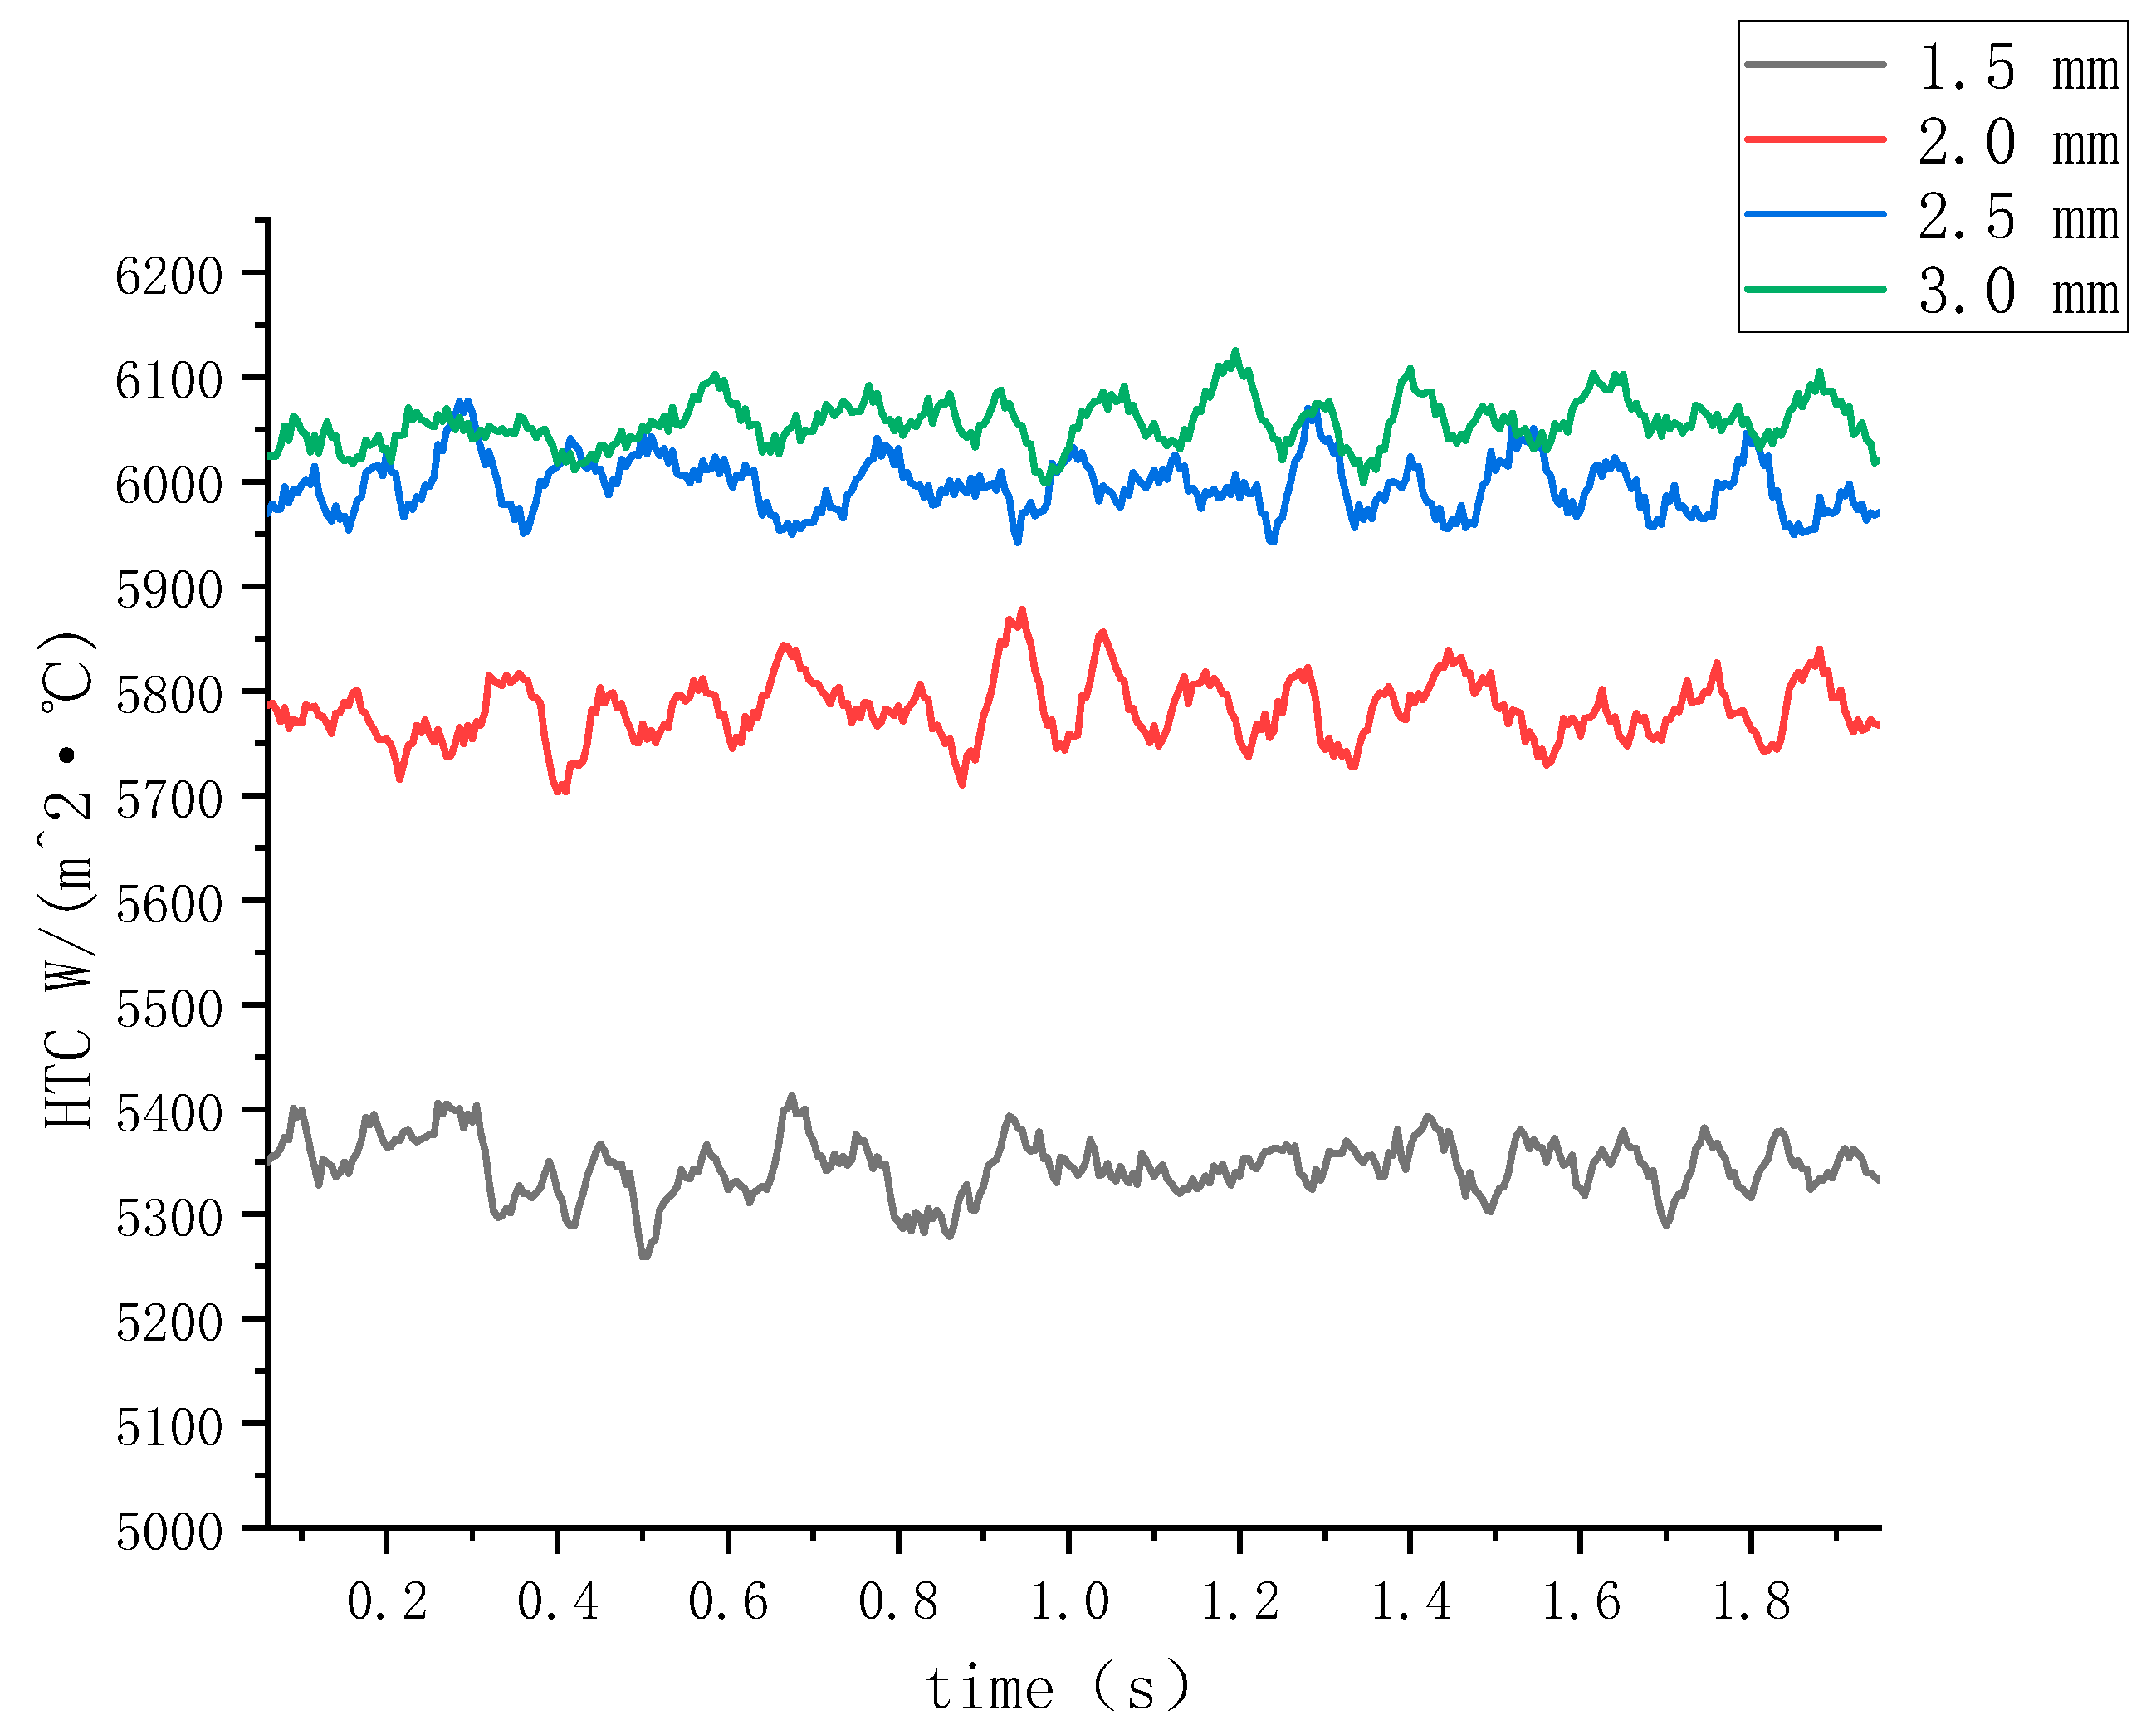
is 0.02989, 0.02842, 0.06243, and 0.10543, indicating that K 4 > K 3 > K 1 > K 2 . Because the torque generated during the injection lubrication process is smaller, the following conclusion may be reached: when the injection diameter is 2 mm, the power loss is reduced. Similarly, the best values for the other three parameters (injection angle, injection distance, and gear speed) are 90°, 3.5 cm, and 2000 r/min, respectively. This is consistent with the preceding simulation results, which show that when the incident diameter is 2 mm, the gear power loss is the minimum and the lubrication is optimal.
The R i is the extreme difference between the corresponding factors in each column: the larger the extreme difference value, the greater the influence of the factor on the test results as the main influencing parameter. The smaller the extreme difference, the smaller the influence of the factor on the test as the minor factor. The R-values for incidence distance, incidence angle, incidence diameter and rotational speed are 0.02160, 0.01722, 0.07700 and 0.03363 respectively. According to the results of the aforementioned analysis, the liquid injection diameter has the greatest effect on power loss during lubrication among the studied important parameters. In comparison, the liquid injection angle has the least affect on power loss.
To more visually demonstrate the pattern of influence of each parameter on the lubrication effect in the oil injection lubrication test, the mean main effects of each factor and the test index were plotted.
Figure 14 demonstrated how adjustments in the various parameters had varying effects on the test results. The slope of the line on the graph indicates how much influence the factor had on the test indicator; the higher the slope, the greater the influence. With a low mean value, this degree of injection lubrication generated low torque and power loss. The graph clearly demonstrates that as the incidence diameter increased, the mean value increased slightly and then sharply, and the slope of the change pattern was consistent with the mean value, indicating that the incidence diameter had a significant influence on oil injection lubrication loss. The increase in torque was not substantial when the incidence diameter was less than or equal to 2.0 mm. When the injection diameter exceeded 2.0 mm, the torque increased immediately, indicating a significant increase in the power loss of the gears. According to the findings of the tests, when the incidence diameter was 2.0 mm, the flow of lubricant injected was minimal and the heat dissipation effect was high. The torque created by the gears to overcome the liquid was minor in this case; therefore, the power loss was minimal. As a result, the incidence diameter of 2.0 mm provided the best overall heat dissipation effect for the gear. This is consistent with the simulation results.

4.2. Analysis of Variance

The extreme difference analysis method of an orthogonal test can be used to obtain the best working conditions for liquid injection lubrication. This method requires only a modest calculation and analysis of the given test data, but the accuracy of the analysis cannot be reliably controlled. ANOVA is a mathematical method that decomposes the sum of squares of the total variance based on the factors influencing the variance and then performs statistical tests. It can effectively compensate for the inadequacies of the ANOVA method.
According to the rules of ANOVA, when the p-value was less than 0.05, this indicated that the factor had a significant effect on the test results. The incidence diameter had the most significant influence and was the key influencing factor parameter for the gear’s power loss, as shown in Table 4 with the incidence diameter’s p = 0.010 of less than 0.05 value. The p-value of 0.103 for the rotational speed was the secondary factor. The p-values of 0.273 and 0.471 for the incident distance and incident angle, respectively, were non-essential influence parameters. This was also a good indication of the correctness of the extreme difference analysis.

4.3. Regression Analysis

The optimum test conditions for gear injection lubrication were obtained by using extreme difference analysis and analysis of variance (ANOVA). Regression analysis is a scientific technique for establishing a relationship between the dependent variable and the independent variable by regressing a large number of observations using mathematical and statistical techniques. In order to make a more scientific and reasonable prediction of the test results, regression analysis can be used to analyze the orthogonal test.
Assuming a linear relationship between the dependent variable y 1 (torque) and the independent variables x 1 (incident distance), x 2 (incident angle), x 3 (incident diameter) and x 4 (rotational speed), the mathematical model can be written as:
  y 1 = a + b x 1 + c x 2 + d x 3 + e x 4
After a further series of calculations on the test data, the regression analysis table was obtained as shown in Table 5.
Therefore, the torque regression equation was obtained as:
y 1 = 00287 0.00425 x 1 + 0.00201 x 2 + 0.02635 x 3 + 0.00996 x 4
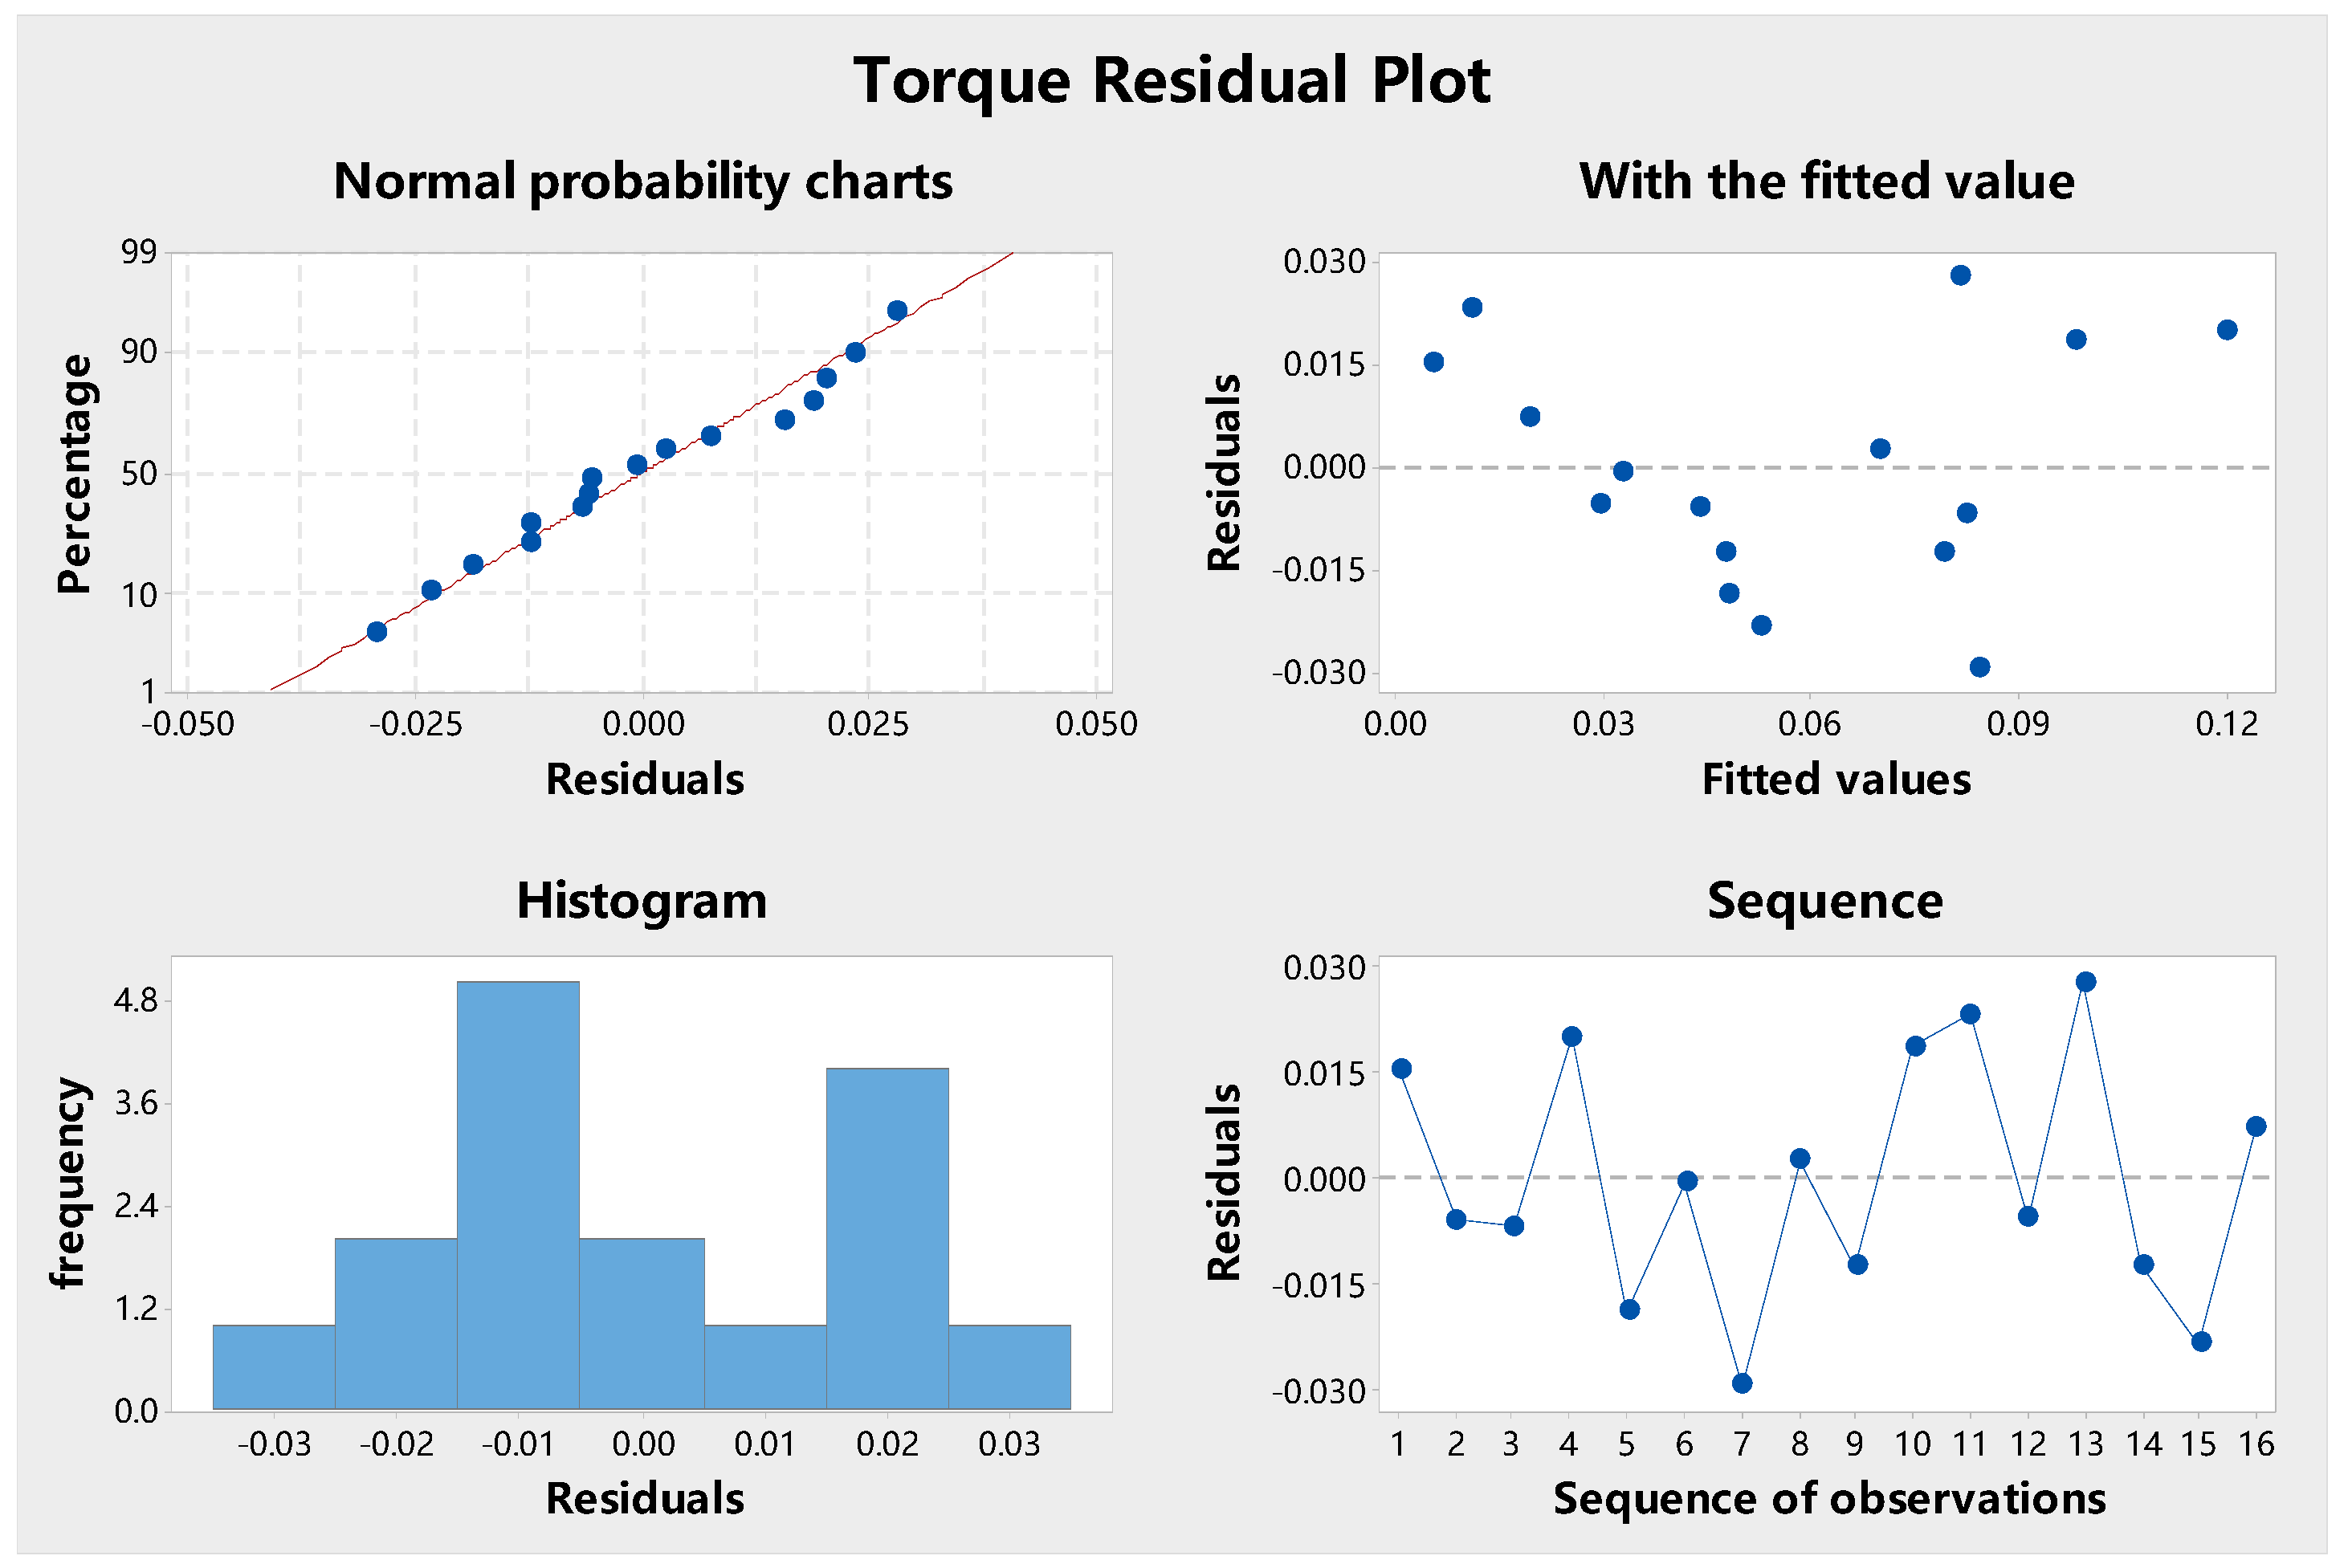
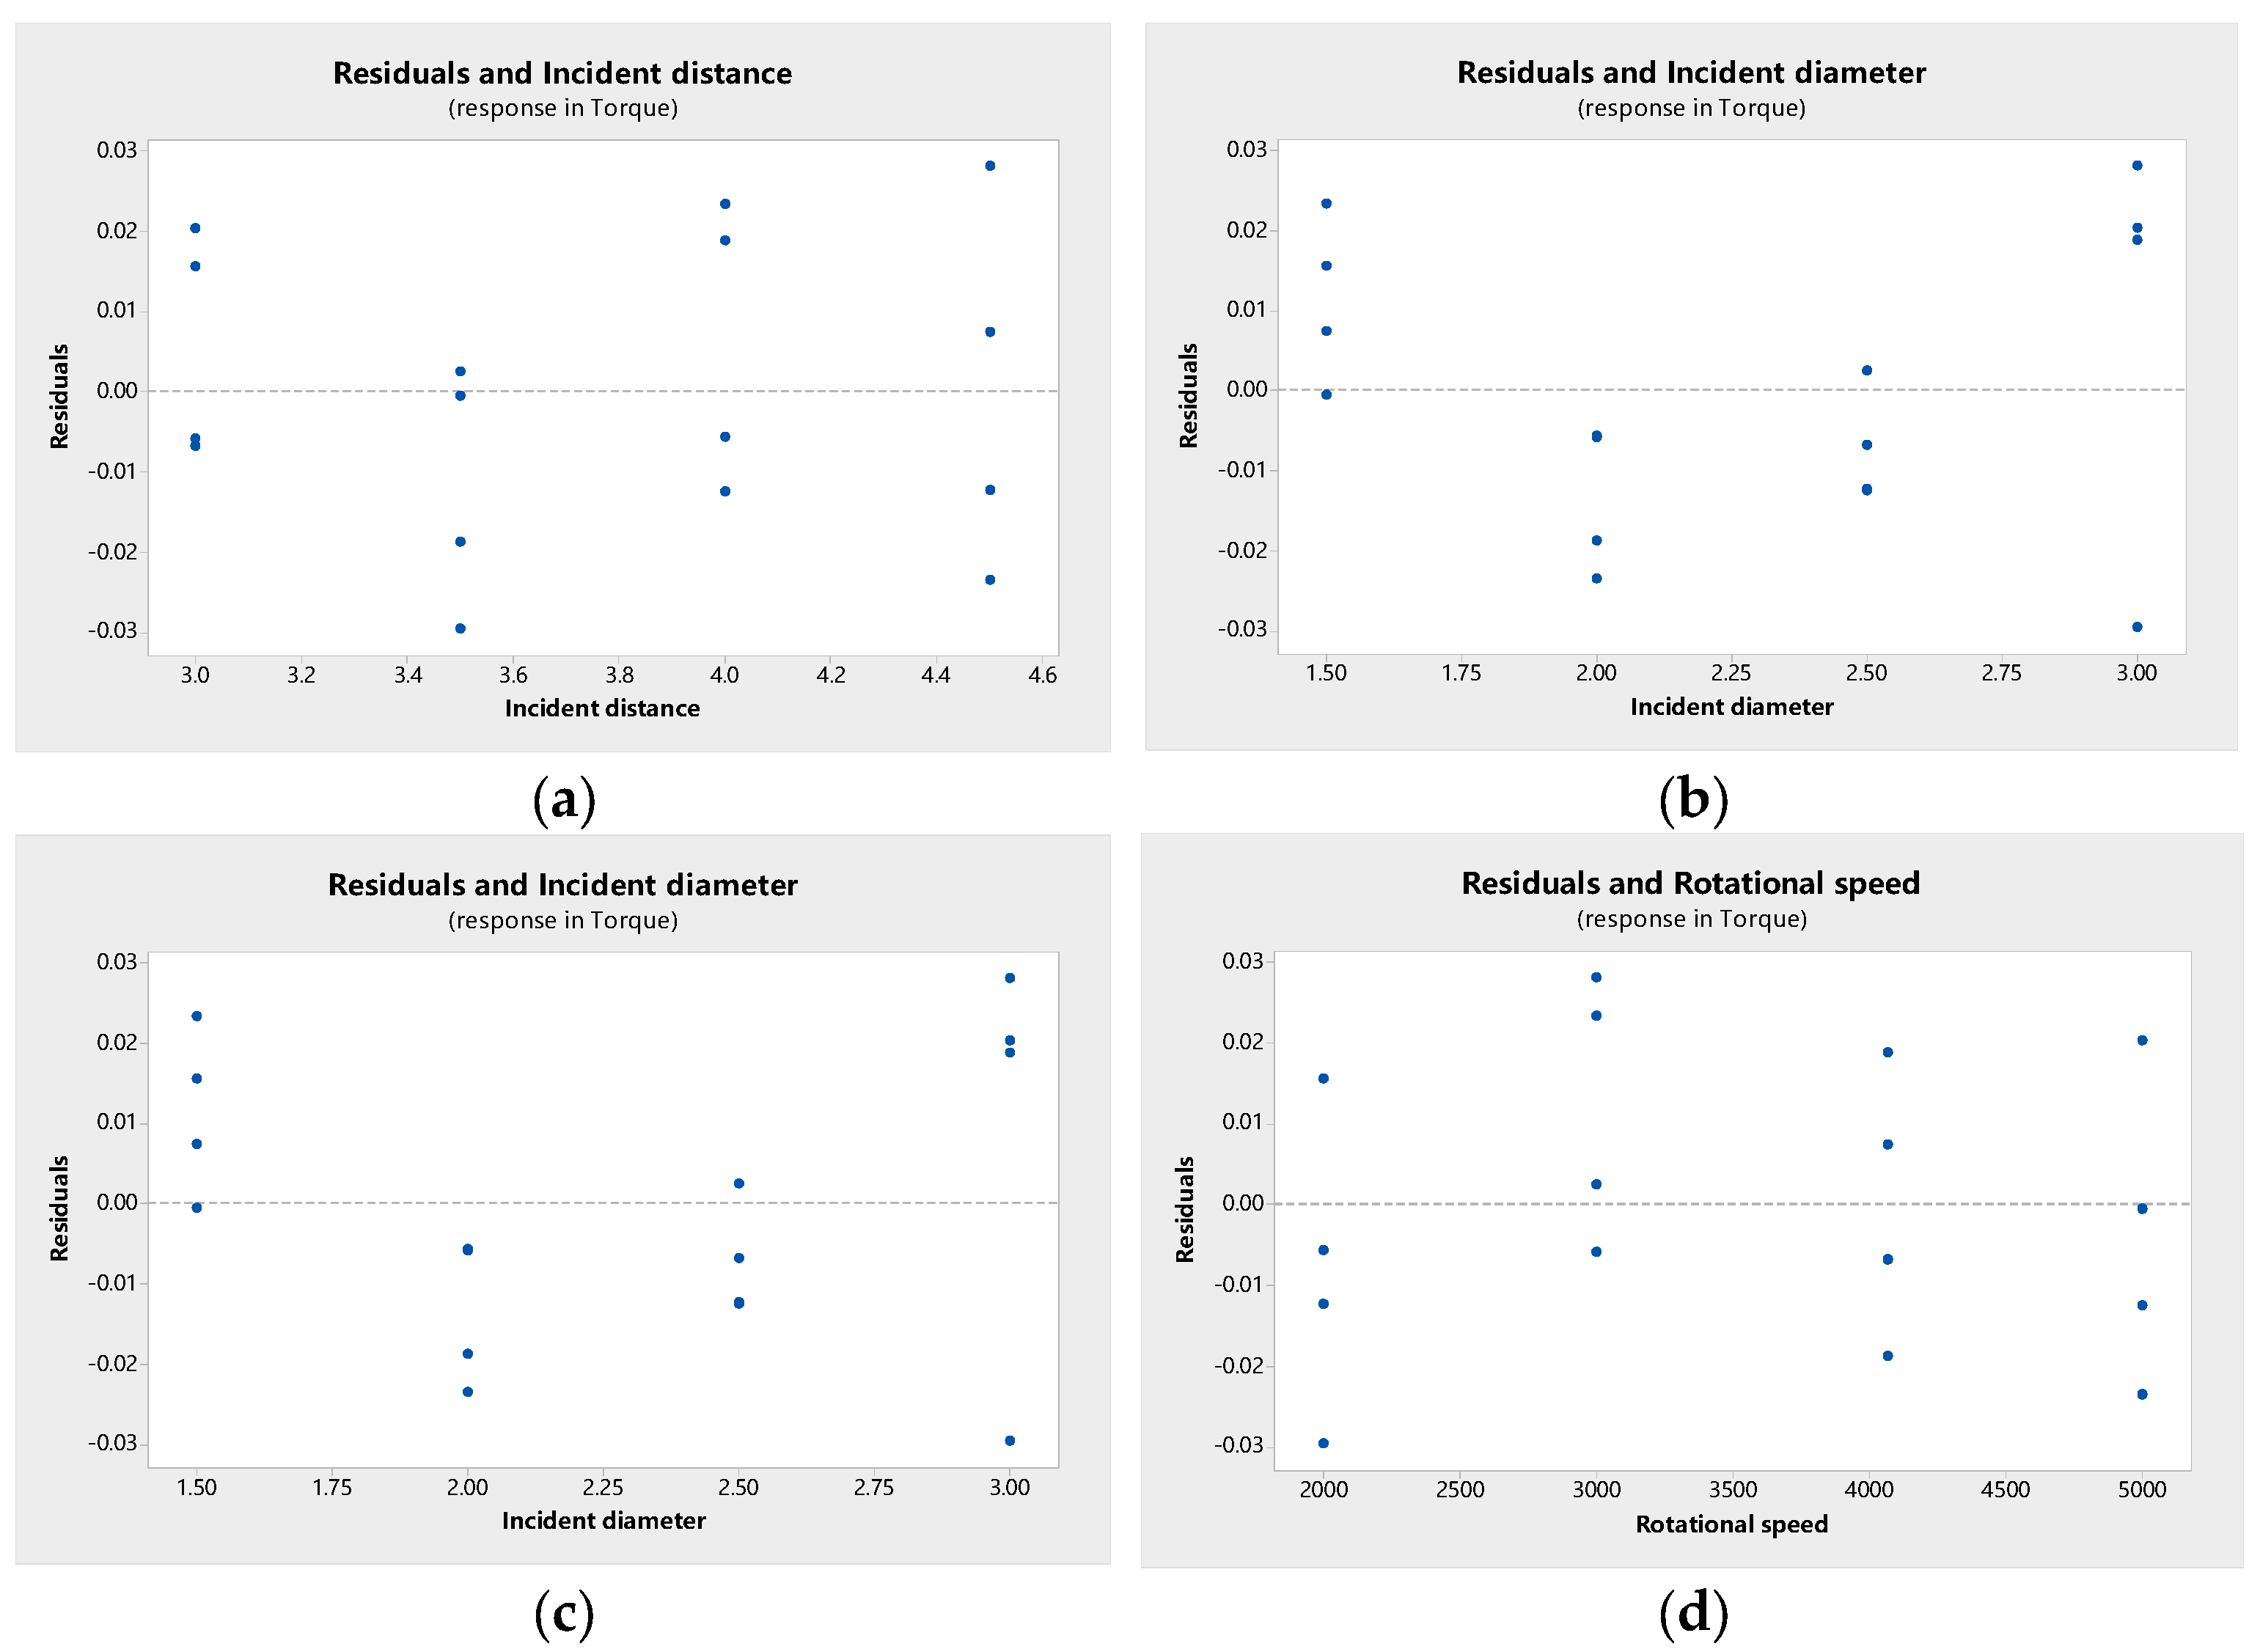
The torque residuals displayed in Figure 15 and the scatter plot of residuals vs. factors shown in Figure 16 were plotted for a more visual inspection of the torque residuals.
From the graph, it can be observed that the torque residuals were distributed normally. In a normal probability plot, the residuals are distributed around a straight line. The residual distribution histogram, residuals against fitted values plot, and residuals versus observed order plot all show that the torque residual values were within −0.030 and 0.030 and randomly distributed on both sides of the reference line. As can be seen in Figure 16, the residuals and the scatter points of the factors were all on vertical straight lines without bending. Therefore, the equation regression equation was correct based on the above analysis.

4.4. Prediction of Gear Oil Injection Lubrication

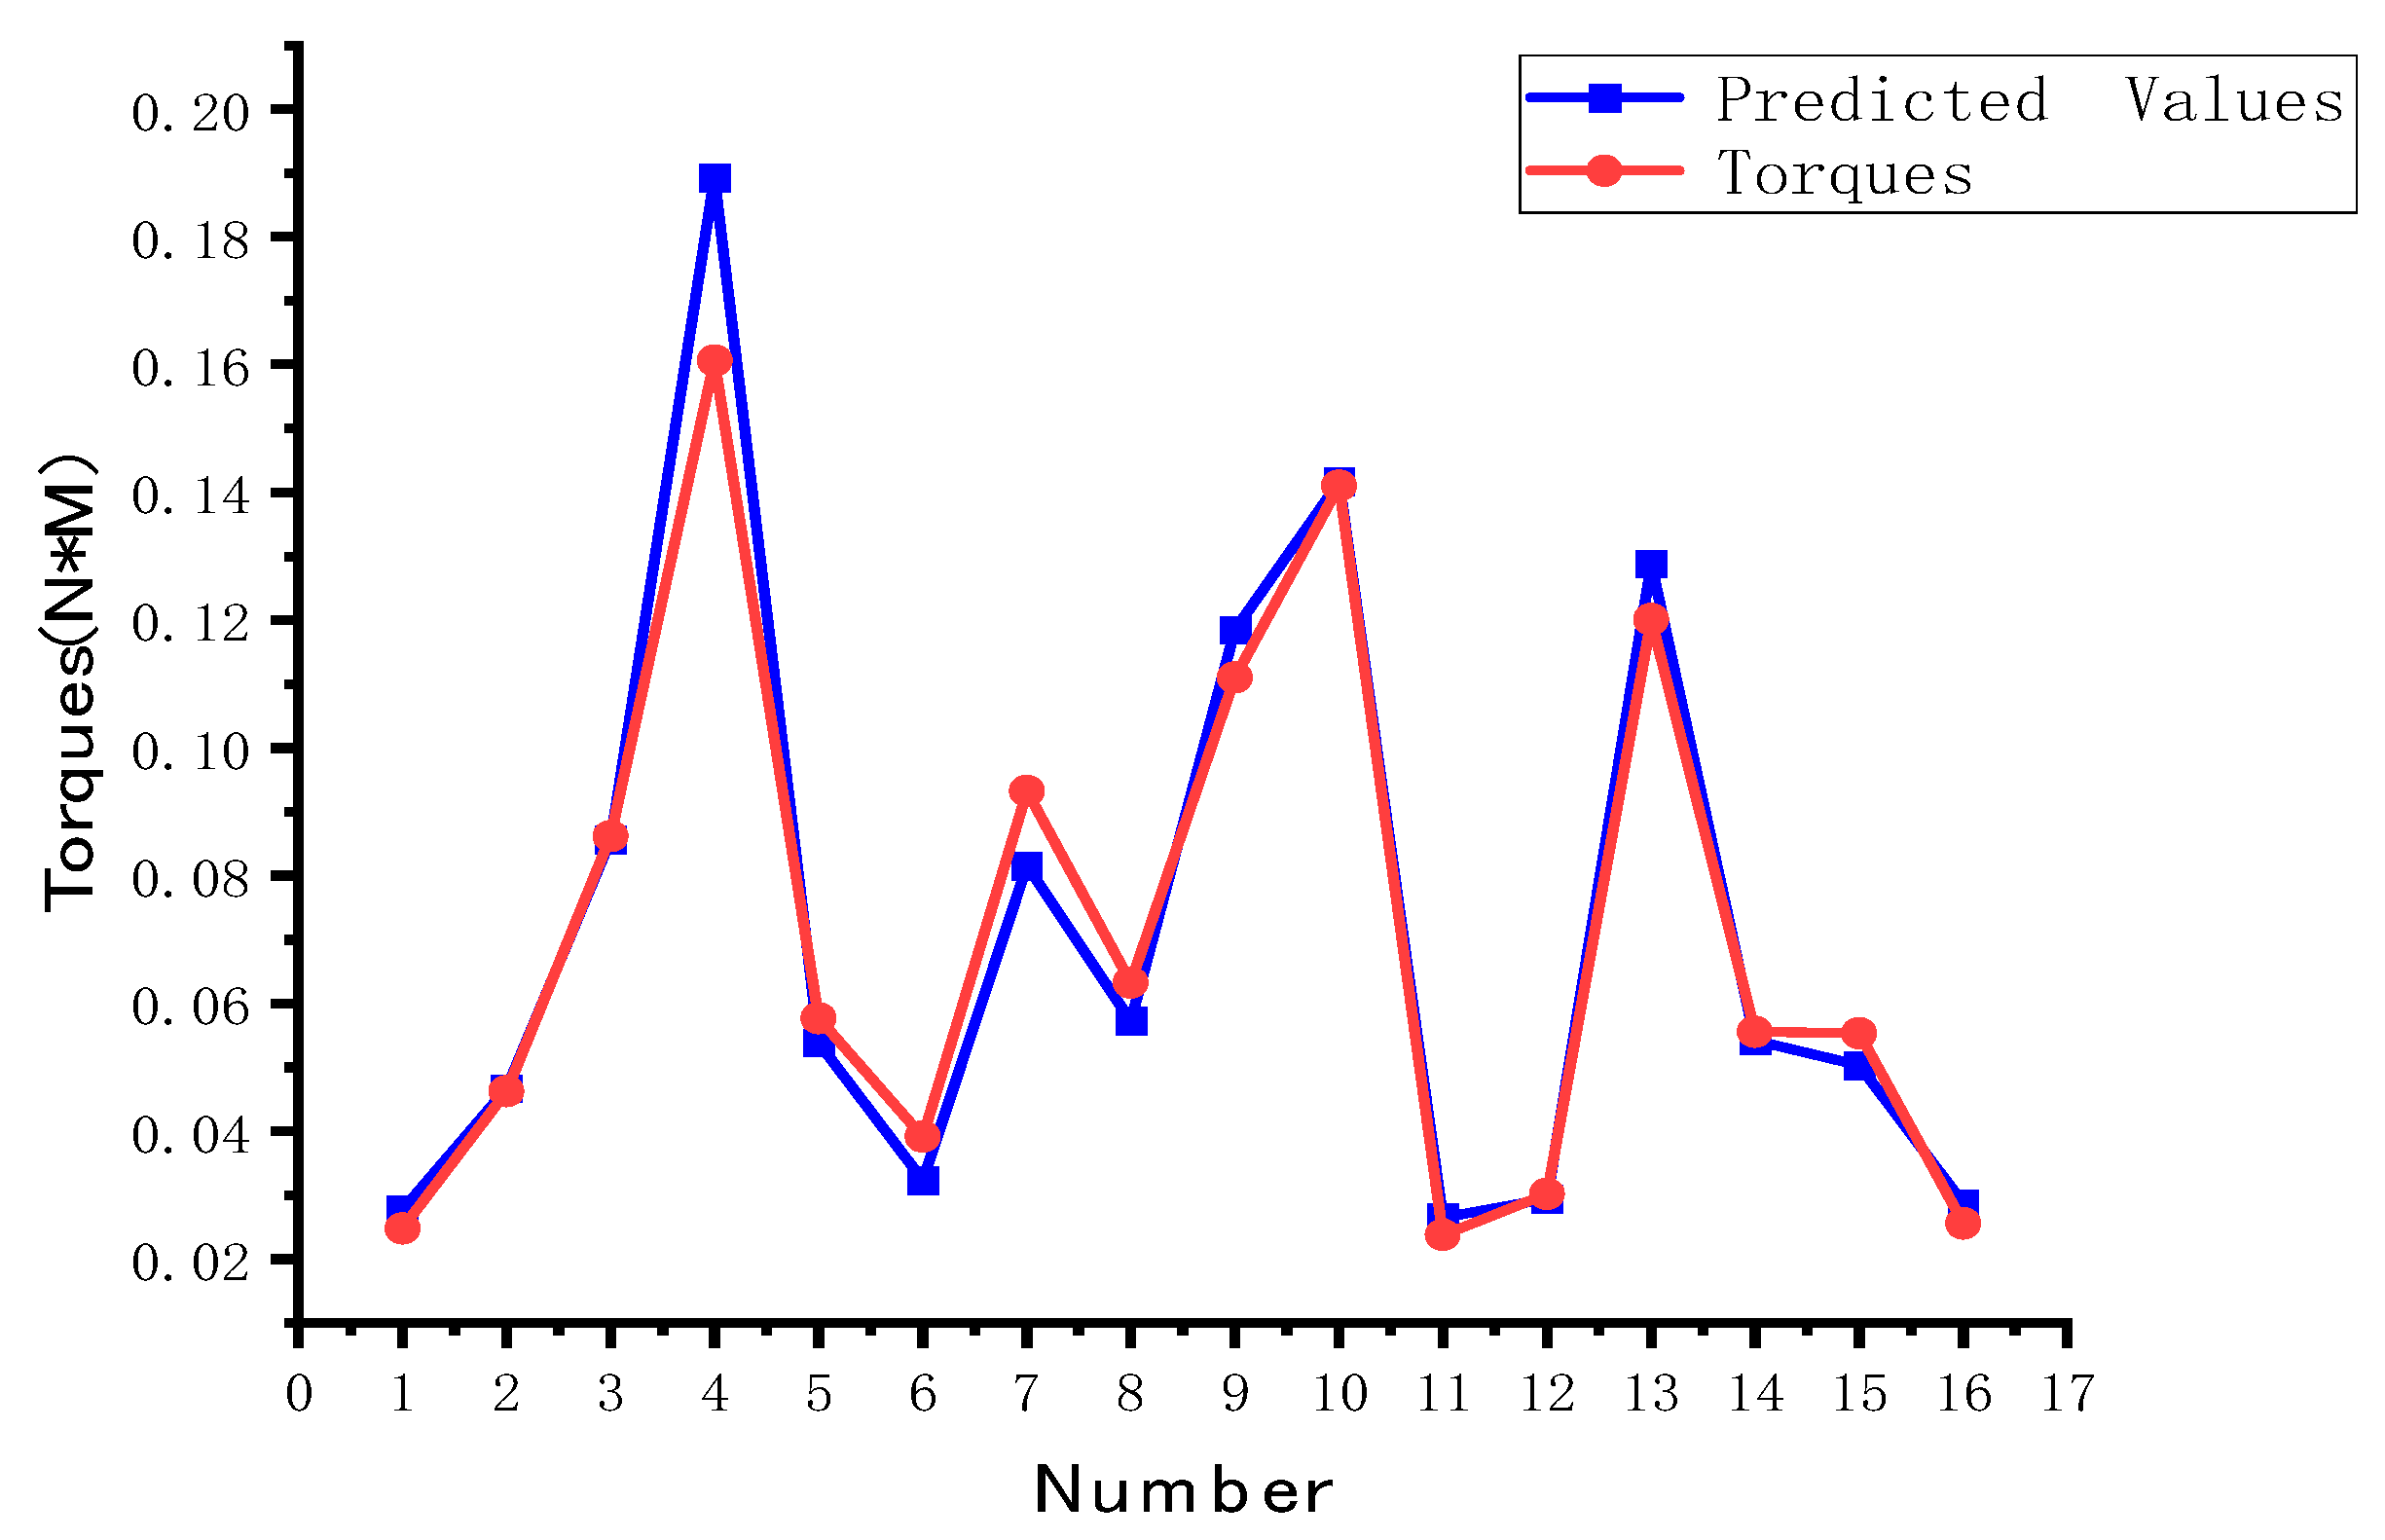
The torque prediction table displayed in Table 6 was obtained using the regression equation to forecast the test data and compare the predicted value with the actual test value; Figure 17 is presented accordingly.
According to the above analysis, the optimal combination of parameters for lubricant utilization of the high-speed rotating gear is: injection distance 3.5 cm, injection angle 90°, injection diameter 2.0 mm, and gear speed 2000 r/min. Gear injection lubrication is optimal under the above working conditions.

5. Conclusions

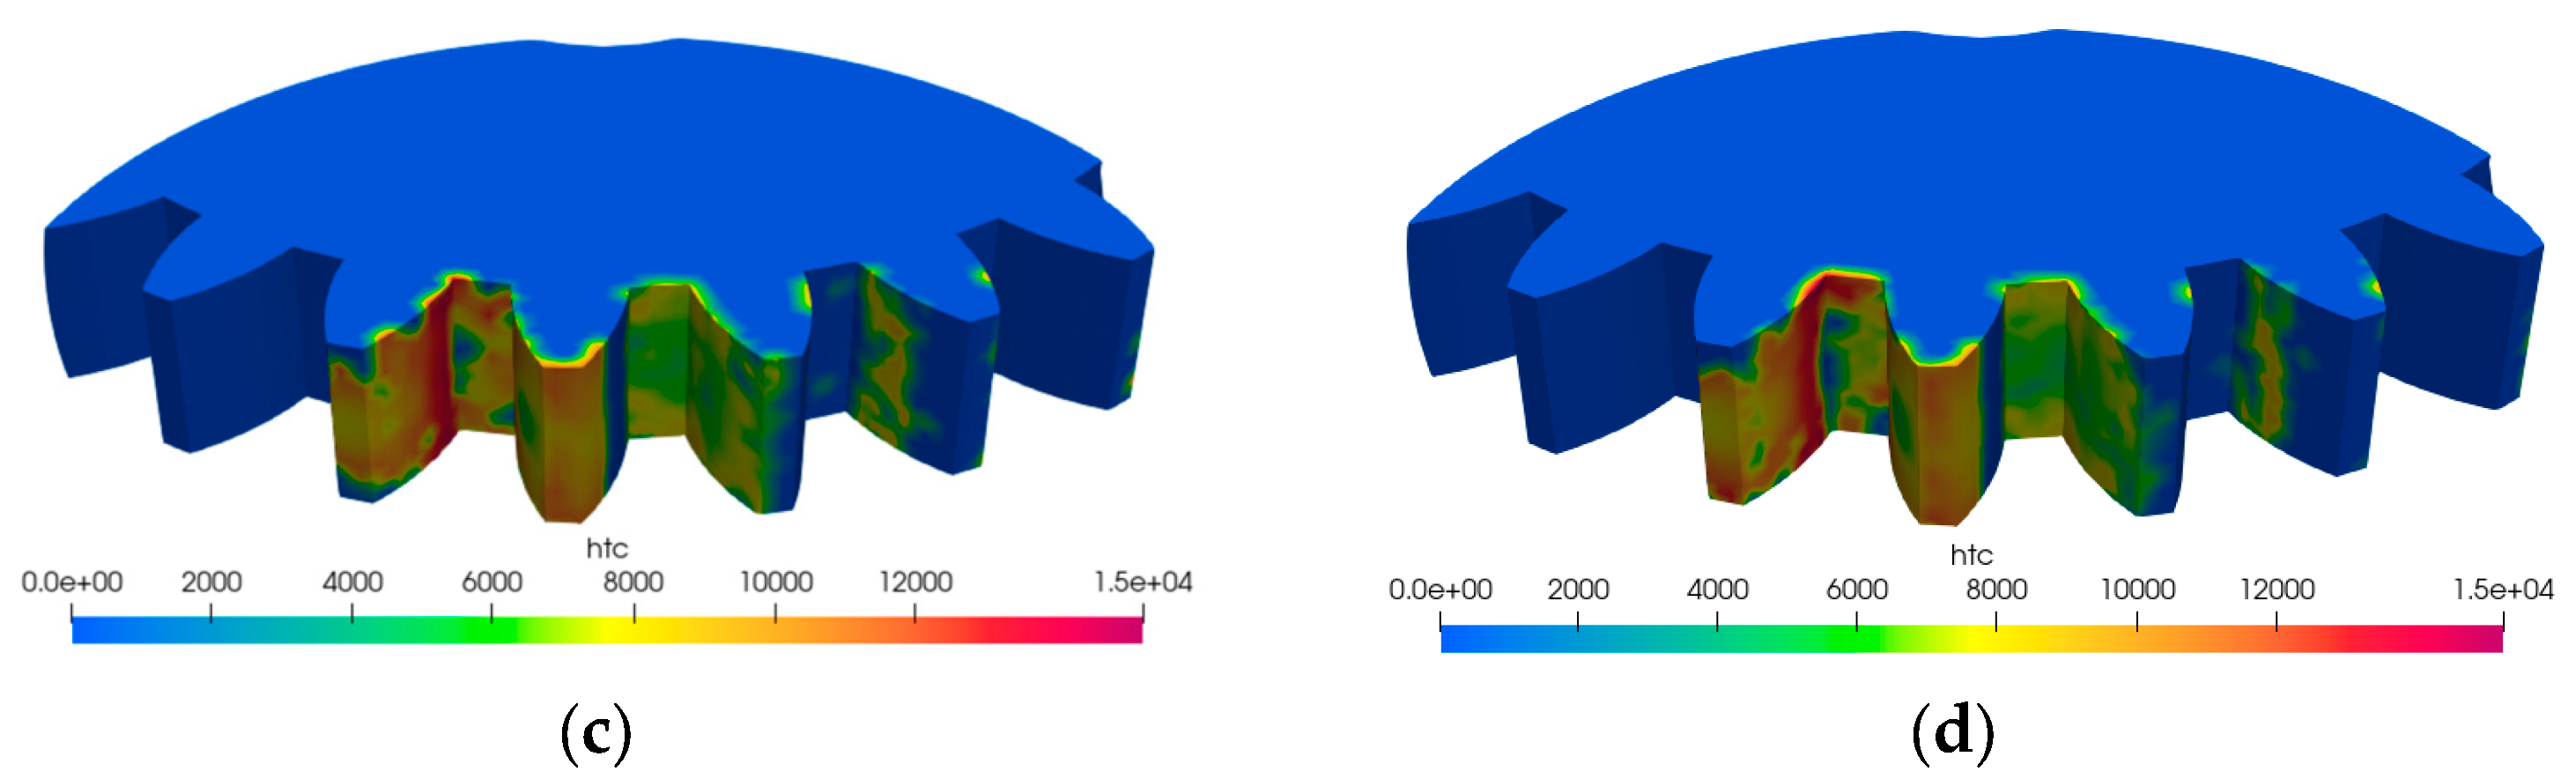
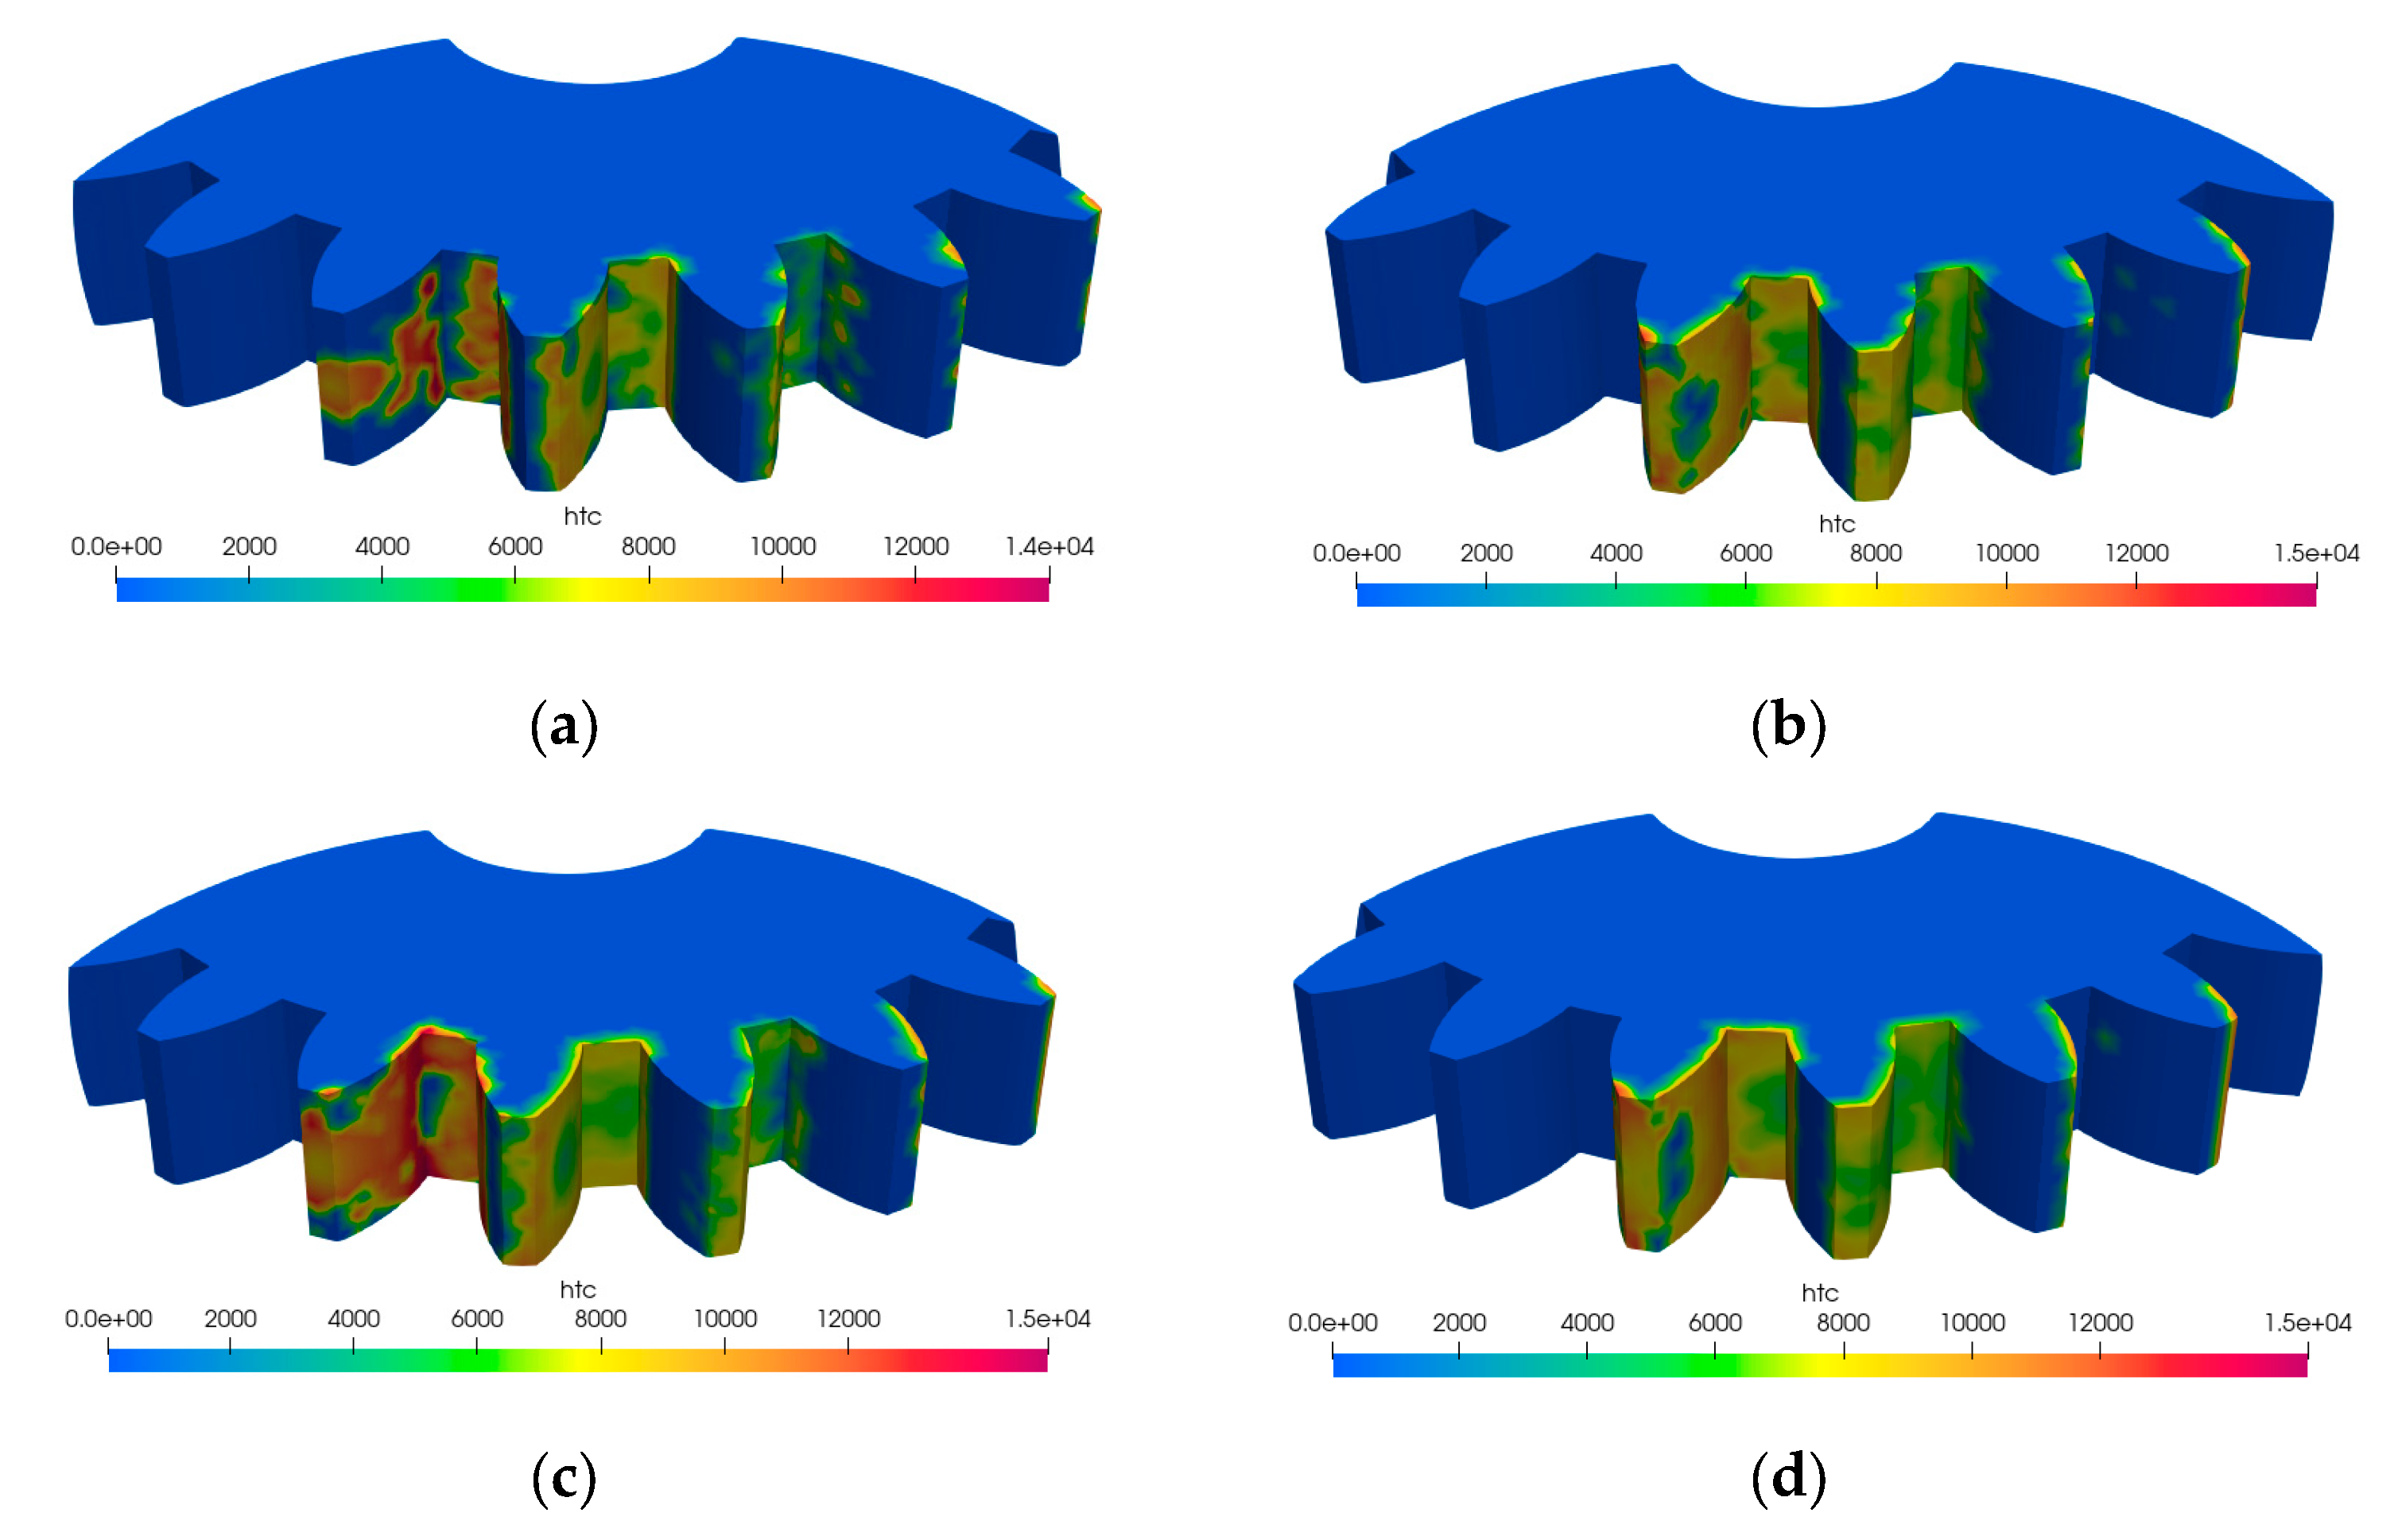
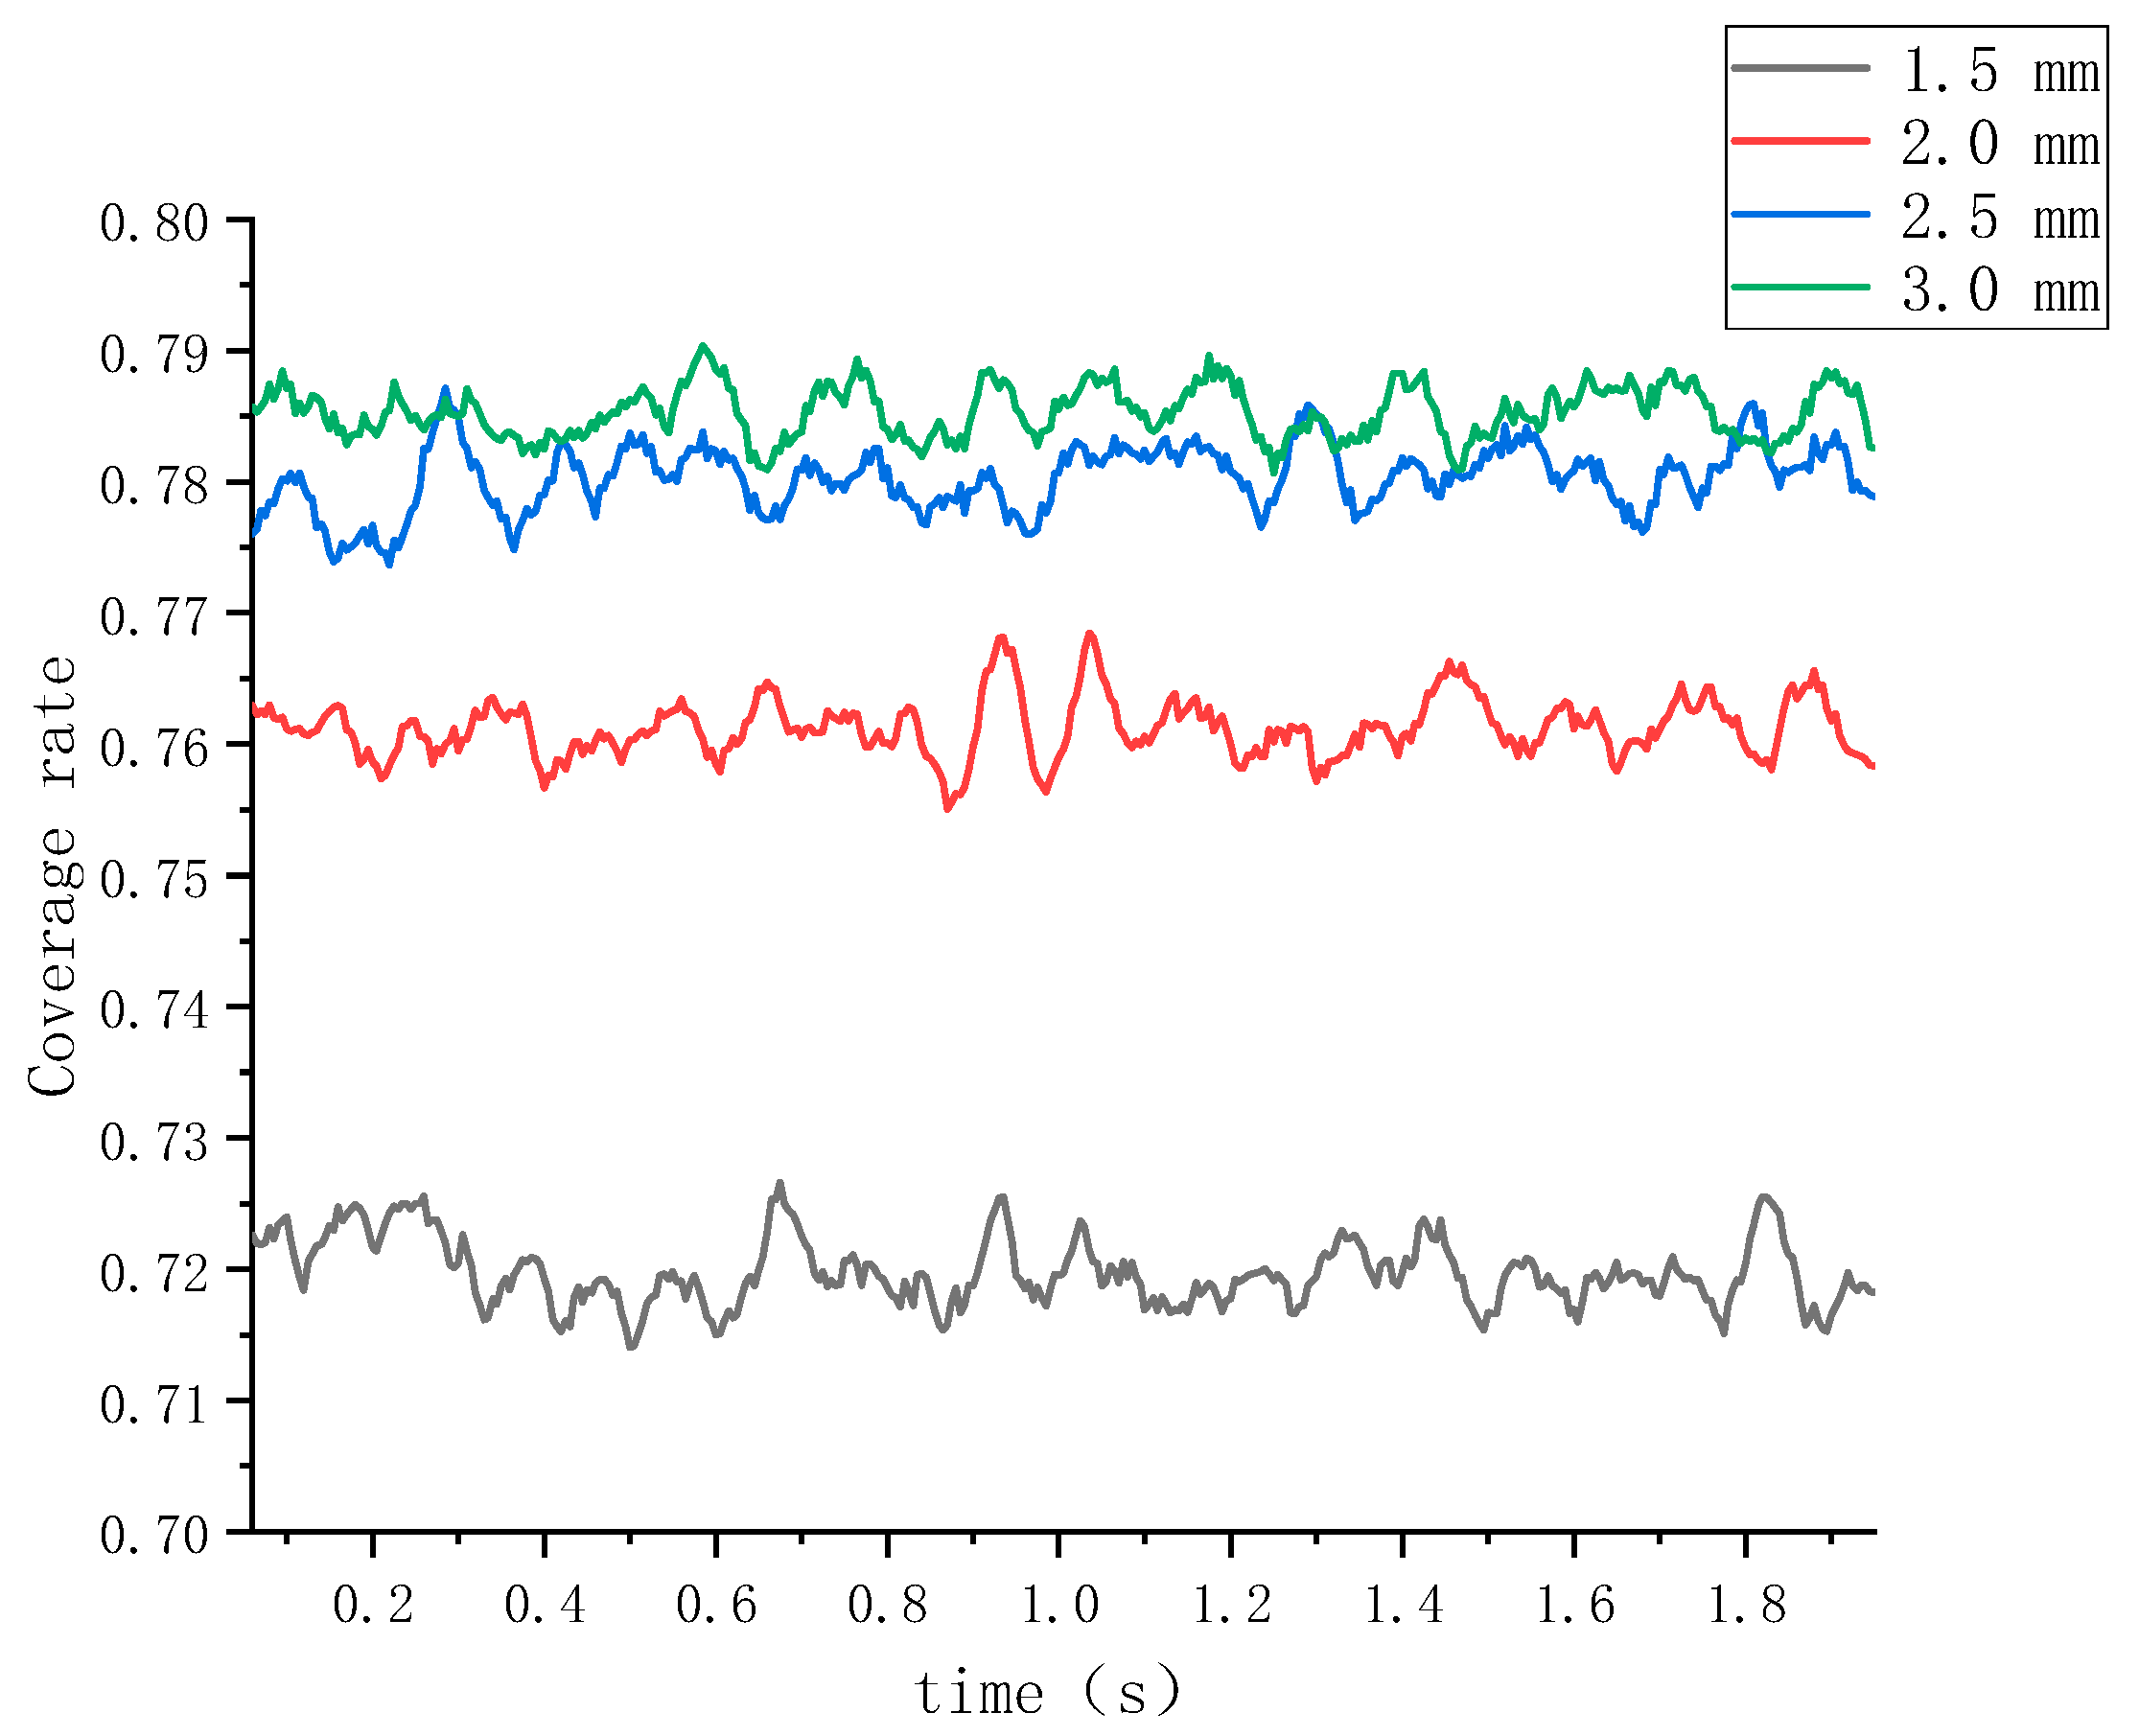
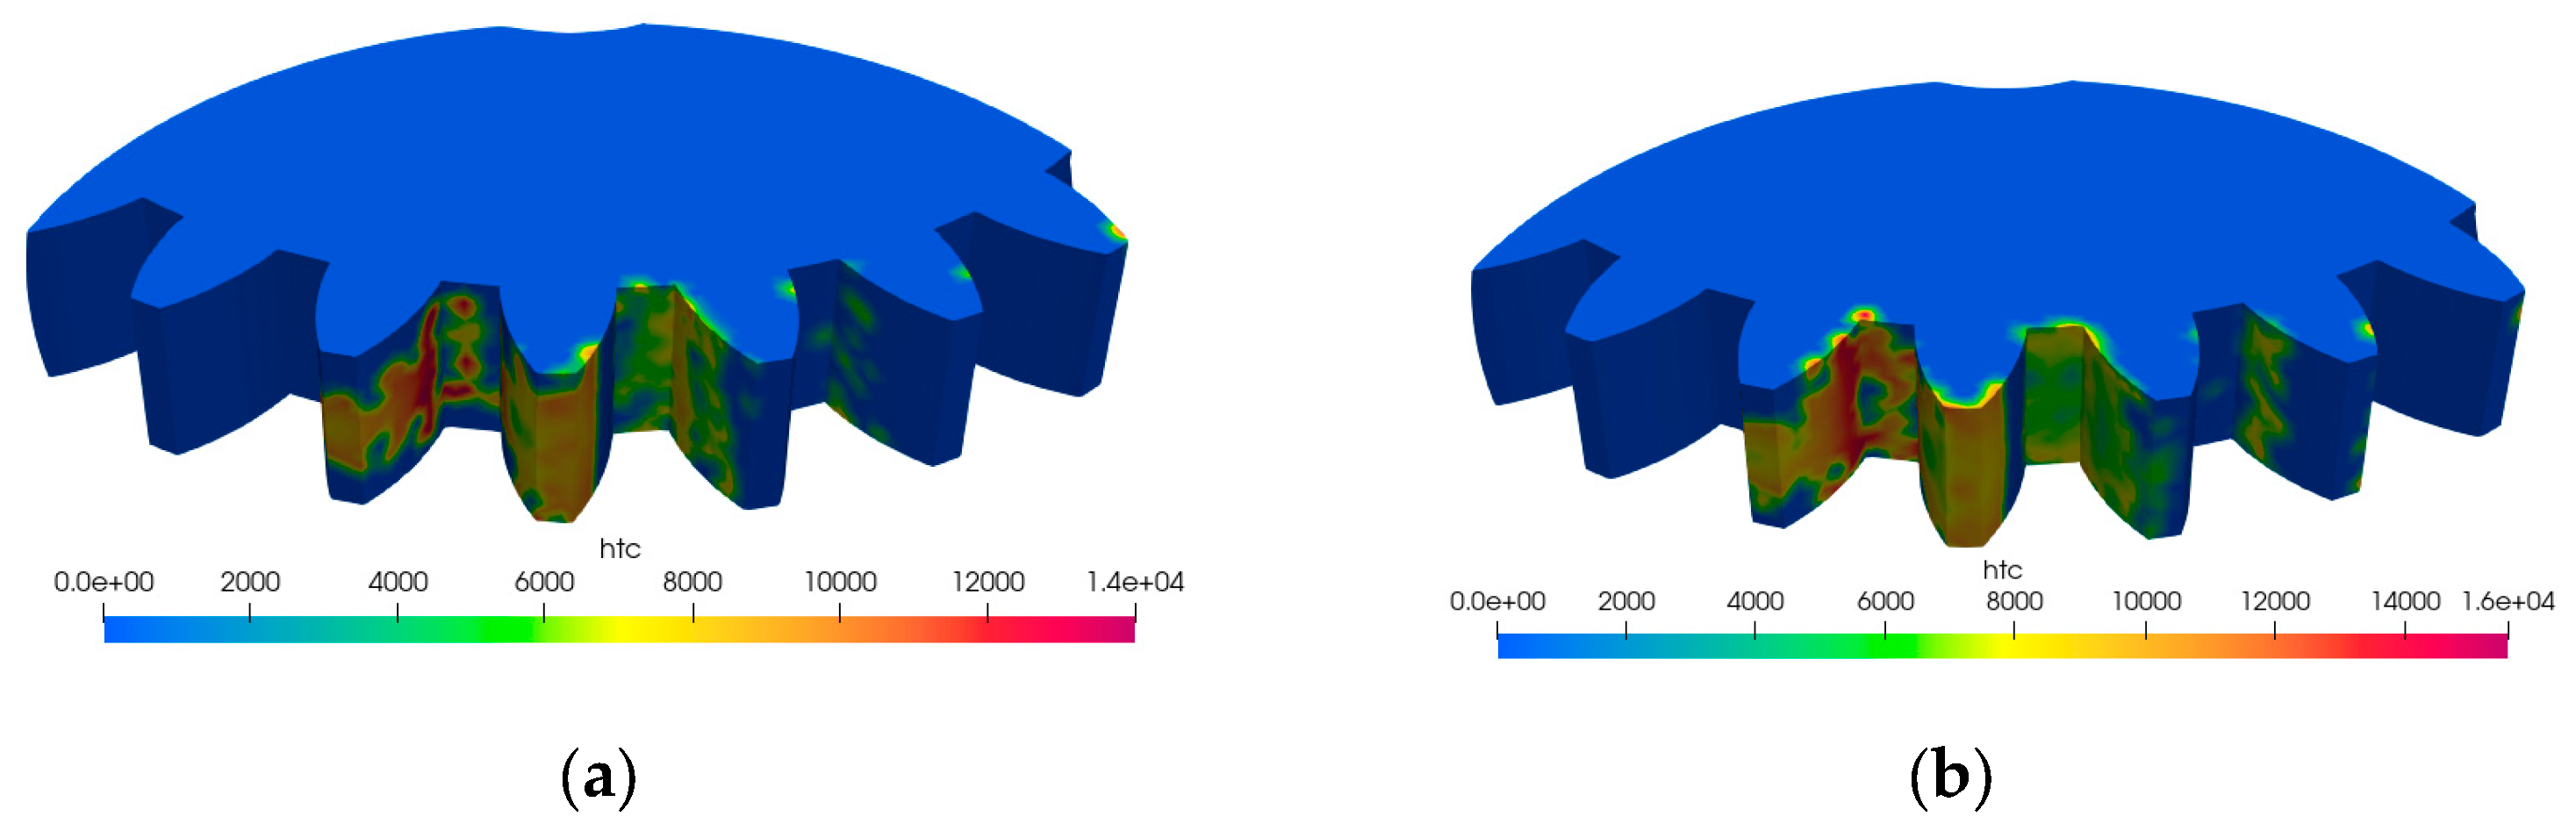
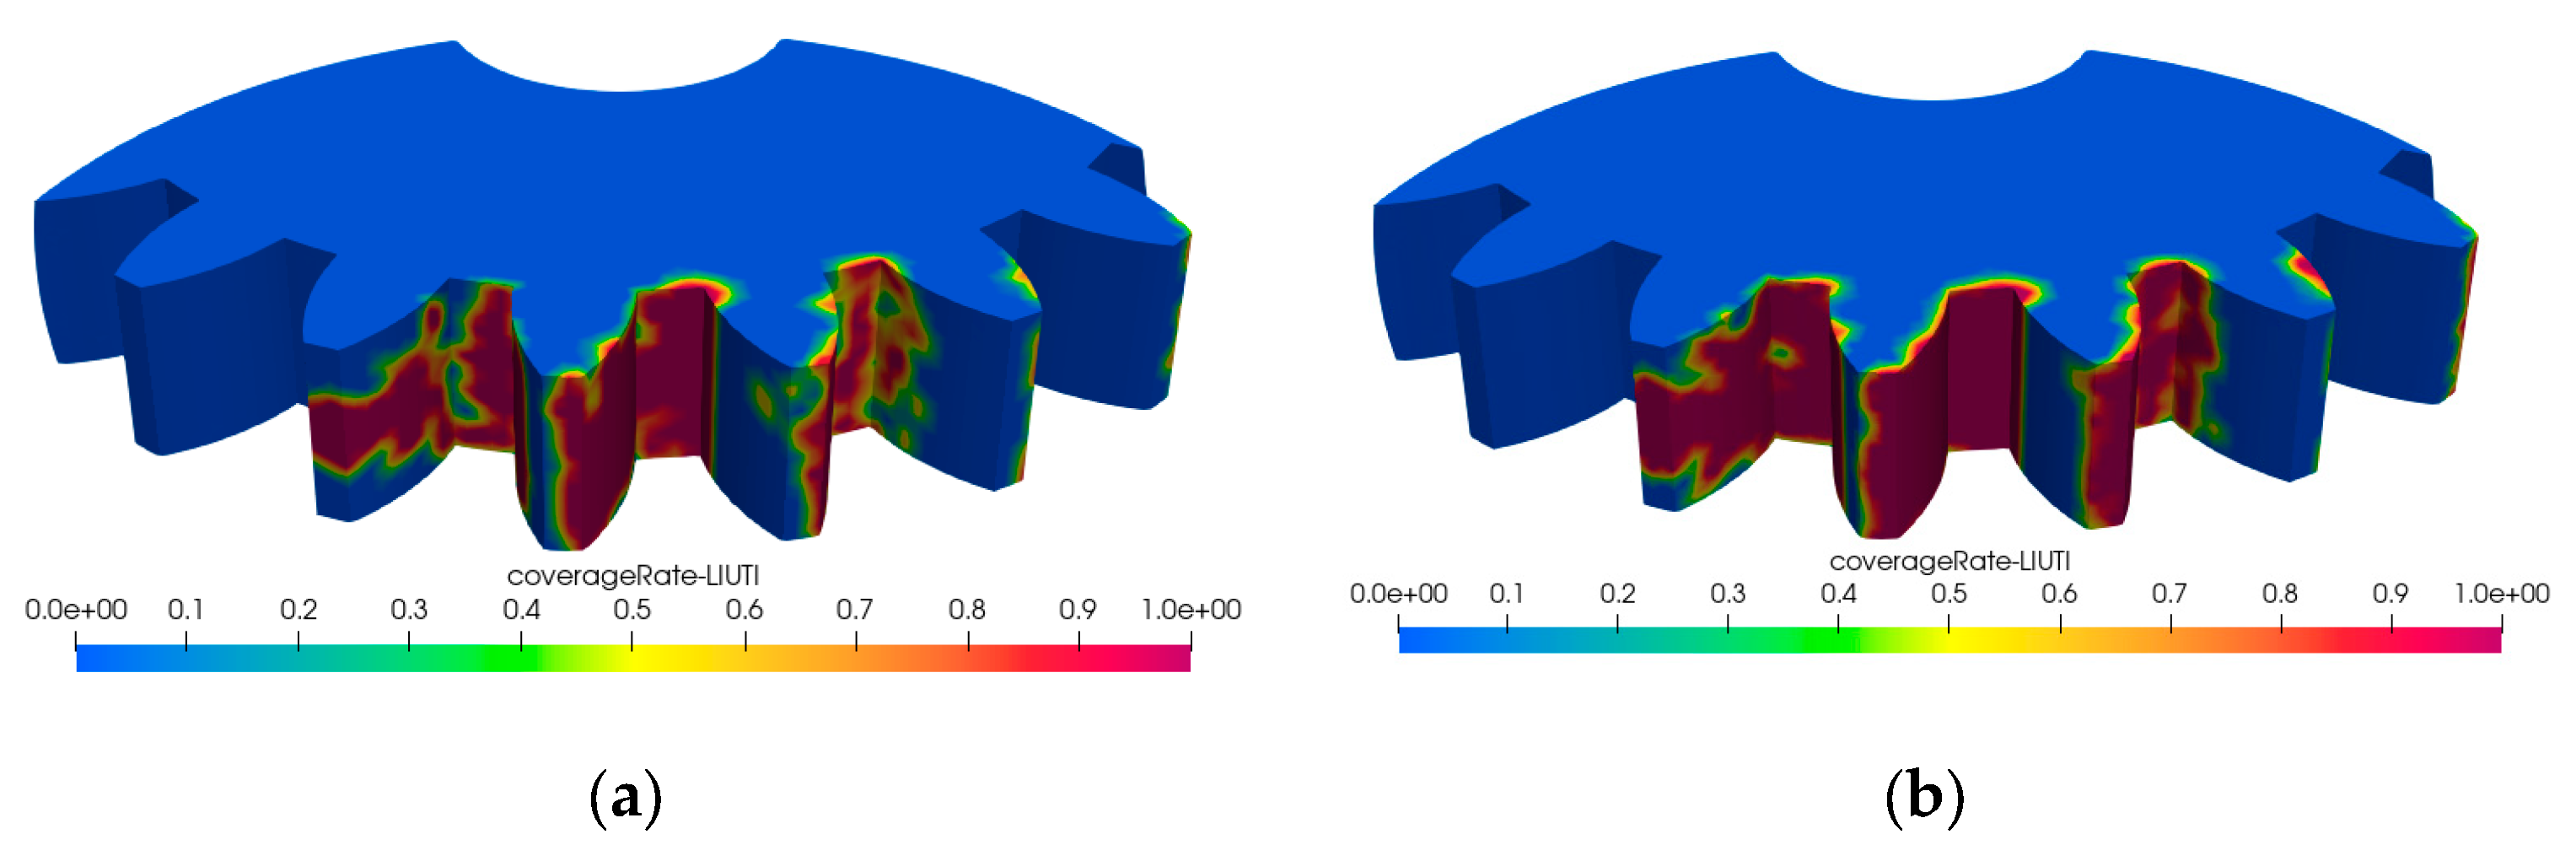
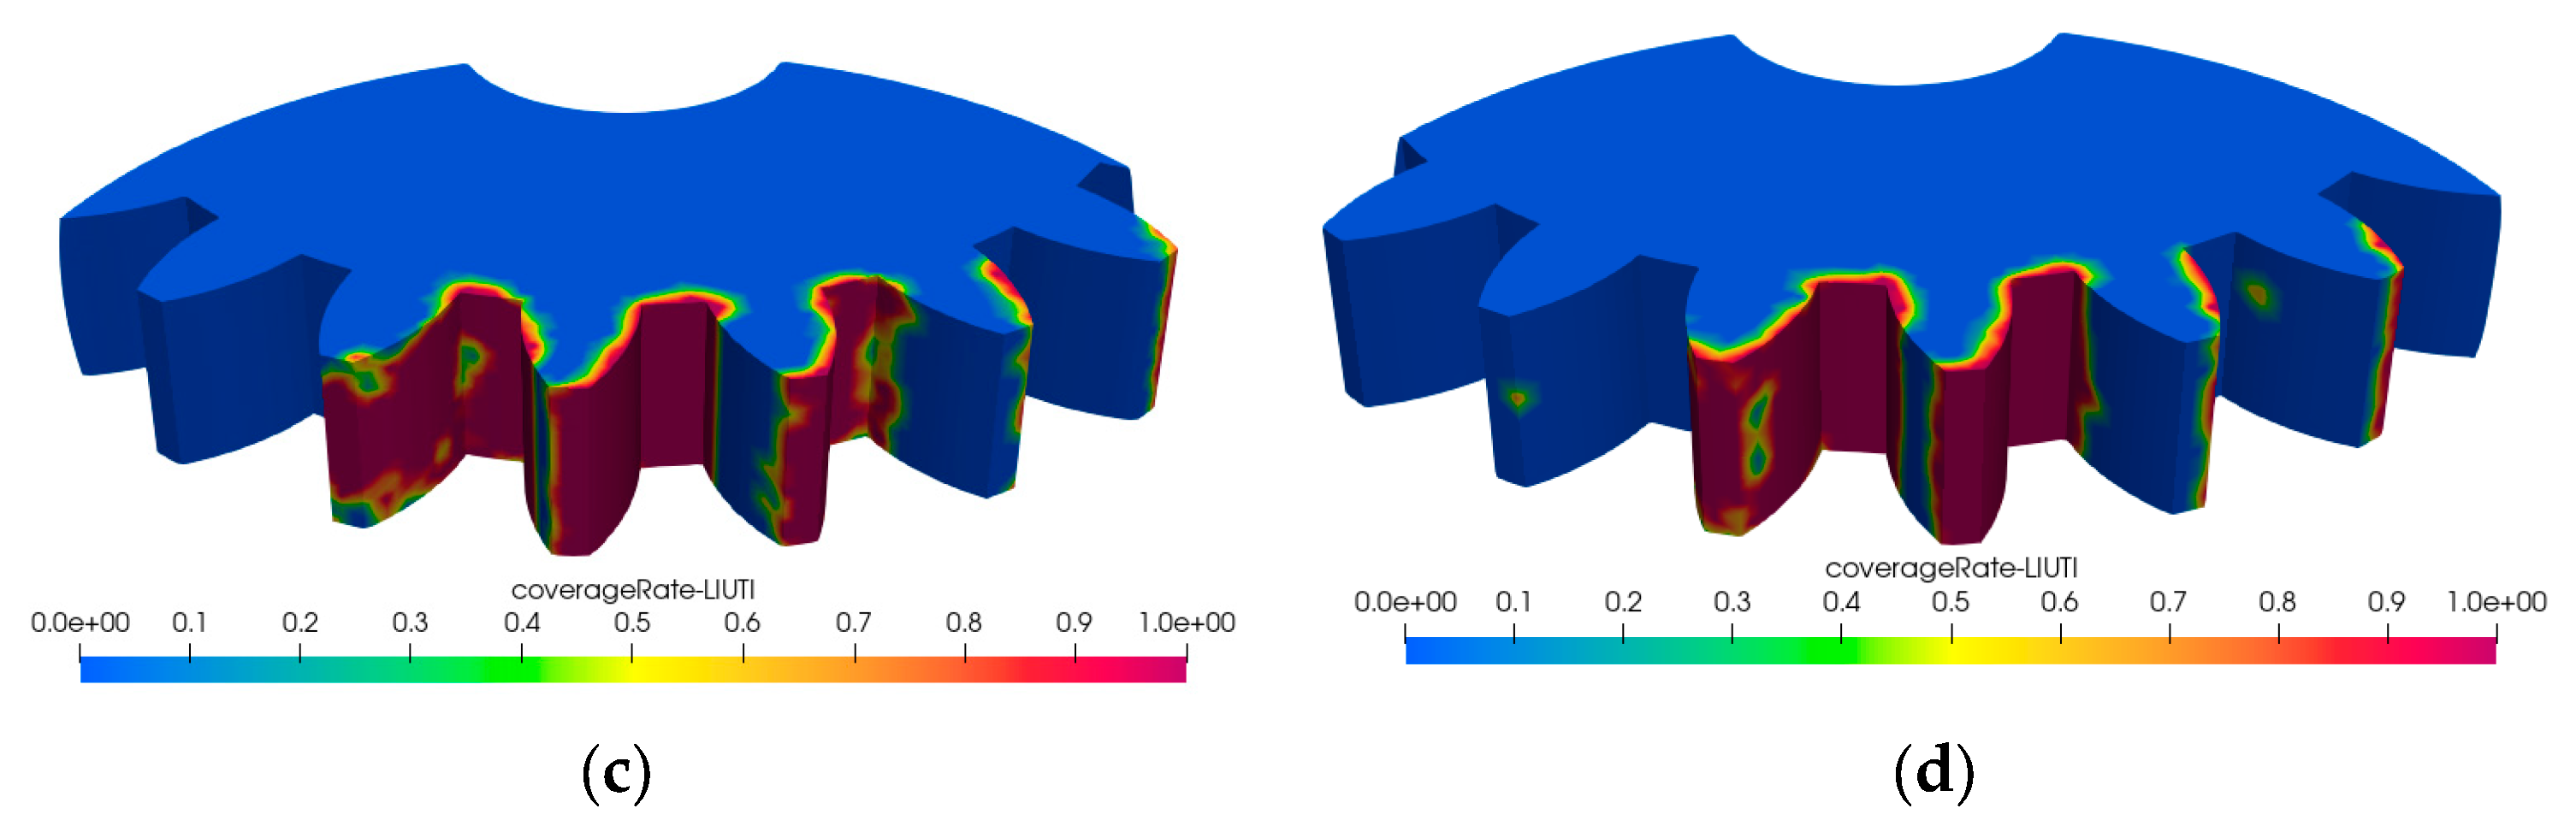
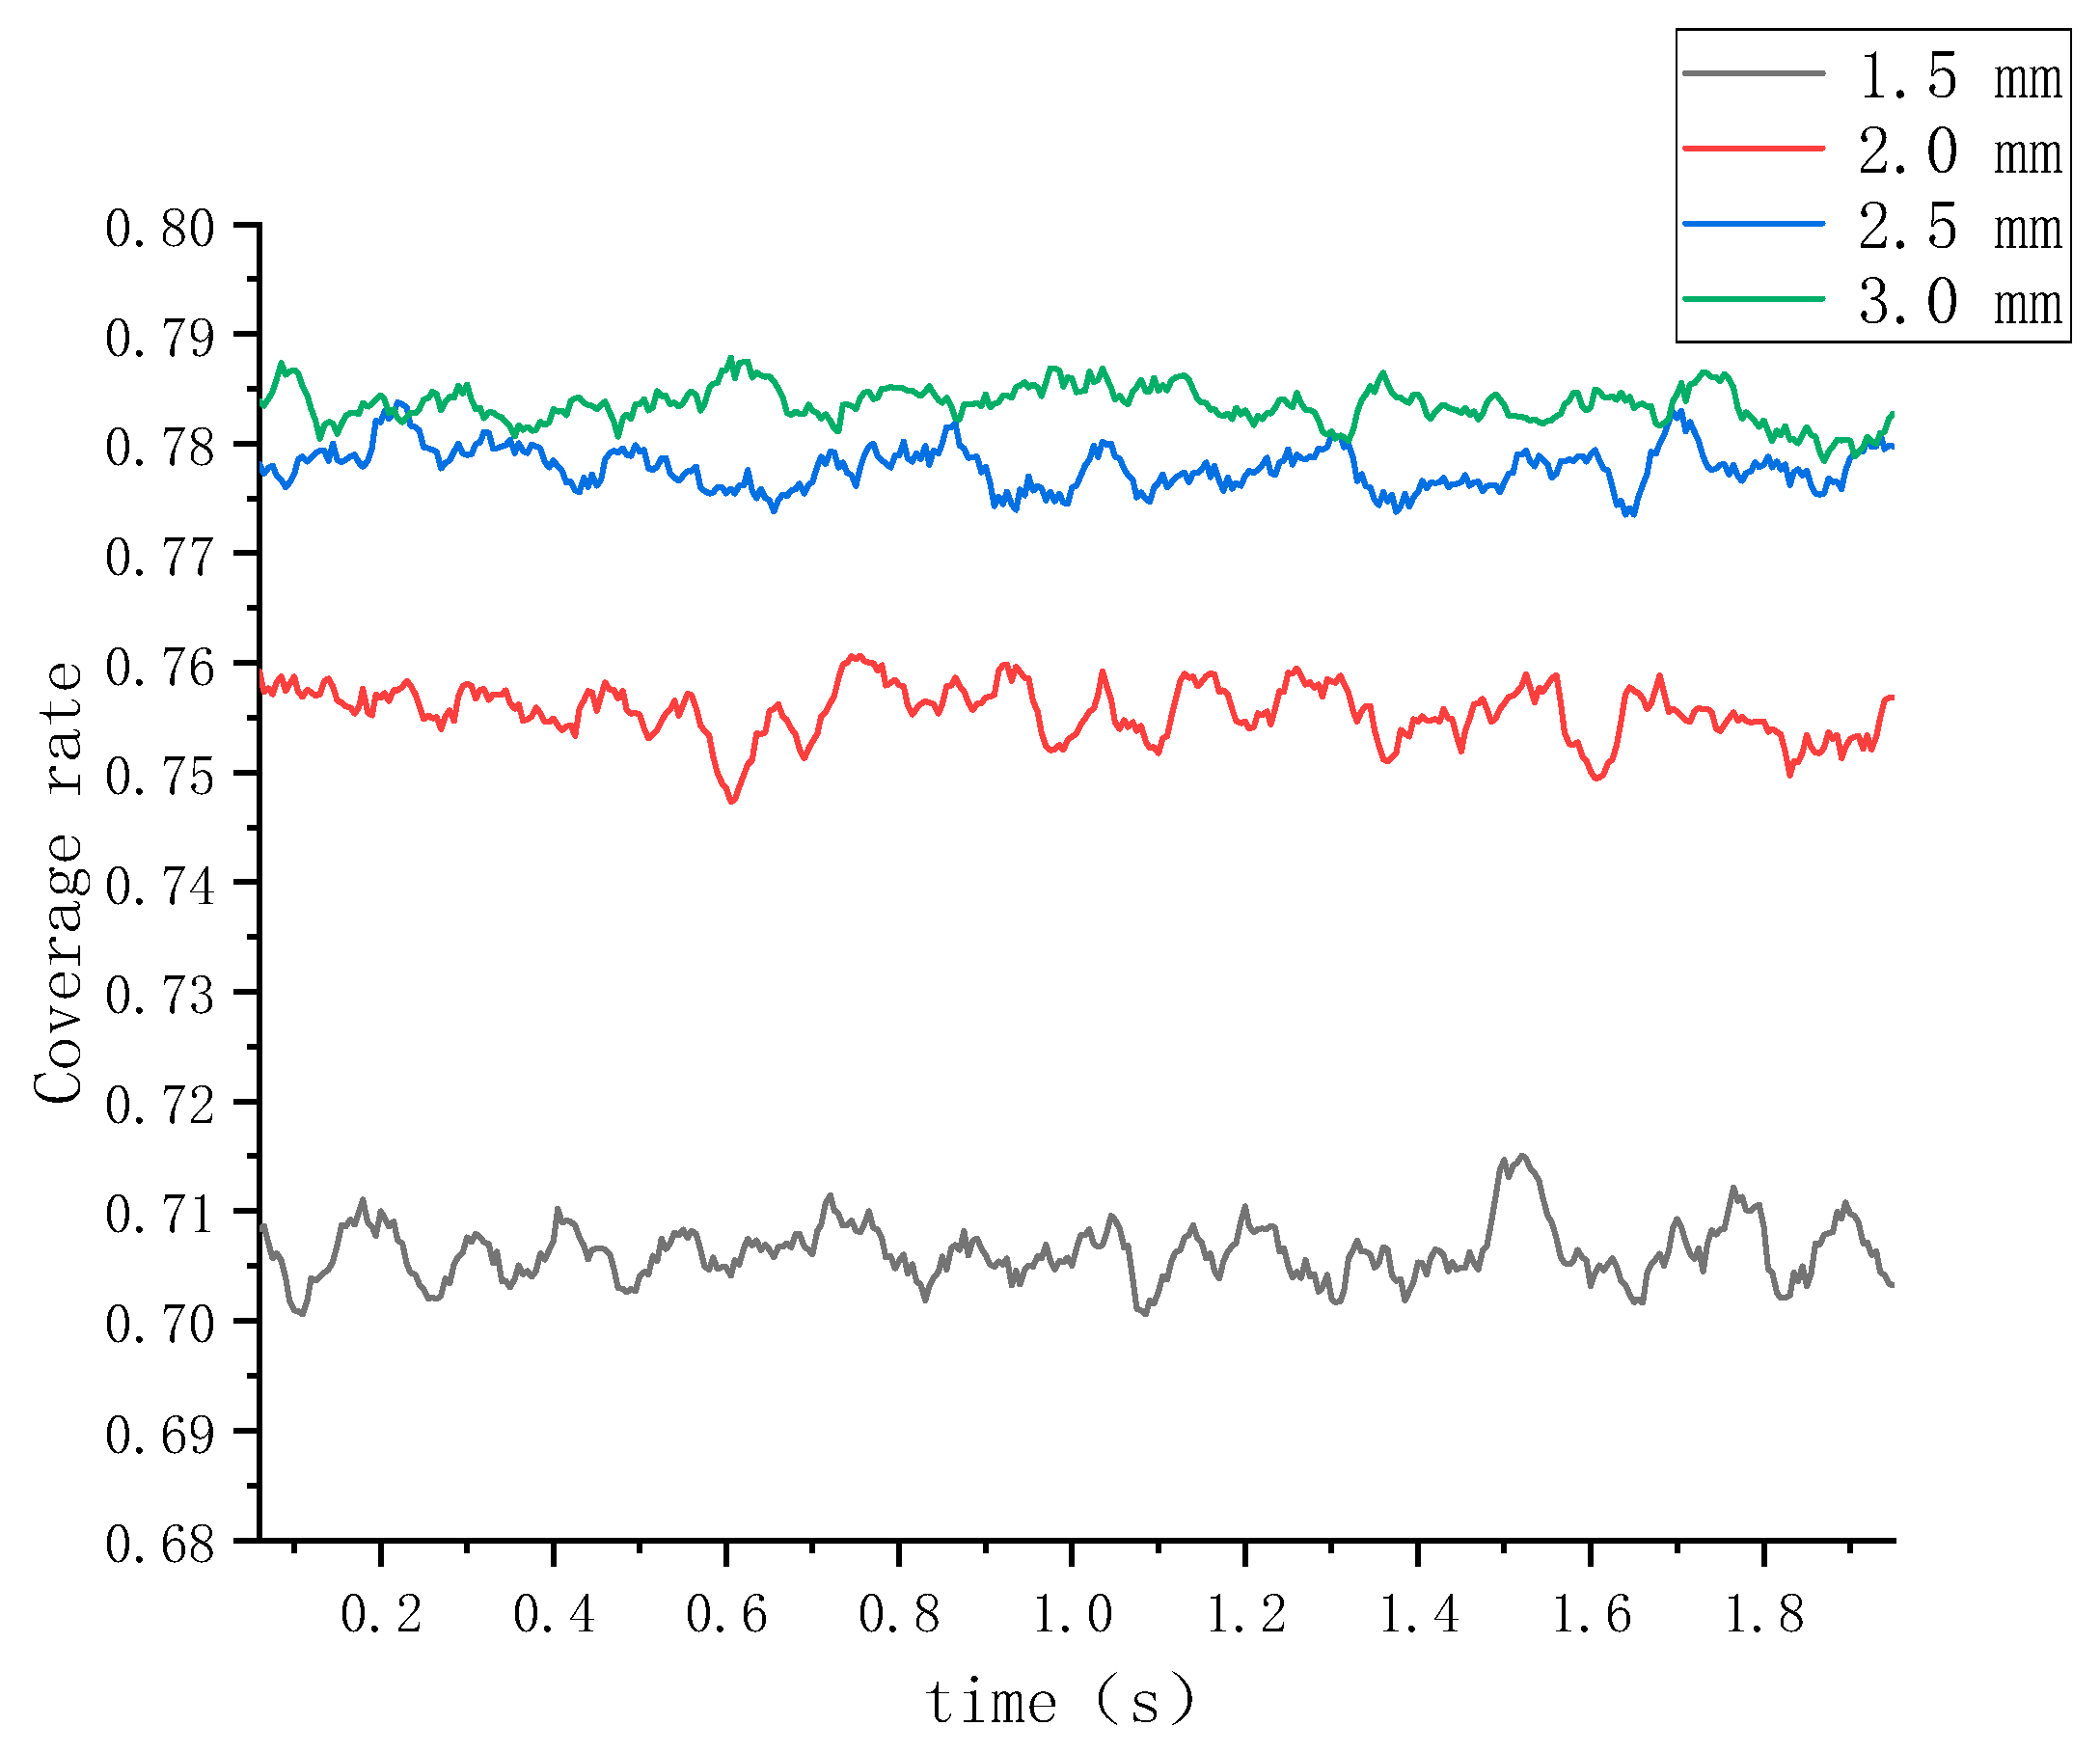
(1) According to the results of this study, the transmission gear fluid coverage and convective heat transfer coefficient for large and small gears rotating at high speeds follow the same pattern for different injection diameters: gear lubrication effectiveness increases with increasing injection diameter.
(2) The increase in fluid coverage and convective heat transfer coefficient is quite significant when the injection diameter increases to 2.0 mm. The growth in both was substantially slower when the diameter was increased to 2.5 mm. As the incident diameter increased, the liquid coverage and convective heat transfer coefficients remained virtually flat. This means that when the injection diameter reaches a critical value, the surface area of the fluid in contact with the gear is maximized, but further increases in the injection diameter will not improve the lubrication effect, and will only increase the load on the lubrication system without providing significant assistance.
(3) The injection diameter is the characteristic with the largest impact on the lubricating effect, according to data analysis. When the diameter of the liquid injection is increased, the liquid-generated torque overcome by the gear during the lubrication process increases significantly. The gear lubrication effect and heat dissipation capacity are correspondingly improved. In this sequence, rotational speed, incidence distance and incidence angle all have progressively less significant impact on gear lubrication.
(4) In summary, the optimum combination of parameters for lubricant utilisation in high-speed rotating gears is as follows: injection distance 3.5 cm, injection angle 90°, injection diameter 2.0 mm and gear speed 2000 r/min, i.e., optimum lubricant utilisation for gear injection lubrication under the aforementioned operating conditions.

Author Contributions

Methodology, Q.Y.; Software, T.Z.; Investigation, J.L.; Resources, Y.A.; Writing—original draft, T.S.; Writing—review & editing, Z.Z. All authors have read and agreed to the published version of the manuscript.

Funding

Science and technology development plan project of Jilin province No. 20220201056GX and 20220201036GX, Science and technology research project of Jilin Provincial Department of Education No. JJKH20220734KJ.

Conflicts of Interest

The authors declare no conflict of interest.

References

  1. Kewat, P. Performance Testing of Gear Lubricants and Methods of Improving Gear Surfaces and Gear Lubricants—A Review. Adv. Sci. 2018, 10, 268–272. [Google Scholar] [CrossRef]
  2. Li, K.; Chen, G.; Liu, D. Study of the influence of lubrication parameters on gear lubrication properties and efficiency. Ind. Lubr. Tribol. 2016, 68, 647–657. [Google Scholar] [CrossRef]
  3. Seetharaman, S.; Kahraman, A. A windage power loss model for spur gear pairs. Tribol. Trans. 2010, 53, 473–484. [Google Scholar] [CrossRef]
  4. Voeltzel, N.; Marchesse, Y.; Changenet, C.; Ville, F.; Velex, P. On the influence of helix angle and face width on gear windage losses. Proc. Inst. Mech. Eng. Part C J. Mech. Eng. Sci. 2016, 230, 1101–1112. [Google Scholar] [CrossRef]
  5. Fernandes, C.M.; Rocha, D.M.; Martins, R.C.; Magalhães, L.; Seabra, J.H. Finite element method model to predict bulk and flash temperatures on polymer gears. Tribol. Int. 2018, 120, 255–268. [Google Scholar] [CrossRef]
  6. Mohammadpour, M.; Theodossiades, S.; Rahnejat, H.; Dowson, D. Non-Newtonian mixed thermo-elastohydrodynamics of hypoid gear pairs. Proc. Inst. Mech. Eng. Part J J. Eng. Tribol. 2018, 232, 1105–1125. [Google Scholar] [CrossRef]
  7. Massini, D.; Fondelli, T.; Andreini, A.; Facchini, B.; Tarchi, L.; Leonardi, F. Experimental and Numerical Investigation on Windage Power Losses in High Speed Gears. J. Eng. Gas Turbines Power 2018, 140, 82508. [Google Scholar] [CrossRef]
  8. Ruzek, M.; Ville, F.; Velex, P.; Boni, J.-B.; Marchesse, Y. On windage losses in high-speed pinion-gear pairs. Mech. Mach. Theory 2019, 132, 123–132. [Google Scholar] [CrossRef]
  9. Andersson, M.; Sosa, M.; Olofsson, U. Efficiency and temperature of spur gears using spray lubrication compared to dip lubrication. Proc. Inst. Mech. Eng. Part J J. Eng. Tribol. 2017, 231, 1390–1396. [Google Scholar] [CrossRef]
  10. Dai, Y.; Wu, W.; Zhou, H.B.; Zhang, J.; Ma, F.Y. Numerical Simulation and Optimization of Oil Jet Lubrication for Rotorcraft Meshing Gears. Int. J. Simul. Model. 2018, 17, 318–326. [Google Scholar] [CrossRef]
  11. Chang, L.; Yu, Q.; Jeng, Y.-R. Modeling and Analysis of High-Load and High-Speed Involute Spur Gear Systems in Adverse Lubrication. Tribol. Trans. 2018, 61, 325–334. [Google Scholar] [CrossRef]
  12. Gan, L.; Xiao, K.; Wang, J.; Pu, W.; Cao, W. A numerical method to investigate the temperature behavior of spiral bevel gears under mixed lubrication condition. Appl. Therm. Eng. 2019, 147, 866–875. [Google Scholar] [CrossRef]
  13. Croccolo, D.; De Agostinis, M.; Olmi, G.; Vincenzi, N. A Practical Approach to Gear Design and Lubrication: A Review. Lubricants 2020, 8, 84. [Google Scholar] [CrossRef]
  14. Ouyang, T.; Huang, G.; Chen, J.; Gao, B.; Chen, N. Investigation of lubricating and dynamic performances for high-speed spur gear based on tribo-dynamic theory. Tribol. Int. 2019, 136, 421–431. [Google Scholar] [CrossRef]
  15. Koshizuka, S.; Oka, Y. Moving-particle semi-implicit method for fragmentation of incompressible fluid. Nucl. Sci. Eng. 1996, 123, 421–434. [Google Scholar] [CrossRef]
  16. Khayyer, A.; Gotoh, H. Modified moving particle semi-implicit methods for the prediction of 2D wave impact pressure. Coast. Eng. 2009, 56, 419–440. [Google Scholar] [CrossRef]
  17. Quincey, D.J.; Luckman, A. Progress in satellite remote sensing of ice sheets. Prog. Phys. Geogr. 2009, 33, 547–567. [Google Scholar] [CrossRef]
  18. Rukauskas. Convective Heat Transfer in a Heat Exchanger; Science Press: Beijing, China, 1986. [Google Scholar]
  19. Yang, S.; Tao, W. Heat Transfer; Science Press: Beijing, China, 1998. [Google Scholar]
Figure 1. Three-dimensional view of the drive gear.
Lubricants 11 00366 g001
Figure 2. Cloud map of coverage at different incident diameters. (a) The incident diameter of 1.5 mm. (b) The incident diameter of 2.0 mm. (c) The incident diameter of 2.5 mm. (d) The incident diameter of 3.0 mm.
Lubricants 11 00366 g002
Figure 3. Coverage curves for different incident diameter.
Lubricants 11 00366 g003
Figure 4. Cloud map of HTC distribution at different incidence diameters. (a) The incident diameter of 1.5 mm. (b) The incident diameter of 2.0 mm. (c) The incident diameter of 2.5 mm. (d) The incident diameter of 3.0 mm.
Lubricants 11 00366 g004aLubricants 11 00366 g004b
Figure 5. HTC curves for different incidence diameters.
Lubricants 11 00366 g005
Figure 6. Cloud map of the distribution of different incident diameter coverage. (a) The incident diameter of 1.5 mm. (b) The incident diameter of 2.0 mm. (c) The incident diameter of 2.5 mm. (d) The incident diameter of 3.0 mm.
Lubricants 11 00366 g006aLubricants 11 00366 g006b
Figure 7. Plot of coverage at different injection distances.
Lubricants 11 00366 g007
Figure 8. Cloud map of HTC distribution for different incident diameters. (a) The incident diameter of 1.5 mm. (b) The incident diameter of 2.0 mm. (c) The incident diameter of 2.5 mm. (d) The incident diameter of 3.0 mm.
Lubricants 11 00366 g008
Figure 9. Plot of HTC at different incidence diameters.
Lubricants 11 00366 g009
Figure 10. Experimental platform display diagram (a) The physical view of the test stand, (b) the 3D diagram of the test stand. (c) Overall schematic diagram of gearbox. (d) Top view of gearbox.
Lubricants 11 00366 g010
Figure 11. Control system main page.
Lubricants 11 00366 g011
Figure 12. Original test data: (a) Test #1, (b) Test #2, (c) Test #3, (d) Test #4, (e) Test #5, (f) Test #6, (g) Test #7, (h) Test #8, (i) Test #9, (j) Test #10, (k) Test #11, (l) Test #12, (m) Test #13, (n) Test #14, (o) Test #15, (p) Test #16.
Lubricants 11 00366 g012aLubricants 11 00366 g012b
Figure 13. Plot of torque variation for the jet wet test.
Lubricants 11 00366 g013
Figure 14. Mean main effects graph.
Lubricants 11 00366 g014
Figure 15. Torque residual graph.
Lubricants 11 00366 g015
Figure 16. Scatterplot of residuals with each factor. (a) Residuals from incident distance. (b) Residuals from incident angle. (c) Residuals from incident diameter. (d) Residuals from rotational speed.
Lubricants 11 00366 g016
Figure 17. The comparison of measured and predicted torque values.
Lubricants 11 00366 g017
Table 1. Specific parameters for large and small gears.
NameLarge GearsSmall Gears
MaterialsThe 45 steelThe 45 steel
Number of gears4235
Modulus33
Pressure angle20°20°
gear width15 mm15 mm
Diameter of the indexing circle126 mm105 mm
Table 2. Gear spray lubrication torque statistics table.
No.0102030405060708
Torque
(N·m)
0.020870.037730.075730.14030.02910.03220.054670.07227
No.0910111213141516
Torque
(N*m N·m)
0.06680.11720.034130.023530.109530.034930.02920.0265
Table 3. Orthogonal polar variance analysis table.
No.The Simulation ConditionsValidation Indicators
Incident Distance (cm)Incidence Angle (°)Incident Diameter (mm)Rotational Speed (rpm)Torque (N·m)
13601.520000.02087
2375230000.03773
33902.540690.07573
43105350000.1403
53.560240690.0291
63.5751.550000.0322
73.590320000.05467
83.51052.530000.07227
94602.550000.0668
10475340690.1172
114901.530000.03413
124105220000.02353
134.560330000.10953
144.5752.520000.03493
154.590250000.0292
164.51051.540690.0265
Kj10.068660.056580.029890.03350
Kj20.047060.055520.028420.06342
Kj30.060420.048430.062430.06213
Kj40.050040.065650.105430.06713
Ri0.021600.017220.077000.03363
Rank3412
Table 4. Orthogonal polar variance analysis table.
SourceFreedomAdjSSAdjMSF-Valuep-Value
Incident distance30.0011760.0003922.150.273
Incidence angle30.0005990.0002001.100.471
Incident diameter30.0157000.00523328.710.010
Rotational speed30.0028860.0009625.280.103
Error30.0005470.000182
Total150.020908
S = 0.0135017R-sq = 97.38%R-sq (adjusted) = 86.92%
Table 5. Regression analysis table.
ItemCoefficientCoefficient Standard
Error
T-Valuep-ValueVariance Inflation Factor
Constants−0.02870.0234−1.220.246
Incident distance−0.004250.00457−0.930.3721.00
Angle of incidence0.002010.004570.440.6681.00
Incident diameter0.026350.004575.770.0001.00
Rotational speed0.009960.004572.180.0521.00
Table 6. Torque prediction table.
NumberTorquesPredicted Fitted ValuesFitting Standard Errors95% Confidence Interval95% Predicted Interval
10.027730.0247800.0151122(0.020563, 0.029861)(0.017986, 0.034140)
20.046660.0462050.0097311(0.040976, 0.052102)(0.034681, 0.061559)
30.085660.0861560.0097311(0.076406, 0.097151)(0.064668, 0.114785)
40.189300.1606510.0151122(0.133314, 0.193593)(0.116606, 0.221333)
50.053840.0577210.0097311(0.051188, 0.065087)(0.043325, 0.076901)
60.032300.0391660.0118007(0.033858, 0.045307)(0.029059, 0.052790)
70.081530.0932510.0118007(0.080612, 0.107873)(0.069186, 0.125687)
80.057260.0632750.0097311(0.056114, 0.071350)(0.047493, 0.084301)
90.118500.1110080.0118007(0.095962, 0.128414)(0.082361, 0.149621)
100.141700.1410970.0097311(0.125128, 0.159103)(0.105905, 0.187982)
110.026460.0237490.0097311(0.021061, 0.026779)(0.017825, 0.031640)
120.029400.0301860.0118007(0.026094, 0.034919)(0.022396, 0.040685)
130.128860.1201500.0135579(0.101636, 0.142037)(0.088154, 0.163760)
140.054200.0555730.0118007(0.048041, 0.064287)(0.041232, 0.074904)
150.050300.0553200.0118007(0.047821, 0.063993)(0.041043, 0.074562)
160.028700.0255870.0135579(0.021644, 0.030248)(0.018773, 0.034874)
Disclaimer/Publisher’s Note: The statements, opinions and data contained in all publications are solely those of the individual author(s) and contributor(s) and not of MDPI and/or the editor(s). MDPI and/or the editor(s) disclaim responsibility for any injury to people or property resulting from any ideas, methods, instructions or products referred to in the content.

