Abstract
The appearance of fretting fatigue cracks in bolted sheets limits their lifetime. Furthermore, repairing these failures requires much effort due to needing to replace the components instead of replacing just the bolt. To prevent such failures, the purpose of this study is to understand the failure mechanism and to identify the major influencing parameters. Therefore, a representative joint of a bolt of size M22 and sheet material were investigated by experiments and a finite element analysis. The experiments were conducted over a wide range of preloads from zero to maximum preload. It turned out that the failure mode changes at 50 kN. For this preload, the influence of the surface and the use of a lubricant was observed. A grinded surface as well as the use of lubricant showed a change in the failure mode. The accompanying simulation showed that an analysis of the stresses delivers no proper explanation for the observed effects in the experiment. Therefore, the contact status was analyzed for various preloads and friction coefficients. The results correlate with the change in the failure mode. The conclusion is that both the stress state and the tribological behavior influence the failure mode and have to be considered in a numerical analysis.
1. Introduction
Joining dissimilar materials, creating a repair-friendly assembly, and transferring high loads are the most popular advantages of bolt joints. Hence, bolted joints are widely used in nearly all fields of engineering. Especially in mechanical engineering, they represent an appropriate method for creating a product assembled out of various components. Due to their intensive use, fatigue failures should be avoided. Commonly, the failure of the bolt itself represents the typical fatigue failure of the bolt joint, but in some cases, a fatigue crack is initiated in the bolted components. Nevertheless, this is quite critical due to the fact that it is much more difficult to replace the components versus replacing just the bolt. Therefore, this study investigates the fatigue crack initiation in bolted sheet metal. Such fatigue cracks can arise, for example, at wheel flanges near the bolt joint, as shown by Knothe et al. [1]. A similar failure scenario is shown by Wöllner et al. [2], where the authors describe the fatigue crack nucleation in agricultural rims. It is observed that the fatigue crack starts in the region of the bolt joint. Moreover, many more laboratory studies describe the fatigue crack initiation of bolt joints. Benhamena et al. [3] observed sheets made of aluminum and bolts with a nominal diameter of 10 mm and preloads up to 10 kN. They concluded that an increase in the preload increases the cycles until fatigue crack initiation or, in other words, increases the lifetime. They also pointed out that for a low preload, the crack starts at the borehole and for a high preload, in the contact zone between the sheet and the nut. Similar findings are presented by Chakherklou et al. [4,5] and Esmaeili et al. [6] for sheets made of aluminum 7075-T6 and a bolt with a nominal diameter of 5 mm. Peña et al. present results for a single-lap joint with a bolt size of M16 and sheets made of HSS 500MC in [7], where they also found an extension of the lifetime with an increasing preload. Their numerical analysis results showed that only the model of Ruiz et al. [8] was able to predict the fatigue crack initiation location. Juoksukangas et al. [9] developed an apparatus to study single bolted joints according to their fretting fatigue life. They used M8 bolts in combination with a quenched and tempered steel sheet material. The preload was varied between 20 kN and 30 kN in combination with a variation of bulk stresses in the range of 130 N/mm² to 205 N/mm². They concluded that fretting fatigue life decreases with increasing bulk stress and increasing preload. Chakherlou et al. [10] investigated a double-shear lap joint. Overall, they also found that an increase in preload increases fatigue life. Jayaprakash et al. [11] analyzed for bolt junctions of size M22 the effect of a groove at the edge of the contact zone. They concluded that the groove improves the fretting fatigue strength. The effect of oil lubrication on aluminum alloy 2024-T3 double-shear lap joints was investigated by Chakherlou et al. [12]. The fatigue tests were conducted without any preload on the bolt of size M6. They concluded that the lubricant leads to a greater fatigue life. The increase in fatigue life depends on the friction coefficient of the oil, whereas a smaller friction coefficient leads to a greater fatigue life. Oskouei and Ibrahim [13] performed tests with double-lap joints made out of Al 7075-T6 with bolts of size M5. Their motivation was to study the effect of Ni-P coatings on the fretting fatigue life for different preloads. The results show, for two different preloads, that low preloads promote a crack initiation at the edge of the borehole and high preloads on the contacting surface. The use of the electroless NI-P coating offers a higher fatigue life for a firm preload. Sun et al. [14] used the results of Oskouei and Ibrahim [13] as validation data for their continuum damage mechanics-based approach of fretting and fatigue life. They developed a model for the fatigue life based on the Chaboche plasticity constitutive model [15] and nonlinear kinematic hardening model [16]. The fretting fatigue life was modelled based on Ruiz Criterion [8]. They stated that the minimum life values of these models are the predicted cycles to failure. Finally, they concluded a good agreement of the fatigue life in correlation with the experiments. Venugopal et al. [17] compared different simplifications of finite element models of fretting fatigue in high strength steel bolted connections. They figured out that the maximum stress and strain amplitudes are essential for their investigated joint of size M16. Hence, a shell model is sufficient. However, they also stated that only a solid model can provide the full spectrum of information like contact status, slip, and stress distribution. A more detailed literature overview of fretting fatigue of bolted joints is given by Croccolo et al. [18,19]. Szlosarek and Kröger present investigations of the fatigue crack initiation in sheets made of S355MC and a bolt of nominal size of 22 mm in [20]. They figured out that the fatigue life depends strongly on the preload of the bolt. The shortest lifetime was measured for low preloads. Thereby, the crack started at the borehole of the bolt, as it can be observed, for the fatigue crack initiation of a plate with an open hole due to fluctuating tensile force. The lifetime increased with increasing preload until a particular threshold value was reached. At this value, the crack initiation location undergoes a change from the edge of the borehole to the contact pressure zone between the nut and the sheet. In parallel, the lifetime did not increase with the preload as it was found out for preloads lower than the threshold. In [21], Szlosarek and Kröger attempted to understand this phenomenon by numerical simulations. The results of the fatigue analysis by using the critical plane approach [22] and the damage model of Smith, Watson, and Topper (SWT model) [23] did not match the experimental results in terms of lifetime and crack initiation location. Hence, the authors concluded that it is mandatory to include the influence of the tribological behavior to the damage model.
This challenge establishes the beginning point for this investigation. Therefore, in this work we investigate in detail when the failure mode changes due to preload. In combination with the results of [20], the novelty of this study is test results over a wide range of preloads. As a result, the preloads vary from zero to the highest value that the bolt can tolerate. Above all, the current paper determines at which preload the failure mode changes. A pure fatigue-based damage model seems to be insufficient to make a sufficient numerical prediction of the crack initiation location and the numbers of load cycles to crack. Therefore, novel tests were carried out in which the initial stress state is the same but the tribological conditions were varied. A numerical analysis of the experiments will highlight the stress state and contact status.
2. Materials and Methods
2.1. Experimental Setup
Figure 1 depicts the test specimen as well as the test setup. The sheets are made out of the structural steel S355MC (material number 1.0976). A static tensile test showed a yielding limit of about 370 N/mm² and an ultimate strength of about 560 N/mm². The elongation at the fracture of the sheet material was measured at 19%. The sheets are 5 mm thick, and the surface was not modified. Hence, the hot-rolled surface was used as-built. The contour of the sheet was manufactured by a milling process. Clamping devices fixed the sheet on both sides to apply the fluctuating tensile force. The tests were performed with a load ratio of 0.1 and a frequency of 12 Hz using a sinusoidal signal. For the force-controlled test, a minimum force of 13 kN and a maximum force of 130 kN was used. The bolt joint is designed to resemble the joint between the hub and the rim of a tractor. Thus, a hex-head bolt of nominal diameter of 22 mm, a pitch of 1.5 mm with a metric thread, and strength grade 10.9 was used. The borehole has a diameter of 24 mm and chamfers of 1 mm × 45°. The utilized nut has a pressure disk in reference to standard DIN 74361-3 [24]. The nut and the bolt are burnished. The bolt was instrumented with strain gauges. Therefore, the preload of the bolt was measured at the beginning of the test and during the whole test run. The spacer between the head of the bolt and the sheet was implemented with the aim to design the stiffness ratio between bolt and component as close to the reference bolt joint as possible.
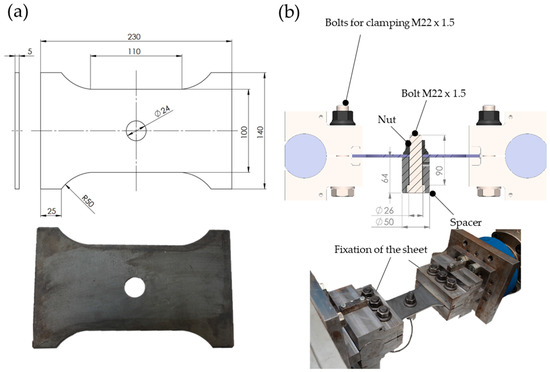
Figure 1.
Used specimen and test setup: (a) Drawing and photograph of the test specimen with dimensions in mm; (b) Used test setup for cyclic loading.
Figure 2 shows a section view of the tribological system. The scheme highlights some important details that can influence the results. The pressure disk of the nut must ideally not be plain in the contact zone. The standard DIN 74361-3 [24] provides a valid range of max 2° for the angle. Measurements with the tentative measurement machine Hexagon TIGO reached the conclusion that the zone for the used nut is nearly perfectly plain without any angle. The figure also depicts the contact zones of the nut and the spacer. They are concentric and on opposite sides. The preparation of each test consists of fixing the sheet in the clamping devices at both ends and attaching the bolt. The initial preload of the bolt was observed with the strain gauge measurement. Tests were performed without any lubricant between the pressure disk and the sheet and using the lubricant Molykote G-Rapid-Plus. Furthermore, sheets with surfaces in an as-built and in a grinded condition were tested.
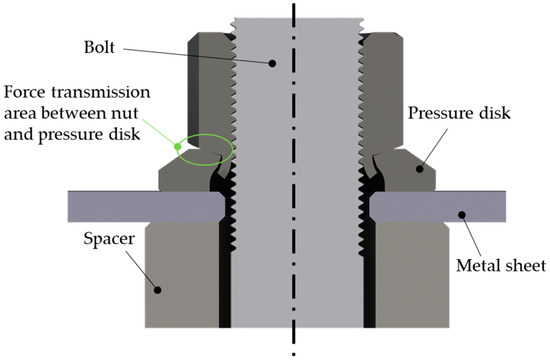
Figure 2.
Scheme of the tribological system.
2.2. Finite Element Model
Figure 3 depicts a simplified version of the experimental setup which was used for the numerical analysis. The finite element solver Optistruct 2021.2 of the company Altair was used to perform the analysis. The clamping at the left and right end was modelled by simplified boundary conditions due to the fact that only the region near the bolt is of interest. All nodes of the left front surface are fixed in all degrees of freedom. The nodes of the right front surface are combined to a rigid body. The cyclic force acts at the reference node of the rigid body at which just the horizontal degree of freedom is free. The pressure disk, the sheet, and the spacer are meshed by linear hexahedron elements with a size between 0.5 mm and 1 mm. The results of the mesh quality check are presented in Table A4. The material of the sheet, the nut, and the spacer are modelled by an elastic material model with a Young’s modulus of 210 GPa and a Poisson’s ratio of 0.3. Presimulations showed that the use of an elastic-plastic material model leads to a non-convergent result, which cannot be analyzed.
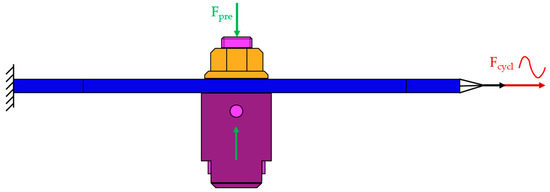
Figure 3.
Scheme of the finite element model.
The contacts between disk and sheet as well as between sheet and spacer are modelled via a surface-to-surface contact, as it is already implemented in the solver. This type of contact was selected due to its typical behavior of generating a smoother contact pressure distribution. The contact stiffness of the penalty contact is determined by the solver due to the stiffness of the surrounding elements. The contact stiffness is kept constant during the run. The solver uses the isotropic Coulomb friction model, which is implemented as Figure 4 shows. A sudden turn from zero tangential slip to a sliding after reaching the static friction limit would lead to convergence problems. Hence, the friction model is implemented in a way that there is also minimal sliding during sticking contact while the transverse force increases with the sliding distance. The slope of this curve is determined by the static friction coefficient and a computed stiffness. Thus, the transverse frictional force increases with the sliding distance. After reaching the static frictional limit, it switches to the constant kinetic frictional force. The model used needs a static and dynamic coefficient of friction as user input.
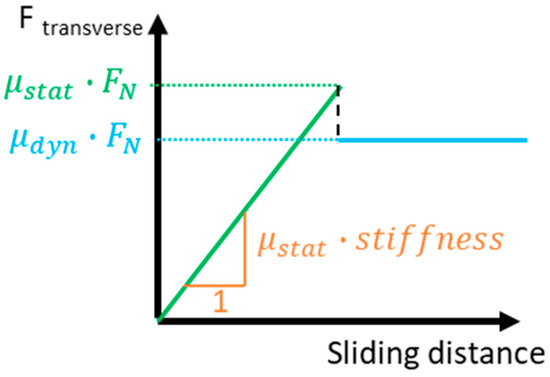
Figure 4.
Implementation of friction in the FEA solver Optistruct.
The preload of the bolt is modelled as the initial step of the simulation, see Figure 5. Thus, the bolt is preloaded, and the contact pressure is formed, which is in accordance with the real fixation process. Afterwards, the preload is constant. In the subsequent simulation steps, the cyclic load fluctuates between 13 kN and 130 kN. Due to the constant direction of the cyclic force, it can be expected that a continuous sliding process will occur, and each contact situation differs from the previous one. Hence, the tension cycle with 13 kN to 130 kN has to be applied several times until a stationary condition is reached. It turned out that a stationary condition is reached to a satisfactory degree after three cycles. The finite element analysis (FEA) provides the results for the local distribution of contact force and contact pressure as well as local stresses and strains.

Figure 5.
Simulation steps.
3. Results
3.1. Experimental Results
Figure 6 shows an overview of all test results as an extension of the already published measurement data of Szlosarek and Kröger [20,21]. The diagram depicts the load cycles to crack in combination with the applied preloads of the bolt. Moreover, the symbols indicate if the fatigue crack started at the borehole or in the contact zone between pressure disk and sheet. The load cycles to crack were determined by the criteria of a stiffness reduction of 1% as a result of the crack initiation in a post-processing routine by analyzing the signals of the force and the displacement of the actuator. The detailed numbers of load cycles to failure are listed in the Appendix A, Table A1. For all specimen, the surface of the sheet was as-built, no lubricant was used, and all tests were conducted with the same nut and pressure disk, respectively. The results show that the load cycles to failure increase with an increasing preload. The lowest number of cycles was reached for tests without any bolt (preload of 0 kN) with about 30,000–60,000 cycles. The load cycles increase with the preload up to a preload of 30 kN. Afterwards, most of the results reached between and cycles. An exciting observation is that the crack initiation location changes between 40 kN and 50 kN. The results show crack initiations at the borehole as well as in the contact zone for a preload of 40 kN. For 50 kN, the majority of the tests show a crack initiation in the contact zone. This indicates that the crack initiation location changes between a preload of 40 kN and 50 kN. Figure 6 depicts one representative example for each crack initiation mode. Additional photographs of tested specimen for various preloads and for both sides of the sheet are presented in [20]. The crack initiation at the borehole is shown for a preload of 30 kN. The failure mode is similar to a fatigue crack of a plate with open hole under fluctuating tensile force, e.g., for the preload of 50 kN, the crack starts in the contact zone between the nut and the sheet and propagates away from the contact pressure zone. Hence, from the viewpoint of fretting fatigue this is an interesting test setup to gain new knowledge.
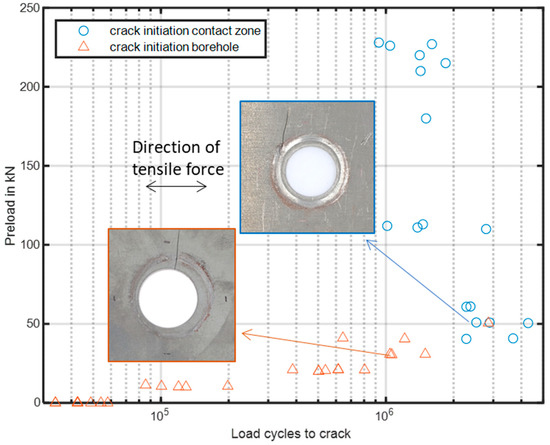
Figure 6.
Test results as load cycles to crack in dependency of the bolt preload.
Tests with the preload of 50 kN were conducted under different tribological conditions to carve out the influencing factors. The motivation was to determine if it is possible to change the crack initiation location back to the borehole by modifying the tribological system. The detailed results are presented in the Appendix B, Table A2. Photographs of one representative test result for each modification are shown in Table A3. Figure 7 depicts a diagram of the measured data. The diagram has two legends. The color of the marker indicates the test setup, and the interior color filling indicates the location of crack initiation. The tests with the as-built surface and without lubricant are the reference tests (blue circles). The first variation was to modify the surface of the specimen by grinding (red triangles). For this purpose, the specimens were grinded in seven steps starting with a granularity of 60 and ending with a granularity of 800, with 5 min of grinding time per step. Due to the grinding, the oxide layer was eliminated, and the surface properties were changed. A confocal microscope MarSurf CM explorer was used to characterize the surface roughness. For the as-built condition, a maximum peak-to-valley height of the surface and the areal average roughness were measured. The grinded surface was characterized with and . The fatigue results for this modification are not uniform. One test showed a crack at the borehole, two tests a crack initiation in the contact pressure zone, and one test is a runout. Runout denotes the termination of the test after cycles without showing a crack initiation. Another modification was the use of a lubricant between the pressure disk and the sheet and between the spacer and the sheet (orange squares). The lubricant G-RAPID-PLUS of the company Molykote was used in the contact zone, which is a solid lubricant based on mineral oils. The layer lattice structure of the lubricant should enable relative motion under high contact pressure. The results of this modification show a crack initiation at the borehole for the majority of tests. One test was a runout. As a first finding it can be stated that a change in the tribological conditions changes the results in terms of the crack initiation location and the load cycles to crack.
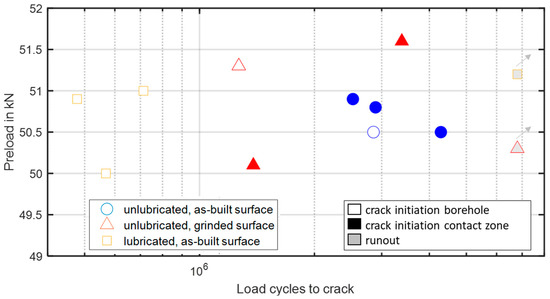
Figure 7.
Test results for various test modifications with the preload of 50 KN.
3.2. Numerical Results
The use of the numerical model is to help understand the experimental observations. Hence, the numerical results should be analyzed according to output values that are crucial for crack initiation to highlight differences between the different versions. The initial step is the analysis of the stress situation. At first, simulations were conducted with different preloads. This represents the experimental data with the as-built surface und unlubricated contact zone. The static coefficient of friction was set to 0.15 referring to Fernando and Saman [25] and the standard for bolt joints VDI2230 [26]. Other references like Nesládek et al. [27] or Mäntylä et al. [28] provide much higher values. Due to this wide range of values, accompanying tests were conducted within this research work. Therefore, a screw-in test was performed using nuts of the same size without a pressure disk. The torque and preload of the bolt was measured during the test. Via the function of the torque with dependency on the preload, it was possible to determine the coefficient of friction between nut and sheet. The thread was lubricated with a known coefficient of friction of 0.1. The dynamic coefficient of friction could not be measured. Usually, it is lower than the static one. Therefore, it was set to 0.14. The fatigue of metals under pure mechanical loading is sensitive to stress amplitudes. Therefore, the stress amplitude in the last simulated cycle will be analyzed. This was performed by forming the differences of the stresses of the last cycle and halving them. Figure 8 shows the simulations results for the preloads of 20 kN, 40 kN, 50 kN, 60 kN, and 80 kN. The maximum value of the stress amplitude is always at the borehole. The value decreases with an increasing preload.
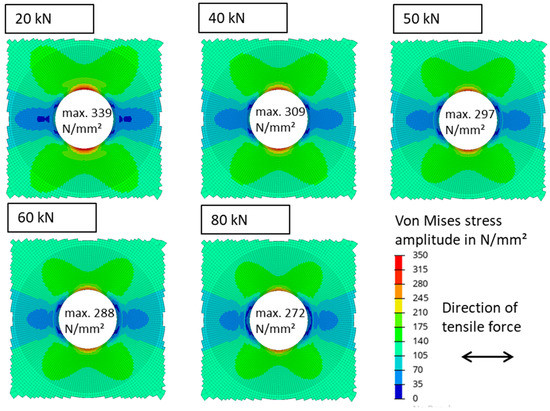
Figure 8.
Numerical results of the von Mises stress amplitude for various preloads.
Figure 9 depicts an equal study with a variation in the friction coefficients. The stress distribution appears more or less equal for each friction coefficient. The maximum stress amplitude is always at the borehole. It decreases with an increasing coefficient of friction. Additionally, one combination of extreme values for the preload (Fpre = 200 kN) and the coefficient of friction () was analyzed. Similar to the previous results, the maximum von Mises stress amplitude is located at the borehole.
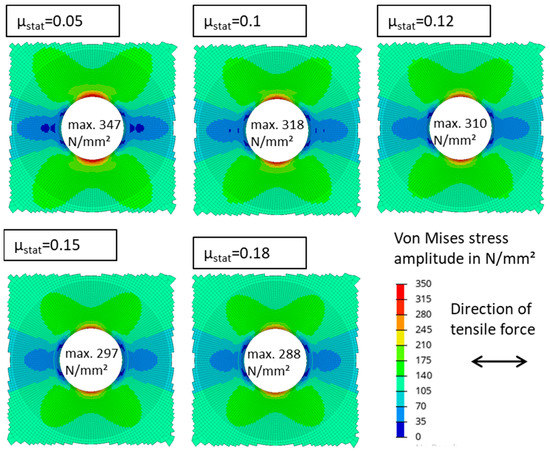
Figure 9.
Numerical results of the von Mises stress amplitude for various friction coefficients.
Figure 10 presents a more detailed evaluation of the stress state for three representative elements. One element is located at the borehole (E1), one at the surface in the zone of maximum contact pressure (E2), and one at the surface in the contact zone; crack initiation was primarily observed in the fatigue tests (E3). A setup with a preload of 50 kN and a static friction coefficient of 0.15 is evaluated. Figure 10a shows the maximum absolute principal stress after preloading in the sheet material for the nut-facing side. It is noticeable that the compressive stress in the contact zone is distributed nonuniformly. The explanation for this phenomenon is shown in Figure 2. The force transmission area between the nut and pressure disk is located more towards the inner circle of the pressure disk. Hence, the pressure disk becomes deformed in a nonuniform way. Figure 10b shows the principal stress tensor for the three representative elements under a tension force of 13 kN. The element at the borehole E1 shows a nearly plain stress situation where almost all stresses are positive. The principal stresses for the element in the contact pressure zone E2 are all negative. The tensor shows a multiaxial stress state. The minor stress is directed in the through thickness direction of the sheet. The element E3 in the fretting area shows a plain stress situation with the predominant direction of the major principal stress (P1) in the direction of the tensile force. Figure 10c depicts the principal stress tensor for a tensile force of 130 kN. Element E1 still shows a plain stress state, whereas the value for P1 increases to 549 N/mm². This value is feasible due to the pure elastic modelling of the material. Calculating the amplitude of P1 leads to a value of 225.5 N/mm². The orientation of the principal stress tensor does not change. This is evidence of a proportional loading of the element. For element E2, the stress P1 changes from tension to compression. The stress amplitude is about 155 N/mm². The minor stresses are nearly constant with the dominant compressive stress in thickness direction and through persisting orientation. The principal stress tensor of element E3 also shows a constant orientation. The stress state is nearly uniaxial in the direction of the tensile force. The stress amplitude for P1 is about 158.5 N/mm². Comparing the amplitudes of P1 will lead to the results that the maximum amplitudes are reached at the element at the borehole. An analysis of the setups with a higher preload or a higher coefficient of friction delivers the same finding. The use of a much more advanced strain-based multiaxial fatigue damage model by Szlosarek and Kröger in [21] leads to the similar finding that the crack initiation is predicted at the borehole. Hence, the evaluation of the stress state seems to be incomplete to explain the fatigue crack initiation. Therefore, the contact situation will also be analyzed.
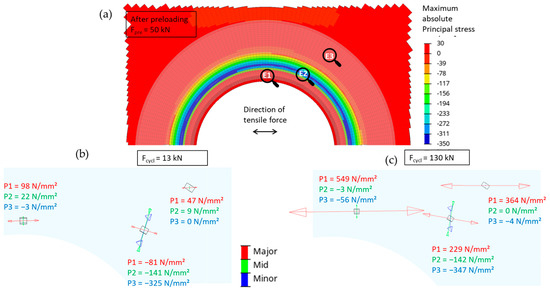
Figure 10.
Stress distribution in the sheet material: (a) Absolute maximum principal stress after preload with Fpre = 50 kN; (b) Principal stress tensor under 13 kN tensile force; (c) Principal stress tensor under 130 kN tensile force.
Figure 11 shows the simulation results of the contact status for the preloads of 20 kN, 40 kN, 50 kN, 60 kN, and 80 kN. The Coulomb friction status is presented in the transition period between 13 kN and 130 kN. A distinction is made between three different conditions, namely open contact, sliding contact, and sticking contact. The preload of 50 kN represents the reference situation. The results show that for preloads higher than 50 kN, a closed circle with a sticking contact exists. No closed circle of the sticking contact can be observed for preloads lower than 50 kN. Thus, at the left and right end areas with sliding contact exists. For the preload of 50 kN, it is not so clear. The circle is not fully closed. The slight asymmetry of the result may follow from numerical effects of the finite element implementation of the friction model.
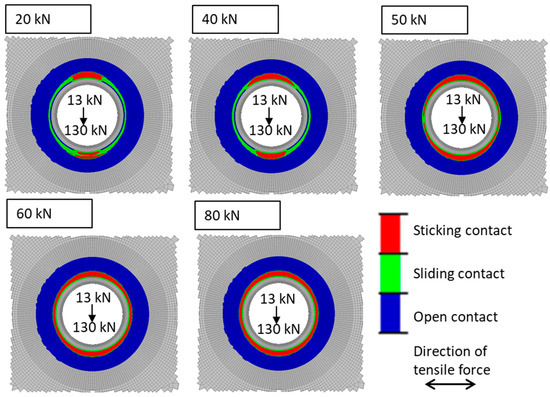
Figure 11.
Numerical results of the contact status for various preloads.
The second simulation series is conducted to observe the change in the tribological conditions under a preload of 50 kN. Here, the change in the tribological conditions is modelled by using different values for the coefficient of friction. With the contact model, as applied here, it is not possible to model the hydromechanical behavior of the lubricant or the change in the local surface topology due to grinding. Hence, these influences are considered in a macroscopic approach. Accompanying tests showed a coefficient of friction of about 0.1 by using the lubricant. This agrees with the data provided by the manufacturer and the standard VDI2230 [26]. Figure 12 depicts the numerical results for a preload of 50 kN. Again, the Coulomb friction status is presented. The simulation with can be interpreted as the experimental setup without lubrication and with as-built surface. The setup with refers to the experiment with lubrication and the as-built surface. The results show a closed circle of sticking contact for a coefficient of friction higher than 0.15. For a coefficient lower than 0.15, the large regions with sliding contact substitute the closed circle of sticking contact. The result for is inconclusive. The circle of closed contact is not fully closed with a small opening on one side.
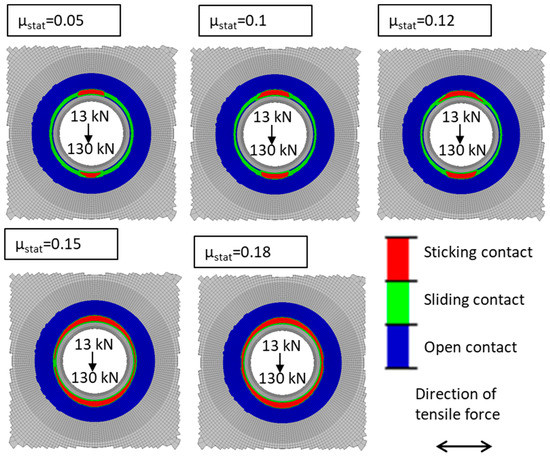
Figure 12.
Numerical results of the contact status for various static friction coefficients.
4. Discussion
It was observed by using unlubricated specimen and an as-built surface that the preload of the bolt affects the crack initiation location. For preloads less than 40 kN, the crack initiates at the borehole, and for preloads greater than 50 kN, the crack initiates in the contact zone. Thus, the range between 40 kN and 50 kN seems to be the crucial interval. The preload of 50 kN was utilized for further investigations to determine whether the crack initiation may also be modified by different tribological setups. The setup with lubrication leads to a crack initiation at the borehole. The use of a lubricant results in a reduced coefficient of friction. Hence, the experiments show that a reduced coefficient of friction leads to a crack initiation at the borehole for the majority of tests, whereas the tests without lubrication and the as-built surface led to a crack initiation in the contact zone. It can be assumed that the coefficient of friction is higher for this setup. Tests with the grinded surface reveal a variety of failures, including runout. Thus, for this setup it can be stated that the grinding of the surface influences the failure mode. A more precise statement is not possible due to the variation of the experiments.
The numerical simulations were carried out using different preloads and different coefficients of friction. The mechanical stresses were evaluated in total and for three representative elements. The crack initiation at the borehole for low preloads and low frictions coefficients can be comprehended by this evaluation. In contrast, an analysis of the mechanical stresses cannot explain the shift of the crack initiation location for high preloads. The numerical results always indicate the borehole as critical position. In [21], it is shown that a much more advanced fatigue analysis is also not able to predict the change in the crack initiation location. The contact status data reveal that a reduction in the preload leads to a similar result as a reduction in the friction coefficient. For preloads higher than 50 kN, a closed circle of sticking contact is observed. This is also visible for a preload of 50 kN and an increased coefficient of friction. The opposed effect occurs by a decreased preload or a preload of 50 kN combined with a decreased coefficient of friction. Here, the area of the sticking contact is no longer a closed circle.
5. Conclusions
The fatigue crack initiation of a bolt joint of size M22 was investigated for the entire range of bearable preloads. Altogether, the crack initiation location depends on the preload. Between 40 kN and 50 kN, the crack initiation location shifts from the borehole (lower than 40 kN) to the contact zone (higher than 50 kN). Detailed analysis for a preload of 50 kN with a grinded or lubricated surface was carried out. The results show a huge variation in the results for the grinded surface. The lubricated specimen shows a decreased number of cycles and a crack initiation exclusively at the borehole. Hence, the failure mode was shifted back due to the lubricant. A comparison of the experimental and the numerical results shows that the distribution of sticking and sliding contact status has a good correlation to whether the crack will be initiated at the borehole or in the contact zone. The simulation shows a closed circle of sticking contact for the experimental results with crack initiation in the contact zone. In the same way, the experimental results with a crack initiation at the borehole correlate with the numerical results with an open circle of sticking contact. The comparison of the experiments and the numerical results concludes that a combined damage model for fatigue and tribological loads must be implemented. Another enhancement may be to update the friction coefficient during the simulation like Mäntylä [29] et al. demonstrate by using the Archard model [30]. Thus, further research should concentrate on the challenge of developing numerical crack initiation models for this combined tribological and stress-based fatigue problem. Therefore, it appears worthwhile to perform additional basic experiments to control the tribological setup more precisely than it is possible by using a commercially produced nut.
Author Contributions
Conceptualization, R.S.; methodology, R.S.; software, R.S. and P.H.; experiments, P.H. and R.S.; writing—original draft preparation, R.S.; writing—review and editing, M.K. and P.H.; supervision, M.K.; All authors have read and agreed to the published version of the manuscript.
Funding
This research received no external funding.
Data Availability Statement
The data presented in this study are available in Appendix A and Appendix B. The simulation data presented in this study are available on request from the corresponding author.
Conflicts of Interest
The authors declare no conflict of interest.
Appendix A

Table A1.
Experimental results of the test series with different preloads.
Table A1.
Experimental results of the test series with different preloads.
| Test Number | Preload | Crack Initiation Location | Cycles to Crack |
|---|---|---|---|
| 1 | 0 kN | borehole | 57,995 |
| 2 | 0 kN | borehole | 42,600 |
| 3 | 0 kN | borehole | 42,694 |
| 4 | 0 kN | borehole | 33,955 |
| 5 | 0 kN | borehole | 42,545 |
| 6 | 0 kN | borehole | 48,777 |
| 7 | 0 kN | borehole | 54,094 |
| 8 | 10.2 kN | borehole | 119,732 |
| 9 | 10.1 kN | borehole | 129,211 |
| 10 | 10.5 kN | borehole | 198,211 |
| 11 | 11.3 kN | borehole | 85,515 |
| 12 | 20 kN | borehole | 501,977 |
| 13 | 21 kN | borehole | 613,971 |
| 14 | 20.9 kN | borehole | 804,070 |
| 15 | 20.5 kN | borehole | 538,255 |
| 16 | 30.8 kN | borehole | 1,041,874 |
| 17 | 30.8 kN | borehole | 1,496,038 |
| 18 | 30.5 kN | borehole | 1,061,404 |
| 19 | 41.1 kN | borehole | 643,995 |
| 20 | 40.8 kN | contact zone | 3,675,143 |
| 21 | 40.5 kN | contact zone | 2,276,980 |
| 22 | 40.5 kN | borehole | 1,211,595 |
| 23 | 50.5 kN | borehole | 2,855,086 |
| 24 | 50.8 kN | contact zone | 2,891,121 |
| 25 | 50.5 kN | contact zone | 4,287,646 |
| 26 | 50.9 kN | contact zone | 2,522,088 |
| 27 | 60.8 kN | contact zone | 2,279,173 |
| 28 | 61 kN | contact zone | 2,375,510 |
| 29 | 111 kN | contact zone | 1,381,777 |
| 30 | 112 kN | contact zone | 1,013,565 |
| 31 | 226 kN | contact zone | 1,043,371 |
| 32 | 228 kN | contact zone | 930,606 |
| 33 | 227 kN | contact zone | 1,601,310 |
Appendix B

Table A2.
Experimental results of the test series with tribological setups.
Table A2.
Experimental results of the test series with tribological setups.
| Test Number | Setup | Crack Initiation Location | Cycles to Crack |
|---|---|---|---|
| 1 | unlubricated, as-built surface | contact zone | 2,891,121 |
| 2 | unlubricated, as-built surface | contact zone | 4,287,646 |
| 3 | unlubricated, as-built surface | contact zone | 2,522,088 |
| 4 | unlubricated, as-built surface | borehole | 2,855,086 |
| 5 | unlubricated, grinded surface | contact zone | 1,383,318 |
| 6 | unlubricated, grinded surfaceunlubricated, polished surface | borehole | 1,267,019 |
| 7 | unlubricated, grinded surface | contact zone | 3,387,754 |
| 8 | unlubricated, grinded surface | no crack | runout |
| 9 | lubricated, as-built surface | contact zone | 568,428 |
| 10 | lubricated, as-built surface | contact zone | 712,844 |
| 11 | lubricated, as-built surface | contact zone | 477,696 |
| 12 | lubricated, as-built surface | no crack | runout |
Appendix C

Table A3.
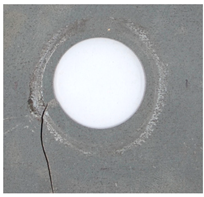
Photographs of the tested specimen with as-built, grinded, and lubricated surface.
Table A3.
Photographs of the tested specimen with as-built, grinded, and lubricated surface.
| Unlubricated, As-Built Surface | Unlubricated, Grinded Surface | Lubricated, As-Built Surface |
|---|---|---|
 Cycles to crack: 2891121 | 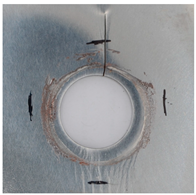 Cycles to crack: 1267019 | 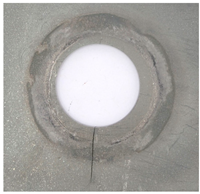 Cycles to crack: 568428 |
Appendix D

Table A4.
Result of the mesh quality check.
Table A4.
Result of the mesh quality check.
| Criteria | Ideal Value | % Ideal | Fail Value | % Fail |
|---|---|---|---|---|
| Aspect ratio | 1.000 | 99.135 | >8.0 | 0.002 |
| Jacobian | 1.000 | 14.396 | <0.5 | 0.001 |
| Skew angle | 0° | 21.227 | >60° | 0.000 |
| Warpage angle | 0° | 16.527 | >20° | 0.000 |
References
- Knothe, W.; Schumacher, J.; Streicher, M.; Fischer, G. Interactions Between Wheel and Hub—Developments and Potentials at Commercial Vehicles. Mater. Test. 2008, 50, 12–19. [Google Scholar] [CrossRef]
- Wöllner, U.; Szlosarek, R.; Kröger, M. Fatigue behavior of agricultural rims under rotating bending load. Fatigue Fract. Eng. Mater. Struct. 2022, 45, 2143–2158. [Google Scholar] [CrossRef]
- Benhamena, A.; Amrouche, A.; Talha, A.; Benseddiq, N. Effect of contact forces on fretting fatigue behavior of bolted plates: Numerical and experimental analysis. Tribol. Int. 2012, 48, 237–245. [Google Scholar] [CrossRef]
- Chakherlou, T.N.; Oskouei, R.H.; Vogwell, J. Experimental and numerical investigation of the effect of clamping force on the fatigue behaviour of bolted plates. Eng. Fail. Anal. 2008, 15, 563–574. [Google Scholar] [CrossRef]
- Chakherlou, T.N.; Alvandi-Tabrizi, Y.; Kiani, A. On the fatigue behavior of cold expanded fastener holes subjected to bolt tightening. Int. J. Fatigue 2011, 33, 800–810. [Google Scholar] [CrossRef]
- Esmaeili, F.; Chakherlou, T.N.; Zehsaz, M.; Hasanifard, S. Investigating the effect of clamping force on the fatigue life of bolted plates using volumetric approach. J. Mech. Sci. Technol. 2013, 27, 3657–3664. [Google Scholar] [CrossRef]
- Jiménez-Peña, C.; Talemi, R.H.; Rossi, B.; Debruyne, D. Investigations on the fretting fatigue failure mechanism of bolted joints in high strength steel subjected to different levels of pre-tension. Tribol. Int. 2017, 108, 128–140. [Google Scholar] [CrossRef]
- Ruiz, C.; Boddington, P.H.B.; Chen, K.C. An investigation of fatigue and fretting in a dovetail joint. Exp. Mech. 1984, 24, 208–217. [Google Scholar] [CrossRef]
- Juoksukangas, H.; Lehtovaara, A.; Mäntylä, A. Experimental and numerical investigation of fretting fatigue behavior in bolted joints. Tribol. Int. 2016, 103, 440–448. [Google Scholar] [CrossRef]
- Chakherlou, T.N.; Razavi, M.J.; Aghdam, A.B.; Abazadeh, B. An experimental investigation of the bolt clamping force and friction effect on the fatigue behavior of aluminum alloy 2024-T3 double shear lap joint. Mater. Des. 2011, 32, 4641–4649. [Google Scholar] [CrossRef]
- Jayaprakash, M.; Mutoh, Y.; Yoshii, K. Fretting Fatigue Behavior and Life Prediction of Automotive Steel Bolted Joint. Mater. Des. 2011, 32, 3911–3919. [Google Scholar] [CrossRef]
- Chakherlou, T.N.; Mirzajanzadeh, M.; Vogwell, J. Effect of hole lubrication on the fretting fatigue life of double shear lap joints: An experimental and numerical study. Eng. Fail. Anal. 2009, 16, 2388–2399 . [Google Scholar] [CrossRef]
- Oskouei, R.H.; Ibrahim, R.H. Improving fretting fatigue behaviour of Al 7075-T6 bolted plates using electroless Ni–P coatings. Int. J. Fatigue 2012, 44, 157–167. [Google Scholar] [CrossRef]
- Sun, Y.; Voyiadjis, G.Z.; Hu, W.; Shen, F.; Meng, Q. Fatigue and fretting fatigue life prediction of double-lap bolted joints using continuum damage mechanics-based approach. Int. J. Damage Mech. 2017, 26, 162–188. [Google Scholar] [CrossRef]
- Lemaitre, J.; Chaboche, J.L. Mechanics of Solid Materials, 1st ed.; Cambridge University Press: Cambridge, UK, 1990. [Google Scholar]
- Chaboche, J.L. On some modifications of kinematic hardening to improve the description of ratcheting effects. Int. J. Plasticity 1991, 7, 661–678. [Google Scholar] [CrossRef]
- Venugopal Poovakaud, V.; Jiménez-Peña, C.; Talemi, R.; Coppieters, S.; Debruyne, D. Assessment of Fretting Fatigue in High Strength Steel Bolted Connections with Simplified Fe Modelling Techniques. Tribol. Int. 2020, 143, 106083. [Google Scholar] [CrossRef]
- Croccolo, D.; De Agostinis, M.; Fini, S.; Olmi, G.; Robusto, F.; Scapecchi, C. Fretting Fatigue in Mechanical Joints: A Literature Review. Lubricants 2022, 10, 53. [Google Scholar] [CrossRef]
- Croccolo, D.; De Agostinis, M.; Fini, S.; Mele, M.; Olmi, G.; Scapecchi, C.; Tariq, M.H.B. Failure of Threaded Connections: A Literature Review. Machines 2023, 11, 212. [Google Scholar] [CrossRef]
- Szlosarek, R.; Kröger, M. Fatigue behavior of bolted boreholes under various preloads. Mater. Test. 2022, 64, 195–201. [Google Scholar] [CrossRef]
- Szlosarek, R.; Kröger, M. Multiaxial fatigue crack initiation in bolted sheet material. Procedia Struct. Integr. 2023, 43, 41–46. [Google Scholar] [CrossRef]
- Fatemi, A.; Socie, D.F. A Critical Plane Approach to Multiaxial Fatigue Damage Including Out-Of-Phase Loading. Fatigue Fract. Eng. Mater. Struct. 1988, 11, 149–165. [Google Scholar] [CrossRef]
- Smith, K.N.; Topper, T.H.; Watson, P. A Stress–Strain Function for the Fatigue of Metals (Stress-Strain Function for Metal Fatigue Including Mean Stress Effect). J. Mater. 1970, 5, 767–778. [Google Scholar]
- Deutsches Institut für Normung, e. V (DIN). Disc Wheels for Motor Vehicles and Trailers—Part 3: Dimensions and Fastening Devices for Hub-Centering; DIN 74361-3; Deutsches Institut für Normung e. V (DIN): Berlin, Germany, 2023. [Google Scholar]
- Fernando, S. An engineering insight to the fundamental behaviour of tensile bolted joints. Steel Constr. 2001, 35, 1–13. [Google Scholar]
- Verein Deutscher Ingenieure (VDI). Systematic Calculation of High Duty Bolted Joints Joints with One Cylindrical Bolt; VDI 2230; Verein Deutscher Ingenieure (VDI): Düsseldorf, Germany, 2003. [Google Scholar]
- Nesládek, M.; Španiel, M.; Jurenka, J.; Růžička, J.; Kuželka, J. Fretting fatigue—Experimental and numerical approaches. Int. J. Fatigue 2012, 44, 61–73. [Google Scholar] [CrossRef]
- Mäntylä, A.; Juoksukangas, J.; Hintikka, J.; Frondelius, T.; Lehtovaara, A. FEM-Based Wear Simulation for Fretting Contacts. Raken. Mek. 2020, 53, 20–27. [Google Scholar] [CrossRef]
- Mäntylä, A.; Hintikka, J.; Frondelius, T.; Vaara, J.; Lehtovaara, A.; Juoksukangas, J. Prediction of Contact Condition and Surface Damage by Simulating Variable Friction Coefficient and Wear. Tribol. Int. 2020, 143, 106054. [Google Scholar] [CrossRef]
- Archard, J.F. Contact and rubbing of flat surfaces. J. Appl. Phys. 1953, 24, 981–988. [Google Scholar] [CrossRef]
Disclaimer/Publisher’s Note: The statements, opinions and data contained in all publications are solely those of the individual author(s) and contributor(s) and not of MDPI and/or the editor(s). MDPI and/or the editor(s) disclaim responsibility for any injury to people or property resulting from any ideas, methods, instructions or products referred to in the content. |
© 2023 by the authors. Licensee MDPI, Basel, Switzerland. This article is an open access article distributed under the terms and conditions of the Creative Commons Attribution (CC BY) license (https://creativecommons.org/licenses/by/4.0/).