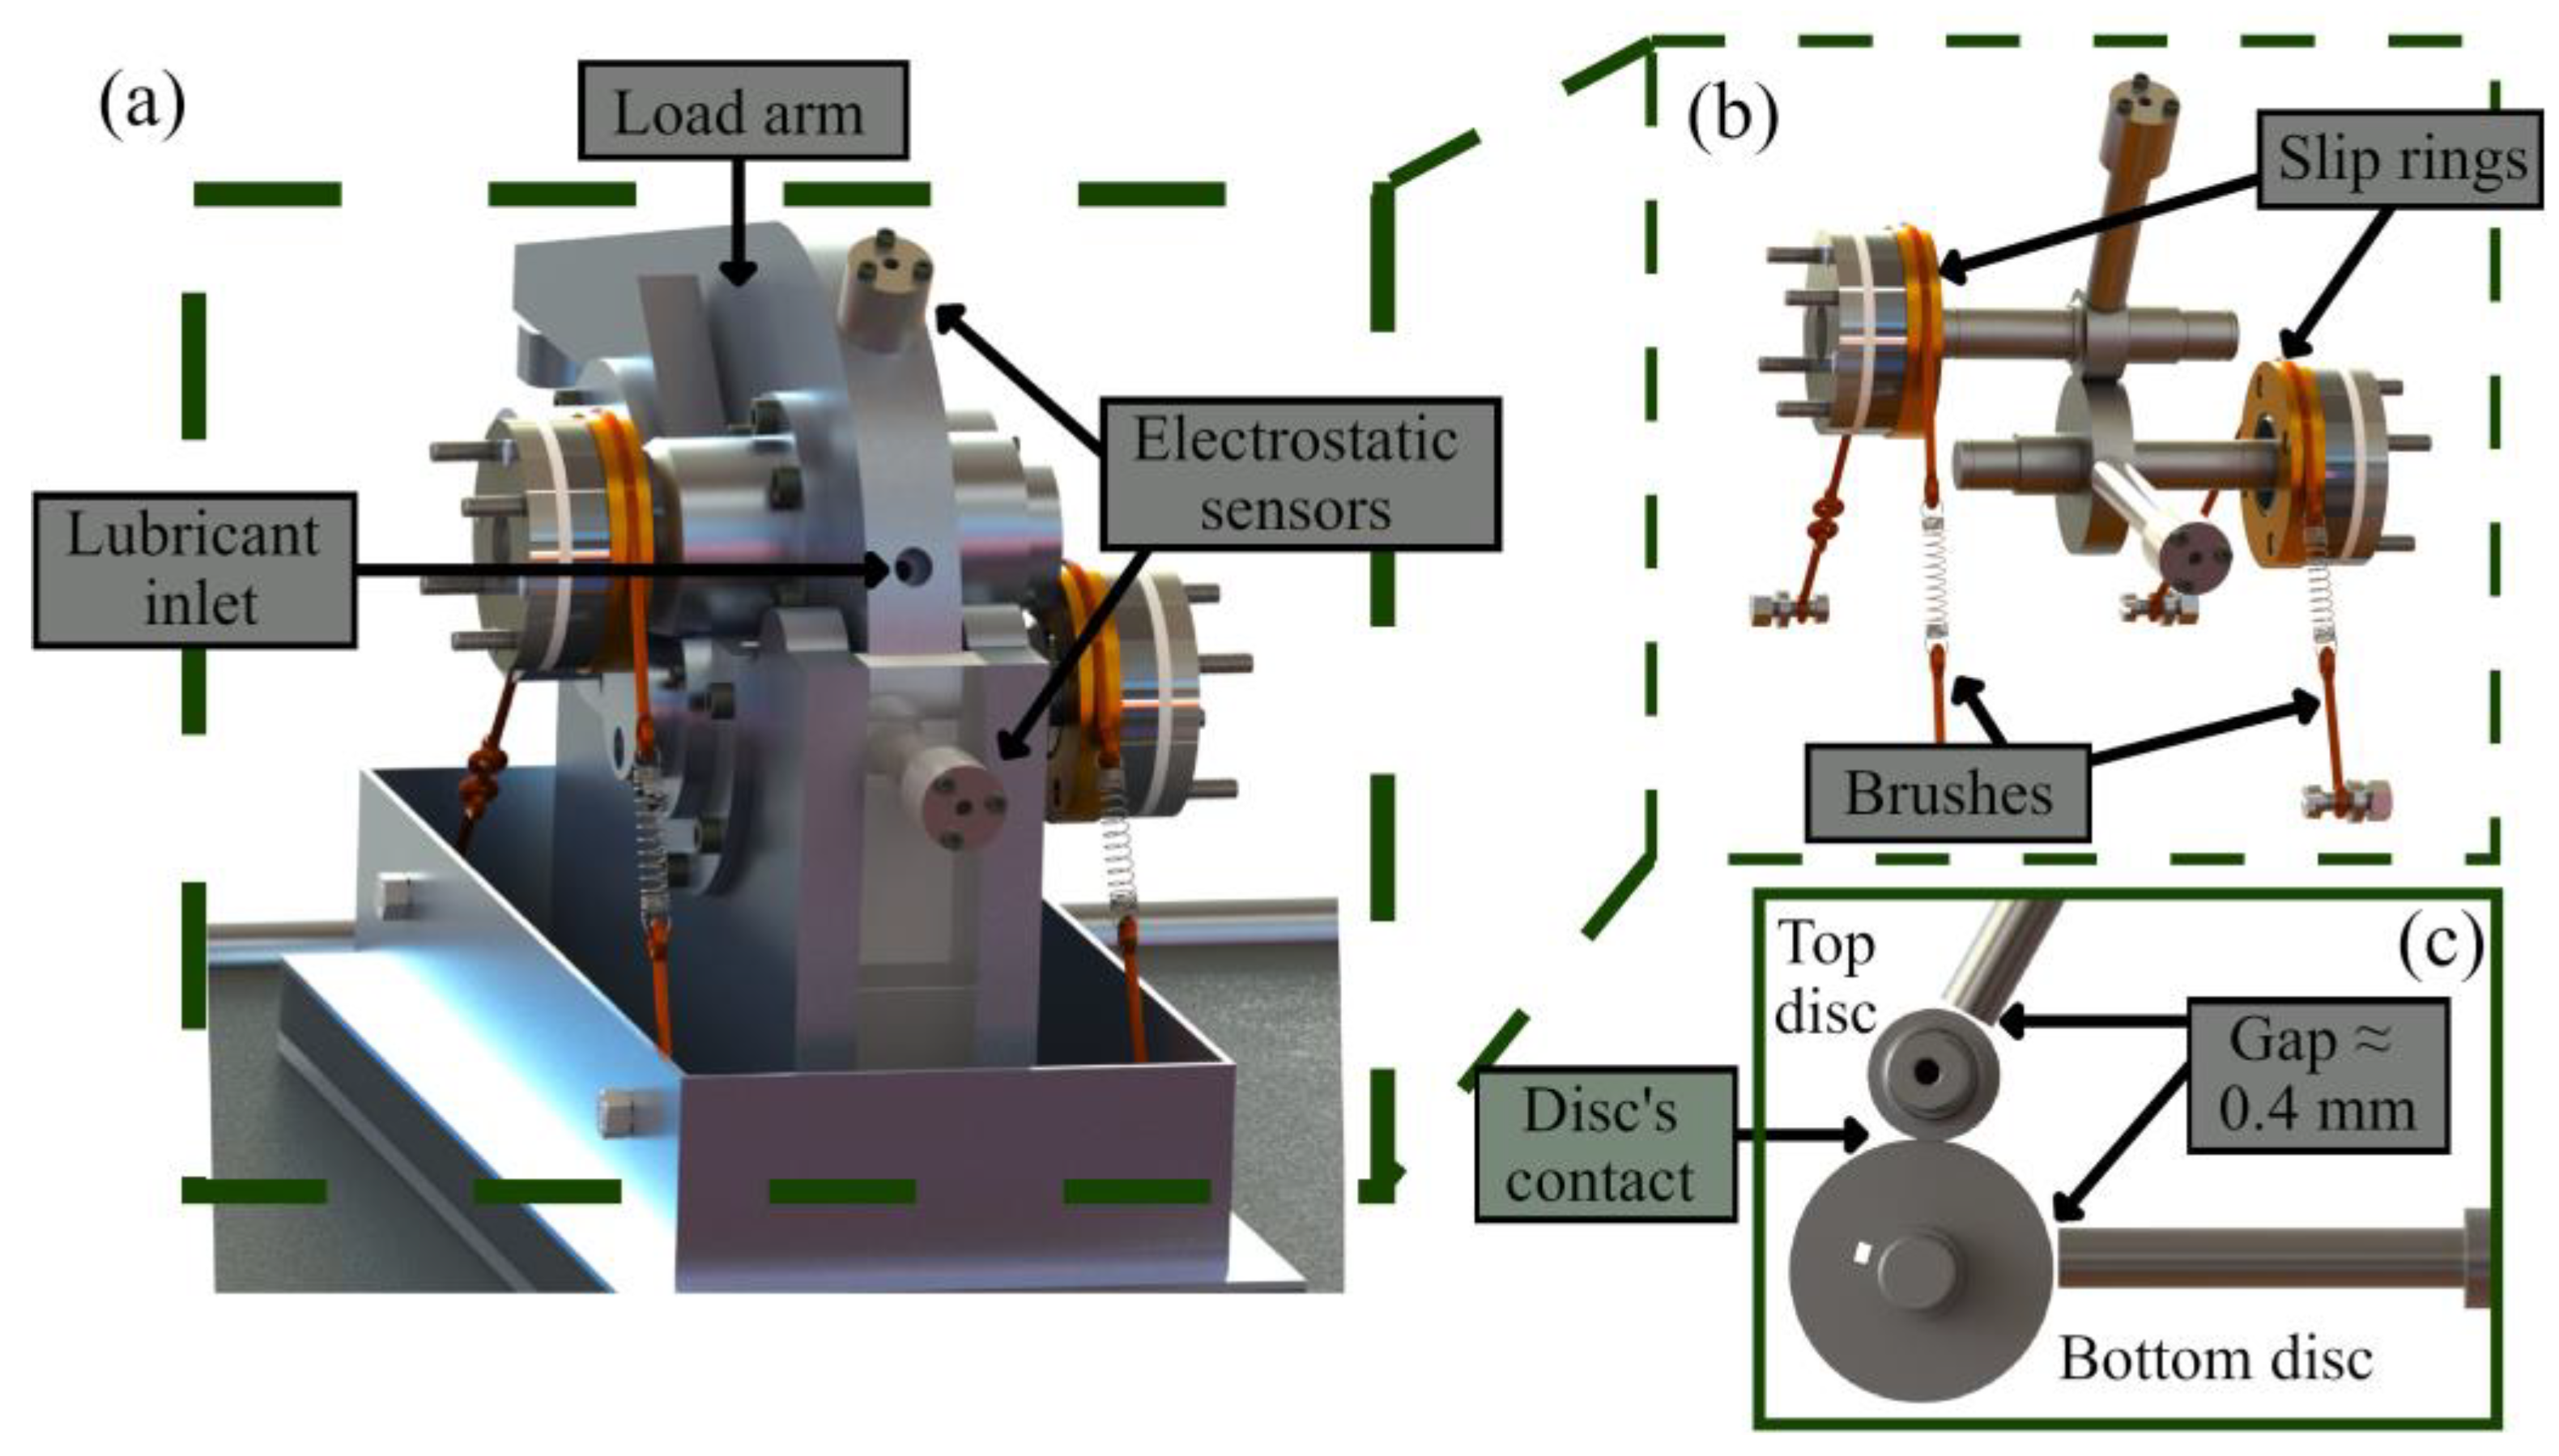
Figure 1.
Three-dimensional models of the TE74 twin-roller machine used in the experiments. The first model (a) illustrates the radial load applied by a load arm, along with brushes/slip rings that allow for proper electrical contacts with the rotating parts. The second model (b) depicts the top and bottom discs, and the locations of two ES sensors. Lastly, the third model (c) shows a cross-sectional view of the gap between the ES sensors and the discs, which is approximately 0.4 mm, as well as the contact area of the discs. A keyhole for the larger disc is also visible in this model.
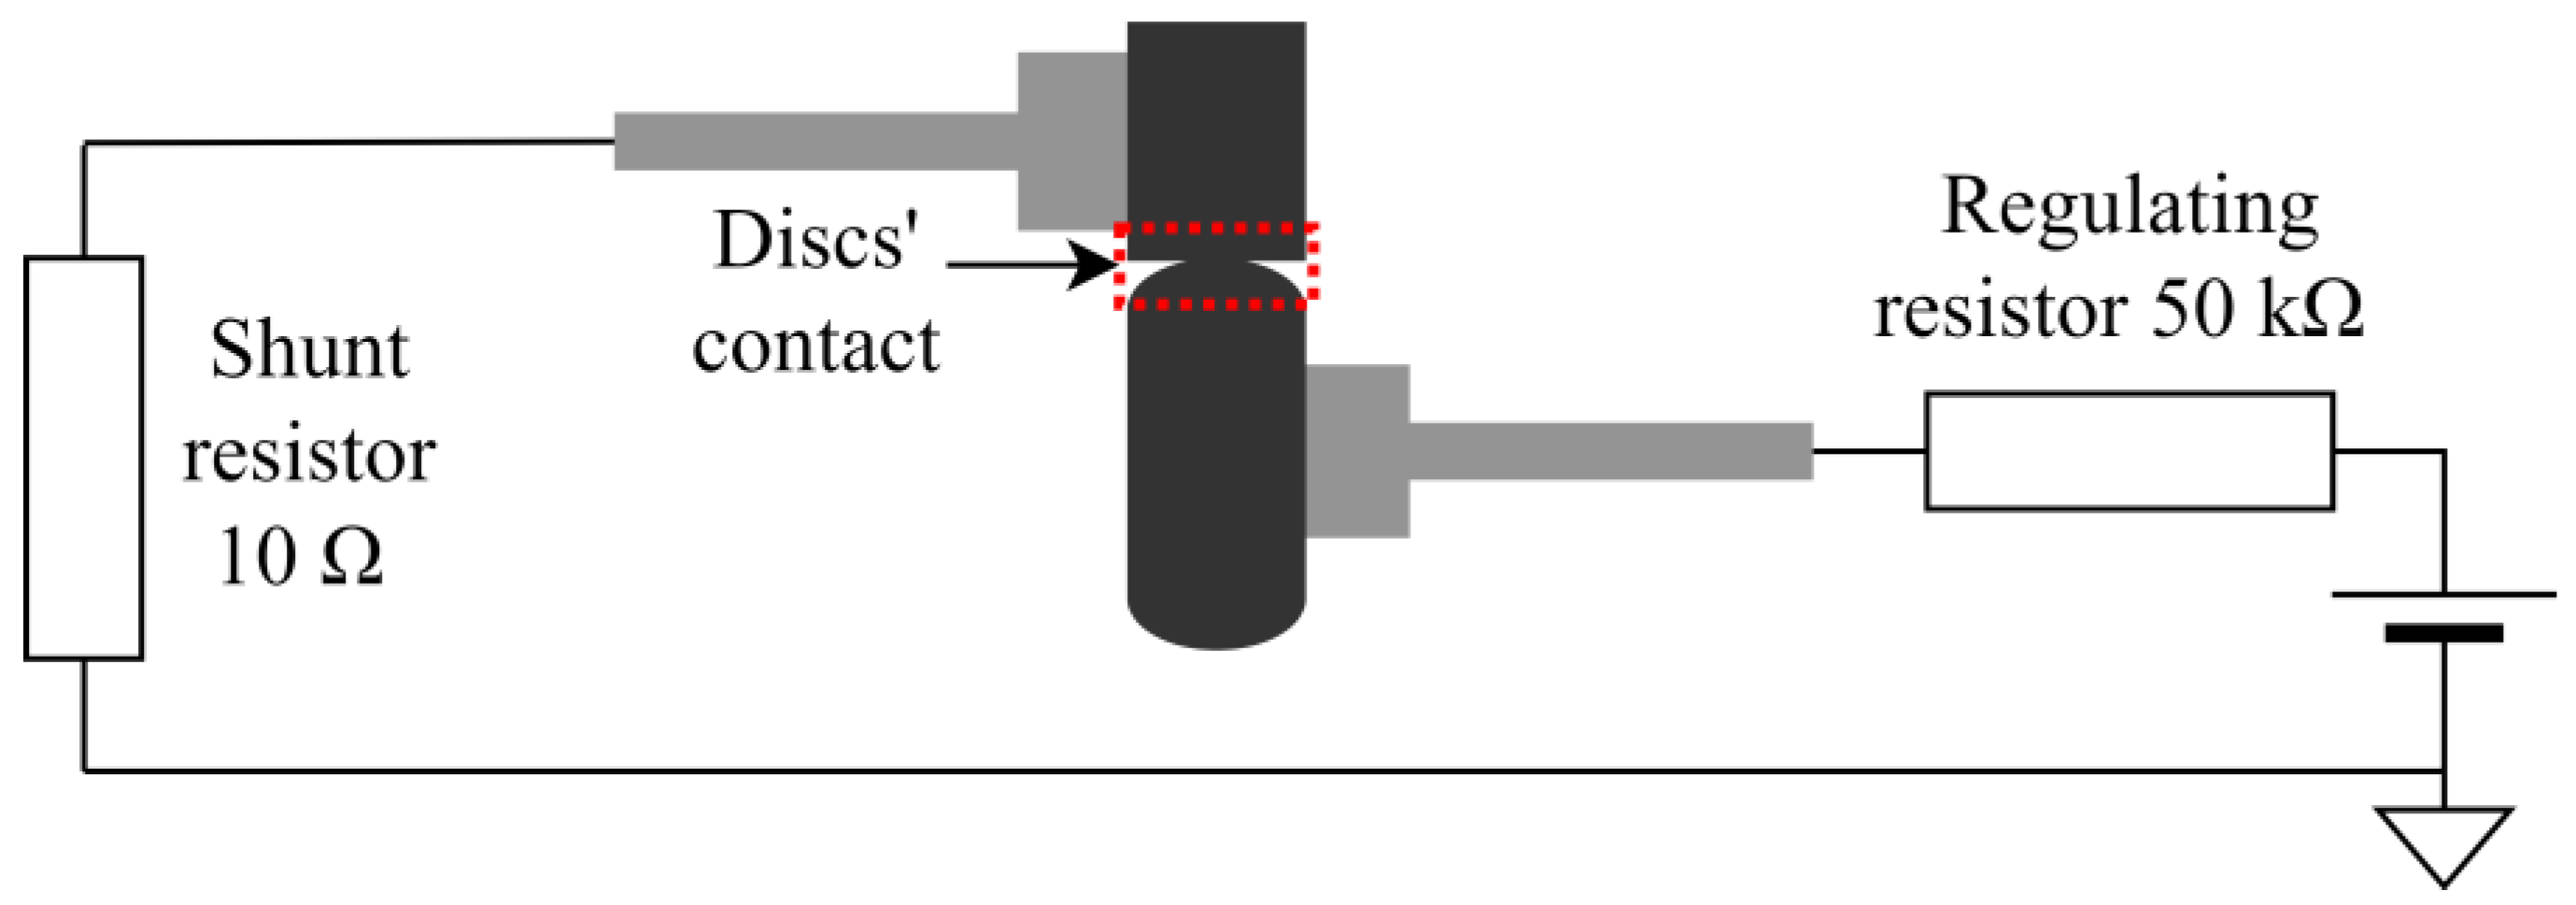
Figure 2.
A diagram representing the electrical circuit utilised in the TE74 test apparatus to create a voltage difference across the discs’ contact.
Figure 2.
A diagram representing the electrical circuit utilised in the TE74 test apparatus to create a voltage difference across the discs’ contact.
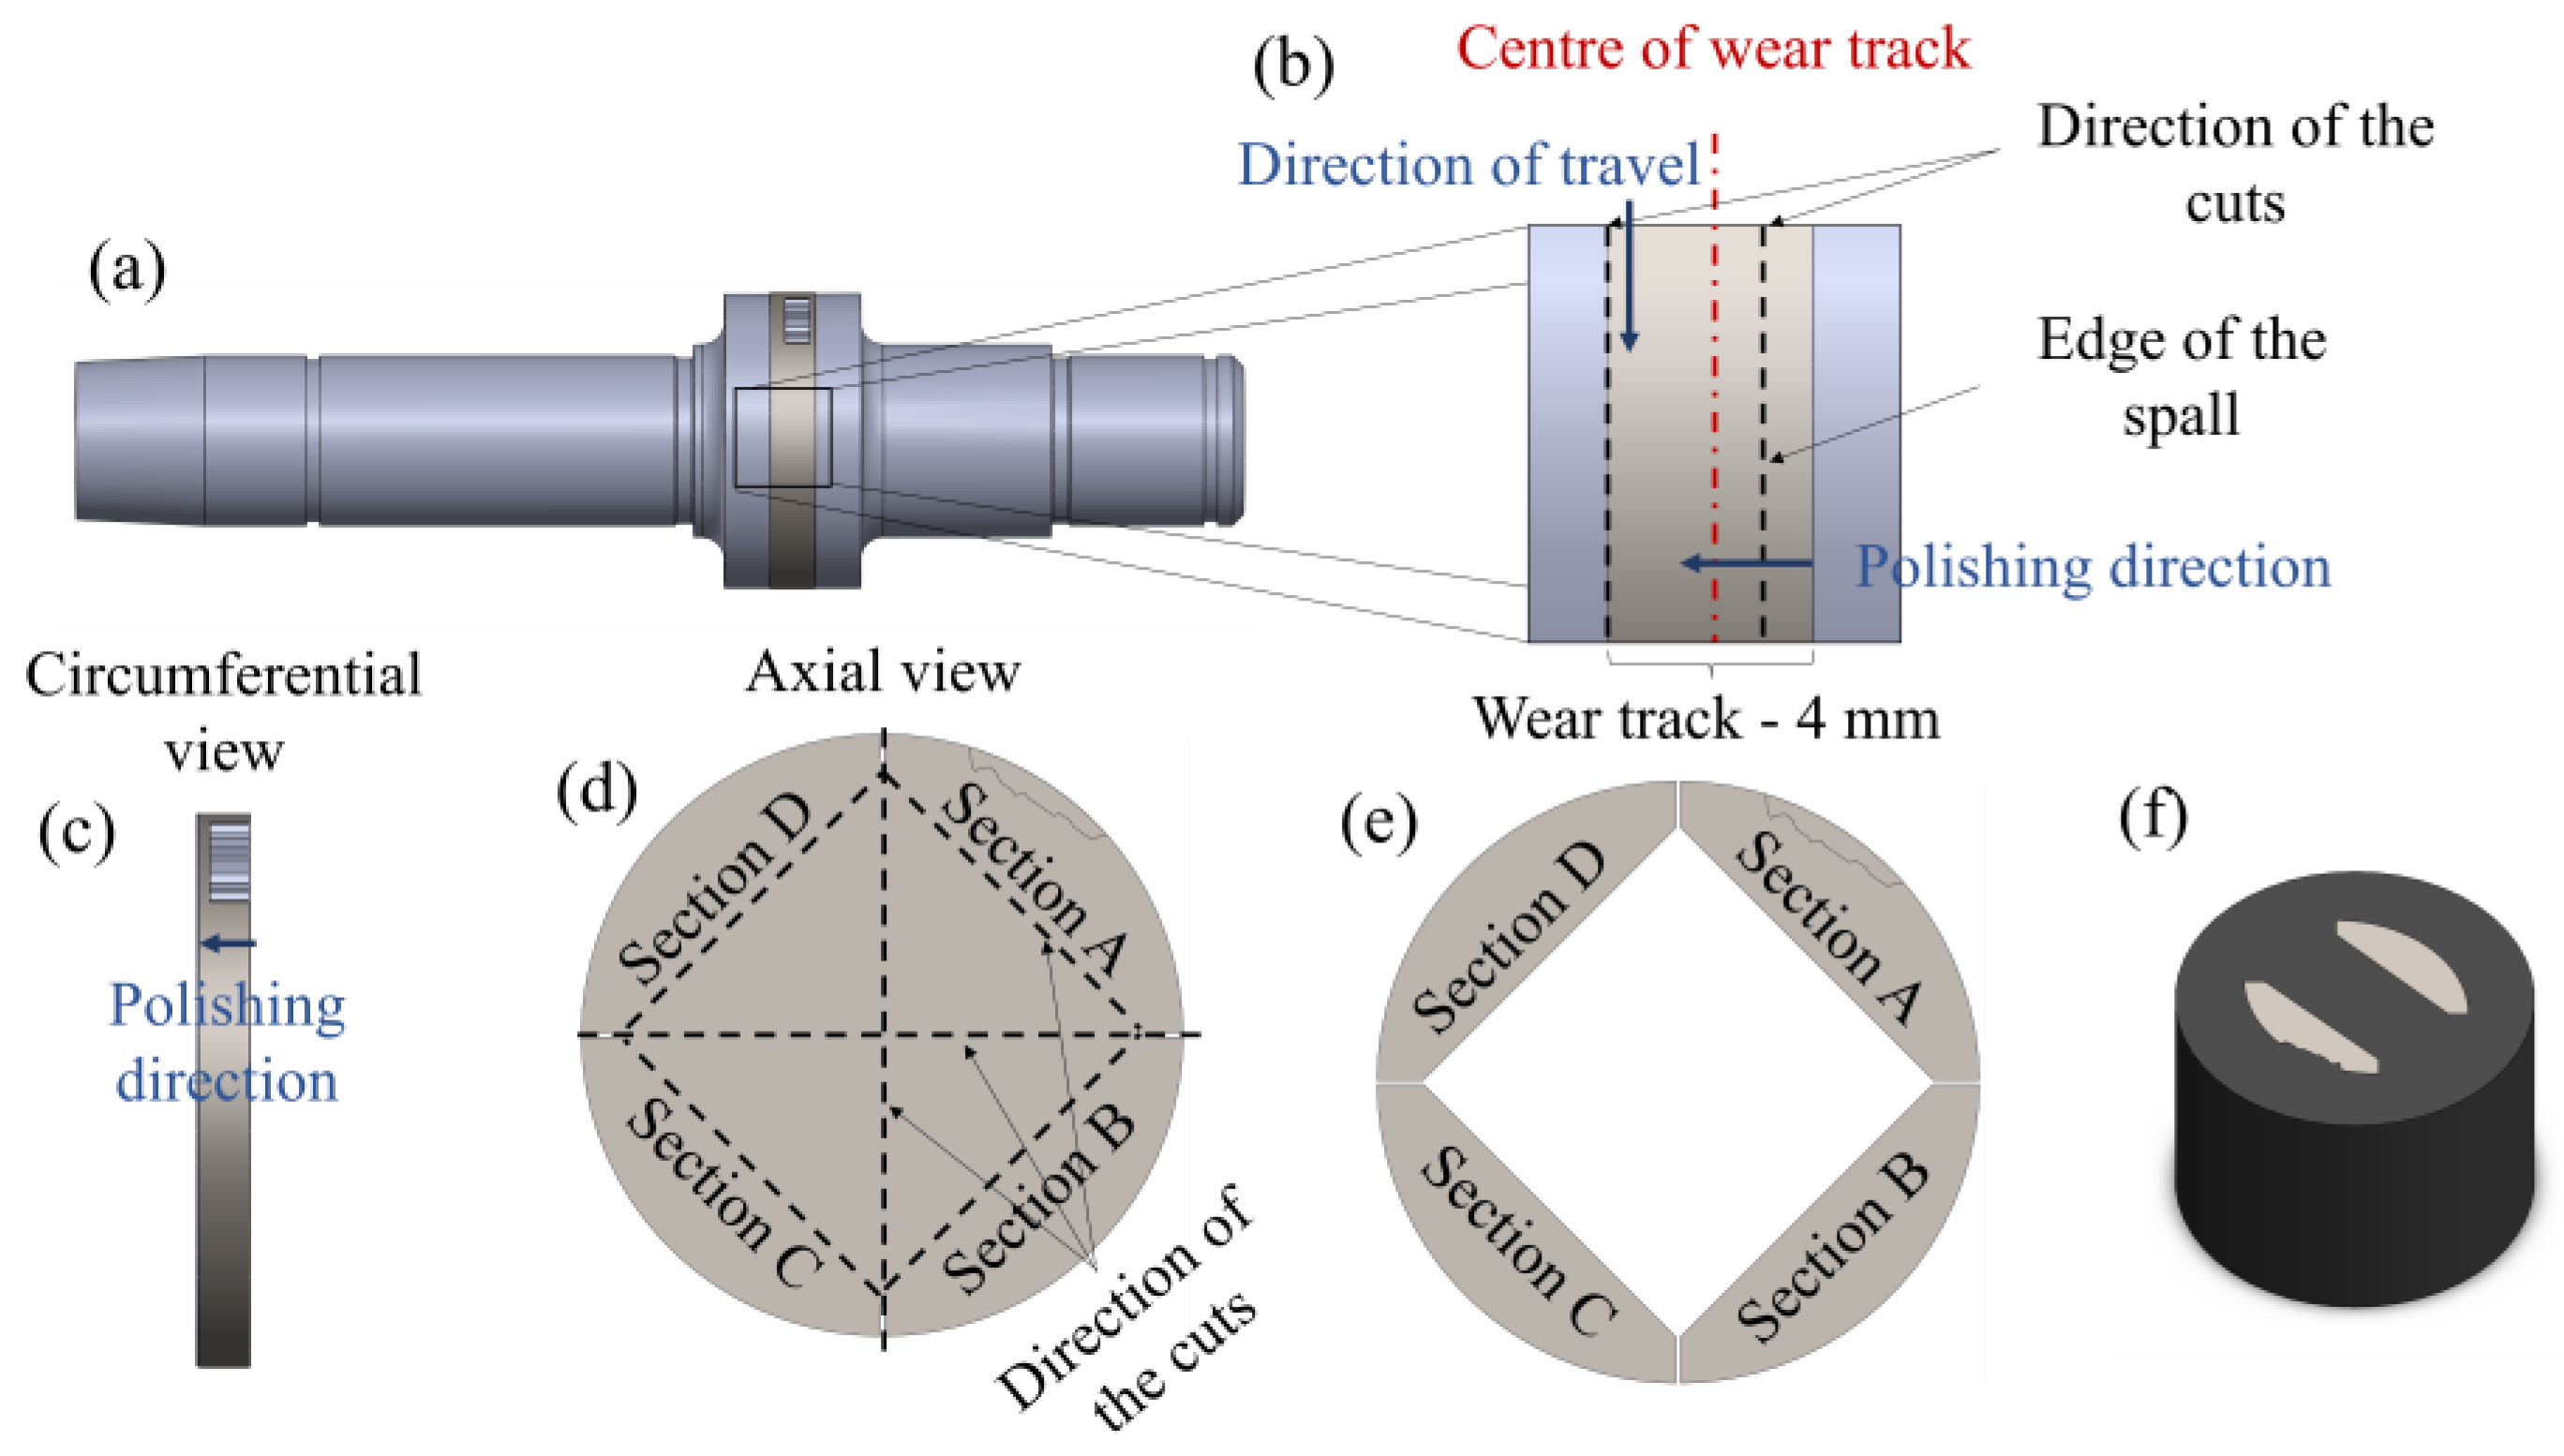
Figure 3.
Material preparation and mounting for the 26 mm disc, showing the wear track in (a), cutting and polishing directions in (b,c); and sample preparation for surface and subsurface investigations in (d–f).
Figure 3.
Material preparation and mounting for the 26 mm disc, showing the wear track in (a), cutting and polishing directions in (b,c); and sample preparation for surface and subsurface investigations in (d–f).
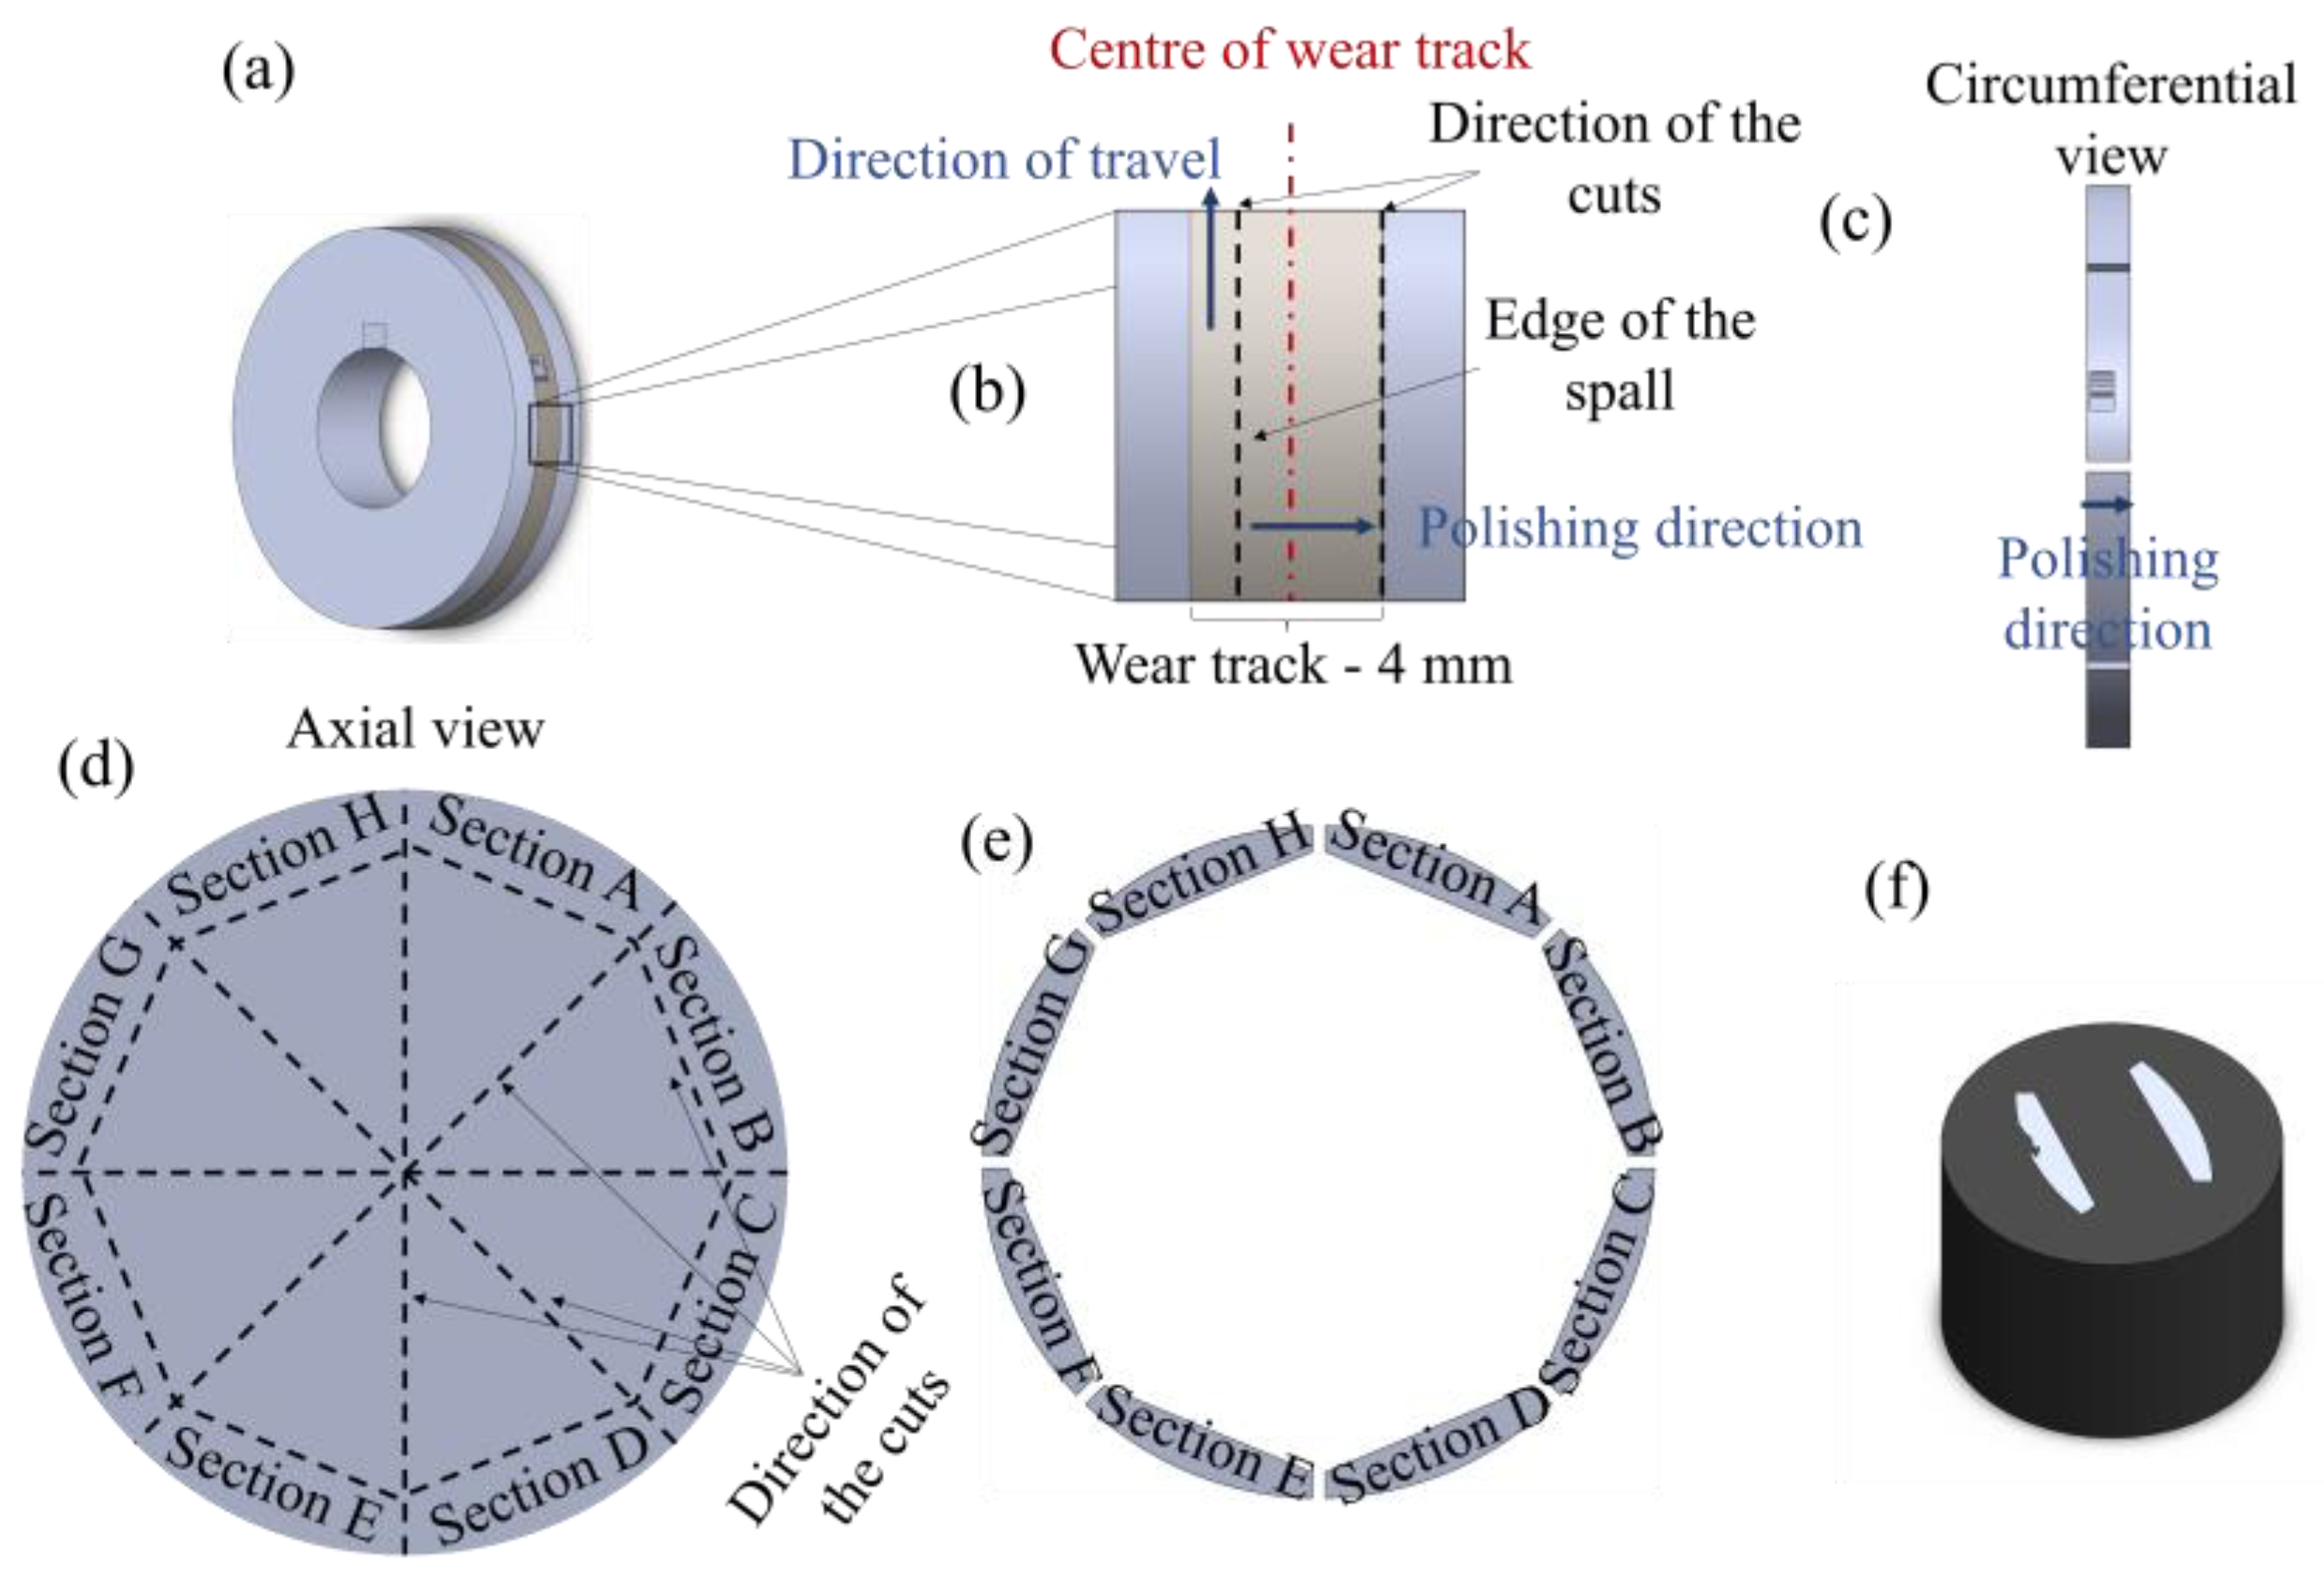
Figure 4.
Material preparation and mounting for the 52 mm disc, with (a,b) showing the wear track and the direction of cutting, (c) representing the polishing direction, and (d–f), demonstrating the sample preparation for surface and subsurface investigations.
Figure 4.
Material preparation and mounting for the 52 mm disc, with (a,b) showing the wear track and the direction of cutting, (c) representing the polishing direction, and (d–f), demonstrating the sample preparation for surface and subsurface investigations.
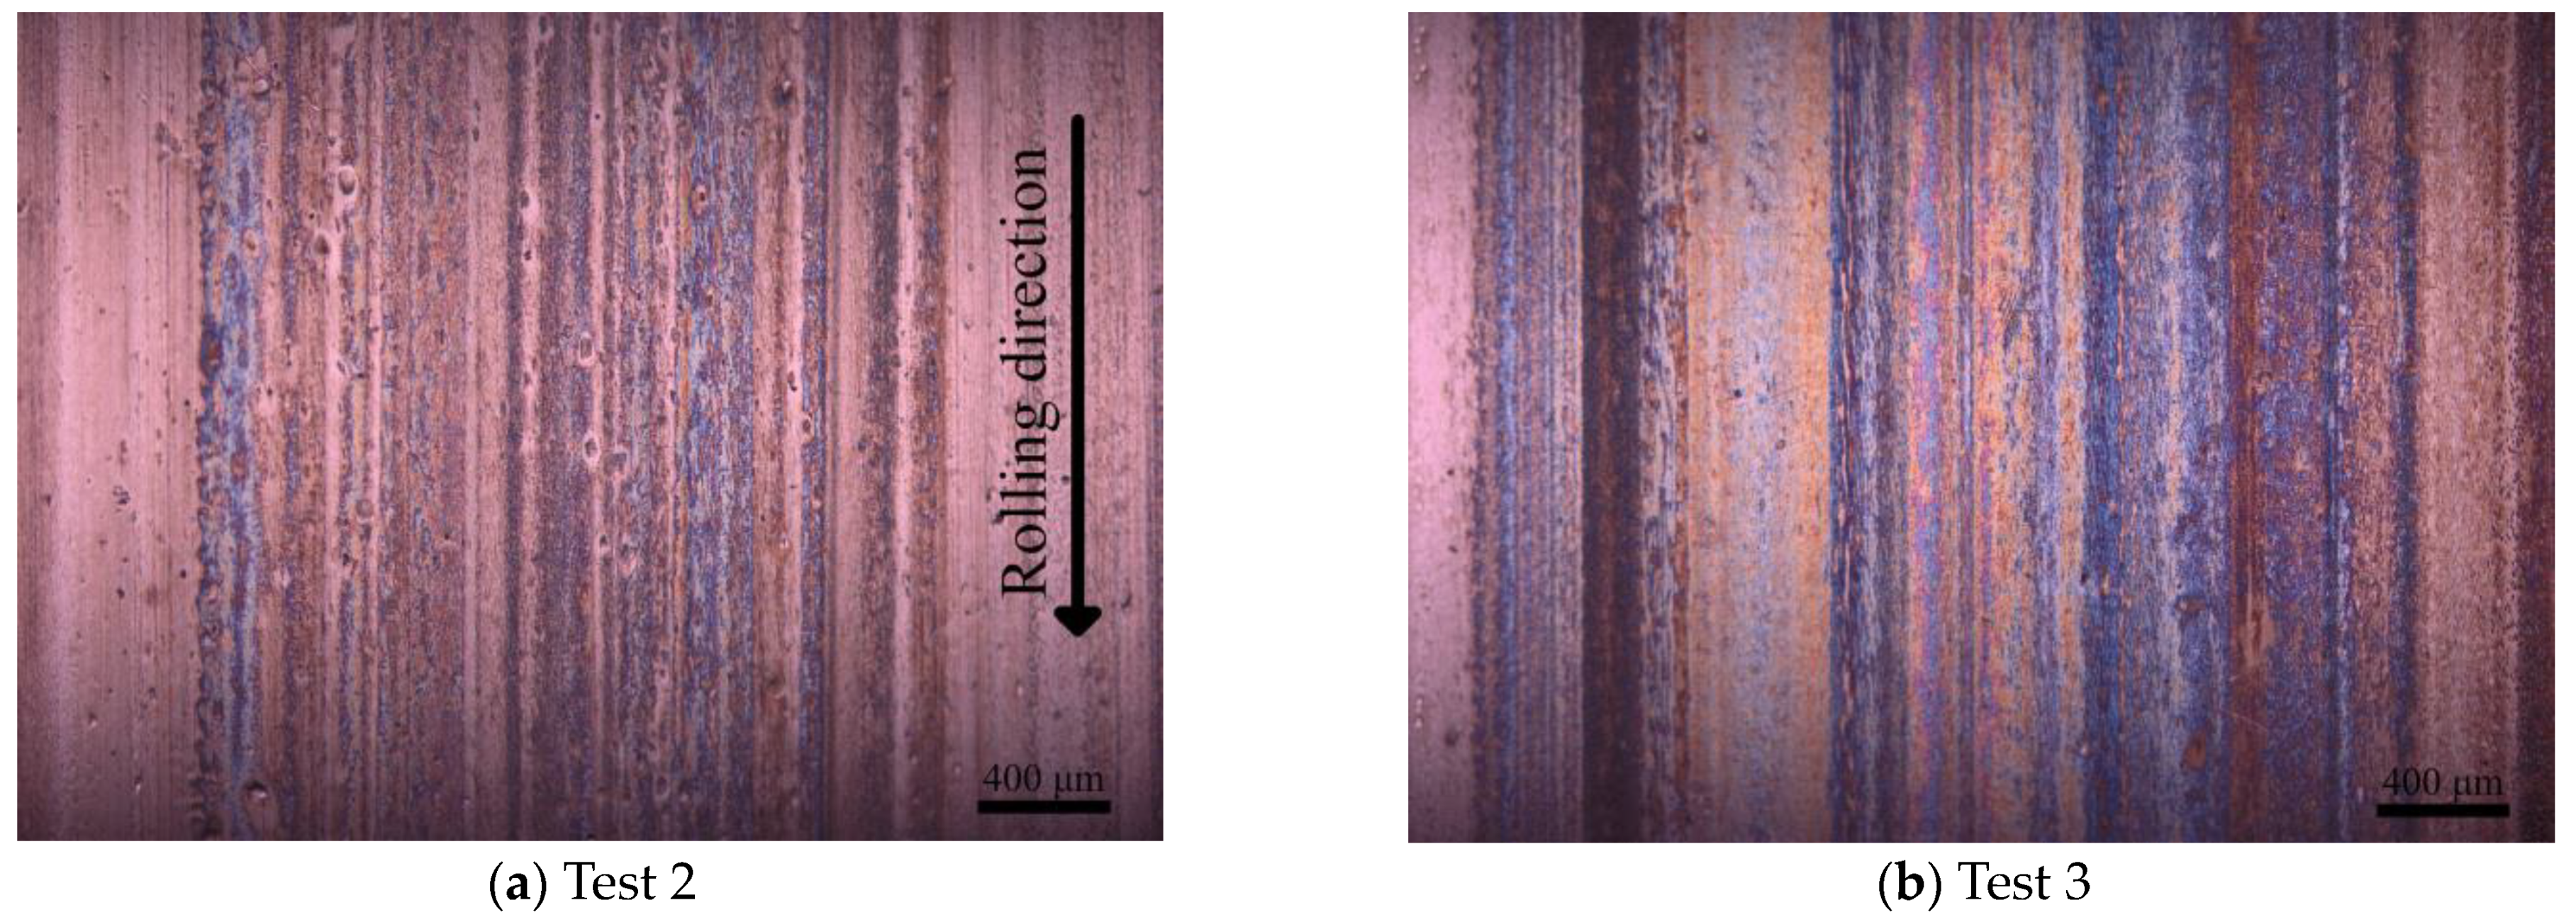
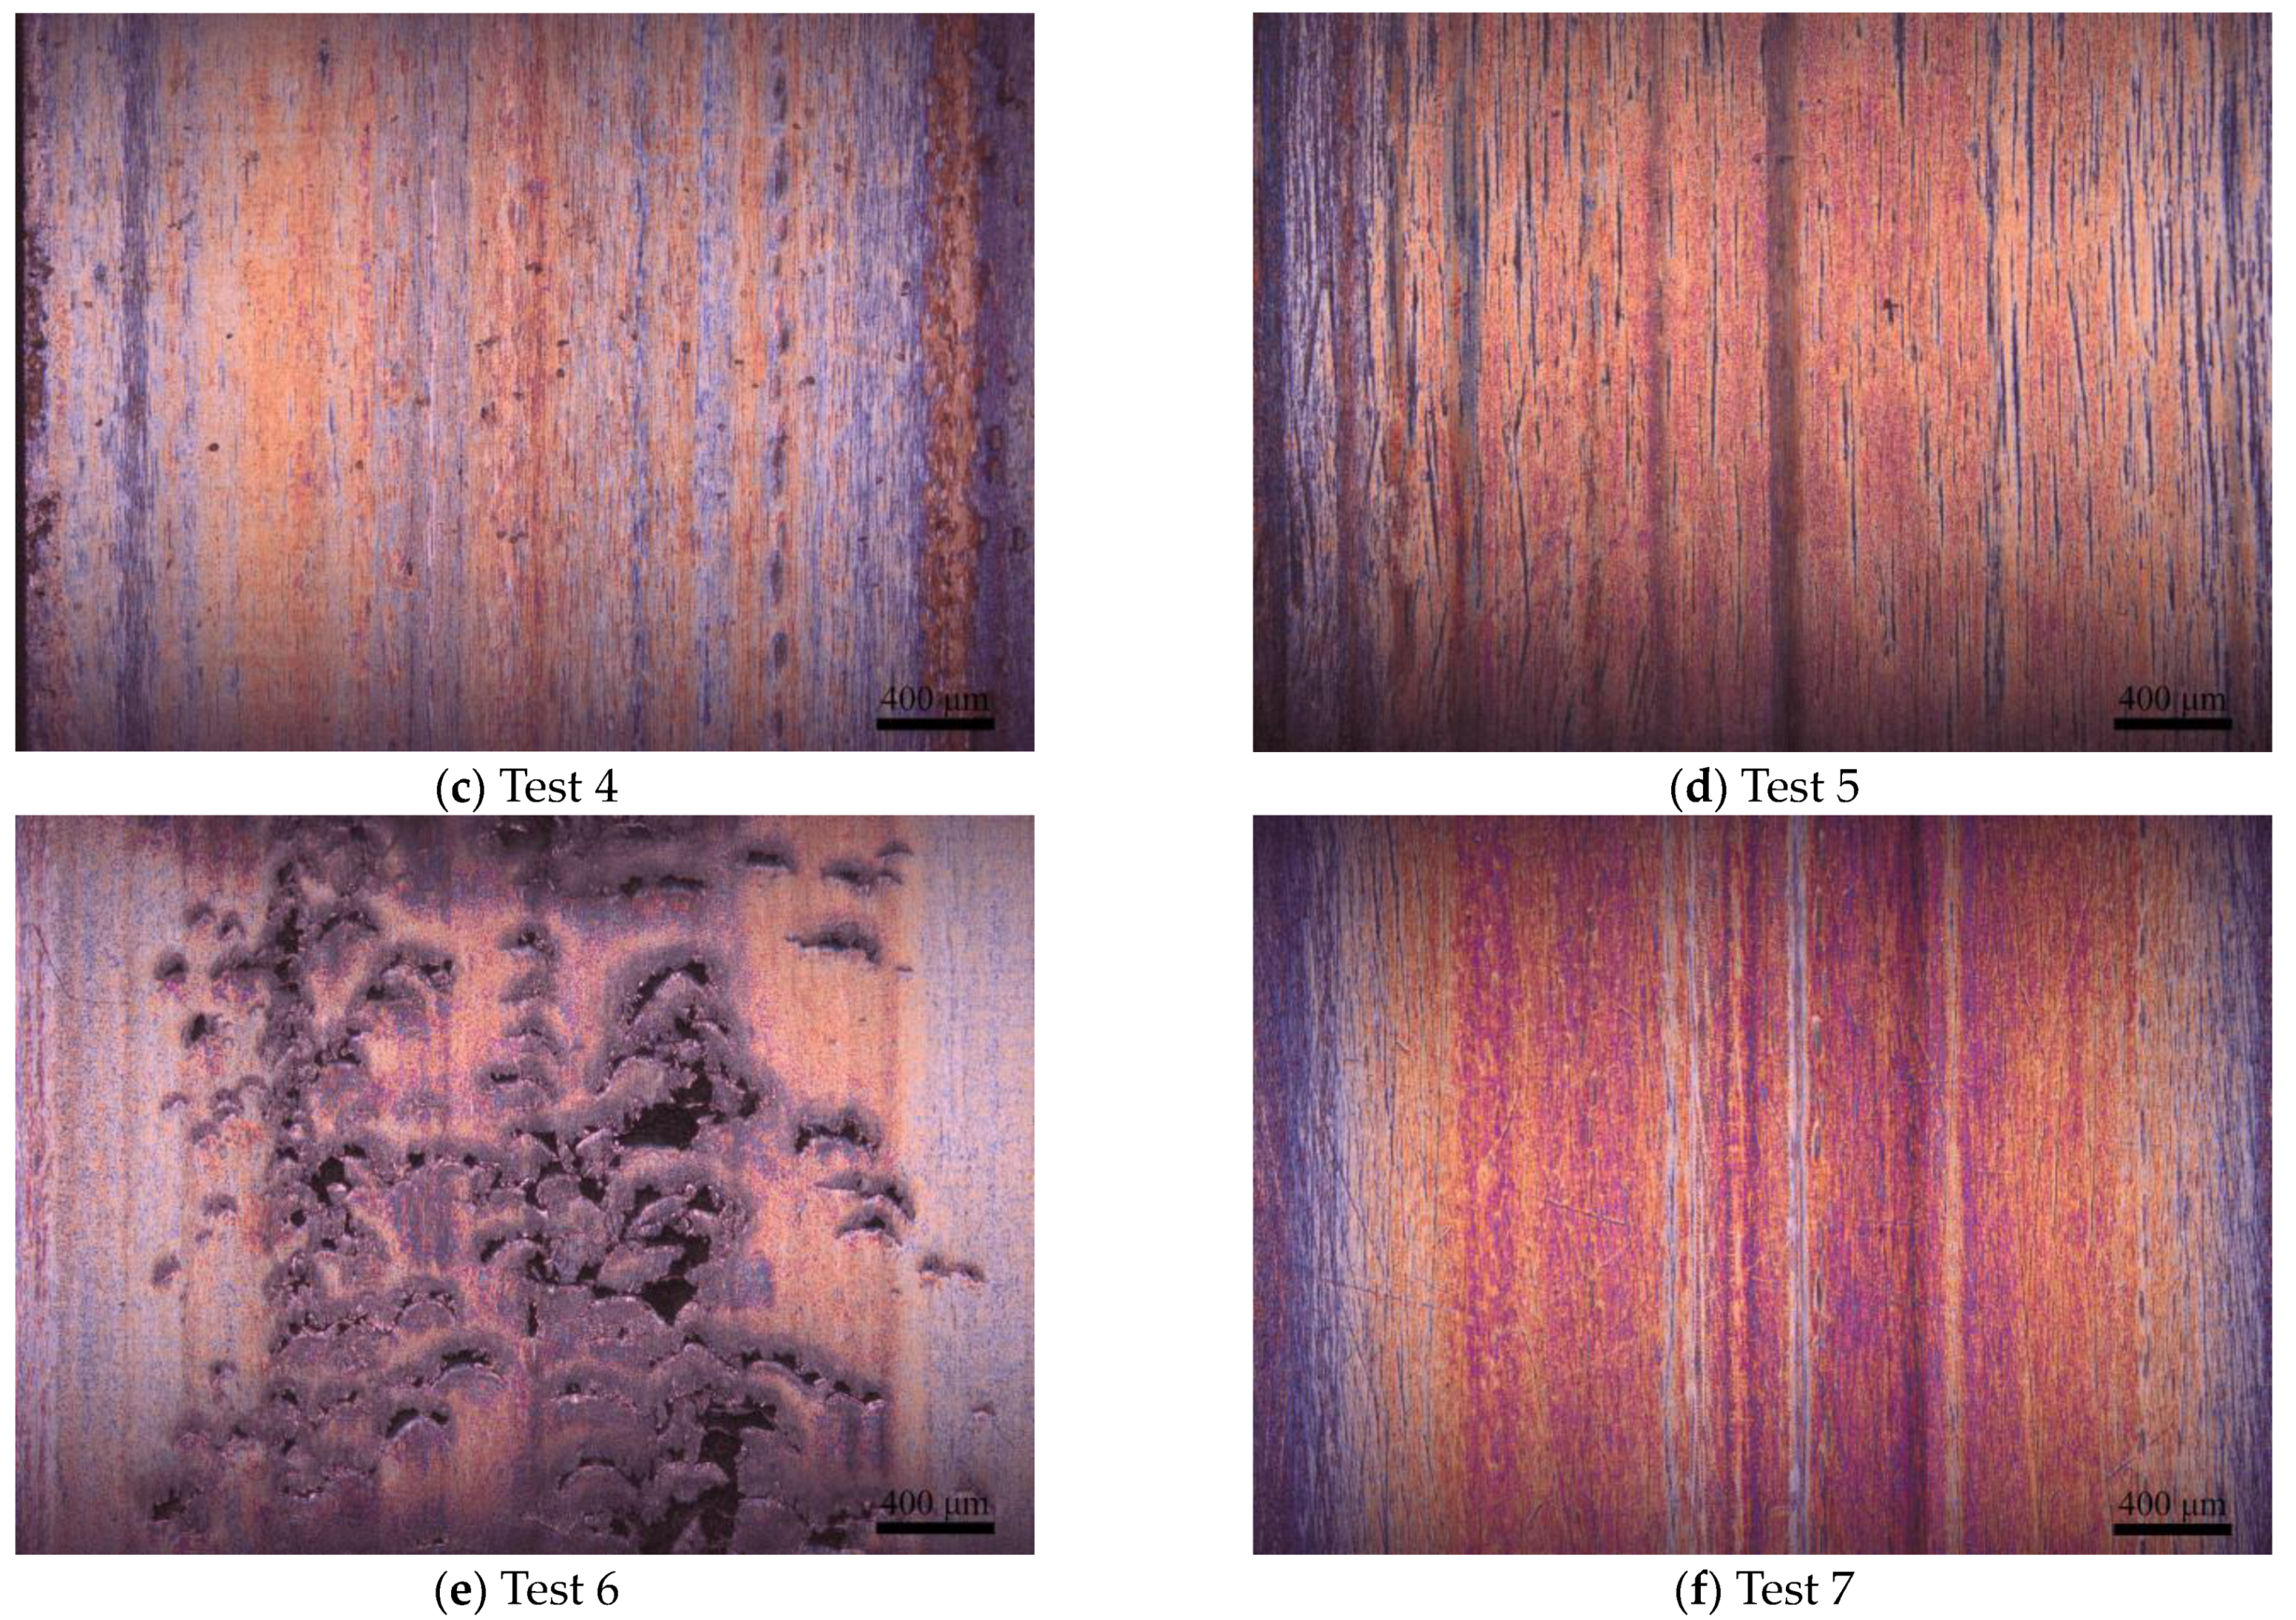
Figure 5.
Surface images of the 26 mm discs for (a) Test 2, (b) Test 3, (c) Test 4, (d) Test 5, (e) Test 6 and (f) Test 7. The arrow indicates the rolling direction for all the images, and the scale bar at the bottom right of the images shows 400 µm.
Figure 5.
Surface images of the 26 mm discs for (a) Test 2, (b) Test 3, (c) Test 4, (d) Test 5, (e) Test 6 and (f) Test 7. The arrow indicates the rolling direction for all the images, and the scale bar at the bottom right of the images shows 400 µm.
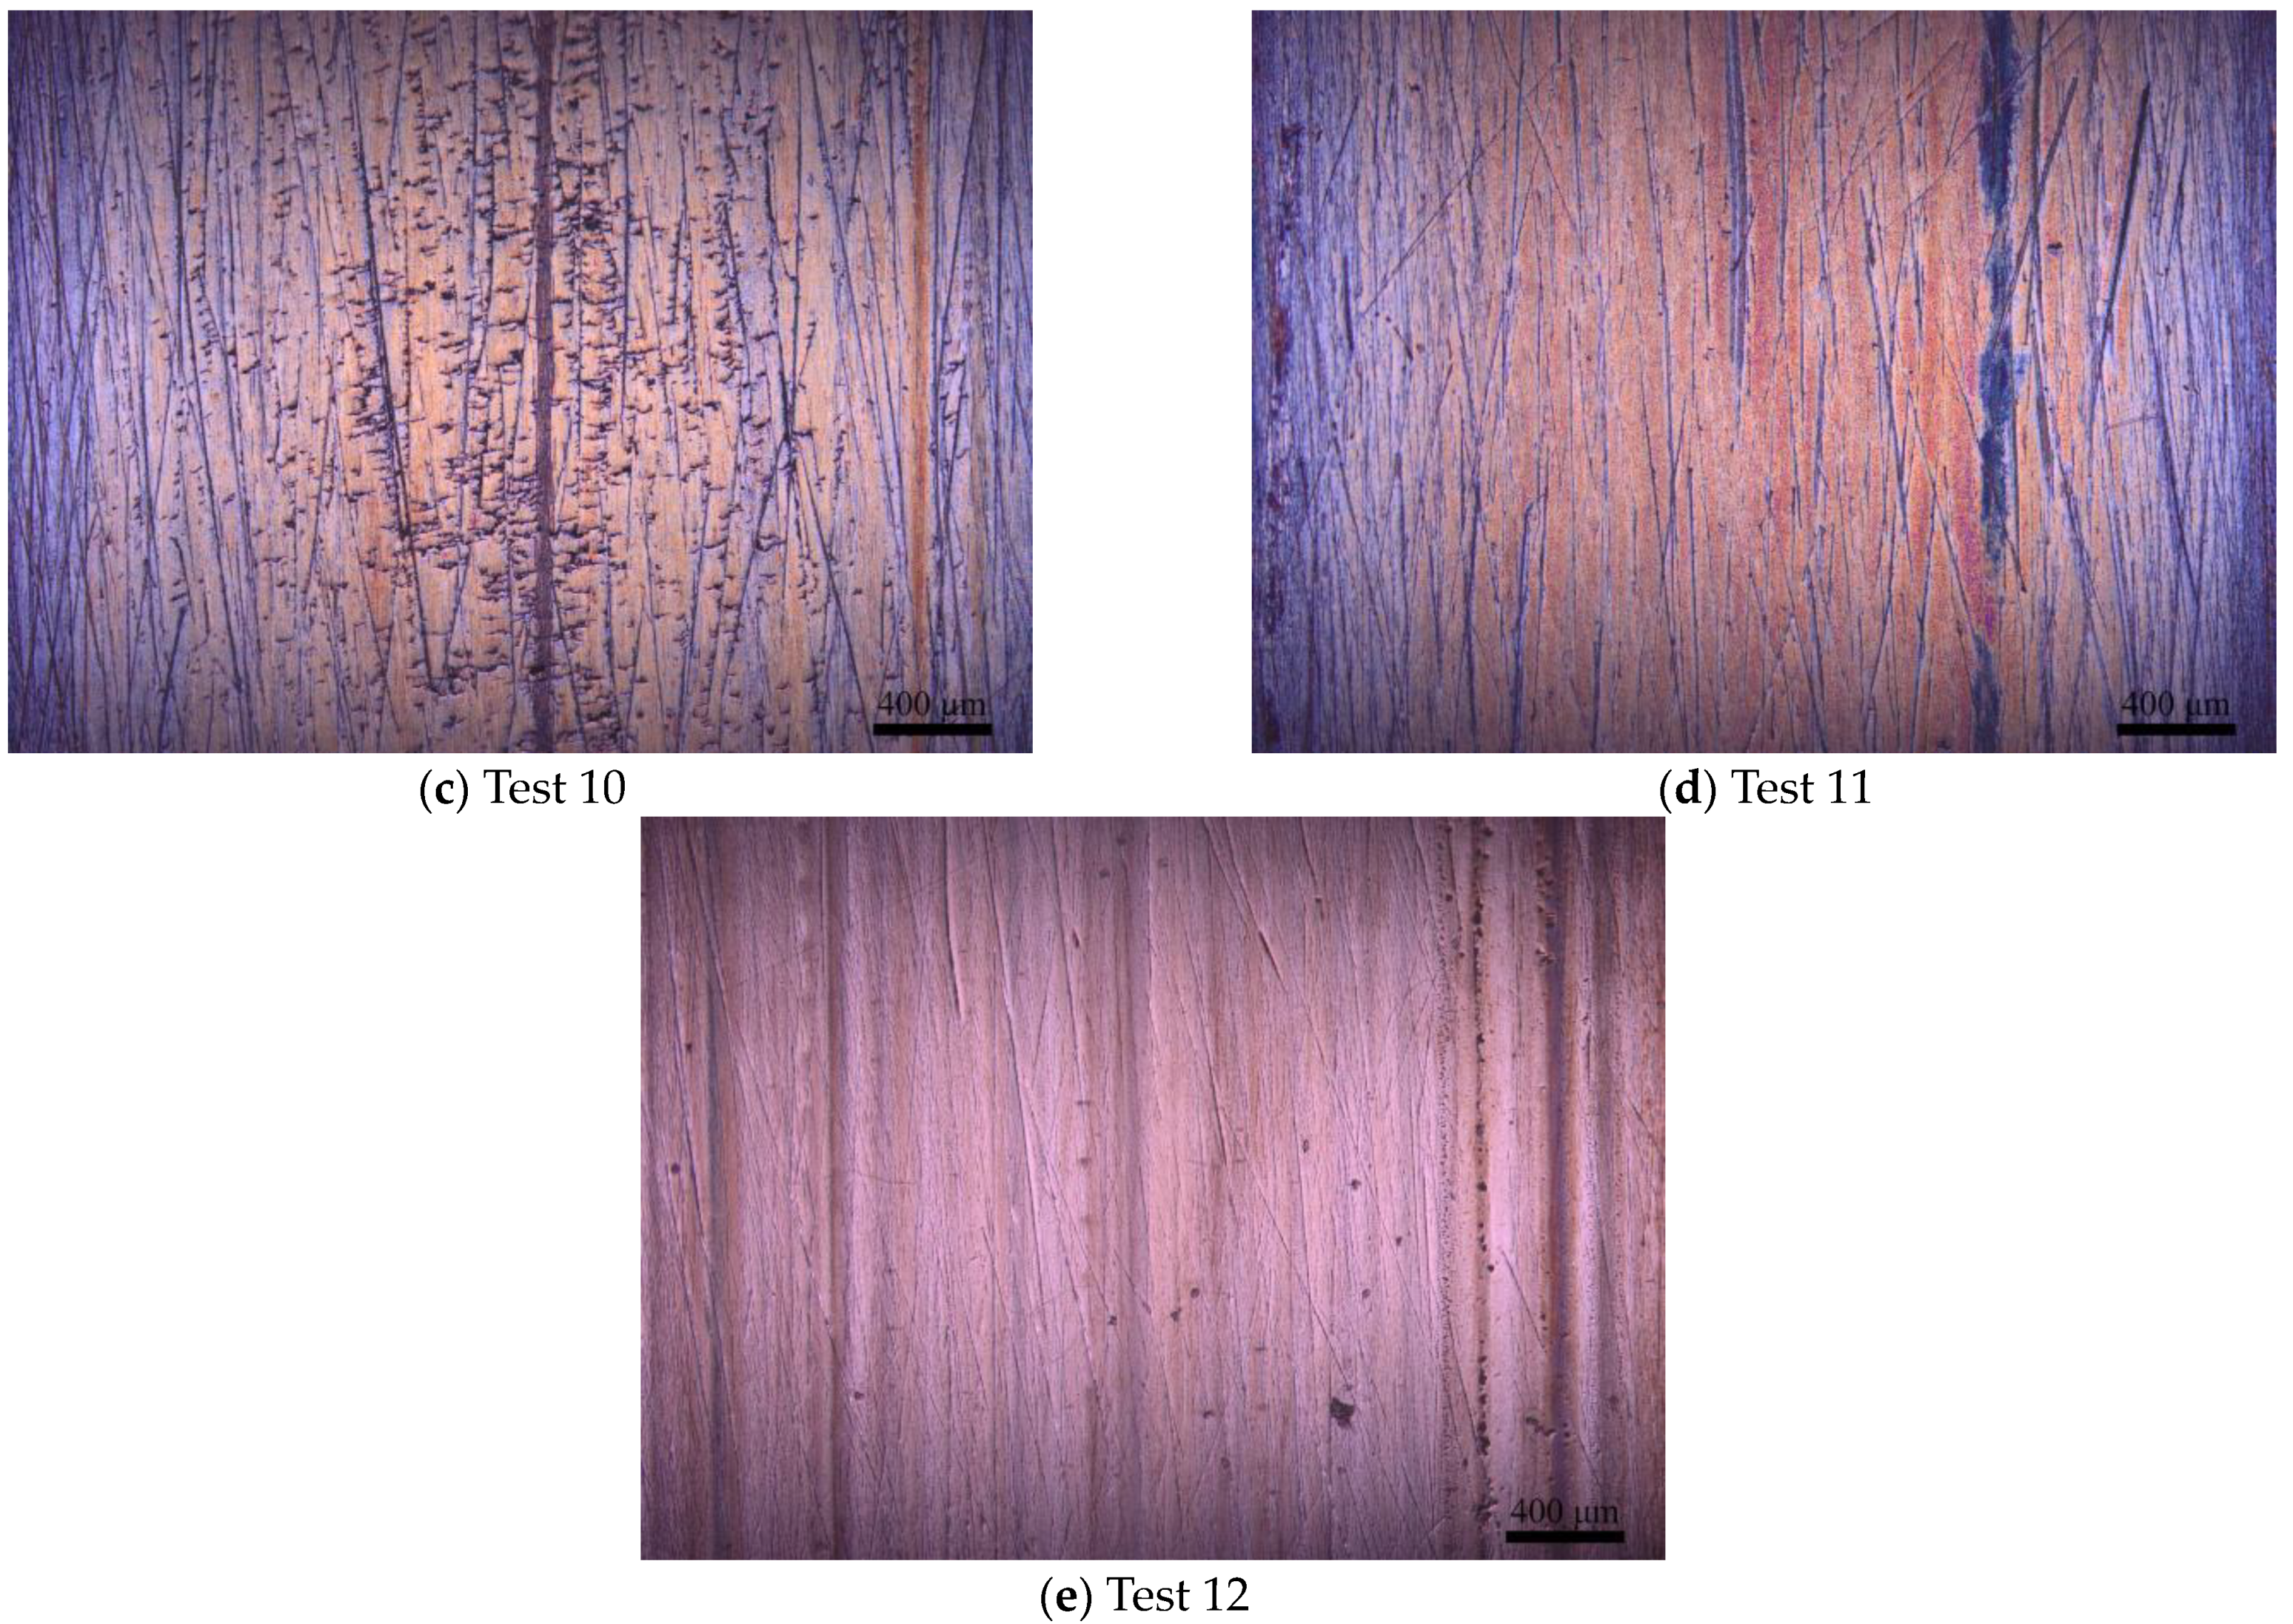
Figure 6.
Surface images of the 26 mm discs for (a) Test 8, (b) Test 9, (c) Test 10, (d) Test 11 and (e) Test 12. The arrow indicates the rolling direction for all the images, and the scale bar at the bottom right of the images shows 400 µm.
Figure 6.
Surface images of the 26 mm discs for (a) Test 8, (b) Test 9, (c) Test 10, (d) Test 11 and (e) Test 12. The arrow indicates the rolling direction for all the images, and the scale bar at the bottom right of the images shows 400 µm.
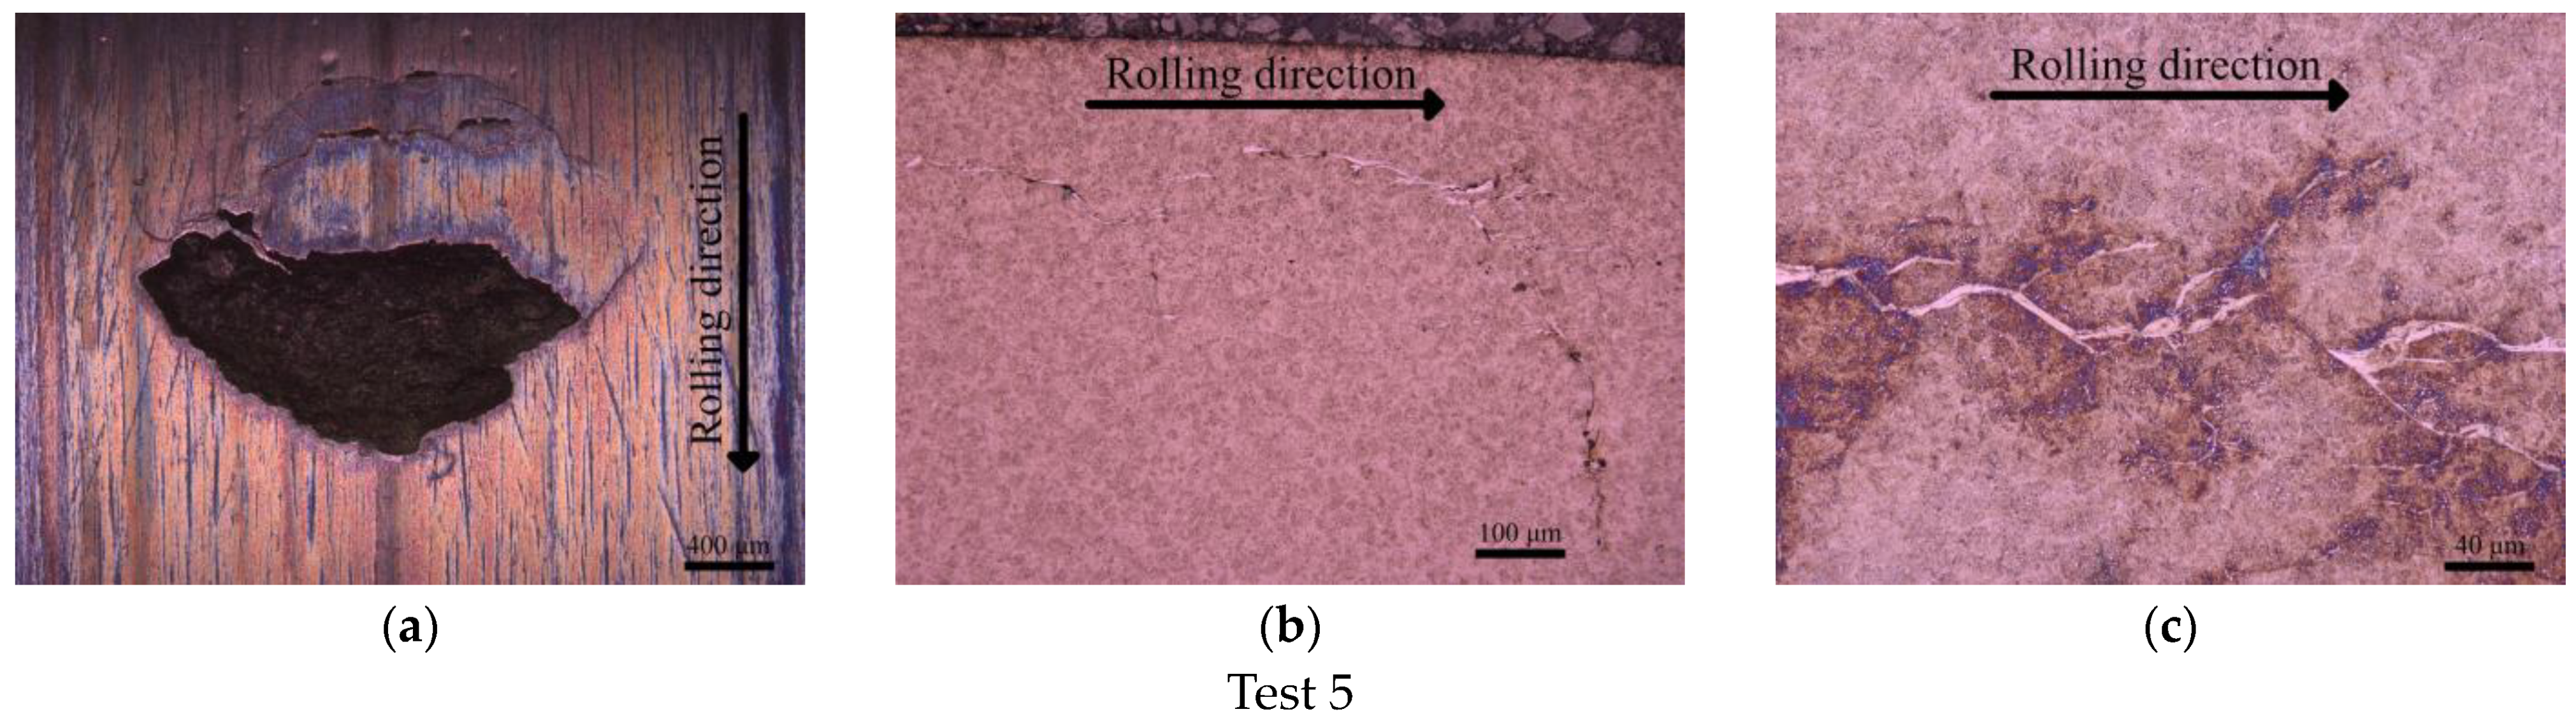
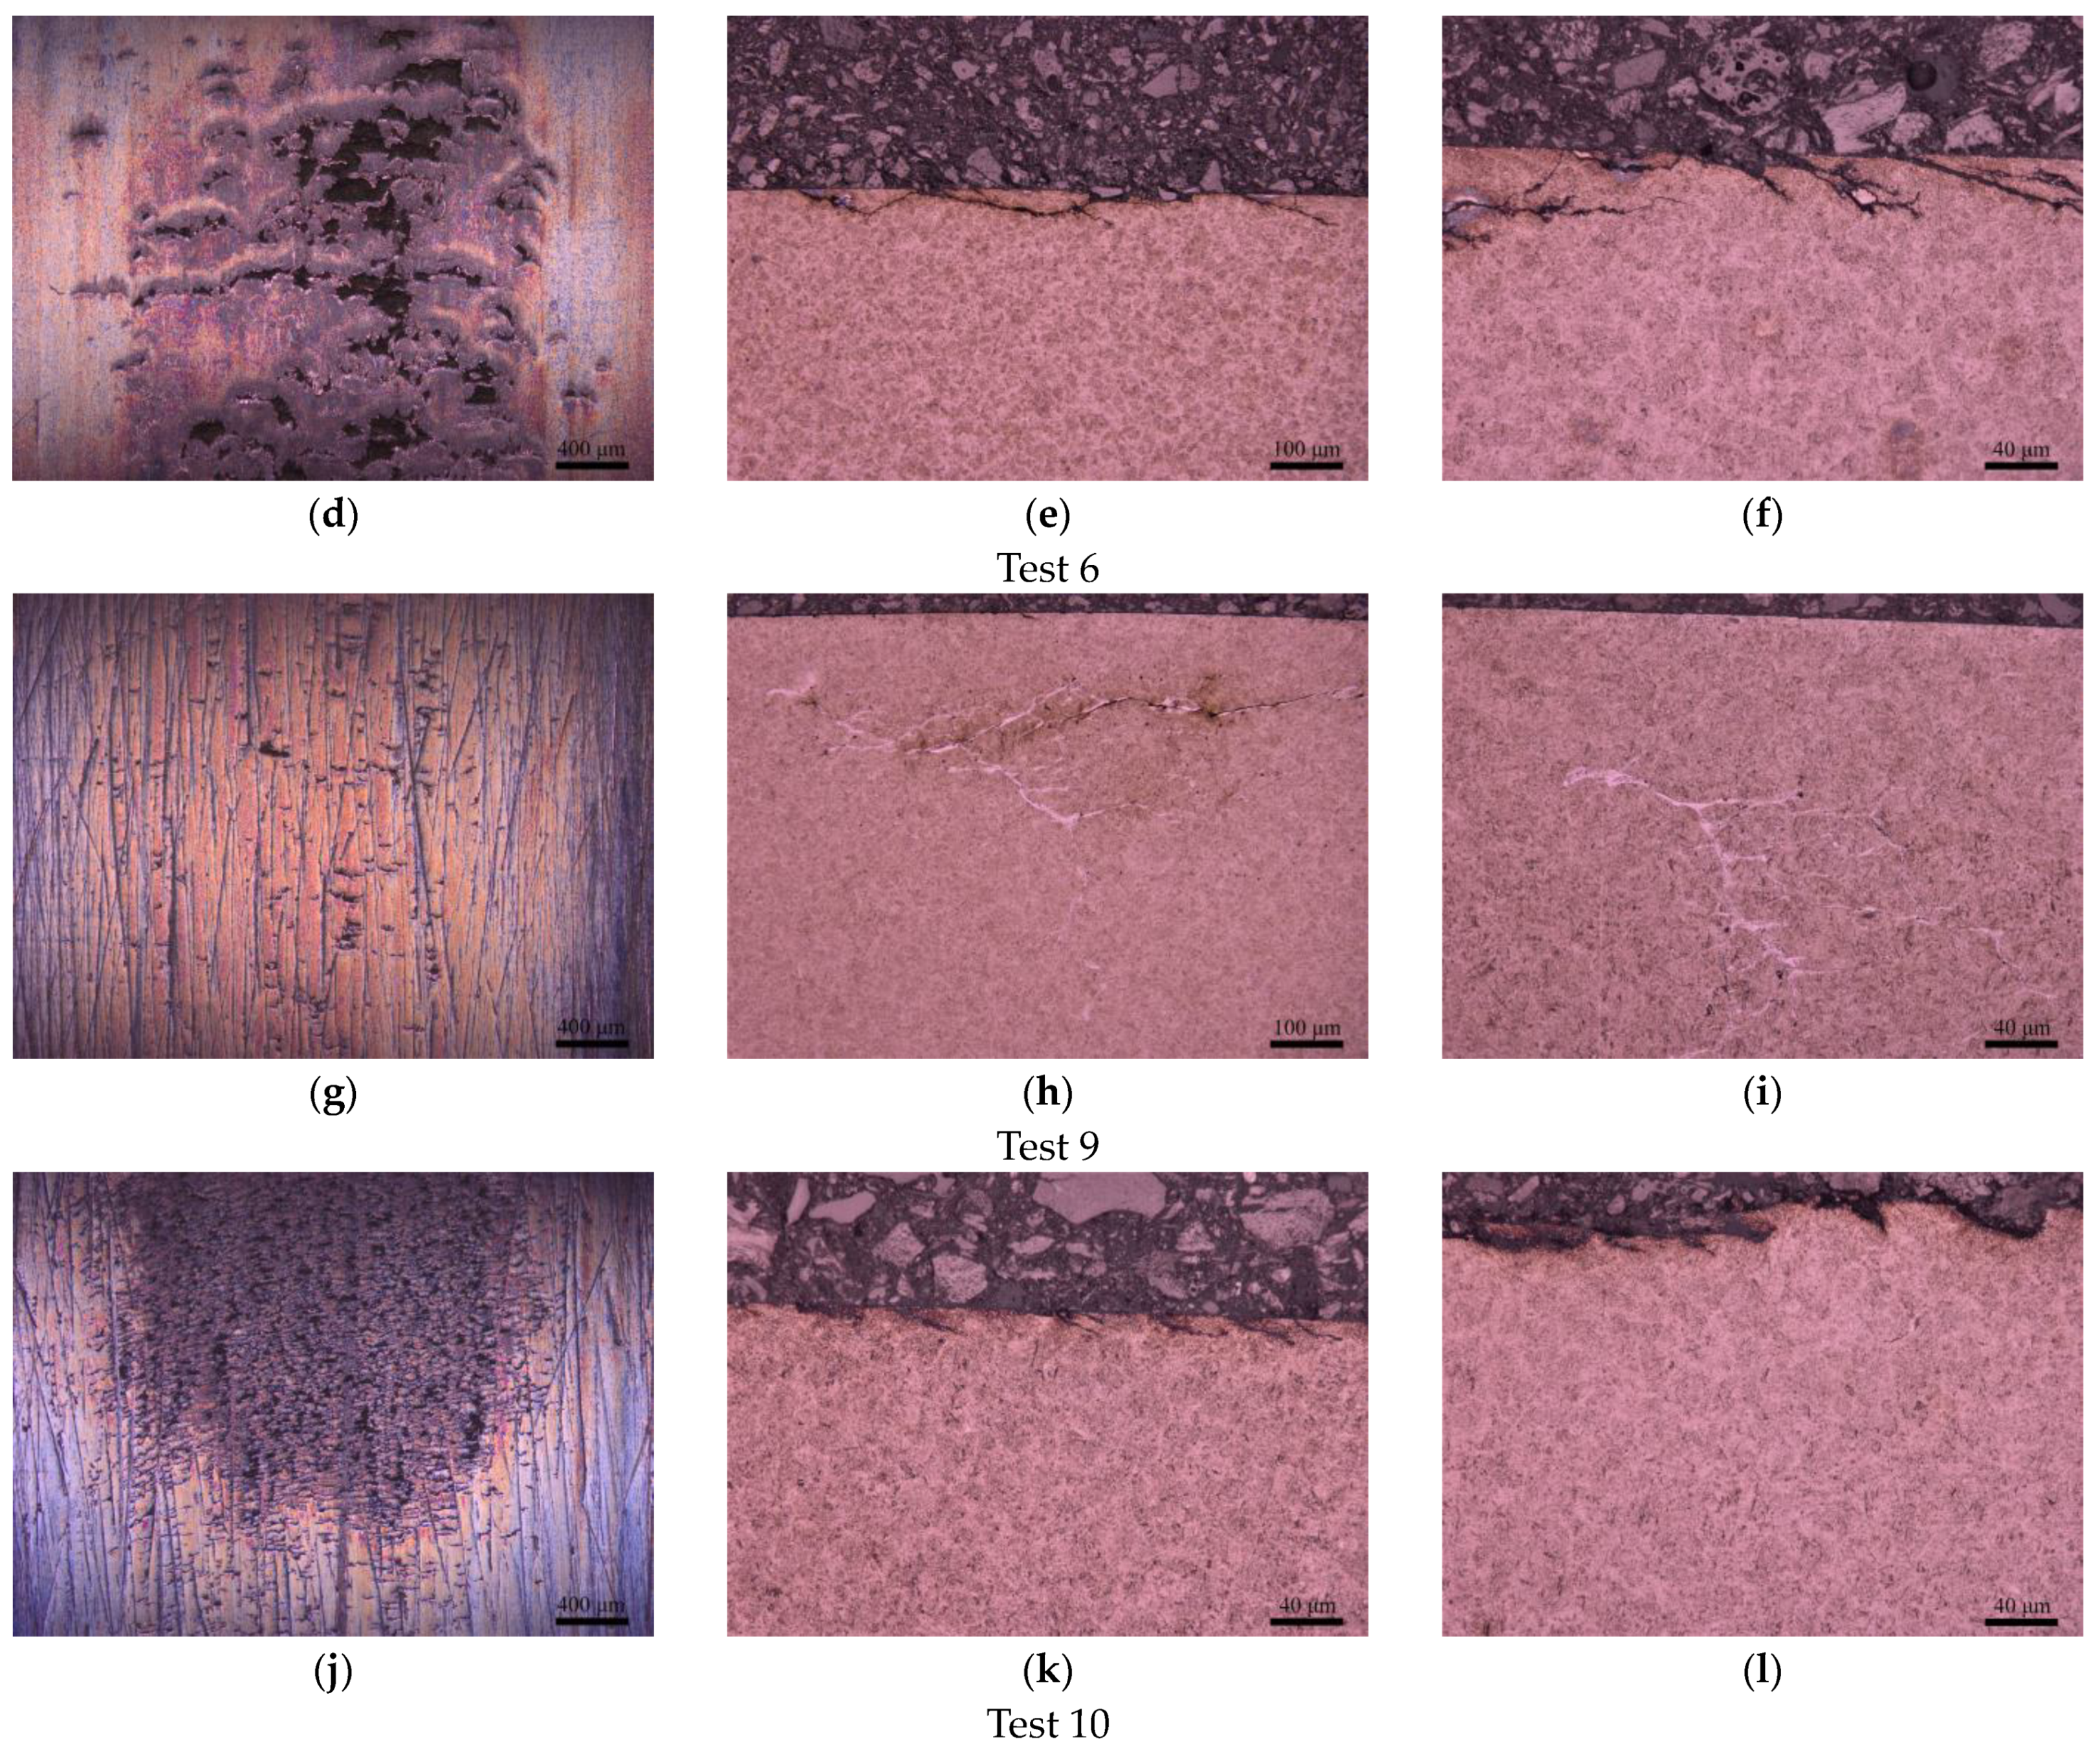
Figure 7.
Surface and subsurface analysis for the 26 mm roller is presented in a row for Tests (a–c) 5, (d–f) 6, (g–i) 9 and (j–l) 10. The arrow indicates the rolling direction for all the images in the column. The scale bar for the left column is 400 µm, for the middle column is 100 µm, and for the right column is 40 µm.
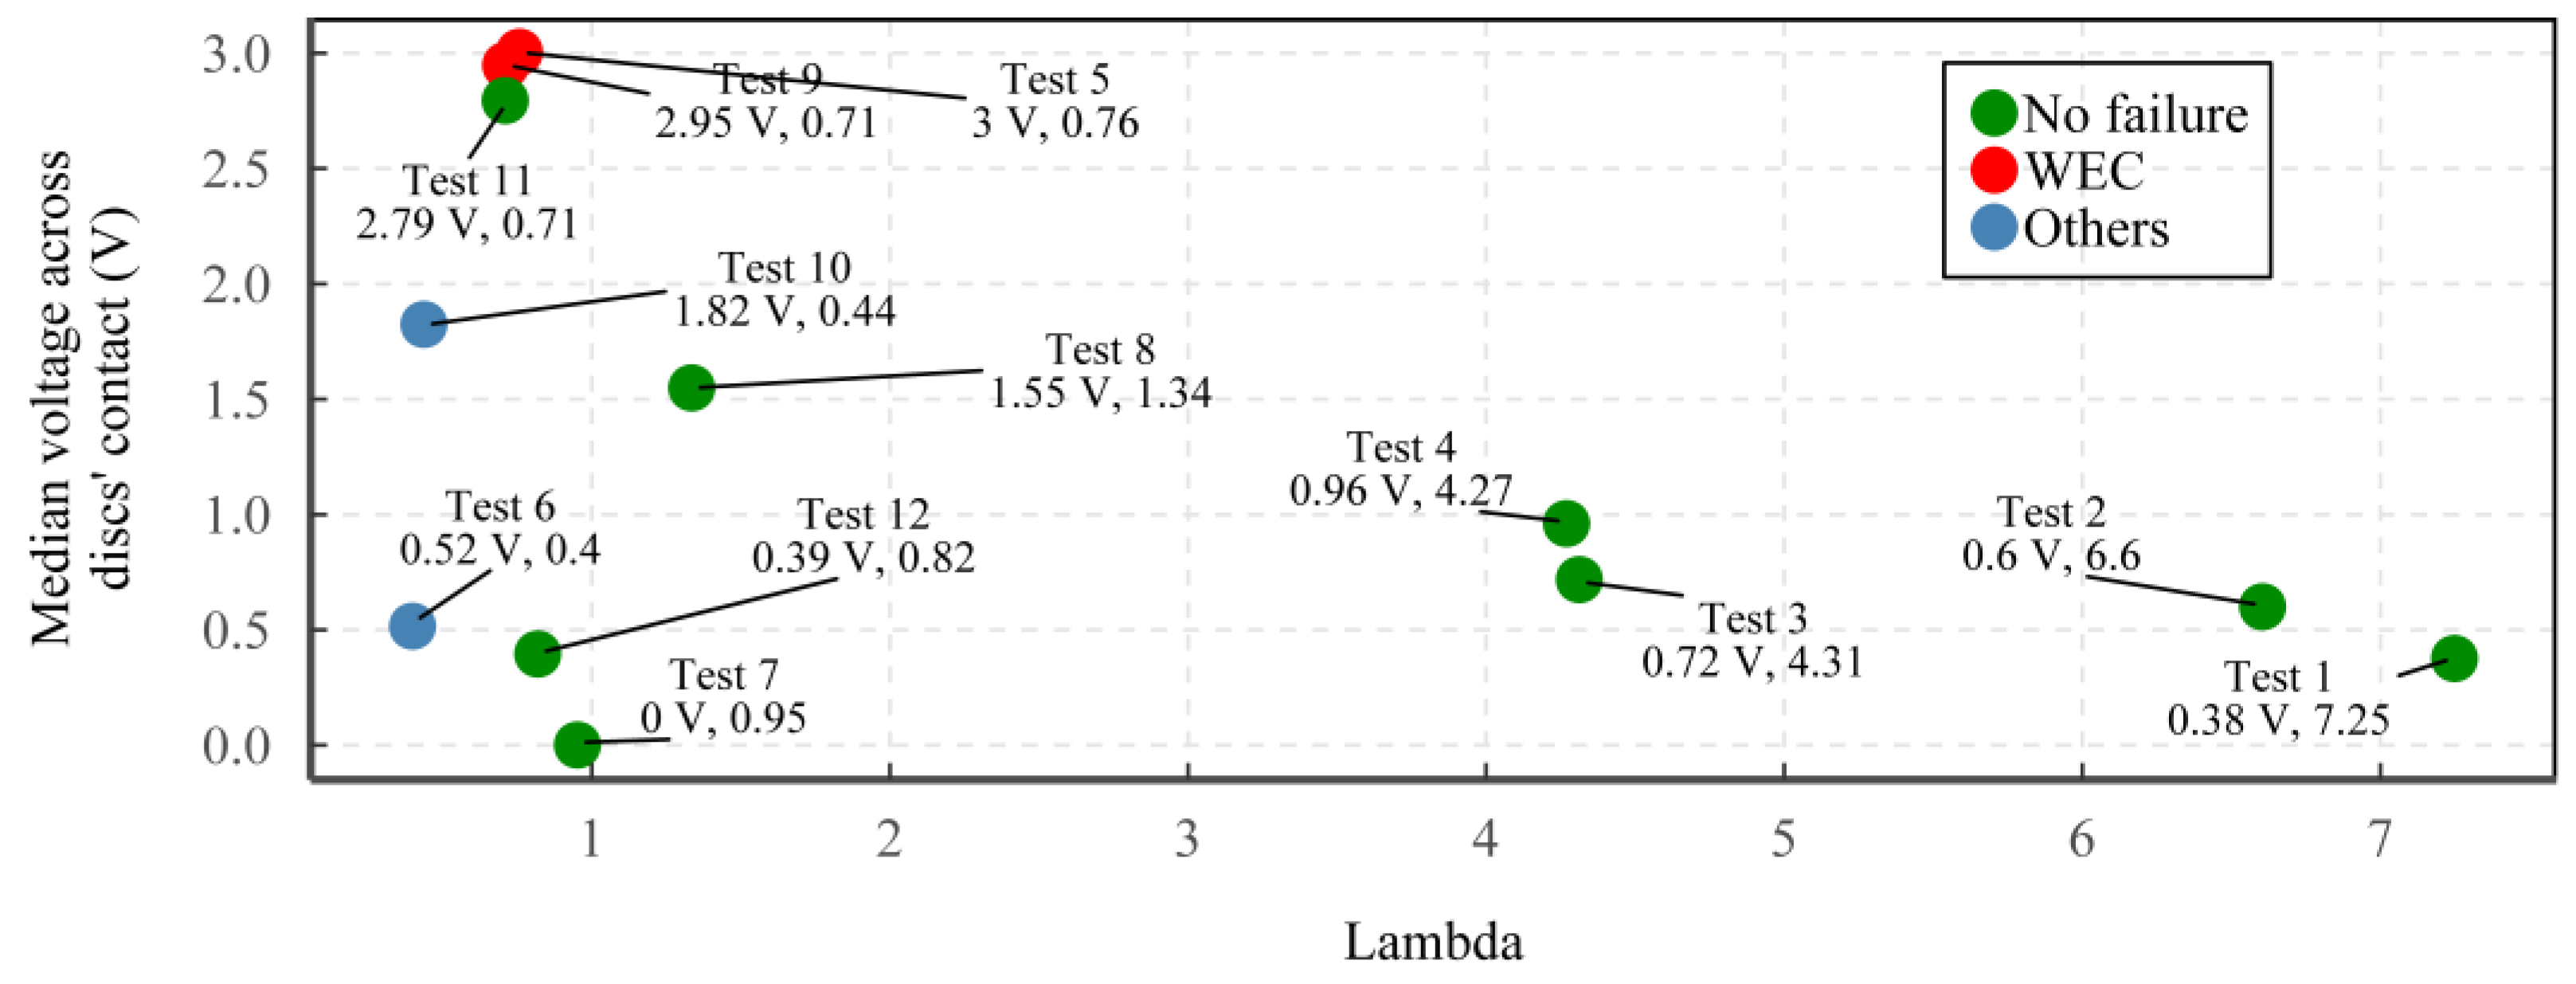
Figure 8.
The plot of the median voltage across the discs’ contact as a function of median lambda for the tests. Test 11 was stopped at 14.93 h to explore the early initiation of WECs.
Figure 8.
The plot of the median voltage across the discs’ contact as a function of median lambda for the tests. Test 11 was stopped at 14.93 h to explore the early initiation of WECs.
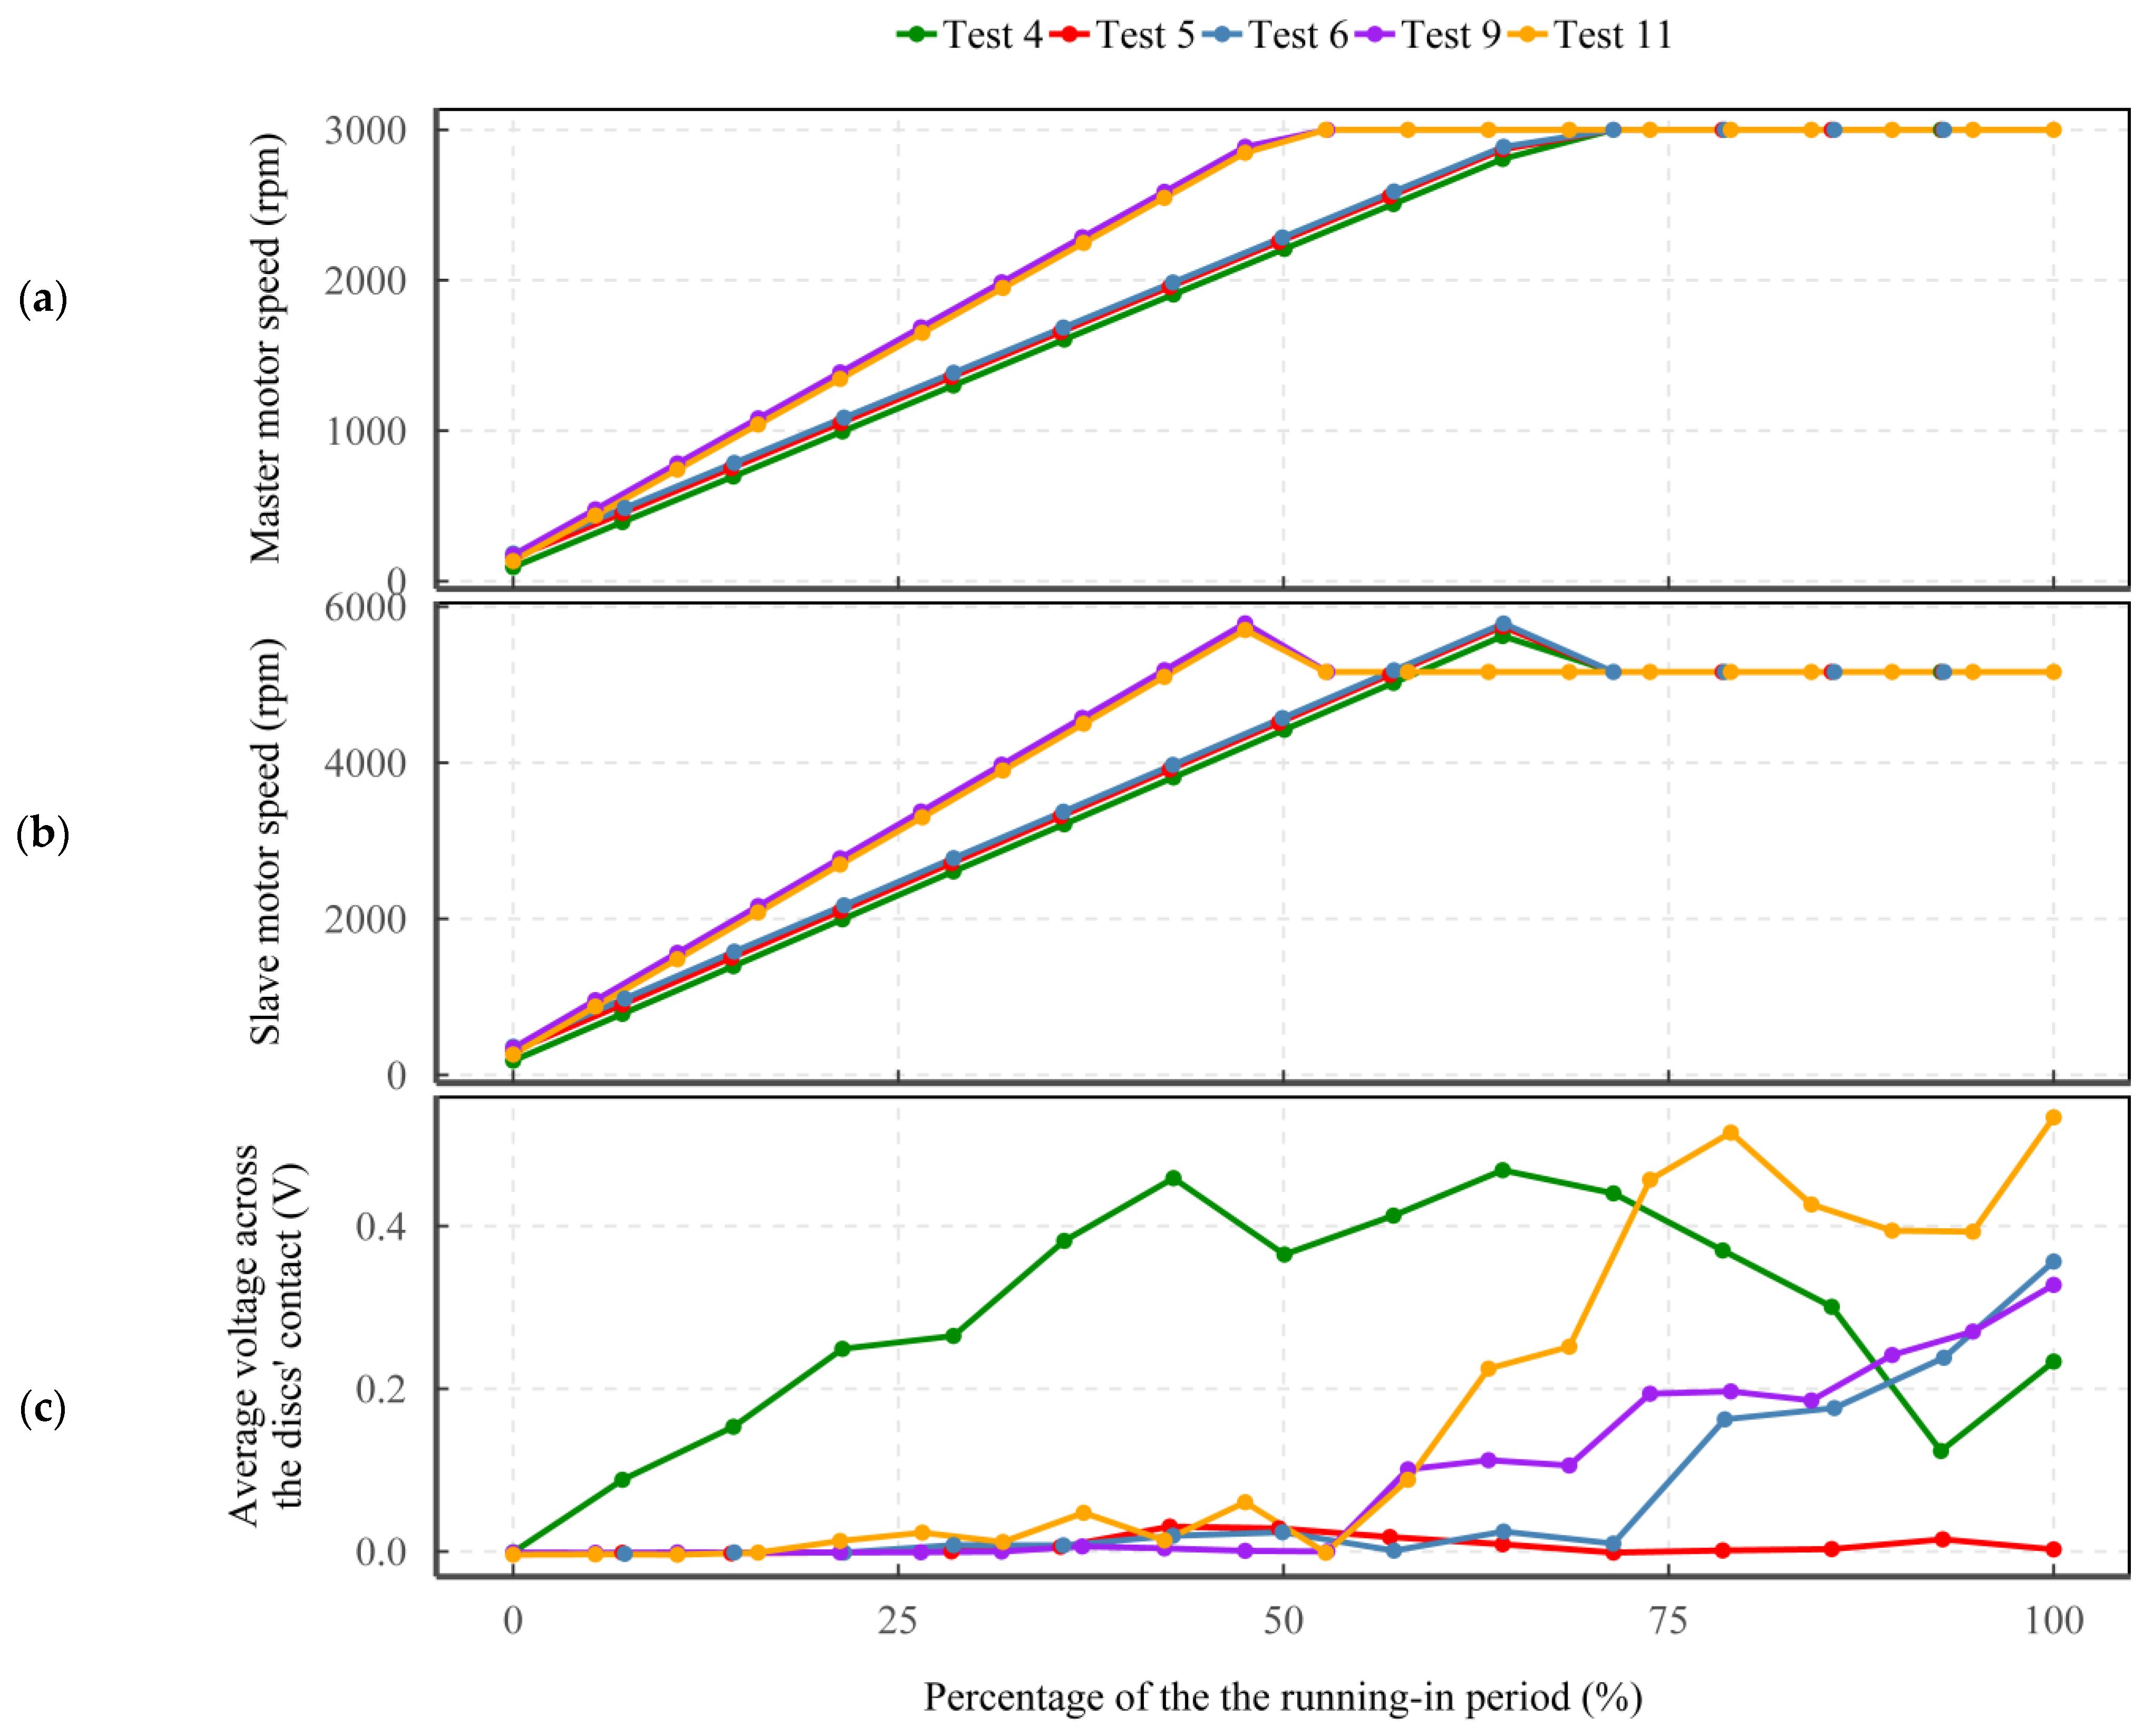
Figure 9.
The details of rotational speeds and average VADC during the running-in period for Tests 4, 5, 6, 9 and 11, with (a) master motor shaft speed for the 52 mm disc, (b) slave motor shaft speed for the 26 mm disc and (c) voltage across the discs’ contact.
Figure 9.
The details of rotational speeds and average VADC during the running-in period for Tests 4, 5, 6, 9 and 11, with (a) master motor shaft speed for the 52 mm disc, (b) slave motor shaft speed for the 26 mm disc and (c) voltage across the discs’ contact.
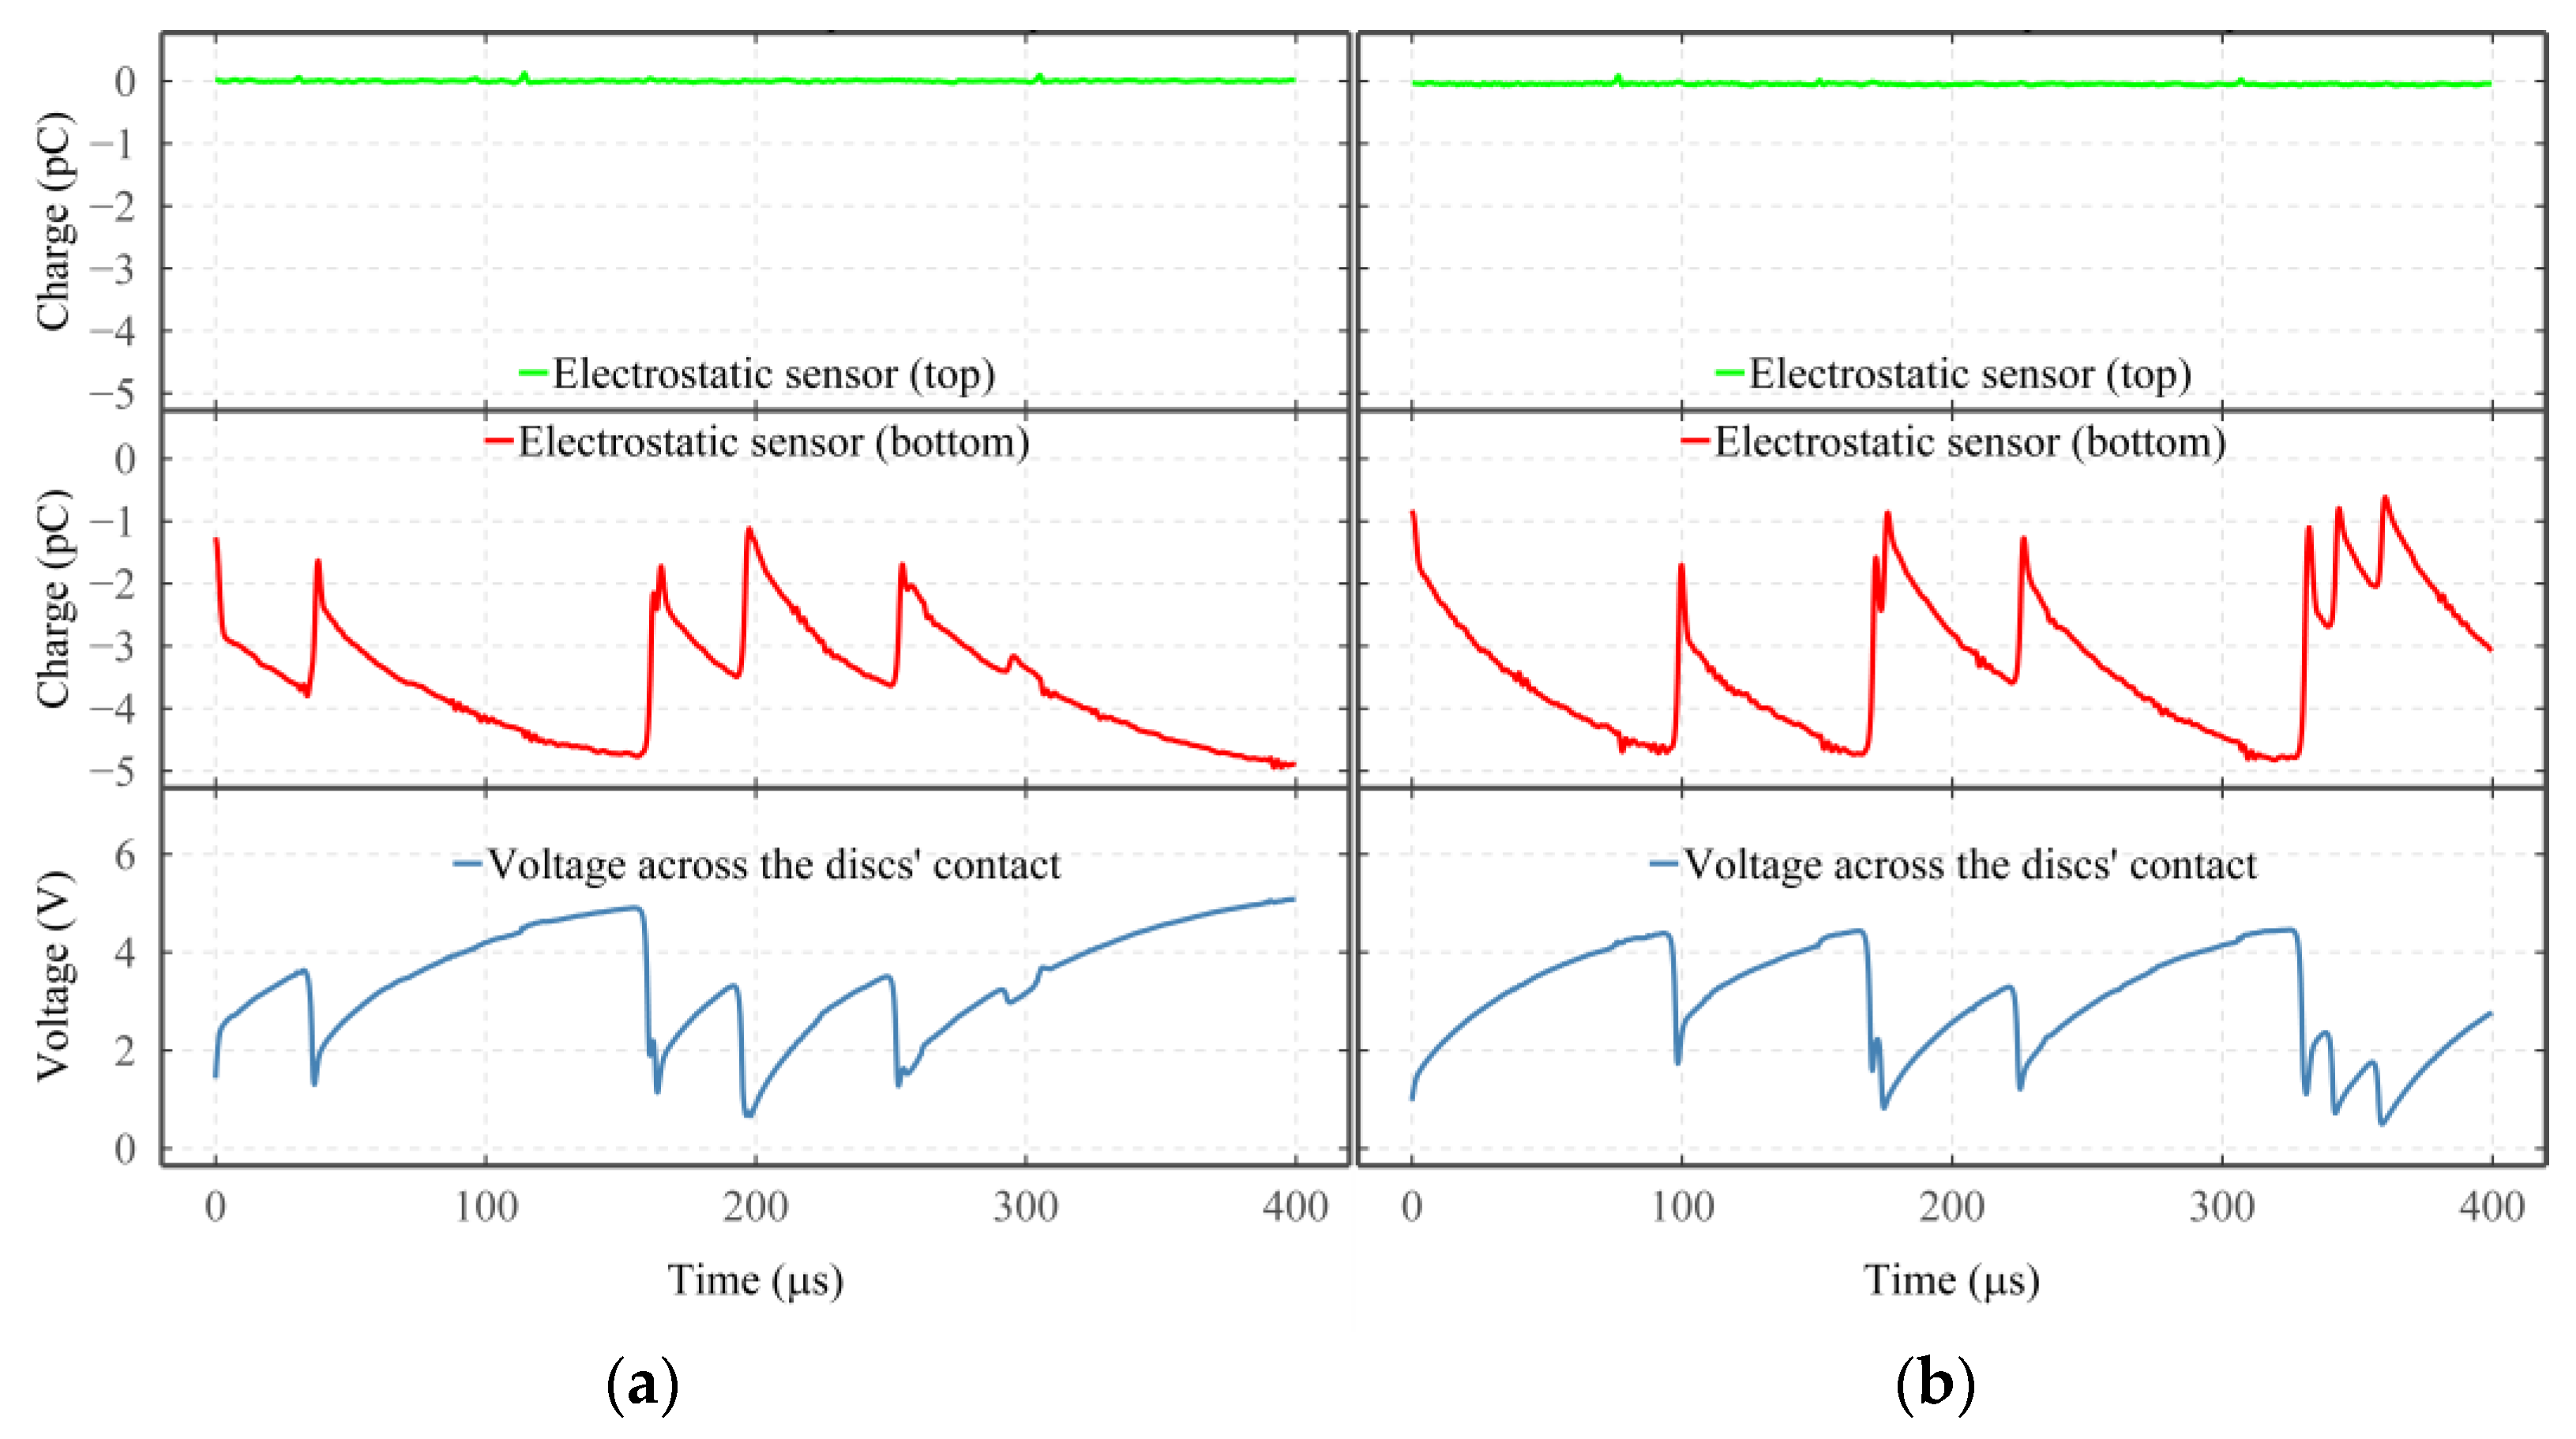
Figure 10.
The responses of the ES sensors and VADC captured at (a) 59 h and (b) 245 h of the 285 h running time in Test 3, corresponding to 20% and 86% of the test duration. Operating conditions: rotational speed of 3000 rpm, radial load of 3340 N (maximal contact pressure of 2.5 GPa), supply voltage of 10 V, SRR of 5%, median lambda of 4.31 and median lubricant inlet temperature of 98.5 °C.
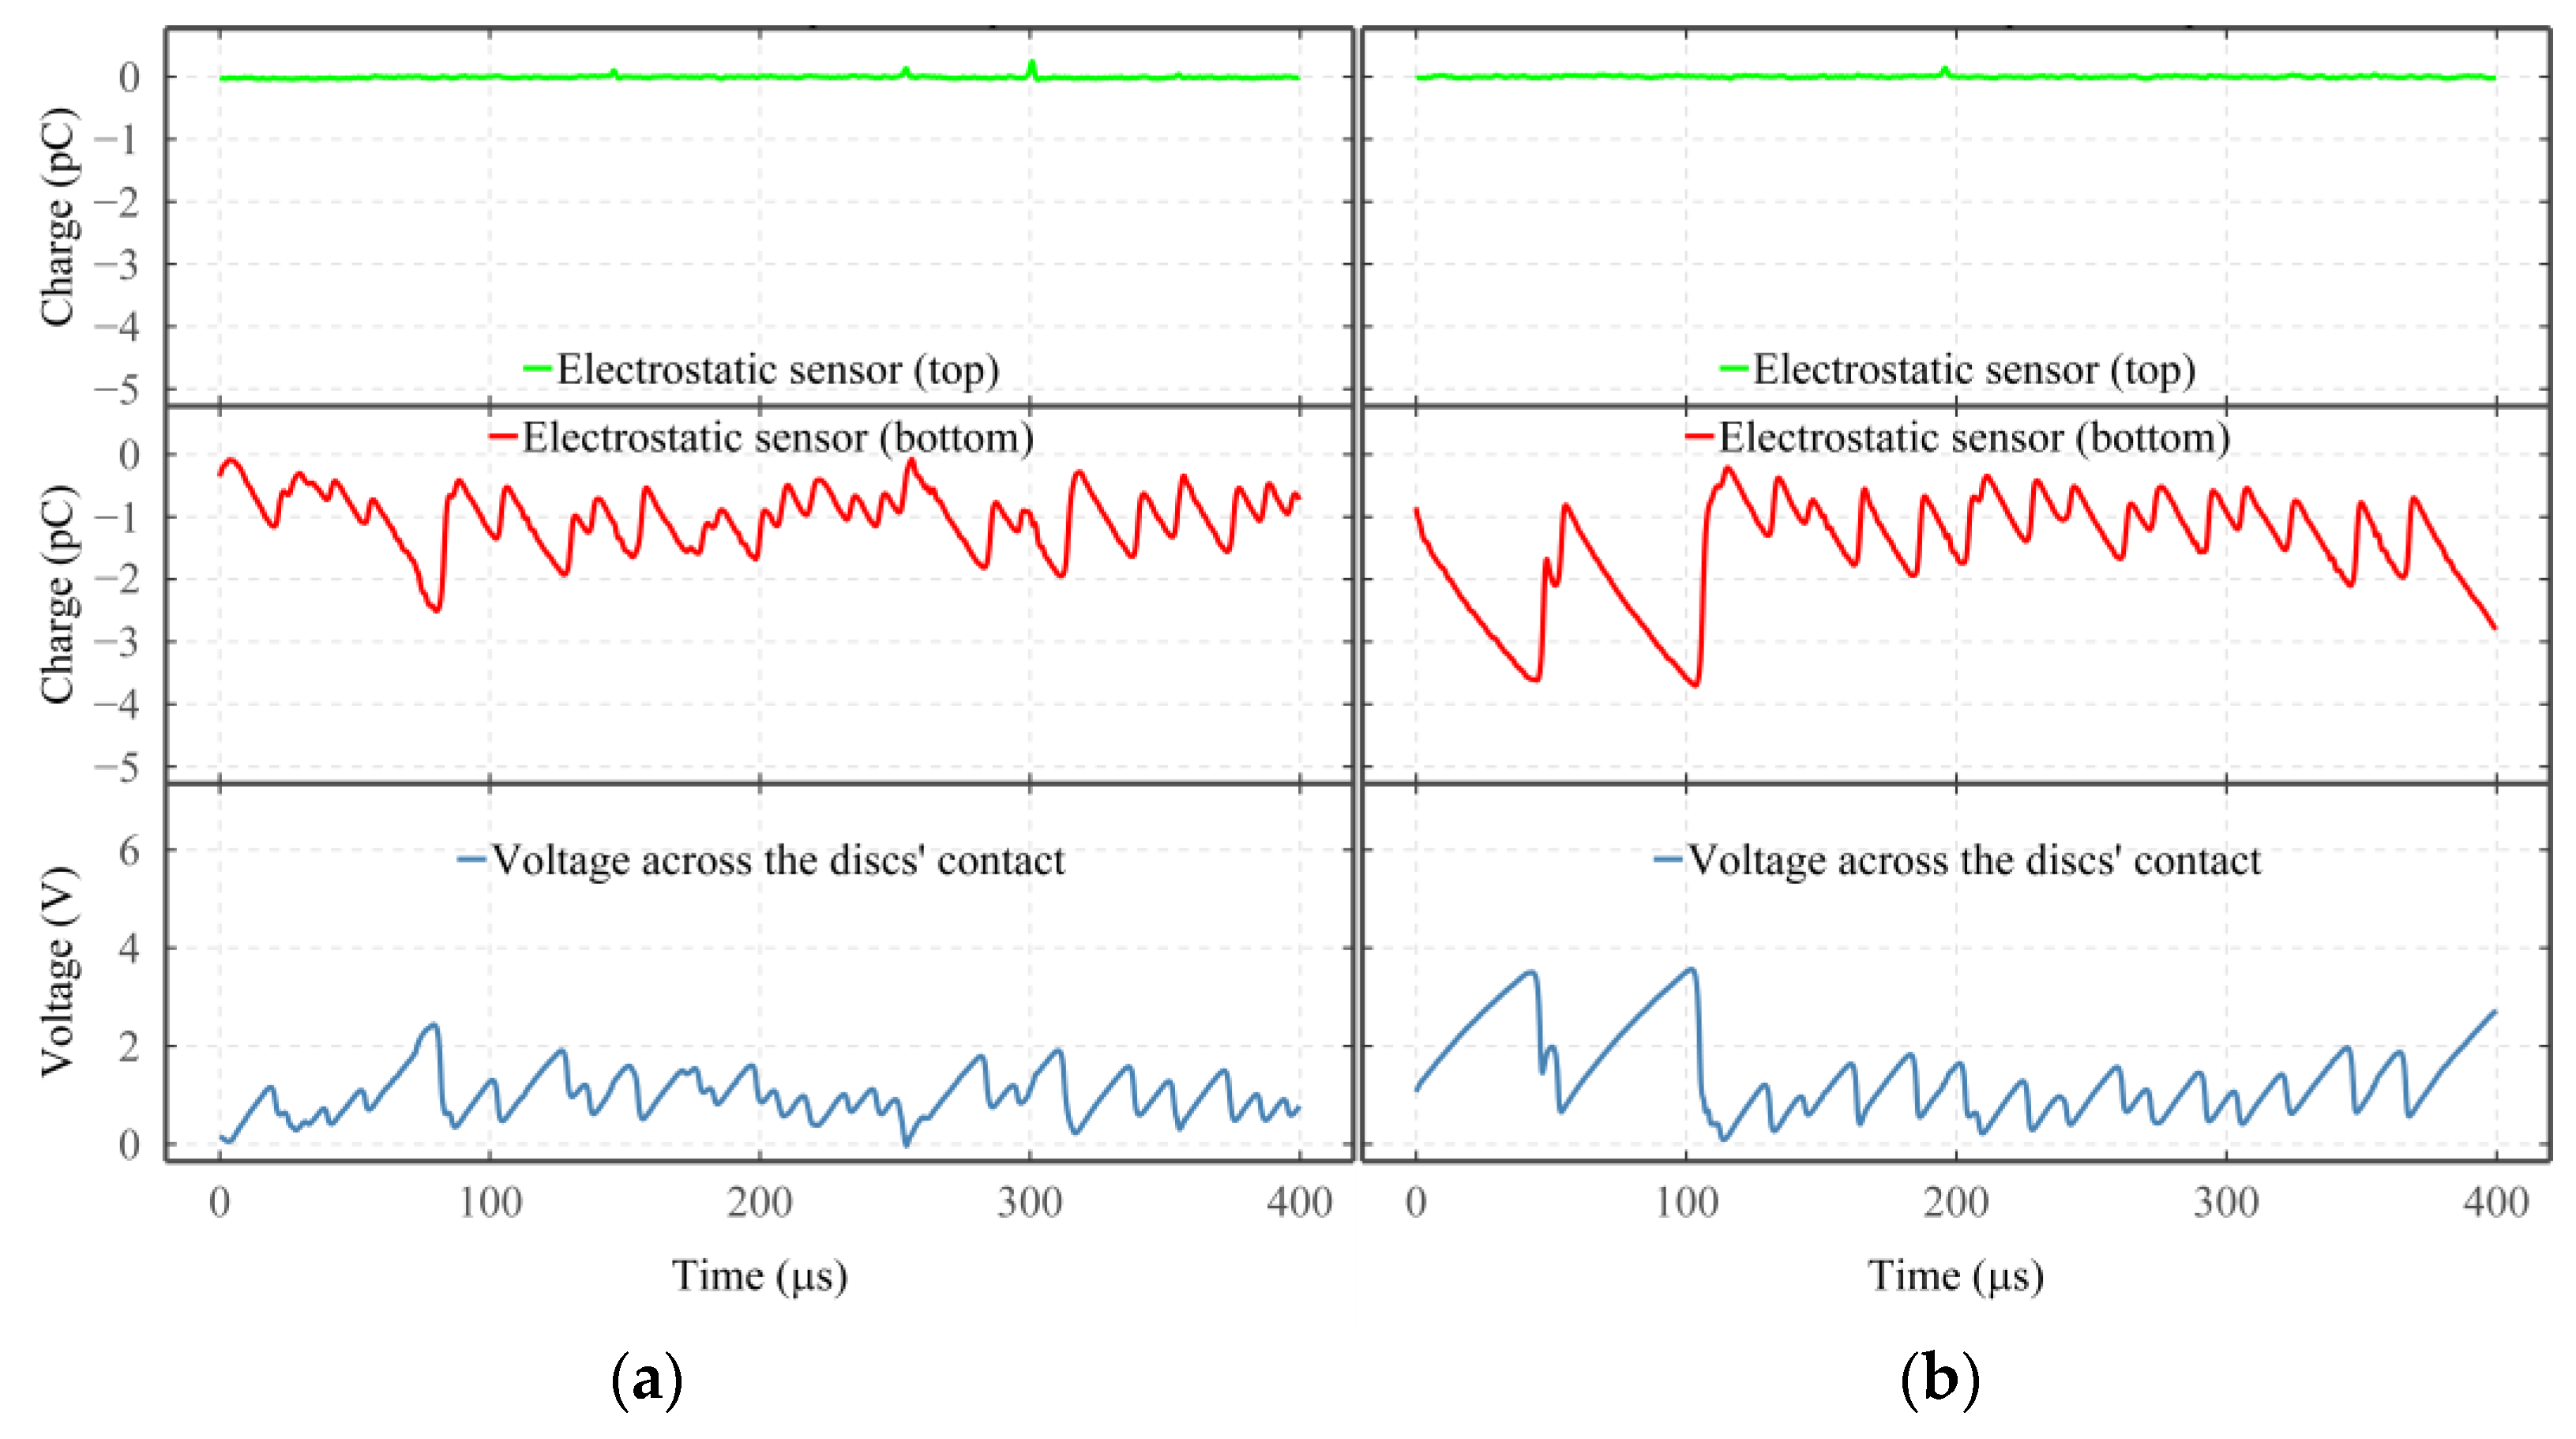
Figure 11.
The responses of the ES sensors and VADC captured at (a) 11 h and (b) 39.82 h of the 39.82 running time in Test 5, corresponding to 28% and 100% of the test duration. Operating conditions: rotational speed of 3000 rpm, radial load of 3340 N (maximal contact pressure of 2.5 GPa), supply voltage of 10 V, SRR of 15%, median lambda of 0.76 and median lubricant inlet temperature of 92.2 °C.
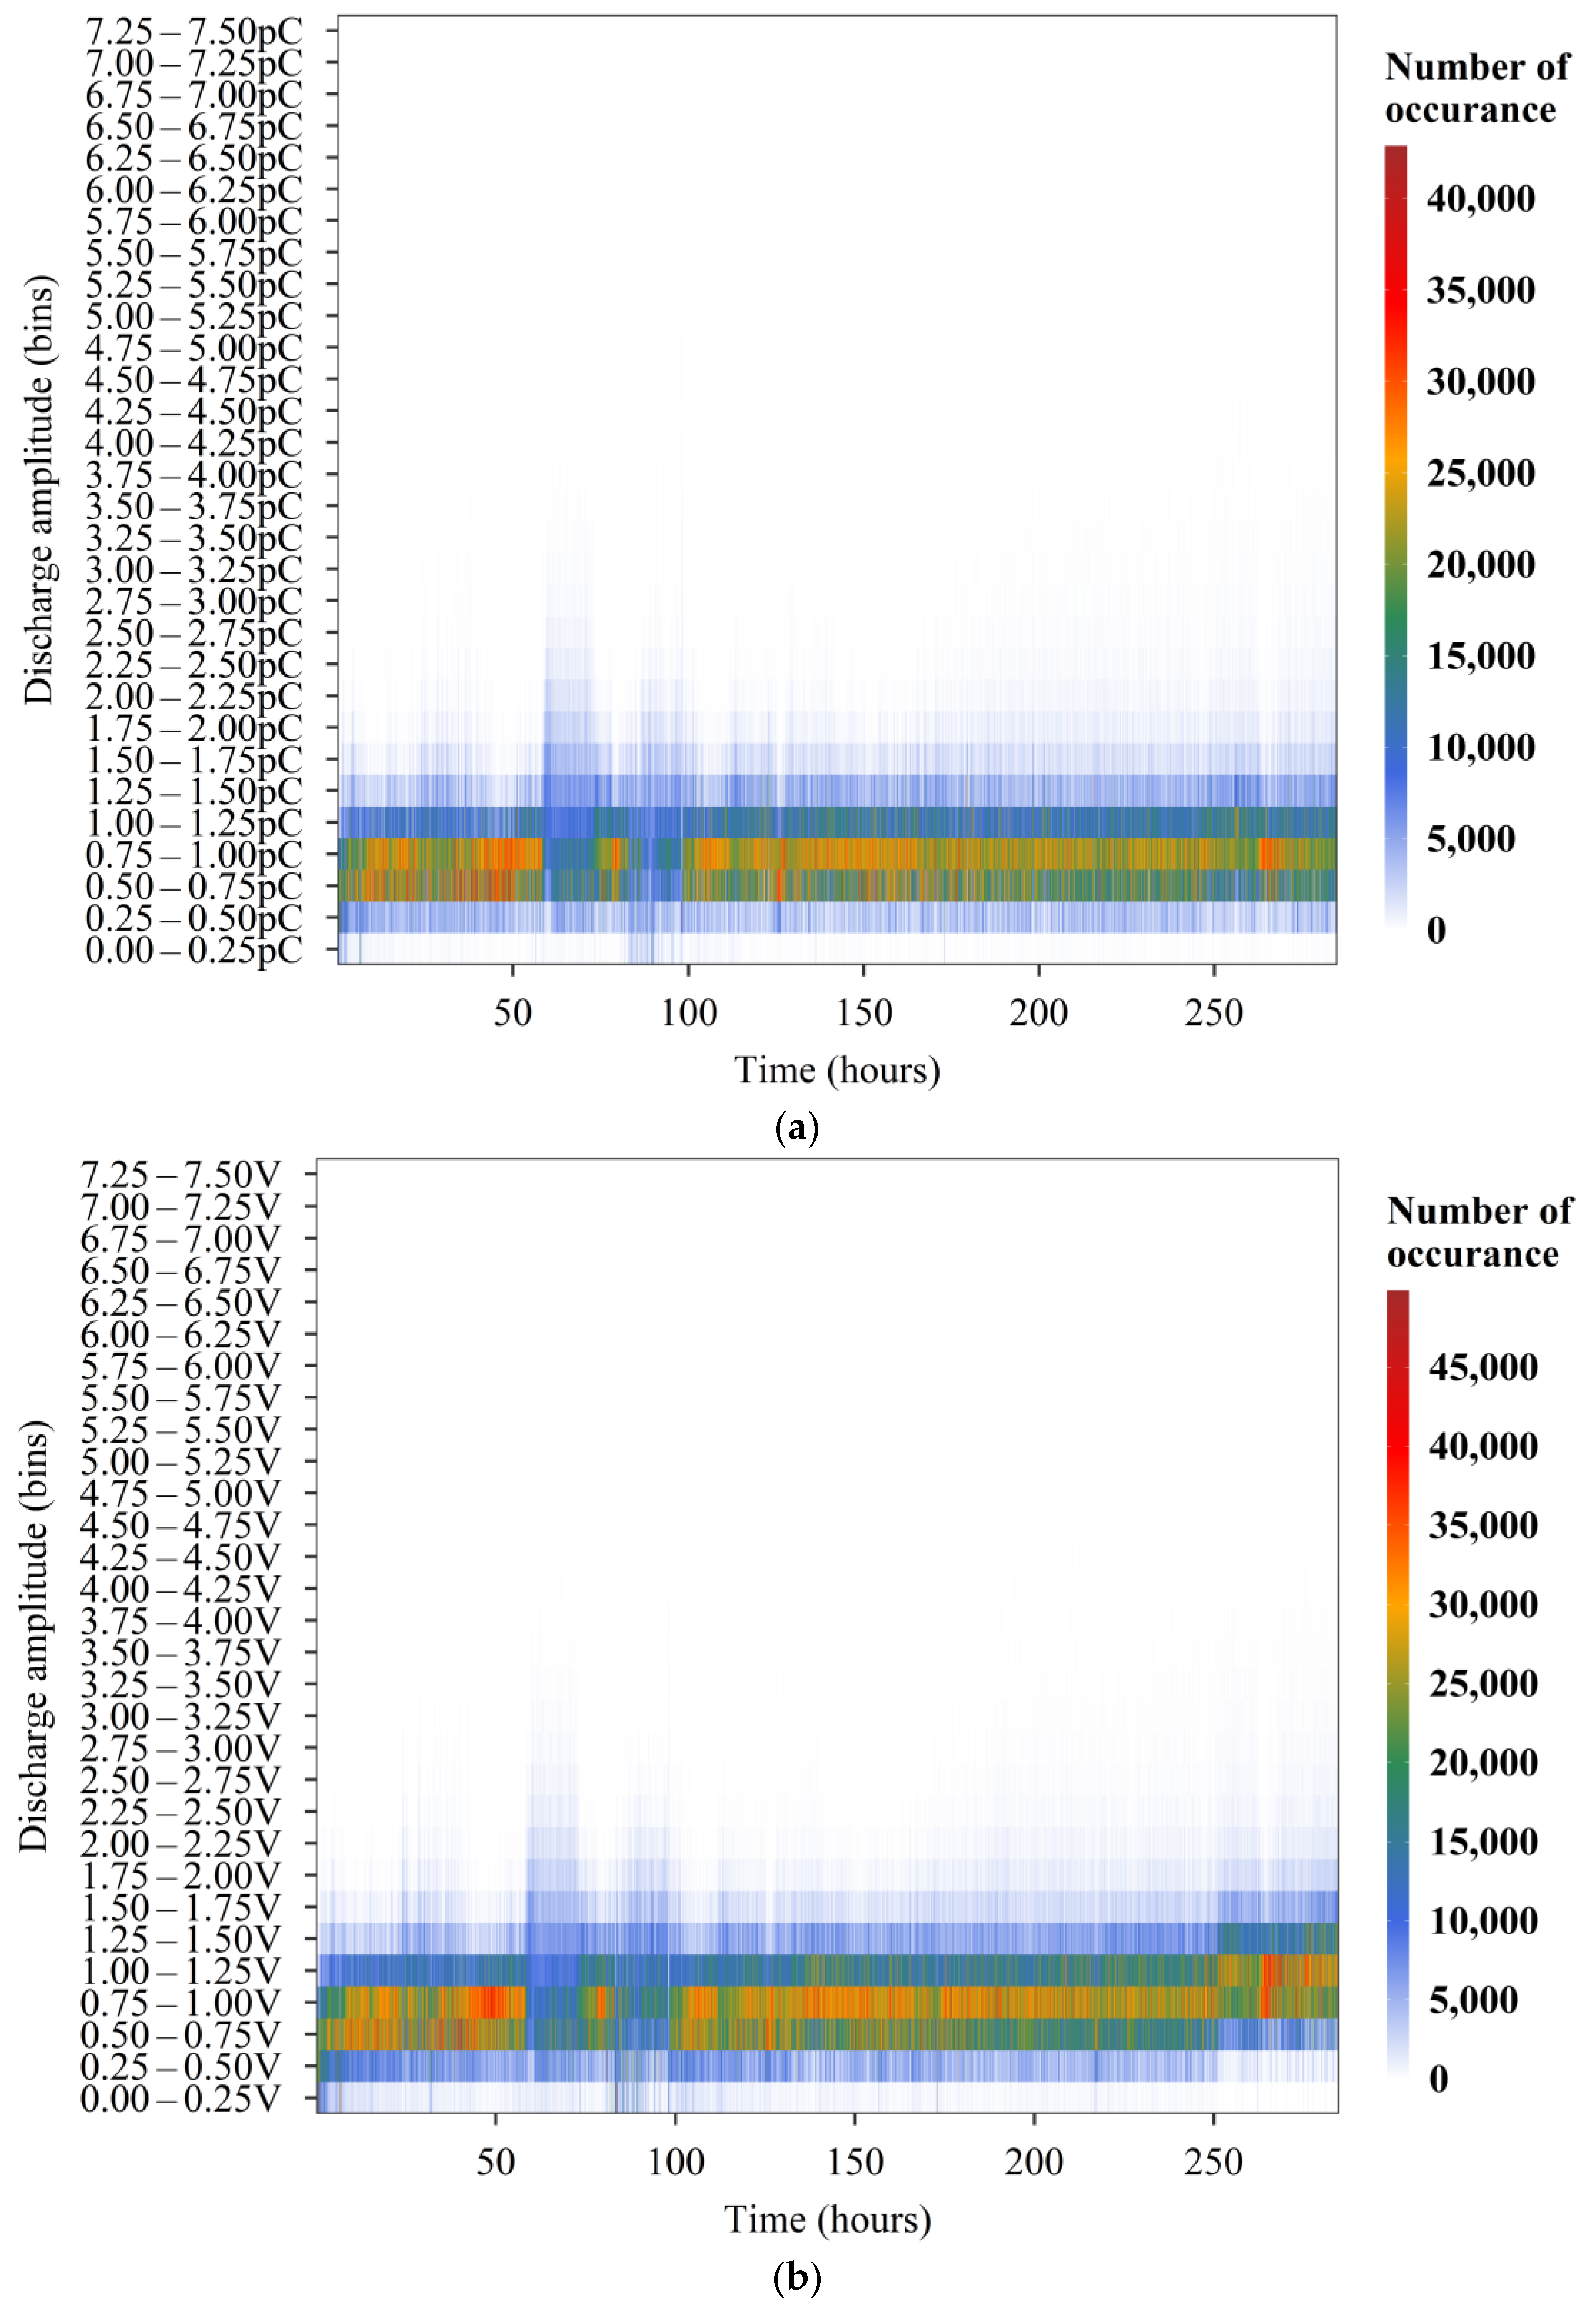
Figure 12.
Quantified discharges according to their discharge amplitude and their occurrences in Test 3 in the signals from (a) ES sensor monitoring the bottom disc and (b) voltage across discs’ contact.
Figure 12.
Quantified discharges according to their discharge amplitude and their occurrences in Test 3 in the signals from (a) ES sensor monitoring the bottom disc and (b) voltage across discs’ contact.
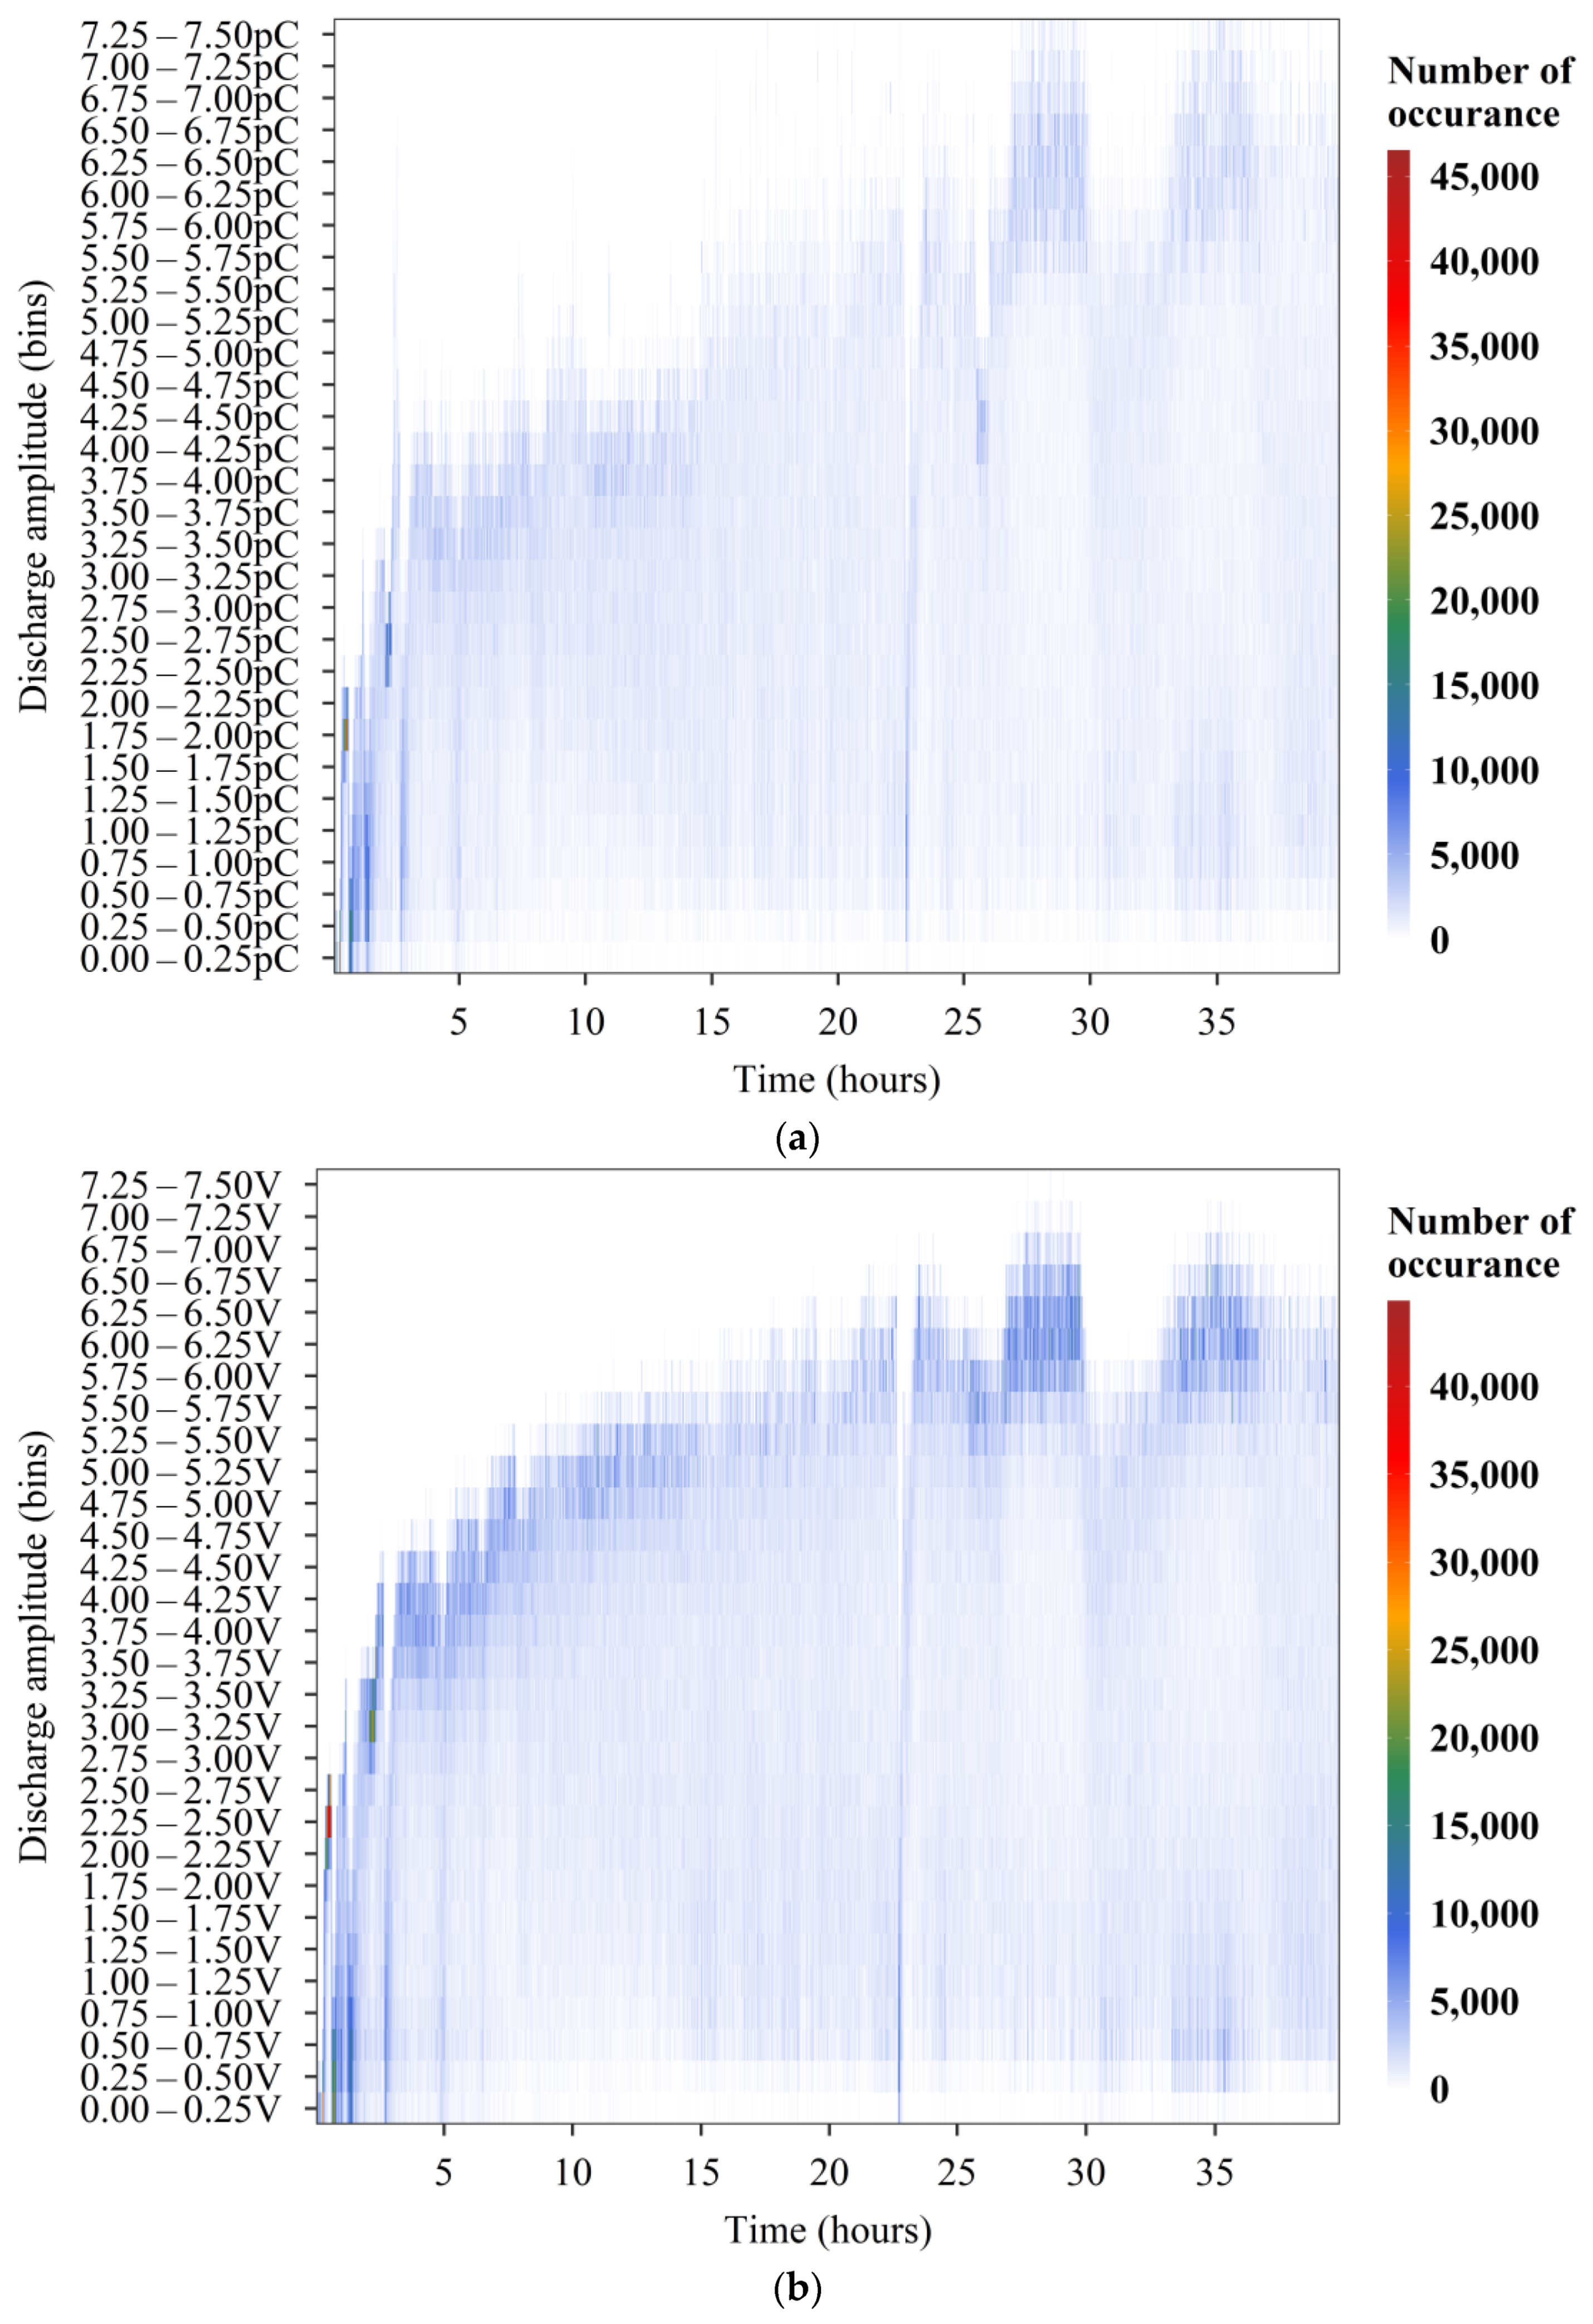
Figure 13.
Quantified discharges according to their discharge amplitude and their occurrences in Test 5 in the signals from (a) ES sensor monitoring the bottom disc and (b) voltage across discs’ contact.
Figure 13.
Quantified discharges according to their discharge amplitude and their occurrences in Test 5 in the signals from (a) ES sensor monitoring the bottom disc and (b) voltage across discs’ contact.
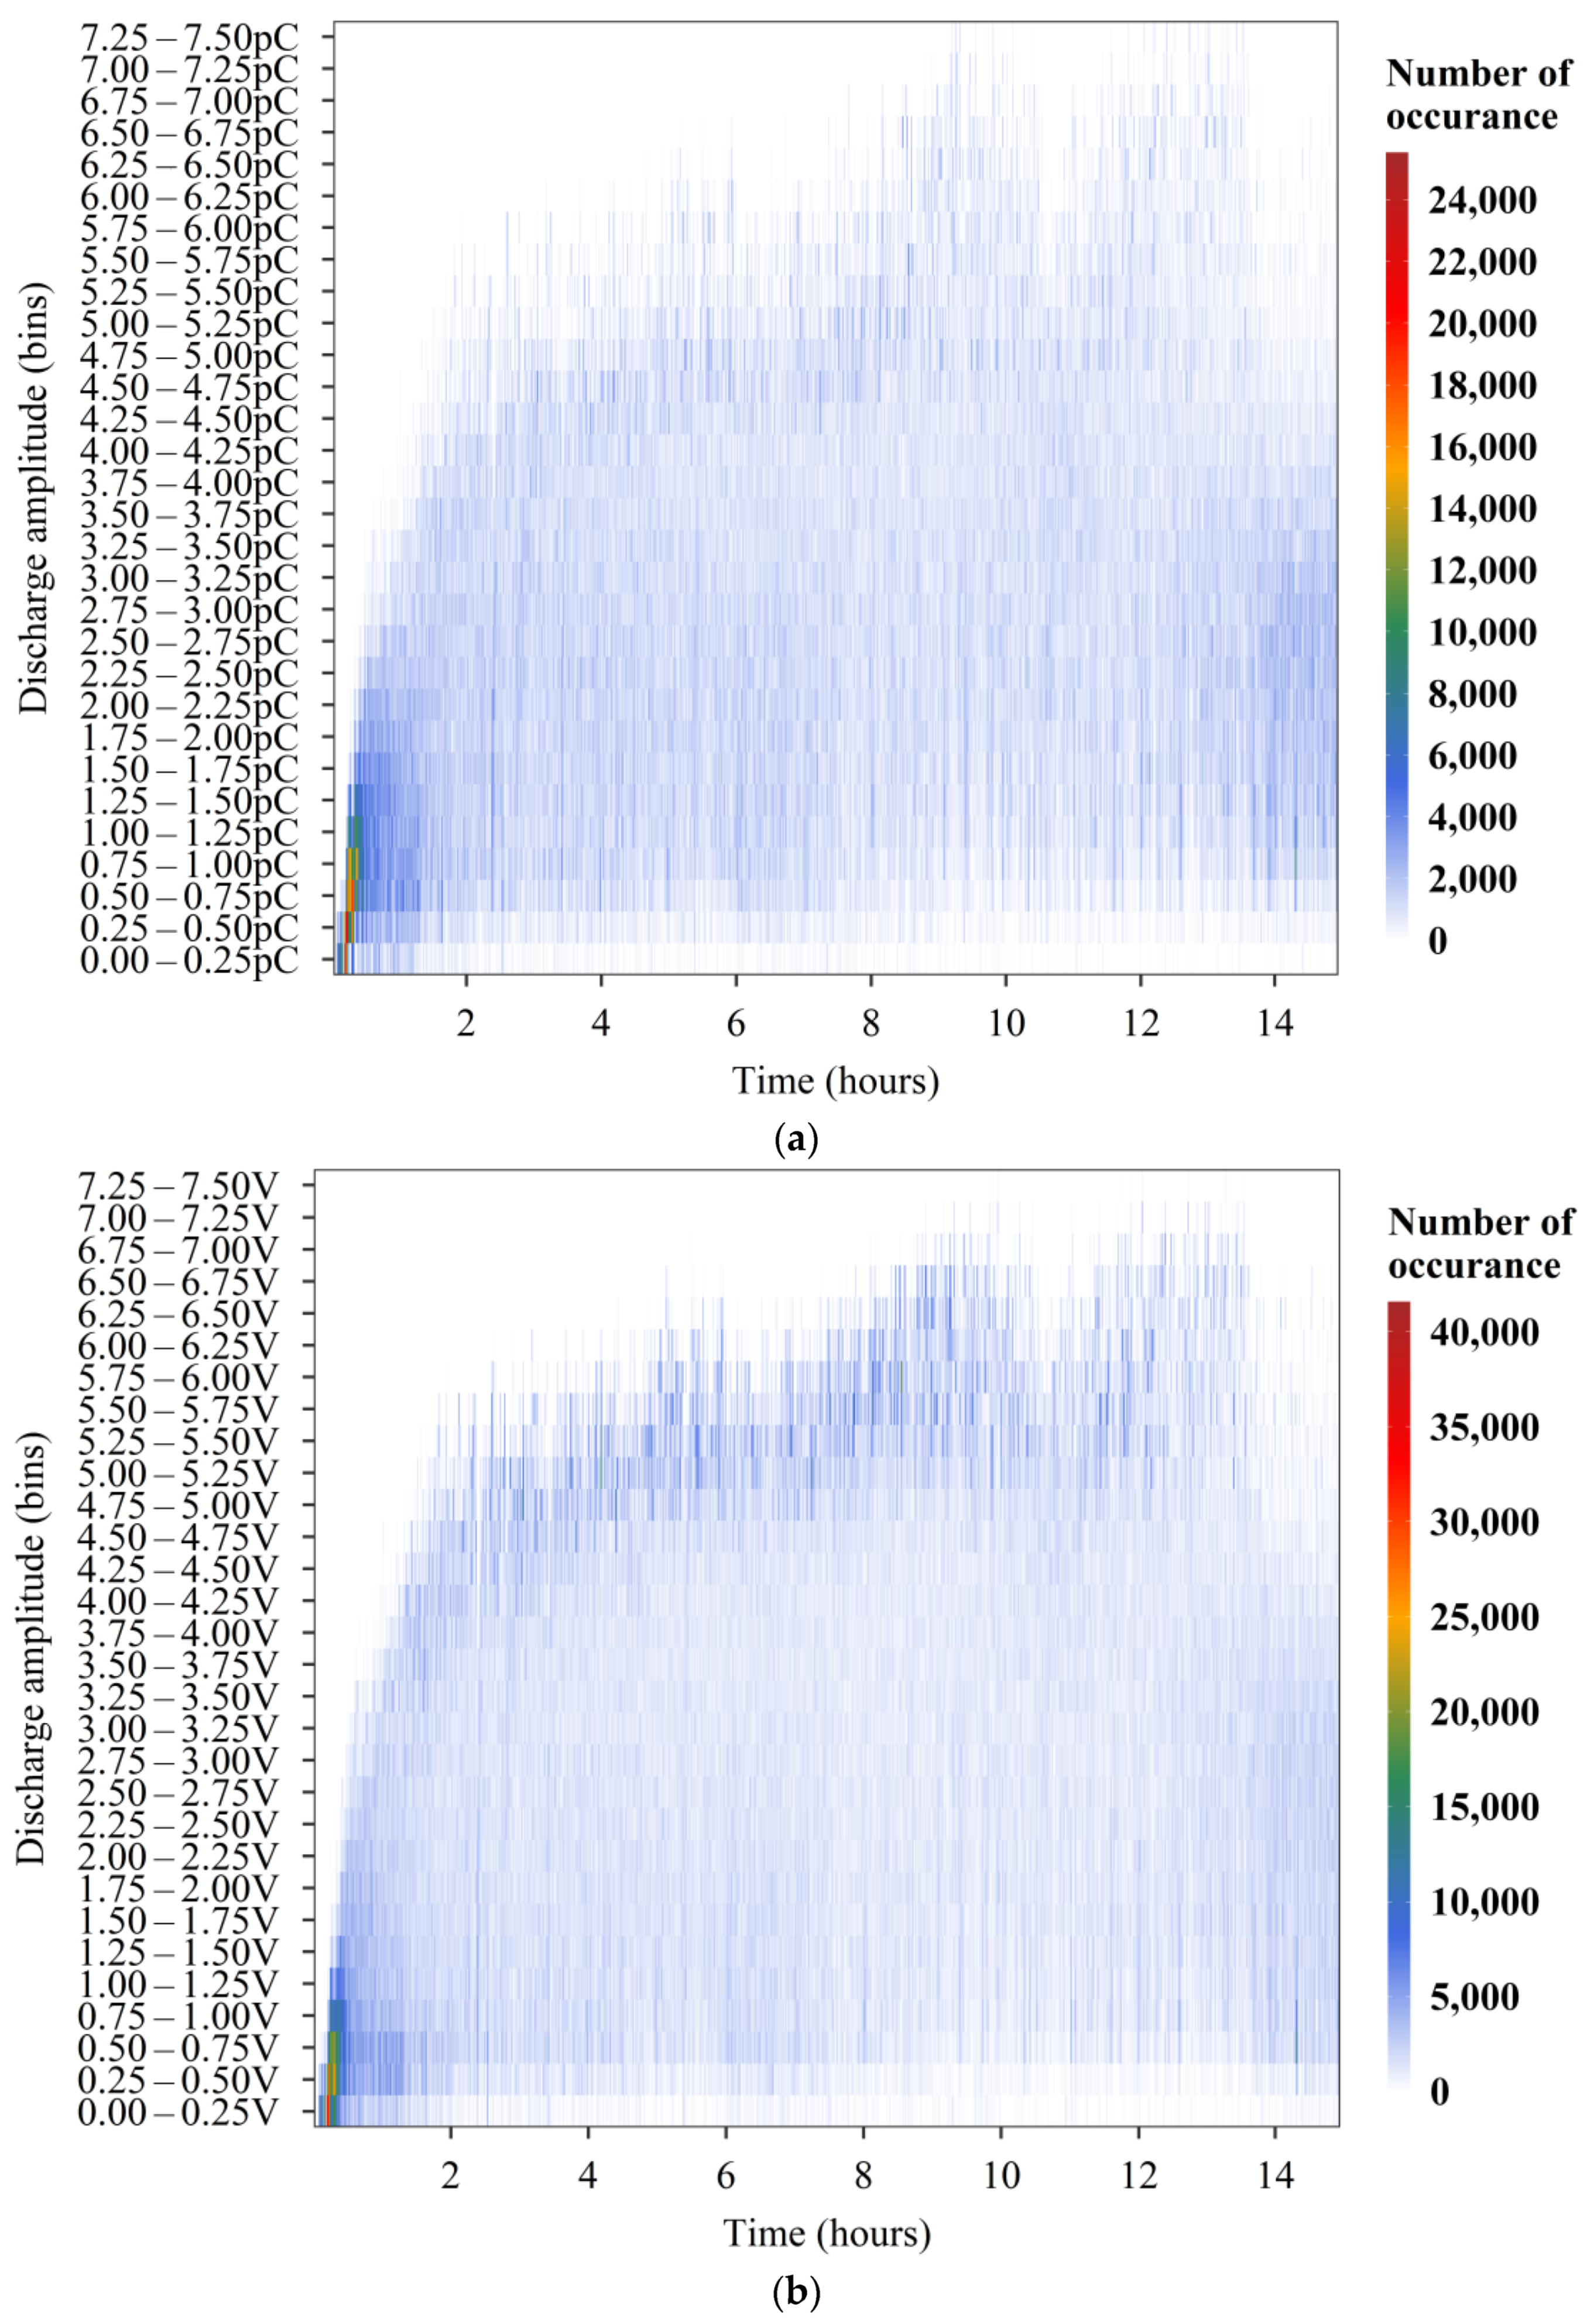
Figure 14.
Quantified discharges according to their discharge amplitude and their occurrences in Test 11 in the signals from (a) ES sensor monitoring the bottom disc and (b) voltage across discs’ contact.
Figure 14.
Quantified discharges according to their discharge amplitude and their occurrences in Test 11 in the signals from (a) ES sensor monitoring the bottom disc and (b) voltage across discs’ contact.
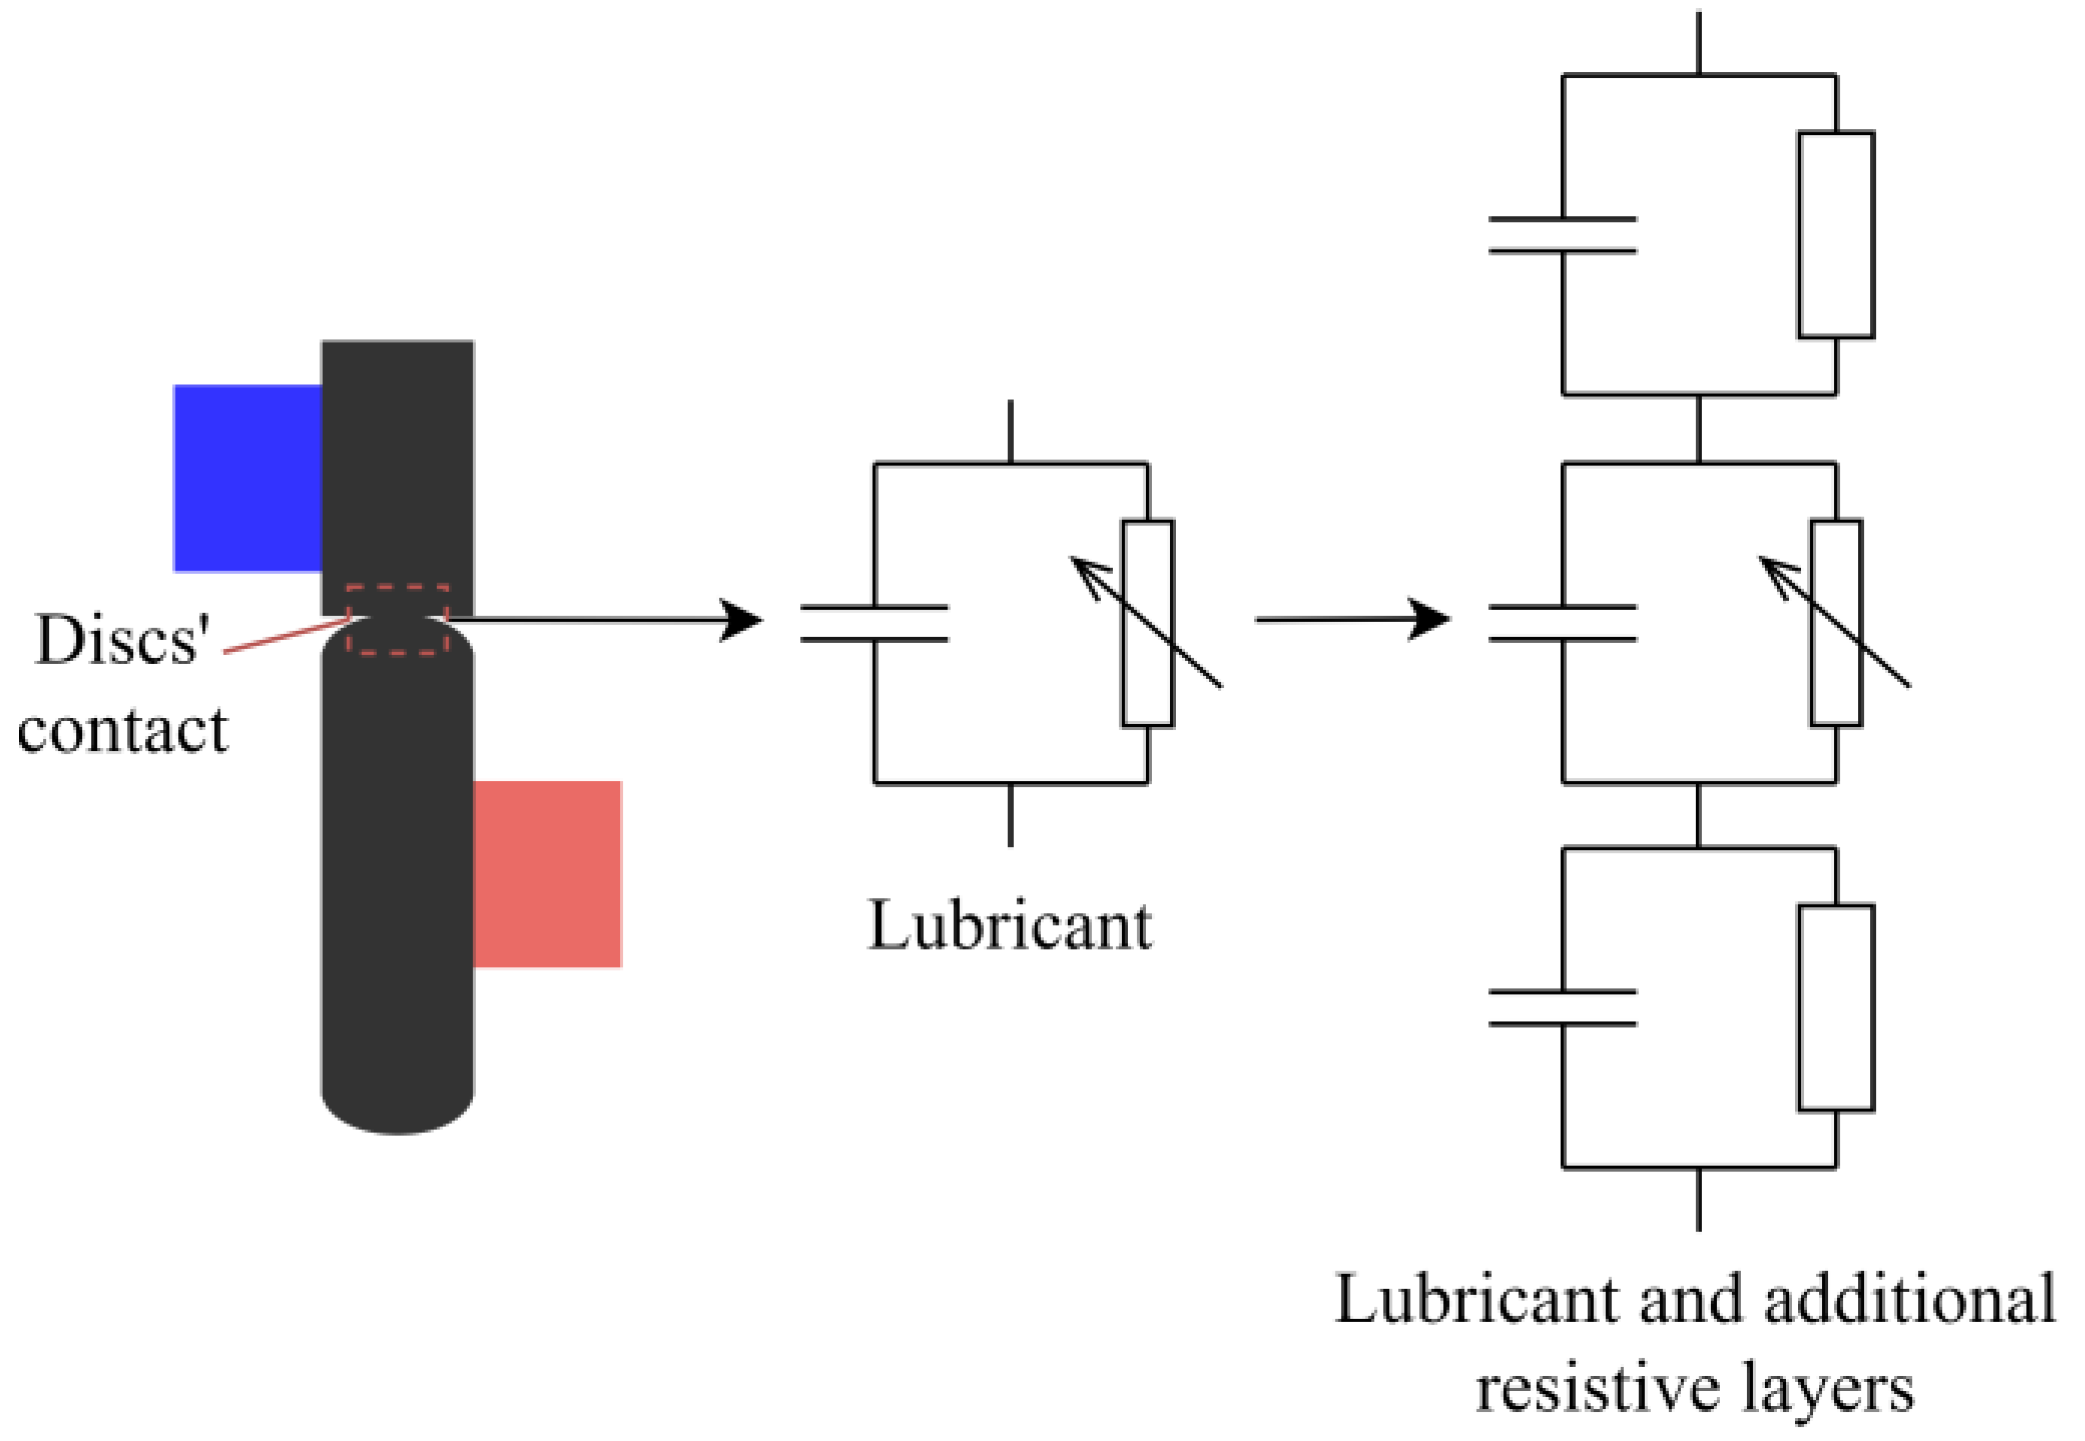
Figure 15.
The electrical resistance of the contact with lubricant, and lubricant and resistive layers.
Figure 15.
The electrical resistance of the contact with lubricant, and lubricant and resistive layers.
Table 1.
Abbreviations and definitions.
Table 1.
Abbreviations and definitions.
| Abbreviations | Definitions |
|---|
| ES | Electrostatic |
| IQR | Interquartile range |
| LOM | Light optical microscopy |
| PAO | Polyalphaolefin |
| PMMA | Polymethylmethacrylate |
| RCF | Rolling contact fatigue |
| SRR | Slide-to-roll ratio |
| VADC | Voltage across the discs’ contact |
| WEC | White etching crack |
Table 2.
Chemical composition of SAE 52100 alloy steel [
26].
Table 2.
Chemical composition of SAE 52100 alloy steel [
26].
| Element | Content (%) |
|---|
| Iron, Fe | 96.5–97.32 |
| Chromium, Cr | 1.35–1.60 |
| Carbon, C | 0.93–1.05 |
| Manganese, Mn | 0.25–0.45 |
| Silicon, Si | 0.15–0.35 |
| Sulfur, S | ≤0.015 |
| Phosphorous, P | ≤0.025 |
Table 3.
Mechanical properties of SAE 52100 alloy steel [
26].
Table 3.
Mechanical properties of SAE 52100 alloy steel [
26].
| Properties | Metric |
|---|
| Bulk modulus | 140 GPa |
| Shear modulus | 80 GPa |
| Elastic modulus | 210 GPa |
| Poisson’s ratio | 0.27–0.30 |
| Density | 7.81 g/cm3 |
| Melting point | 1424 °C
Retained austenite 10–12% |
| Hardness, Rockwell C scale (HRC) | 61.5 |
Table 4.
The physical properties of the WW1362 lubricant.
Table 4.
The physical properties of the WW1362 lubricant.
| Properties | Value | Unit |
|---|
| Density at 15 °C | 883 | kg/m3 |
| Dielectric strength | 26.4 | kV/mm |
| Kinematic viscosity at 40 °C | 60.34 | mm2/s |
| Kinematic viscosity at 100 °C | 8.69 | mm2/s |
Table 5.
Details of the tests; master speed and load were kept constant at 3000 rpm and 3340 N, respectively, resulting in maximal contact pressure of 2.5 GPa and contact area of 2 mm2. The highlighted cells indicate the main parameters that were changed between the tests.
Table 5.
Details of the tests; master speed and load were kept constant at 3000 rpm and 3340 N, respectively, resulting in maximal contact pressure of 2.5 GPa and contact area of 2 mm2. The highlighted cells indicate the main parameters that were changed between the tests.
| Test Index | SRR (%) | Supply Voltage (V) | Lubricant Inlet Temperature (°C) | The Roughness of the Top Disc (µm) | The Roughness of the Bottom Disc (µm) | Minimum Film Thickness (µm) | Lambda |
|---|
| 1 | No | 10 | 75 | 0.025 | 0.029 | 0.268 | 7 |
| 2 | 5 | 10 | 80 | 0.025 | 0.029 | 0.249 | 6.5 |
| 3 | 5 | 10 | 100 | 0.025 | 0.029 | 0.153 | 4 |
| 4 | 15 | 10 | 100 | 0.025 | 0.029 | 0.153 | 4 |
| 5 | 15 | 10 | 95 | 0.208 | 0.112 | 0.189 | 0.8 |
| 6 | 15 | 10 | 100 | 0.094 | 0.385 | 0.159 | 0.4 |
| 7 | 15 | 0 | 100 | 0.087 | 0.142 | 0.133 | 0.8 |
| 8 | 15 | 10 | 100 | 0.071 | 0.102 | 0.186 | 1.5 |
| 9 | 15 | 10 | 100 | 0.199 | 0.110 | 0.182 | 0.8 |
| 10 | 15 | 10 | 100 | 0.306 | 0.200 | 0.146 | 0.4 |
| 11 | 15 | 10 | 100 | 0.199 | 0.110 | 0.182 | 0.8 |
| 12 | No | 10 | 95 | 0.199 | 0.110 | 0.182 | 0.8 |
Table 6.
The surface and subsurface analysis of the samples; master speed and load were kept constant at 3000 rpm and 3340 N, respectively, resulting in maximal contact pressure of 2.5 GPa and contact area of 2 mm2. The highlighted cells indicate the main parameters that were changed between the tests.
| Test Index | SRR (%) | Median Lubricant Inlet Temperature (°C) | Supply Voltage (V) | Minimum Film Thickness (µm) | Median Lambda | Duration (Hours) | Cycles (Millions) | Stop Type | Outcome |
|---|
| 1 | No | 73.3 | 10 | 0.278 | 7.25 | 335.77 | 60.44 | Manual | No damage |
| 2 | 5 | 76.8 | 10 | 0.253 | 6.6 | 305.38 | 54.97 | Manual | No damage |
| 3 | 5 | 98.5 | 10 | 0.165 | 4.31 | 285.08 | 51.31 | Manual | No damage |
| 4 | 15 | 97.3 | 10 | 0.163 | 4.27 | 305.86 | 55.05 | Manual | No damage |
| 5 | 15 | 92.2 | 10 | 0.180 | 0.76 | 39.82 | 7.17 | Automatic | Spall, WEC networks in 26 mm disc |
| 6 | 15 | 98.7 | 10 | 0.159 | 0.4 | 2.75 | 0.50 | Automatic | Severe pitting, surface failure of 26 mm disc |
| 7 | 15 | 98.2 | 0 | 0.158 | 0.95 | 239.71 | 43.15 | Manual | No damage |
| 8 | 15 | 96.0 | 10 | 0.167 | 1.34 | 35.69 | 6.42 | Manual | No damage |
| 9 | 15 | 97.5 | 10 | 0.161 | 0.71 | 45.72 | 8.23 | Manual | Pitting, WEC networks in 26 mm disc |
| 10 | 15 | 98.2 | 10 | 0.161 | 0.44 | 14.52 | 2.61 | Automatic | Severe pitting, surface failure of 26 mm disc |
| 11 | 15 | 97.7 | 10 | 0.161 | 0.71 | 14.93 | 2.70 | Manual | No damage |
| 12 | No | 92.7 | 10 | 0.186 | 0.82 | 114.85 | 20.67 | Manual | No damage |
Table 7.
The analysis of the voltage across the discs for the tests. The highlighted cells indicate the main parameters that were changed between the tests.
Table 7.
The analysis of the voltage across the discs for the tests. The highlighted cells indicate the main parameters that were changed between the tests.
| Test Number | Running Time (h) | Minimum (V) | First Quartile (V) | Median (V) | Third Quartile (V) | Maximum (V) | Failure Type |
|---|
| Test 1 | 335.77 | 0.18 | 0.32 | 0.38 | 0.42 | 0.56 | No failure |
| Test 2 | 305.38 | −0.48 | 0.45 | 0.60 | 1.08 | 2.02 | No failure |
| Test 3 | 285.08 | 0.37 | 0.64 | 0.72 | 0.82 | 1.10 | No failure |
| Test 4 | 305.86 | 0.19 | 0.79 | 0.96 | 1.19 | 1.79 | No failure |
| Test 5 | 39.82 | 1.83 | 2.71 | 3.00 | 3.30 | 4.18 | WECs |
| Test 6 | 2.75 | 0.15 | 0.41 | 0.52 | 0.59 | 0.85 | Other |
| Test 7 | 239.71 | 0.00 | 0.00 | 0.00 | 0.00 | 0.00 | No failure |
| Test 8 | 35.69 | 0.90 | 1.38 | 1.55 | 1.69 | 2.17 | No failure |
| Test 9 | 45.72 | 0.90 | 2.43 | 2.95 | 3.45 | 4.97 | WECs |
| Test 10 | 14.52 | 1.45 | 1.71 | 1.82 | 1.89 | 2.15 | Other |
| Test 11 | 14.93 | 1.51 | 2.46 | 2.79 | 3.09 | 4.04 | No failure |
| Test 12 | 114.85 | 0.15 | 0.34 | 0.39 | 0.46 | 0.65 | No failure |
Table 8.
The analysis of the electric current, resistance and field for the tests. The highlighted cells indicate the main parameters that were changed between the tests.
Table 8.
The analysis of the electric current, resistance and field for the tests. The highlighted cells indicate the main parameters that were changed between the tests.
| Test Number | Running Time (h) | Current (μA) | Resistance (kΩ) | Electric Field (kV/mm) | Normalised Field (V) | Failure Type |
|---|
| Median | IQR | Median | IQR | Median | IQR | Median | IQR |
|---|
| Test 1 | 335.77 | 190.90 | 1.31 | 2.44 | 0.37 | 1.36 | 0.35 | 0.05 | 0.02 | No failure |
| Test 2 | 305.38 | 185.59 | 13.64 | 3.92 | 4.13 | 2.38 | 2.63 | 0.09 | 0.10 | No failure |
| Test 3 | 285.08 | 183.05 | 3.25 | 4.68 | 0.97 | 4.37 | 1.12 | 0.17 | 0.04 | No failure |
| Test 4 | 305.86 | 177.85 | 7.26 | 6.28 | 2.29 | 5.93 | 2.40 | 0.23 | 0.09 | No failure |
| Test 5 | 39.82 | 134.04 | 8.18 | 24.69 | 4.56 | 16.65 | 3.24 | 3.93 | 0.77 | WECs |
| Test 6 | 2.75 | 187.60 | 3.51 | 3.35 | 1.00 | 3.27 | 1.12 | 1.29 | 0.44 | Other |
| Test 7 | 239.71 | 0.00 | 0.00 | 0.00 | 0.00 | 0.00 | 0.00 | 0.00 | 0.00 | No failure |
| Test 8 | 35.69 | 165.63 | 5.49 | 10.43 | 1.99 | 9.31 | 1.88 | 1.16 | 0.24 | No failure |
| Test 9 | 45.72 | 134.60 | 21.10 | 24.36 | 11.47 | 18.19 | 6.18 | 4.14 | 1.41 | WECs |
| Test 10 | 14.52 | 158.67 | 2.09 | 13.08 | 0.84 | 11.42 | 1.13 | 4.18 | 0.41 | Other |
| Test 11 | 14.93 | 137.16 | 10.73 | 22.97 | 5.67 | 17.34 | 3.99 | 3.94 | 0.90 | No failure |
| Test 12 | 114.85 | 189.97 | 2.80 | 2.68 | 0.79 | 2.12 | 0.66 | 0.48 | 0.15 | No failure |
Table 9.
The analysis of the number and amplitude of discharges for the tests. The highlighted cells indicate the main parameters that were changed between the tests.
Table 9.
The analysis of the number and amplitude of discharges for the tests. The highlighted cells indicate the main parameters that were changed between the tests.
| Test Number | Running Time (h) | Number of Discharges | Amplitude of Discharges (V) | Failure Type |
|---|
| Median | IQR | Median | IQR |
|---|
| Test 1 | 335.77 | 37,900 | 10,500 | 0.62 | 0.62 | No failure |
| Test 2 | 305.38 | 86,500 | 18,100 | 0.87 | 0.57 | No failure |
| Test 3 | 285.08 | 79,900 | 9000 | 0.88 | 0.41 | No failure |
| Test 4 | 305.86 | 71,900 | 20,000 | 1.06 | 0.6 | No failure |
| Test 5 | 39.82 | 31,300 | 7225 | 3.6 | 3.16 | WECs |
| Test 6 | 2.75 | 69,700 | 5250 | 0.57 | 0.63 | Other |
| Test 7 | 239.71 | 0 | 0 | 0 | 0 | No failure |
| Test 8 | 35.69 | 44,800 | 10,800 | 1.88 | 1 | No failure |
| Test 9 | 45.72 | 54,500 | 27,800 | 3.21 | 2.61 | WECs |
| Test 10 | 14.52 | 37,100 | 3600 | 1.82 | 1.53 | Other |
| Test 11 | 14.93 | 34,800 | 5200 | 3.1 | 3.26 | No failure |
| Test 12 | 114.85 | 46,400 | 8700 | 0.66 | 0.55 | No failure |


