1. Introduction
Rolling friction models have attracted the attention of engineers and researchers since the wheel invention. As a common rule, rolling friction is mostly studied under the condition of constant rolling speed. Many publications have emerged in this area allowing basic laws derived to describe the reliance between the rolling resistance moment and the magnitude of the load, the driving conditions and various other influencing factors. Interest of this topic is confirmed by an almost unlimited number of publications that is still growing, just to cite the recently appeared ones [
1,
2,
3,
4].
These fundamental problems are solved for the sake of understanding and immediately for specific advanced applications revolving around pre-rolling and rolling. In achieving high accuracy of rolling motion control and ultra-precision positioning through rolling systems, knowledge of the laws of rolling resistance at the pre-rolling in forward motion and when reversing the motion is required. This also led to the need to study the laws of rolling friction at low loads, low speeds, and small displacements of the rolling body. It was found that under these conditions, the main mechanisms of rolling friction are associated with the elasticity of the contacting bodies, relative slip and internal hysteretic friction, as well as adhesion [
5,
6]. “Pre-rolling” is a special name given to displacements in a friction pair, in which rolling friction has a nonstationary character. Here, the dependence laws of the rolling resistance moments on displacements are of a specific nonlinear character, which is still unknown [
3,
7,
8,
9,
10].
The development of micro- and nanotechnology has led to the need to study the adhesion forces, as the reason for the reciprocal sticking of individual MEMS elements that disturb their work [
11]. The sticking factor due to adhesion forces should also be considered when using micro- and nano-manipulators in the technique [
12,
13].
Despite the practical importance of the above problems, “empirical procedures for measuring and representing the laws of friction” [
4] with high sensitivity and accuracy in the nano- and micro range of values have not yet been developed.
This paper presents the development results of the empirical procedure for measuring and representing the rolling friction law, in a particular case when the displacement of the rolling body is significantly less than the radius of the contact spot. We will call this rolling region of deep pre-rolling (DPR). This works aims to describe the design of the single-contact ball pendulum device developed and experienced by the authors. In this device, the physical pendulum with one ball rests on the flat surface of the test specimen allowing free swings with a stable swing plane. In addition, the description of a special technique for measuring rolling resistance forces with high sensitivity and accuracy in DPR mode is given.
2. Review of Pendulum Devices for Studying the Surface of Solids
2.1. Pendulum Devices with One Supporting Ball
The devices that use the free swing method of a physical pendulum rest upon a flat surface through a rolling body (balls, rollers, edge of a prism (or knife)) have long been used to measure the hardness and strength of materials and products [
14,
15,
16,
17,
18,
19,
20,
21,
22,
23,
24,
25]. The hardness and strength of the sample pads in these devices is being associated with a decrease in the pendulum swing amplitude as a function of time.
Mendeleev D.I., apparently, was the first who conducted a thorough study (1895–1898) of the influence on the error of weighing the nature of the damping of the swing of the pendulum, which rested on the platform with a prism edge. He made, in particular, the following conclusion; the time of an individual oscillation decreases with decreasing amplitude of the oscillation itself much faster than, according to well-known formulas, the dependence of the oscillations period of a mathematical pendulum on amplitude [
14].
From the point of view of the possibility of calculating the bodies’ deformations during their elastic contact, the contact of the ball and the flat surface is the simplest. This part of the elasticity theory is the most developed [
6]. Several researchers have made attempts to build a pendulum device on one ball. However, when working with such a (single-contact) pendulum, the researchers faced the problem of instability of its swing plane, since the pendulum on one ball has three rotational degrees of freedom, which leads to instability of the swing plane and significantly complicates the research.
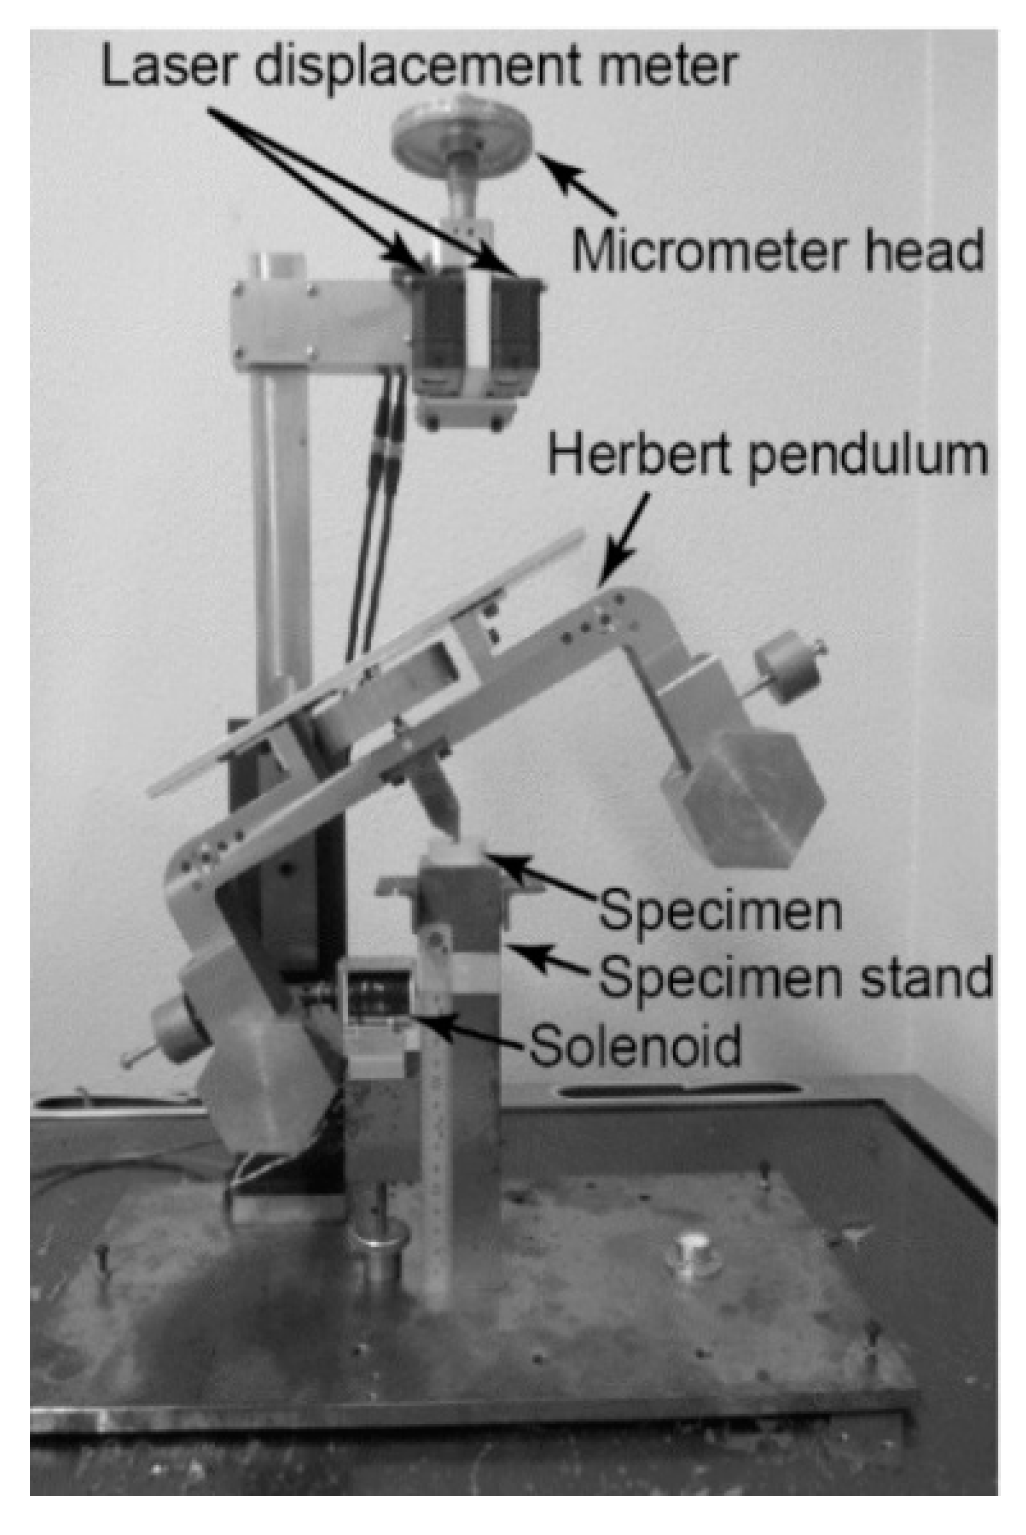
In 1923, Herbert, E developed a pendulum device to measure the hardness of metals (
Figure 1) [
15,
21]. In this device, the pendulum rested on the test sample with a single steel or ruby ball of 1 mm in diameter inserted into the tip. The total weight of the pendulum was 4 kg, its center of gravity should have been located above the fulcrum, but below the center of the ball by 0.1 mm [
17]. After installing the pendulum on the test sample surface, the pendulum was deflected to an initial position of several degrees, and the time of the first swing was measured, which was multiplied by 10, and this parameter was used as an estimate of the test material hardness [
18].
There is a problem with the stability of the swing plane in Herbert’s pendulum. Therefore, in the instructions for the use of Herbert’s pendulum, it was recommended to deflect the pendulum from the equilibrium position “using a feather” [
16]. Subsequently, this device was modified by other researchers so that the pendulum had less weight and rested not on one ball, but on one roller (
Figure 2). The roller had a diameter of 2 mm and a length of 12 mm as stated in [
19]. This solved the problem of stability of the swing plane and allowed the use of the device to assess the hardness of brittle, viscoelastic, and biological materials [
19,
20,
21]. In [
22], hardness measurements of Herbert pendulums using various weights are described.
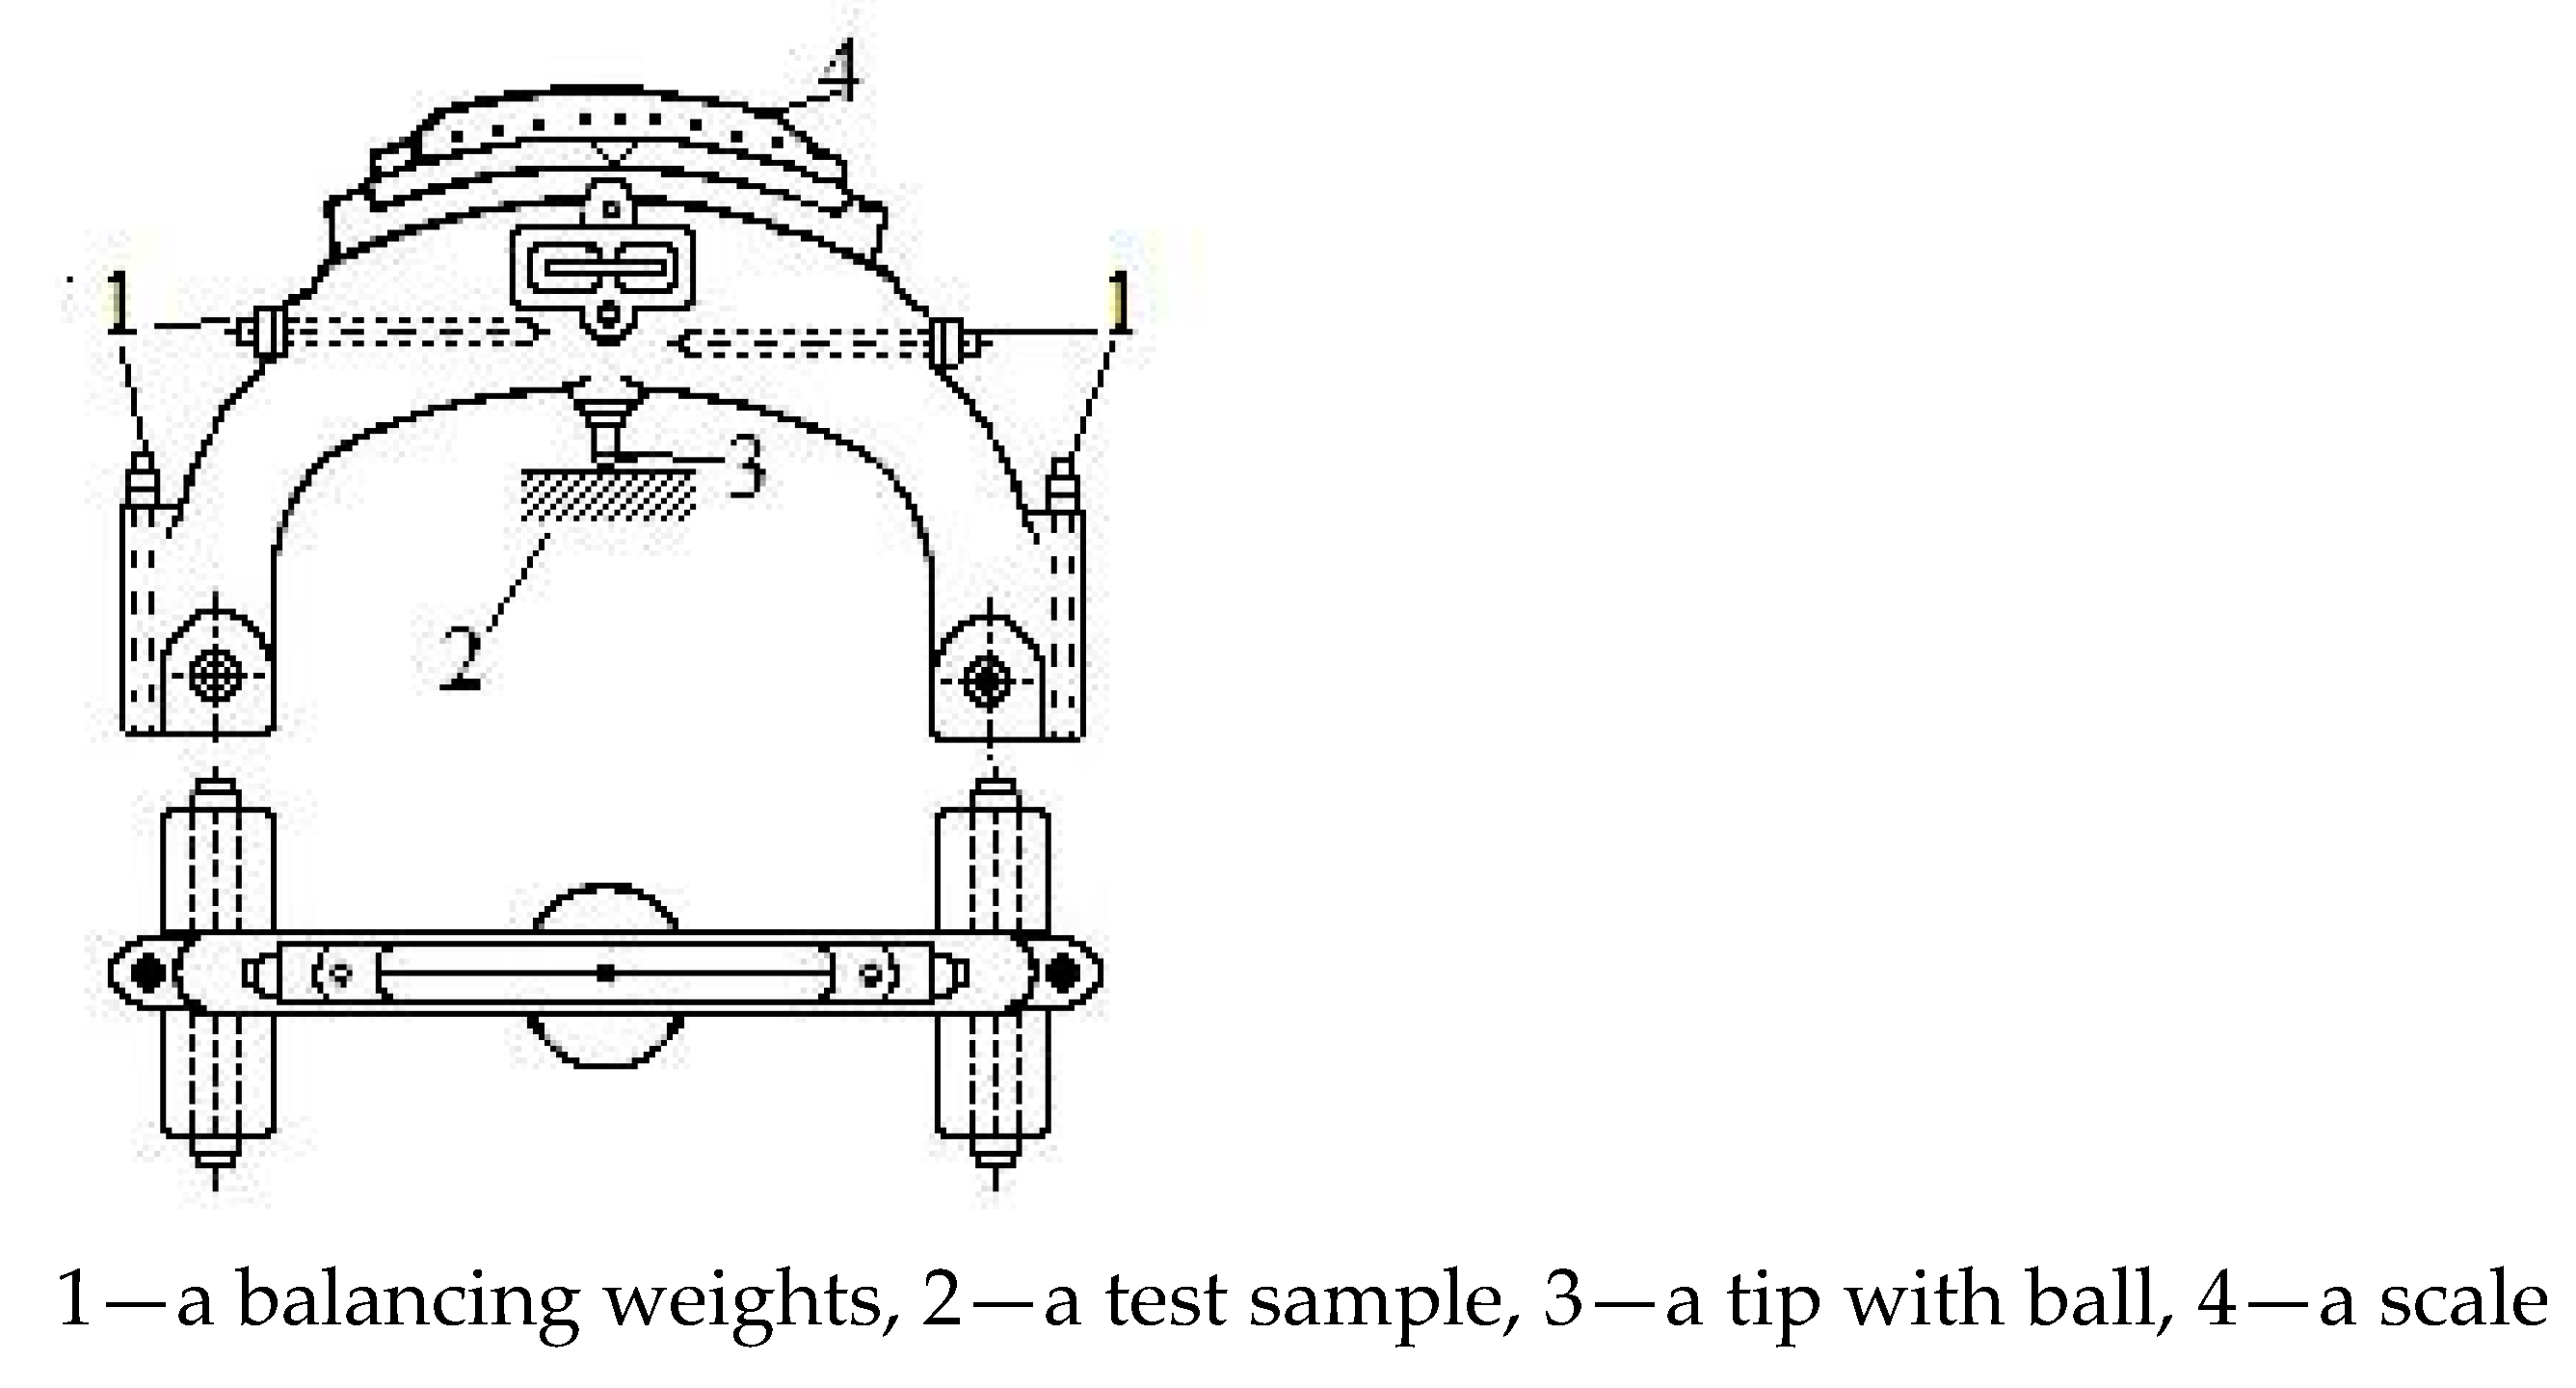
Kuznetsov V.D. (1929) developed a pendulum device in which the pendulum was supported by one or two sharpened needles, or, two balls with a diameter of 0.5 mm (
Figure 3), and the pendulums themselves had different shapes and weights. Sharp needles were used to study the strength of crystals whose surface has been damaged by these needles during the swing of the pendulum, but the balls were used to measure the hardness of materials [
23].
Due to the instability of the swing plane of the pendulum in this device (
Figure 3), the amplitude of the pendulum deviation was measured here using a system of dials. The use of two pendulum support points in the Kuznetsov device made it possible to stabilize the swing plane of the pendulum [
24].
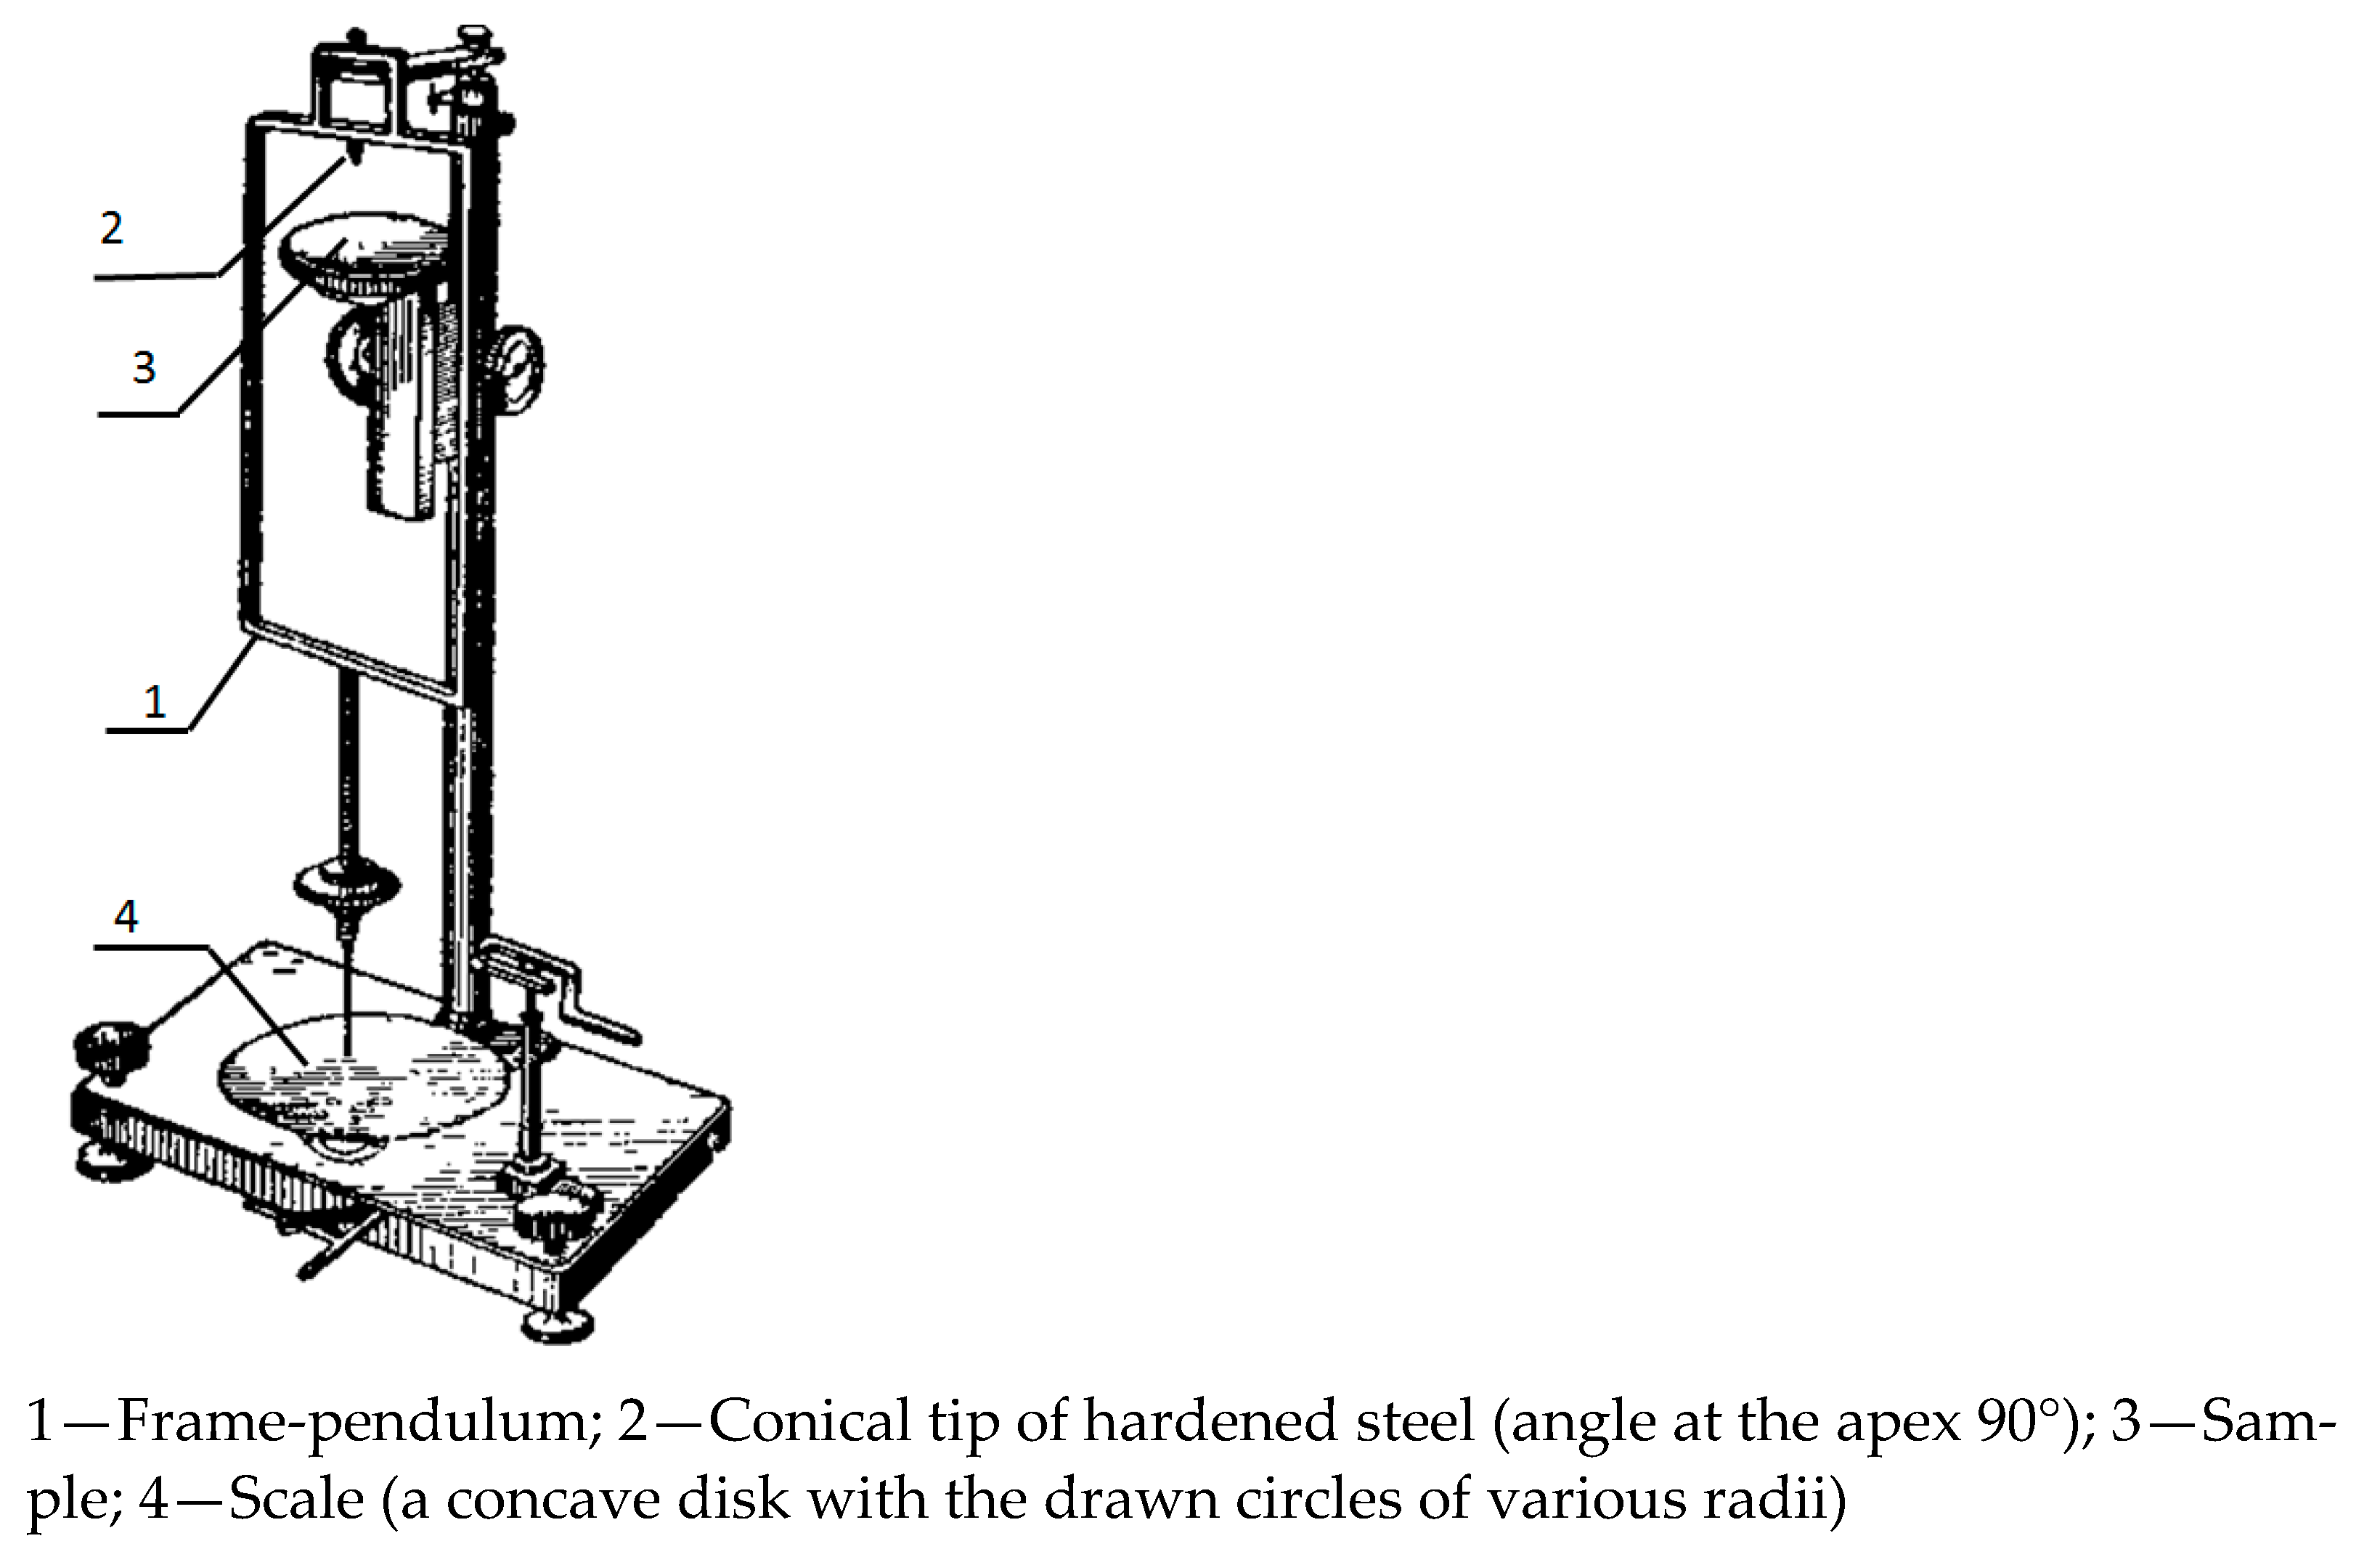
Kuznetsov’s two-contact pendulum [
25] is widely used in modern commercially produced pendulum devices by Koenig and Persos (
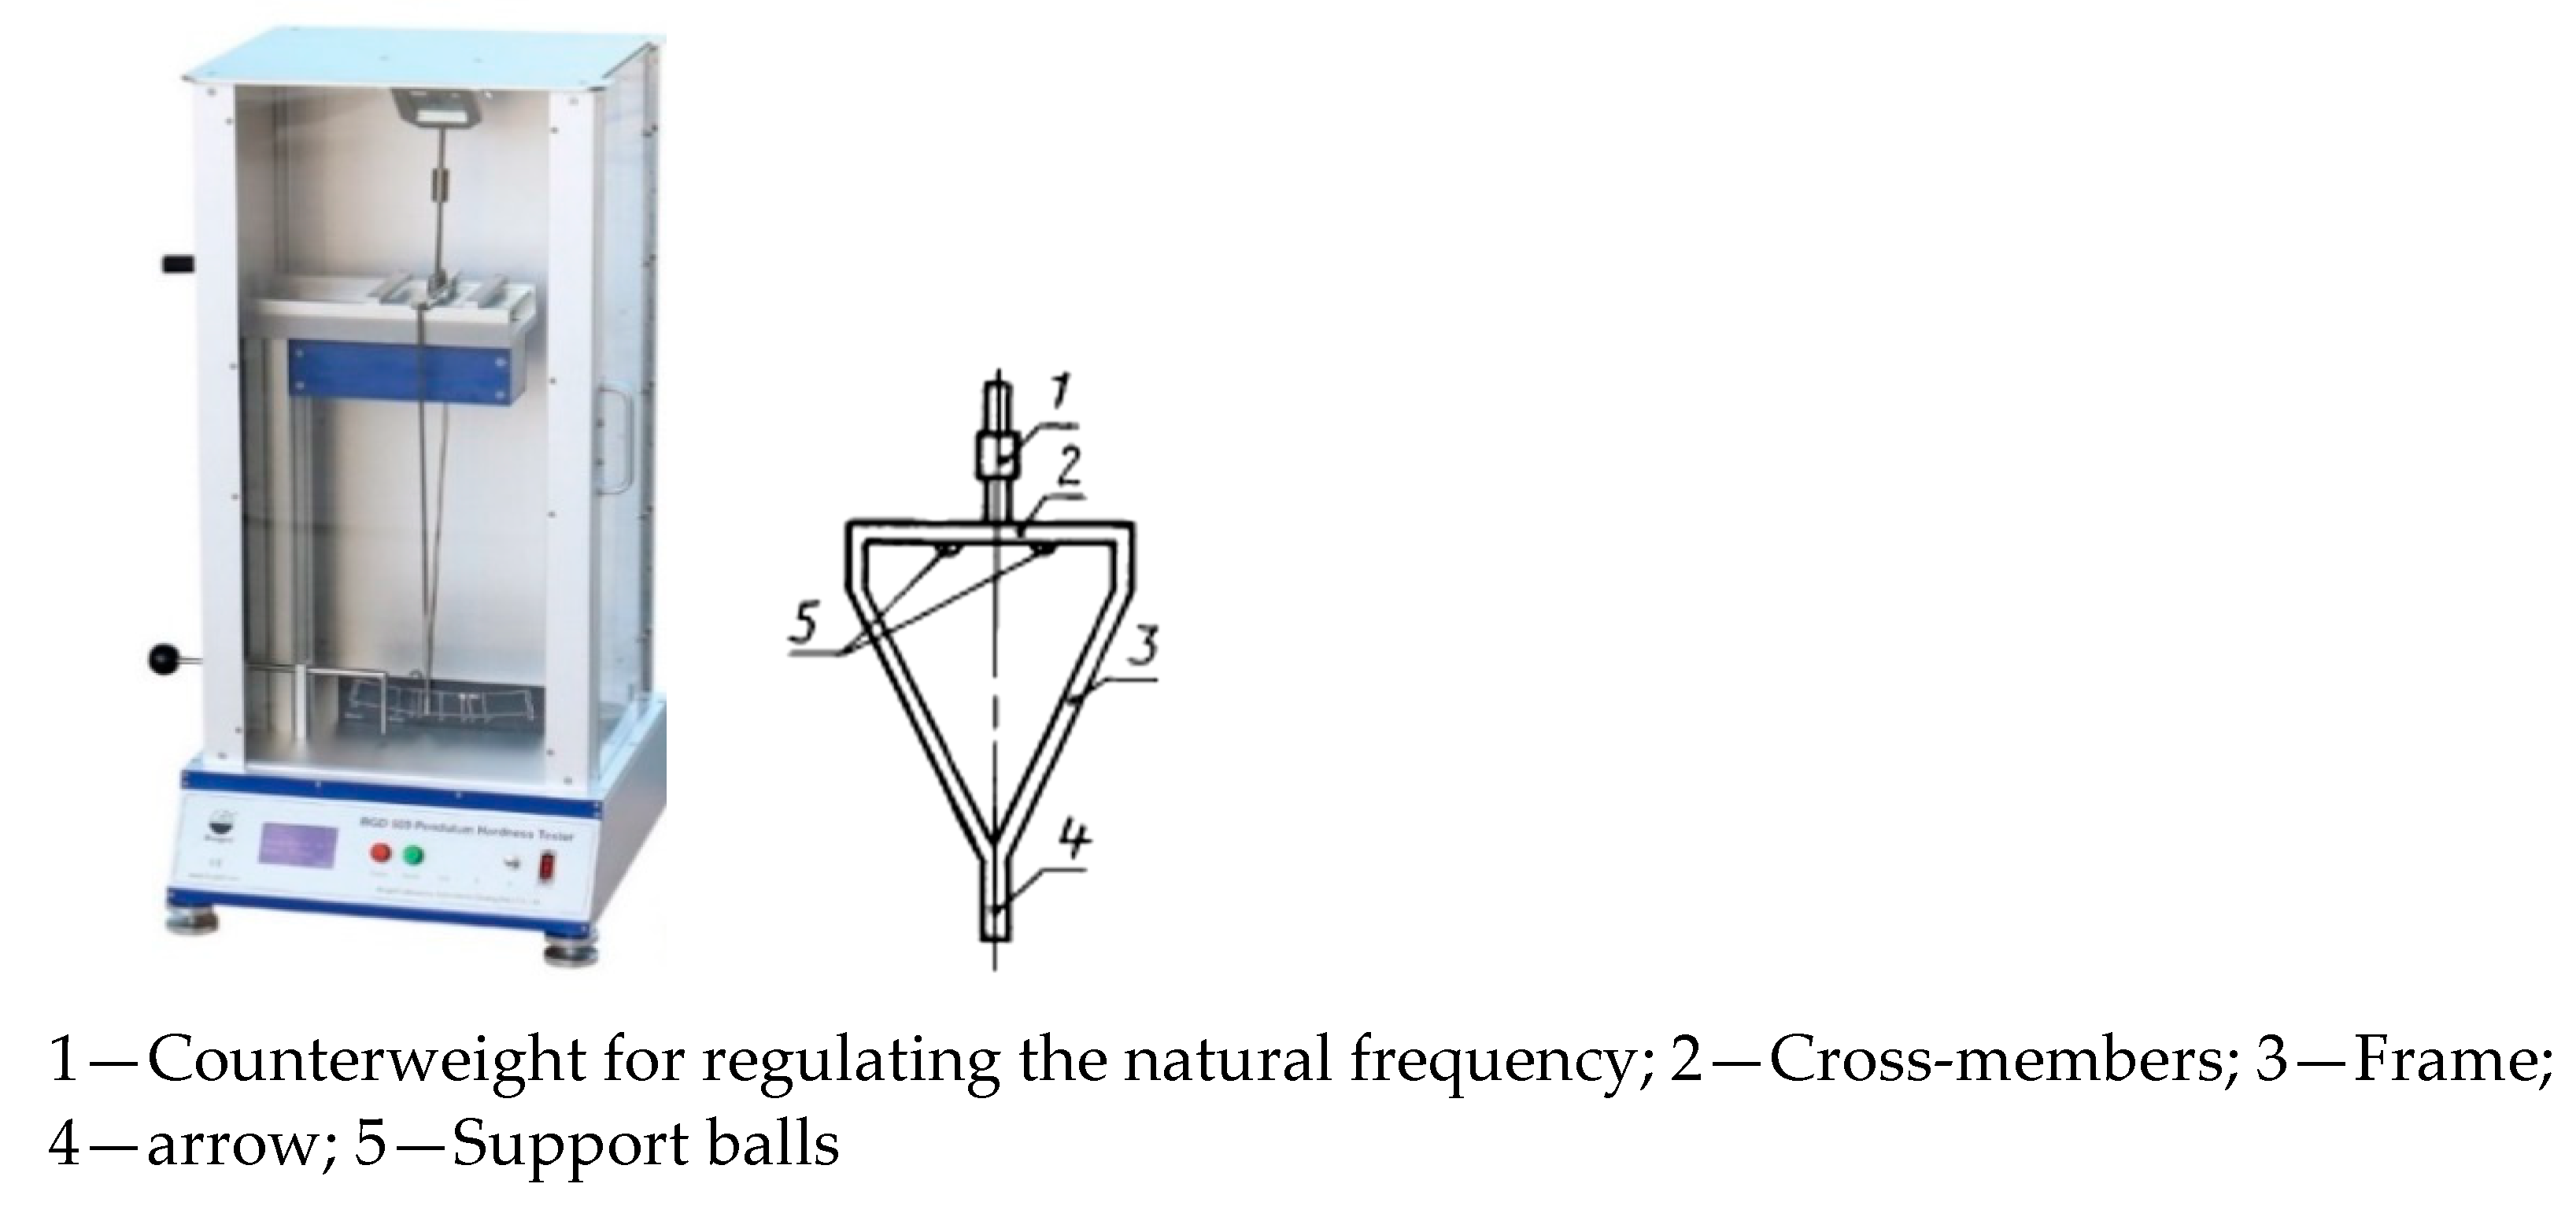
Figure 4 and
Figure 5), which formed the basis of standards measuring for the plastics and coatings hardness [
26]. The surface hardness here is estimated as the ratio of the pendulum swings number on the test surface and on a calibrated glass plate.
The problem with these previous one ball system is that they are too heavy with balancing issues, furthermore, no theory has been published publicly to describe the phenomena.
2.2. Pendulum Devices with Two Supporting Balls
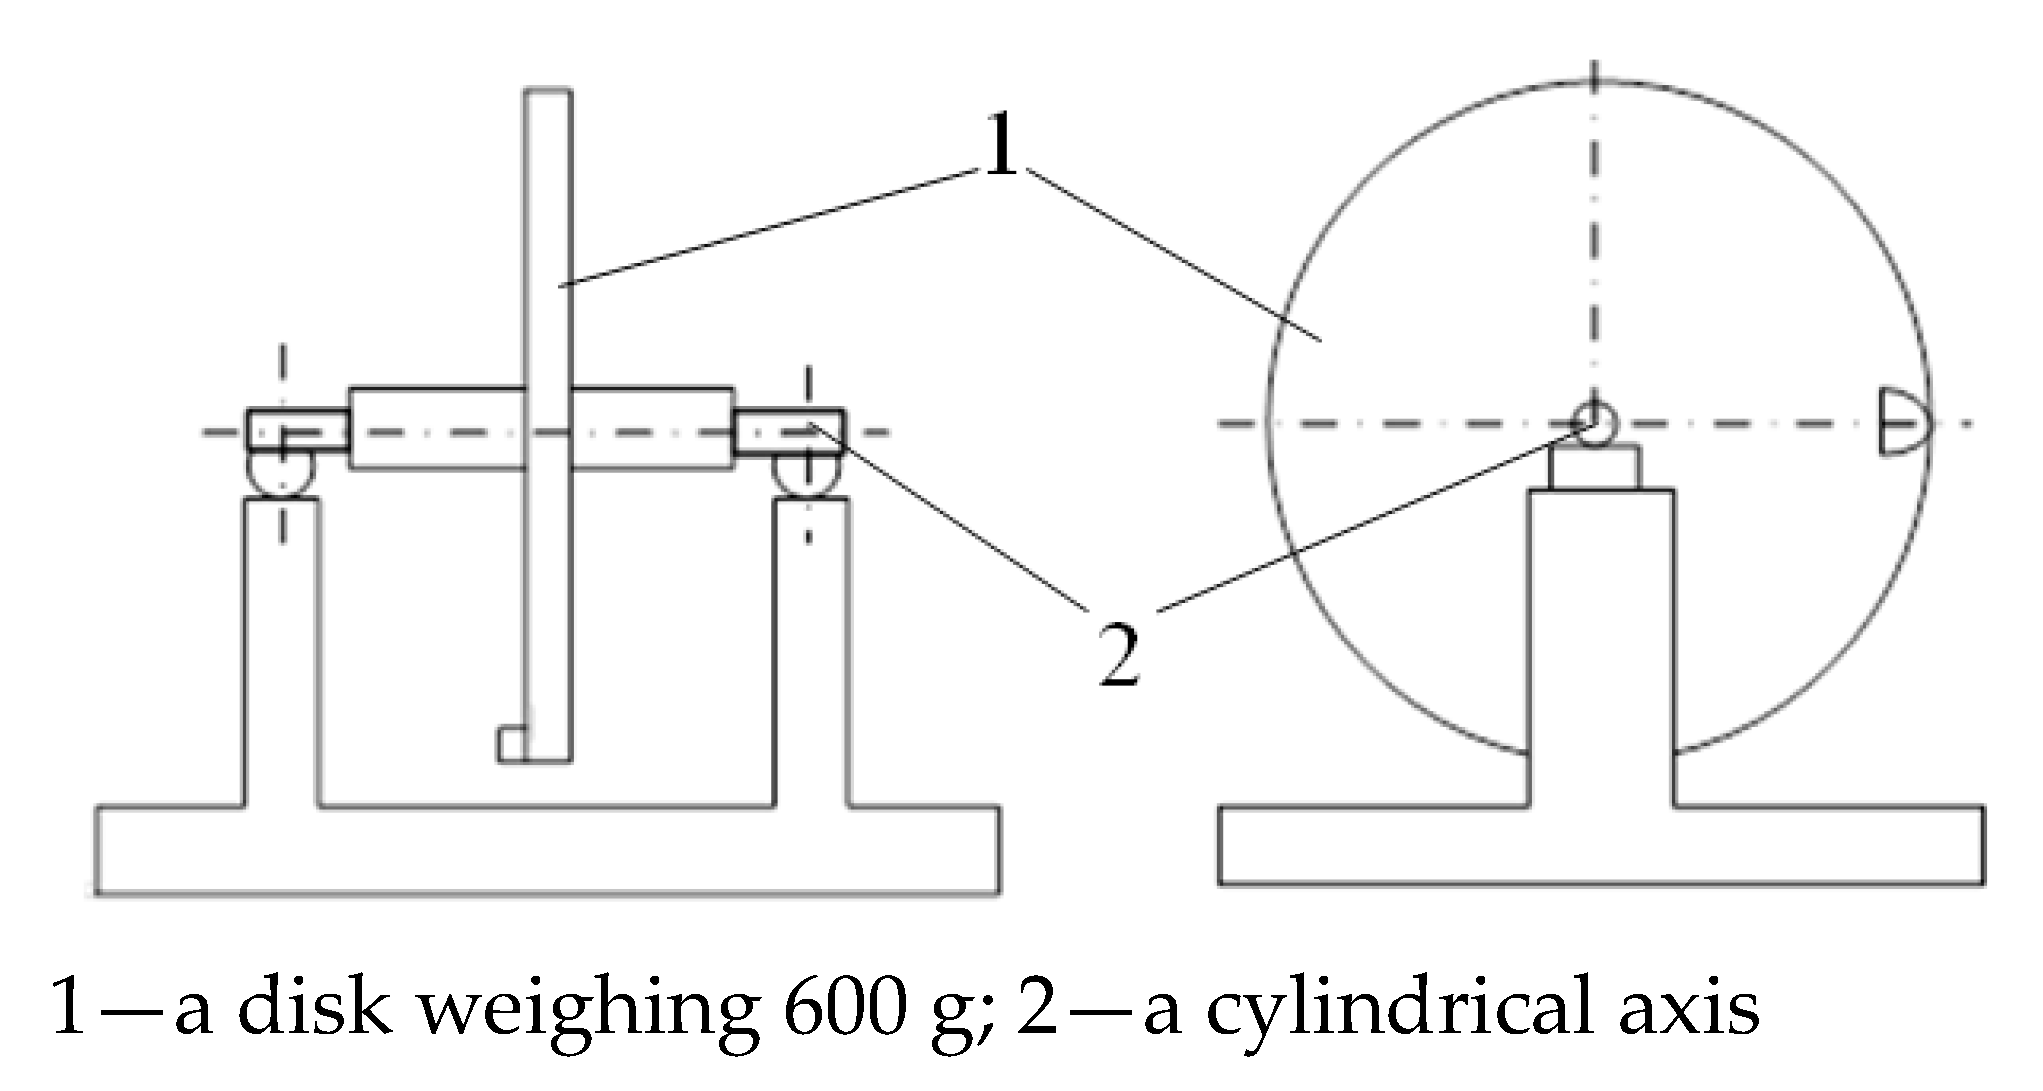
G.A. Tomlinson was apparently, the first to use a physical pendulum with two supporting balls for systematic studies of the molecular nature of rolling friction at low swing amplitudes. In his experiments carried out in 1929, a pendulum in the form of a disk was mounted on a cylindrical axis and rested on two rolling bodies (two cylinders, or two half-cylinders, or two balls). One version of the experiment to measure the rolling friction of a cylinder along a plane is shown in
Figure 6. The amplitude of the disk oscillation was approximately in the range of 221 to 6 arc minutes. The rolling friction coefficient was found by calculating the damping of the swing amplitude of the disk under the assumption that the damping decrement remains constant [
27]. In his article, Tomlinson, among other things, concluded that the rolling friction coefficient is practically independent of speed.
Previously, the authors of this work developed a two-contact pendulum device in which a physical pendulum made free damping swings with an amplitude substantially smaller than the angle of elastic contact, resting on two identical balls on a test flat surface (
Figure 7) [
28]. The pendulum mass center was on ball’s contact spot [
29]. It was suggested that under loads referred to the field of elastic deformation and low rolling speeds, the balls movement was similar to pure rolling. In this case, the main mechanism of rolling resistance is the adhesion forces and the forces of frequency-independent internal friction arising from the deformation of the contacting bodies. A phenomenological theory of rolling resistance was constructed in the DPR mode, and it was shown that with this device it is possible to study the laws of rolling resistance on the nano—and microscale with high sensitivity and accuracy.
In this device, the initial pendulum swing amplitude did not exceed 300 arcsec, and the final pendulum swing amplitude was 2 arcsec. We used polycrystalline sapphire balls with a diameter of 10 mm, and the pendulum weight was about 1.2 kg. Depending on the material of the supporting surface (tempered steel, hard glass, electrotechnical silicon), the angle of elastic contact was in the range of 37 to 47 arcmin. During the experiments, the amplitude and time of each swing were measured allowing the construction of the amplitude vs. time and period vs. the number of swings or time. The constructed mathematical models made it possible to approximate with high accuracy these experimental dependences with analytical dependences as presented below.
However, a two-contact pendulum has an obvious drawback: it can only be used if there are two identical test samples, placed under each ball, or one sample with a relatively large uniform surface. This significantly reduces the range of materials tested. In addition, there is a problem of identity, both of the balls themselves and of the conditions for their fixation were not always exactly similar.
3. The Phenomenological Theory of Rolling Resistance in DPR Mode
This theory is built on the assumption that the adhesion forces can be represented as some force bonds (springs) that connect the contacting bodies. When the pendulum swings, one part of these forces breaks, and in this case, a certain fraction of the pendulum energy is spent on the work of tearing off the surface of the ball from the surface under consideration. Also, part of the pendulum energy must work against the forces of internal friction during the deformation of the contacting bodies. Under the assumption that these forces are frequency independent, the friction moment as a function of the pendulum deflection angle can be written in the form [
29] of Equation (1).
where
m—the pendulum mass;
R—the ball radius;
c,
b,
p—the approximation parameters determined from the experiment. Here, coefficient c “is responsible” for the adhesive component of friction, and the second part on the right-hand side of Equation (1) is “responsible” for internal friction during the deformation of contacting bodies and capillary forces.
Using Equation (1), we can calculate the specific surface energy in the contact zone as the ratio of the work
performed by the adhesion forces when the surface of the ball is separating from the surface of the contact spot during its rotation through a small angle φ when it moves away from the equilibrium position, to
S:
The parameter σ in its physical meaning and dimensions coincides with the similar parameter γ used in [
3], which is referred to by the author as surface energy or surface tension.
The phenomenon of a sharp decrease in the period of the pendulum during its swings is associated with the action of the same elastic bonds between the surfaces of the contacting bodies that do not break as the pendulum swings. The dependence of the moment of these forces on the ball rotation angle, based on some physical considerations, can be written in the form [
29]
where
a is the contact spot radius; γ,
n are the approximation parameters determined from the experiment. In our opinion, the parameter γ characterizes the elastic pressure of the adhesion forces acting between the ball surface and the test surface. In [
3], the author, in the case of the Van-der-Waals forces action denoted as σ, calls the similar parameter as Van-der-Waals stress.
Under the experimental conditions, when the mass center of the pendulum lies on the contact spot, and at very small values of its amplitude and angular velocity, the differential equation of swings of the pendulum practically coincides with the equation of swings of a mathematical pendulum. Using Equation (1), we have a differential equation in the form
where
I—the moment of pendulum inertia relative to the mass center.
The solution of Equation (4) in a first-term approximation of the asymptotic theory of nonlinear oscillations gives the relationship of the pendulum swings amplitude α on time in an implicit form [
29]:
where
T—the average value of the pendulum swing period.
Using Equation (5) as the regression equation for approximating the experimental damping curves of the swing amplitudes, we can determine the numerical values of the parameters c, b, and p.
Similarly, taking into account Equation (3) for the moment of elastic forces, solving the differential equation of the pendulum swing, in the second approximation of the asymptotic theory of nonlinear oscillations, we can obtain the dependence of the pendulum swing period on the amplitude in the form (Equation (28) in [
29]).
Using an equation of the form Equation (6) as a regression equation for the experimental dependence T(α), one can find the numerical values of the parameters T0, γ, and n, which are stable with respect to the choice of initial approximations of the values of these parameters during calculations in the process of nonlinear approximation.
The total moment of rolling resistance forces can be written as
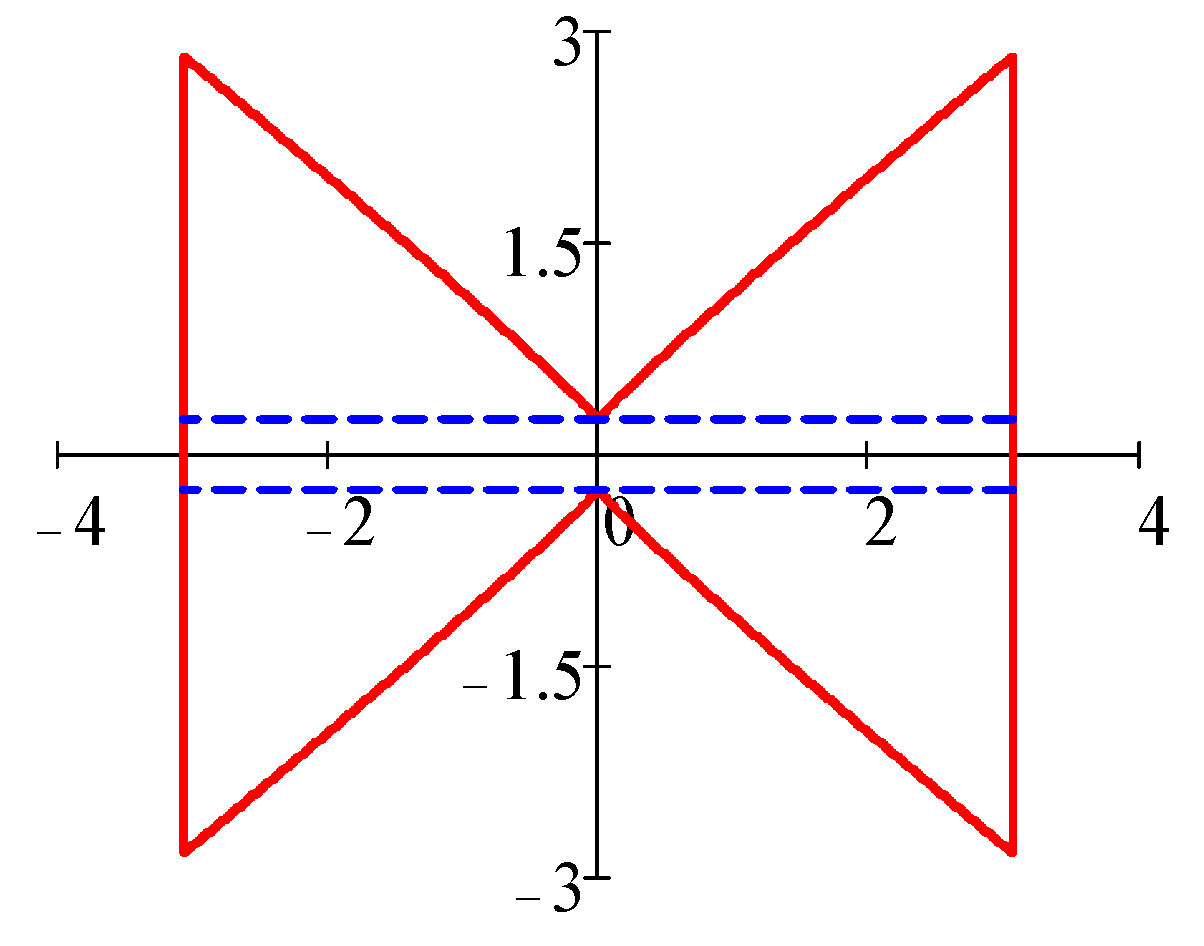
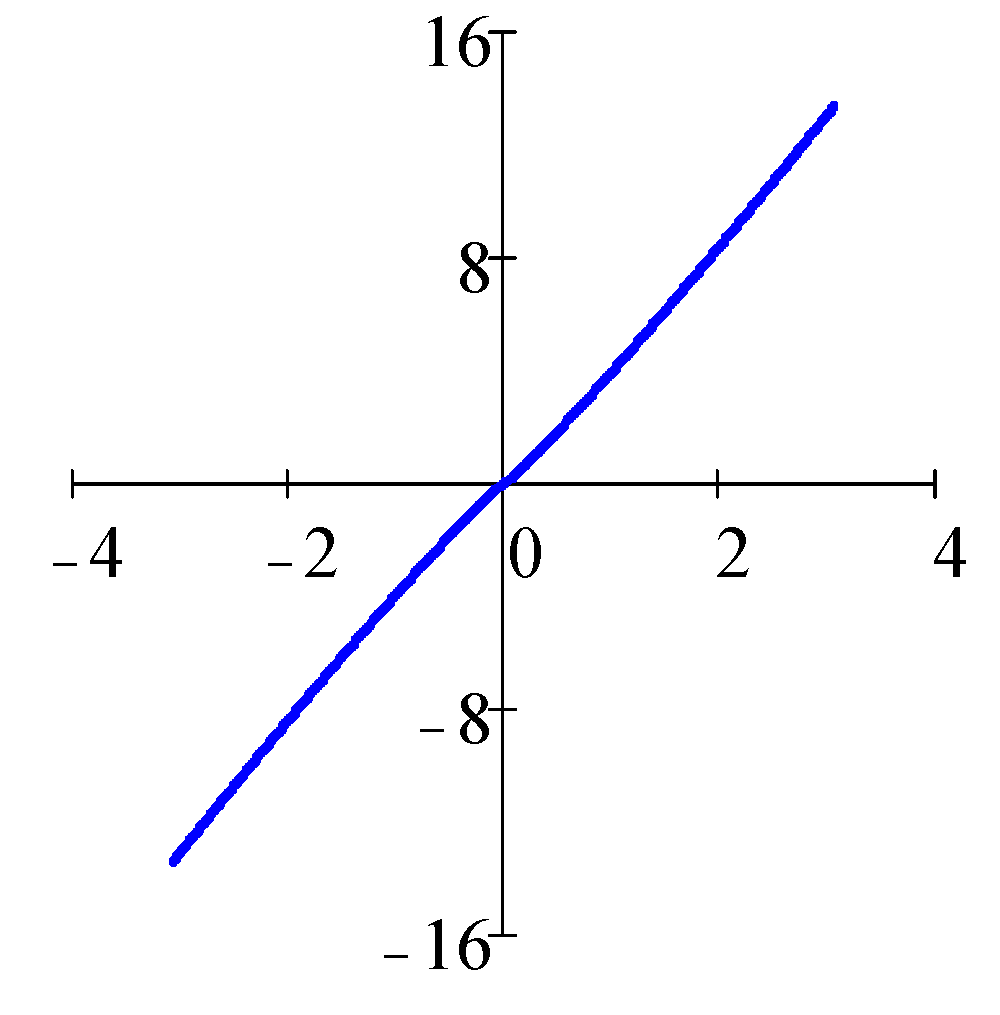
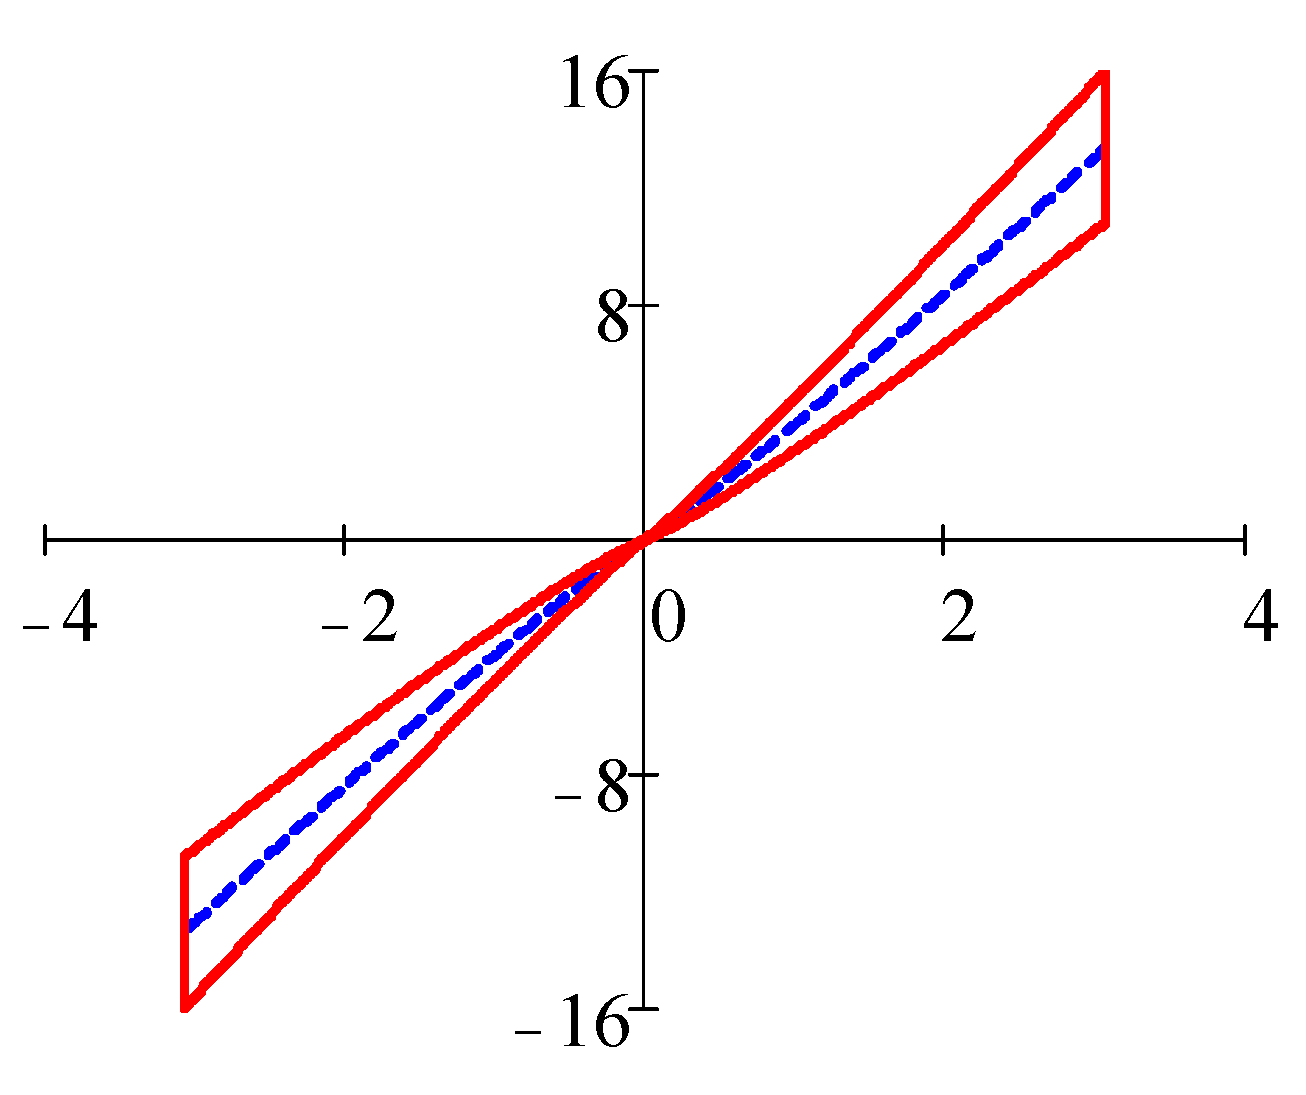
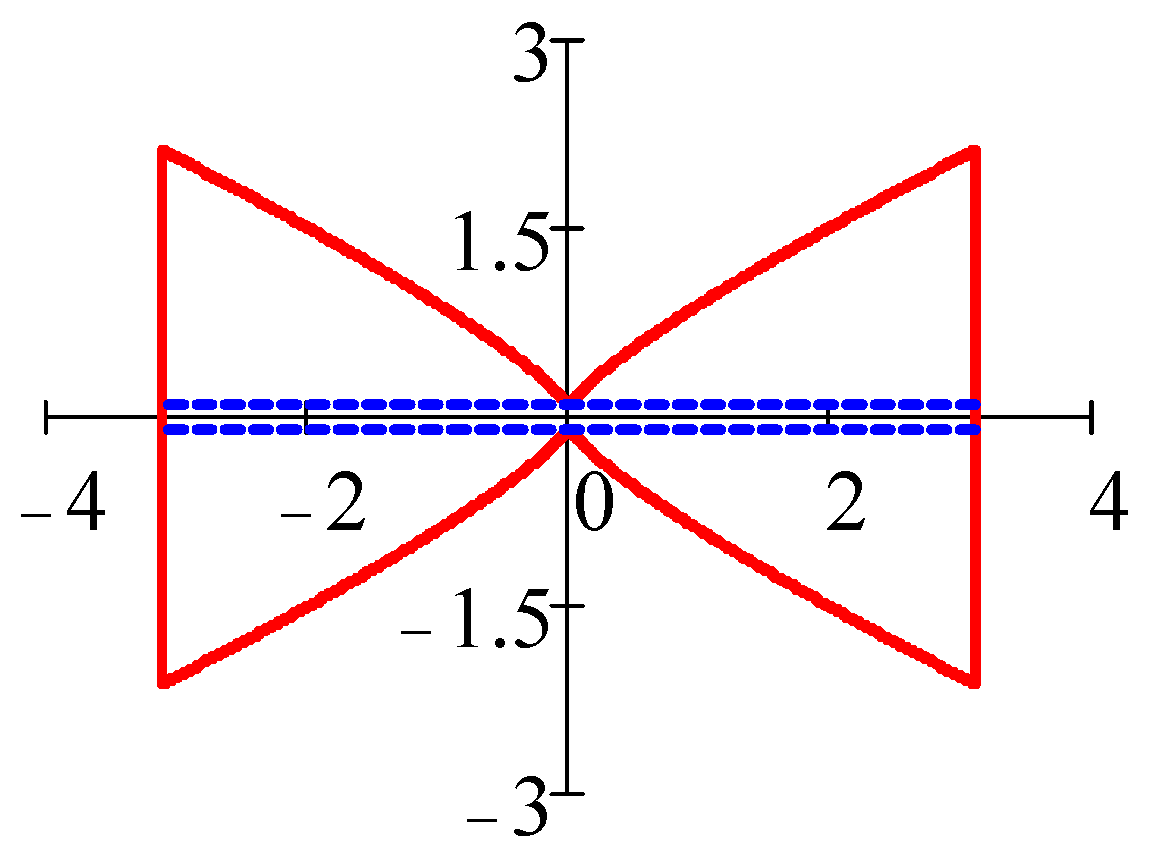
The dependence M(φ) with the known dependence φ(t) allows us to construct a phenomenological theory of rolling resistance of adhesion forces in the DPR mode. In particular, the dependence Mel(φ) allows one to construct a skeletal curve and the dependence Mfr(φ) allows one to construct a hysteresis loop around the virgin curve. Examples of such curves are shown below.
4. Pendulum Device Based on One Ball: Design and Measurement Procedure
As mentioned previously, when using a pendulum device based on one ball, it is necessary to solve the problem of instability of the pendulum swing plane. The instability effect enhances when the mass center of the pendulum is close to the contact spot, and the friction is small. If the pendulum is mounted with one support ball on a hard flat surface, it will have the ability to swing around two horizontal axes and rotate around a vertical axis.
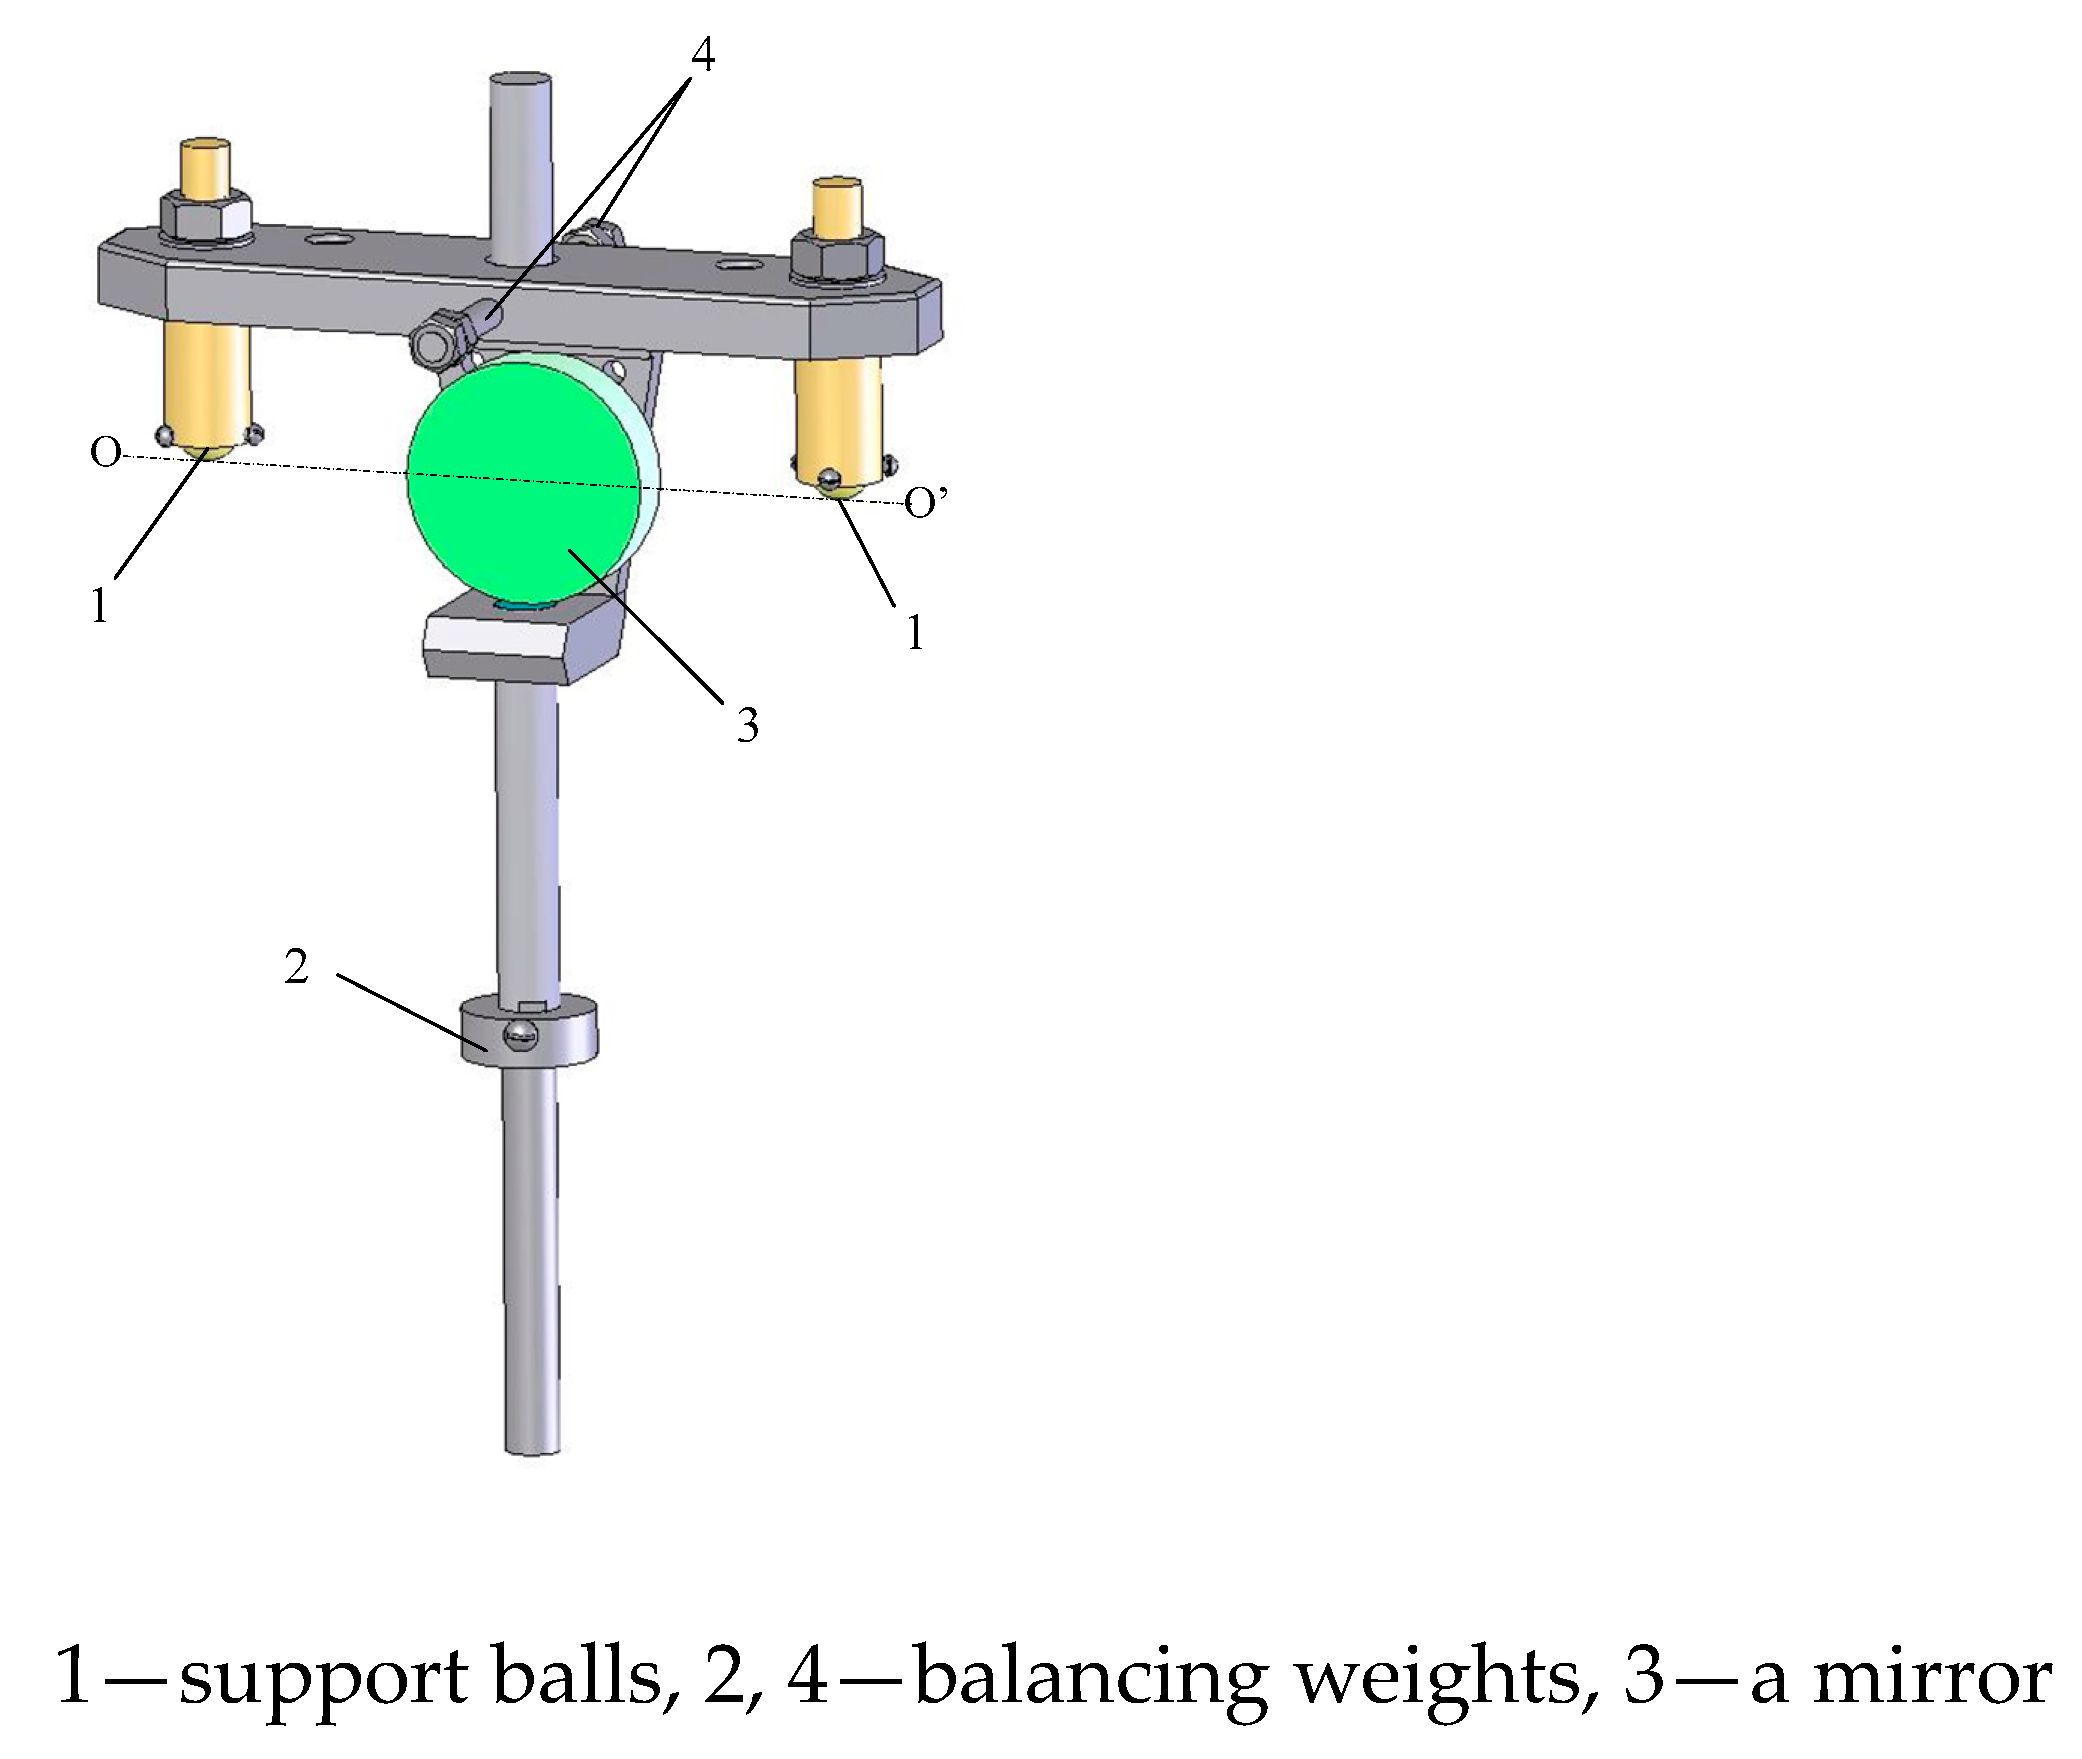
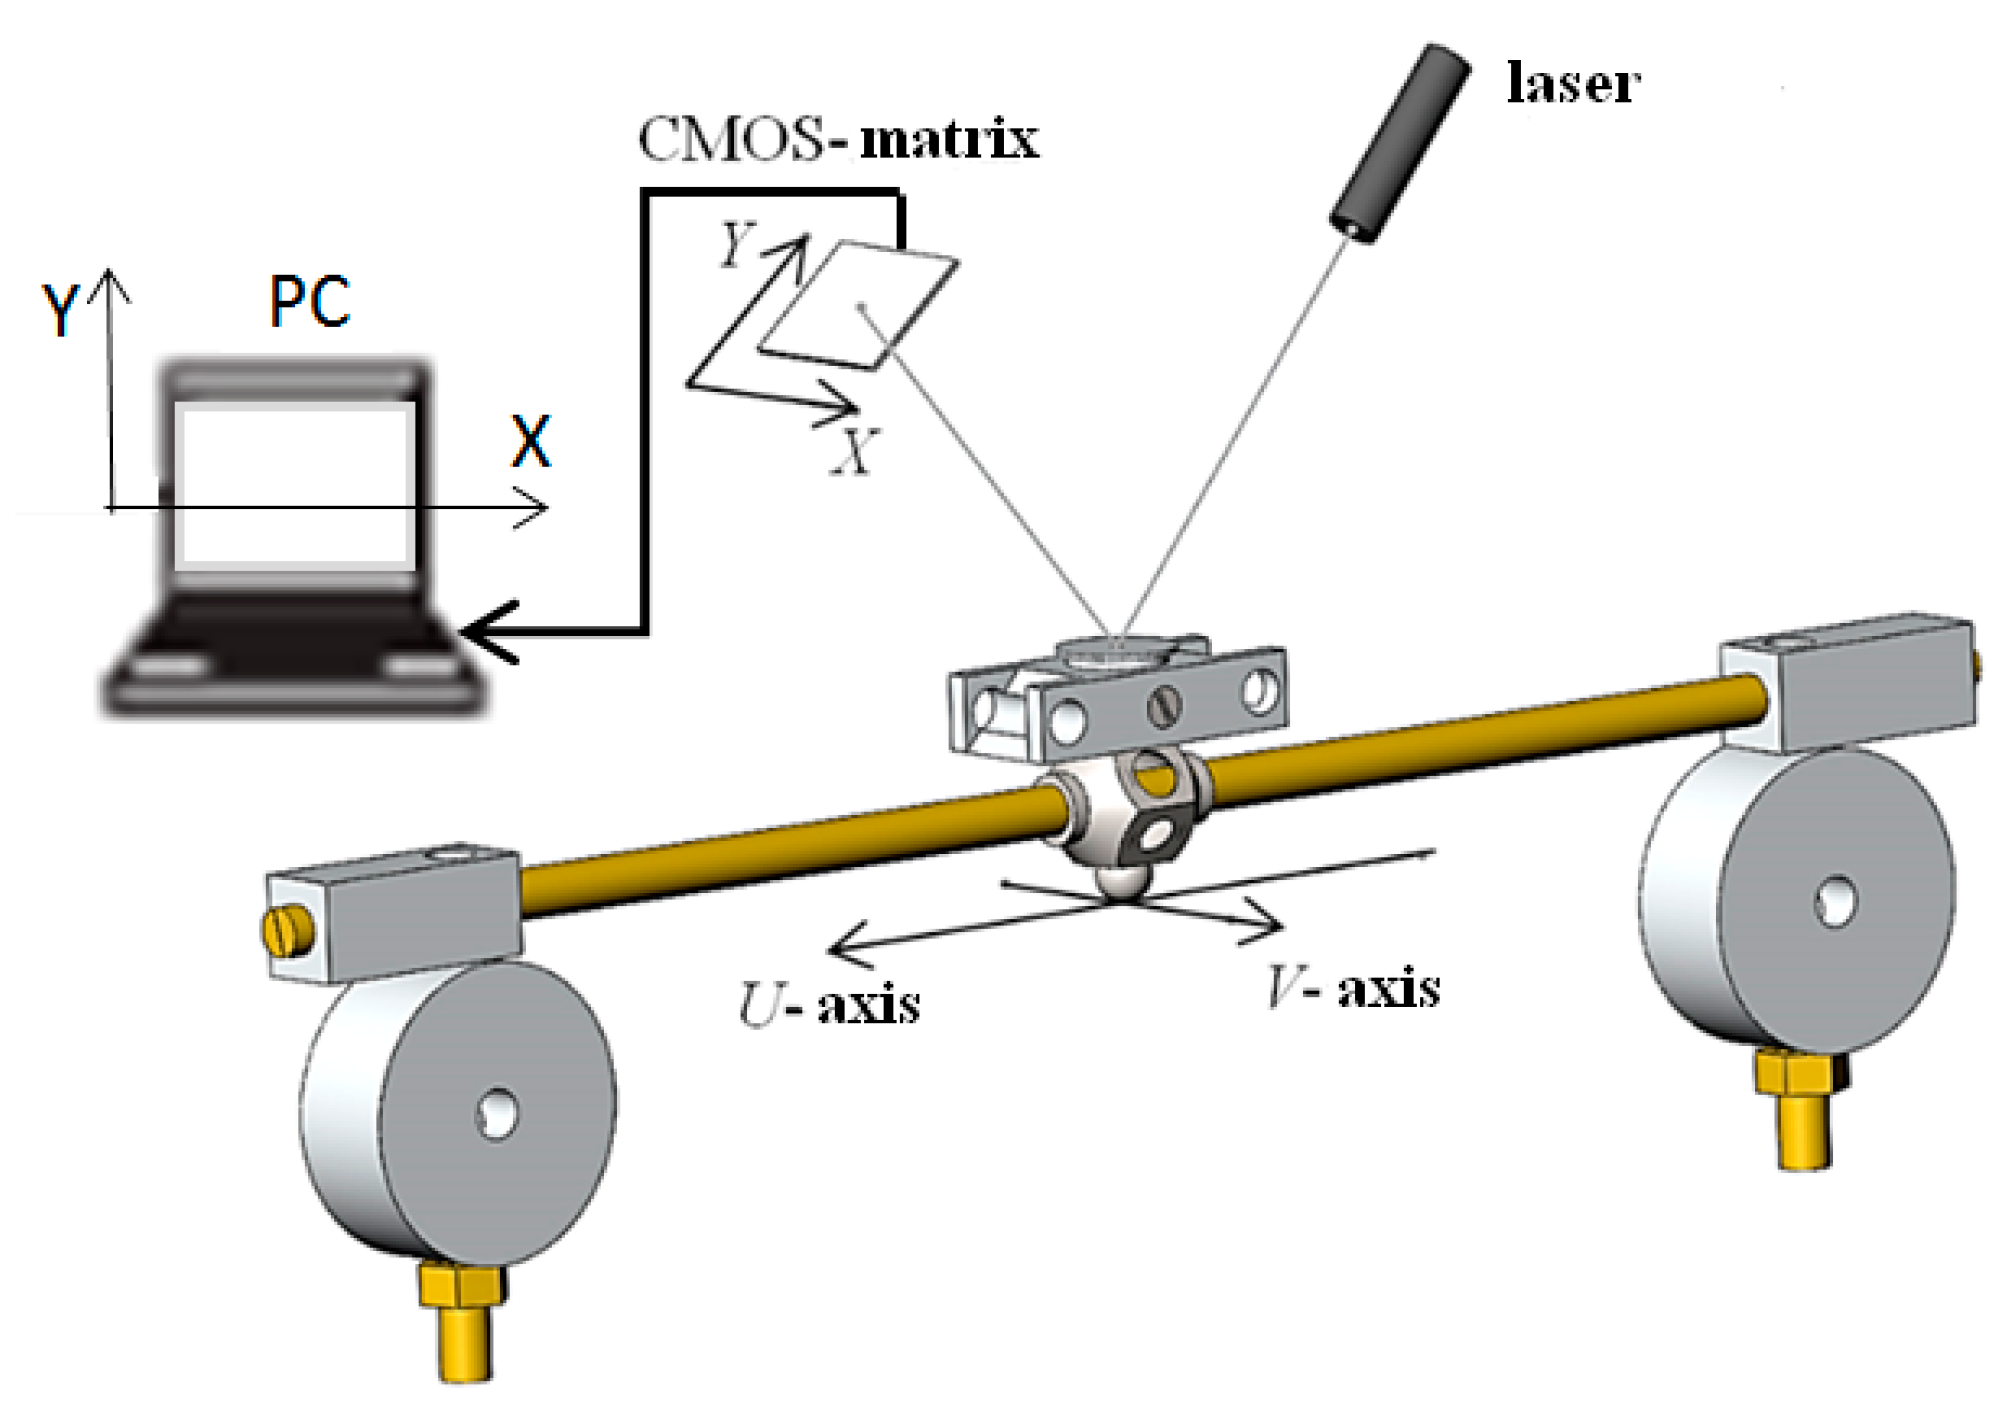
In our experiments, it was found that in the DPR mode, after careful starting of the swings, the pendulum rotation around the vertical axis practically did not occur or quickly stopped due to the spin friction being high. In addition, it was noted, if the pendulum shape where the moments of inertia of the main horizontal central inertia axes differ significantly from each other (
Figure 8), the swings with a short period around the long axis (the
U axis with a minimum moment of inertia) damps earlier than swings with a large period around the short axis (
V axis with a maximum moment of inertia).
Thus, in order to build a device based on a single-ball pendulum and solve the problem of holding the pendulum swing plane, it is necessary that the main moments of inertia of the pendulum around which the swings occur should differ significantly in size as explained later. In addition, the mass center of the pendulum should be on the contact spot, which eliminates both the ball slippage during its swings and the influence of base vibrations on swings [
28,
29]. The first condition can be fulfilled due to the pendulum design—it should have the most elongated shape. The second condition can be ensured by careful balancing. There is no spinning around the vertical axis due to proper balancing.
Figure 8 shows a single-ball pendulum specially designed for measurements. In this pendulum, the ratio of the moments of inertia
Iv/
Iu is about 25, which experimentally gave the ratio of the pendulum swing periods
Tv/
Tu equal to about 5. This has been achieved with extensive tests. The diameter of the ball was 12.1 mm. The mass of the pendulum was 0.406 kg. The mass center of the pendulum was near the contact spot.
To measure the amplitude and swing time of the pendulum, an optical recording system for its oscillations was used, consisting of a semiconductor laser, a focusing device (not shown in
Figure 8), a mirror mounted on the pendulum, and a CMOS matrix. The computer records the signal from the matrix. This setup allows us to record the beam displacement path, reflected from the pendulum along the
X and
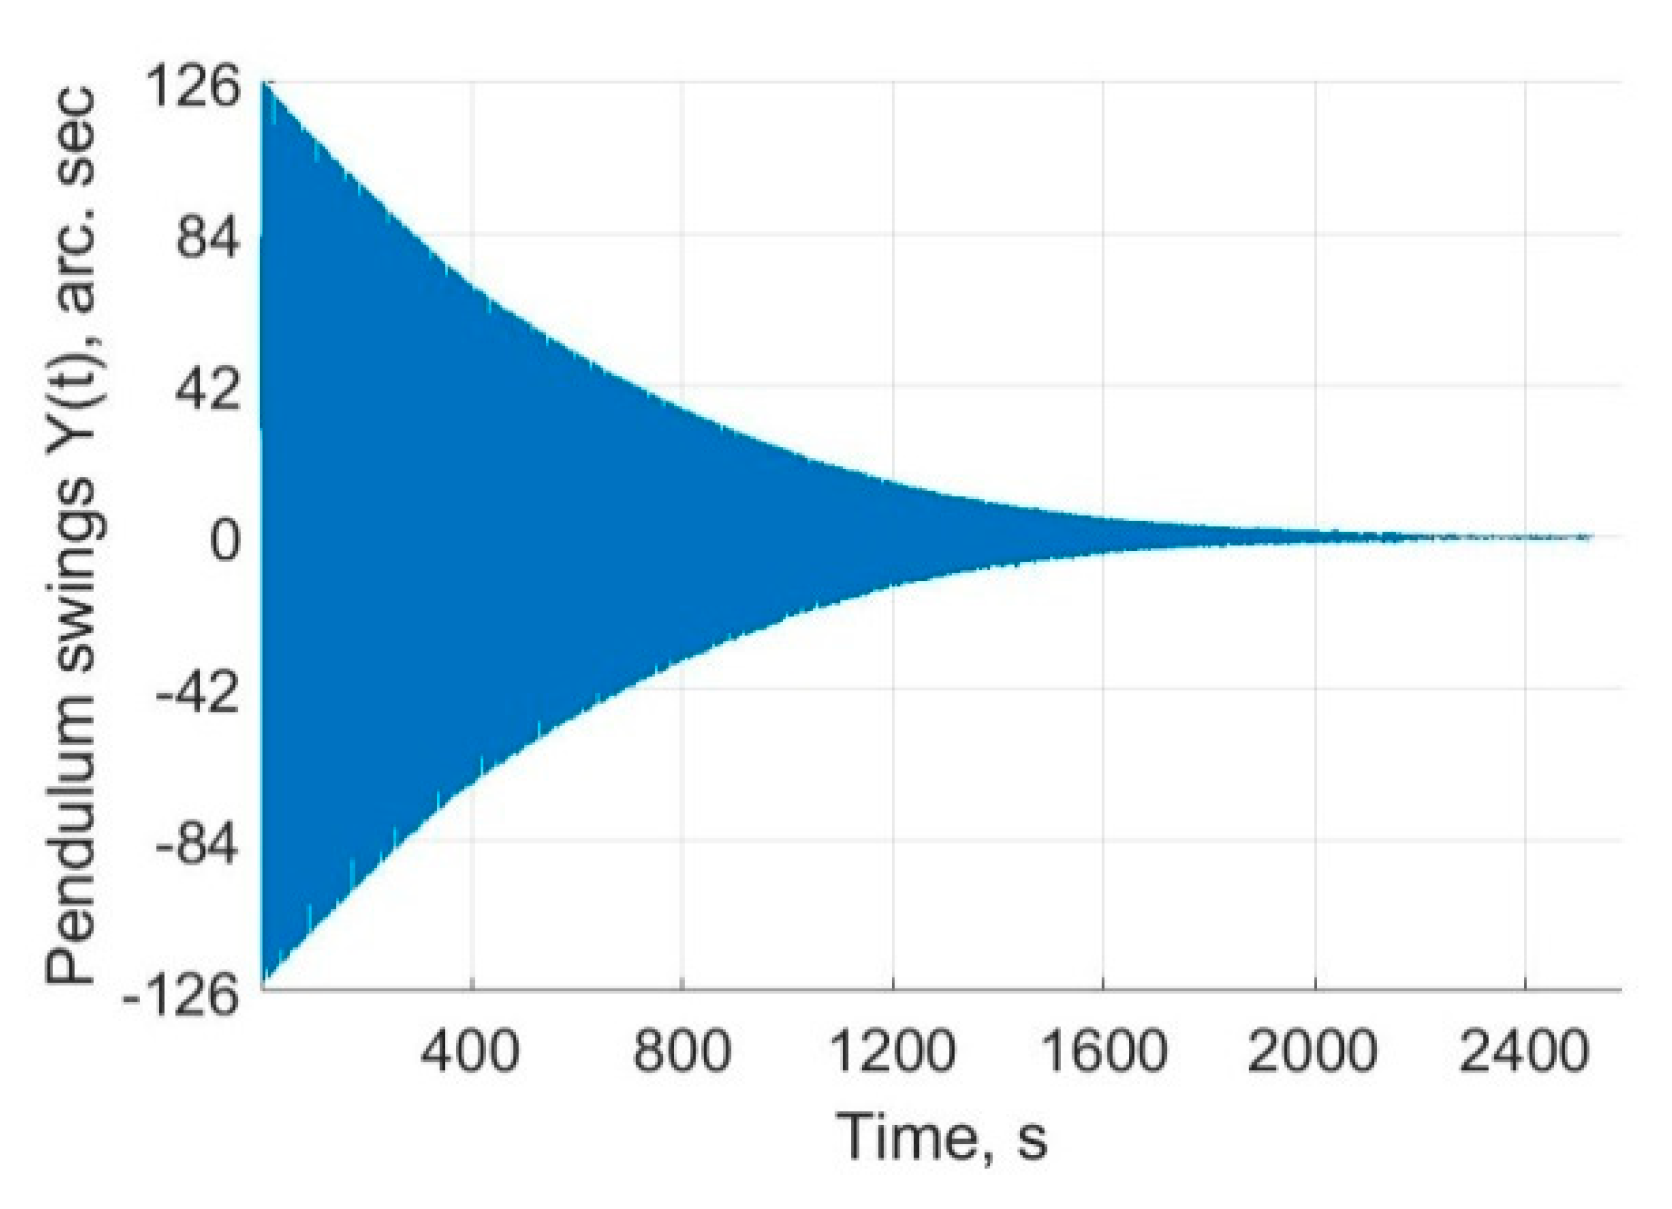
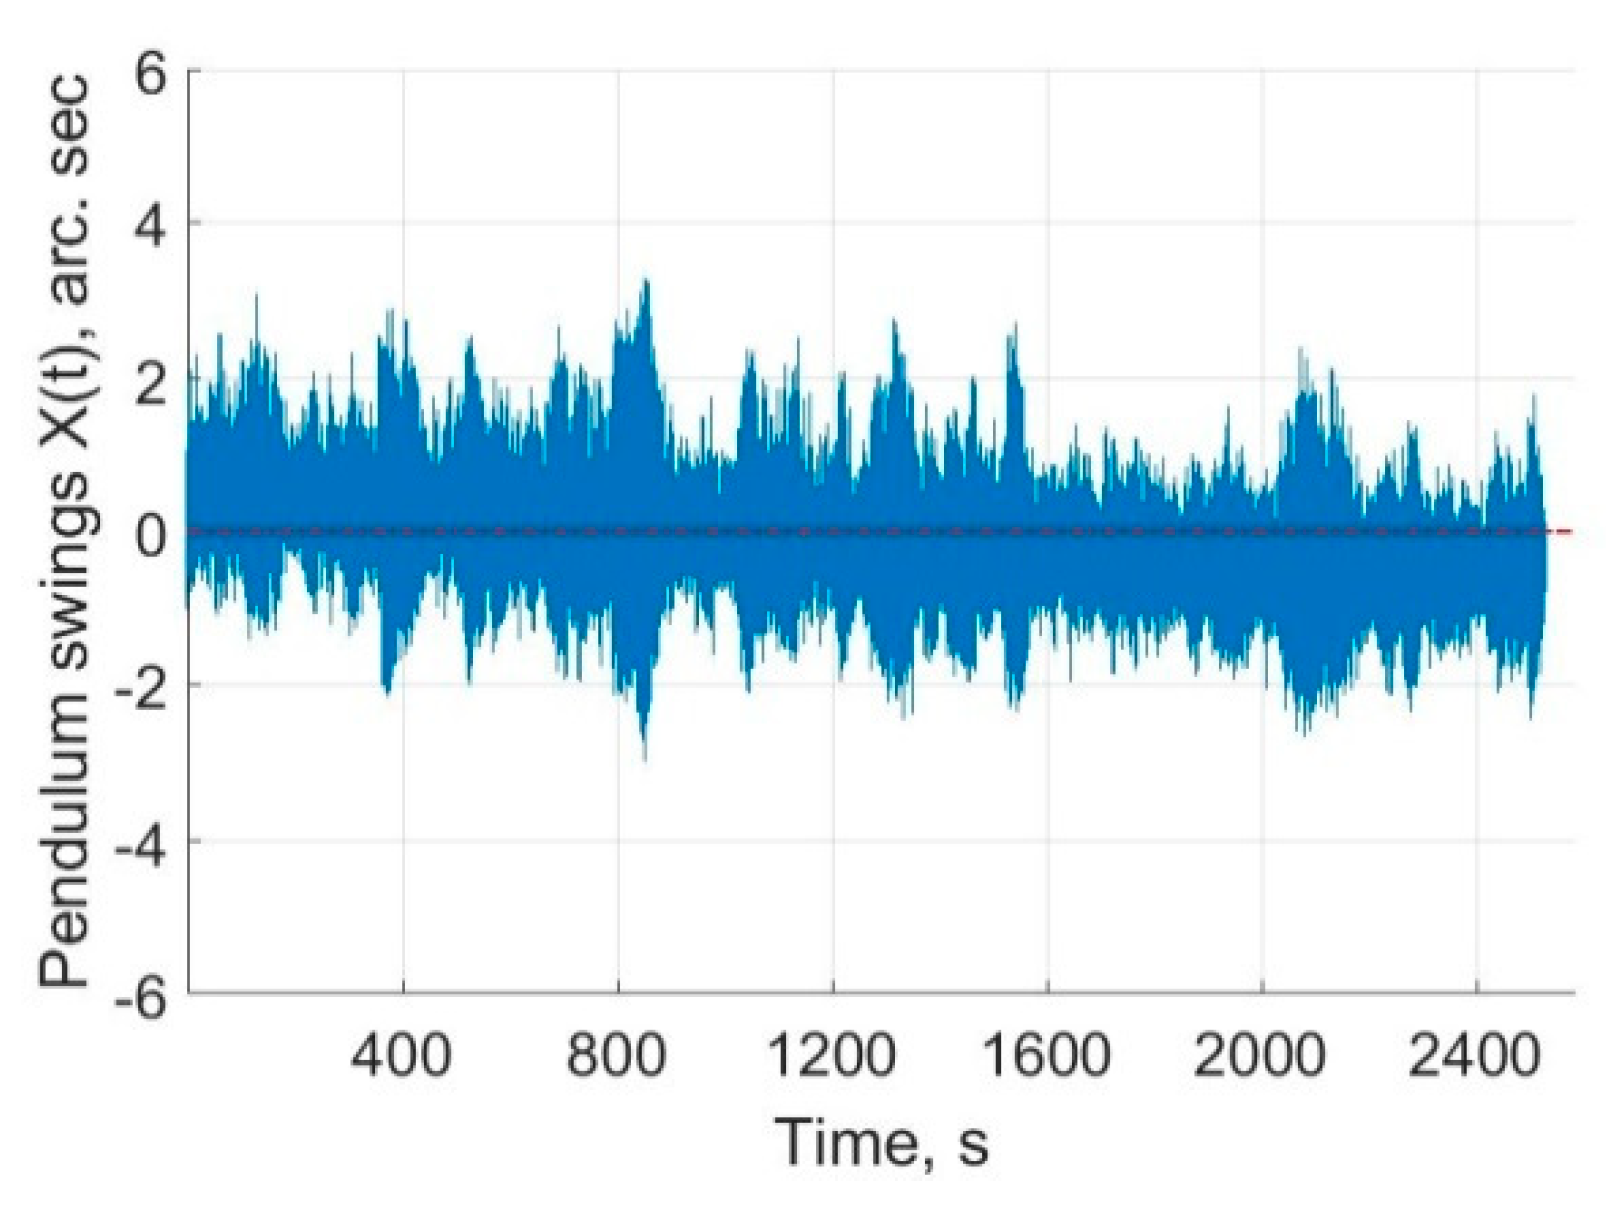
Y axes of the coordinate system of the CMOS matrix. Examples of writing
Y (
t) and
X (
t) of a balanced pendulum are shown in
Figure 9 and
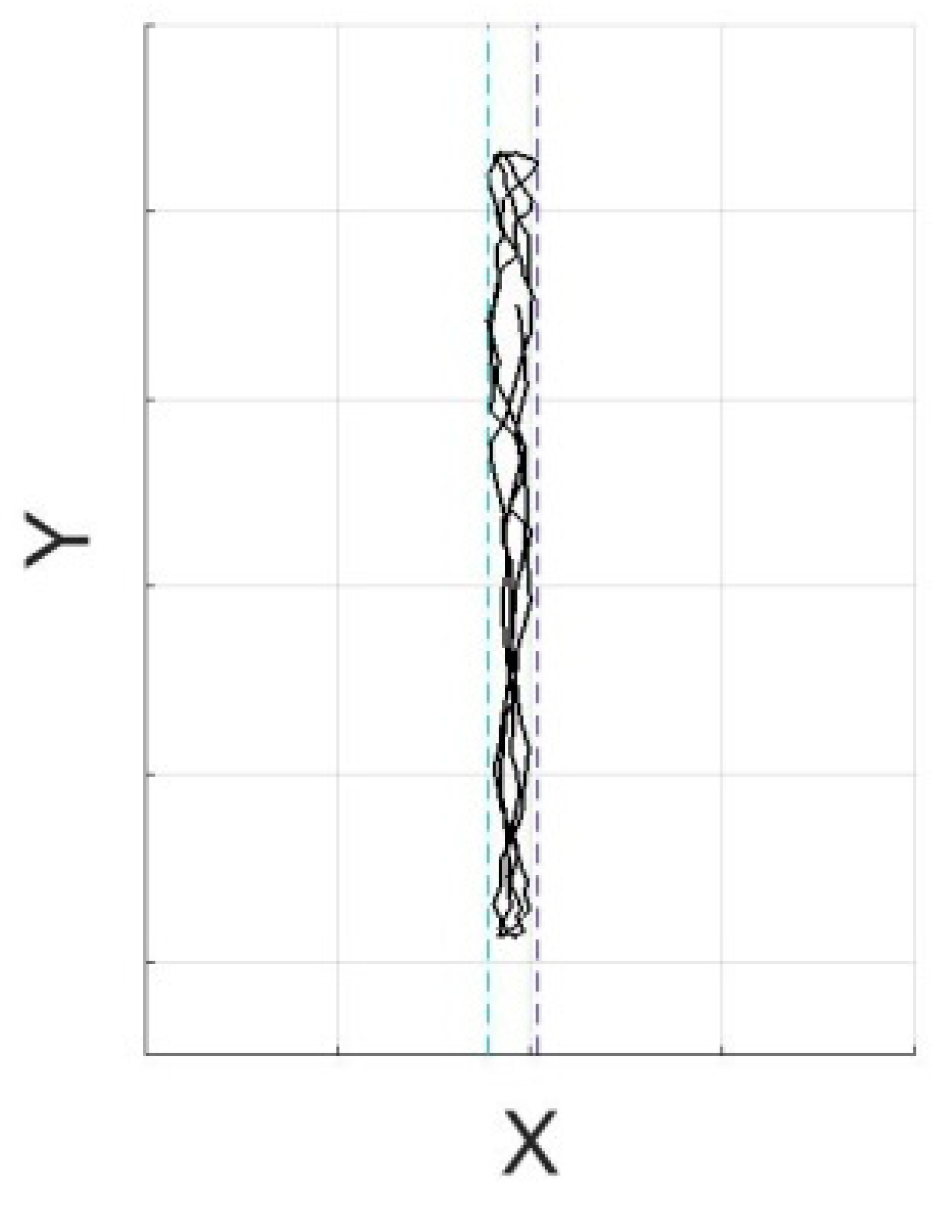
Figure 10, respectively. The Control over the balancing of the pendulum was also carried out by constructing its trajectory in the coordinates
Y,
X (
Figure 11)—an analogue of the Lissajous figure. It is worth noting that measurements are repeatable.
If the pendulum was perfectly balanced, and the optoelectronic system was perfectly tuned and had no noise, and there was no influence of the vibrations of the basis, the short-term transverse vibrations of the pendulum should not be excited, and the records in
Figure 10 and
Figure 11 should look like a horizontal and vertical line, respectively.
5. Measurement and Calculation Results
In the experiments, a ball of radius R = 6.05 mm made of hard steel was used as a pendulum support. As the materials for the test samples were selected next: single-crystal silicon (roughness Ra = 0.4 nm, elastic modulus Esi = 1.31·1011 N/m2, Poisson’s ratio νsi = 0.266), hard steel (Ra = 63 nm, Est = 2.11·1011 N/m2, νst = 0.28) and K8 optical glass (Rz = 40 nm, Eg = 0.82·1011 N/m2, νg = 0.206).
The calculated contact parameters of the hard steel ball and surfaces for testing are shown in
Table 1.
The initial swing amplitude of the pendulum was chosen equal to α0 ≈ 6·10−4 rad ≈ 124 arcsec, the final amplitude was approximately 2 arcsec, so that the maximum ball displacement is rmax ≈ 3.63 μm, the minimum ball displacement is rmin ≈ 0,06 μm. This is limited by the recording equipment’s accuracy.
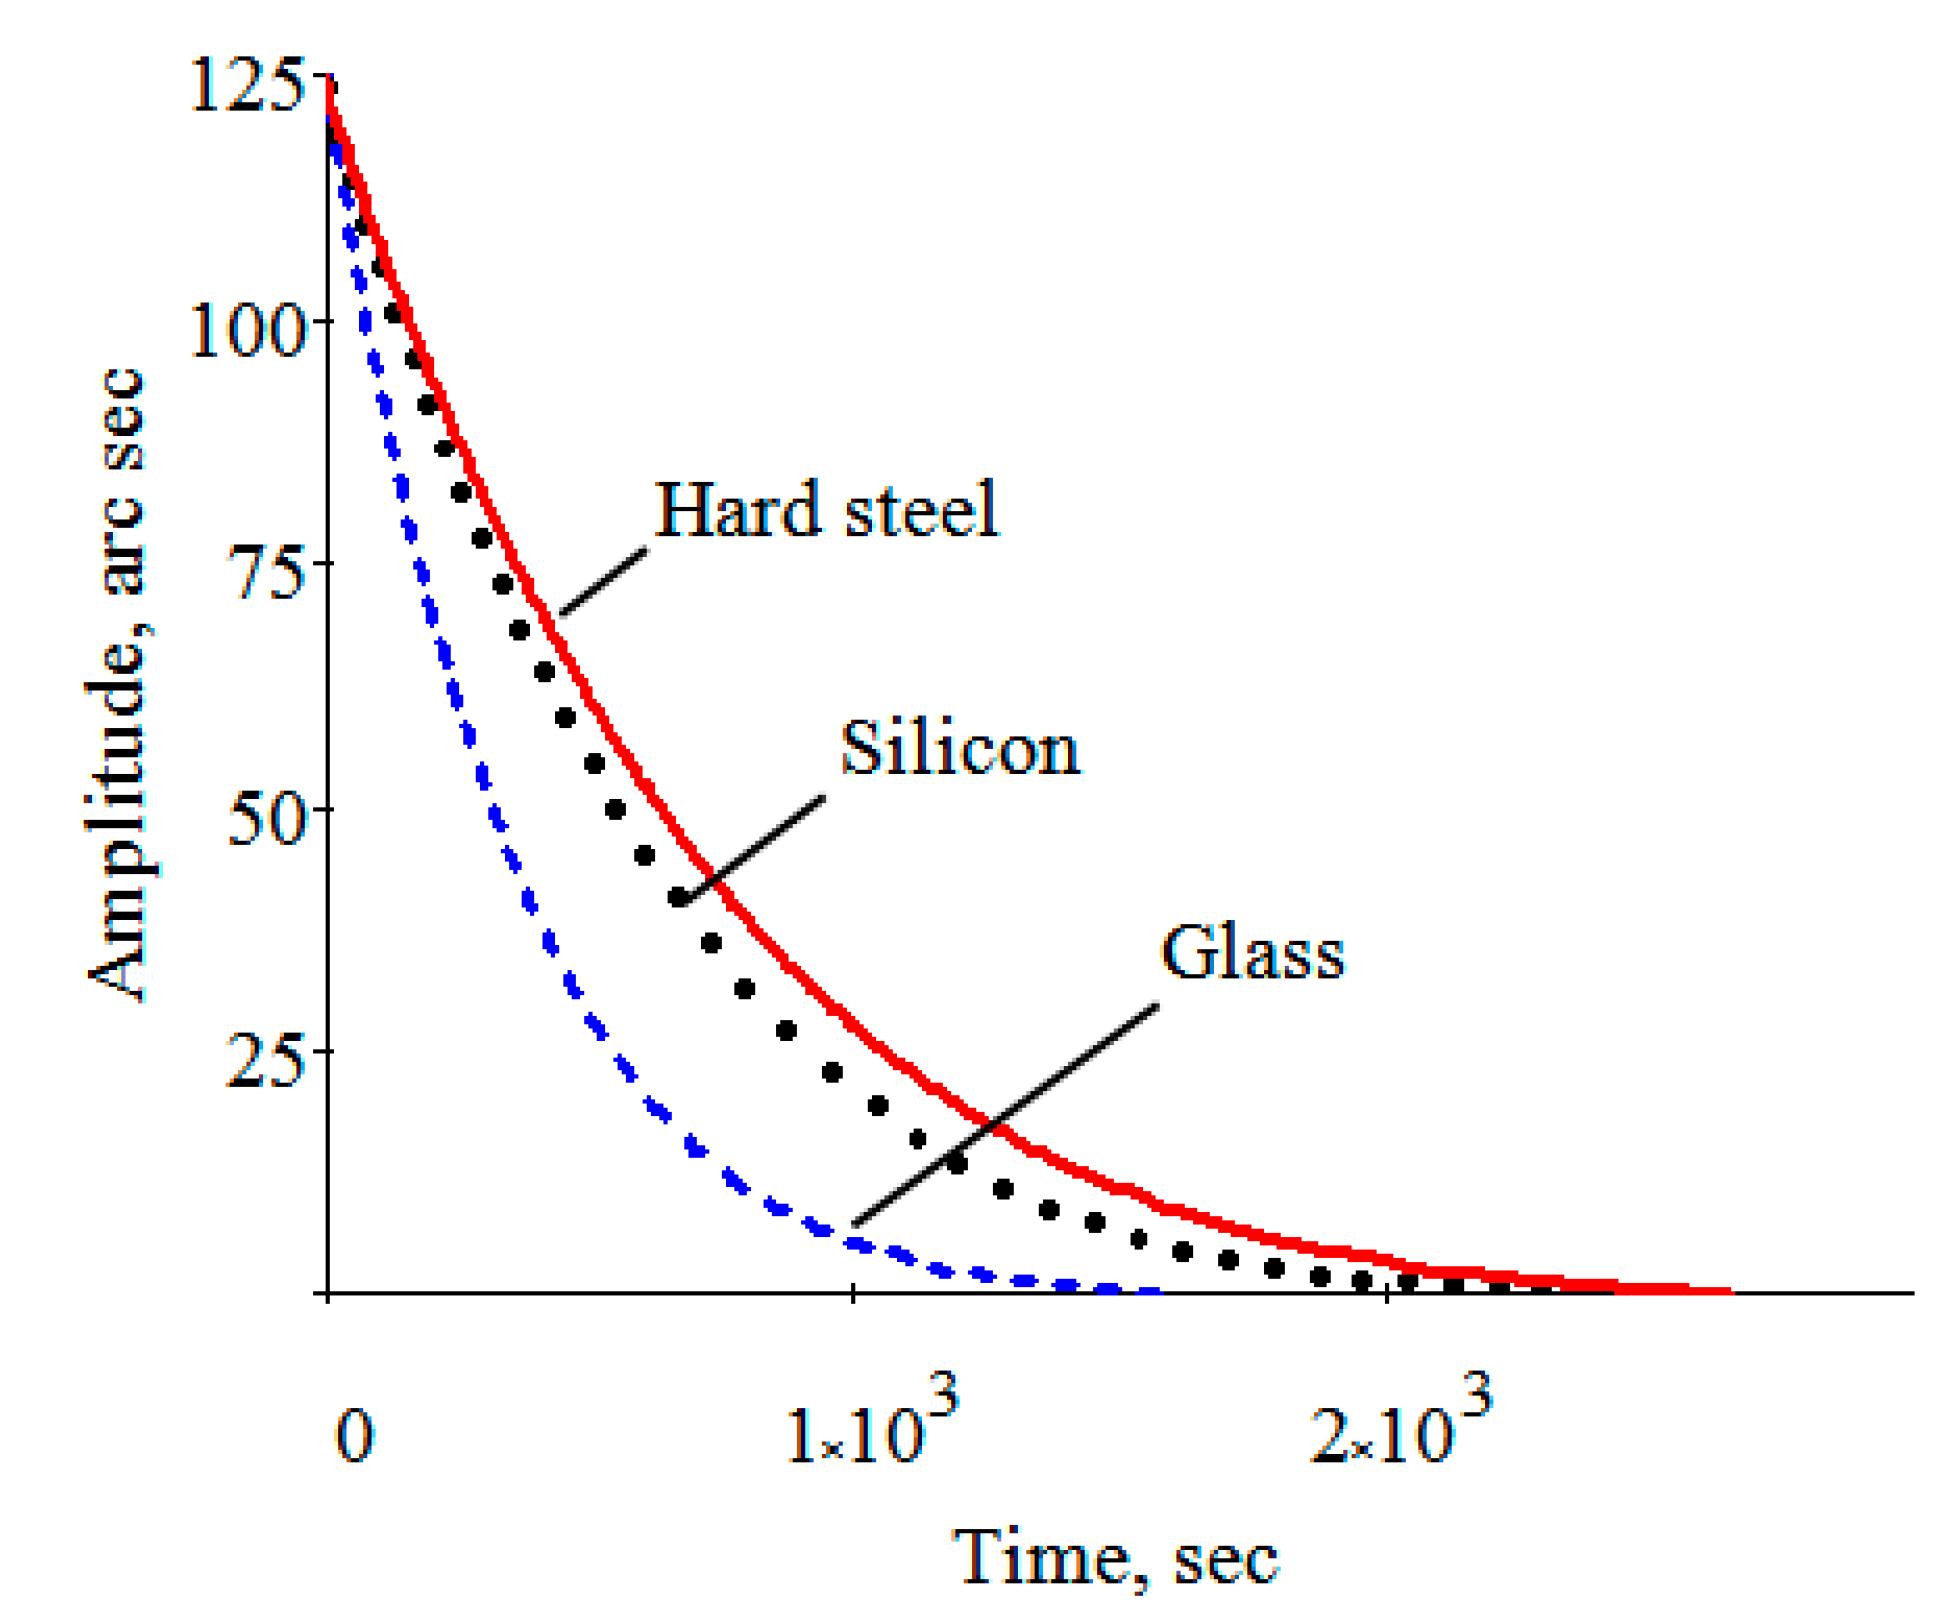
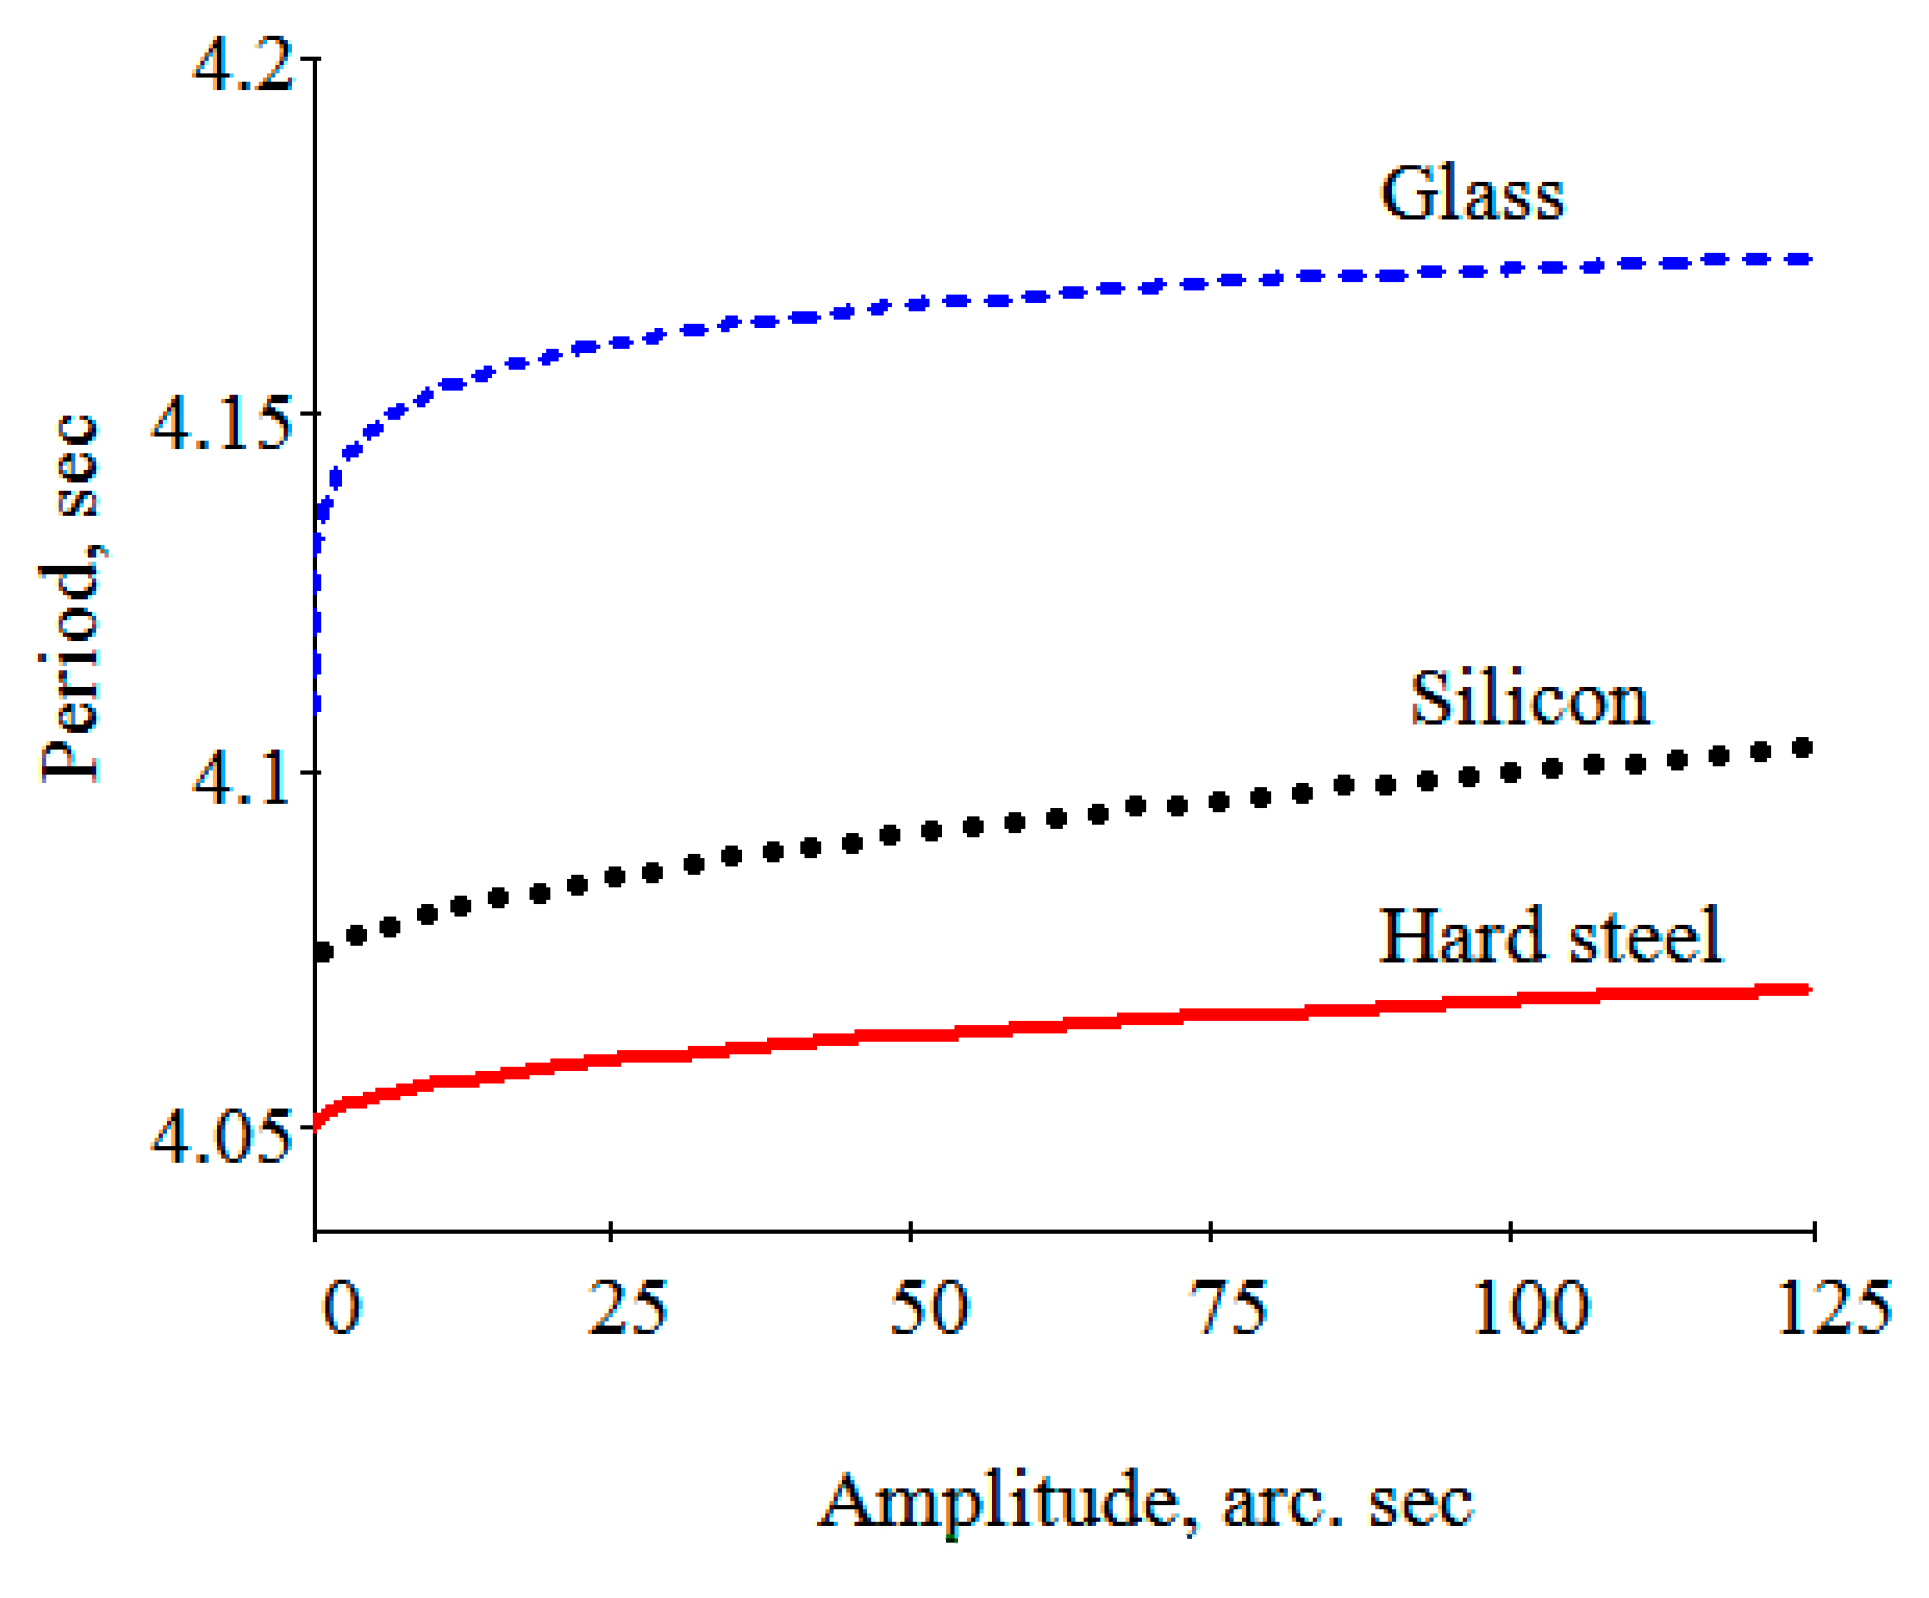
It is noticed that the angular and linear displacements of the ball were in the DPR zone. The results of measuring the dependences of the amplitude α on time
t and the period
T on amplitude α obtained for friction pairs by averaging the results of a series of three consecutive measurements for each contact pair are shown in
Figure 12 and
Figure 13, respectively.
The calculation results of the approximation parameters (friction parameters) of the amplitude versus time are presented in
Table 2. The calculation of the average relative approximation error (ARAE) of the curves of the amplitude dependence on time, given in this table, was carried out according to Equation (8).
where
αi—the measured values of the amplitude,
α(
ti)—the calculated values with Formula (5).
Note that the values of the parameter σ agree in order of magnitude with the values of “adhesive energy
wt-s (~10
−3 J/m
2)” obtained using an atomic force microscope (AFM) [
30].
The values of the elastic interaction parameters obtained from the approximation of the reliance of the pendulum swing period on the amplitude are presented in
Table 3. The calculation [
31] of the average relative error of this approximation given in this table is carried out according to Equation (9).
where
Ti—the measured value of the amplitude,
T(
αi)—the calculated value of the amplitude in accordance with Equation (6).
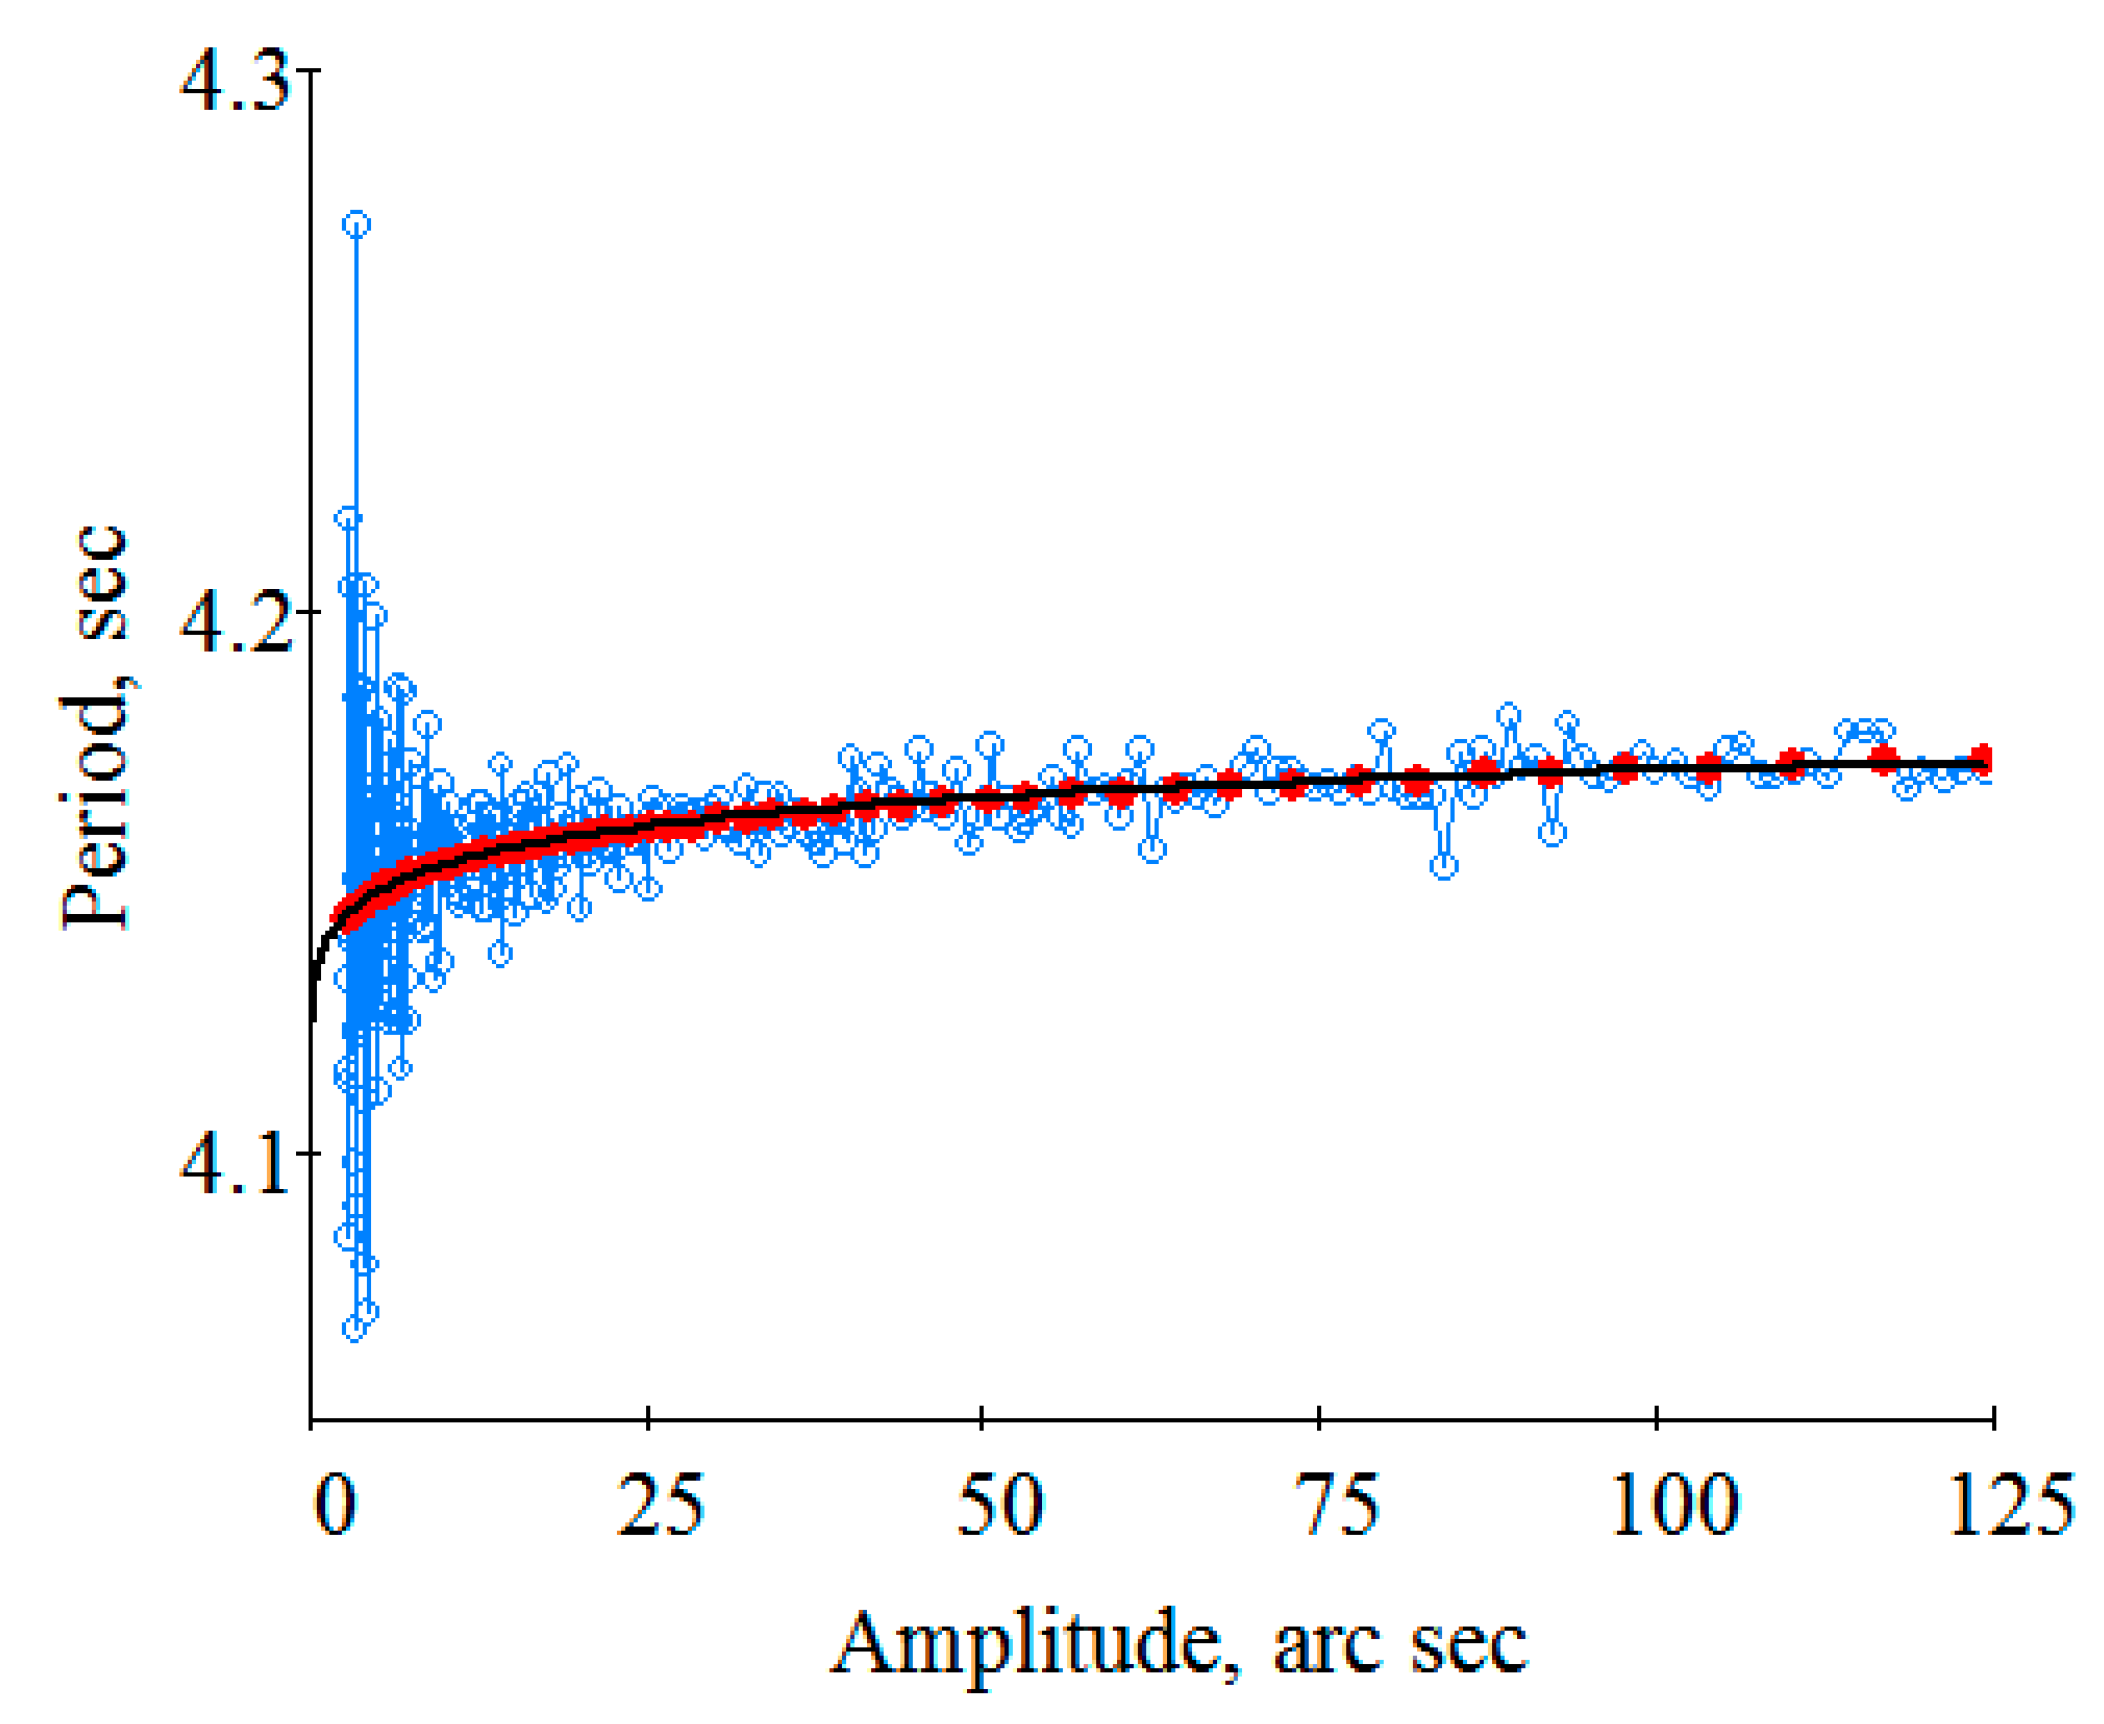
In
Figure 14, graphical smoothing has been applied using least-squares smoothing according to the rule of s-nearest neighbors, in which s is selected adaptively [
32].
The practical coincidence of the smoothing curve, which does not imply the use of any physical models, and the curve constructed on the basis of the dependence model
T(α), proposed in [
29,
33] and leading to Equation (6), can be considered a justification for the objectivity of these models.
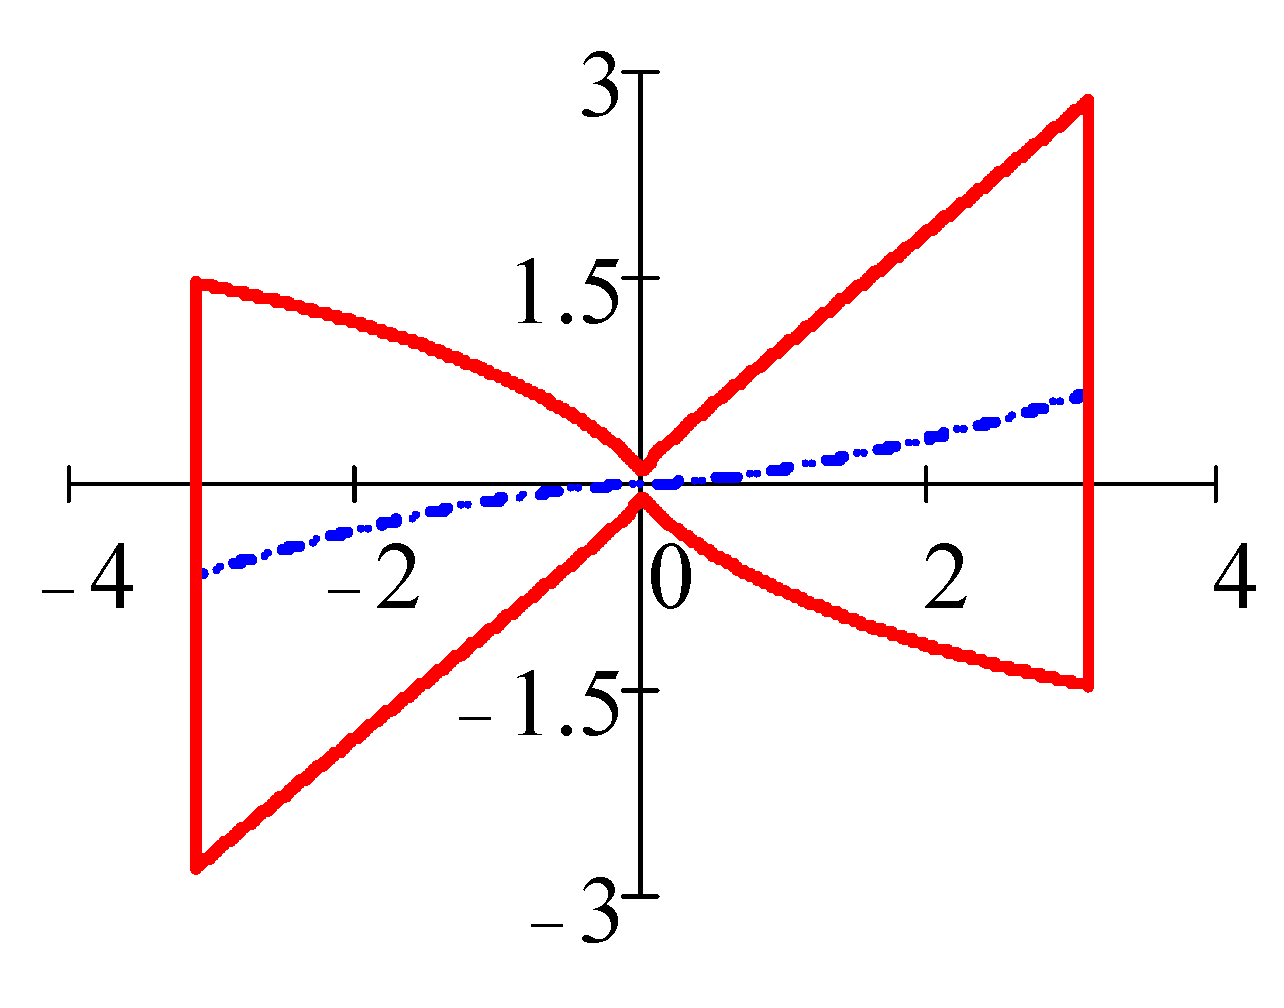
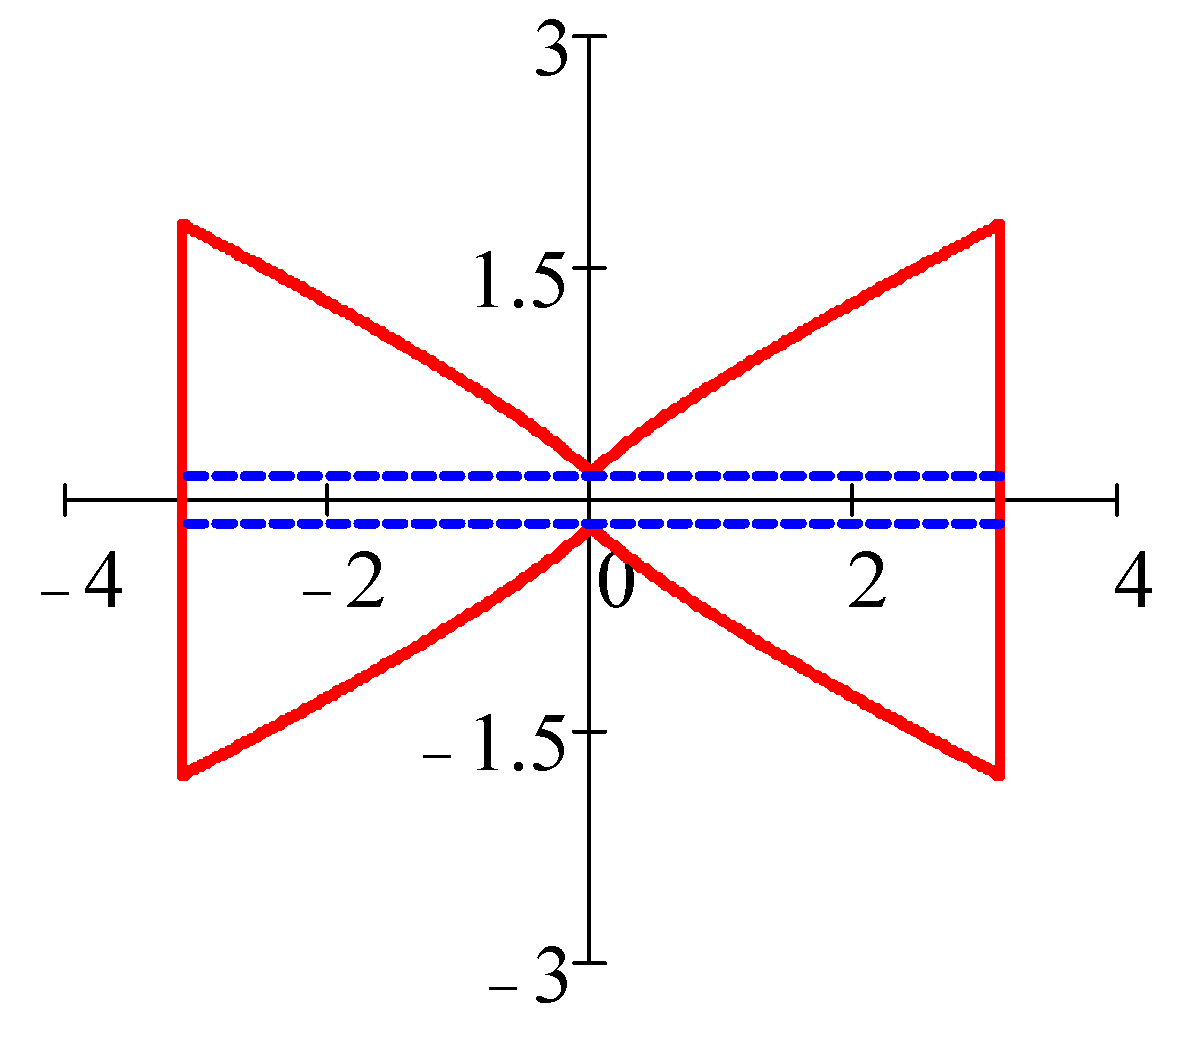
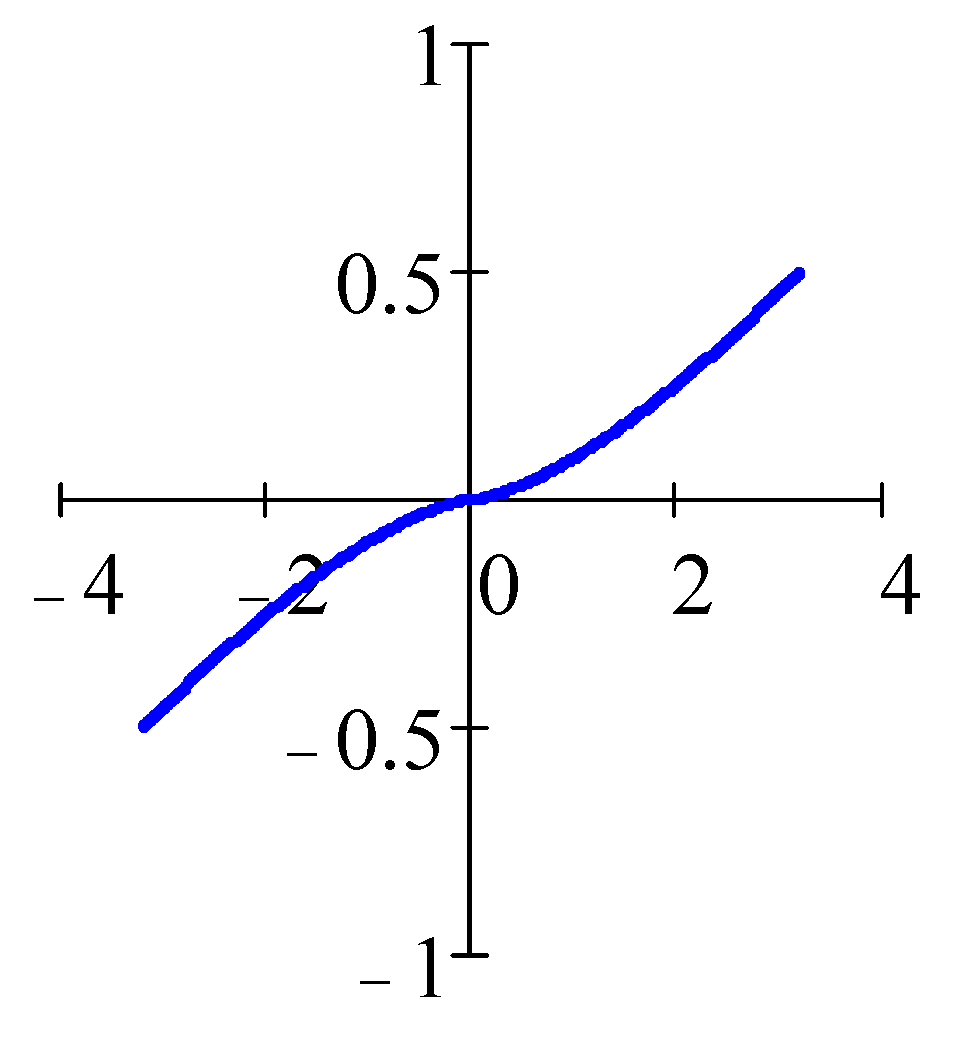
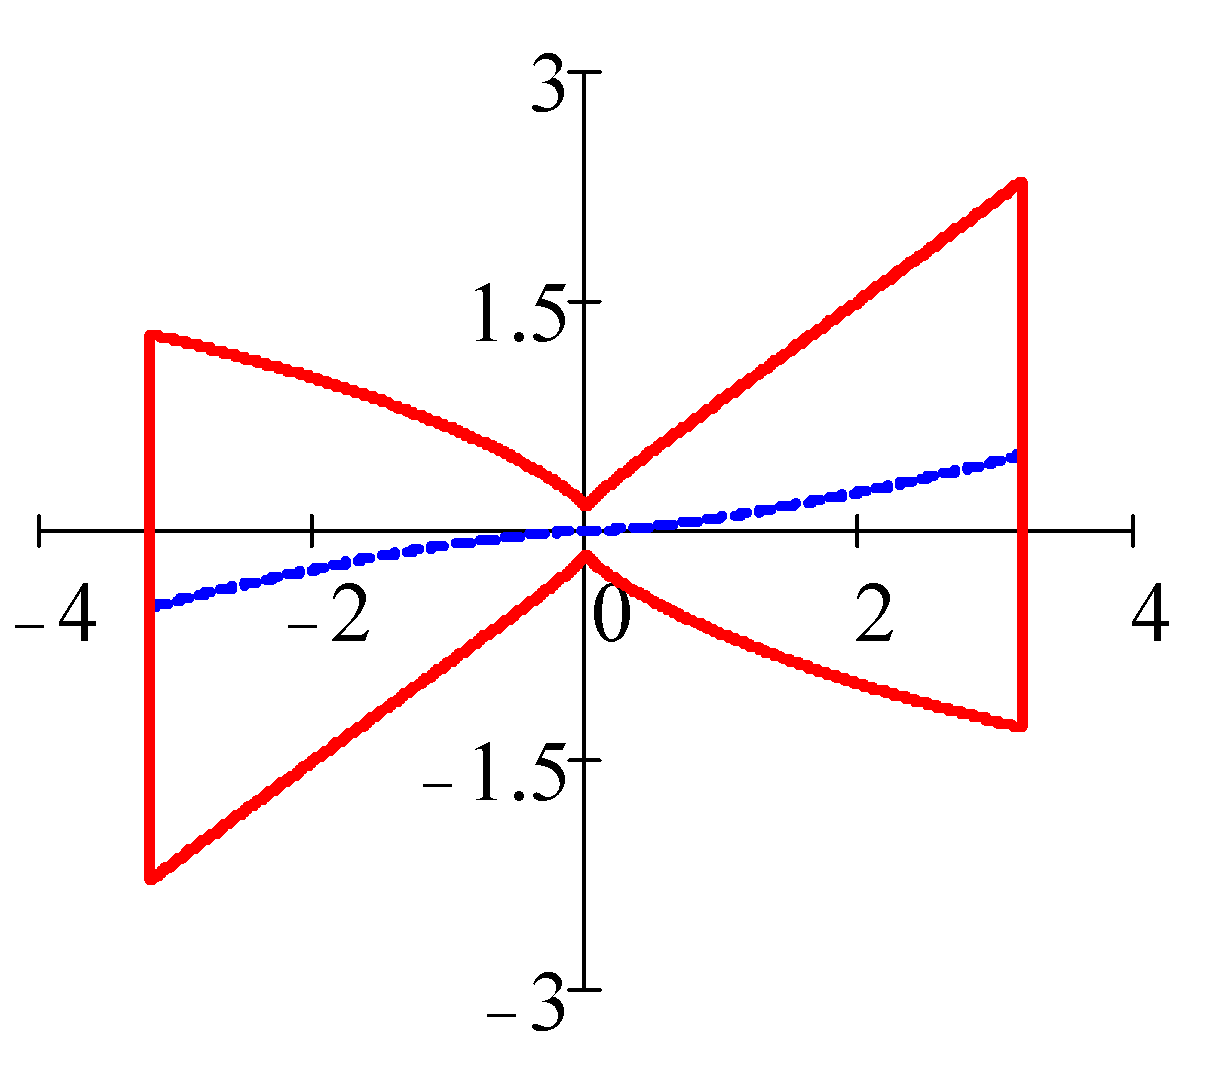
Graphs displayed in
Table 4 show the dependences of the moments of rolling resistance forces with the angle of pendulum deviation within one swing cycle at an amplitude of 3.1 arcsec, constructed according to Equations (1), (3) and (7) and taking into account the values of the parameters obtained by approximating the experimental data for three different materials. It also shows the results of calculating the work of the adhesion forces 4
At (rectangle set off in with dashed lines) and the work of dissipative forces (adhesion to tear off and internal friction) 4
A (the area of the whole figure), calculated for one period or four deviations from the equilibrium position of the pendulum.
6. Conclusions
In the displacement zone where the dimensions are significantly reduced than the dimensions of the contact spot and under elastic loads, the “deep-pre-rolling” (DPR) zone, rolling resistance is determined by:
dissipative adhesion forces, when parts of surface bodies that are in contact, leaves each other; in addition, rolling resistance is determined by the frequency-independent internal friction forces, arising during elastic deformations of contacting bodies.
also, this rolling resistance is determined by the elastic adhesion forces that create negative pressure between the surfaces of the contacting bodies.
In the DPR zone, the spin friction around the vertical axis has a maximum value compared to the swing friction around the horizontal axes. Swing friction around horizontal axes decreases with decreasing swing speed. These friction features allowed us to build a pendulum device based on one ball with a stable swing plane. In this device, the pendulum must have a shape in which the horizontal moments of inertia differ significantly from each other reaching between 25 to 30 as a key condition. Here, the swing of the pendulum with a maximum period has a stable swing plane.
In the DPR zone, there is an effect of a sharp decrease in the swing period of the pendulum with a decrease in the swing amplitude. In this case, the rolling friction also decreases and tends to its minimum final value, determined by the work of adhesion forces on separation. In the study of rolling resistance in the DPR zone, it is necessary to measure not only the reliance of the swing amplitude on the time, but also the reliance of the swing period of the pendulum on time.
The developed phenomenological theory and measurement procedure allowed us for the first time to build a simple instrument for direct measurements with high sensitivity and accuracy of the surface energy density of the adhesion forces (or surface tension) in the case of a solid body, and the parameters of internal frequency-independent friction and the pressure generated by adhesion forces. Key applications are found in precision positioning at a small scale or telescopes at a large scale and also any trials for balancing mechanical devices around a single ball.
Author Contributions
Conceptualization, I.G. and S.M. Methodology, I.G., N.R. and S.M.; validation, I.G., N.R; formal analysis, I.G.; investigation, I.G., N.R. and S.M.; data curation, N.R.; writing—original draft preparation, I.G. and S.M.; writing—review and editing, S.M.; supervision, I.G.; project administration, I.G and S.M. All authors have read and agreed to the published version of the manuscript.
Funding
The research received no external funding.
Data Availability Statement
Research data can be shared through authors of this paper.
Acknowledgments
The authors would like to express their thanks to the support of BNTU and KFUPM through DROC and IRC-IMR center.
Conflicts of Interest
The authors declare no conflict of interest.
References
- Vicente, F.S.; Guillamón, M.P. Use of the fatigue index to study rolling contact wear. Wear 2019, 436–437, 203036. [Google Scholar] [CrossRef]
- Cross, R. Coulomb’s Law for rolling friction. Amer. J. Phys. 2016, 84, 221–230. [Google Scholar] [CrossRef]
- Cherepanov, G.P. The laws of rolling. Phys. Mesomech. 2019, 22, 242–254. [Google Scholar] [CrossRef]
- Popov, V.L. Contact Mechanics and Friction: Physical Principles and Applications; Springer: Berlin/Heidelberg, Germany, 2017; pp. 231–253. [Google Scholar] [CrossRef]
- Bowden, F.P.; Tabor, D. The Friction and Lubrication of Solids; Oxford University Press: New York, NY, USA, 1950; p. 372. [Google Scholar]
- Johnson, K.L. Contact Mechanics; Cambridge University Press: Cambridge, UK, 1987; p. 52. [Google Scholar] [CrossRef]
- Mekid, S. A non-linear model for pre-rolling friction force in precision positioning. Proc. Inst. Mech. Eng. Part J J. Eng. Tribol. 2004, 218, 305–312. [Google Scholar] [CrossRef]
- Tan, X.; Modafe, A.; Ghodssi, R. Measurement and Modeling of Dynamic Rolling Friction in Linear Microball Bearings. J. Dyn. Syst. Meas. Control 2006, 128, 891–898. [Google Scholar] [CrossRef]
- Amthor, A.; Zschaeck, S.; Ament, C. High Precision Position Control Using an Adaptive Friction Compensation Approach. IEEE Trans. Autom. Control 2009, 55, 274–278. [Google Scholar] [CrossRef]
- Benditkis, R.; Necsulescu, D.S. Comments on Rolling Resistance. J. Tribol. 1994, 116, 658–660. [Google Scholar] [CrossRef]
- van Spengen, W.M. MEMS reliability from a failure mechanisms perspective. Microelectron. Reliab. 2003, 43, 1049–1060. [Google Scholar] [CrossRef]
- Mekid, S. Dedicated instruments for nano-engineering education: Integrated nano-manipulation and micro-nanomachining. Int. J. Mech. Eng. Educ. 2019, 49, 60–71. [Google Scholar] [CrossRef]
- Mekid, S.; Bashmal, S. Engineering manipulation at nanoscale: Further functional specifications. J. Eng. Des. Technol. 2019, 17, 572–590. [Google Scholar] [CrossRef]
- Mendeleev, D.I. Opytnoe issledovanie kolebaniya vesov i vozobnovlenie prototipa ili osnovnoj obrazcovoj russkoj mery massy v 1893–1898 gg. (Experimental research: Weight change and the renewal of the prototype or the main exemplary Russian measure of mass in 1893–1898.). L. Gos. Nauch.-Tekhn. Izd-Vo Lenhimsektor 1931, 20, 302. (In Russian) [Google Scholar]
- Herbert, E.G. Some Recent developments in hardness testing. Engineer 1923, 135, 686–687. [Google Scholar]
- Kratkoe rukovodstvo k mayatniku Gerberta dlya ispytaniya tverdosti (Herbert Pendulum Quick Guide for Hardness Testing). Moskva; Mashmetizdat: 1933. 12p. (In Russian)
- Avdeev, B.A.; Mashgiz, M. Ispytatel’nye mashiny i pribory (Testing machines and devices). 1957, 35, 354. (In Russian) [Google Scholar]
- Pod Red, L.K.; Martens, M. Tekhnicheskaya enciklopediya (Technical Encyclopedia). Sov. Enciklopediya 1929, 5, 465. (In Russian) [Google Scholar]
- Halama, R.; Podešva, J.; Suzuki, R.; Matsubara, M.; Čech, R. Mechanics of Herbert Pendulum Hardness Tester and its Application. Key Eng. Mater. 2017, 741, 122–127. [Google Scholar] [CrossRef]
- Matsubara, M.; Sakamoto, K. Improved Herbert Hardness Tester. Exp. Tech. 2011, 36, 73–76. [Google Scholar] [CrossRef]
- Suzuki, R.; Kaburagi, T.; Matsubara, M.; Tashiro, T.; Koyama, T. Hardness Measurement for Metals Using Lightweight Herbert Pendulum Hardness Tester With Cylindrical Indenter. Exp. Tech. 2015, 40, 795–802. [Google Scholar] [CrossRef]
- Suzuki, R.; Kaburagi, T.; Matsubara, M.; Setagawa, T.; Shimizu, R. Effect of test load on damping hardness in Herbert hardness test. In Proceedings of the Ibaraki District Conference, Ibaraki, Japan, 1 January 2016; p. 212. [Google Scholar] [CrossRef]
- Kuznecov, V.D. Fizika tverdogo tela (Solid state physics). Tomsk. Krasn. Znamya 1937, 5, 448–480. (In Russian) [Google Scholar]
- Heins, R.W.; Street, N. An Evaluation of the Rehbinder-Kuznetsov Pendulum Technique In Hardness Measurements. Soc. Pet. Eng. J. 1965, 5, 177–183. [Google Scholar] [CrossRef]
- Pendulum Hardness Tester/Buiged Laboratory Instruments, Biuged, Guangzhou, China 2019, CO.LTD [Electronic Re-source]. Guangzhou, 2019. Mode of Access. Available online: http://www.biuged.com/En_Pr_d_gci_106_id_105.html (accessed on 7 September 2019).
- ISO 1522:2006; Paints and Varnishes—Pendulum Damping Test. 2006.
- Tomlinson, G. CVI.A molecular theory of friction. London, Edinburgh, Dublin Philos. Mag. J. Sci. 1929, 7, 905–939. [Google Scholar] [CrossRef]
- Gilavdary, I.; Mekid, S.; Riznookaya, N. Micro-slippage effects in pre-rolling induced by a disturbed and undisturbed pendulum with spherical supports. Proc. Inst. Mech. Eng. Part J J. Eng. Tribol. 2013, 228, 46–52. [Google Scholar] [CrossRef]
- Gilavdary, I.; Mekid, S.; Riznookaya, N. A new theory on pure pre-rolling resistance through pendulum oscillations. Proc. Inst. Mech. Eng. Part J J. Eng. Tribol. 2012, 227, 618–628. [Google Scholar] [CrossRef]
- Szoszkiewicz, R.; Bhushan, B.; Huey, B.D.; Kulik, A.J.; Gremaud, G. Adhesion hysteresis and friction at nanometer and micrometer lengths. J. Appl. Phys. 2006, 99, 014310. [Google Scholar] [CrossRef]
- MathSoft. In Mathcad 12. User’s Guide; Math-Soft, Inc.: Cambridge, MA, USA, 2004; p. 163.
- Gilavdary, I.; Mekid, S.; Riznoukaya, N. Measurement of extremely low pre-rolling resistance in dry and lubricating conditions. Surf. Topogr. Metrol. Prop. 2020, 8, 035004. [Google Scholar] [CrossRef]
- Borawski, A.; Szpica, D.; Mieczkowski, G. Research on Tribological Features of Brake Friction Materials—Com-parison of the Results Obtained with the Pin-On-Disc and Ball-Cratering Methods. Mechanika 2022, 28, 317–322. [Google Scholar] [CrossRef]
| Disclaimer/Publisher’s Note: The statements, opinions and data contained in all publications are solely those of the individual author(s) and contributor(s) and not of MDPI and/or the editor(s). MDPI and/or the editor(s) disclaim responsibility for any injury to people or property resulting from any ideas, methods, instructions or products referred to in the content. |
© 2023 by the authors. Licensee MDPI, Basel, Switzerland. This article is an open access article distributed under the terms and conditions of the Creative Commons Attribution (CC BY) license (https://creativecommons.org/licenses/by/4.0/).
