Article

Simple Deconvolution Models for Evaluating the True Microhardness of Thin Nanostructured Coatings Deposited via an Advanced Physical Vapor Deposition Technique

1
Institute of Mechanics and Mechanical Engineering, Faculty of Mechanical Engineering, Transport and Aeronautics, Riga Technical University, Kipsala Street 6b, LV-1048 Riga, Latvia
2
Nesta, 58 Victoria Embankment, London EC4Y 0DS, UK
*
Author to whom correspondence should be addressed.
Lubricants 2023, 11(12), 501; https://doi.org/10.3390/lubricants11120501
Submission received: 6 September 2023 / Revised: 8 November 2023 / Accepted: 24 November 2023 / Published: 26 November 2023
(This article belongs to the Special Issue Tribological Behavior of Metal Coatings)

Abstract

:
This article discusses the micromechanical properties and true microhardness determination of nanostructured tribological coatings (NTCs) based on a multilayered alternating nitride/carbonitride bilayer substructure for transition metals. The constituent nitride/carbonitride bilayers in the superlattice structure of the NTC were alloyed with refractory metals, denoted as Me = Me1 or Me2 = Cr, Hf, Nb, W, and Zr. The resulting NTC coatings were deposited onto 100Cr6 steel substrates using an advanced physical vapor deposition (PVD) technique, referred to here as high-power ion-plasma magnetron sputtering (HiPIPMS). The comprising crystalline nanometer-scale TiAlSiMe1-N/TiMe2-CN nanoparticles strengthened by Me additives significantly increased the NTC microhardness to over 3200 HV. The primary focus of this research was to determine the true microhardness of the NTC film samples. The apparent microhardness (Ha) of the film/substrate system for various NTC samples was measured during microindentation testing using the Vickers method. Nine NTC samples were tested, each generating a corresponding microindentation dataset containing between 430 and 640 imprints, depending on the specific NTC sample. These datasets were analyzed using three distinct empirical approaches: (i) the inverse power-law model (IPL-Model), (ii) the sigmoid-like decay model (SLD-Model), and (iii) the error function model (ERF-Model). The observed solid correlation between the proposed models and experiments suggests that the true microhardness estimates (Hf) obtained through the empirical mathematical modeling approach are reliable.

1. Introduction

Nanostructured tribological coatings (NTCs) with hardness levels categorized as hard and superhard, including transition metal nitrides and carbonitrides, have garnered significant attention due to their remarkable attributes, including high hardness, chemical inertness, and superior wear resistance [1,2,3]. Notably, nanocomposite coatings of nitride/carbonitride-type compositions, like Ti-N, TiAlSi-N, Ti-CN, and TiAlSiCr-CN [4], have been developed specifically for enhancing the longevity of steel-cutting tools. Furthermore, the infusion of small proportions of Al and Si constituents into the nanocomposite structure has substantially elevated its tribological and anti-corrosive properties. These enhancements encompass hardness, wear resistance, thermal stability, and resistance to denitrification [5].
It is well known that nanocoatings can be deposited via different methods [6,7]. The fabrication of TiAlSiN nanocomposite films via various physical vapor deposition (PVD) techniques is well documented, leading to variations in coating performance. However, the brittleness often associated with hard ceramic coatings like TiAlSiN, such as amorphous carbon (a-C) and diamond-like coatings (DLC) [8,9], can significantly constrain their practical applicability. Furthermore, pure carbon films, including DLC coatings, tend to display inadequate adhesion to substrates and insufficient toughness for machine components. Consequently, novel modified PVD methodologies [10] are imperative to ensure the functional efficacy of deposited coatings. The toughness of hard ceramic coatings such as TiAlSiN is predominantly influenced by their micro- and nanostructure, which might not achieve the required density due to the presence of micropores and nanovoids that contribute to cracks and delamination phenomena [11,12]. Nanostructured multilayer coatings, founded upon the alternating nitride/nitride and/or nitride/carbonitride bilayer configurations of the transition metals deposited through reactive magnetron sputtering with N2/Ar gas mixtures, have enjoyed sustained interest. This approach enables the creation of coatings with heightened tribological performance and micromechanical properties, surpassing those inherent to equivalent monolayered coatings [11,13,14,15].
A recent innovative approach to further enhance alternating multilayered coatings’ tribological and micromechanical attributes has emerged by integrating new nanocrystalline, nanocomposite, or even amorphous constituent components. This integration is achieved using an advanced physical vapor deposition (PVD) technique known as high-power ion-plasma magnetron sputtering (HiPIPMS) [13,16]. Consequently, the focus of this research was directed towards a modified non-stoichiometric nitride/carbonitride multilayered structure based on a multiplication/bilayer structure, TiMe-CN/TiAlSi-N, where Me represents Hf or Nb. This endeavor presented an innovative solution capable of substantially mitigating or eliminating the well-recognized drawbacks (compressive macro-stresses, inadequate adhesion to steel workpieces, and compromised thermal stability) associated with pure hard carbon- or nitride-based films. Taking into account the promising application potential of the obtained thin nanostructured coatings deposited via this advanced PVD technique, it is essential to evaluate their micromechanical properties, which significantly affect the exploitation of machine components with NTC.
However, determining the micromechanical properties of NTC samples is challenging due to the thin coating thickness. When measuring microhardness at the resolution limit, or nanohardness, the effect of the coating surface texture can be significant. Plichta et al. [17] observed a significant influence of surface texture (RMS 0.5 nm) on near-surface micromechanical properties. Cyclic nanoindentation measurements were performed on a thin film deposited on a silicon wafer substrate, obtaining fluctuations of specific measured values up to 100% compared to the actual nanohardness value. In analyzing Cu/Ni multilayer structures, Kulej et al. [18] found that the results of nanohardness measurements are related to the surface texture; that is, a smoother surface provides a higher nanohardness. In the case of microindentation, in order to obtain qualitative hardness measurements, the quality requirements of the surface texture are not as high as in the case of nanoindentation. Furthermore, the availability of nanoindenters to researchers can be limited and expensive, so there is the potential to use microindentation and calculate the true microhardness of the coating using mathematical models [19,20,21].
It is essential to emphasize that, presently, there is no available analytical solution for modeling the indentation behavior exhibited by such a sandwiched system comprising a pointed indenter, a film, and a substrate. The intricate interplay of various factors and the absence of a straightforward analytical framework make this a challenging area of study.
In this context, it is noteworthy to mention various the mathematical models that have been proposed by different researchers. These models include those developed by Doerner et al. [22], King et al. [23], J.R. Tuck et al. [24], and Saha et al. [25]. Other researchers, such as Mencik et al. [26], have contributed to the development of deconvolution models for determining the true hardness of thin films deposited on bulk substrates. Deconvolution models, such as those proposed by the mentioned researchers, aim to estimate the true mechanical properties (e.g., elastic modulus and hardness) of the deposited nanostructured thin films by “deconvolving” the measured apparent properties. These models are based, in general, on assumptions and simplifications that may not fully capture the complexity of the problem. One notable limitation is that the authors often do not thoroughly discuss the confidence limits or uncertainties associated with the asymptotic values calculated by these models. This lack of consideration for the margins of error can undermine the reliability of the results. The challenges associated with modeling and analyzing the mechanical response of thin film/substrate systems under indentation, particularly at shallow indentation depths, are indeed complex and have been the subject of extensive research [19,21].
This article aimed to assess the micromechanical characteristics of nanostructured nitride/carbonitride coatings consisting of transition metals alloyed with refractory metals such as Me = Cr, Hf, Nb, W, and Zr. Various deconvolution models were refined, and three mathematically different types of models were proposed to enhance their robustness with respect to the microindentation testing experiments using the Vickers method. This modeling process leveraged three distinct empirical mathematical models: (i) the inverse power-law model (IPL-Model), (ii) the sigmoid-like decay model (SLD-Model), and (iii) the error function model (ERF-Model). Each model demonstrates a distinctive sigmoidal behavior, characterized by two discernible asymptotic domains interconnected by an intermediate transitional region. Knowing that the mechanical characterization of thin film–substrate systems via indentation is a complex problem, especially at shallow depths, special attention was paid to the robustness of the proposed deconvolution models and the application of them to the apparent microhardness data of the NTC film samples, As were the limitations and uncertainties associated with modeling and interpreting data in this context, particularly when dealing with shallow indentation depths where surface effects are prominent.

2. Materials and Methods

2.1. Preparation of the NTC Samples

Thin-film coatings were successfully deposited onto 100Cr6-bearing steel substrates (30 mm × 4 mm disc) using the advanced physical vapor deposition (PVD) technique referred to here as the high-power ion-plasma magnetron sputtering (HiPIPMS) method. This method was employed within the thin-film modular deposition system (TF-MDS) [15,27]. In this context, HiPIPMS refers to a specific advanced PVD technique capable of achieving a discharge power density exceeding 60 W/cm2 within the erosion zone of the magnetron sputtering target (MST), which is a crucial factor for the equal sputtering rate of different materials like transition metals, which have different sputtering yields during PVD processes [10].
Magnetron sputtering devices (MSDs) employed in the HiPIPMS deposition processes were equipped with MST without a backing plate, in contrast to the conventional DC PVD method using MST with a backing plate in combination with insufficiently intense bubbling water cooling with a comparably low flow rate underneath the backing plate. It is important to note that there is no concealed technique for surpassing the 60 W/cm2 threshold for the discharge power of magnetron sputtering devices (MSDs). In contrast to conventional PVD methods, HiPIPMS deposition systems feature magnetically intense MSDs (with a magnetic B-field strength exceeding 800 mT) equipped with MSTs devoid of backing plates. This process was complemented by highly efficient bubble-free water cooling with a high flow rate directly beneath the MST copper membrane. The water pressure for direct cooling of the MSTs was maintained during the PVD process at approximately 4–5 bars at the inlet of the MSDs.
The principal technological parameters governing the HiPIPMS-PVD process concerning MST sputtering and NTC growth encompass the following: (i) Base pressure in the vacuum chamber before the PVD process, pb = 0.131 mPa; (ii) Total operating gas pressure of the sputter gas mixture (Ar/N2), psg = 0.32 Pa; and (iii) Partial gas flow rate, qgN2 = 11.9 L/h, (iv) before film deposition, substrate heating, and in situ sputter cleaning were performed using a collimated linear ion beam etching at 1750 V × 135 mA; (v) The distance between the MSD and substrate L = 78 mm; (vi) The substrate temperature during the PVD deposition process was kept at 350 °C; and (vii) The electrical discharge power regime of the MSDs was varied within (640–680) V × (7.5–10.5) A depending on the sputter gas mixture ratio, the design and configuration of the MSTs, and their total working surface. The DC discharge power density of the operating MSDs exceeded the 60 W/cm2 threshold value needed for the equal-rate sputtering conditions of the mosaic-type sputtering targets; (viii) The NTC film sample deposition rate at 2D rotation was kept at 180 nm/min, and (ix) the negative bias voltage during the deposition process was maintained at 90 V, causing a bias current of about 320–480 mA depending on the sputter discharge power. Collectively, these parameters were carefully controlled to enable the precise execution of the HiPIPMS-PVD process, facilitating the sputtering of MSTs and the growth of NTCs with the targeted properties.

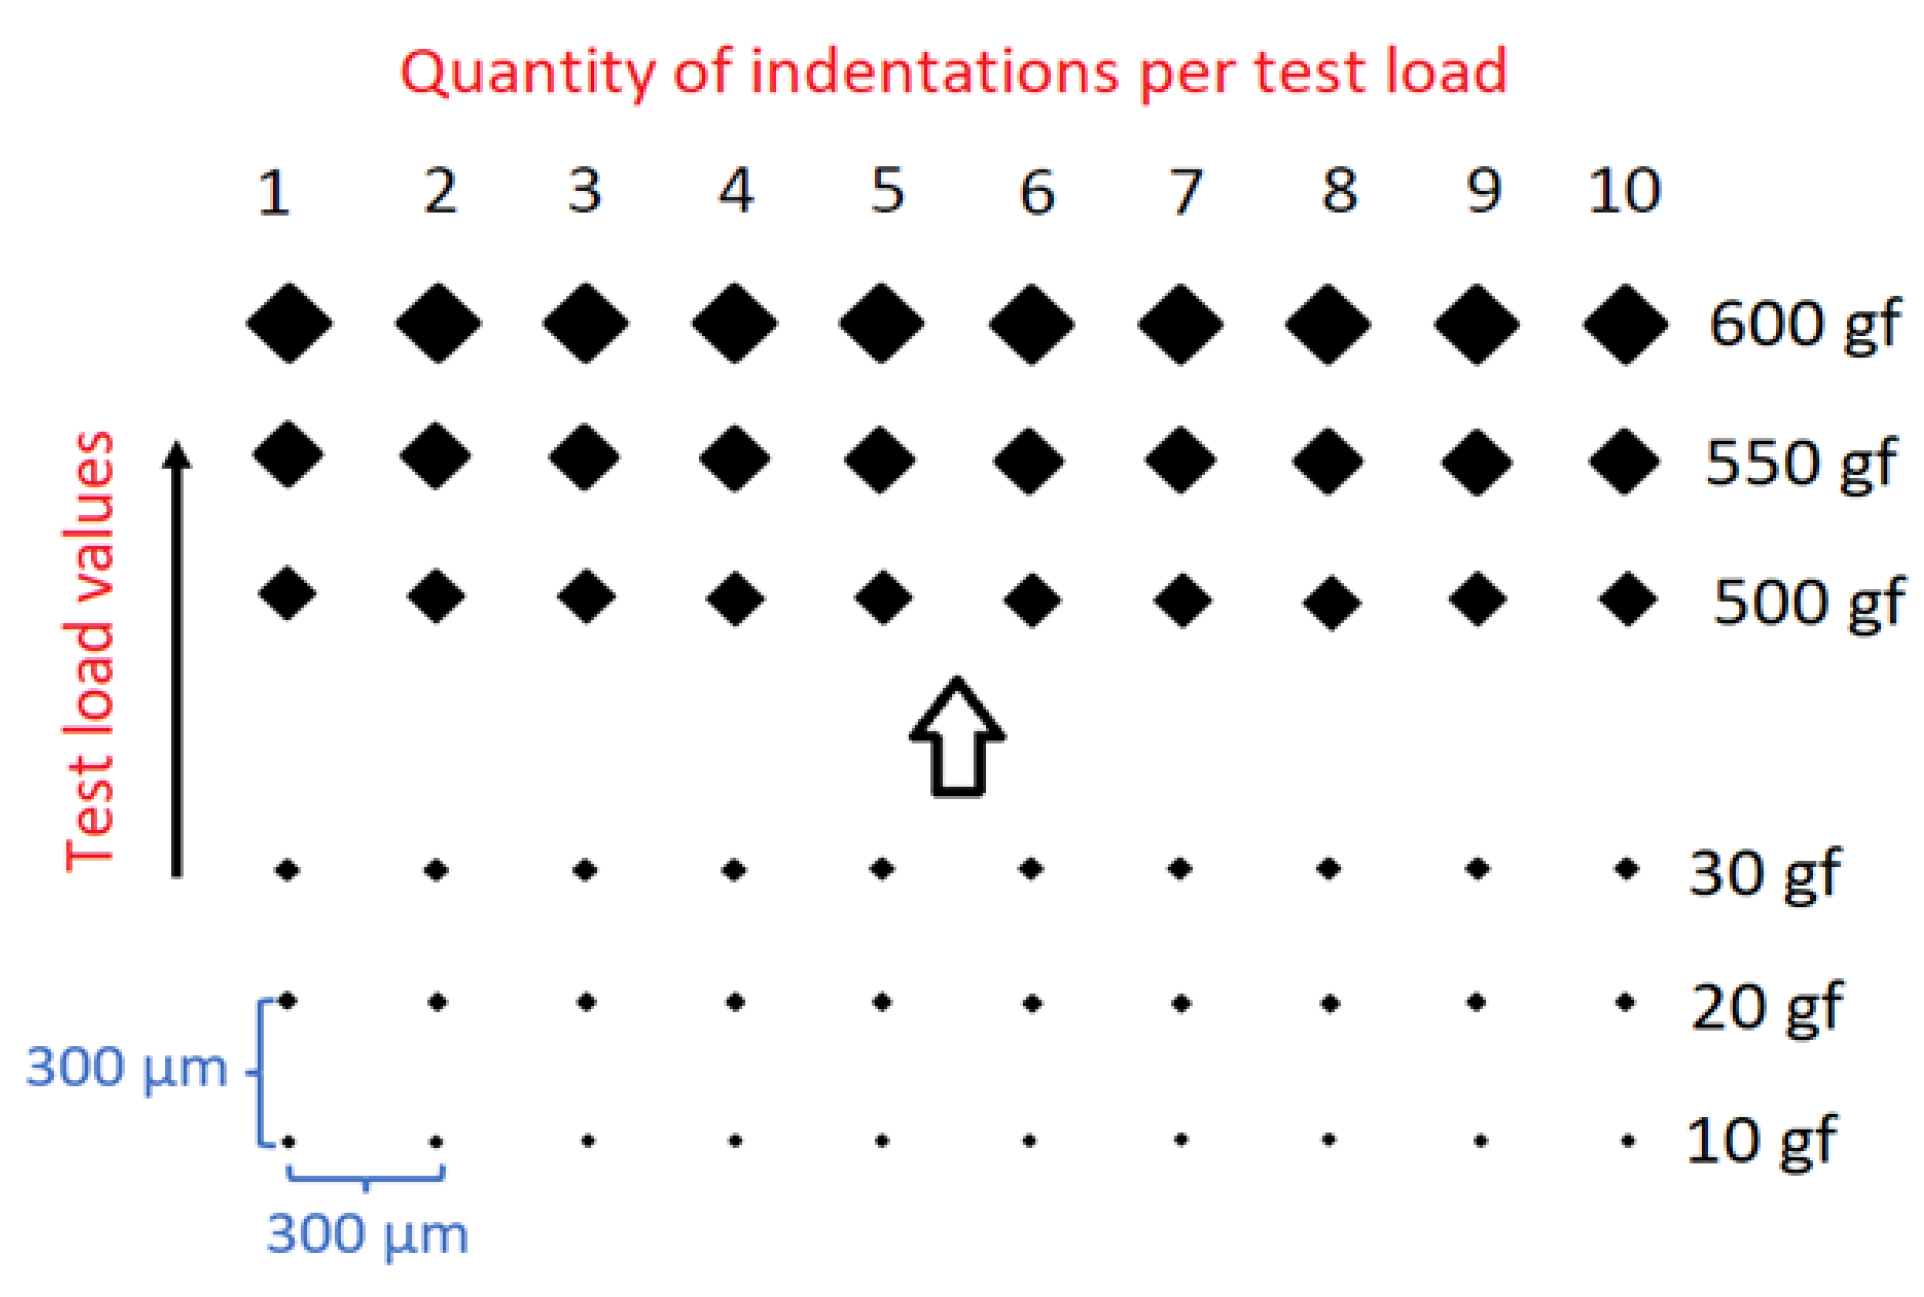
2.2. Microindentation Hardness Testing Experiment

Microindentation hardness tests yielded comprehensive insights into the amalgamated hardness of the coating, encompassing both the coating itself and the substrate. micro-Vickers hardness tests were conducted on NTC samples using the HM-210D micro-hardness testing machine (Mitutoyo, Kawasaki, Japan), adhering to ISO 6507-2:2018 standard [28] (Metallic materials—Vickers hardness test—Part 2: Verification and calibration of testing machines). The experimental setup featured a motor-controlled XY sample stage in conjunction with AVPAK-20 V3.0 software, facilitating the establishment of a systematic test matrix. Indentations were spaced 300 µm apart in the XY directions on the sample surface. A range of not less than twenty distinct indentation loads, spanning from 10 gf to 700 gf (0.10 N to 6.88 N), was employed. For enhanced statistical accuracy, ten indentations were conducted for each test load. The configuration of the test matrix is illustrated in Figure 1.
A load increment of 10 gf was adopted within the load range of 10 gf to 100 gf, while a load step of 50 gf was employed for the load range of 100 gf to 700 gf. All the pyramidal indentations were observed through a 100× magnification lens, which was the highest possible resolution of the used device.
The rigorous implementation of the International System of Units (SI) in Vickers microhardness testing experiments results in hardness values expressed not in conventional kgf/mm2 units but in GPa units. These GPa units, although accurate, may not be intuitively interpretable for most engineers and technicians. As ASTM guidelines recommended, a “soft” metric approach in alignment with the Vickers hardness testing experiment was adopted. This approach facilitates an ease of comprehension and enhances the practical utility of the hardness measurements within the engineering and technical community.

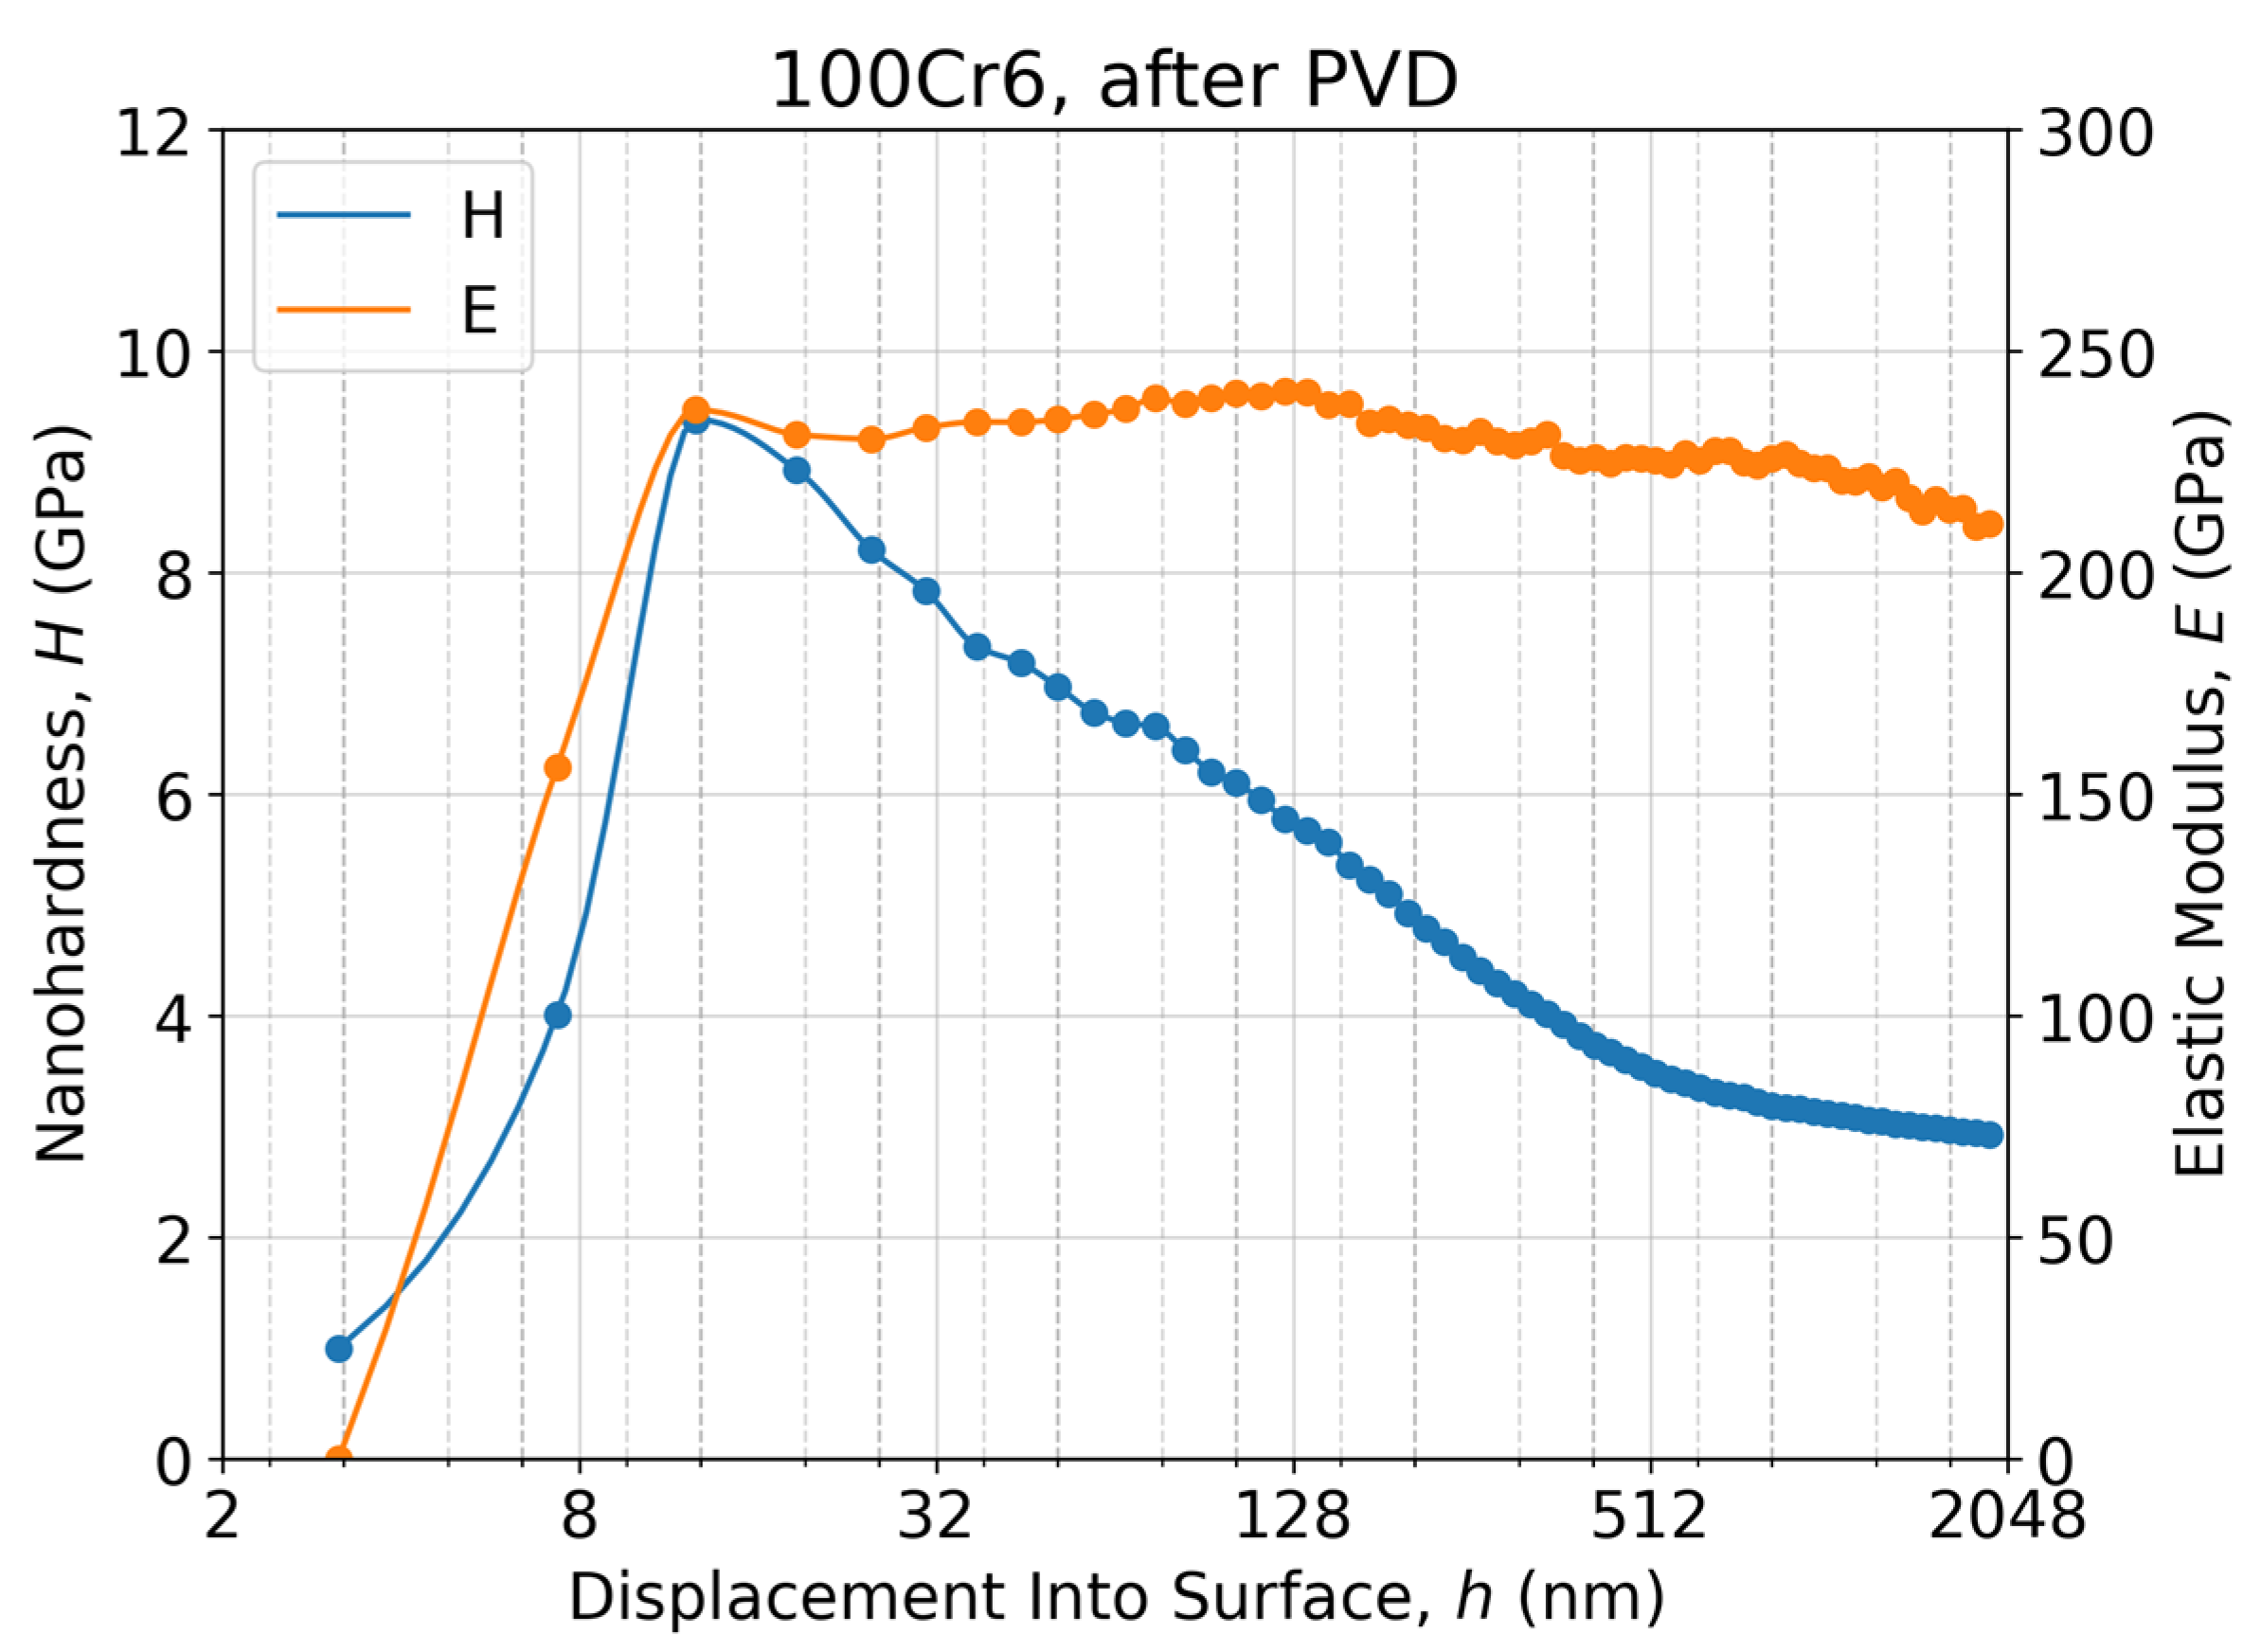
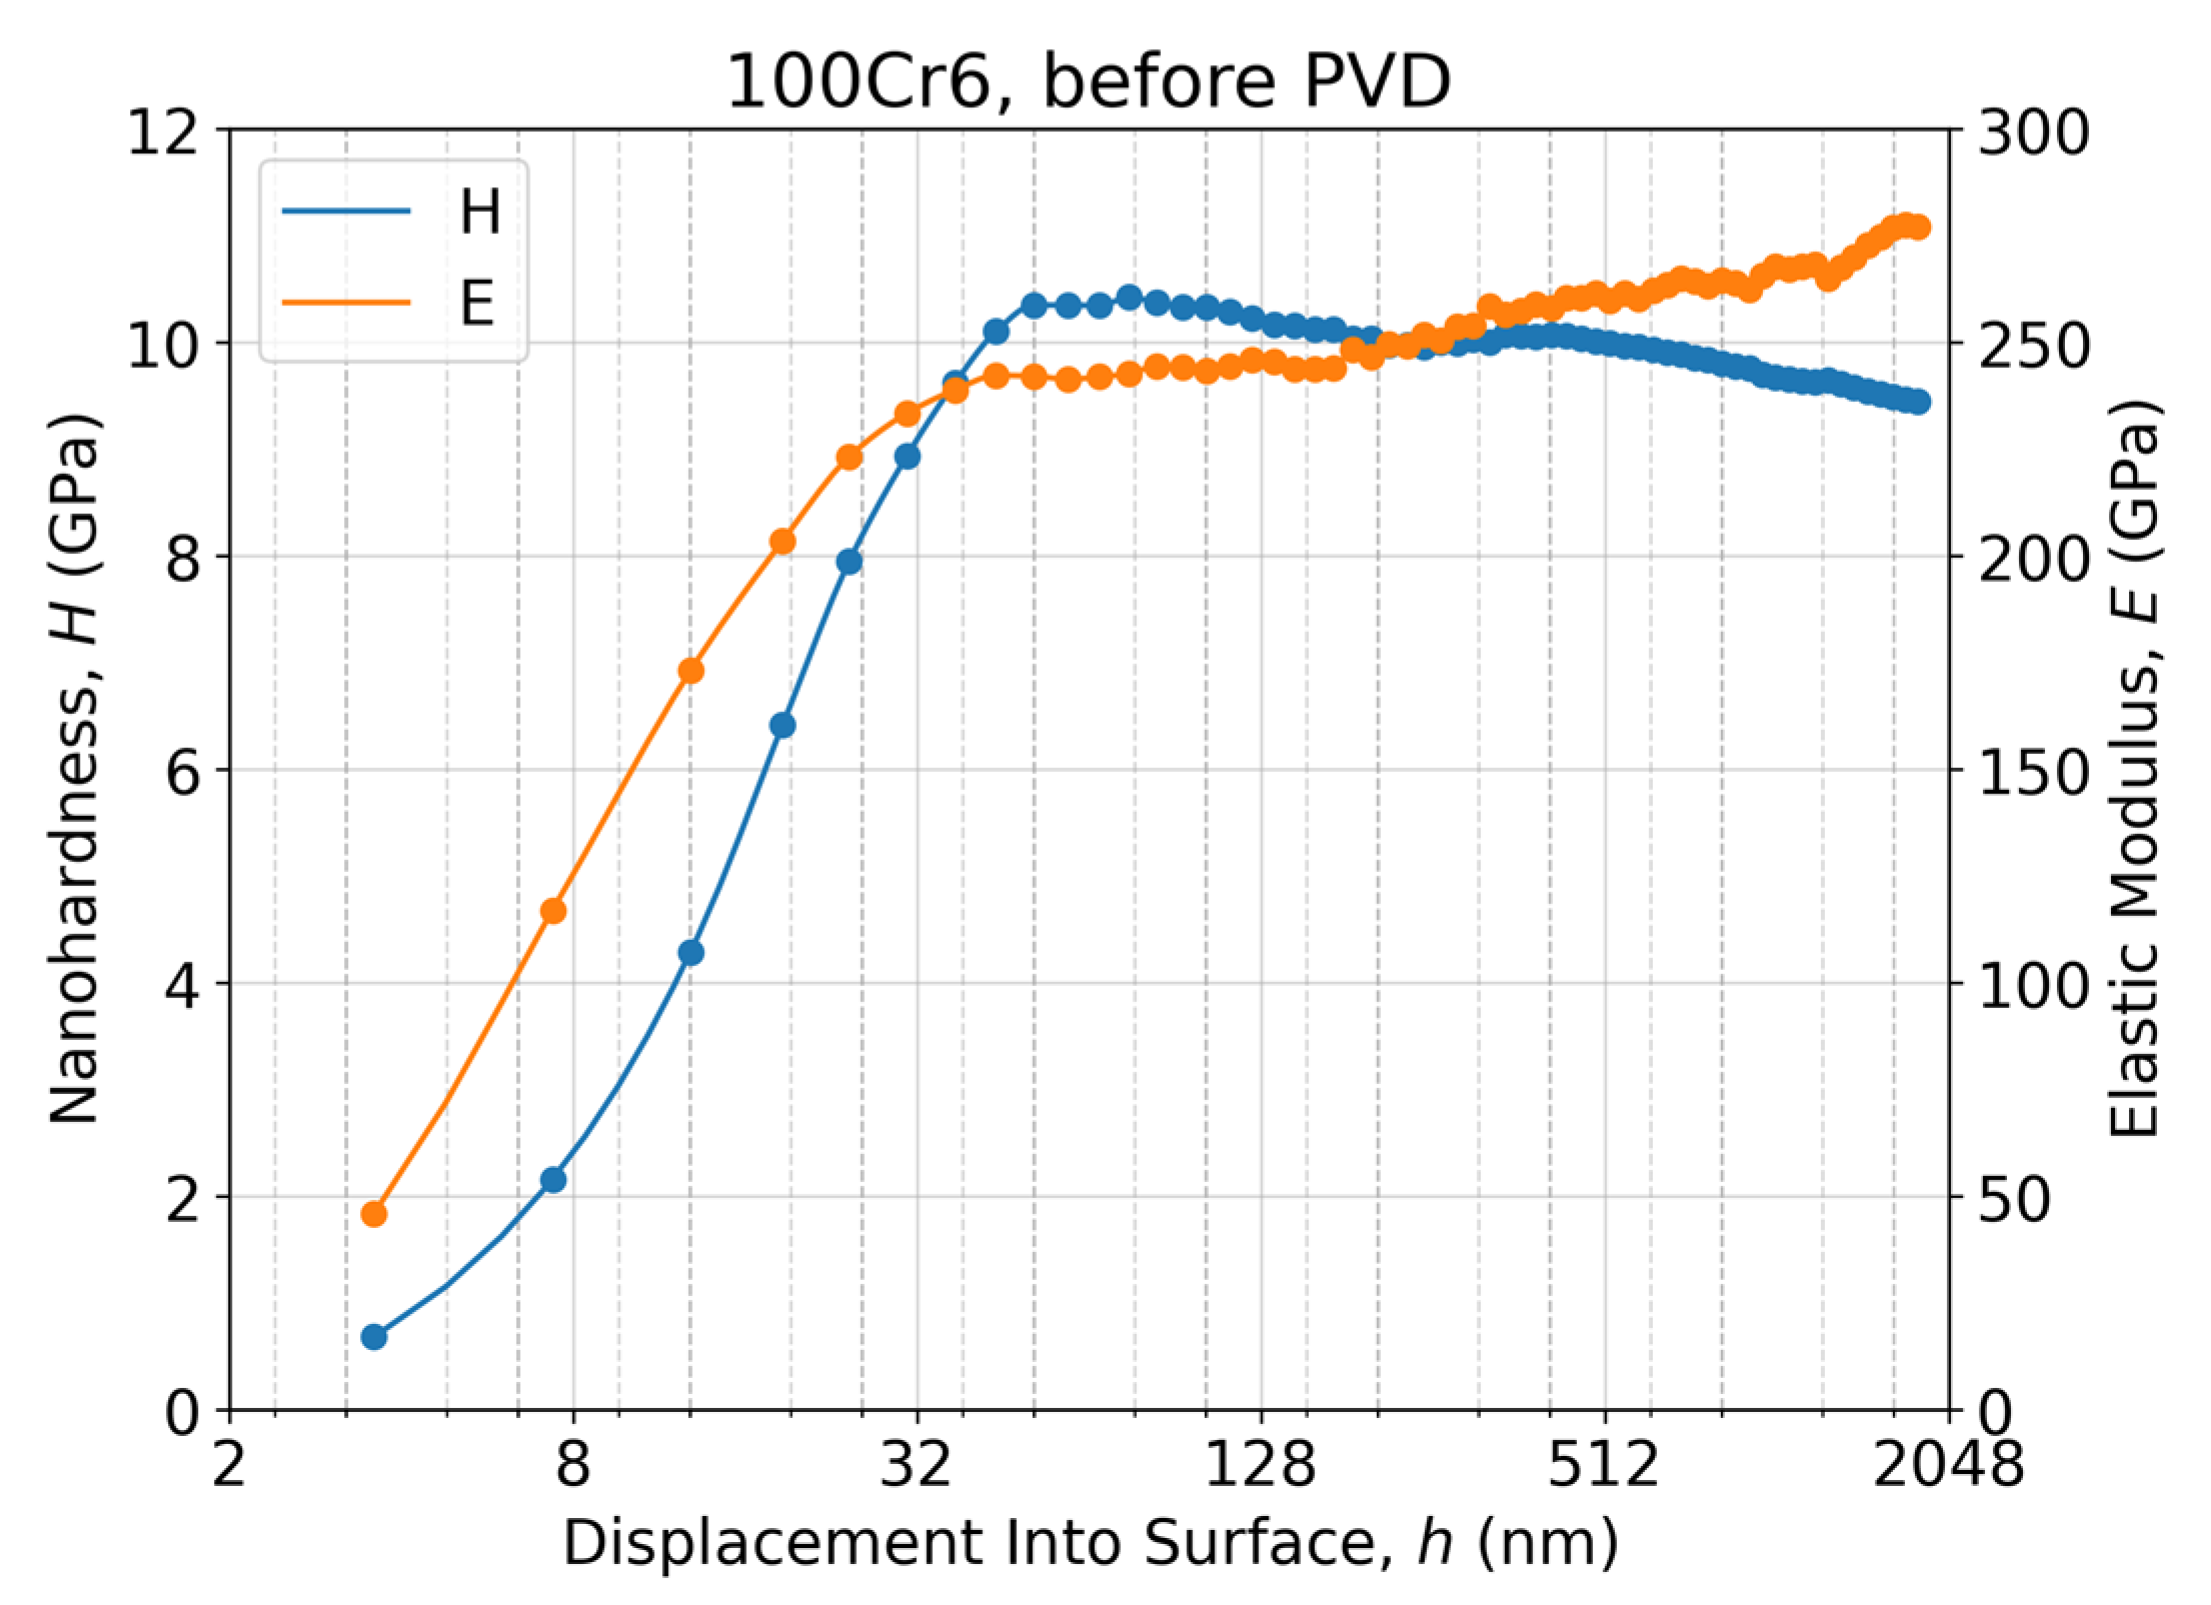
2.3. Nanoindentation Hardness Testing Experiment

Instrumented depth-sensing nanoindentation experiments were conducted using a G200 Nano Indenter (Agilent, Santa Clara, California, USA) equipped with a sharp Berkovich diamond indenter featuring a tip radius of approximately 20 nm. These experiments employed the continuous stiffness measurement (CSM) technique. The Nano Indenter G200 has a load capacity of up to 600 mN with the standard option. An optical microscope was employed to select the indentation test site on the sample surface. The CSM technique allowed for the continuous measurement of harmonic contact stiffness as a function of depth, enabling the calculation of mechanical properties with respect to displacement, denoted as ‘h’.
During the nanoindentation measurements, a depth-controlled approach was employed, maintaining a constant logarithmic indentation strain rate, (dh/dt)/h, at a level of 0.05 s⁻1. Additionally, a superimposed, harmonically oscillating force frequency of 45 Hz was applied. Before conducting the nanoindentation experiments, the G200 tester was calibrated using a reference sample of fused silica. Subsequently, the load–displacement measurements, elastic modulus, hardness, and standard deviations were calculated based on experimentally obtained loading–unloading datasets. These calculations were performed using the well-established Oliver–Pharr method [29] and facilitated by MTS TestWorks V4.1 software.

2.4. Empirical Mathematical Models Applied for The Calculation of the Apparent Microhardness, Ha(h)

The microindentation hardness measurements were subjected to modeling the apparent microhardness, Ha(h), of the NTC samples using three distinct empirical approaches: (i) the inverse power-law model (IPL-Model), (ii) the sigmoid-like decay model (SLD-Model), and (iii) the error function model (ERF-Model). Each model exhibits a characteristic sigmoidal behavior characterized by two distinct asymptotic domains bridged by an intermediary transitional regime. This pattern effectively encapsulates the micromechanical properties of the hard-film/soft-substrate system or vice versa. During the indentation process, underneath the loaded indenter, a transition occurs from the film surface layer (the upper asymptotic value or “true” hardness of the film) to the underlying substrate bulk volume (the lower asymptotic value or “true” hardness of the substrate). These models are relevant in empirically approximating the indentation measurement data relating to the film-dominated region at shallow indentation depths, the film/substrate-governed transitional region at modest indentation depths, and the substrate-dominated region at large indentation depths. These models were optimized with best-fit parameters, which were subsequently leveraged to extrapolate and estimate the true hardness, Hf = Ha(h => 0), of the NTC at its surface when h => 0. The utilization of multiple models facilitated an assessment of the robustness of the true hardness estimates. A strong concurrence among the different models would indicate a heightened level of reliability in the estimated values. Thus, the IPL-Model was defined as follows:
H a h = H s + H f H s 1 + h c k
where Ha(h) is the apparent hardness of the film/substrate system as a 4-parameter (4P) function of the indentation depth, h. Parameters Hf and Hs control the upper (i.e., the film surface) and lower (i.e., the bulk substrate) asymptotic hardness levels of the empirical film/substrate model. Furthermore, the parameter “c” controls the inflection point of the model curve regarding the upper and lower asymptotic domains with respect to the transition region of the film/substrate system, while the parameter “k” is related to the steepness of the model curve, “k” value is the slope at the point “h = c”.
The SLD-Model was formulated as:
H a h = H s + H f H s 1 + e k h c
where the variables and parameters have an analogous interpretation as to the IPL-model. Finally, the ERF-Model was defined as:
H a h = H f + H s 2 H f H s 2 e r f k h c
where “erf” denotes the Gauss error function, and the variables and parameters have the same interpretation as for the IPL-Model and SLD-Model. These three empirical models were fitted to each dataset of the NTC samples measured during the microhardness testing experiments. Each point {Hai; hi} of the apparent microhardness, Hai, at the indentation depth, hi, was calculated as an averaged value of 20–40 imprints, depending on the test load and sample surface roughness, RMS-value, to obtain safe and reliable experimental data. The smaller the test load, P, the more indentations needed to be made. The total number of indentations exceeded 600 Vickers pyramidal imprints, d = (d1 + d2)/2, per sample. Special attention was paid to outliers, which were discarded so as not to affect the apparent hardness’s mean values. The fitting was conducted using the non-linear least squares method implemented by the Python scientific computing library SciPy [30]. The non-linear least squares method minimizes the squared residuals to obtain optimal parameters for each model. To ensure convergence during the optimization, reasonable initial parameter guesses were provided for each model.

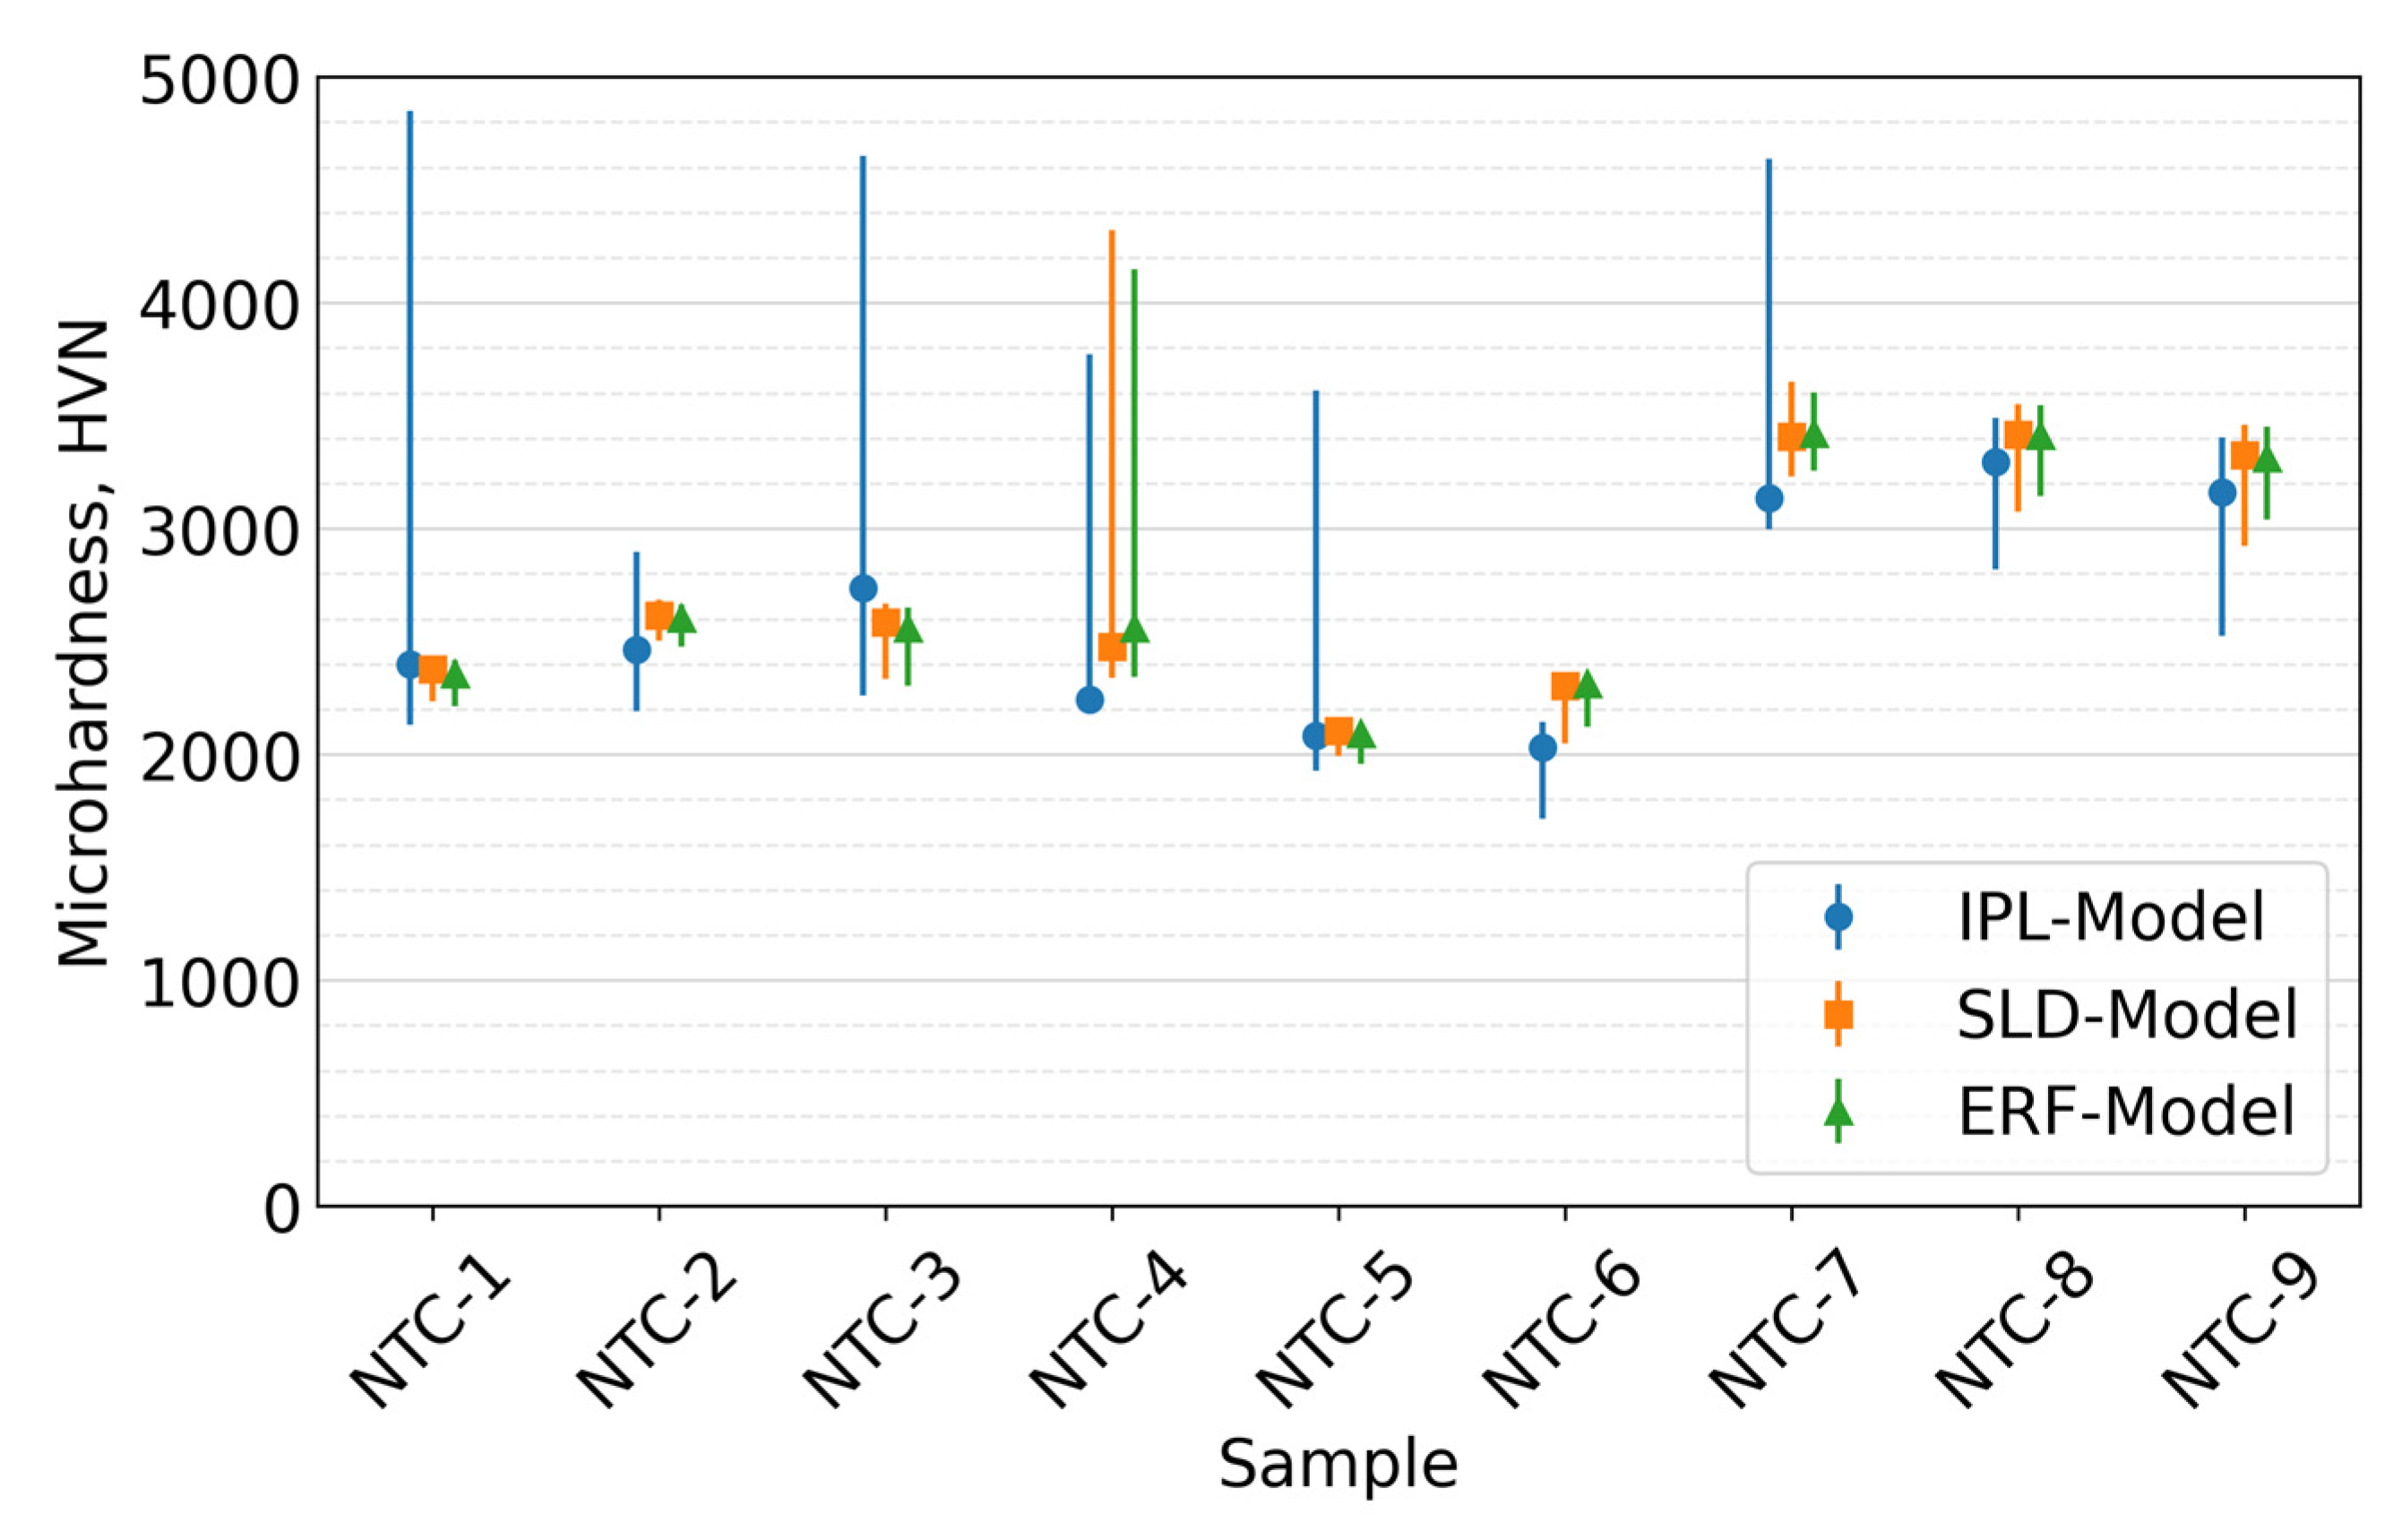
2.5. Determination of the Robustness of the Predicted True Hardness, Hf, of the Coated Film

A bootstrapping resampling technique was deployed to determine the robust estimates of the coated film’s predicted true hardness, Hf, values at its surface Ha (h = 0) [31]. This is a well-established approach for determining confidence intervals of modeling estimates, whereby the measurement data are repeatedly sampled with replacement, and the resampled datasets are fitted via the empirical models discussed above. Given each empirical mathematical model described in Section 2.4 n = 1000 resampled datasets for each measured and averaged dataset obtained during the microindentation testing experiment were created.
Choosing appropriate initial guesses for the parameters helped guide the optimization algorithm toward meaningful solutions. It was essential to start with reasonable estimates of the Hf/Hs-values based on our previous knowledge of the NTC samples. The same goes for the two other parameters, the “c” and “k” values—our prior knowledge about the behavior of the materials under indentation was used and some preliminary analysis was performed. That way, the best-fit parameters were found for each resampled dataset. The best-fit parameters were then used to estimate the true hardness at the film surface Hf = Ha (h = 0). The predicted true hardness of each empirical model, Hf, was then determined using the median (50th percentile) estimate of Ha (h = 0) across all n resampled datasets of a given hardness measurement; the 95% confidence interval was estimated using the 2.5th (Hf 2.5) and 97.5th (Hf 97.5) percentiles.

3. Results and Discussion

3.1. Preparation and Characterization of the NTC Film Samples

During the deposition of the NTCs via the reactive HiPIPMS process, enhancements were made to the constituent structure of the nitride/carbonitride bilayer {TiAlSi-Me1N/TiMe2-CN} through the incorporation of refractory metals Me1, Me2 = Cr, Hf, Nb, W, and Zr as alloying agents. This augmentation aimed to strengthen the NTC’s core nitride/carbonitride bilayer architecture. Bespoke mosaic-type magnetron sputtering targets (MSTs) were crafted to facilitate the implementation of these bilayer structures. These MSTs featured integrated Me1, Me2 = Cr, Hf, Nb, W, and Zr inserts positioned within the annular erosion zone of the circular planar MSTs.
However, in this article, the primary focus was to determine the true (intrinsic) hardness, Hf, of the NTCs, thus the information about other coatings’ characteristics can be found in Leitans et al.’s work [16]. Microindentation testing experiments using the Vickers method to measure various NTC samples’ apparent hardness, Ha, were conducted. These measurements were a basis for acquiring the experimental datasets for calculating the true hardness, Hf, for nine NTC samples (Table 1). Three distinct four-parameter sigmoidal empirical mathematical models were used to fit the apparent hardness curve related to the film/substrate system’s transition region. These models were instrumental in extracting the true hardness of the film from experimentally measured datasets {Hai; hi}. Through these methodologies, we aimed to gain a comprehensive understanding of the true hardness of the NTCs based on a simple mechanical model of the elastic–plastic deformation processes grounded in Hertzian elastic contact theory [32].
The thicknesses of the NTC samples differed due to the distinct sputtering rates resulting from the specific combinations of mosaic-type MSTs for each HiPIPMS process, consequently, for each NTC sample, alongside the variation in deposition process durations, there were factors that were not precisely harmonized. The typical thickness range of 1000–6000 nm provides sample scope for the comprehensive mechanical investigations of the coatings. Consequently, despite the diversity in coating thicknesses, the mechanical properties of the NTC samples are unequivocally comparable.

3.2. Micromechanical Properties of the NTC Film Samples

The NTC film samples alloyed with the refractory metals Me = Cr, Hf, Nb, W, and Zr were deposited onto 100Cr6-bearing steel substrates exhibiting varying microhardness values. As usual, all substrates were subjected to the HRC test before and after the PVD process, since the substrates were thermally treated in a vacuum chamber before the deposition process. This means that the samples were heated up to a temperature of 350 °C, and this temperature was maintained during the whole film deposition process for about 1–2 h, depending on the specific film’s thickness. The 100Cr6 steel substrates used in our experiments usually exhibited a Rockwell hardness on the HRC scale as high as 54–59 units. This HRC value does not practically differ before and after the deposition process.
In contrast, the Rockwell hardness for three NTC samples NTC-4, NTC-8, and NTC-9, after being deposited, was reduced to below 20 HRC, while before the deposition, it was 57 HRC. The substrates with hardness values lower than 20 HRC indicated the occurrence of substrate annealing during the NTC deposition process. This substrate annealing occurred when operating the magnetrons at a high discharge power of approximately 2.7–3.0 kW. As, throughout the PVD deposition process the substrate temperature was maintained at 350 °C, which is significantly below the critical tempering temperature of about 500 °C for bearing steel’s annealing threshold, this should not have happened. It was inferred that the thermal stability of the substrates regarding the samples NTC-4, NTC-8, and NTC-9 was inadequate to withstand the highly intensive thermal interaction induced through magnetron ion-plasma processes.
In this context, a nanoindentation testing experiment was conducted on the NTC-4 sample substrate after the PVD process (Figure 2) and compared with one measured for the reference 100Cr6 steel substrates, as prepared for the PVD processes (Figure 3). The occurrence of substrate annealing during the PVD process provided an opportunity to investigate how substrate hardness impacts the micromechanical properties of the coatings. Considering the HRC test results and the nanoindentation testing experiments conducted before and after the PVD processes, it was concluded that the whole sample set, a total of nine samples, could be divided into two categories depending on the actual substrate microhardness, despite the different alloying additives, Me = Cr, Hf, Nb, W, and Zr. Thus, the first sample set, containing six samples, NTC-1, NTC-2, NTC-3, NTC-5, NTC-6, and NTC-7, represents the ‘hard-coatings’ on the ‘hard-substrates’ with a hardness of about 8–9 GPa or 850 HV (Figure 4). The other sample set includes three samples, NTC-4, NTC-8, and NTC-9, representing the ‘hard-coatings’ on the ‘soft-substrates’ with a hardness of about 3 GPa or 300 HV (Figure 5). As a reference point, a substrate with a hardness of 57 ± 2 HRC was utilized for comparing the tribological and micromechanical characteristics of the NTC samples.

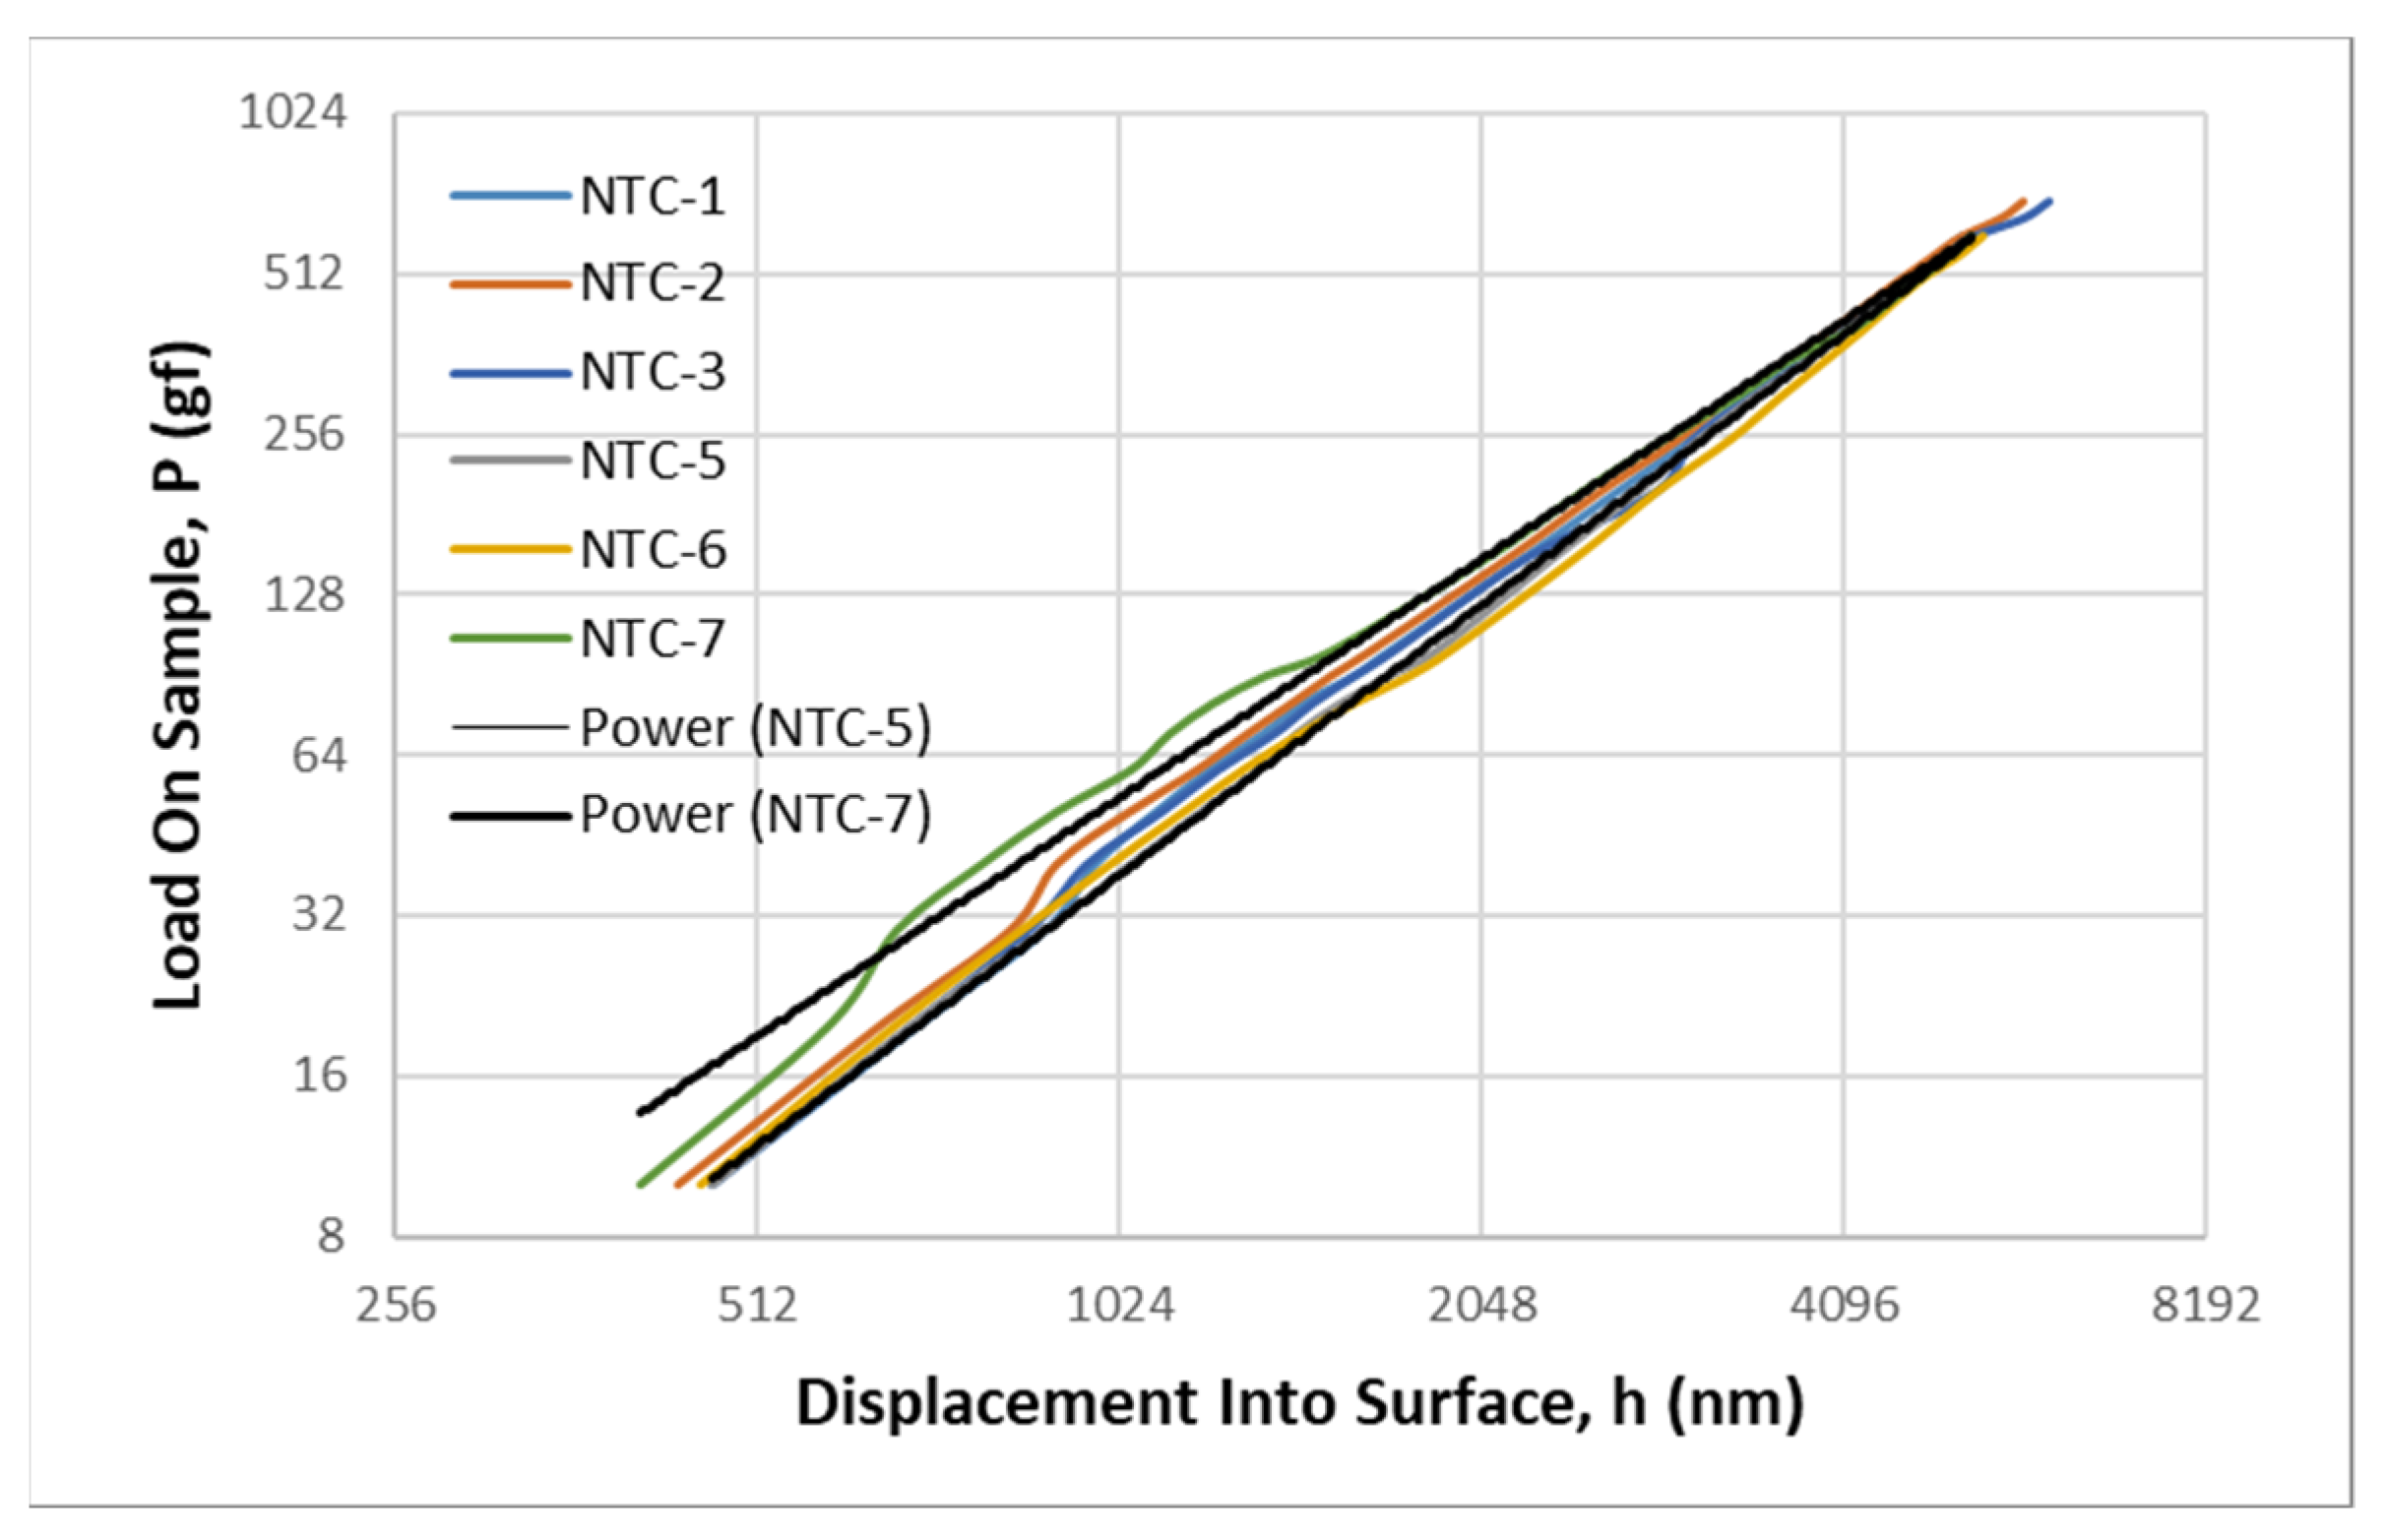
3.2.1. Microindentation Response Analysis Using the Load–Displacement Curves

The collection of the load–displacement, P–h, curves generally exhibited a close adherence to Meyer’s law, characterized by the power-law relationship P = C × hn (Figure 4 and Figure 5). Here, n represents a constant exponent referred to as Meyer’s index, and C is a constant amplitude dependent on the elastic–plastic properties of the coating and, to some extent, on the indenter geometry. The constant “C” represents the proportionality factor between the applied load and the indentation depth, raised to the power of “n”. It can be thought of as the “hardness coefficient” in the power-law relationship. This coefficient indicates the inherent hardness behavior of the material being tested. Each NTC sample’s load–displacement, P–h, curve represents averaged datasets from nine microhardness testing experiment series containing 430–640 imprints, depending on the specific NTC sample. While point markers and error bars have been omitted for clarity, it is essential to note that the relative standard deviation for the resulting curves typically fell within the range of 6–29%. This deviation tended to increase at lower loads and shallower penetration depths.
The load–displacement, P–h, curves are presented in a log–log scale plot to facilitate a more comprehensive assessment of the power-law relationship. It can be observed that Meyer’s index (n) for the NTC-1, NTC-2, NTC-3, NTC-5, NTC-6, and NTC-7 samples deposited onto the hard-annealed-bearing 100Cr6 steel substrates has the values of 1.6665, 1.6198, 1.6341, 1.6851, 1.6294, and 1.4861, respectively (Figure 4). In turn, the NSC-4, NSC-8, and NSC-9 samples deposited onto soft-annealed-bearing steel substrates have the values of 1.3115, 0.9228, and 0.9919, respectively (Figure 5). These n values are considerably lower than those exhibited by the ‘hard-coatings’ on the ‘hard-substrates’ shown in Figure 4. For both sample sets deposited on the hard and soft 100Cr6 steel substrates, the corresponding collections of their load–displacement, P-h, curves are contained within the upper and lower trendlines of the curves with higher and lower Meyer’s index (n) values within the relevant sample set. All the load–displacement, P-h, curves of the hard substrate sample set are significantly steeper than those of the soft substrate sample set. Additionally, it is worth noting that the highest Meyer’s index (n) of neither the soft substrate sample set (nmax = 1.3115) nor the hard substrate sample set (nmax = 1.6851) is lower than that of the 100Cr6 steel substrate without any coating, which displays a steeper load–displacement (P-h) curve with an n value of 1.7617. For bulk materials, such as steel, silicon, sapphire, and glass substrates, Meyer’s index is a valuable indicator of the indentation size effect (ISE). When the exponent n is less than 2, it signifies normal ISE behavior. Conversely, when n exceeds 2, it indicates the presence of reverse ISE behavior. At n = 2, ISE is absent for the given material and the applied indentation depths. The range of “n” values observed between 0.9228 and 1.6851 indicates a significant influence of these size-dependent effects. The fact that “n” is less than 2 is in contrast to what is typically observed in bulk materials, where “n” is close to 2 due to the expected quadratic relationship between the projected contact area, A(h), and the indentation depth h [34,35]. This suggests that the film/substrate system’s mechanical behavior is influenced by nanoscale or microscale effects that deviate from classical bulk material behavior.
In summary, the constants “C” and “n” in the power-law hardness relationship provide insights into the material’s inherent hardness and its size-dependent mechanical behavior. The deviation of “n” from 2 suggests the presence of non-classical effects that need to be considered when interpreting the mechanical properties of the film/substrate system. It is important to approach their interpretation with an understanding of strain gradient plasticity, microstructure, and nanoscale material behavior.

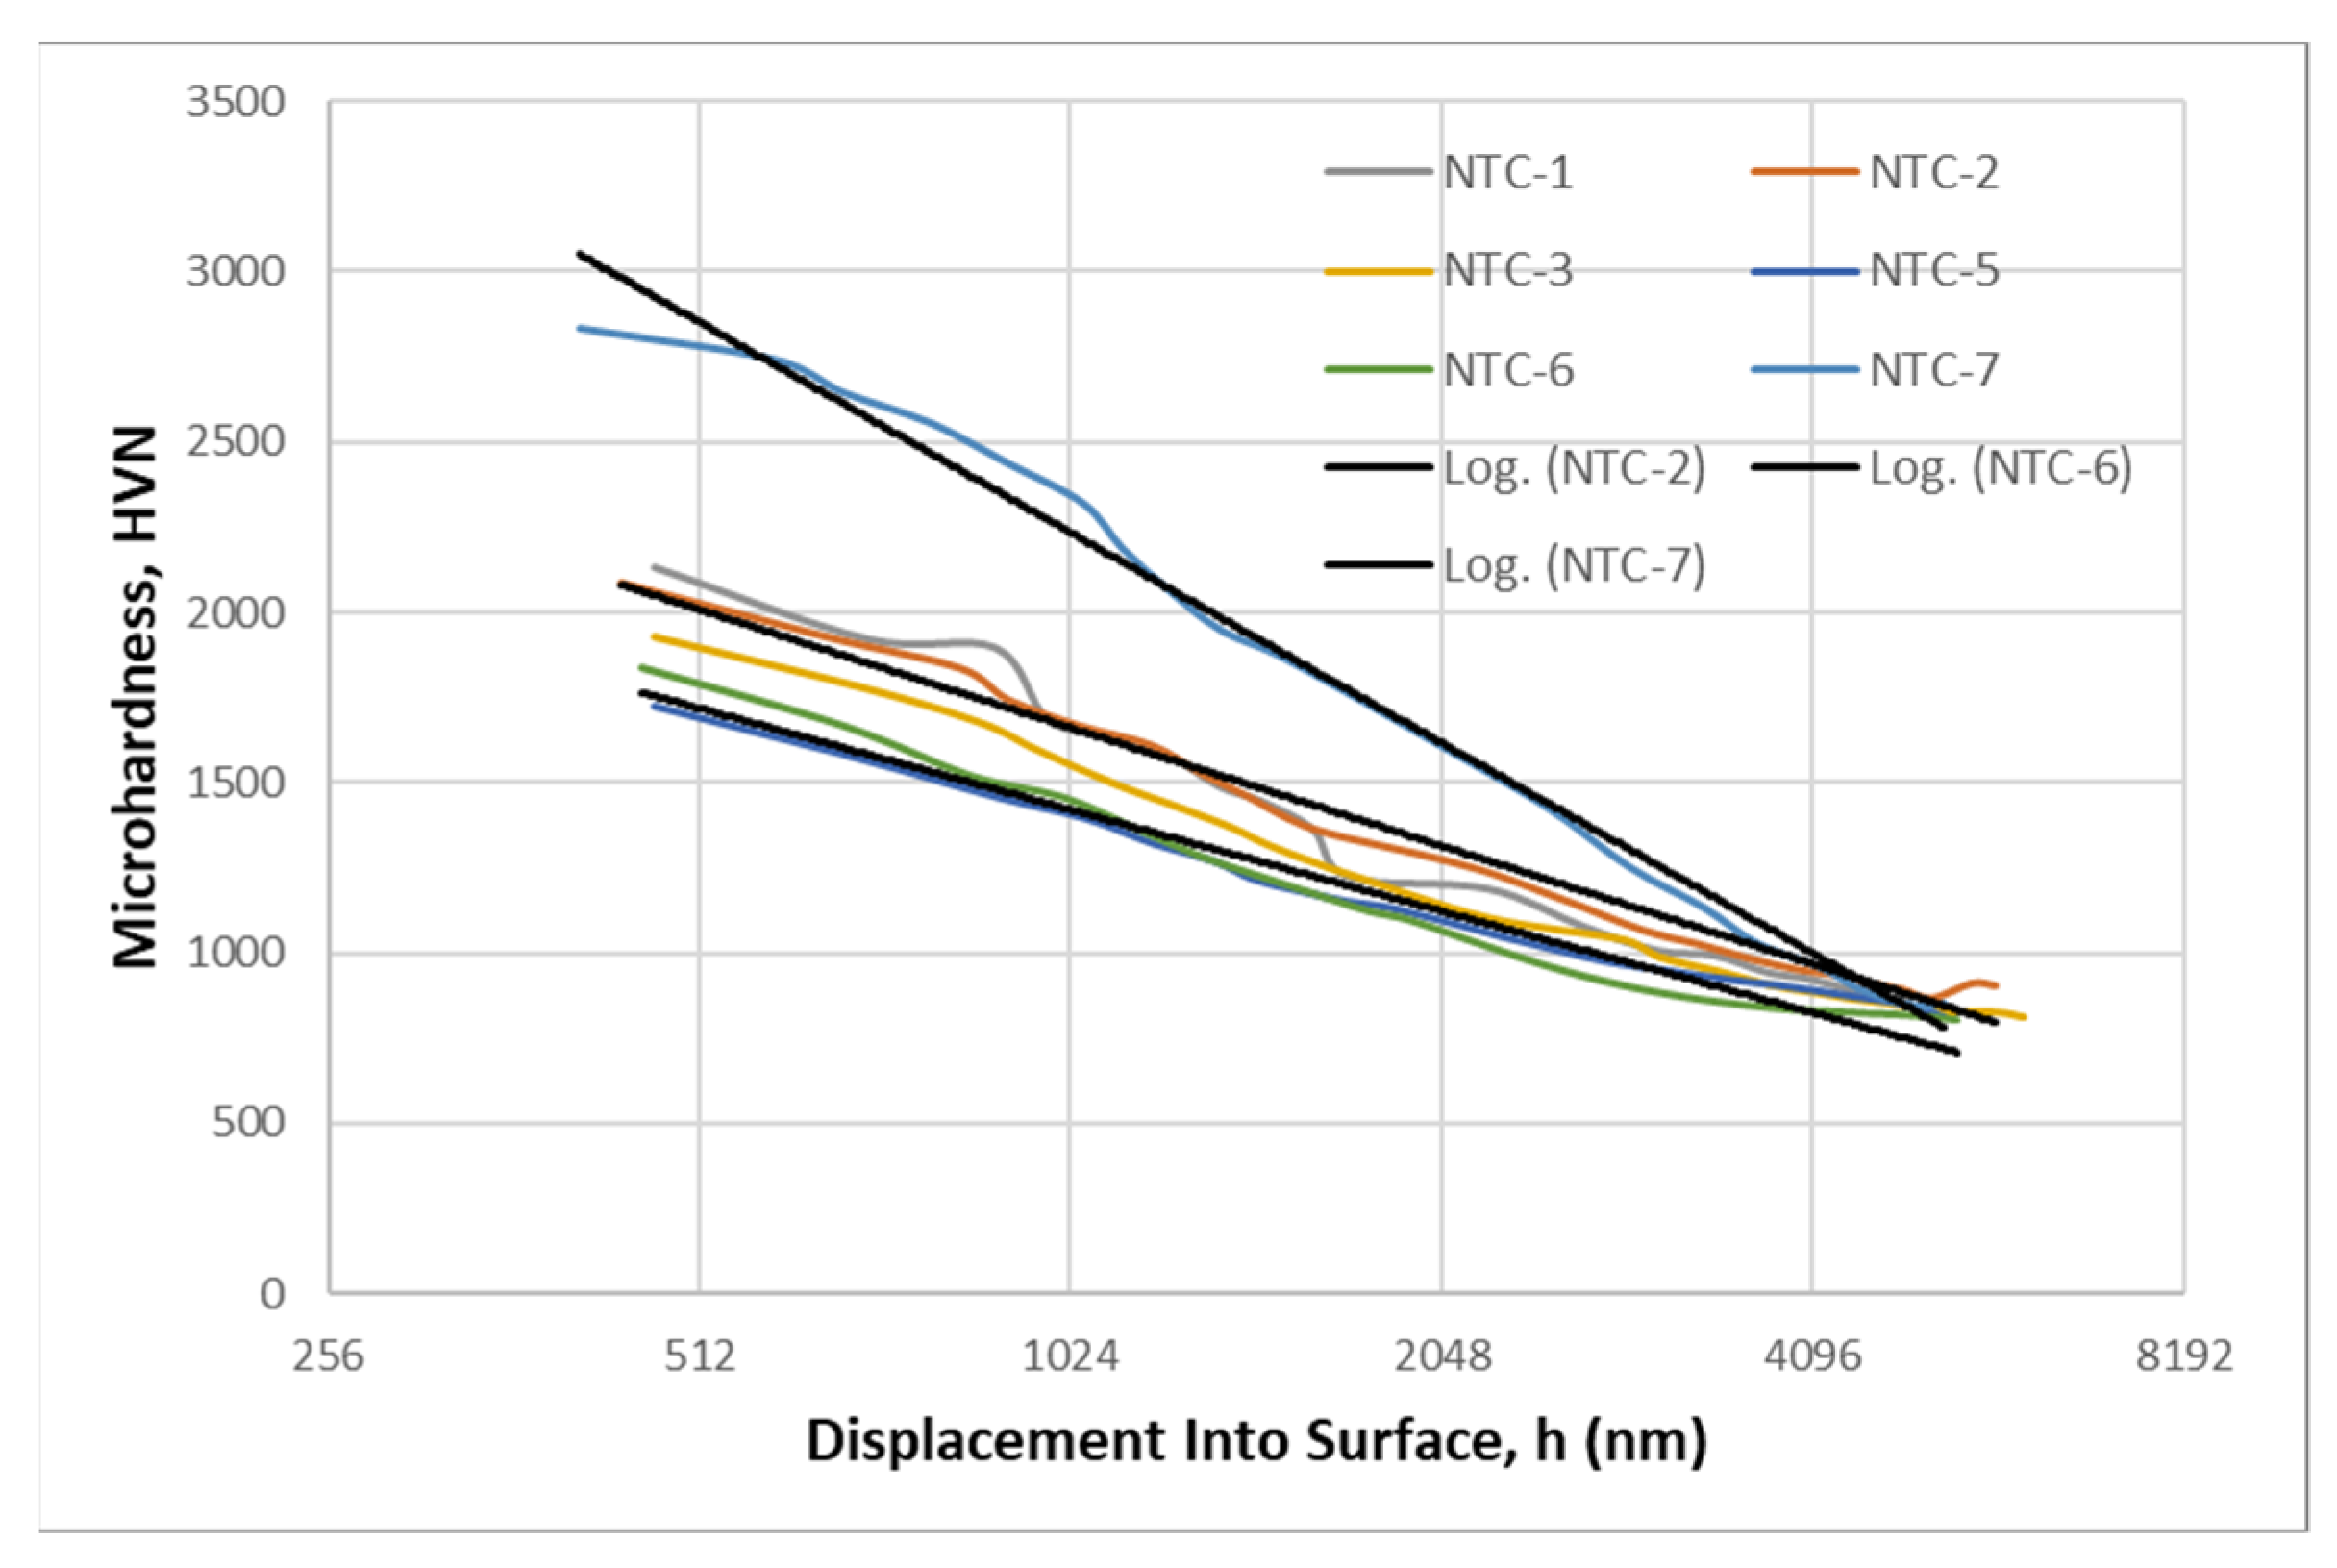
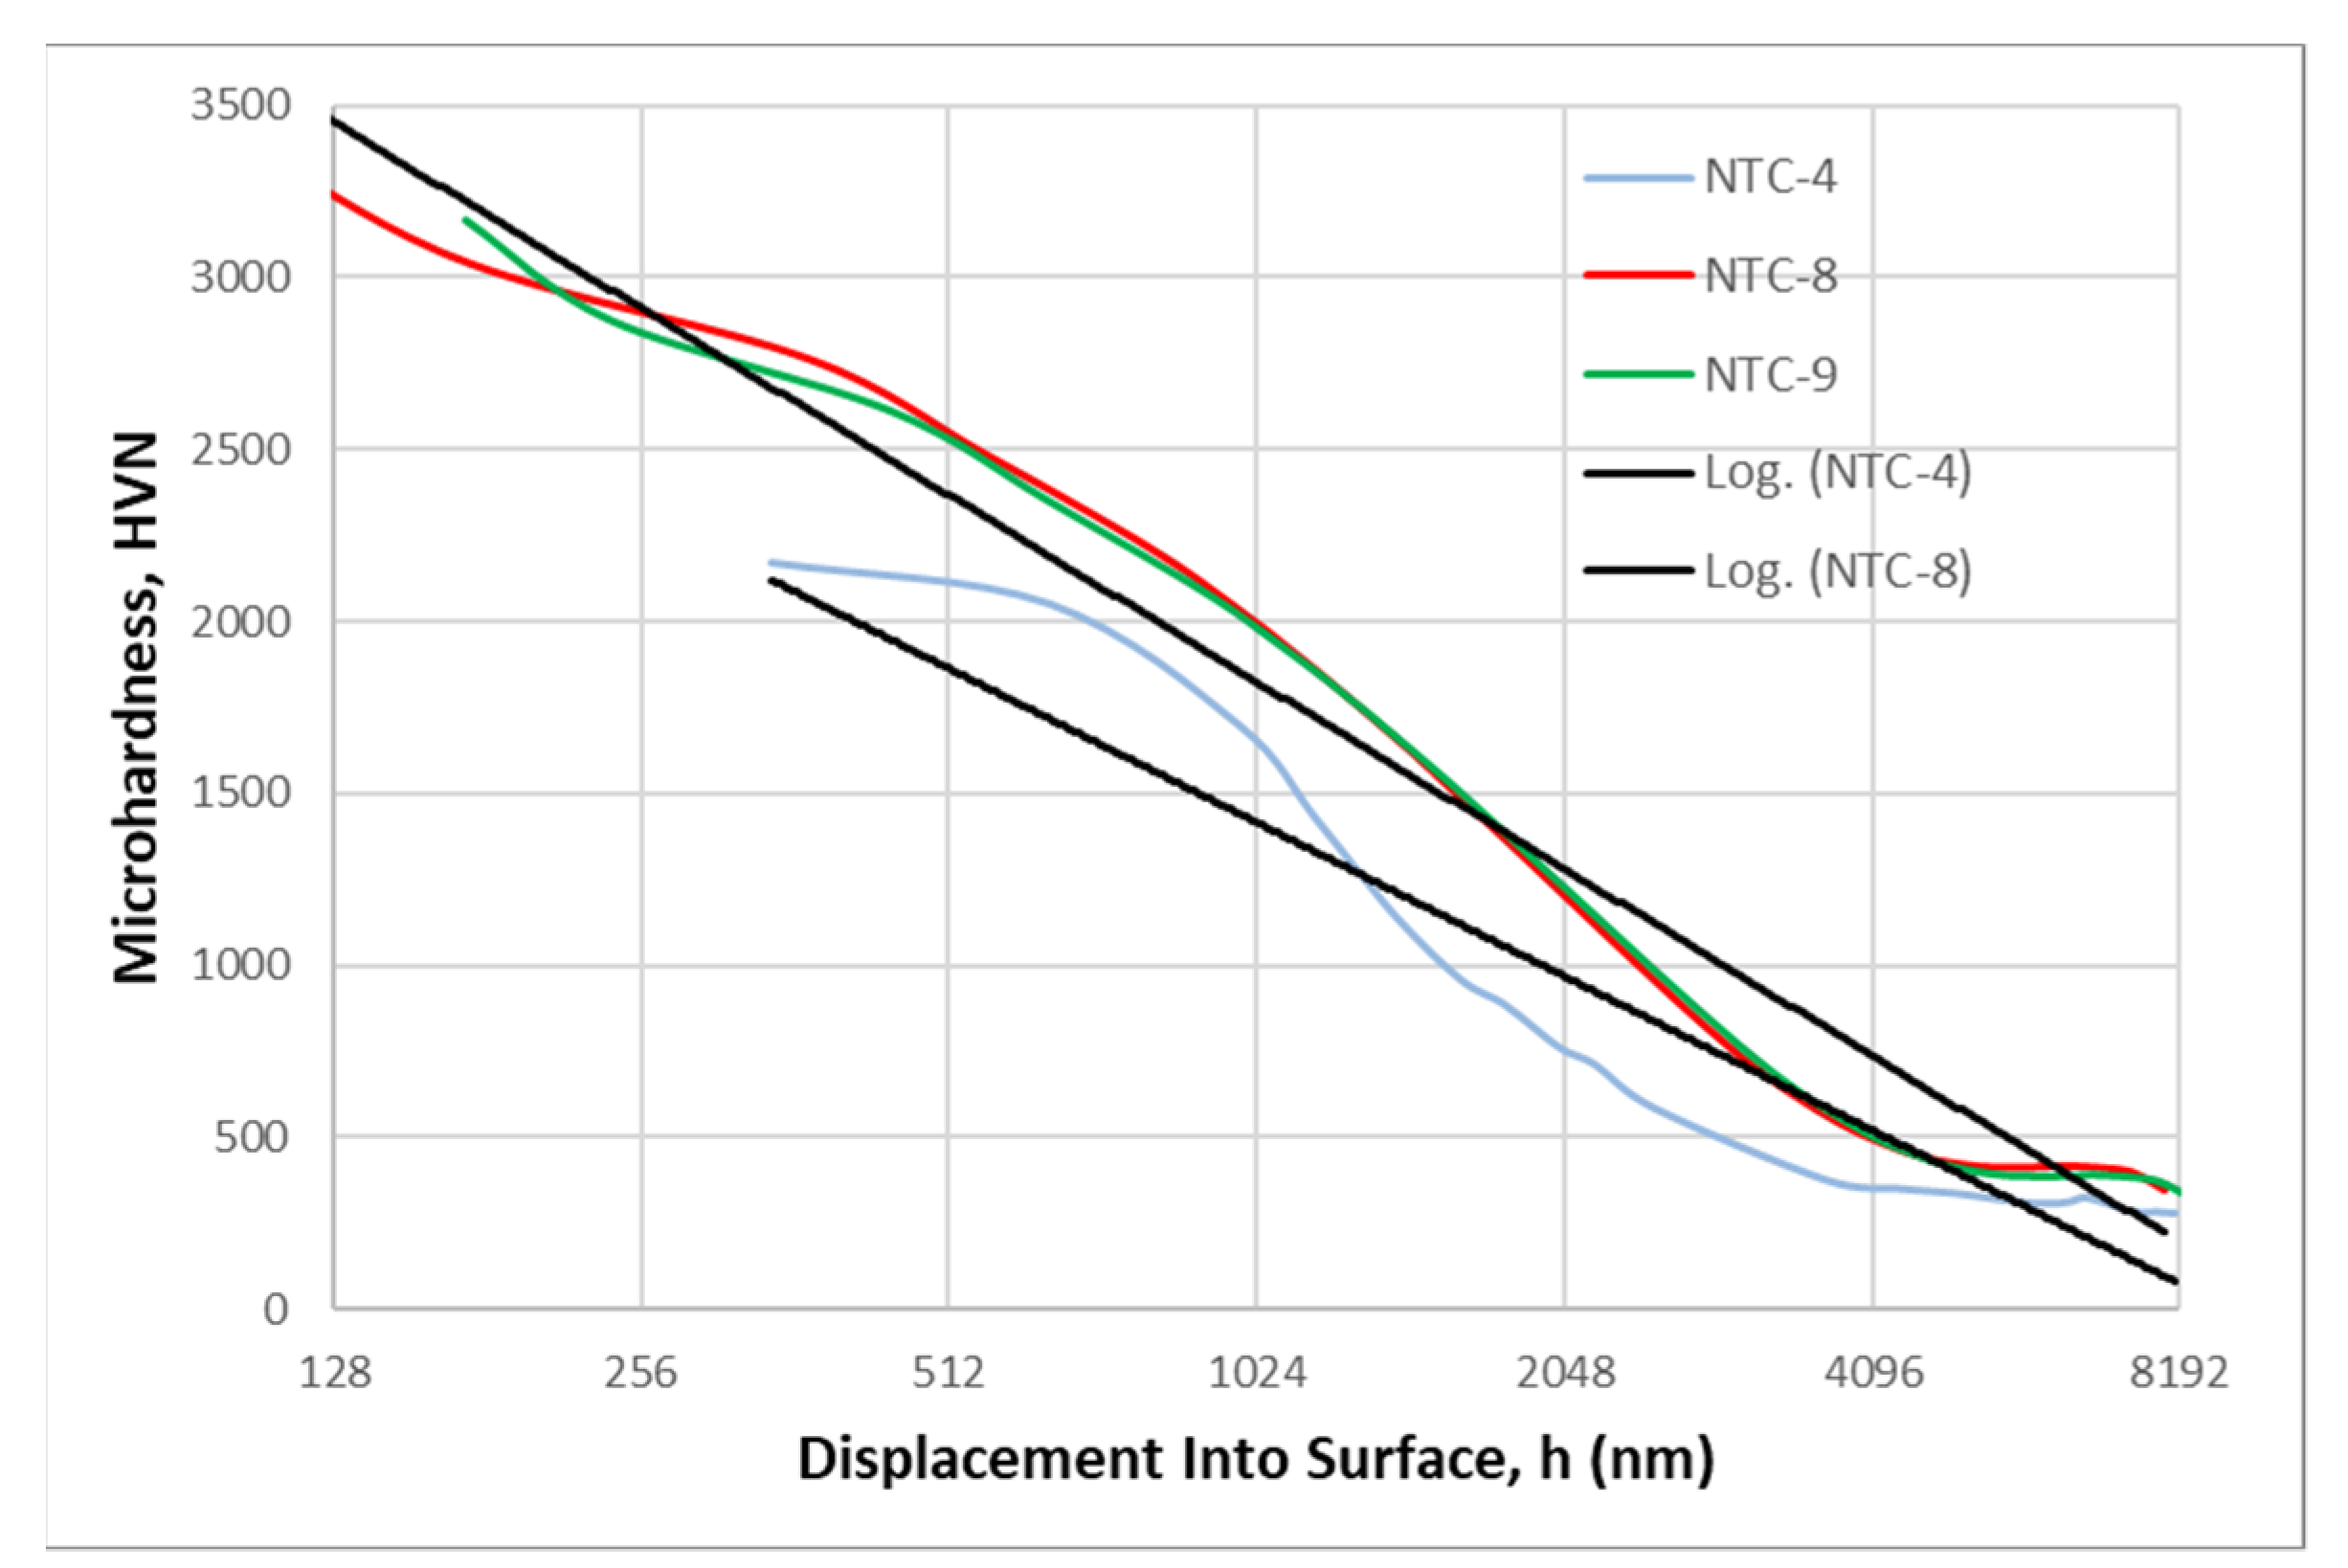
3.2.2. Microindentation Response Analysis Using the Hardness–Displacement Curves

A digital stepwise load-time frame was applied to the indenter, which looks like a trapezoidal load-time profile used to approach the specified load value, P, then this peak load was held, and then reduced to zero again. The microindentation response, as indentation depth, h, also underwent this digital stepwise growth underneath the loaded indenter. In this context, it was deemed more fitting to treat the displacement as the logarithmic strain, specifically, the Hencky strain defined as ε = ln(h/h0), where h0 signifies some initial penetration depth when searching the film surface, as opposed to the Cauchy strain, defined as ε = h/t, where t is representing the film thickness. Consequently, Figure 6, Figure 7 and Figure 8 illustrate the hardness–displacement, H-h, curves presented in a semi-logarithmic scale. This semi-log scale visualization of the hardness–displacement, H-h, curves facilitate a more meticulous examination of the undulating patterns, peak values, and potential plateaus associated with the intrinsic material properties, especially within shallow indentation ranges.
Some of the hardness–displacement, H-h, curves of the NTC samples can be reasonably fitted with straight lines when plotted on a semi-logarithmic scale. However, others exhibit a significant deviation from a linear logarithmic trendline (Figure 6, Figure 7 and Figure 8). The complex behavior of these hardness–displacement, H-h, curves in microhardness testing experiments, especially when compared to bulk materials like the 100Cr6 steel substrate, can be attributed to several factors associated with the unique characteristics of NTC film samples. These factors include their chemical composition, alternating bilayer nitride/carbonitride substructure, interactions within the superlattice structure, and the overall interaction of the film with the underlying substrate.
The interaction between the film and the substrate significantly influences the measured hardness of the film/substrate system. The film and substrate possess differing mechanical properties, such as hardness, elastic modulus, and plasticity. When the indenter makes initial contact with the film surface and subsequently penetrates it, it immediately encounters resistance from both the film and the substrate [36,37]. This interaction leads to complex elastic–plastic deformation behavior that differs from that observed in bulk materials. Furthermore, as the indenter penetrates the film/substrate system, an “Elastic-Plastic Transition” occurs. In the early stages of indentation, deformation behavior is primarily elastic, and the hardness may gradually increase as the indenter penetrates the film. However, as the indentation depth increases, plastic deformation becomes more prominent. This transition from elastic to plastic deformation can also result in deviations from a simple logarithmic trendline.
A no less important role is played by the superlattice microstructure of the NTC film samples, including grain boundaries, defects, and crystallographic orientation. They can affect its mechanical properties and response to microindentation [38,39]. Films with different microstructures may exhibit different hardness–depth behaviors, as shown in Figure 6, Figure 7 and Figure 8. The film/substrate systems often have residual stresses that can affect their mechanical behavior. These stresses can be tensile or compressive and may change as a function of indentation depth. However, this requires further specific, in-depth research.

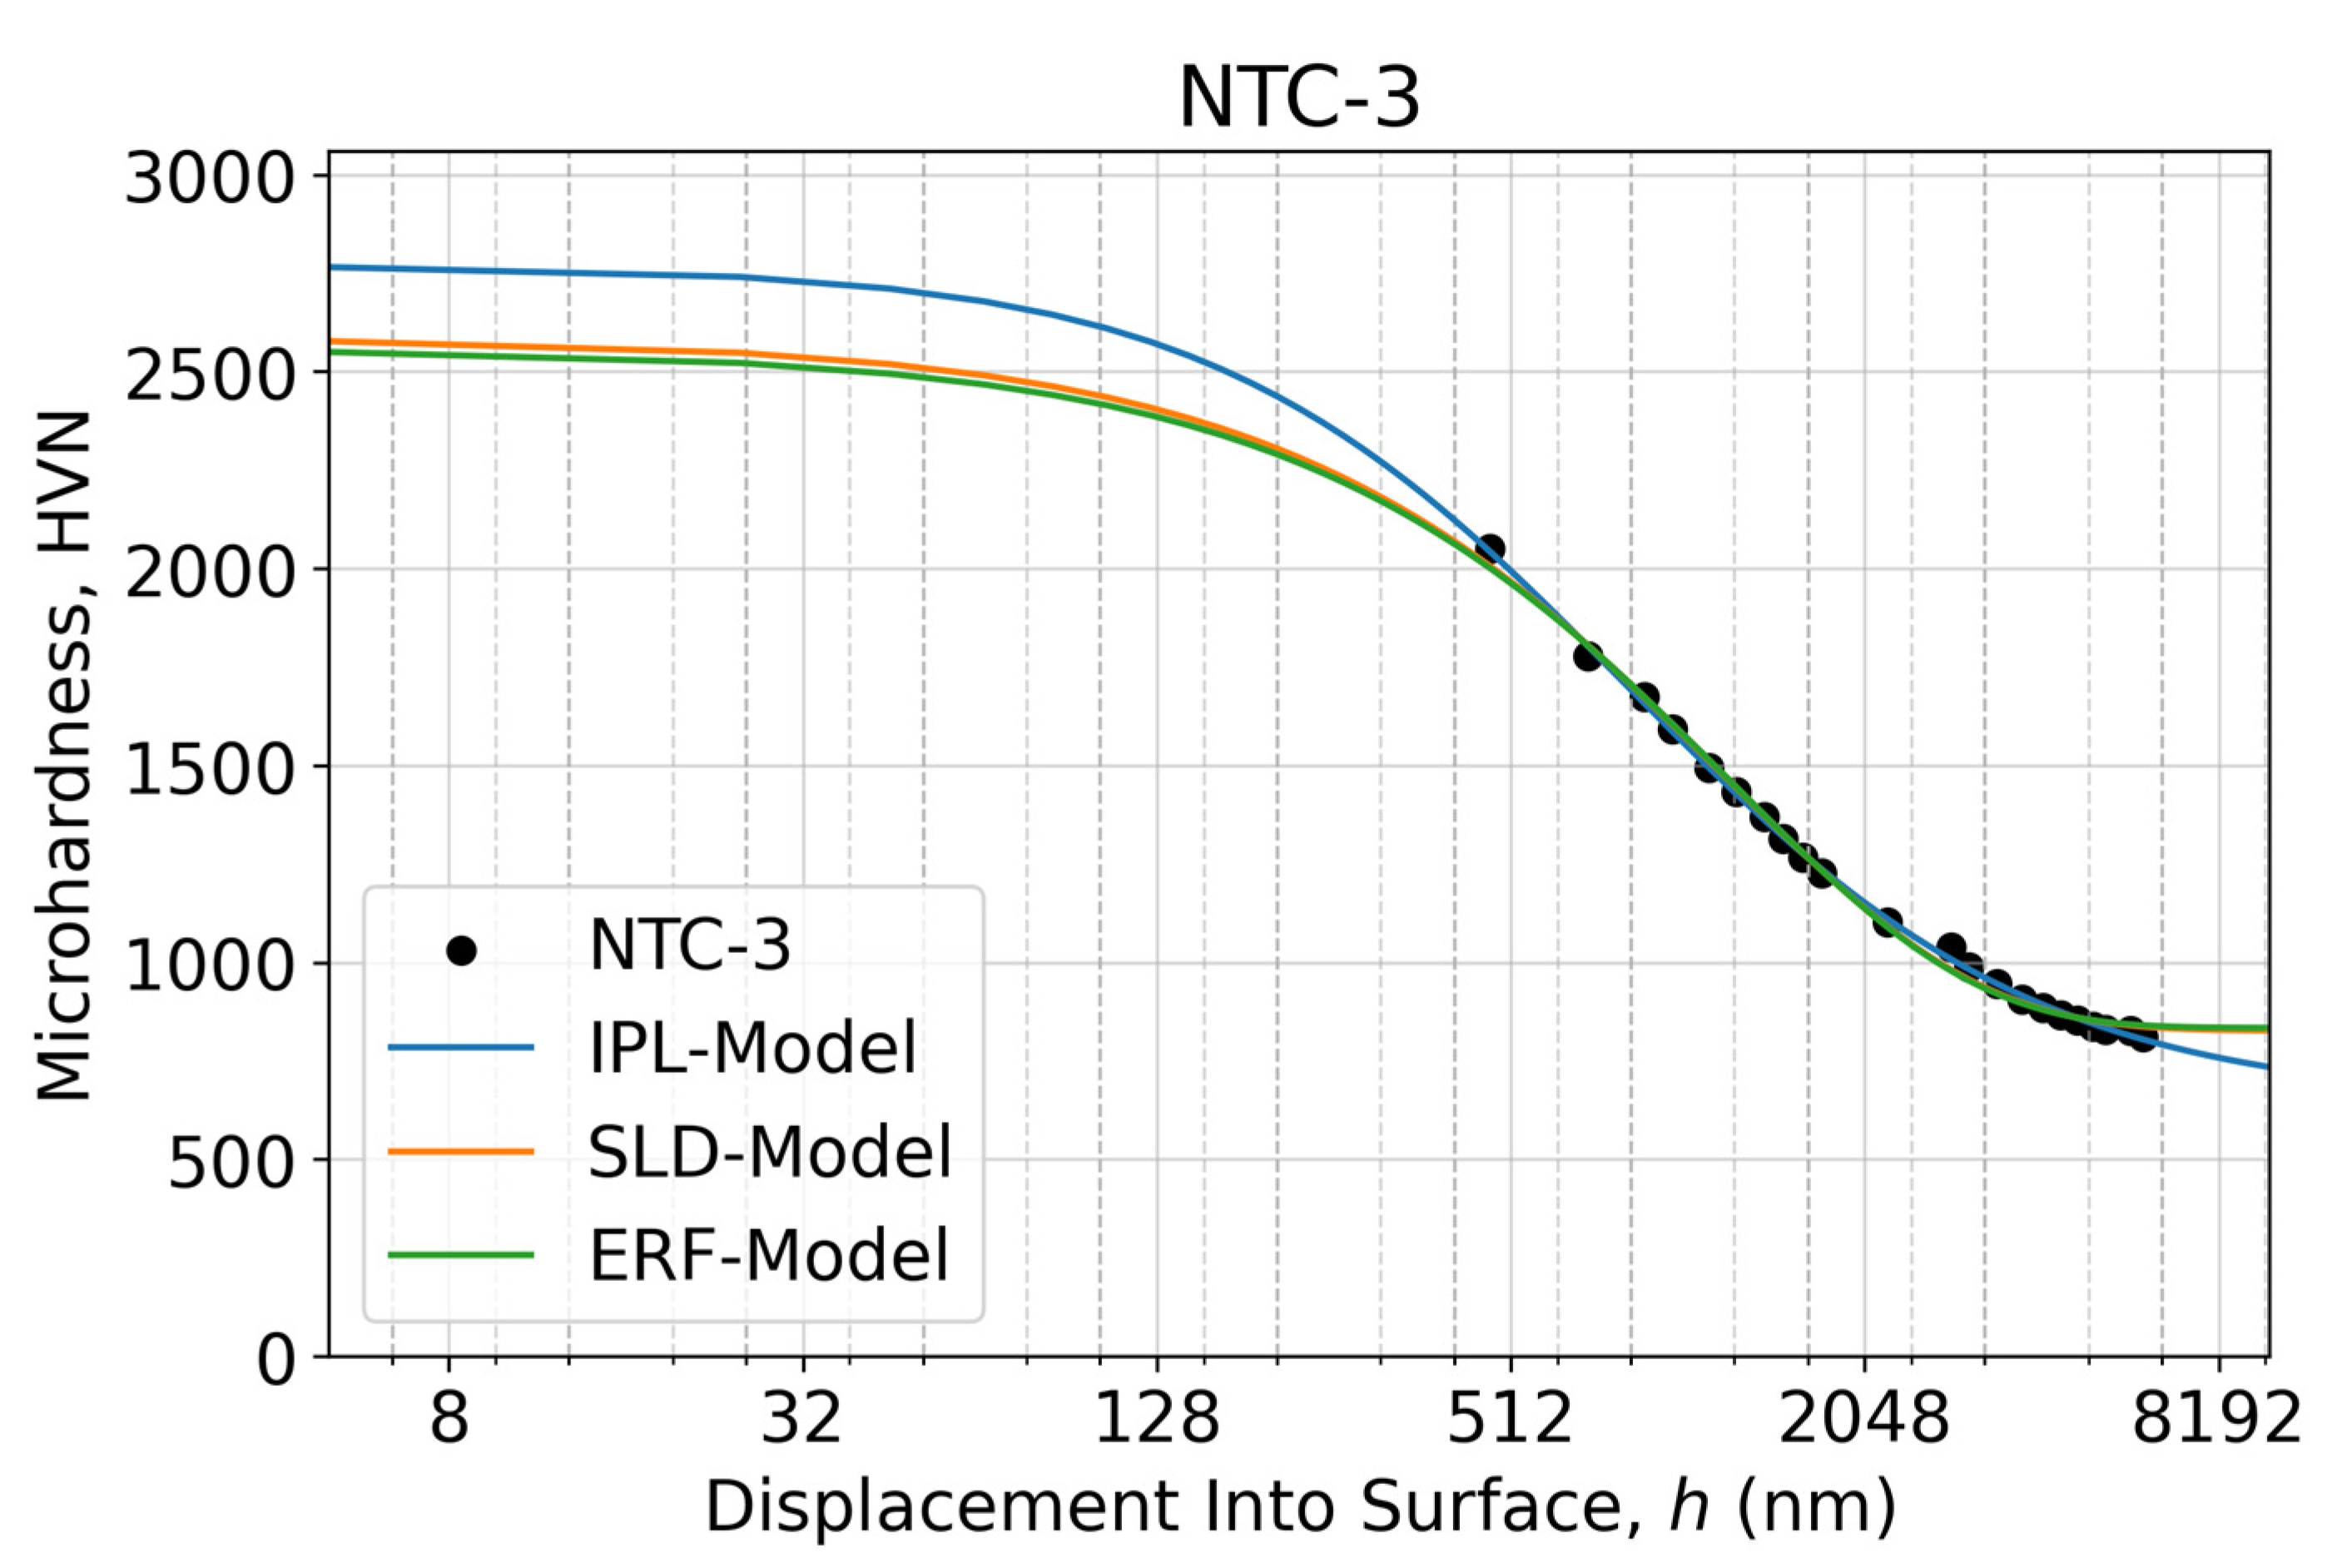
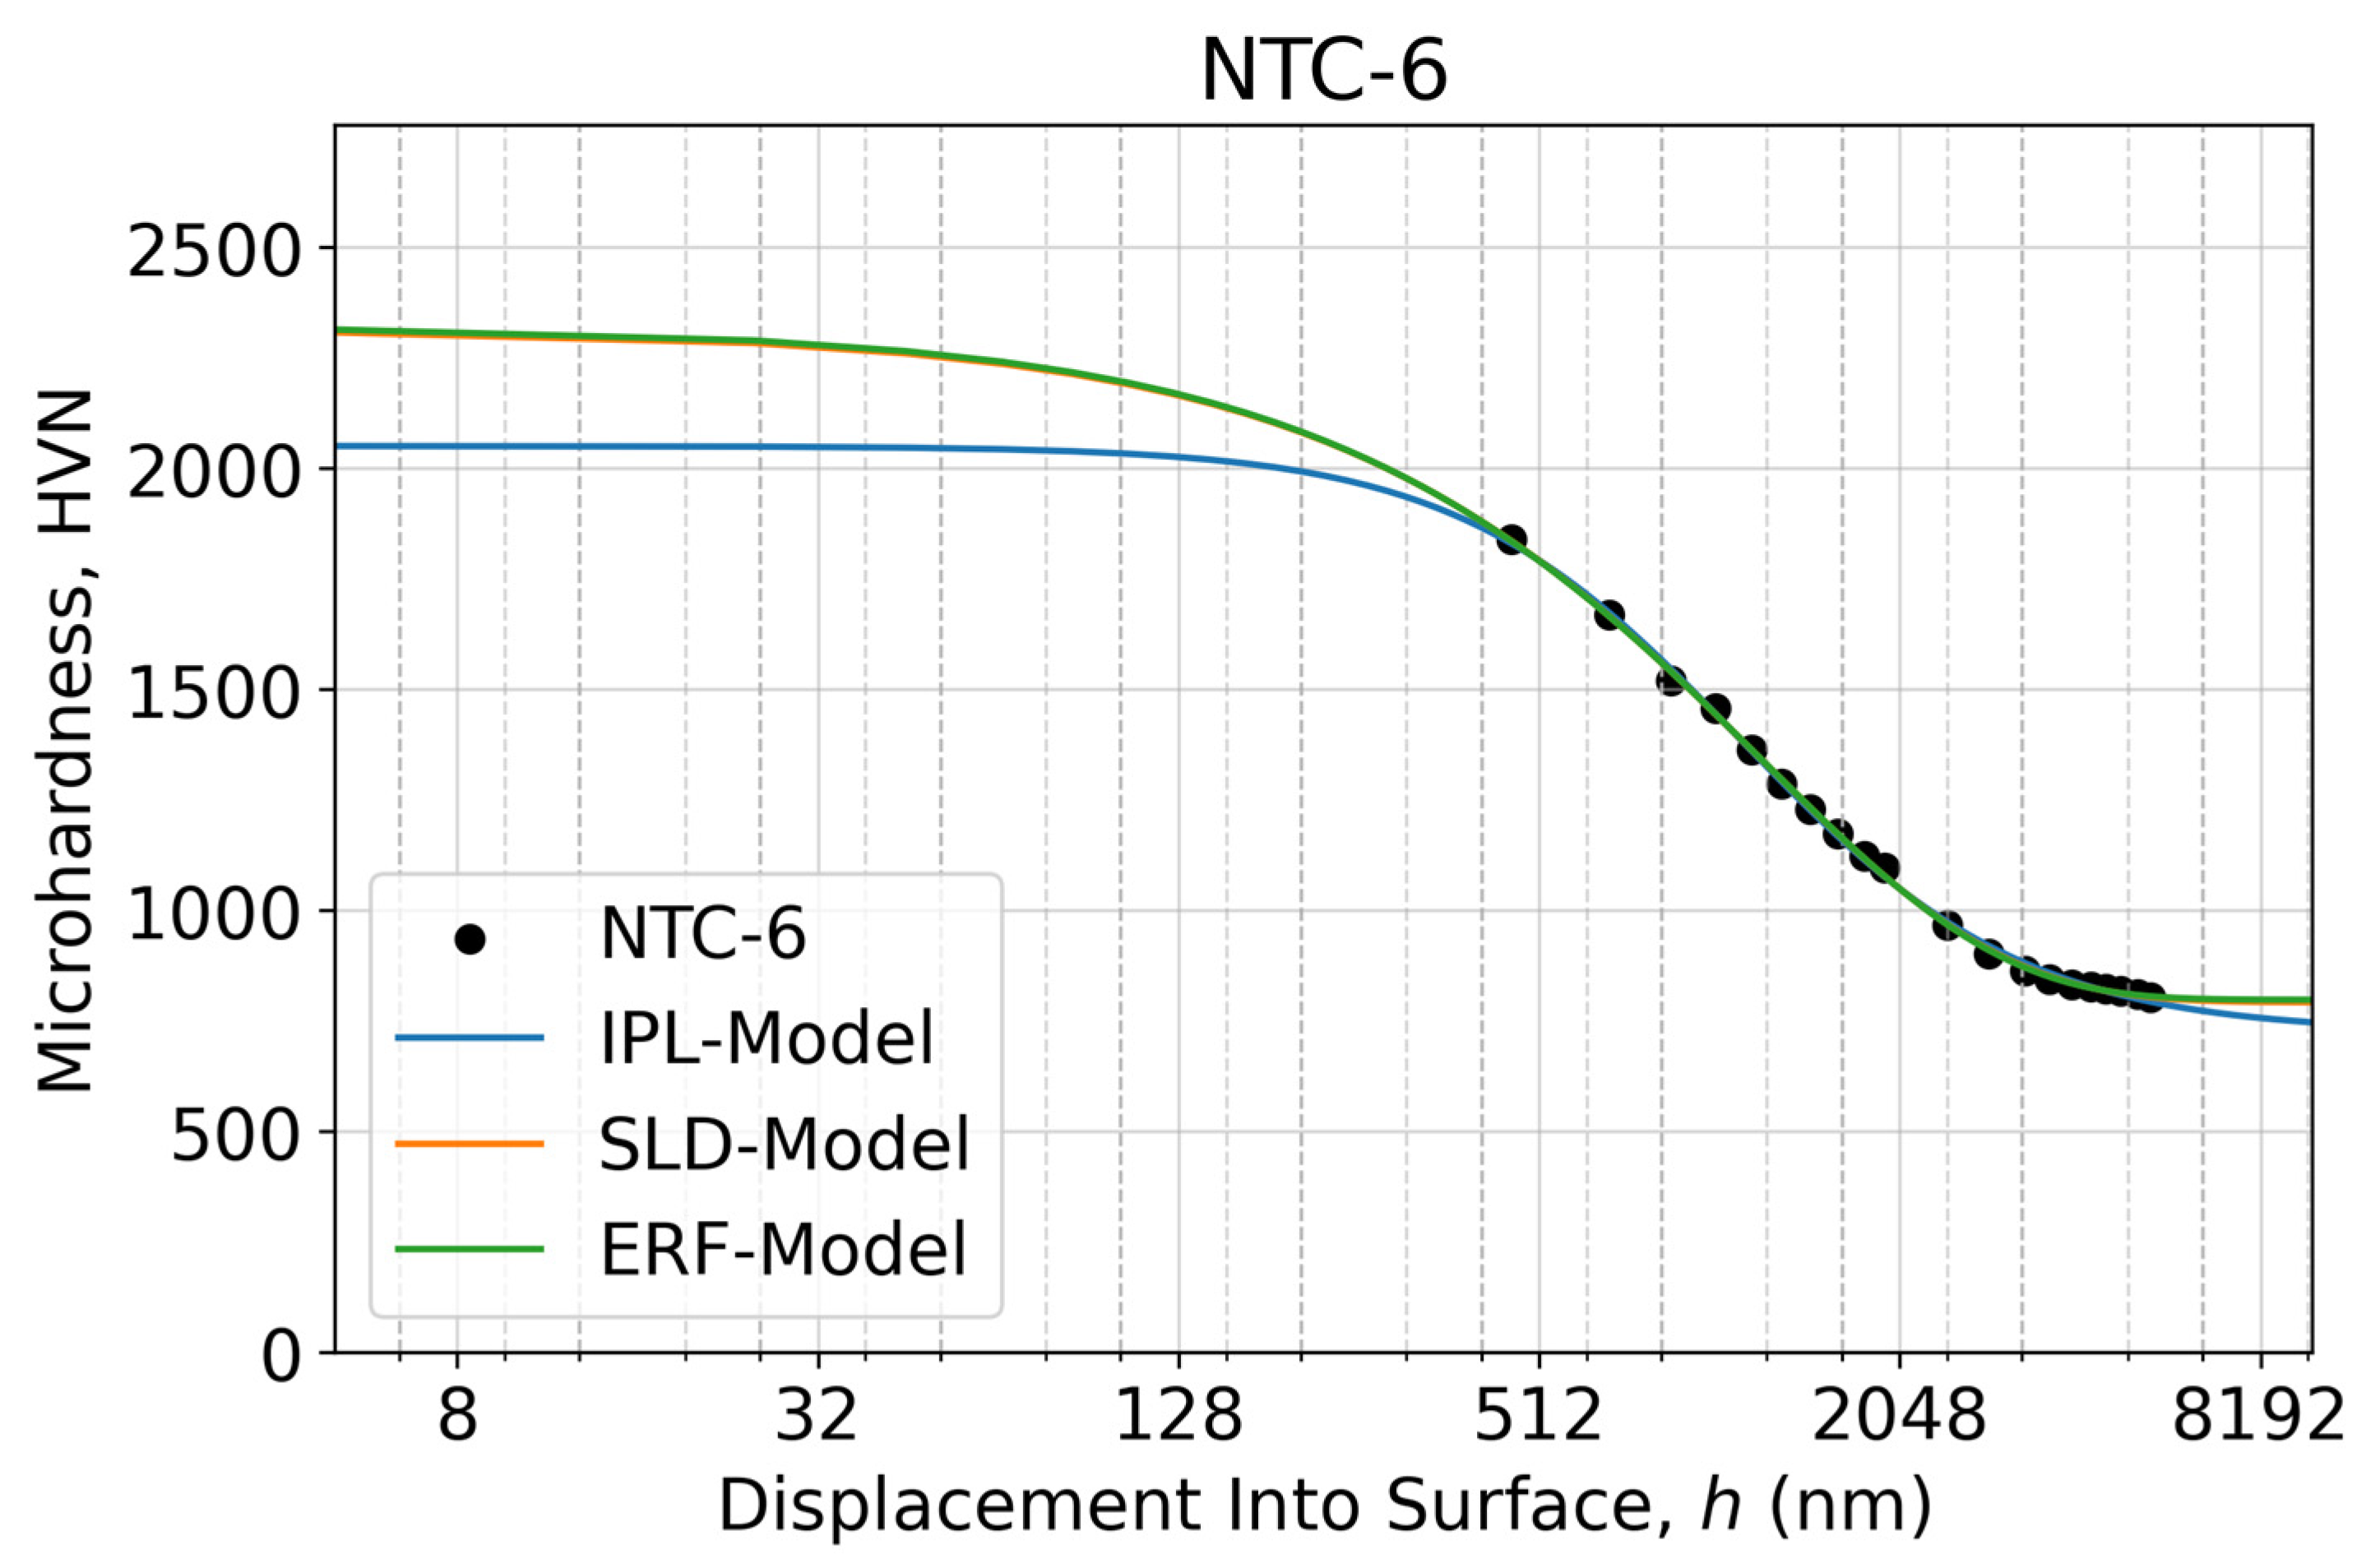
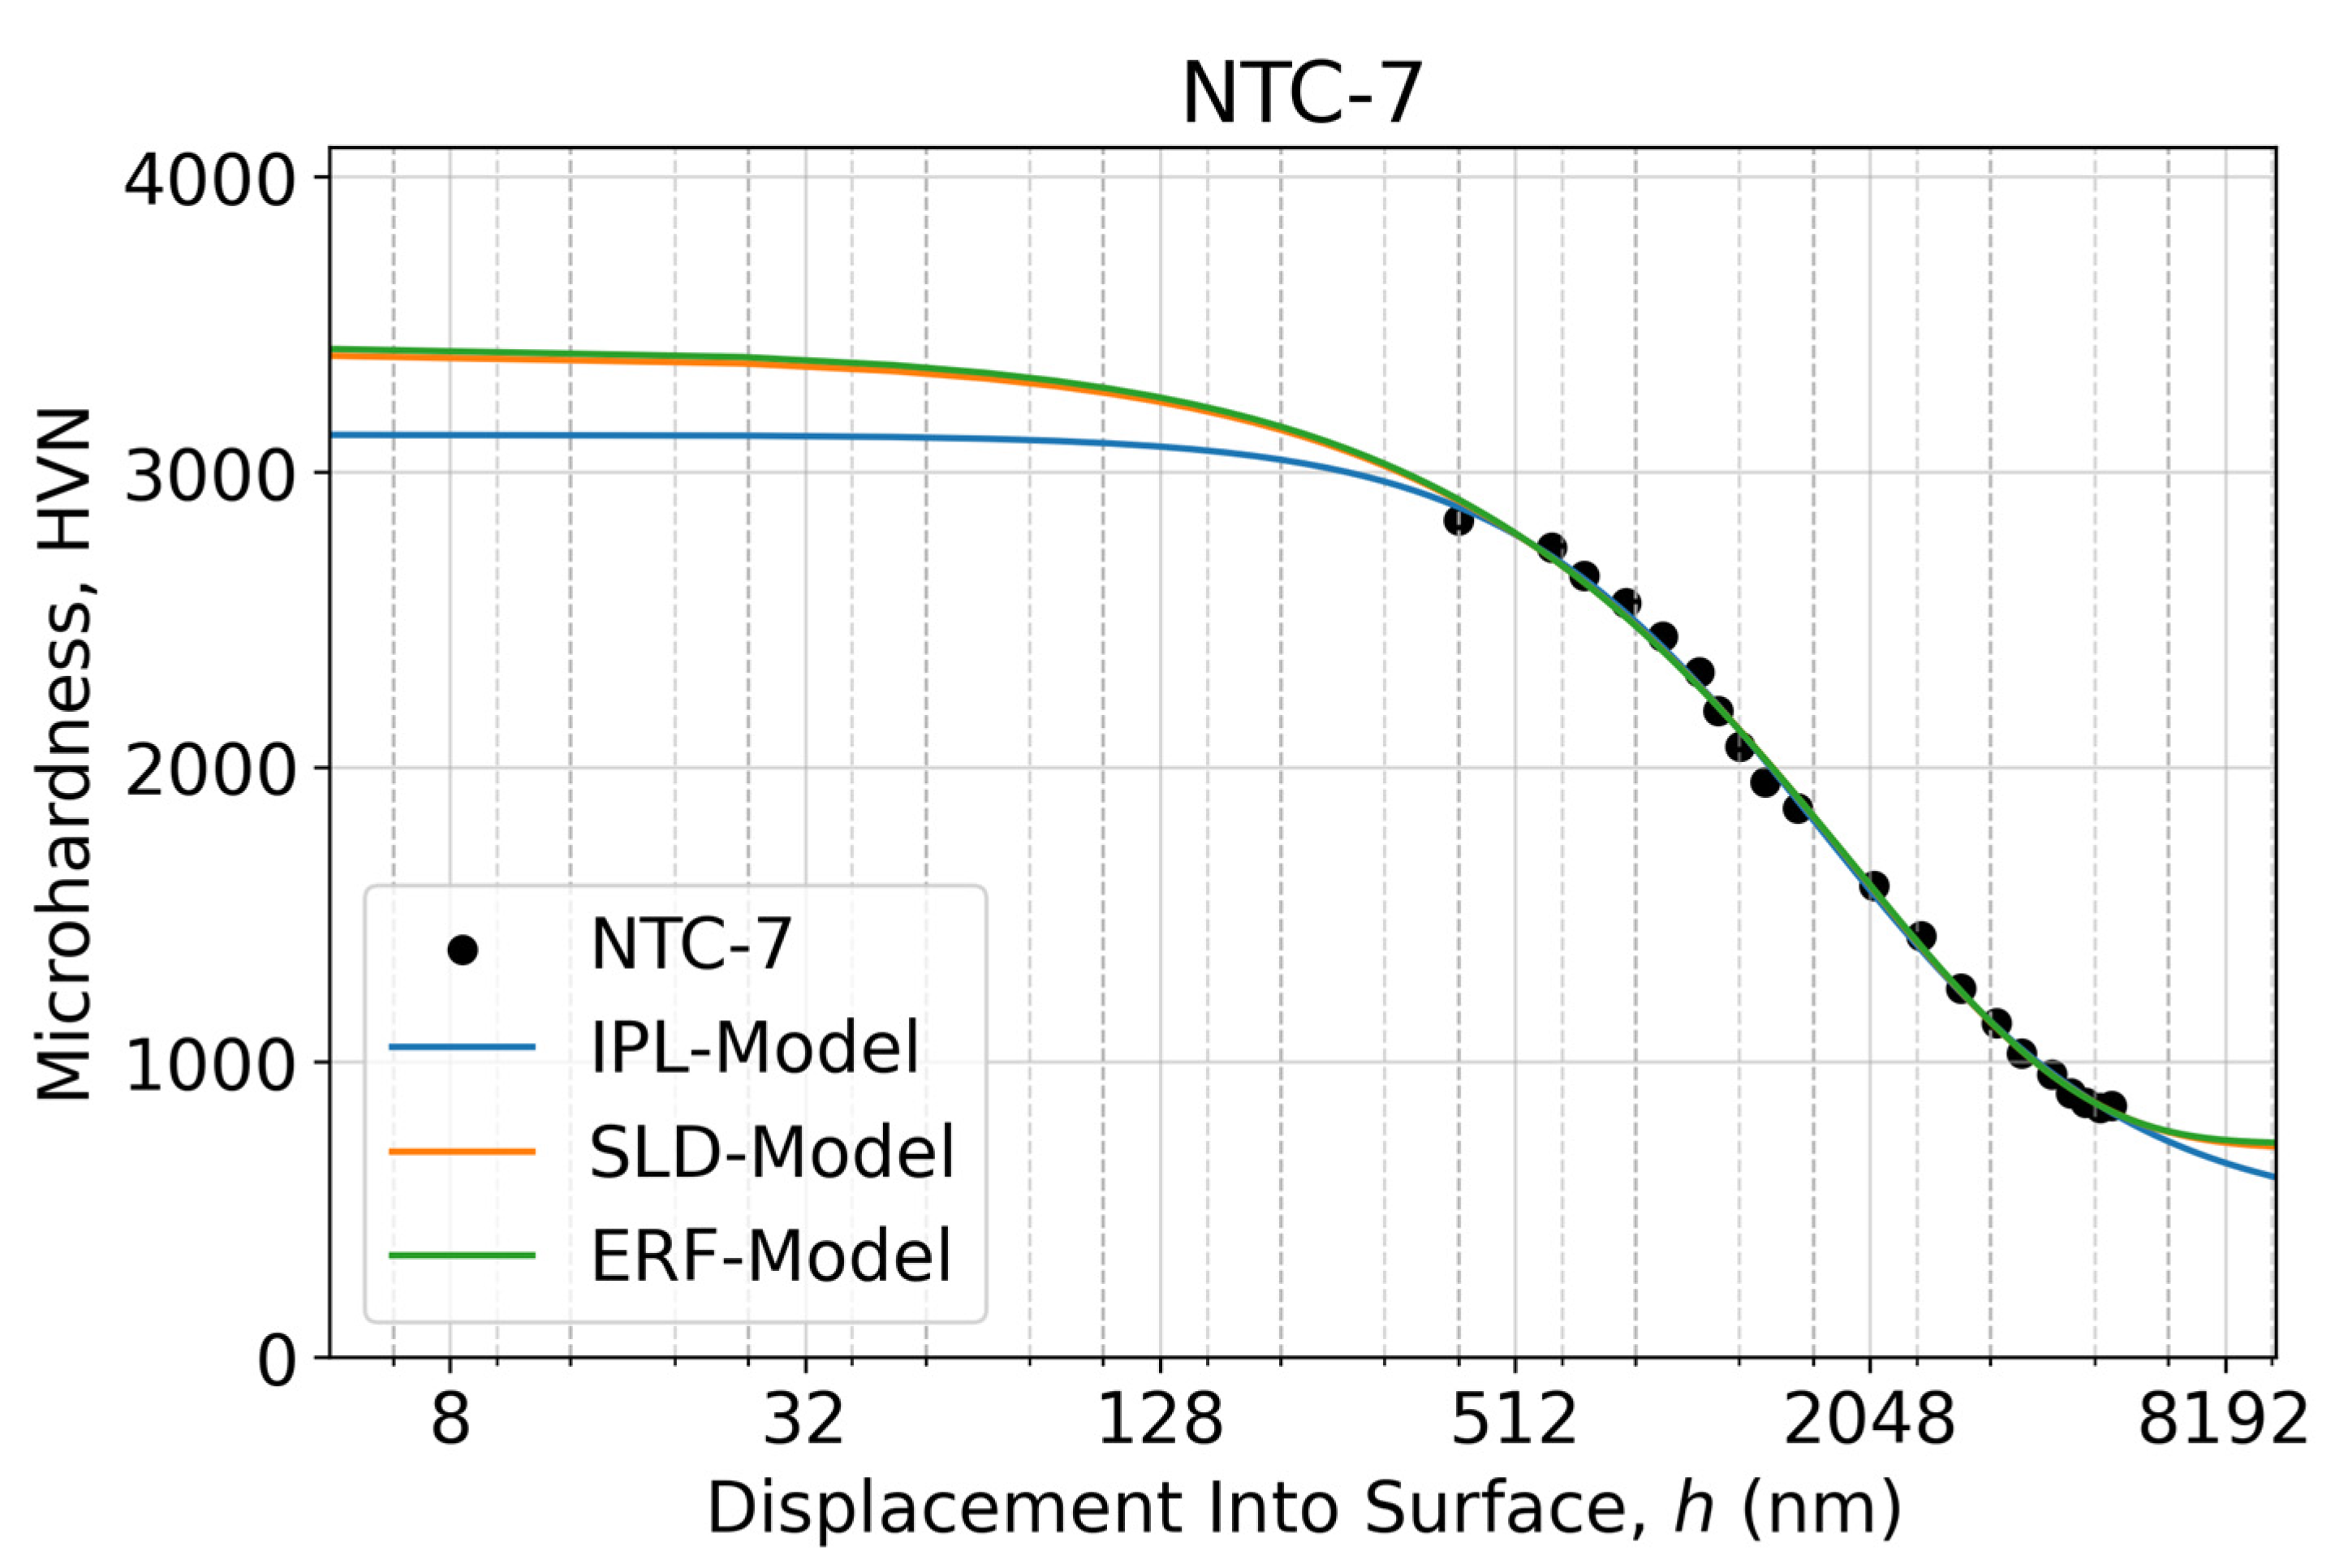
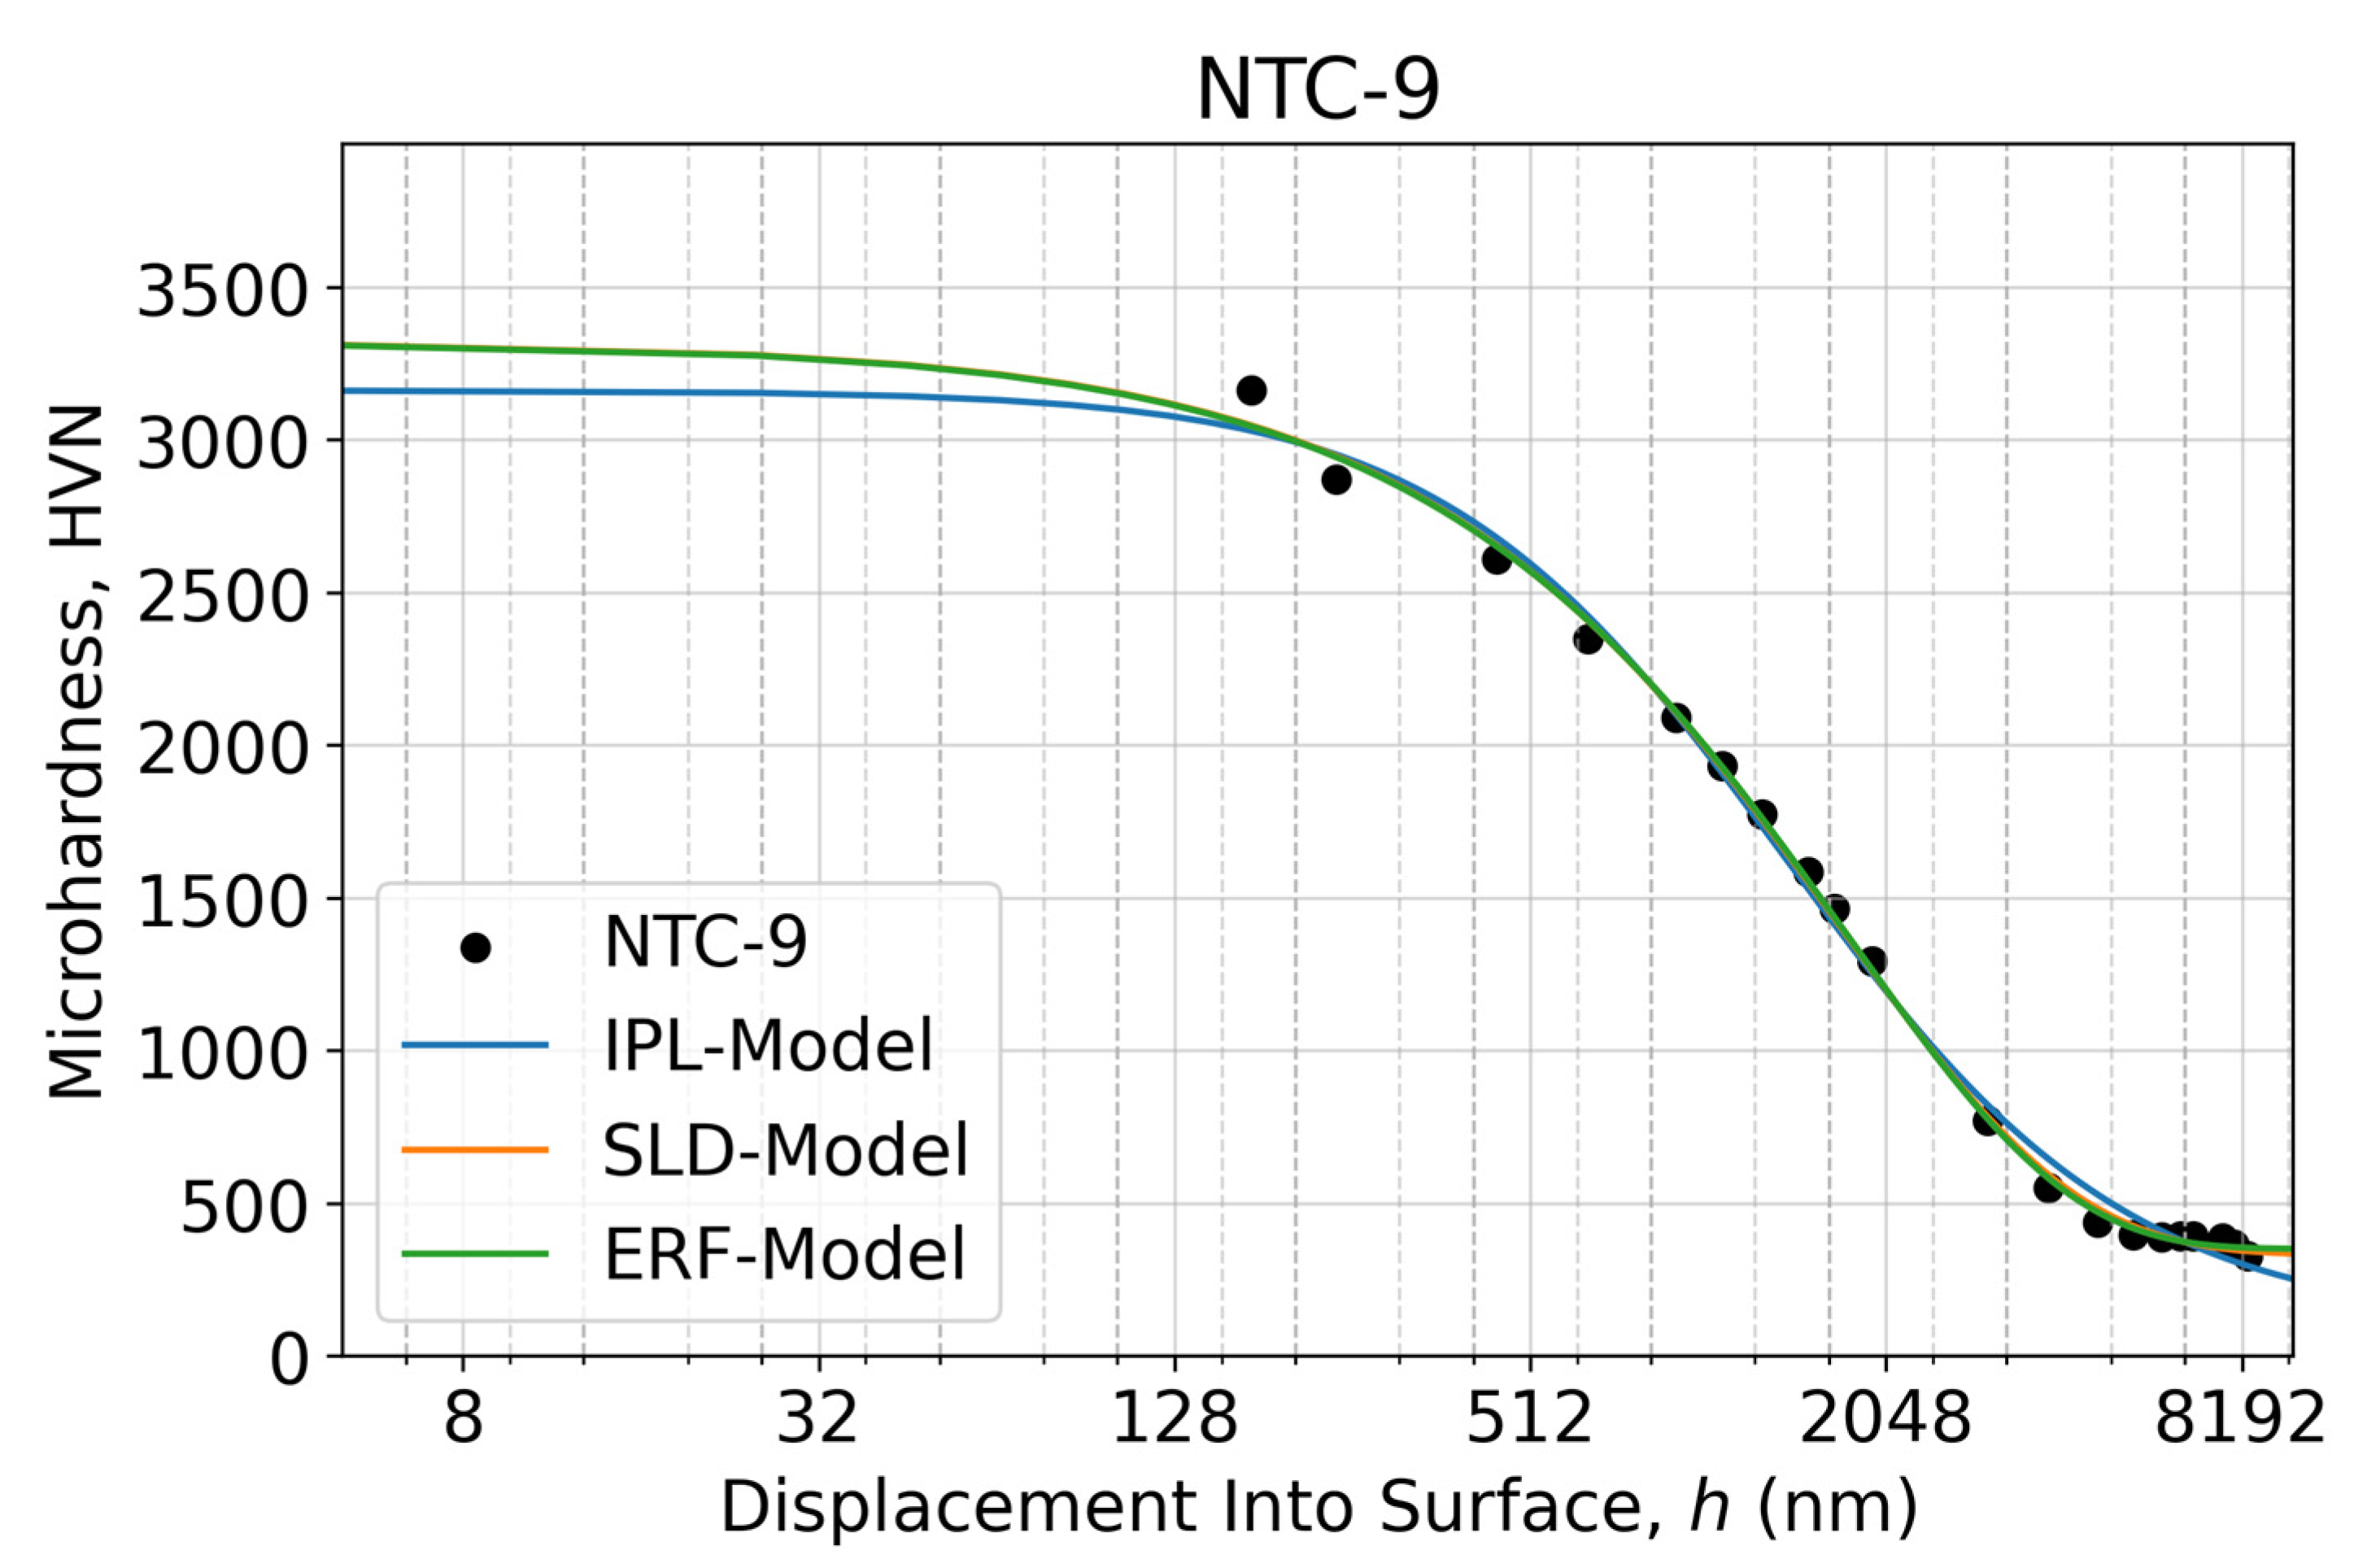
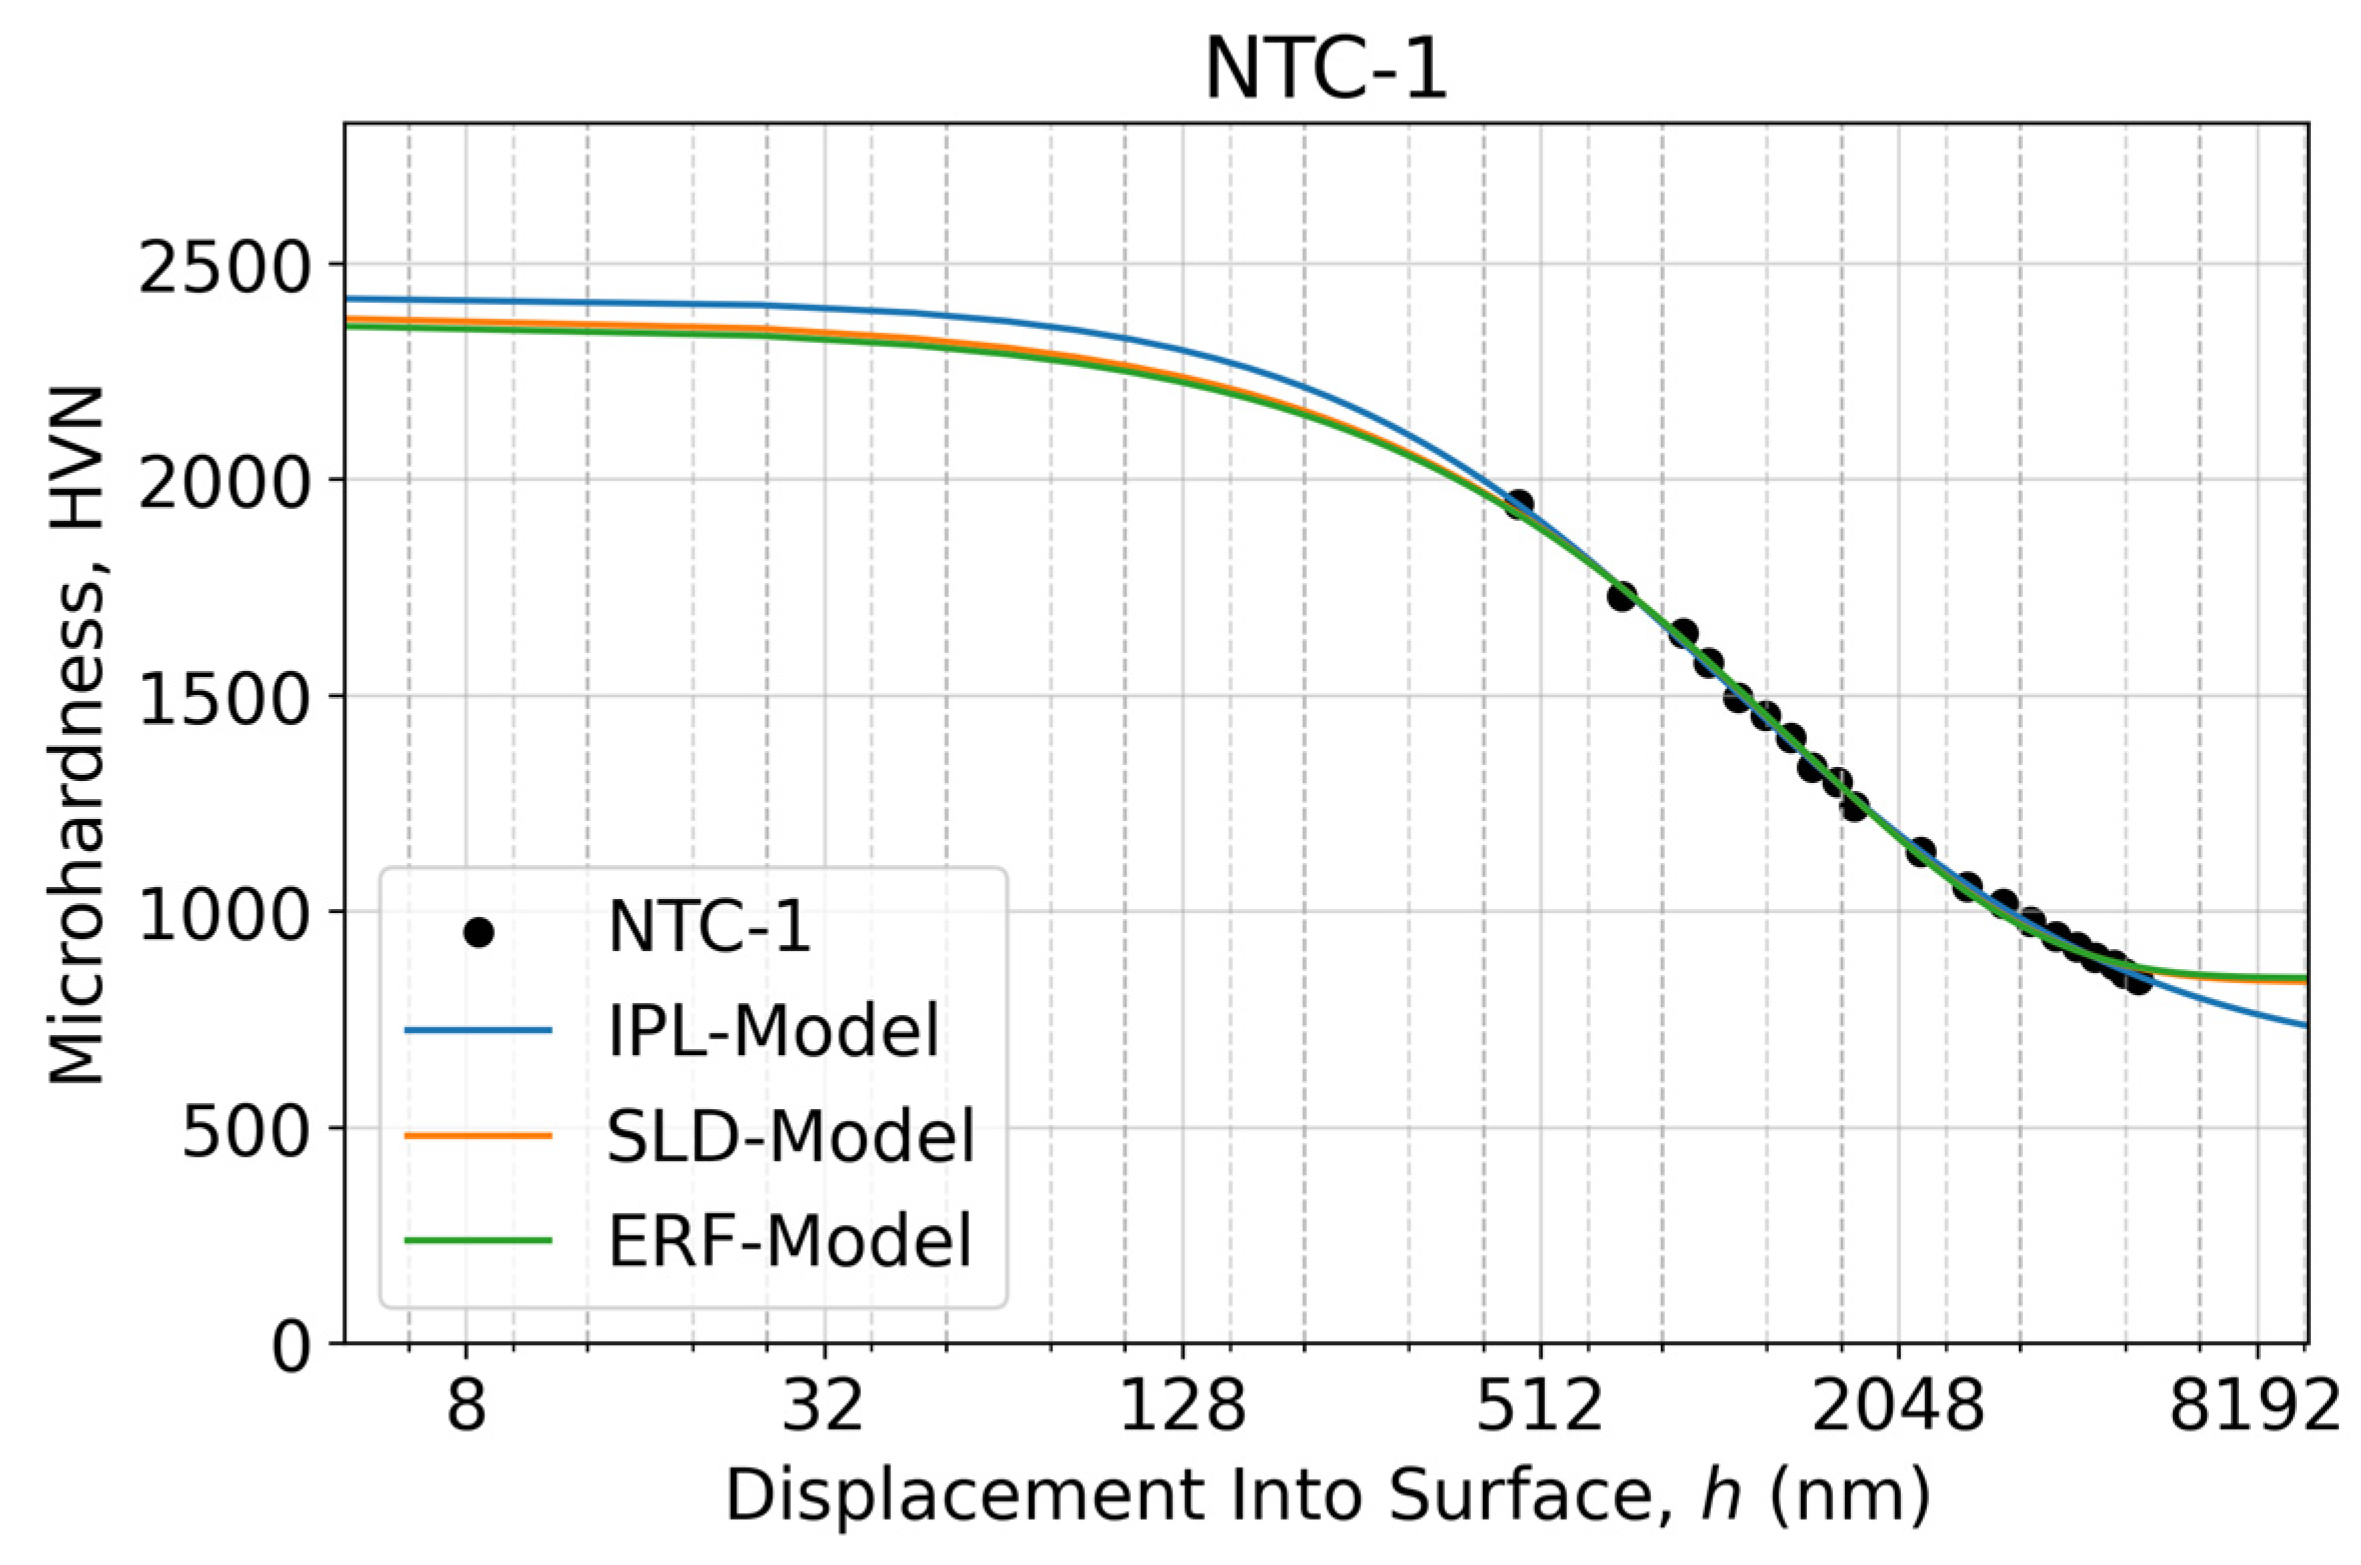
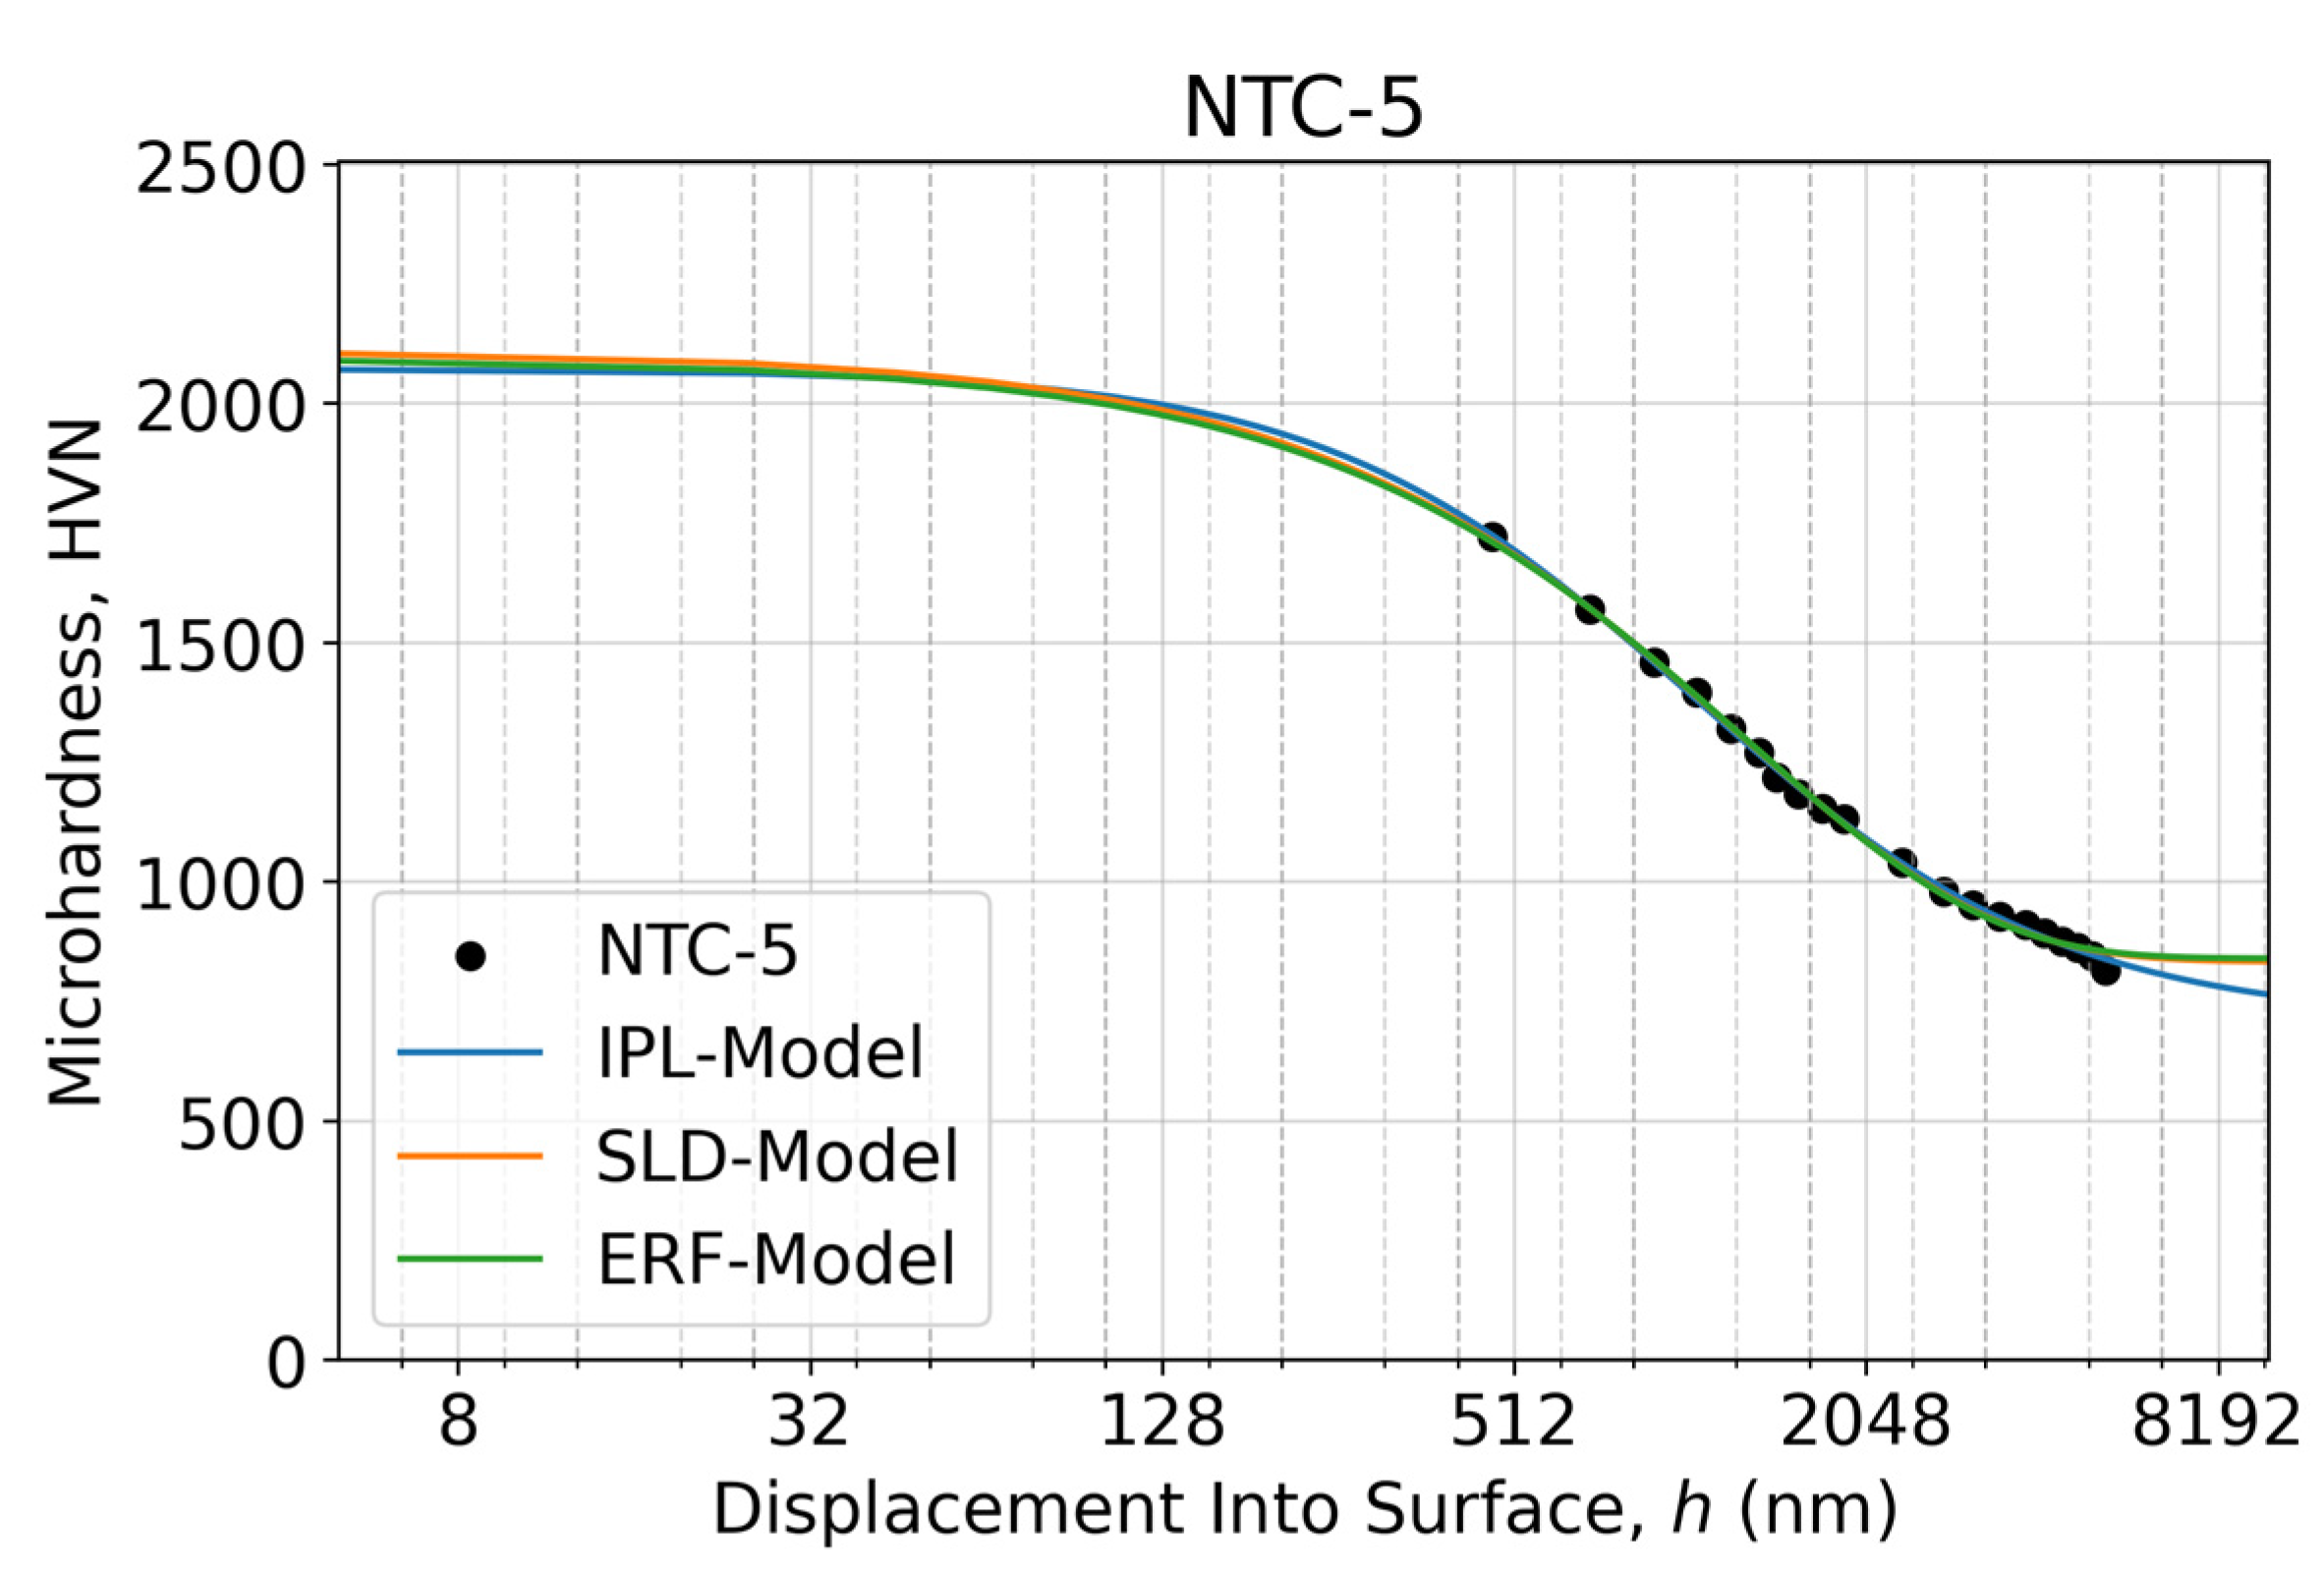
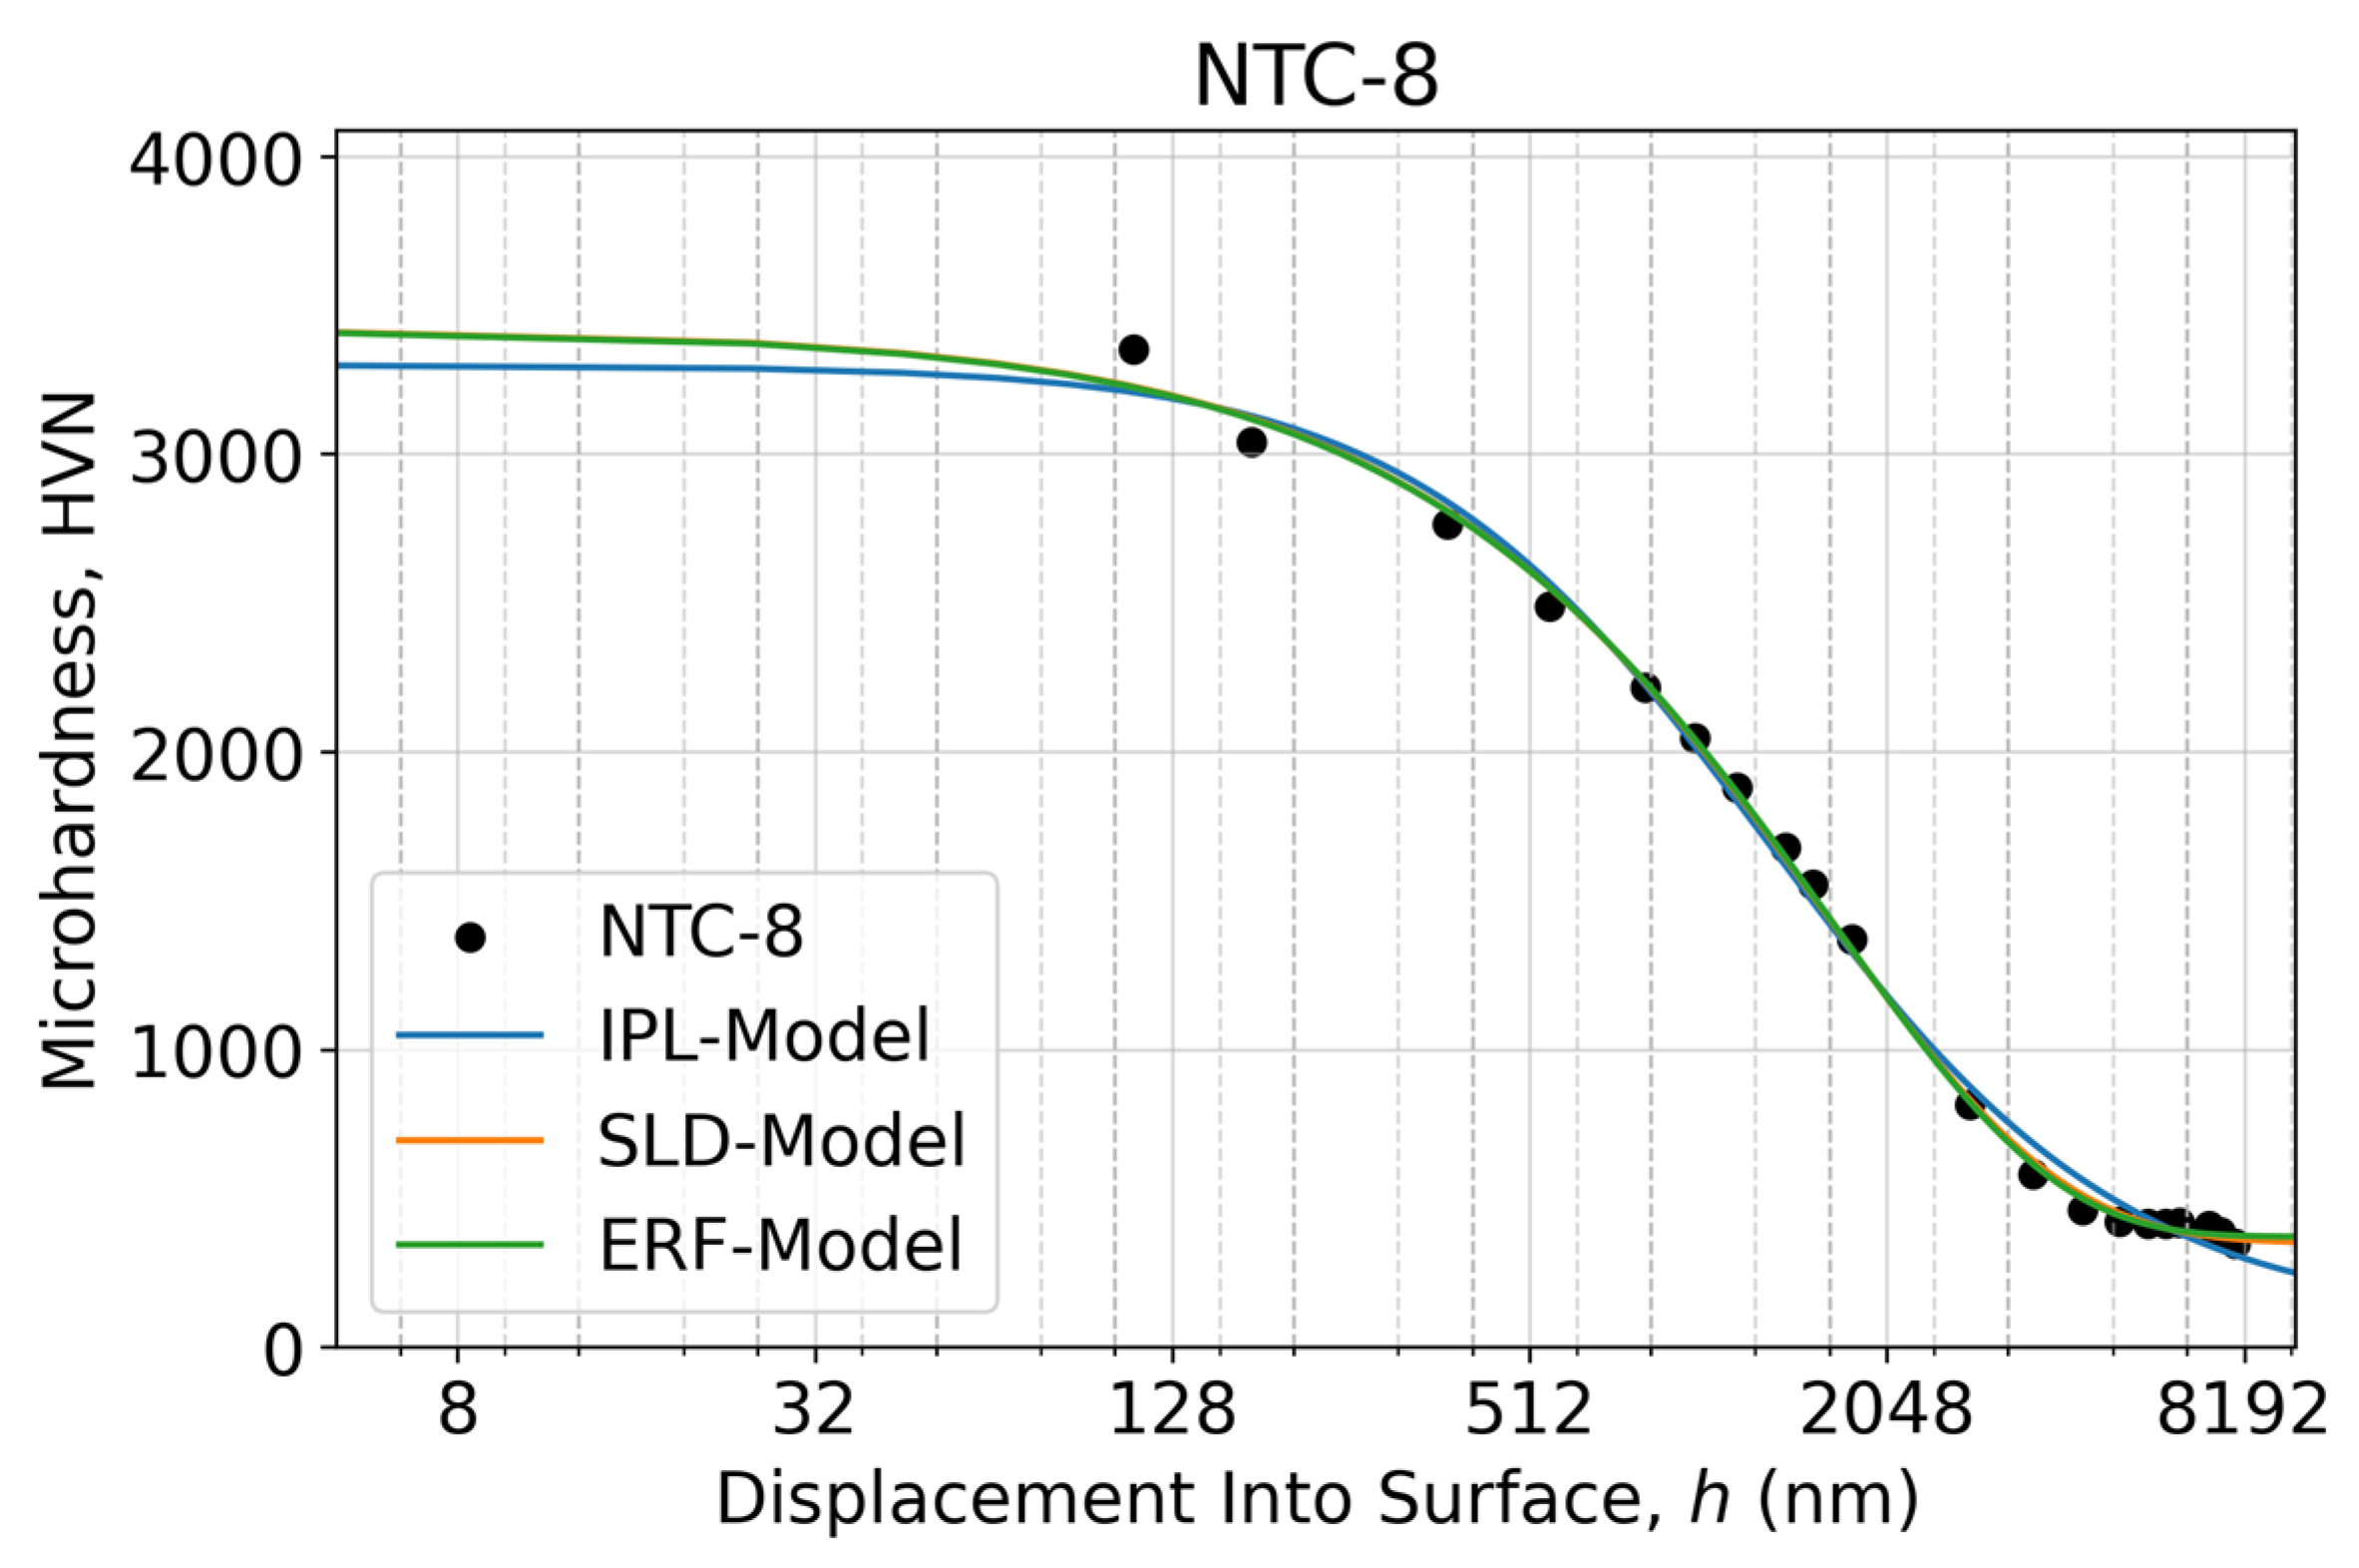
3.3. Mathematical Modelling of the Apparent Microhardness, Ha(h)

The microhardness–displacement, HVN-h, curves of the NTC film samples primarily demonstrated a negative skin effect (dH(h)/dh < 0) within a whole penetration depth range of approximately 100–8000 nm corresponding to test loads of 10–700 gf (for example, see Figure 9, Figure 10 and Figure 11). It was similar to what happens with the bulk steel substrates within the same indentation depth range; they distinctly exhibit a negative skin effect known as the indentation size effect (ISE), observed commonly for bulk crystalline materials. The measured microhardness–displacement curves for all the NTC film samples were monotonically decreasing. They did not reach a convincing broad plateau region, which could be attributed to the lower asymptotic hardness value of the film/substrate system according to the sigmoidal decay models proposed above. Therefore, the measured apparent hardness can be attributed to the convoluted hardness of the transition region of the film/substrate system.
Moreover, it is imperative to consider that at greater penetration depths, the apparent hardness of the film/substrate system will be most likely affected first of all by the elastic modulus of the underlying Ti adhesion layer (ETi = 120 GPa) and after that by the stiffer bulk steel substrate (Esteel = 190–210 GPa, Figure 3). Accordingly, the substrate’s elastic modulus first significantly impacted the apparent elastic modulus of the coated film and then intermittently impacted its apparent hardness.
It is noteworthy that when the indenter reaches a particular penetration depth, h, the indentation response is, in actuality, a result of a deformation zone roughly three times larger in depth. This extended zone is delineated by the contact radius, ac, and encompasses the interface between the core (the intensely deformed homogeneous region beneath the indenter) and the attenuating stress–strain field tail beyond the core [40]. For the present investigation involving the utilization of a sharp, three-faceted Berkovich indenter for the bulk substrate, the heavily deformed core radius beneath the indenter is approximated as ac ≈ 2.8 h. For instance, in the case of the NTC-1 sample subjected to a test load of 10 gf (100 mN), the indenter’s penetration depth reached about 500–700 nm, corresponding to a contact radius, ac, of approximately 2000 nm. Consequently, it is generally advisable to employ loads smaller than 100 mN to investigate the positive skin effect, also known as the reverse ISE. This reasoning only heightens the concern that the measured apparent microhardness of the NTC samples might be influenced not only by the strain-hardening process occurring within the core region itself but also by the interplay of the underlying adhesion layer and the elastic–plastic reverberations from the bulk substrate.
Three empirical mathematical models were used to model these processes prudently and estimate the coated film’s true predicted hardness, Hf = Ha (h = 0). Each model exhibits sigmoidal behavior approximating the indentation measurement data related to the film-dominated region at shallow indentation depths, the film/substrate governed transitional region at intermediate indentation depths, and the substrate-dominated region at large indentation depths. We show the resulting model fits of the apparent microhardness, Ha(h), of the representative samples NTC-1, NTC-5, and NTC-8, in Figure 9, Figure 10 and Figure 11, respectively, whereas the fits for the remaining samples are shown in Appendix A (Figure A1, Figure A2, Figure A3, Figure A4, Figure A5 and Figure A6). The NTC sample set of nine items can be split into three subsets depending on the alloying refractory metals, Me = Cr, Hf, Nb, W, and Zr: (i) NTC-1, NTC-2, and NTC-3 belong to those doubly alloyed with Cr, Nb, or W; (ii) NTC-4, NTC-5, and NTC-6 belong to those alloyed with Nb only; (iii) NTC-7, NTC-8, and NTC-9 belong to those alloyed with Hf only.
Table 2 summarizes the performance of the three empirical mathematical models by comparing the mean-squared errors (MSE) of the model fits (described in Section 2.4 to our microindentation testing experiments. The IPL-Model shows the smallest MSE for most of the measurement tests (six out of nine), whereas the ERF-Model has the best fit for three tests. More generally, the MSE values of the ERF-Model and SD-Models tend to be similar, suggesting that both models produce fits of similar quality.
Table 3 shows the values of the predicted true hardness, Hf, of the coated film using the IPL-Model for each of our samples, as well as the 2.5th and 97.5th percentile estimates obtained via the bootstrapping resampling technique that constitute the 95% confidence interval. Similarly, Table 4 and Table 5 characterize the Hf values estimated using the SLD and ERF models, respectively.
These results are summarized in Figure 12, which compares the predicted true hardness values, Hf, of the coated film of three empirical mathematical models. It was found that the three models are in good agreement. The difference between the maximum and minimum predicted true hardness Hf between the three models is around 6.9% across all nine samples. The best agreement between the models was shown for the NTC-5 sample, with only a 1.2% difference, where the SLD-Model estimated the maximum predicted true hardness Hf = 2106.5 HVN and the IPL-Model estimated the lowest predicted true hardness Hf= 2081.4 HVN. Meanwhile, the largest variation between the models was found for the NTC-4 sample, with a difference of 14.1%, where the ERF-Model estimated the maximum predicted true hardness Hf = 2558.1 HVN and the IPL-Model estimated the lowest predicted true hardness Hf = 2242.6 HVN. Overall, the agreement among the different models indicates a heightened level of reliability in the estimated values of predicted true hardness, Hf, of the coated film.
The 95% confidence intervals of the predicted true hardness of the three models are also largely overlapping for each sample. It was found that the IPL-Model tends to have much larger confidence intervals than the SLD-Model and ERF-Model, signifying the high sensitivity of the IPL-Model to the bootstrapping resampling technique. The sensitivity of the IPL-Model can be explained by the fact that the IPL-Model also exhibited the best model fit for most of the samples as judged via the mean-squared error (Table 2). This suggests that the IPL-Model follows the measurement data more closely than the other models. Hence, given that the bootstrapping technique perturbs the measurement data by resampling it, the IPL-Model would be expected to exhibit the highest sensitivity to the resampling of the data. Meanwhile, the confidence intervals for the SLD-Model and ERF-Model predictions tend to be narrower, signifying a more robust response to the bootstrapping resampling technique. Nonetheless, the overall agreement between the three models indicates that the true hardness estimates, Hf, of the coated film samples obtained via the proposed empirical mathematical modeling approach can be deemed reliable.

4. Conclusions

It was observed that the three distinct empirical models—namely, the inverse power-law model (IPL-Model), the sigmoid-like decay model (SLD-Model), and the error function model (ERF-Model)—were in substantial agreement. Each model demonstrates a characteristic sigmoidal behavior, defined by two distinct asymptotic domains connected by an intermediary transitional regime. The variation in the predicted true microhardness, Hf, values for the examined hard nitride/carbonitride NTC samples between the proposed models averages around 6.9% across all nine samples.
The models show the best agreement for the NTC-5 sample, with only a 1.2% difference between them. Specifically, the SLD-Model estimates the highest predicted true hardness, Hf, as 2106.5 HV, while the IPL-Model estimates the lowest predicted true hardness, Hf, as 2081.4 HV, for this sample. In contrast, the most significant variation between the models was observed for the NTC-4 sample, with a difference of 14.1%. Here, the ERF-Model predicts the highest, Hf, as 2558.1 HV, while the IPL-Model predicts the lowest, Hf, as 2242.6 HV.
Overall, the agreement between these different models indicates a high level of reliability in estimating the predicted true microhardness, Hf, of the considered NTC film samples. Additionally, the 95% confidence intervals for the predicted true hardness of the proposed models largely overlap for each sample. It is worth noting that the IPL-Model tends to have much larger confidence intervals than the SLD-Model and ERF-Model, suggesting a high sensitivity of the IPL-Model to the bootstrapping resampling technique. This sensitivity can be attributed to the fact that the IPL-Model also exhibited the best model fit for most of the samples, as assessed via the mean-squared error. The mathematical modeling of the apparent microhardness, Ha(h), with three distinct empirical models, yielded concurrent estimates of the true microhardness, Hf, of the nine examined NTC film samples representing hard nitride/carbonitride structures, with the differences of the Hf between the models being approximately 6.9%, on average, across the nine samples.

Author Contributions

Conceptualization, U.K., I.B. and E.J.; investigation, A.L., U.K., E.J., J.L. and R.S.; writing—original draft preparation, U.K. and K.K.; writing—review and editing, A.L., U.K., E.J., J.L. and I.B.; visualization, A.L., J.L. and U.K.; supervision I.B.; project administration I.B.; funding acquisition I.B. All authors have read and agreed to the published version of the manuscript.

Funding

This research was funded by the Latvian Council of Science, project “Carbon-rich self-healing multifunctional nanostructured smart coatings (NSC) for high-tech applications using high-power confined plasma technology for their deposition”, project No. 2019/1-0385.

Data Availability Statement

The data presented in this study are available on request from the corresponding author.

Acknowledgments

The authors thank B.A. Bartosz for his interest and valuable discussions, V. Kovalenko for the preparation of the samples, and K. Kundzins for SEM measurements. The authors express gratitude to Mitutoyo Poland Sp.o.o. for providing the microhardness measurement equipment used in this study.

Conflicts of Interest

Karlis Kanders was employed by the company Nesta. The remaining authors declare that the research was conducted in the absence of any commercial or financial relationships that could be construed as a potential conflict of interest.

Appendix A

Figure A1. Microindentation response as an apparent microhardness–displacement curve of the NTC-2 sample calculated using two measured diagonals of the Vickers imprints at each specified test load within the 10–700 gf range (0.098–6.86 N) in a semi-log scale. The fitted microhardness–displacement curves relevant to the proposed three sigmoidal decay models are shown as solid lines.
Lubricants 11 00501 g0a1
Figure A2. Microindentation response as an apparent microhardness–displacement curve of the NTC-3 sample calculated using two measured diagonals of the Vickers imprints at each specified test load within the 10–700 gf range (0.098–6.86 N) in a semi-log scale. The fitted microhardness–displacement curves relevant to the proposed three sigmoidal decay models are shown as solid lines.
Lubricants 11 00501 g0a2
Figure A3. Microindentation response as an apparent microhardness–displacement curve of the NTC-4 sample calculated using two measured diagonals of the Vickers imprints at each specified test load within the 10–700 gf range (0.098–6.86 N) in a semi-log scale. The fitted microhardness–displacement curves relevant to the proposed three sigmoidal decay models are shown as solid lines.
Lubricants 11 00501 g0a3
Figure A4. Microindentation response as an apparent microhardness–displacement curve of the NTC-6 sample calculated using two measured diagonals of the Vickers imprints at each specified test load within the 10–700 gf range (0.098–6.86 N) in a semi-log scale. The fitted microhardness–displacement curves relevant to the proposed three sigmoidal decay models are shown as solid lines.
Lubricants 11 00501 g0a4
Figure A5. Microindentation response as an apparent microhardness–displacement curve of the NTC-7 sample calculated using two measured diagonals of the Vickers imprints at each specified test load within the 10–700 gf range (0.098–6.86 N) in a semi-log scale. The fitted microhardness–displacement curves relevant to the proposed three sigmoidal decay models are shown as solid lines.
Lubricants 11 00501 g0a5
Figure A6. Microindentation response as an apparent microhardness–displacement curve of the NTC-9 sample calculated using two measured diagonals of the Vickers imprints at each specified test load within the 10–700 gf range (0.098–6.86 N) in a semi-log scale. The fitted microhardness–displacement curves relevant to the proposed three sigmoidal decay models are shown as solid lines.
Lubricants 11 00501 g0a6

References

  1. Zhang, S.; Sun, D.; Fu, Y.; Du, H. Recent Advances of Superhard Nanocomposite Coatings: A Review. Surf. Coat. Technol. 2003, 167, 113–119. [Google Scholar] [CrossRef]
  2. Musil, J. Hard and Superhard Nanocomposite Coatings. Surf. Coat. Technol. 2000, 125, 322–330. [Google Scholar] [CrossRef]
  3. Musil, J.; Vlček, J. Magnetron Sputtering of Hard Nanocomposite Coatings and Their Properties. Surf. Coat. Technol. 2001, 142–144, 557–566. [Google Scholar] [CrossRef]
  4. Chang, Y.Y.; Lai, H.M. Wear Behavior and Cutting Performance of CrAlSiN and TiAlSiN Hard Coatings on Cemented Carbide Cutting Tools for Ti Alloys. Surf. Coat. Technol. 2014, 259, 152–158. [Google Scholar] [CrossRef]
  5. Miletić, A.; Panjan, P.; Škorić, B.; Čekada, M.; Dražič, G.; Kovač, J. Microstructure and Mechanical Properties of Nanostructured Ti–Al–Si–N Coatings Deposited by Magnetron Sputtering. Surf. Coat. Technol. 2014, 241, 105–111. [Google Scholar] [CrossRef]
  6. Farooq, S.A.; Raina, A.; Mohan, S.; Singh, R.A.; Jayalakshmi, S.; Haq, M.I.U. Nanostructured Coatings: Review on Processing Techniques, Corrosion Behaviour and Tribological Performance. Nanomaterials 2022, 12, 1323. [Google Scholar] [CrossRef] [PubMed]
  7. Bazhin, P.M.; Kostitsyna, E.V.; Stolin, A.M.; Chizhikov, A.M.; Bychkova, M.Y.; Pazniak, A. Nanostructured Ceramic Composite Rods: Synthesis, Properties and Application. Ceram. Int. 2019, 45, 9297–9301. [Google Scholar] [CrossRef]
  8. Wu, W.Y.; Ting, J.M. Growth and Characteristics of Metal-Containing Diamond-like Carbon Using a Self-Assembled Process. Carbon N. Y. 2006, 44, 1210–1217. [Google Scholar] [CrossRef]
  9. Persson, K.; Gåhlin, R. Tribological Performance of a DLC Coating in Combination with Water-Based Lubricants. Tribol. Int. 2003, 36, 851–855. [Google Scholar] [CrossRef]
  10. Maniks, J.; Mitin, V.; Kanders, U.; Kovalenko, V.; Nazarovs, P.; Baitimirova, M.; Meija, R.; Zabels, R.; Kundzins, K.; Erts, D. Deformation Behavior and Interfacial Sliding in Carbon/Copper Nanocomposite Films Deposited by High Power DC Magnetron Sputtering. Surf. Coat. Technol. 2015, 276, 279–285. [Google Scholar] [CrossRef]
  11. Das, J.; Linke, B. Evaluation and Systematic Selection of Significant Multi-Scale Surface Roughness Parameters (SRPs) as Process Monitoring Index. J. Mater. Process. Technol. 2017, 244, 157–165. [Google Scholar] [CrossRef]
  12. Pogrebnjak, A.; Smyrnova, K.; Bondar, O. Nanocomposite Multilayer Binary Nitride Coatings Based on Transition and Refractory Metals: Structure and Properties. Coatings 2019, 9, 155. [Google Scholar] [CrossRef]
  13. Kanders, U.; Lungevics, J.; Leitans, A.; Boiko, I.; Berzins, K.; Trubina, Z. Nanostructured TiAlSi-CN:Me/a-CN:Si3N4 Composite Coatings Deposited by Advanced PVD Technique. Solid State Phenom. 2021, 320, 37–42. [Google Scholar] [CrossRef]
  14. Das, P.; Anwar, S.; Bajpai, S.; Anwar, S. Structural and Mechanical Evolution of TiAlSiN Nanocomposite Coating under Influence of Si3N4 Power. Surf. Coat. Technol. 2016, 307, 676–682. [Google Scholar] [CrossRef]
  15. Liu, Y.; Yu, S.; Shi, Q.; Ge, X.; Wang, W. Multilayer Coatings for Tribology: A Mini Review. Nanomater 2022, 12, 1388. [Google Scholar] [CrossRef]
  16. Leitans, A.; Jansons, E.; Lungevics, J.; Kundzins, K.; Boiko, I.; Kanders, U.; Kovalenko, V.; Linins, O. Tribological and Micromechanical Properties of the Nanostructured Carbonitride/Nitride Coatings of Transition Metals Alloyed by Hf and Nb. Coatings 2023, 13, 552. [Google Scholar] [CrossRef]
  17. Plichta, T.; Zahradnicek, R.; Cech, V. Surface Topography Affects the Nanoindentation Data. Thin Solid Films 2022, 745, 139105. [Google Scholar] [CrossRef]
  18. Kulej, E.; Kucharska, B.; Pyka, G.; Gwoździk, M. Characterization of the Surface Topography and Nano-Hardness of Cu/Ni Multilayer Structures. Cent. Eur. J. Phys. 2011, 9, 1421–1425. [Google Scholar] [CrossRef]
  19. Wei, Z.; Zhang, G.; Chen, H.; Luo, J.; Liu, R.; Guo, S. A Simple Method for Evaluating Elastic Modulus of Thin Films by Nanoindentation. J. Mater. Res. 2009, 24, 801–815. [Google Scholar] [CrossRef]
  20. Korsunsky, A.M.; McGurk, M.R.; Bull, S.J.; Page, T.F. On the Hardness of Coated Systems. Surf. Coat. Technol. 1998, 99, 171–183. [Google Scholar] [CrossRef]
  21. Iost, A.; Guillemot, G.; Rudermann, Y.; Bigerelle, M. A Comparison of Models for Predicting the True Hardness of Thin Films. Thin Solid Films 2012, 524, 229–237. [Google Scholar] [CrossRef]
  22. Doerner, M.F.; Nix, W.D. A Method for Interpreting the Data from Depth-Sensing Indentation Instruments. J. Mater. Res. 1986, 1, 601–609. [Google Scholar] [CrossRef]
  23. King, R.B. Elastic Analysis of Some Punch Problems for a Layered Medium. Int. J. Solids Struct. 1987, 23, 1657–1664. [Google Scholar] [CrossRef]
  24. Tuck, J.R.; Korsunsky, A.M.; Bhat, D.G.; Bull, S.J. Indentation Hardness Evaluation of Cathodic Arc Deposited Thin Hard Coatings. Surf. Coat. Technol. 2001, 139, 63–74. [Google Scholar] [CrossRef]
  25. Saha, R.; Nix, W.D. Effects of the Substrate on the Determination of Thin Film Mechanical Properties by Nanoindentation. Acta Mater. 2002, 50, 23–38. [Google Scholar] [CrossRef]
  26. Menčík, J.; Munz, D.; Quandt, E.; Weppelmann, E.R.; Swain, M.V. Determination of Elastic Modulus of Thin Layers Using Nanoindentation. J. Mater. Res. 1997, 12, 2475–2484. [Google Scholar] [CrossRef]
  27. Jansons, E.; Lungevics, J.; Kanders, U.; Leitans, A.; Civcisa, G.; Linins, O.; Kundzins, K.; Boiko, I. Tribological and Mechanical Properties of the Nanostructured Superlattice Coatings with Respect to Surface Texture. Lubricants 2022, 10, 285. [Google Scholar] [CrossRef]
  28. 6507-2:2018; Metallic materials—Vickers hardness test—Part 2: Verification and calibration of testing machines. International Organization for Standardization: Geneva, Switzerland, 2018.
  29. Oliver, W.C.; Pharr, G.M. Measurement of Hardness and Elastic Modulus by Instrumented Indentation: Advances in Understanding and Refinements to Methodology. J. Mater. Res. 2004, 19, 3–20. [Google Scholar] [CrossRef]
  30. Virtanen, P.; Gommers, R.; Oliphant, T.E.; Haberland, M.; Reddy, T.; Cournapeau, D.; Burovski, E.; Peterson, P.; Weckesser, W.; Bright, J.; et al. SciPy 1.0: Fundamental Algorithms for Scientific Computing in Python. Nat. Methods 2020, 17, 261–272. [Google Scholar] [CrossRef]
  31. Efron, B.; Tibshirani, R.J. An Introduction to the Bootstrap. Teach. Stat. 1994, 23, 49–54. [Google Scholar] [CrossRef]
  32. Sneddon, I.N. The Relation between Load and Penetration in the Axisymmetric Boussinesq Problem for a Punch of Arbitrary Profile. Int. J. Eng. Sci. 1965, 3, 47–57. [Google Scholar] [CrossRef]
  33. Attaf, M.T. Connection between the Loading Curve Models in Elastoplastic Indentation. Mater. Lett. 2004, 58, 3491–3498. [Google Scholar] [CrossRef]
  34. Petrík, J.; Blaško, P.; Mihaliková, M.; Mikloš, V. The Relationship between the Deformation and the Indentation Size Effect (ISE). J. Appl. Res. Technol. 2018, 16, 267–275. [Google Scholar] [CrossRef]
  35. Broitman, E. Indentation Hardness Measurements at Macro-, Micro-, and Nanoscale: A Critical Overview. Tribol. Lett. 2017, 65, 23. [Google Scholar] [CrossRef]
  36. Chen, K.S.; Chen, T.C.; Ou, K.S. Development of Semi-Empirical Formulation for Extracting Materials Properties from Nanoindentation Measurements: Residual Stresses, Substrate Effect, and Creep. Thin Solid Films 2008, 516, 1931–1940. [Google Scholar] [CrossRef]
  37. Tayebi, N.; Polycarpou, A.A.; Conry, T.F. Effects of Substrate on Determination of Hardness of Thin Fillms by Nanoscratch and Nanoindentation Techniques. J. Mater. Res. 2004, 19, 1791–1802. [Google Scholar] [CrossRef]
  38. Chen, Y.; Guo, T.; Wang, J.; Pang, X.; Qiao, L. Effects of Orientation on Microstructure and Mechanical Properties of TiN/AlN Superlattice Films. Scr. Mater. 2021, 201, 113951. [Google Scholar] [CrossRef]
  39. Hahn, R.; Bartosik, M.; Soler, R.; Kirchlechner, C.; Dehm, G.; Mayrhofer, P.H. Superlattice Effect for Enhanced Fracture Toughness of Hard Coatings. Scr. Mater. 2016, 124, 67–70. [Google Scholar] [CrossRef]
  40. Johnson, K.L. Contact Mechanics; Cambridge University Press: Cambridge, UK, 1985. [Google Scholar] [CrossRef]
Figure 1. Microindentation hardness testing matrix of 10 measurements at each applied load, P (gf), within the load interval [10, 600] in gram-force units, gf [16]. The applied test load increment was 10 gf within the load interval [10, 100], and 50 gf within the load interval [100, 600]. Imprints’ spacing within the testing matrix in the XY plane was 300 µm to avoid any mutual impact of neighboring imprints. For each test load value, 10 imprints were performed.
Lubricants 11 00501 g001
Figure 2. Nanoindentation response as a nanohardness–displacement, H-h, curve and an elastic modulus–displacement, E-h, curve of the 100Cr6 steel substrate of the NTC-4 sample in semi-log scale plot, measured after the PVD process and calculated via the Oliver–Pharr method [29].
Lubricants 11 00501 g002
Figure 3. Nanoindentation response as a nanohardness–displacement, H-h, curve and an elastic modulus–displacement, E-h, curve of the 100Cr6 steel substrate of the NTC-4 sample in semi-log scale plot, measured before the PVD process and calculated via the Oliver–Pharr method [29].
Lubricants 11 00501 g003
Figure 4. Microindentation responses as load–displacement, P-h, curves of the NTC-1, NTC-2, NTC-3, NTC-5, NTC-6, and NTC-7 samples on the hard-annealed-bearing 100Cr6 steel substrates in a log–log scale plot to demonstrate Meyer’s well-known power-law [33].
Lubricants 11 00501 g004
Figure 5. Microindentation responses as load–displacement, P-h, curves of the NTC-4, NTC-8, and NTC-9 samples on the soft-annealed-bearing100Cr6 steel substrate in a log – log scale plot to demonstrate Meyer’s well-known power-law [33].
Lubricants 11 00501 g005
Figure 6. Microindentation response as apparent hardness–displacement, H-h, curves of the NTC-1, NTC-2, NTC-3, NTC-5, NTC-6, and NTC-7 samples on the hard-annealed-bearing 100Cr6 steel substrate in a semi-log scale plot.
Lubricants 11 00501 g006
Figure 7. Microindentation response as apparent hardness–displacement, H-h, curves of the NTC-4, NTC-8, and NTC-9 samples on the soft-annealed-bearing 100Cr6 steel substrate in a semi-log scale plot.
Lubricants 11 00501 g007
Figure 8. Microindentation response as apparent hardness–displacement, H-h, curves of the NTC-7 sample deposited on the hard-annealed-bearing 100Cr6 steel substrate, and NTC-8 and NTC-9 samples deposited on the soft-annealed-bearing steel 100Cr6 substrate in a semi-log scale plot.
Lubricants 11 00501 g008
Figure 9. Microindentation response as an apparent microhardness–displacement curve of the NTC-1 sample calculated using two measured diagonals of the Vickers imprints at each specified test load within the 10–700 gf range (0.098–6.86 N) in a semi-log scale. The fitted microhardness–displacement curves relevant to the proposed three sigmoidal decay models are shown as solid lines.
Lubricants 11 00501 g009
Figure 10. Microindentation response as an apparent microhardness–displacement curve of the NTC-5 sample calculated using two measured diagonals of the Vickers imprints at each specified test load within the 10–700 gf range (0.098–6.86 N) in a semi-log scale. The fitted microhardness–displacement curves relevant to the proposed three sigmoidal decay models are shown as solid lines.
Lubricants 11 00501 g010
Figure 11. Microindentation response as an apparent microhardness–displacement curve of the NTC-8 sample calculated using two measured diagonals of the Vickers imprints at each specified test load within the 10–700 gf range (0.098–6.86 N) in a semi-log scale. The fitted microhardness–displacement curves relevant to the proposed three sigmoidal decay models are shown as solid lines.
Lubricants 11 00501 g011
Figure 12. Determination of the robustness of the predicted true hardness, Hf, of the coated film. The markers denote the predicted true hardness, Hf, of the coated film using three different empirical mathematical models. The bars denote the range between the 2.5th and 97.5th percentile estimates obtained via the bootstrapping resampling technique, constituting the 95% confidence interval of the predicted true hardness.
Lubricants 11 00501 g012
Table 1. Overview of the micromechanical and tribological properties of the NTC samples.
Sample
Label
Coating’s
Bilayered
Substructure 1
Coating
Thickness,
t (nm) 2
Indentation
Depth, h (nm)
at 100 gf 3
Microhardness,
HVN
at 100 gf 4
NTC-1{TiAlSiZr-N/W-CN}6200 ± 3151720 ± 1371244 ± 103
NTC-2{TiAlSiNb-N/Ti-CN}5400 ± 2701652 ± 1321355 ± 109
NTC-3{TiAlSiCr-N/Si-CN}5060 ± 2501731 ± 1381228 ± 98
NTC-4{TiAlSi-N/TiNb-CN}4100 ± 1902509 ±201586 ± 47
NTC-5{TiAlSi-N/TiNb-CN}3300 ± 1601880 ± 1501131 ± 91
NTC-6{TiAlSi-N/TiNb-CN}2200 ± 1101930 ± 1541777 ± 142
NTC-7{TiAlSi-N/TiHf-CN}4700 ± 1301540 ± 1231861 ± 149
NTC-8{TiAlSi-N/TiHf-CN}6200 ± 3151783 ± 1421371 ± 110
NTC-9{TiAlSi-N/TiHf-CN}6100 ± 3001937 ± 1541294 ± 104
1 Chemical composition of the bilayered structure of the NTC superlattice was stated according to the MSD-MST configuration used in the relevant PVD process. 2 A Calo tester (CSM Instruments, Peseux, Switzerland) and digital microscope KH-7700 (Hirox, Tokyo, Japan) were used to measure the thickness of the deposited coatings. 3 Indentation depth, h, was calculated using two measured diagonals of the Vickers imprints at the 100 gf (0.98 N) test load. 4 Vickers hardness number (HVN in kgf/mm2 units) was calculated using two measured diagonals of the Vickers imprints at the 100 gf (0.98 N) test load.
Table 2. Mean-squared error for each sample and the empirical mathematical model’s fit 1.
SampleIPL-ModelSLD-ModelERF-Model
NTC-1107.9248.4284.2
NTC-2393.5398.3425.9
NTC-3130.9453.8531.3
NTC-45891753.62250.6
NTC-585.6177.5201.4
NTC-6135.268.664.8
NTC-71106.31373.31392.8
NTC-84529.31991.51810.9
NTC-93886.21780.51619.1
1 The model with the smallest mean-squared error is highlighted in bold for each NTC sample.
Table 3. Predicted true hardness, Hf, of the coated film using the IPL-Model, and the 2.5th and 97.5th percentile estimates obtained via the bootstrapping resampling technique.
SampleHf (HVN)Hf2.5 (HVN)Hf97.5 (HVN)
NTC-12397.421294848.3
NTC-22462.72192.92898.9
NTC-32738.82262.34650
NTC-42242.62198.83773.1
NTC-52081.41925.63612
NTC-62029.71716.42143
NTC-73137.22997.74635.3
NTC-832972821.13490.9
NTC-93162.42523.93403.5
Table 4. Predicted true hardness, Hf, of the coated film using the SLD-Model, and the 2.5th and 97.5th percentile estimates obtained via the bootstrapping resampling technique.
SampleHf (HVN)Hf2.5 (HVN)Hf97.5 (HVN)
NTC-12378.92235.12431.7
NTC-22617.52501.12683.2
NTC-325872334.82669.8
NTC-42479.22337.64322.7
NTC-52106.51990.62147.8
NTC-62303.32050.62363.2
NTC-73408.13230.43650.5
NTC-83418.13075.13553
NTC-933242924.53458.4
Table 5. Predicted true hardness, Hf, of the coated film using the ERF-Model, and the 2.5th and 97.5th percentile estimates obtained via the bootstrapping resampling technique.
SampleHf (HVN)Hf2.5 (HVN)Hf97.5 (HVN)
NTC-12357.52213.82418.3
NTC-22601.22478.62664.6
NTC-32558.12303.42652.4
NTC-425592343.24146.2
NTC-52092.31956.52131.4
NTC-62314.12120.62341.8
NTC-73421.73254.73603.2
NTC-83413.23144.33545.7
NTC-933133039.63450.3
Disclaimer/Publisher’s Note: The statements, opinions and data contained in all publications are solely those of the individual author(s) and contributor(s) and not of MDPI and/or the editor(s). MDPI and/or the editor(s) disclaim responsibility for any injury to people or property resulting from any ideas, methods, instructions or products referred to in the content.

