Article

Activated Carbon Nano-Particles from Recycled Polymers Waste as a Novel Nano-Additive to Grease Lubrication

by
Mohamed G. A. Nassef
1,2,*,
Hassan Shokry Hassan
3,4,
Galal A. Nassef
2,
Belal Galal Nassef
2,5,
Mina Soliman
6 and
Marwa F. Elkady
7,8
1
Industrial and Manufacturing Engineering Department, Egypt-Japan University of Science and Technology, New Borg El-Arab City 21934, Egypt
2
Production Engineering Department, Alexandria University, Alexandria 21544, Egypt
3
Environmental Engineering Department, Egypt-Japan University of Science and Technology, New Borg El-Arab City 21934, Egypt
4
Electronic Materials Research Department, Advanced Technology and New Materials Research Institute, City of Scientific Research and Technological Applications (SRTA-City), Alexandria 21934, Egypt
5
Materials Science and Engineering Department, Egypt-Japan University of Science and Technology, New Borg El-Arab City 21934, Egypt
6
Atlasco Egypt Company, 1st Industrial Zone, El-Obour 11828, Egypt
7
Chemical and Petrochemical Engineering Department, Egypt-Japan University of Science and Technology (E-JUST), New Borg El-Arab City 21934, Egypt
8
Fabrication Technology Department, Advanced Technology and New Materials Research Institute (ATNMRI), City of Scientific Research and Technological Applications (SRTA-City), New Borg El-Arab City 21934, Egypt
*
Author to whom correspondence should be addressed.
Lubricants 2022, 10(9), 214; https://doi.org/10.3390/lubricants10090214
Submission received: 12 August 2022 / Revised: 26 August 2022 / Accepted: 3 September 2022 / Published: 6 September 2022
(This article belongs to the Special Issue Advances in Novel Lubricant Additives)

Abstract

:
A worldwide growing trend is dedicated towards reducing carbon dioxide emissions from mechanical systems in different industries. One key factor under focus of research is to decrease energy losses in rotating machinery during operation by improving lubrication performance. This paper presents a novel grease nano-additive using activated carbon (AC) as a byproduct from recycled polymer waste. Five different concentrations of AC nanoparticles (ACNPs) are added to lithium grease to obtain blends containing 0.025 wt.%, 0.05 wt.%, 0.1 wt.%, 0.5 wt.%, and 1 wt.%. The tribological assessment of blends has been performed using a four-ball wear test and load carrying capacity test. The obtained results for blends are compared to samples of base grease and to blends with 2 wt.% reduced graphene oxide (rGO). Test results showed a remarkable enhancement of load carrying capacity of AC samples by 20–30% as compared to base grease. By observing wear scar in rolling elements, the ACNPs lowered the average wear scar diameter (WSD) for all samples by 30–36%. Base grease samples showed the highest coefficient of friction (COF) values between 0.15 and 0.17. These values are reduced to 0.03 and 0.06 for grease with ACNPs reaching their minimum in the case of 1 wt.% AC. These outcomes are found consistent with the enhancements in driving power saving values. The results proved the competitiveness and suitability of the AC as a recycled waste and nano-additive for improving the tribological performance of grease lubrication.

Graphical Abstract

1. Introduction

Mechanical wear and friction have proven to be one of the major causes of mechanical failure along with its impact on the energy consumption [1,2]. It was reported that around 30% of the energy consumption worldwide is exerted in tribological contacts [2] and 33% of the fuel energy in transportation vehicles is dissipated in friction [3]. Another statistic implied that wear contributes to about 80% of mechanical failures [4]. One key factor to enhance the efficiency of the machinery components is to improve the lubricating characteristics inside these components using efficient lubricants. The aim is to increase the durability of the component itself and reduce the emissions of the dangerous gases by minimizing the energy consumed in friction [5].
Over the past decades, research attempts have been recorded in the development of lubricant properties in order to enhance the efficiency of machinery components, increase the component service life, and reduce maintenance costs [6]. This development is achieved by adding different additives such as anti-corrosion, anti-wear, anti-friction, and extreme pressure, which greatly influence the lubricant properties, especially in friction and wear reduction [7,8]. However, these additives have several limitations, such as poor solubility in oil, corrosion of some metallic additives (such as copper and lead), and a significant increase in the percentages of harmful phosphorous and/or sulfur in the lubricant [6,9]. Therefore, the industry is still in need of environmentally friendly lubricant additives, which can enhance the overall lubricant performance without any detrimental side effects.
Recently, applying carbonaceous nanomaterials, such as carbon nanotubes (CNTs), graphene, and graphene oxide (GO) to the lubricating grease has been pro-posed as a new trend to achieve a significant improvement in grease properties [10,11,12,13,14,15]. These nanomaterials have the ability to enhance the load-carrying capacity, decrease friction and wear between the mating parts [16,17,18], and impart new chemical, mechanical, and physical properties to grease [19]. Previous investigations have demonstrated the positive effect of multiwall carbon nanotubes (MWCNTs) on the tribological behavior of lithium-based grease. Adding 0.3 wt.% of MWCNTs has been found to improve the friction coefficient by about 26% [20]. Another investigation showed that adding up to 0.5 wt.% reduces the friction coefficient by 42% [21]. In addition, Mohamed et al. [12] studied different additions of carbon nanotubes in lithium-based grease using a four-ball tester. The addition of 1 wt.% CNTs has been found to reduce the friction coefficient by about 82% and improved the load carrying capacity by 52%.
An experimental study was conducted by Pape et al. [22] tested the application of 1 wt.% graphene at different thicknesses as a dry lubricant and as an additive to grease for angular contact ball bearings. Frictional torque values showed a significant drop to about one-fifth in the case of adding 6–8 nm thick graphene. Another investigation was conducted by Nassef et al. [23], adding different weight percentages of graphene to grease and applying the obtained mixtures to a single row deep groove ball bearing type with double shielding (6006 zz). During a running test using a customized setup, it was found that the consumed power levels fell by about 70% when adding 2 wt.% graphene to grease. Moreover, the vibration levels showed the largest decrease of about 17% when applying 1 wt.% graphene as an additive to grease to the bearing surface.
Activated carbon nanoparticles (ACNPs) extracted from bamboo was introduced as a nano-additive to organic cutting fluids by Talib et al. [24] for machining operations. It is found that the overall machining behavior has been enhanced after adding ACNPs. Also, 0.025 wt.% ACNPs was the optimum concentration, which reduced the friction coefficient and wear scar diameter by 67% and 47%, respectively.
Polyethylene terephthalate (PET) is the third-largest non-fiber plastic, constituting up to 10% of total plastic production [25]. Besides, its one-time use tends to accumulate large amounts in municipal waste [26]. Polyethylene terephthalate (PET) contains pre-dominantly carbon and some amount of hydrogen [27]. PET contains an insignificant amount of impurities, making it an excellent candidate for numerous recycling, especially for producing activated carbon. Consequently, as a green and sustainable solution to environmental problems caused by waste plastics, PET plastic waste is selected in this work as a cheap feedstock for activated carbon nano-particles production. The economical synthesized nano-activated carbon will be evaluated in a first investigation as a cost effective and environment friendly carbonaceous nano-additive to grease due to its high surface area and porosity.
However, there is no published research work conducted on applying this promising nanomaterial especially extracted from plastic waste as a nano-additive in the lubricating grease. Thus, this paper introduces for the first time the cost-efficient AC-NPs extracted from plastic waste as a lubricant nano-additive to lithium grease. The proposed carbonaceous additive derived from recycled polymeric (PET) plastic waste represents an eco-friendly solution and a potential candidate to enhance energy efficiency of rotating machinery components. The tribological properties of grease blended with five different weight percentages of ACNPs are to be investigated to determine the coefficient of friction, wear scar diameter, and load carrying capacity. Results from tests are to be compared with properties of equivalent but costly carbonaceous materials such as graphene as well as base grease (without additives).

2. Materials and Methods

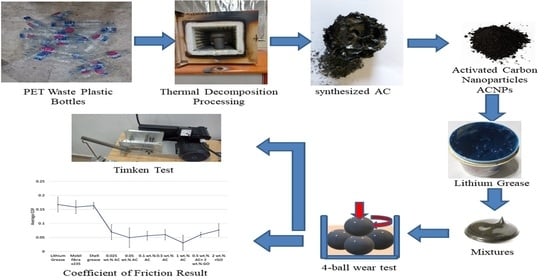
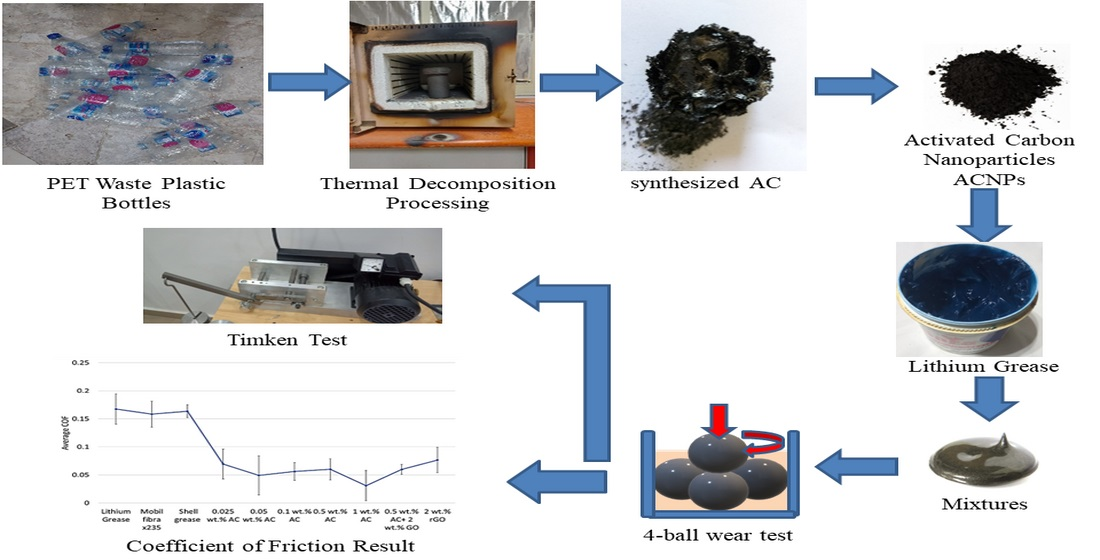
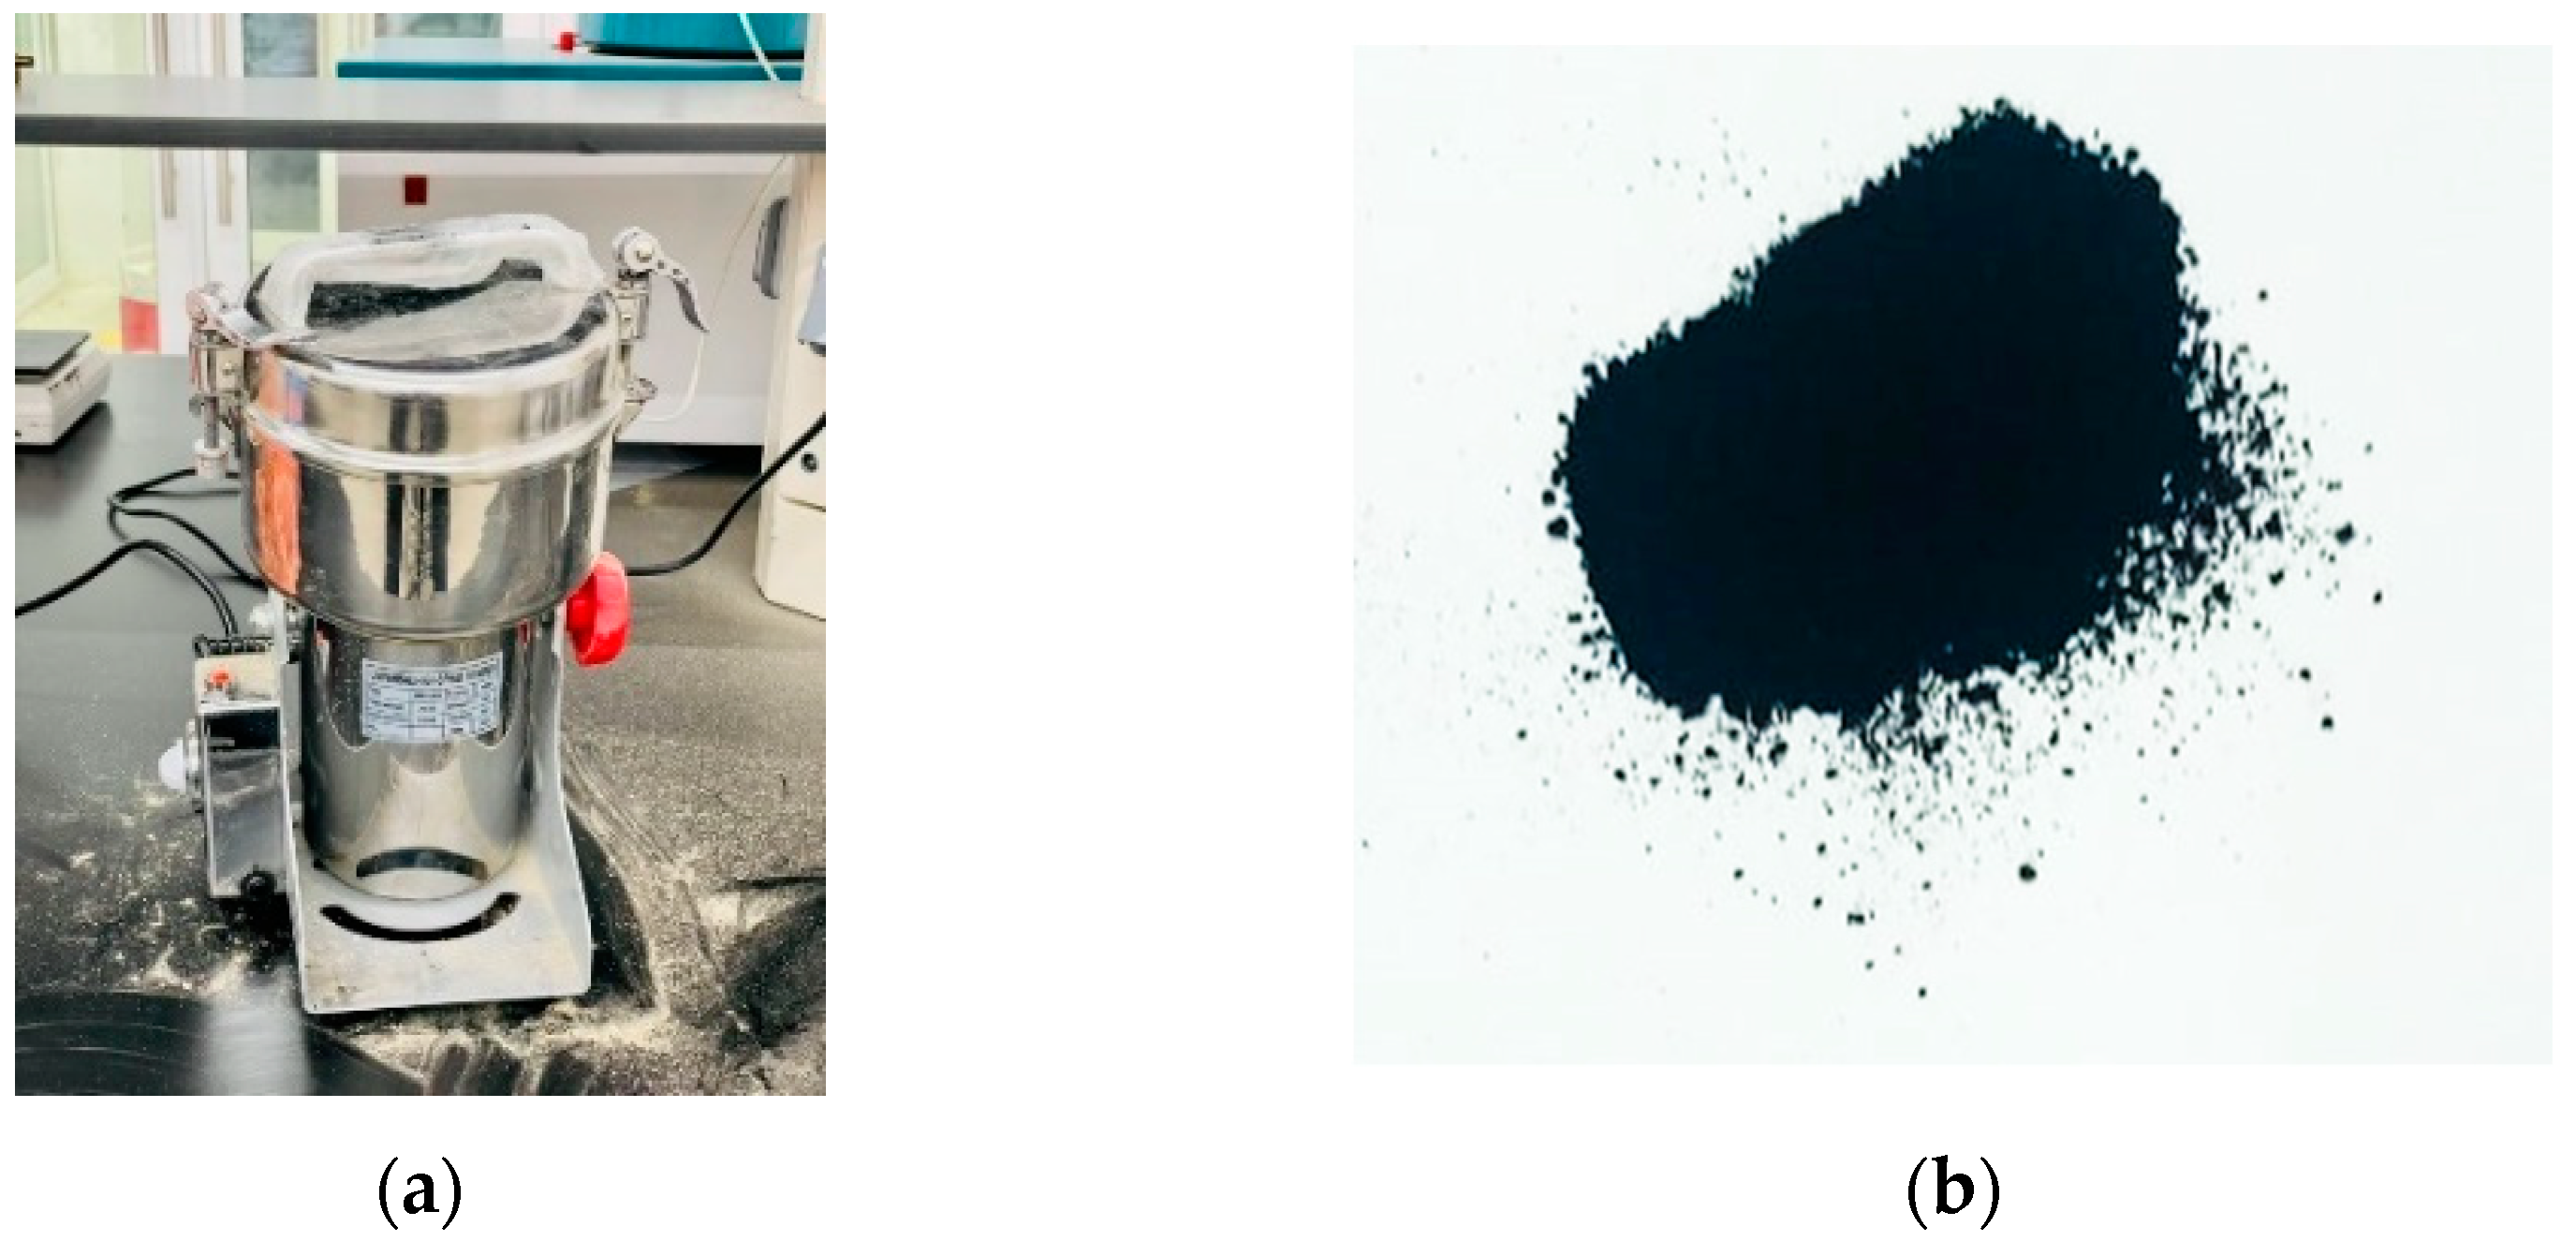
2.1. Synthesis of Activated Carbon (AC) from Waste Plastic

The plastic bottle waste from polyethylene terephthalate (PET) material is fully washed with distilled water to remove any residuals, sun-dried and then shredded. Hence, 25 g of the clean and shredded plastic is then introduced into a 1000 mL stainless steel autoclave, tightly sealed, and then placed in an electric muffle furnace (ASH AMF 25N).
The thermal decomposition stage is reached with a heating rate of 25 °C min−1, and the temperature is adjusted to 500 °C for one hour. The system is later left to cool over-night. The synthetic AC is collected and milled using Electric Grain Spices Multifunctional grinder (ST3-E4842UK), England, for 10 min to sizes below 0.09 µm, as shown in Figure 1.

2.2. Characterization of the Synthetic AC

The surface morphological structure of the prepared AC is studied using scanning electron microscopy (SEM) (JEOL, JSM-6010LV, Akishima, Tokyo, Japan). Transmission electron microscopy (TEM) integrated with energy dispersion X-ray spectroscopy (EDX) (JEOL, JEM-2100F, Akishima, Tokyo, Japan) is used to obtain high resolution micrographs and elemental composition of the AC product. The surface area of the prepared AC nano-powder is determined following the Brunauer–Emmett–Teller (BET) method at −200 °C (Belsorbmini II, BEl Inc., Osaka, Japan).
The physical properties of the prepared AC nano-powder are investigated by X-ray diffractometer (XRD) patterns using Shimadzu 7000 Diffractometer operating with Cu Kα1 radiation (k = 0.15406 nm) generated at 30 kV and 30 mA with a scan rate of 2° min−1 for 2 theta values ranged between 20° and 80°. FTIR spectra identifies the surface functional groups of the prepared AC nano-powder (Shimadzu FTIR-8400 S, Nakagyo-ku, Kyoto, Japan) over the wavelength range of 400–4000 cm−1.

2.3. Characterization of the rGO

Graphene is purchased from NanoGate Company, Egypt in the form of Nano-sheets, which was prepared using the wet chemistry technique (Modified Hammer’s method) [28,29]. The method of graphene characterization is classified into four categories based on common techniques, such as TEM, XRD, FTIR, and Raman spectroscopy (WITec alpha 300 R confocal Raman microscope, Germany). The first technique is responsible for obtaining information about the number of graphene layers and its shape. The preparation of the TEM sample is conducted by immersing the graphene sample in ethanol. After 5 min of sonication, a sample of 5 µm is deposited using the drop-casting technique onto a suitable carbon-copper grid. XRD is the most common and reliable way to discuss the average grain size, interlayer spacing, and crystallinity percentage of graphene Nano-sheets, and it was adopted to characterize graphene using a wavelength of 0.154 nm related to Cu-Kα1 radiation under 40 KeV and 30 mA.
Furthermore, the quality of graphene Nano-sheets is confirmed using FTIR operated with a wavenumber ranging from 400–4000 cm−1, which can reveal the graphene sample’s function groups. Another way to ensure TEM results and analyze structural deficiencies is achieved through using Raman spectroscopy. The Raman analysis exposes the sample to a 532 nm laser to be excited under 3 mW power at room temperature. Finally, five accumulations and 20 s detector time were used to collect the resulting spectrum.

2.4. Type of Used Grease

In this work, commercial lithium grease (ABRO heavy duty super blue) is used for preparing the test samples: base grase (without nano-additives), grease with 0.025 wt.% AC, 0.05 wt.% AC, 0.1 wt.% AC, 0.5 wt.% AC, 1 wt.% AC. Grease samples with 2 wt.% rGO and hybrid additives 0.5 wt.%AC + 2 wt.% rGo are used for comparison. The lithium grease can operate at temperatures up to 200 °C with base oil viscosity of 14 cSt at 100 °C.
Two other types of grease samples (without nano-additives) are used for comparison; Shell Gadus S5 v100 2 grease and Mobil fibrax 235. Shell grease is lithium-complex grease containing antioxidants, extreme pressure (EP), wear and rust preventing additives used for high-speed rolling bearings. Its dropping point is around (260 °C) and it can operate at temperatures up to 200 °C with base oil viscosity of 14 cSt at 100 °C. Mobil fibrax235 is sodium soap grease with a fibrous structure applied for heavy industry machinery. It has a high dropping point (170 °C) and good shear stability. It can generally operate at temperatures up to 120 °C with base oil viscosity of 20 cSt at 100 °C.

2.5. Four Ball Wear Test

Wear prevention characteristics and coefficient of friction (COF) are determined for each test lubricant aggregate using the 4-Ball Wear Tester according to ASTM 2266 and ASTM 5183, respectively. In the wear test, the system is preheated to 75 ± 2 °C and then the upper ball (placed in ball chuck) is set to rotate at a constant speed of 1200 ± 60 rpm while pressing against three lubricant covered stationary balls inside ball cup using 40 kg load for 60 min ± 1 min. The wear scar diameter (WSD) of each test ball is examined using stereo optical microscope (Zeiss Company, Jena, Germany) with magnification 100× to determine the average WSD for the lubricant blend.
According to ASTM D5183, the load is increased by 10 kg for time interval of 10 min up to the point at which seizure takes place. The operating conditions ensure continuous sliding mode in boundary lubrication condition. The values of the coefficient of friction (COF) are determined for each 10-min time interval according to the formula in ASTM D5183 using information concerning the applied torque, friction load, applied weight value, and a normalization factor. To ensure good repeatability of results, tests were repeated three times for each test lubricant blend.

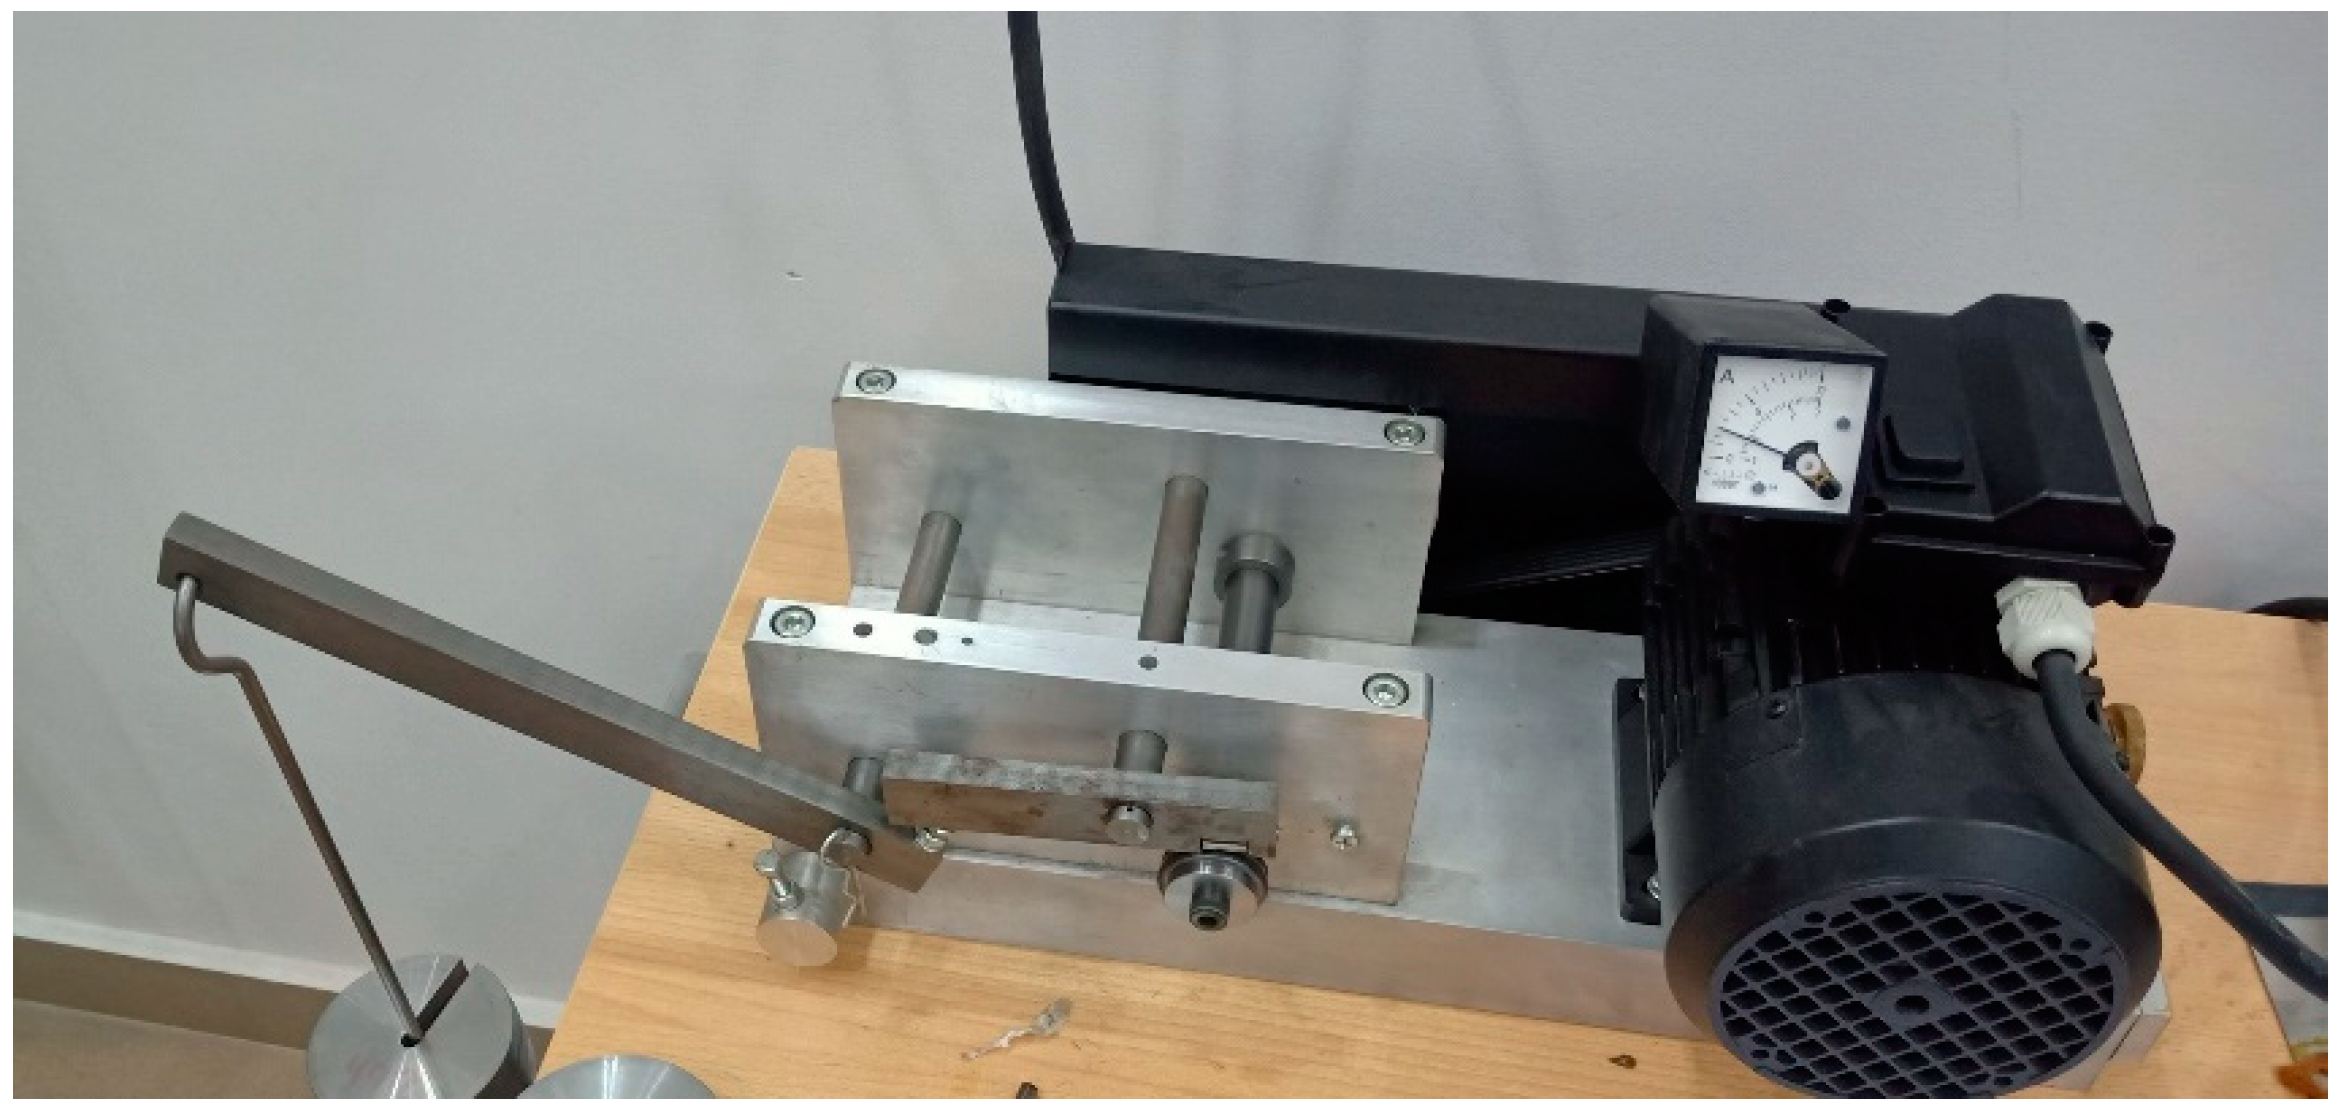
2.6. Load Carrying Capacity Test

A customized tribotester setup based on Brugger’s apparatus structure (DIN 51347-1) is developed and used to determine the load carrying capacity of each test lubricant aggregate, as shown in Figure 2. Its principle is based on the roller-on-ring test. In the test setup, a roller element of 15-mm width and 11-mm diameter is mounted in a cavity on one end of a compound lever mechanism while the selected test weights (each weight unit is 500 g) are attached to the other end. The roller element is made of GCr15 bearing steel (SAE 52100) and is placed against a spinning ring of the same material with 25 mm diameter. The roller element cylinder axis is kept at 90° relative to the axis of ring rotation. Eight grams of the lubricant blend is used to lubricate to the ring and the roller element.
During the running test, the room temperature is maintained at 25 °C. The test starts by running the motor for 30 s without applying weights to ensure uniform lubricant distribution between the ring and roller elements. Then, a step load of 5 N is added to the lever mechanism. The weight of the lever arm assembly is not part of the applied load. The test rig is set to run at 800 ± 5 rpm for 10 min ± 15 s unless a score is detected before that period. In case scoring takes place during the test period (indicated by high noise and vibrations of the spindle), the test is ended, and the load is removed.
By the completion of the 10 min ± 15 s period, the motor is turned off and the load lever mechanism is removed to examine the condition of the test roller surface. If no scoring or welding is observed, a new test roller is placed in the setup but after loading with another step load of 5 N to the lever mechanism for another run. The tests are successively conducted until reaching a load step that produces a score or welding. In this case, load breaks the tribo-film, separating the rolling element and the inner raceway, leading to scoring and motor seizure. Once detected, a load step is removed, and another run is conducted on the test setup for the 10 min ± 15 s period until completion. The test cylinder is then removed and examined to verify the non-seizure load as the load carrying capacity of the applied lubricant sample. To ensure high repeatability, the test is repeated till reaching the onset of scoring, and the load value is compared with previous trials.

3. Results

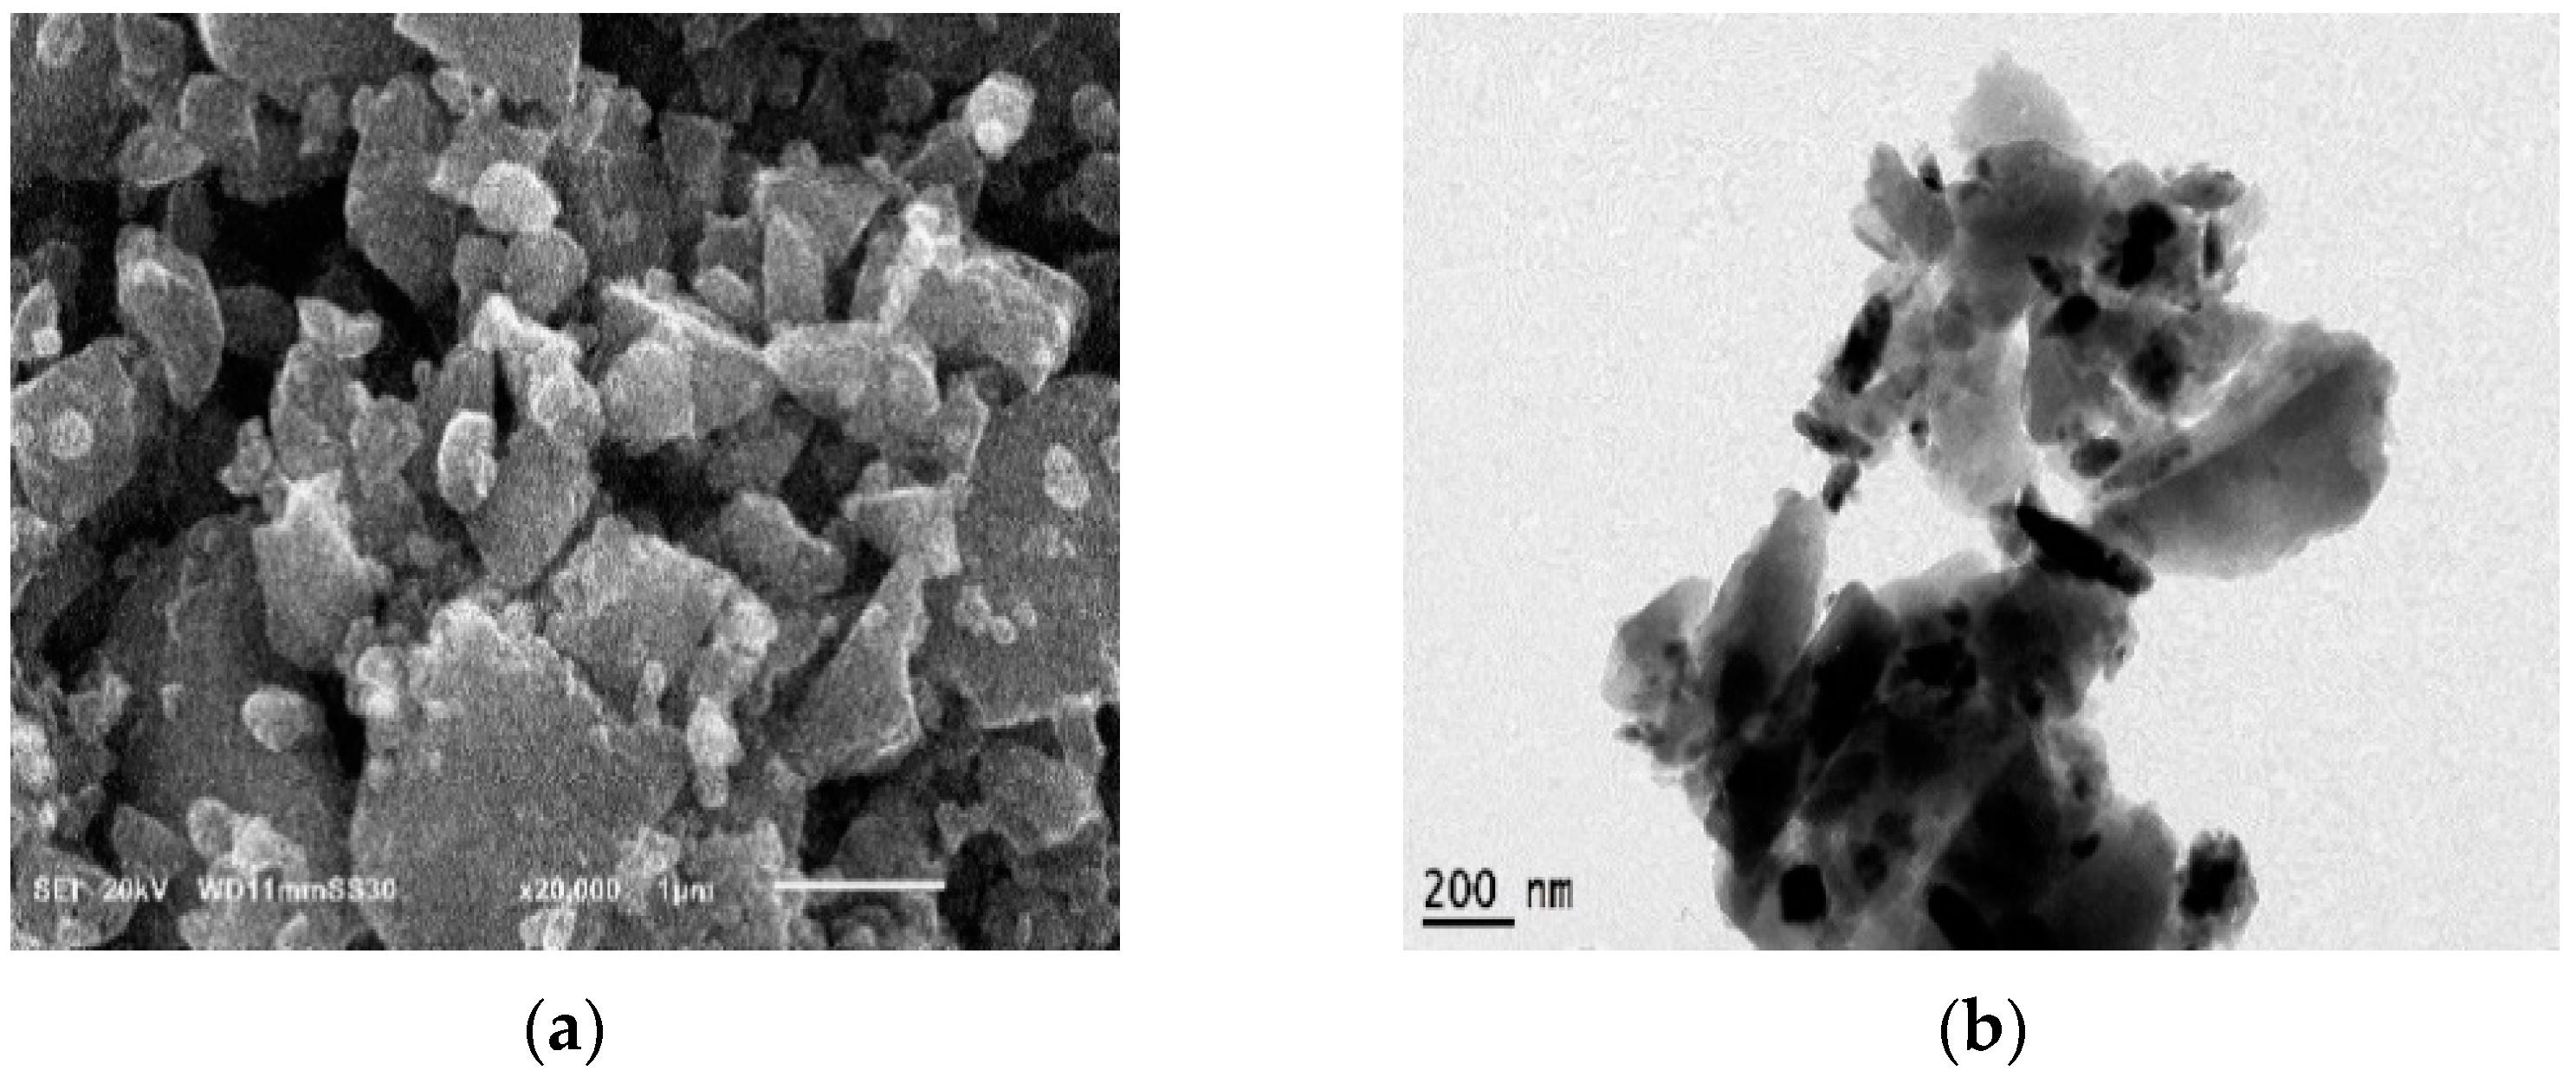
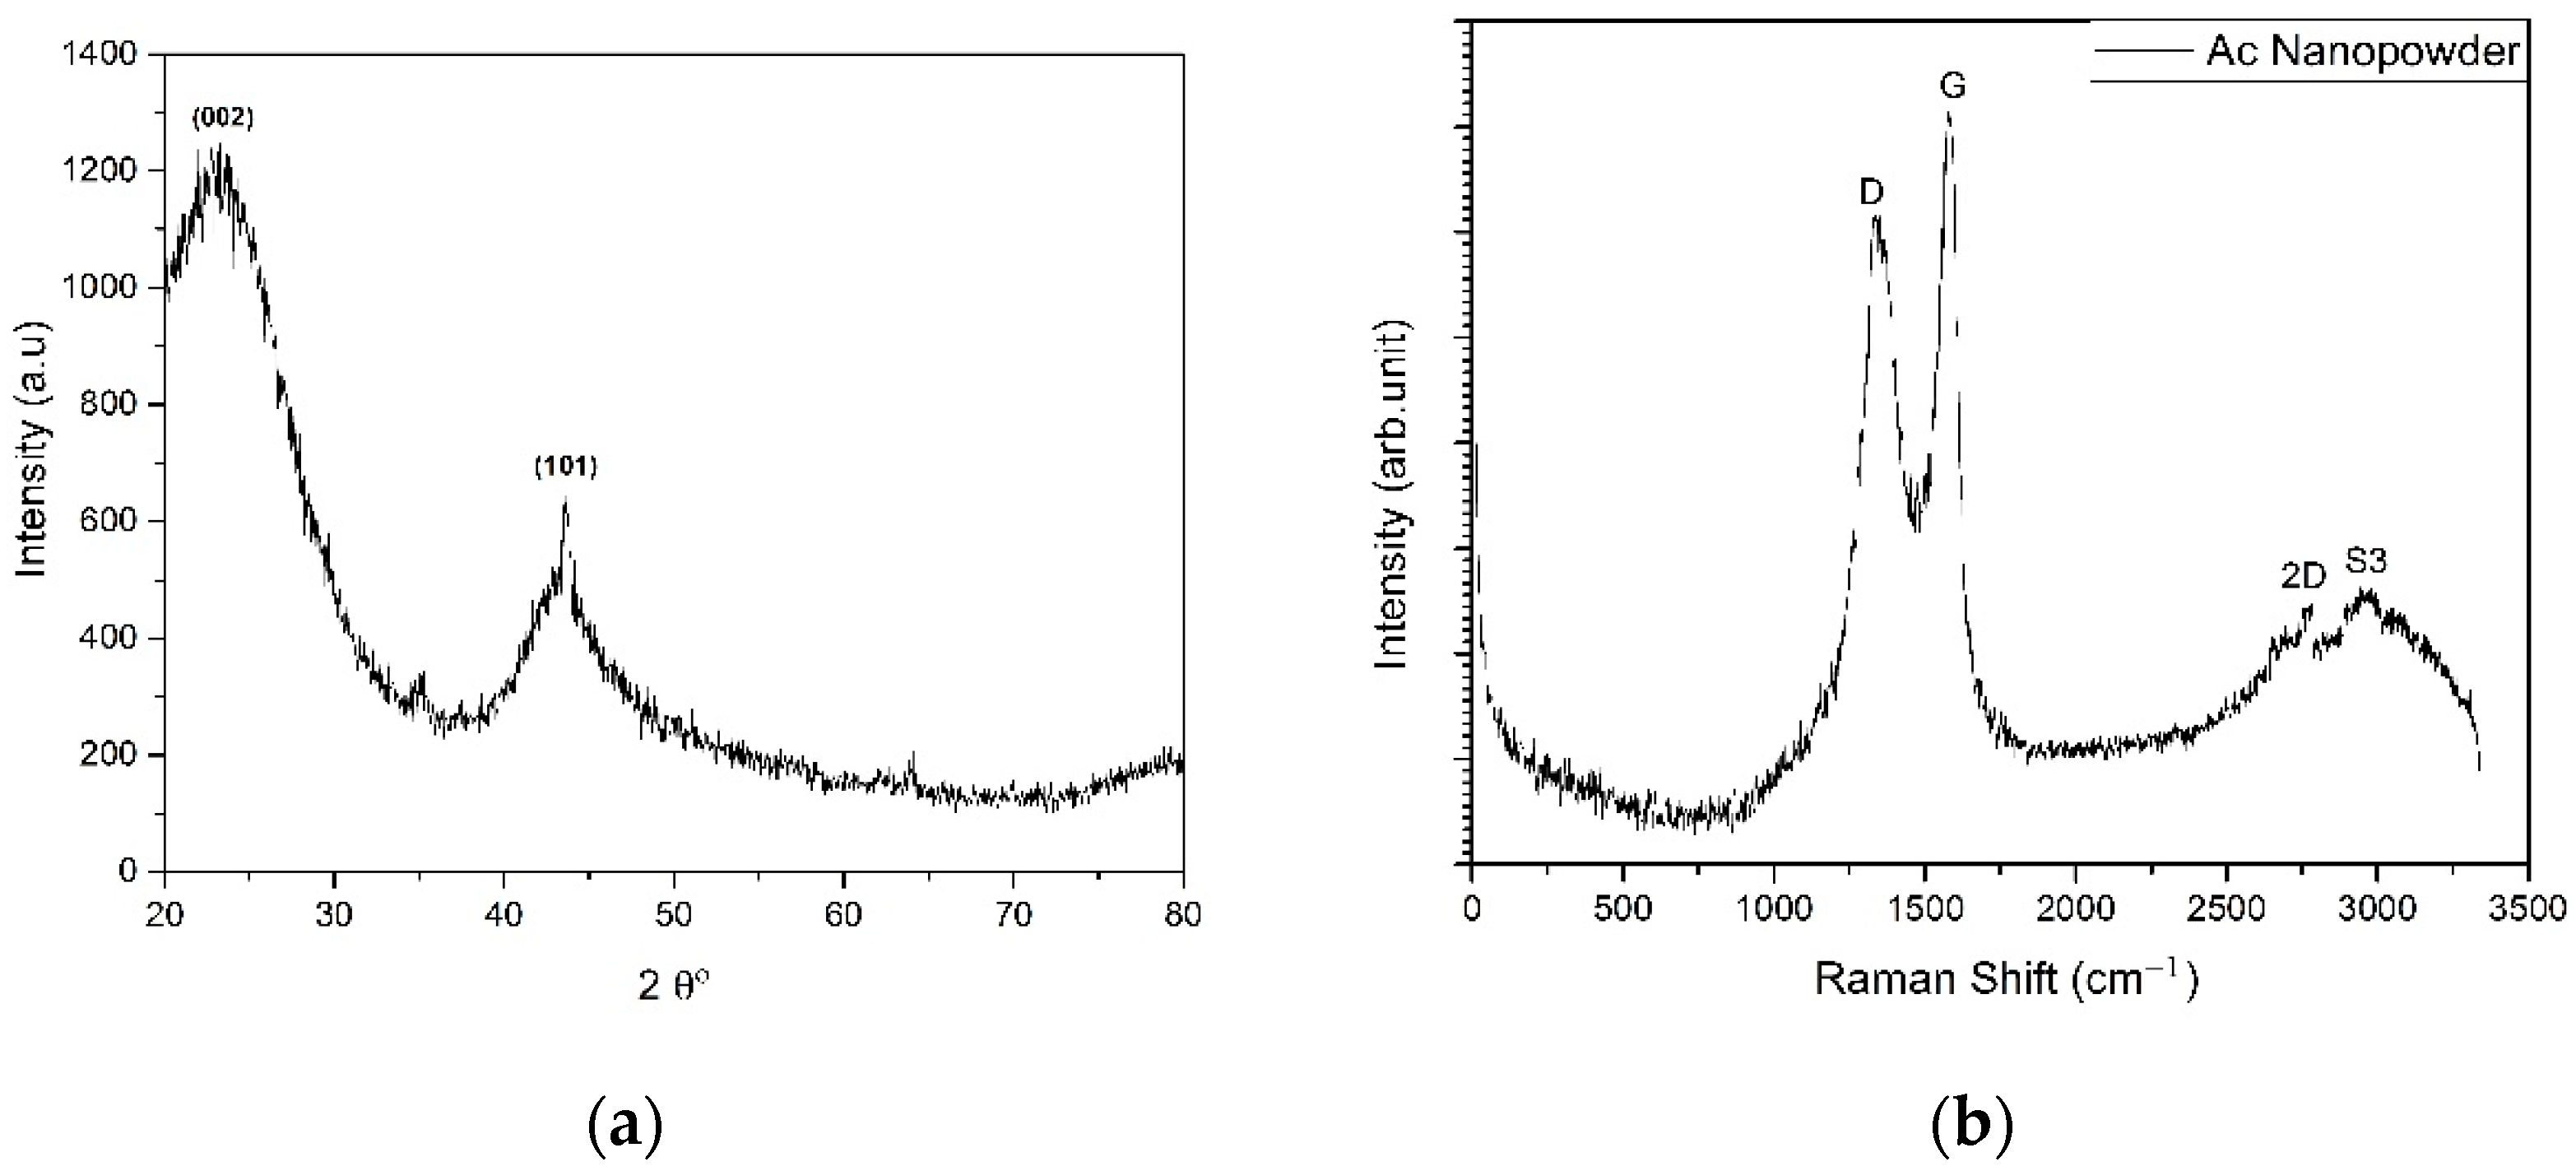
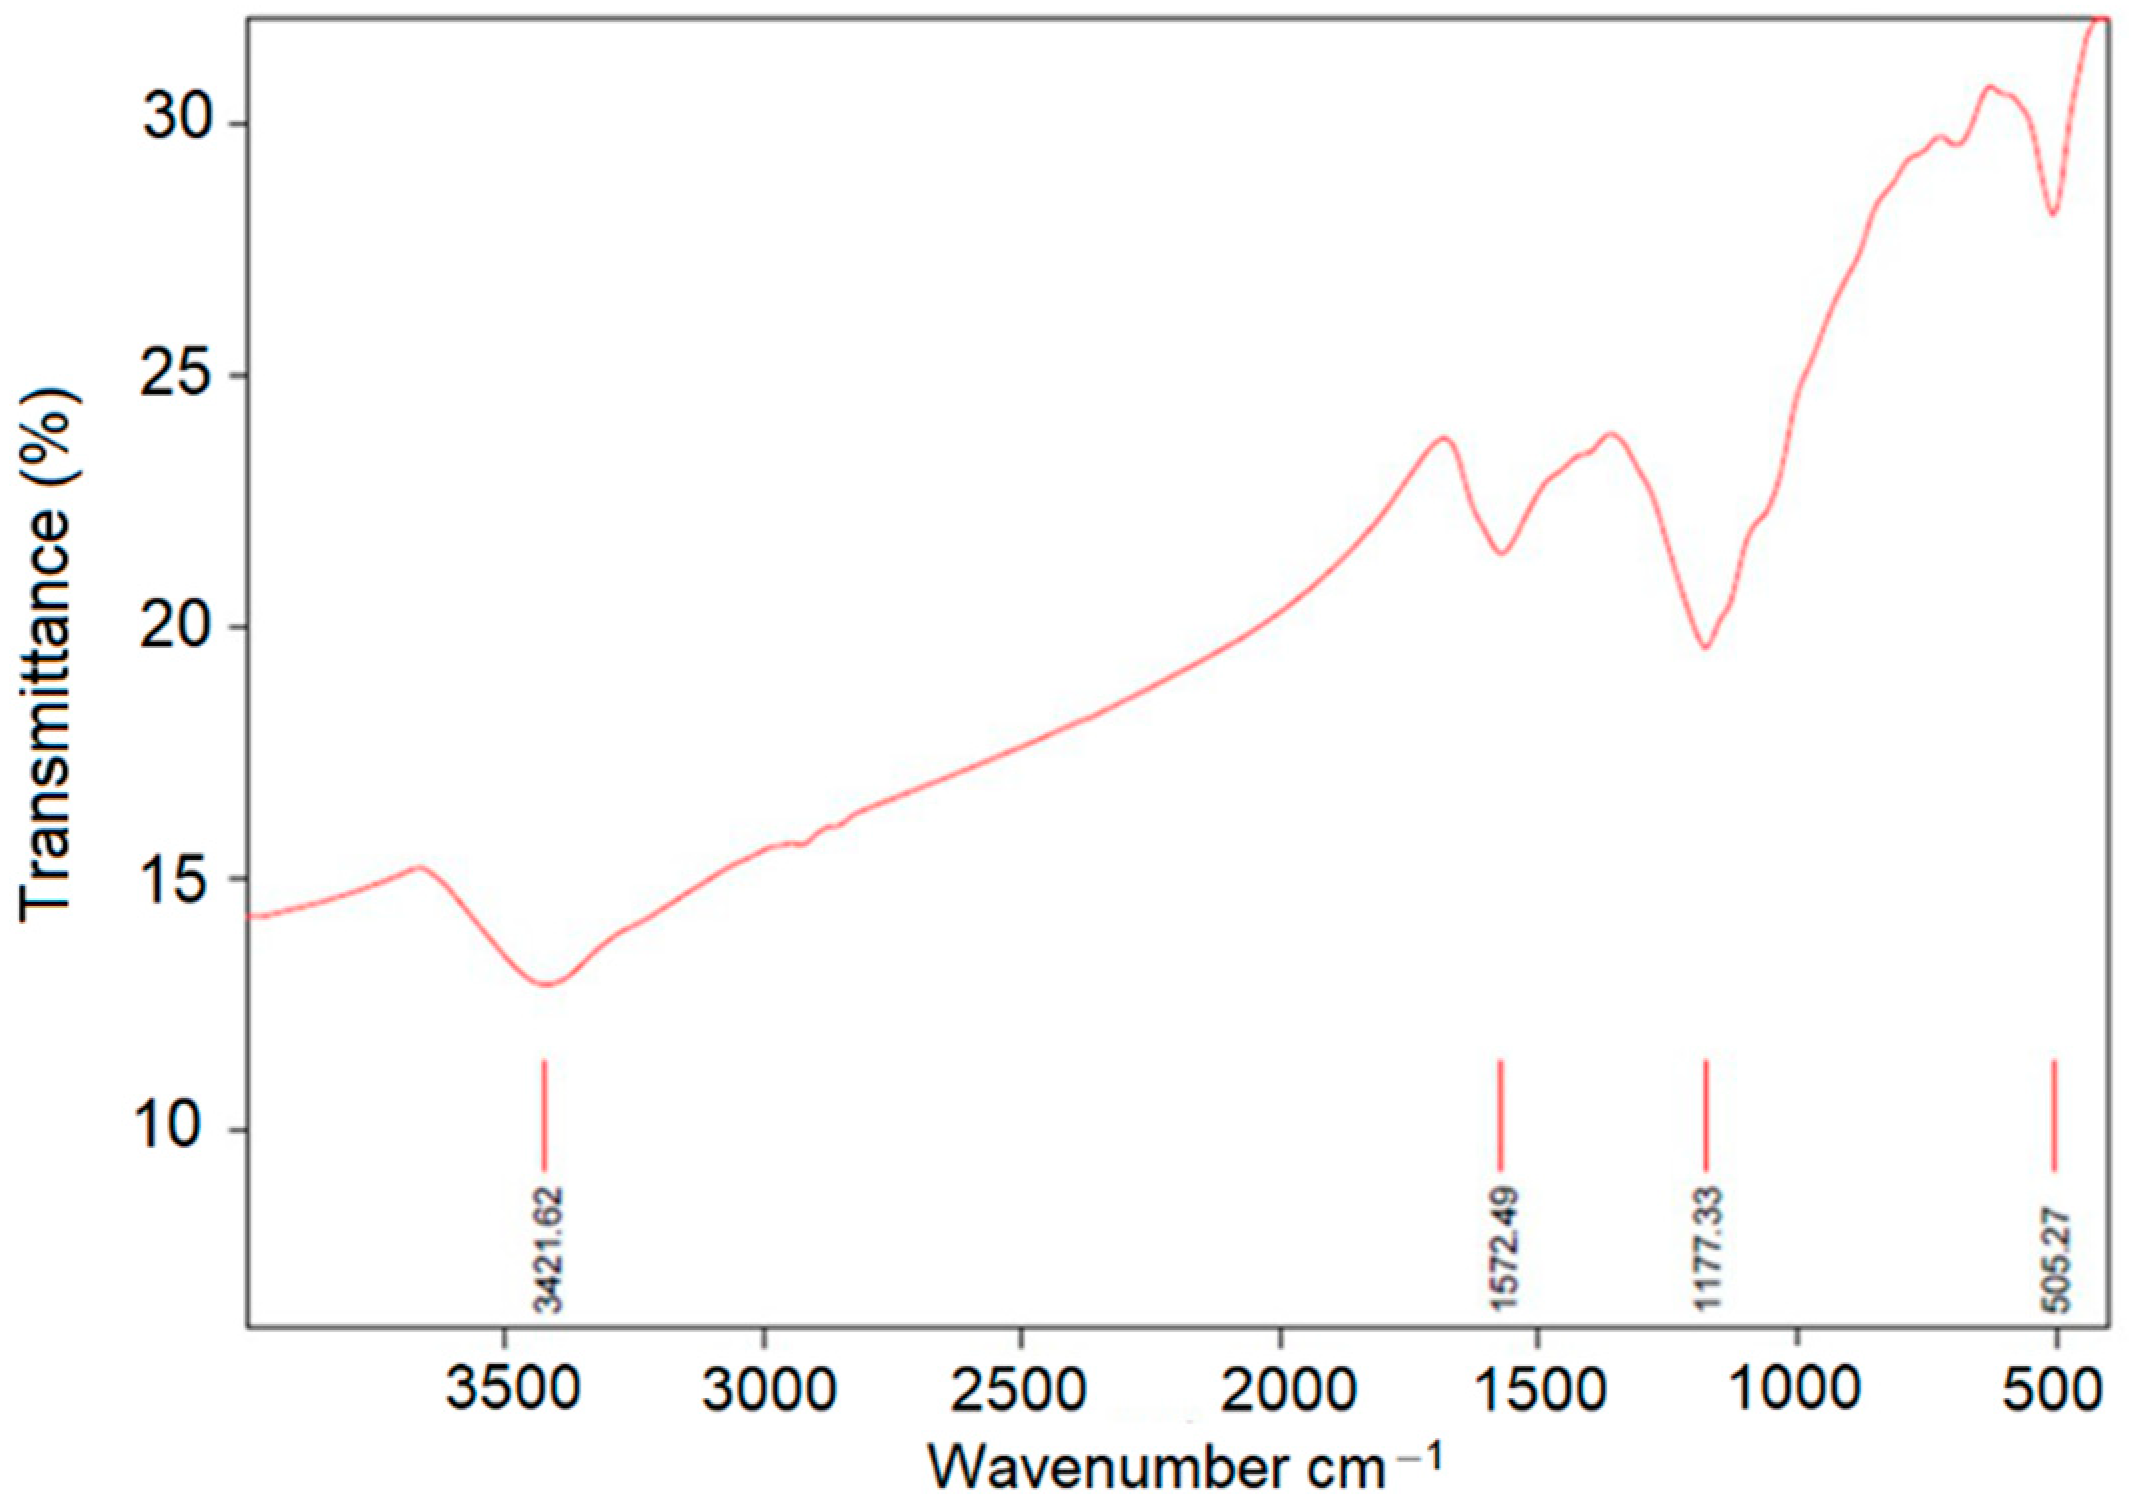
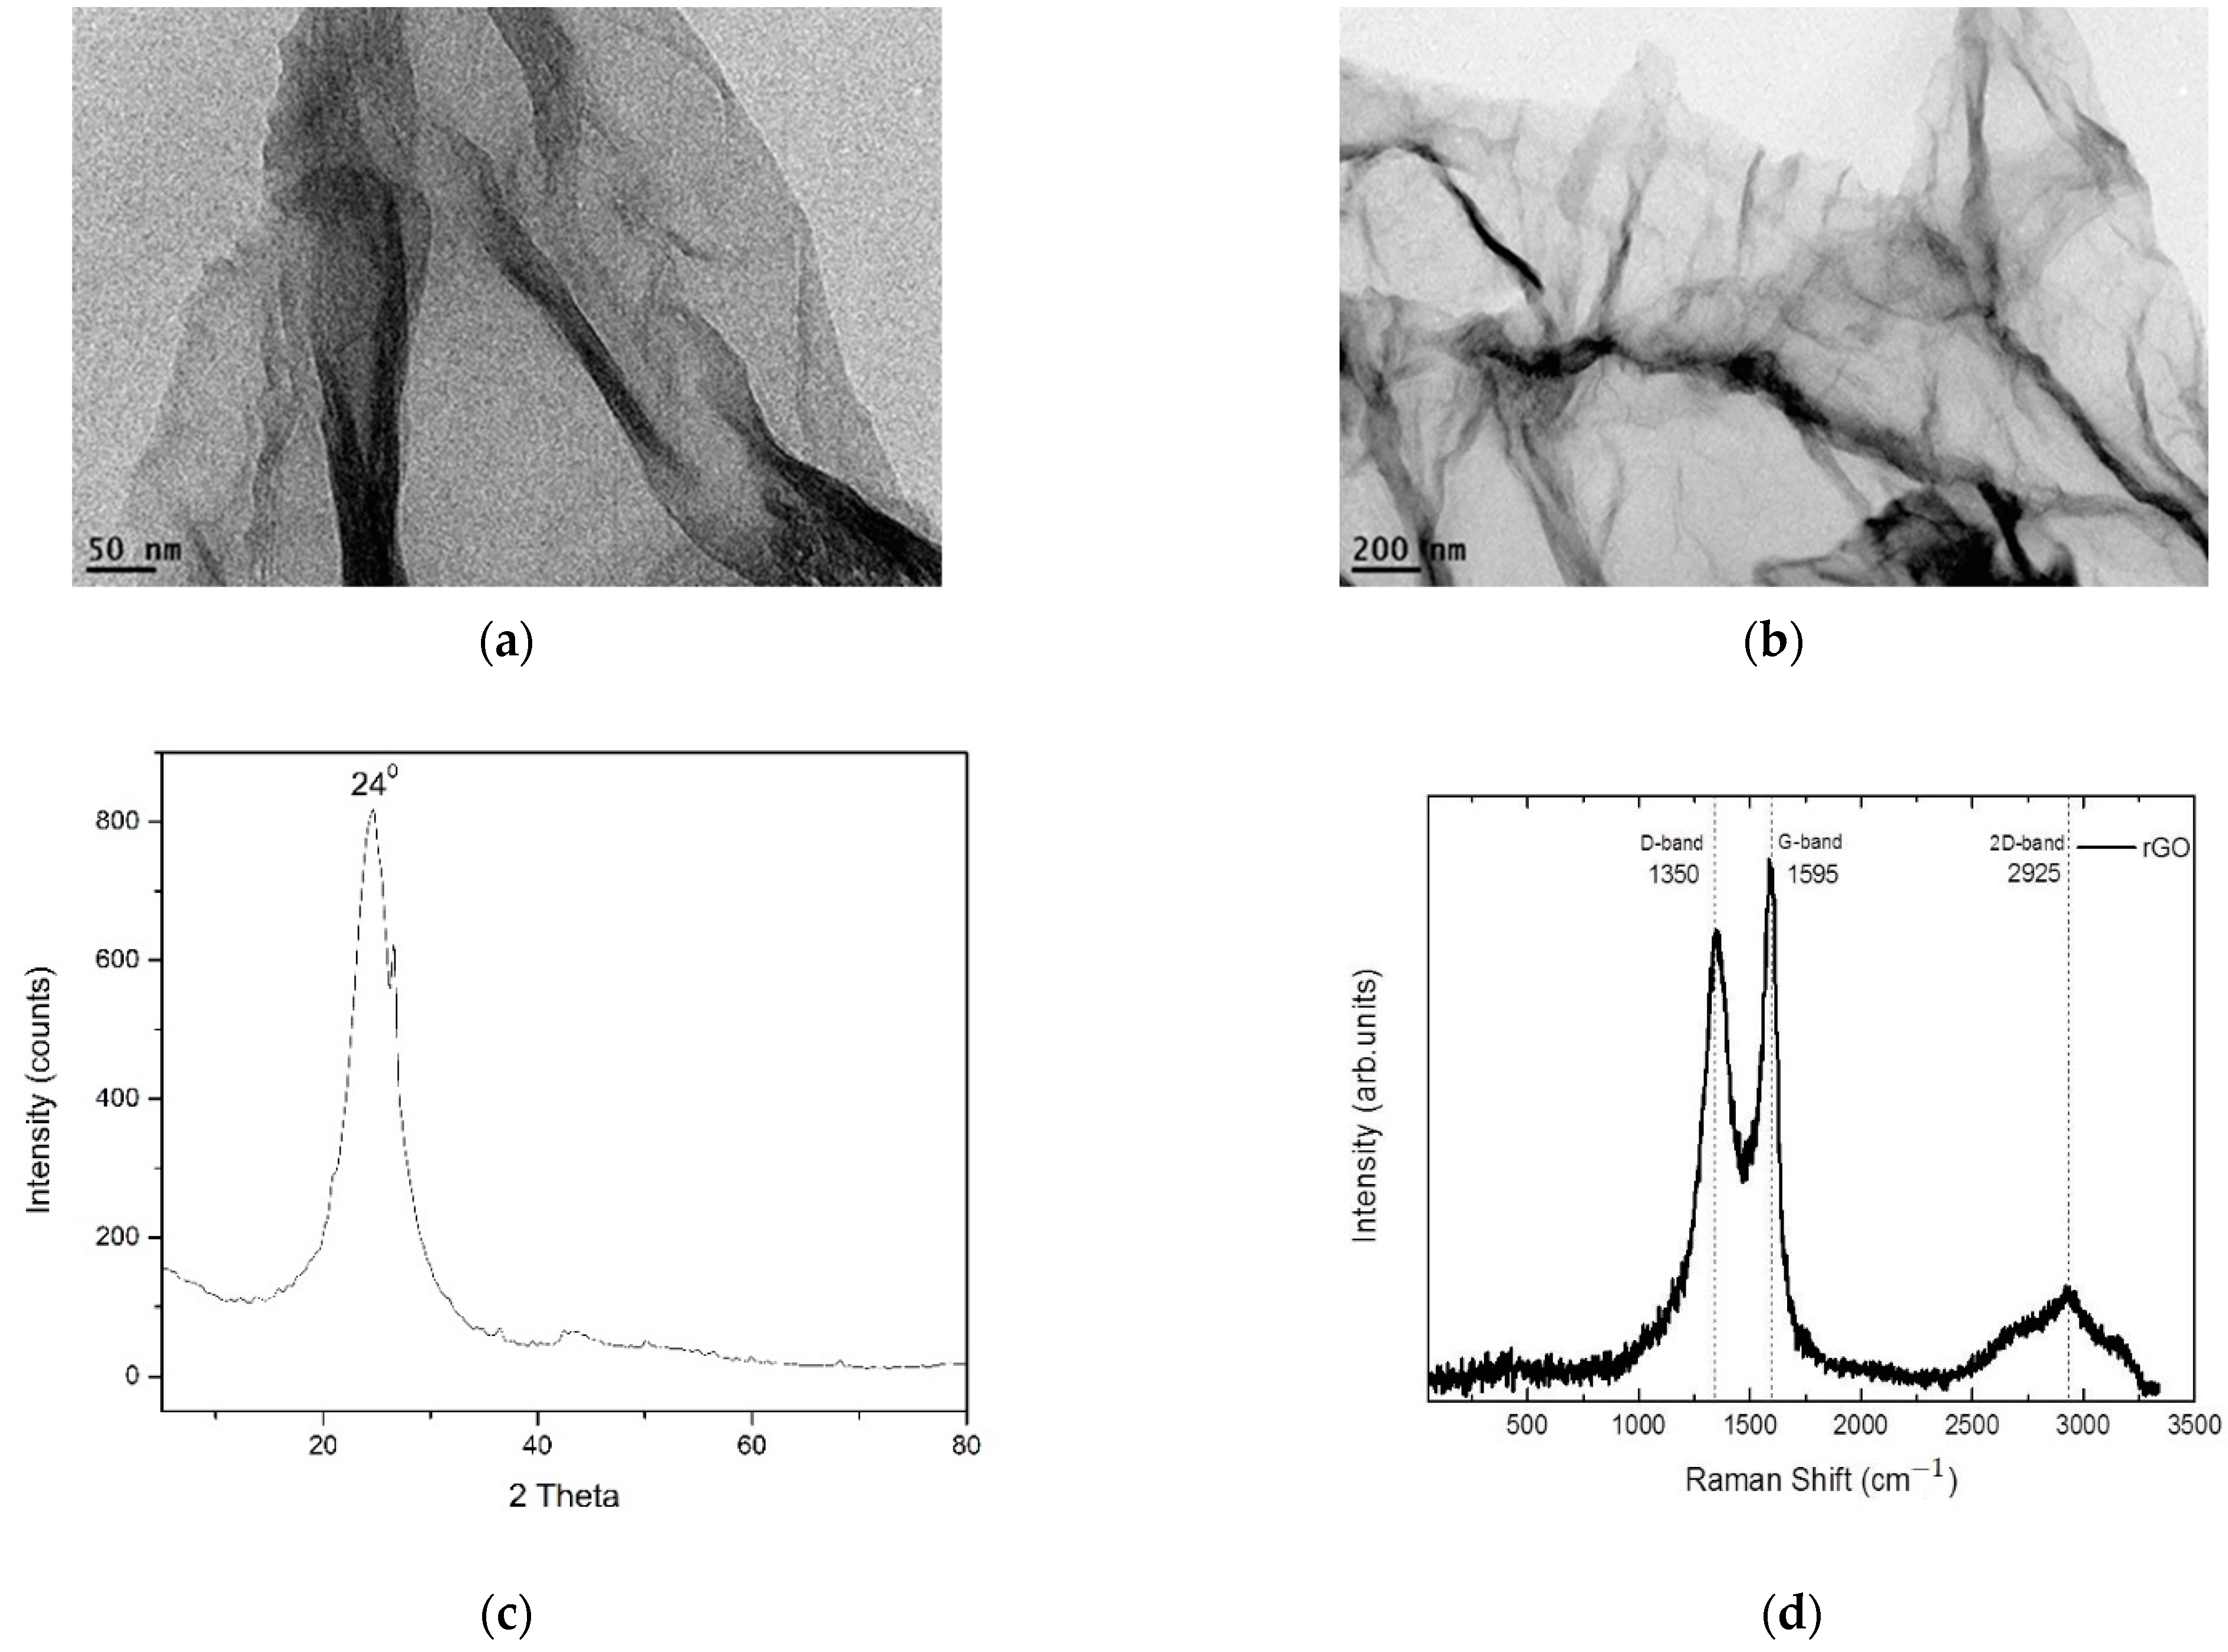
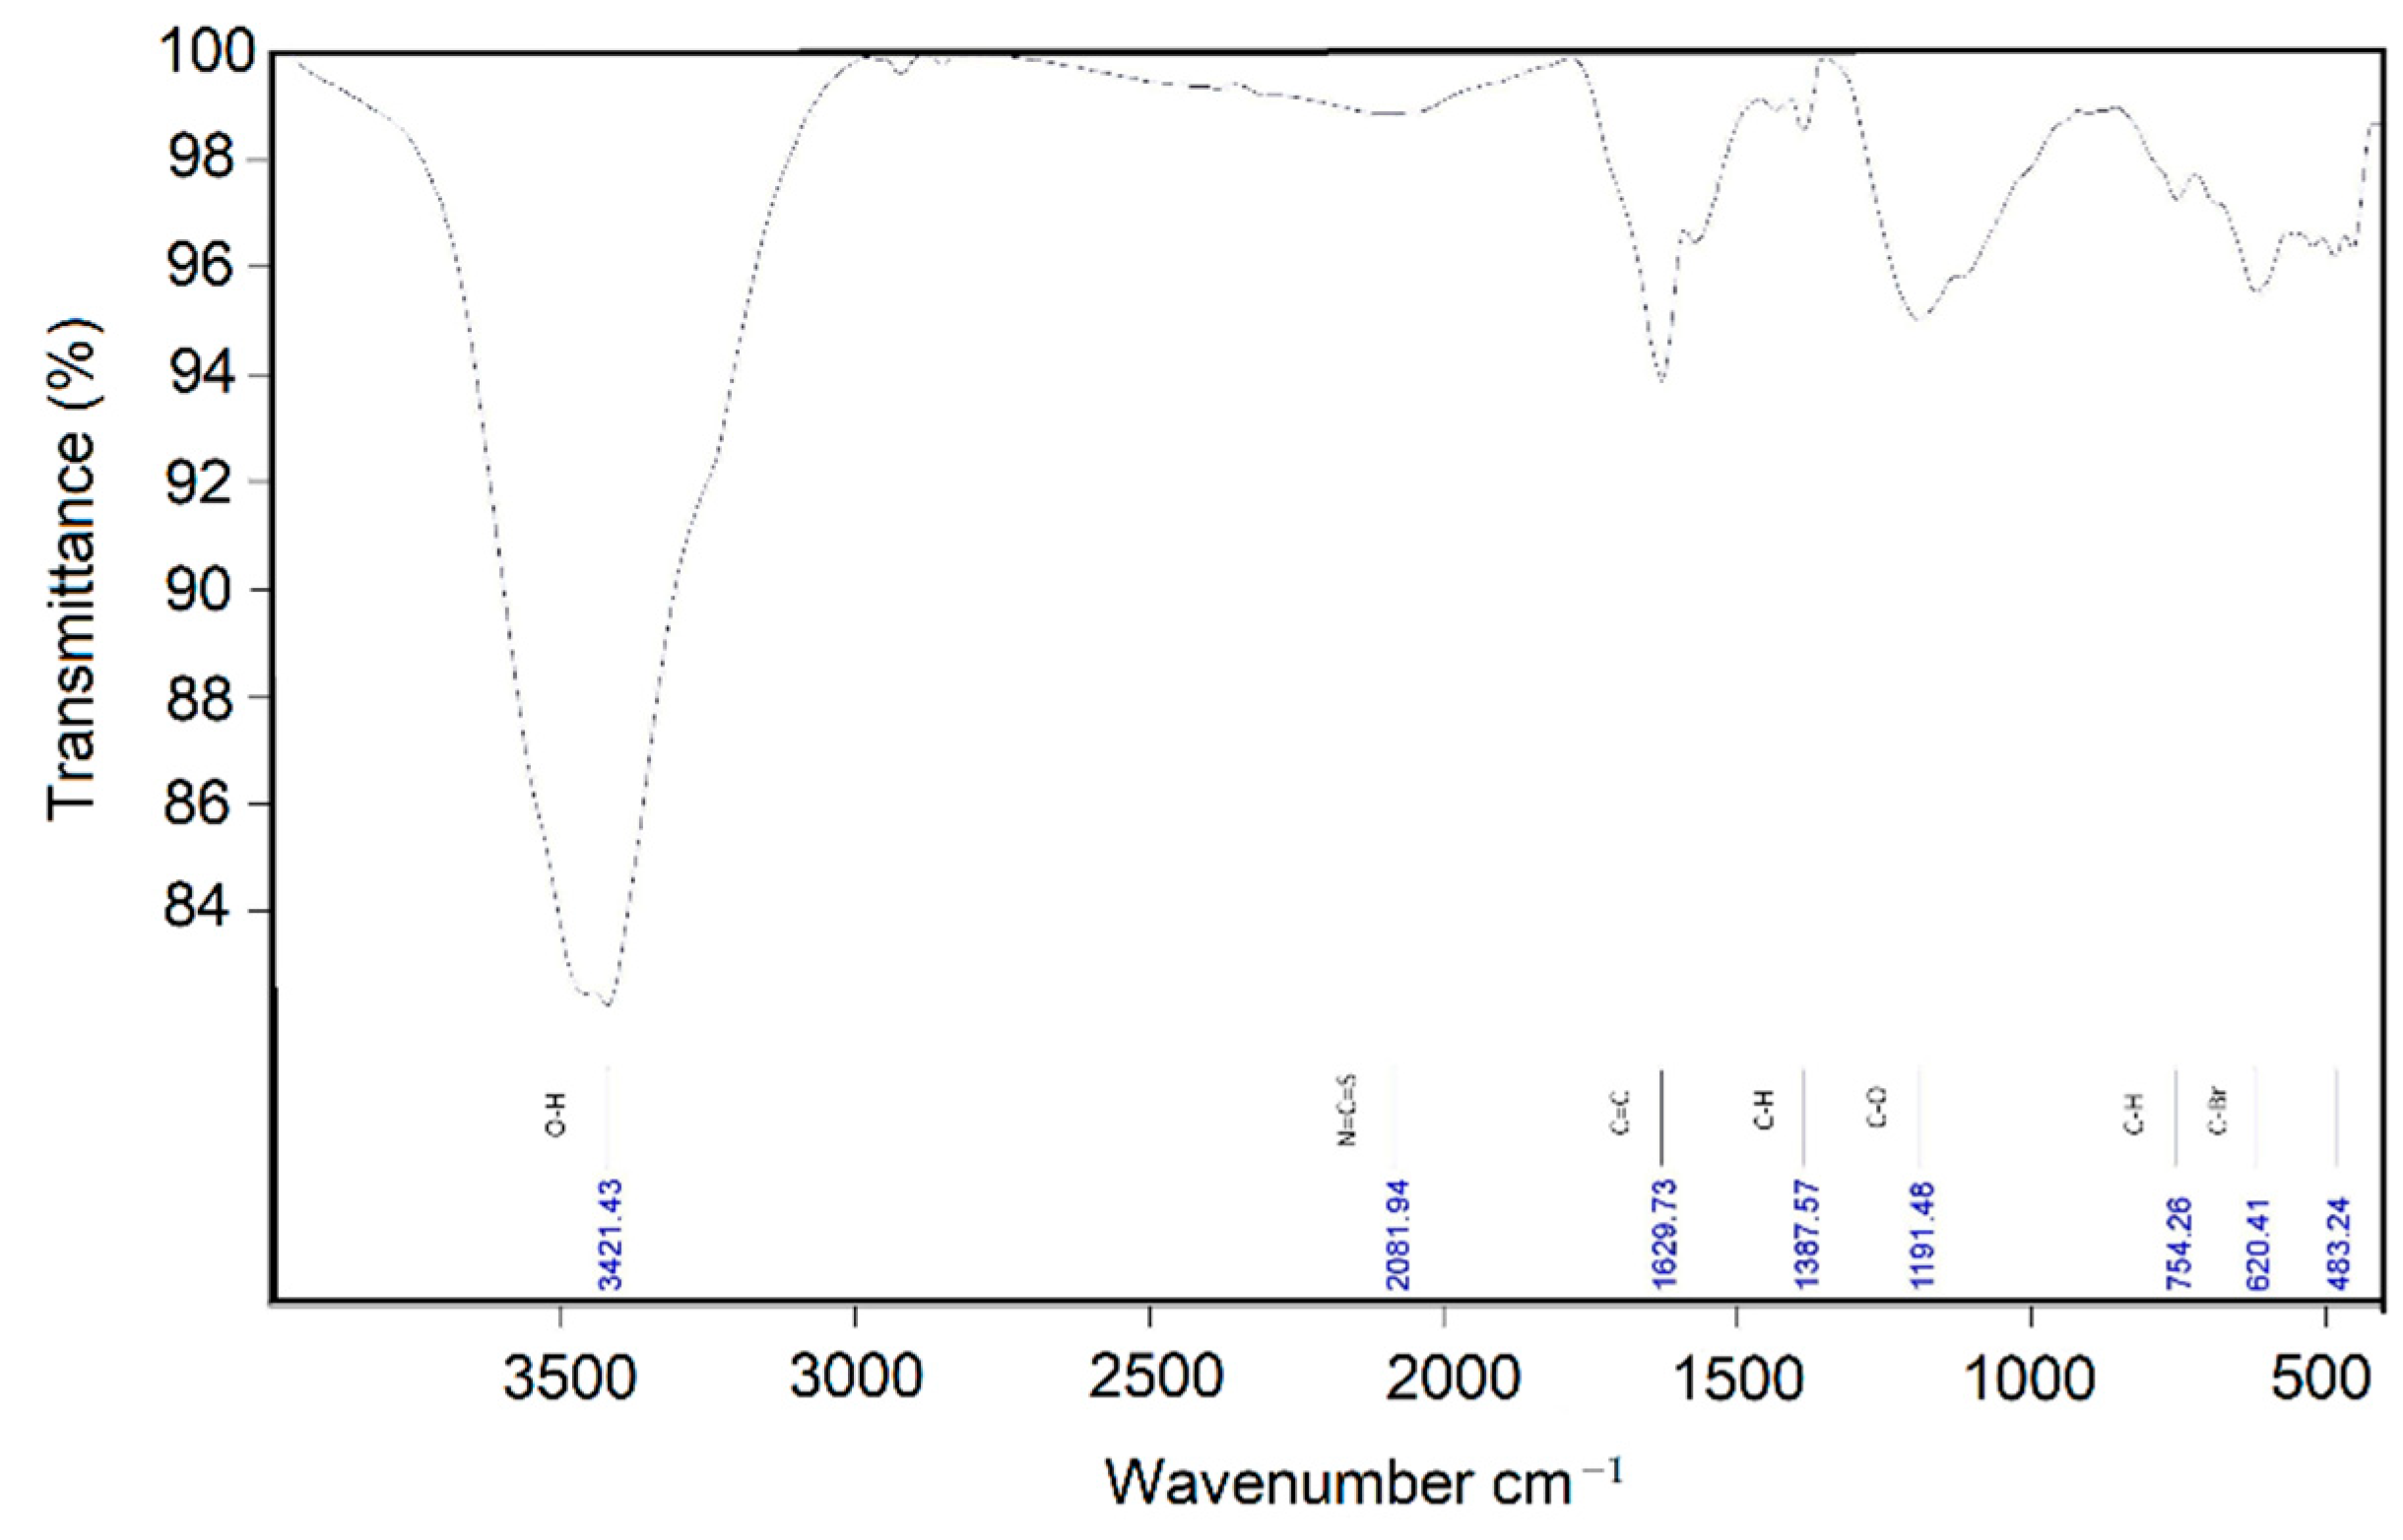
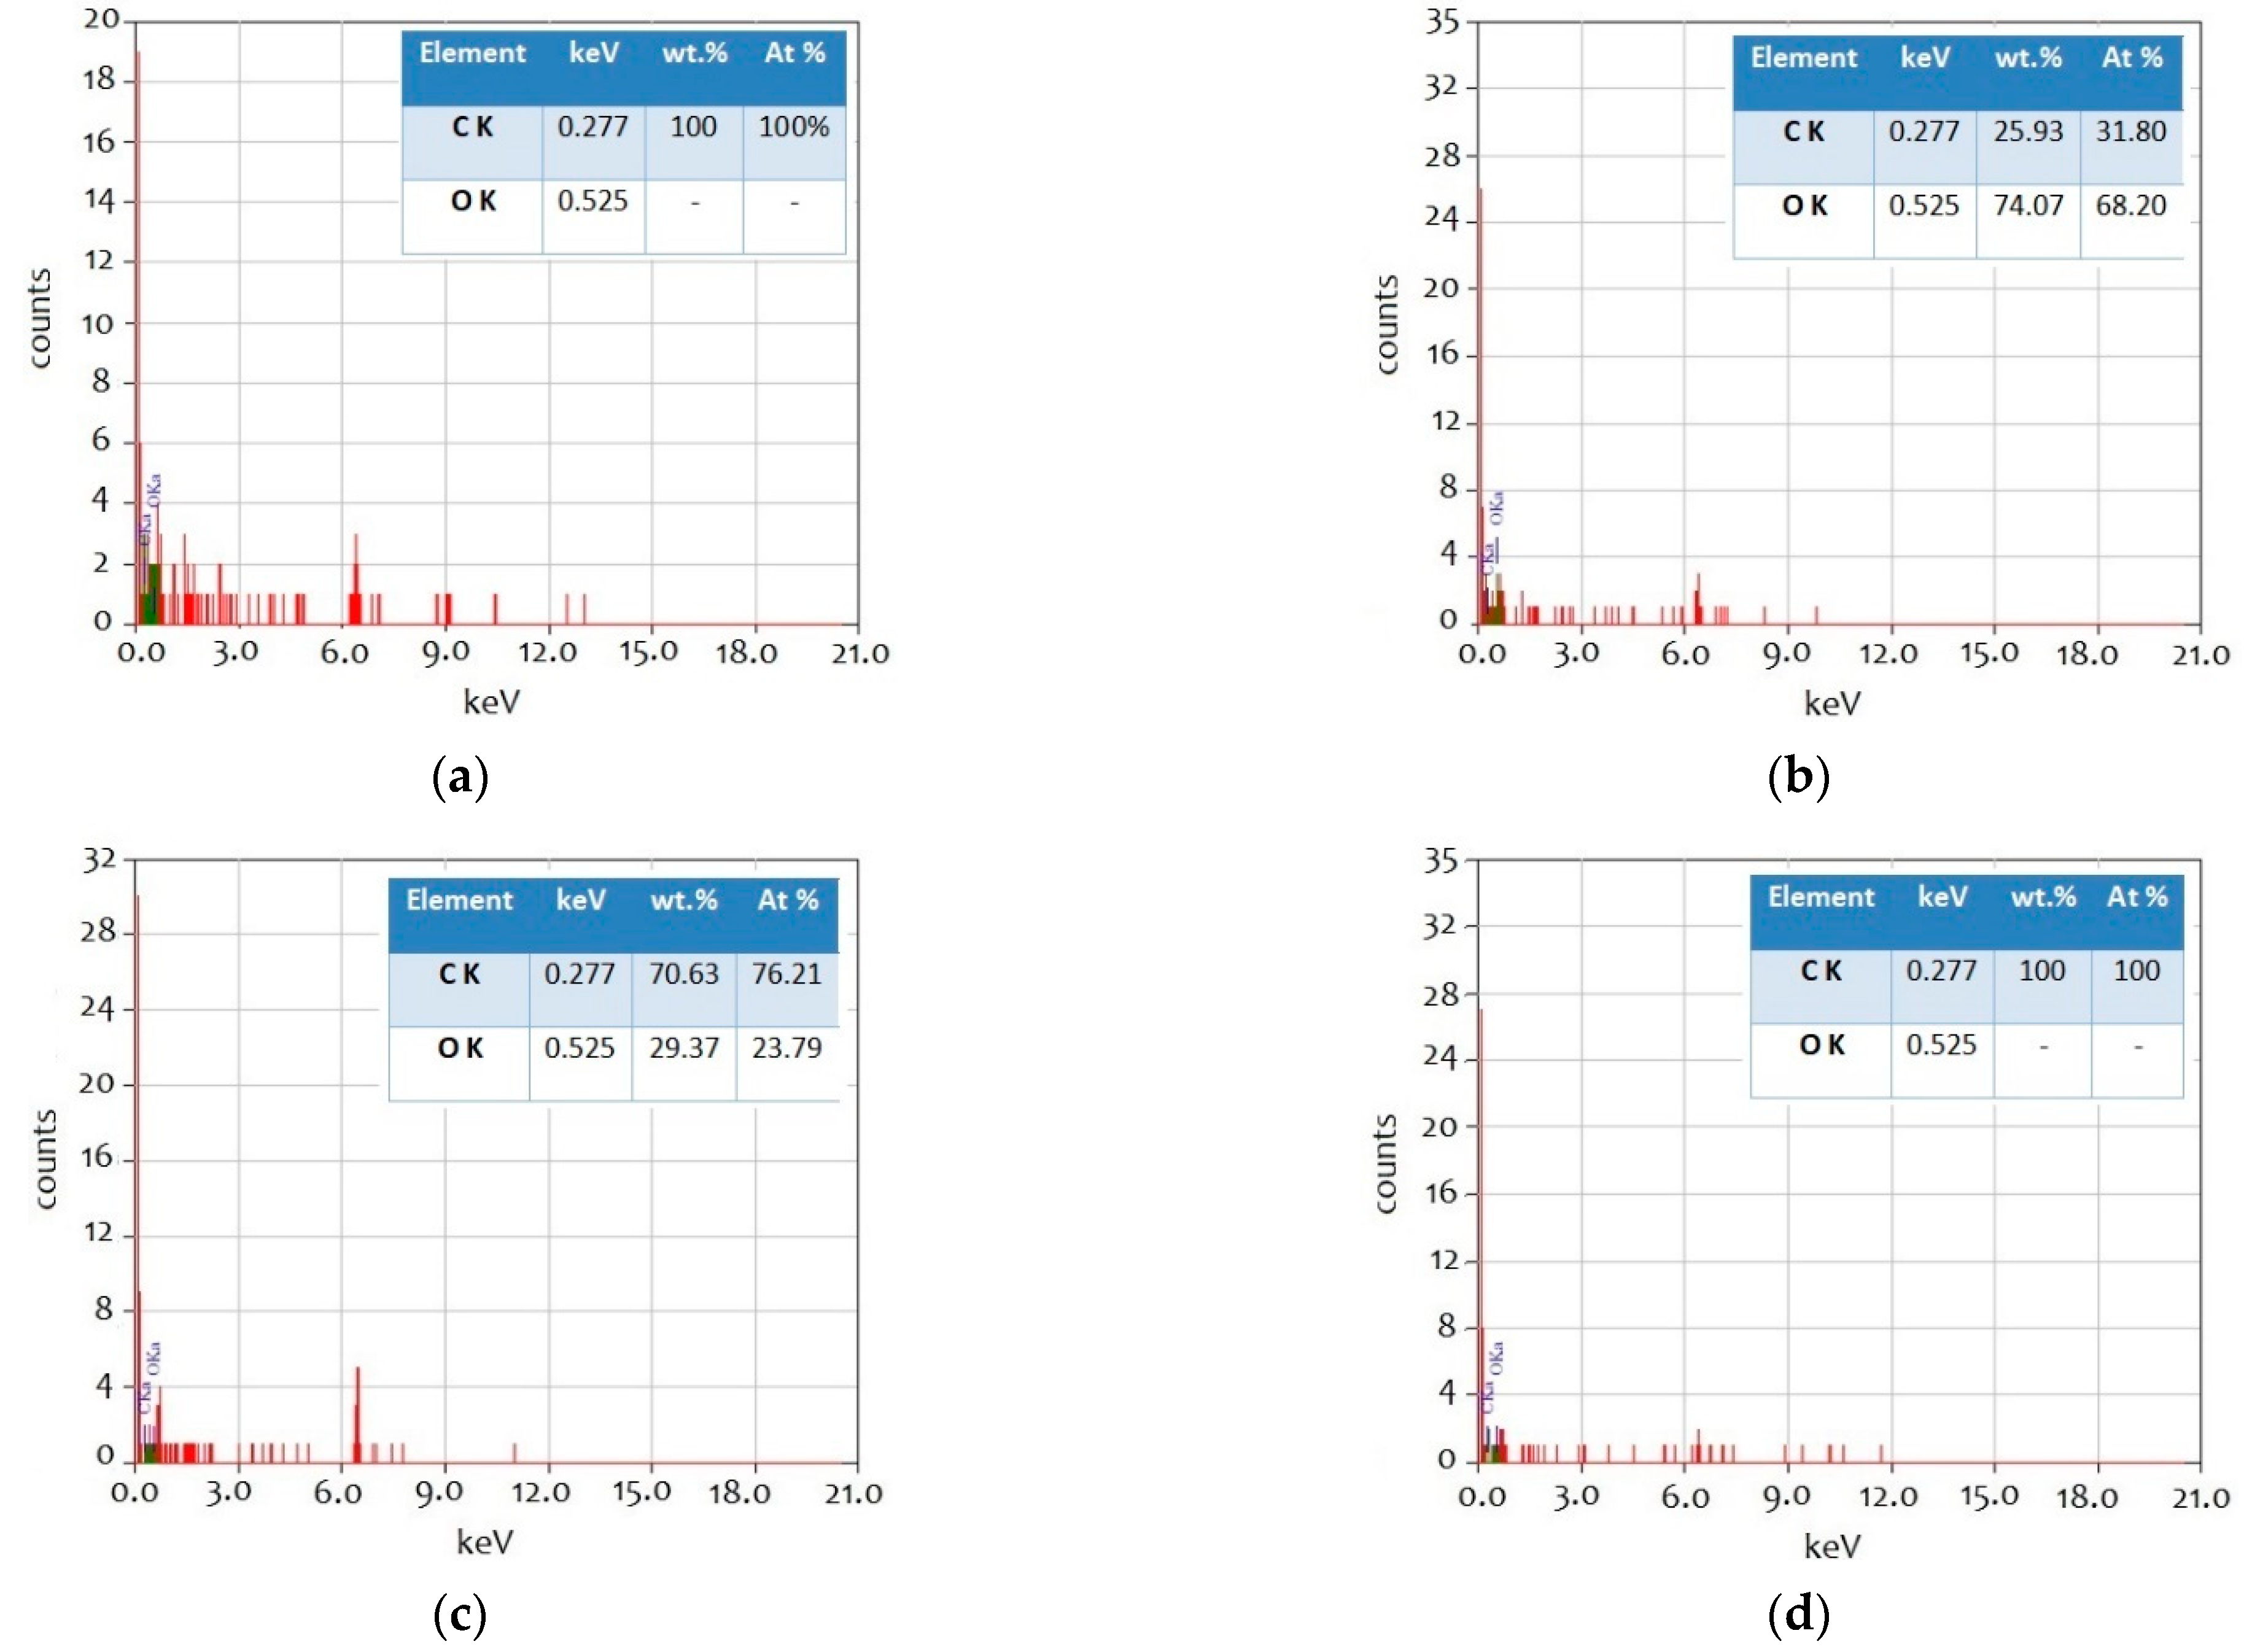
3.1. Nano-Additive Material Characterization

SEM and TEM micrographs of AC are illustrated in Figure 3a,b. It is noted that the prepared AC nano-powder (shown in Figure 3a) is well identified, aggregated, and takes the form of blend blocky morphologies. The nanostructure morphology has smooth surfaces with varying shapes and sizes, which suggest a continuous consumption of material due to the activation of the interior and exterior of AC [30]. The TEM image (shown in Figure 3b) shows entangled and rippled sheets of AC. The average particle diameter of the derived AC from plastic waste is estimated to be 84 nm.
Elemental analysis of AC using EDX spectroscopy reaches 97.56%, which indicates high carbon content in the synthesized AC product with small traces of oxygen (2.44%). A detailed information about the BET surface area, mean diameter of pores, and total pore volume is shown in Table 1. AC exhibits microporous morphology based on the information obtained from the International Union of Pure and Applied Chemistry (IUPAC) classification [31,32]. The pore distribution of AC confirms the dominance of micropores with an effective mean pore diameter of around 1.8 nm. The large pores volume observed in AC nano-powder is attributed to merging of individual pores. This is due to the arrangement of carbon layers resulting in the creation of micropores [33]. The activation of the surface and bulk of the char due to the presence of large quantities of hydrocarbon radicals and some hydrogen and water vapor at 500 °C can cause an amorphous nature, high pore volume, and high surface area of the produced AC [34,35]. XRD patterns of AC nano-powder are shown in Figure 4a. The broad peak at 2θ is located between 18.04 and 20.44° corresponds to the (002) carbon plane (JCPDS card no. 87-1526) which confirms the production of amorphous activated carbon. The peaks at 2θ value of 43.2° corresponding to the (101) diffraction planes of AC which is produced from PET waste plastics [36]. Raman spectrum of nano-activated carbon (Figure 4b) shows two sharp peaks allocated at 1348 cm−1 (D peak) and 1590 cm−1 (G peak). The first D peak is attributed to the lattice defects, edge imperfection, and unkempt alignment at the prepared activated carbon. Meanwhile, the second G peak is related to the occurrence of C=C stretching vibrations. Furthermore, two more small bands were investigated at the Raman spectrum at 2680 cm−1 (2D) and 2844 cm−1 (S3), which may be assigned to the overtone of carbon, indicating the presence of a few-layered carbon material.
Figure 5 shows the FTIR spectrum of the AC nano-powder. The presence of surface functional groups in AC is identified. The peak at 1572.49 cm−1 is due to the C=C stretching of aromatic rings which is an intrinsic characteristic of carbon that is evident in AC [37], while the peak at 3421.62 cm−1 in all prepared materials is attributed to the O-H stretching vibration due to the presence of molecular hydrogen bond of polymeric compounds such as alcohols, phenols, lattice water, and carboxylic acids. The peak at 506.27 cm−1 is attributed to out-of-plane angular deformation of aromatic rings in AC. The 1177.33 cm−1 peak in the AC-prepared materials is attributed to C–O vibration [38].
Figure 6a,b shows TEM images of reduced graphene oxide (rGO), which reveal a less wrinkled nano-sheet structure having thickness and length of up to 5 nm and 3 µm, respectively. Moreover, the number of graphene layers is estimated at 4. Looking at XRD analysis of rGO (shown in Figure 6c), the few-layer graphene structure is confirmed due to the broad (near sharp) characteristic peak at 2θ = 24.5° on the (002) basal plane. This demonstrates the random arrangement of the graphene crystals after the reduction of graphene oxide (GO) [39,40,41]. Furthermore, the crystallinity percentage, the average grain size (according to Scherrer’s rule), and the inter-layer spacing (according to Bragg’s formula) account for 54%, 1.66 nm, and 0.37 nm, respectively. According to the previous values, the appropriate reduction of oxygen during the synthesis process is ensured [42,43].
The TEM and XRD results are confirmed by the obtained Raman spectrum, shown in Figure 6d. It is found that the three rGO characteristic peaks (D, G, and 2D) are observed at 1350, 1595, and 2925 cm−1, respectively. The D band indicates the rGO structural imperfections [44], which recorded a significantly strong peak in the spectrum. While the structural integrity and symmetry are expressed through the G-band [45]. Finally, the 2D band is responsible for the carbon stacking in the graphene structure [46]. By dividing the intensity of the 2D peak by that of the G peak (I2D/IG), the result was found to be 0.91, which confirms the four-layered rGO structure. Turning to the ID/IG ratio, it was higher than that of I2D/IG to reach 0.98, indicating dense edge defects as a result of C=C bond reduction [47]. Regarding the FTIR spectrum of rGO (shown in Figure 7), the wavenumber of 3421.43 cm−1 related to O-H intermolecular bond has experienced a significant broad stretching band. Next comes the medium C=C band, which is observed at 1629.73 cm−1 followed by the weak C-O peak at 1191.48 cm−1. Both C=C and C-O function groups confirm the stable graphene structure with sufficient integrity against any susceptible breakthrough induced by oxidizing agents, especially at the basal plane. Furthermore, the extremely weak (negligible) stretching bands revealed at 1387.57 and 754.26 cm−1 are attributed to C-H function groups and indicate small amounts of hydrogen attached to carbon atoms [47].

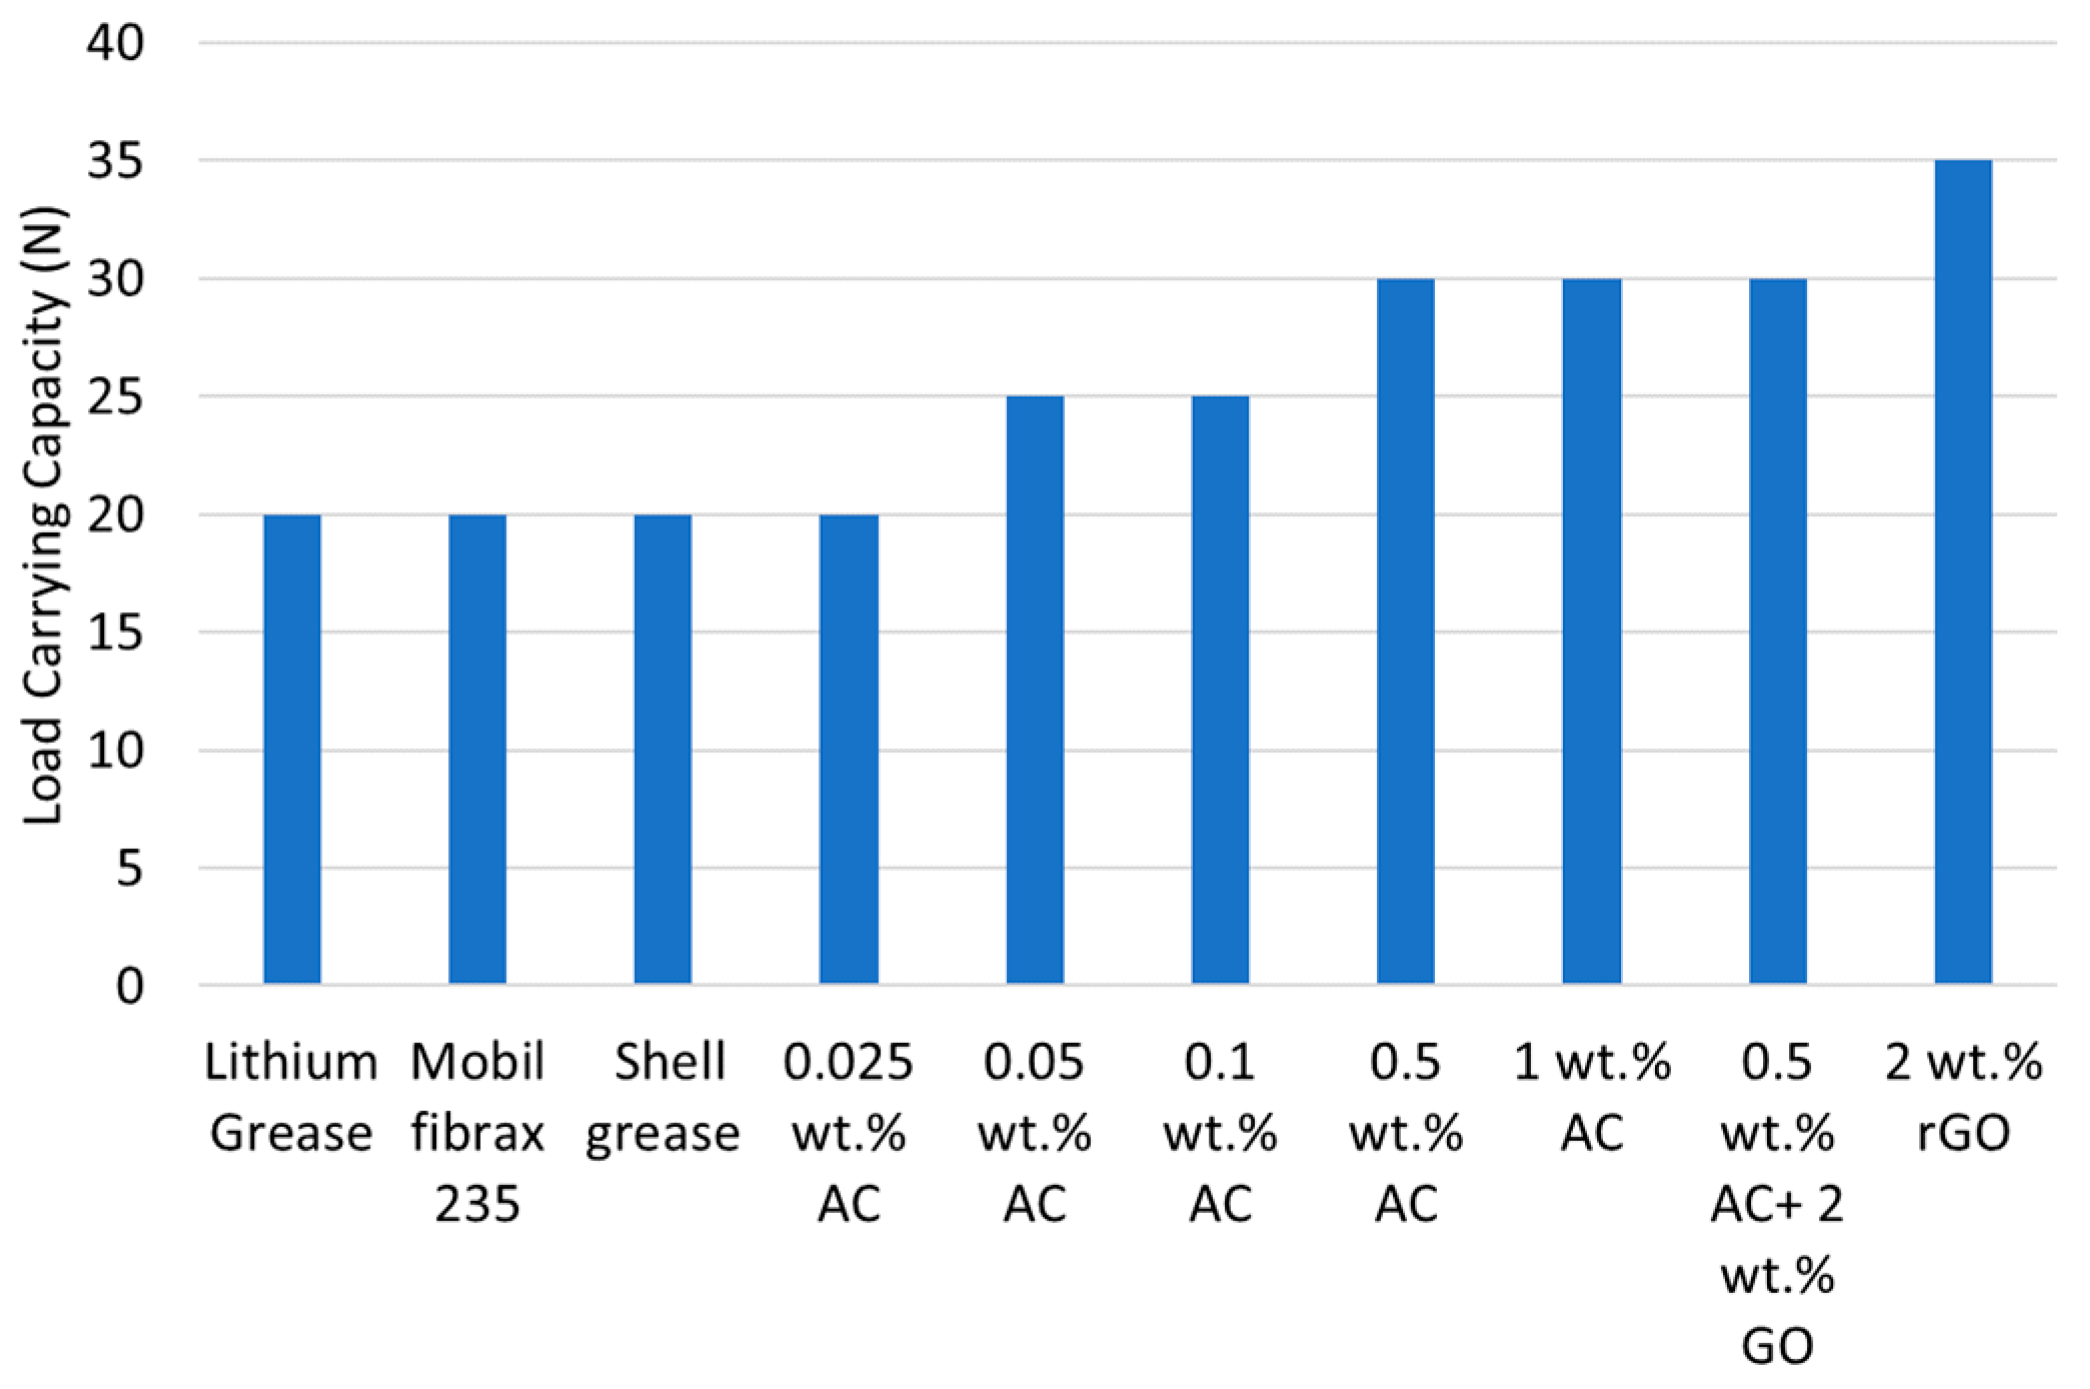
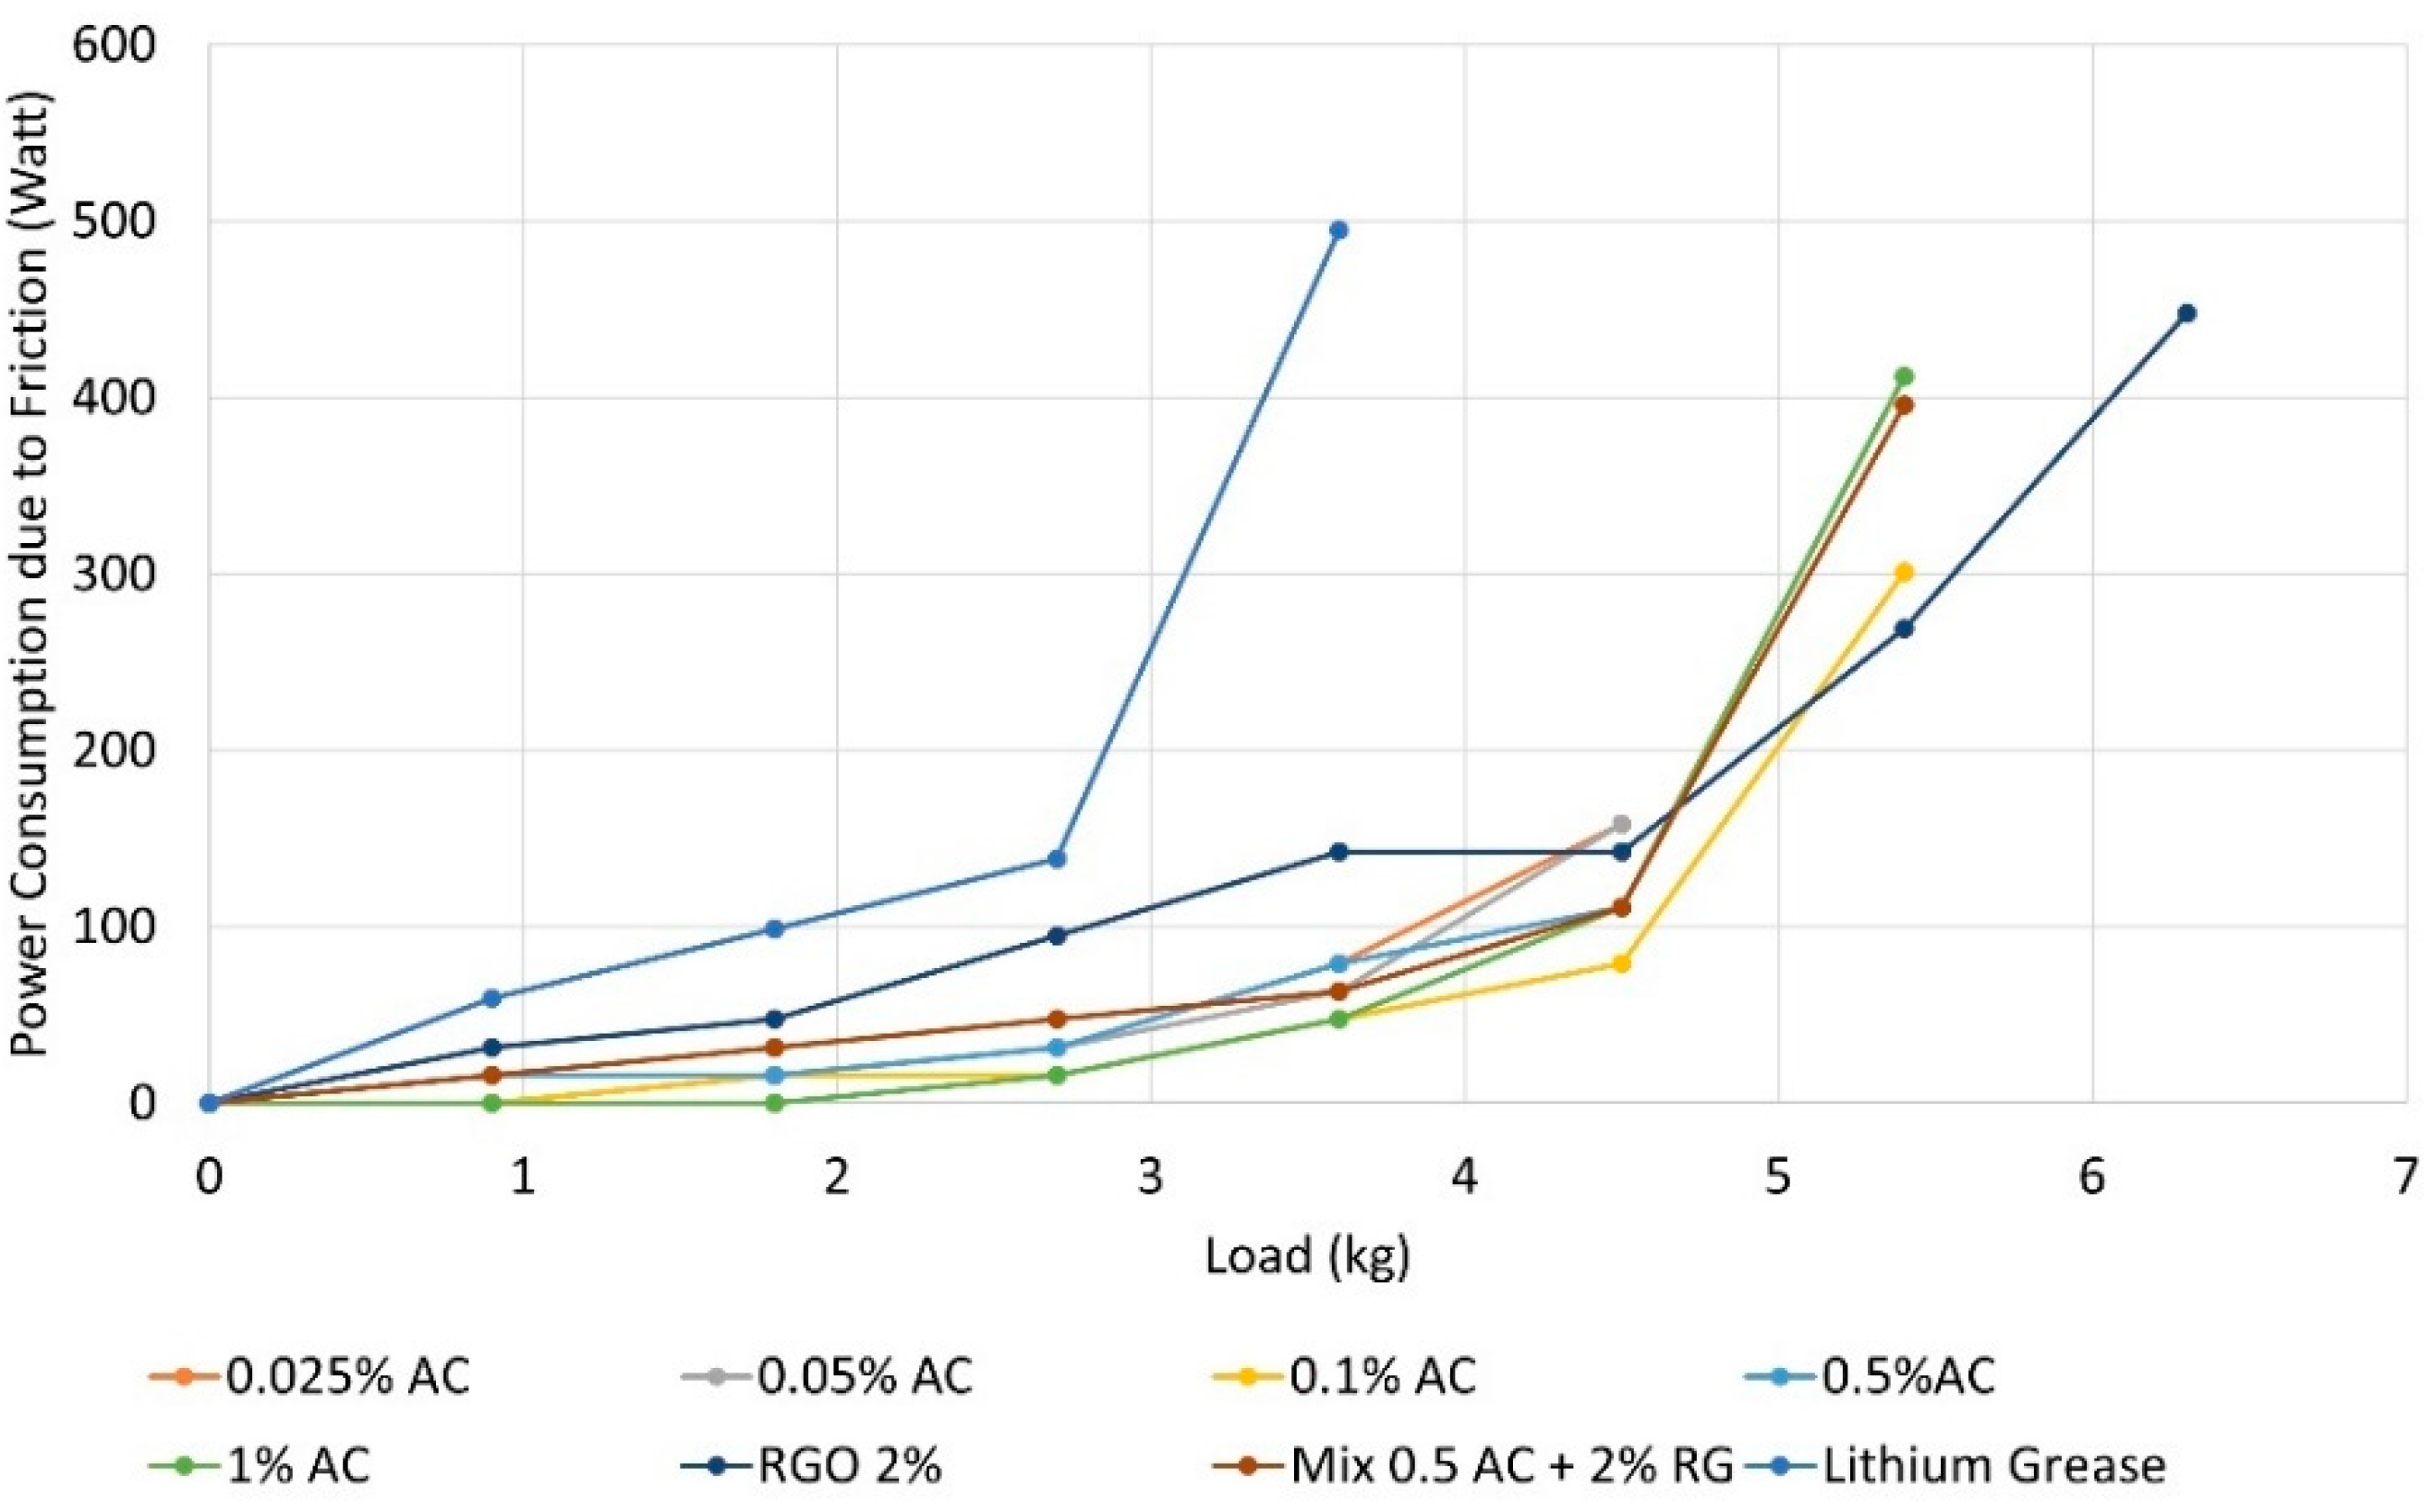
3.2. Load Carrying Capacity Results

In this section, the results of load carrying capacity from the customized tribotester setup are determined and discussed. The non-seizure load values for each lubricant sample are recorded, as shown in Figure 8, where lithium grease, Mobil fibrax 235, and Shell grease are tested for comparison. The results show that all commercial grease types have the lowest load-carrying capacities of nearly 20 N.
The addition of AC improves the load carrying capacity of 25% for 0.05 wt.% and 0.1 wt.%. For the samples containing 0.5 wt.%, 1 wt.% AC as well as for the sample blended with hybrid additive (0.5 wt.% AC + 2 wt.% rGO) the load carrying capacity is improved by 50%. The grease sample containing 2 wt.% rGO nano-additive manifests an improvement of 75% of the load carrying capacity as compared to base greases.

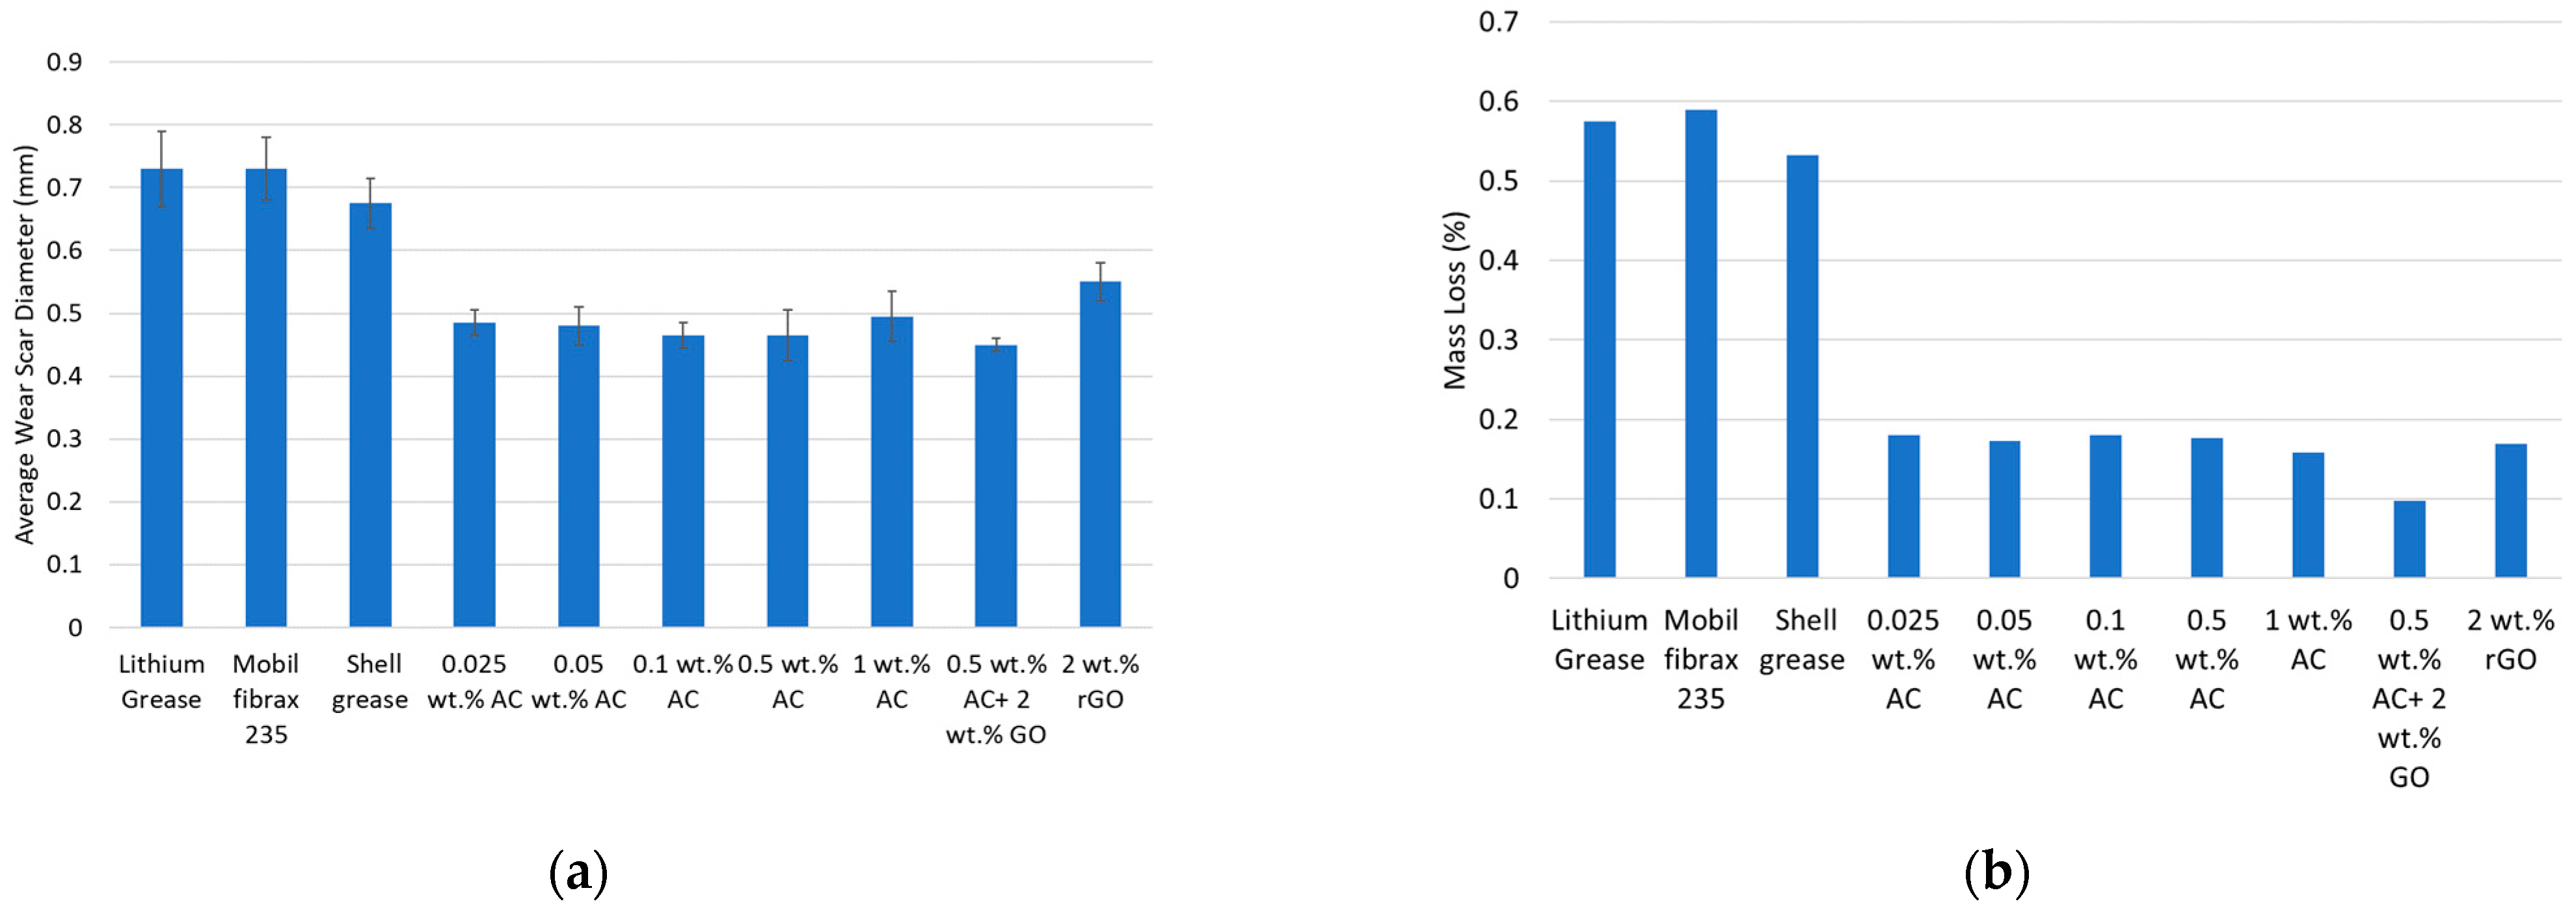
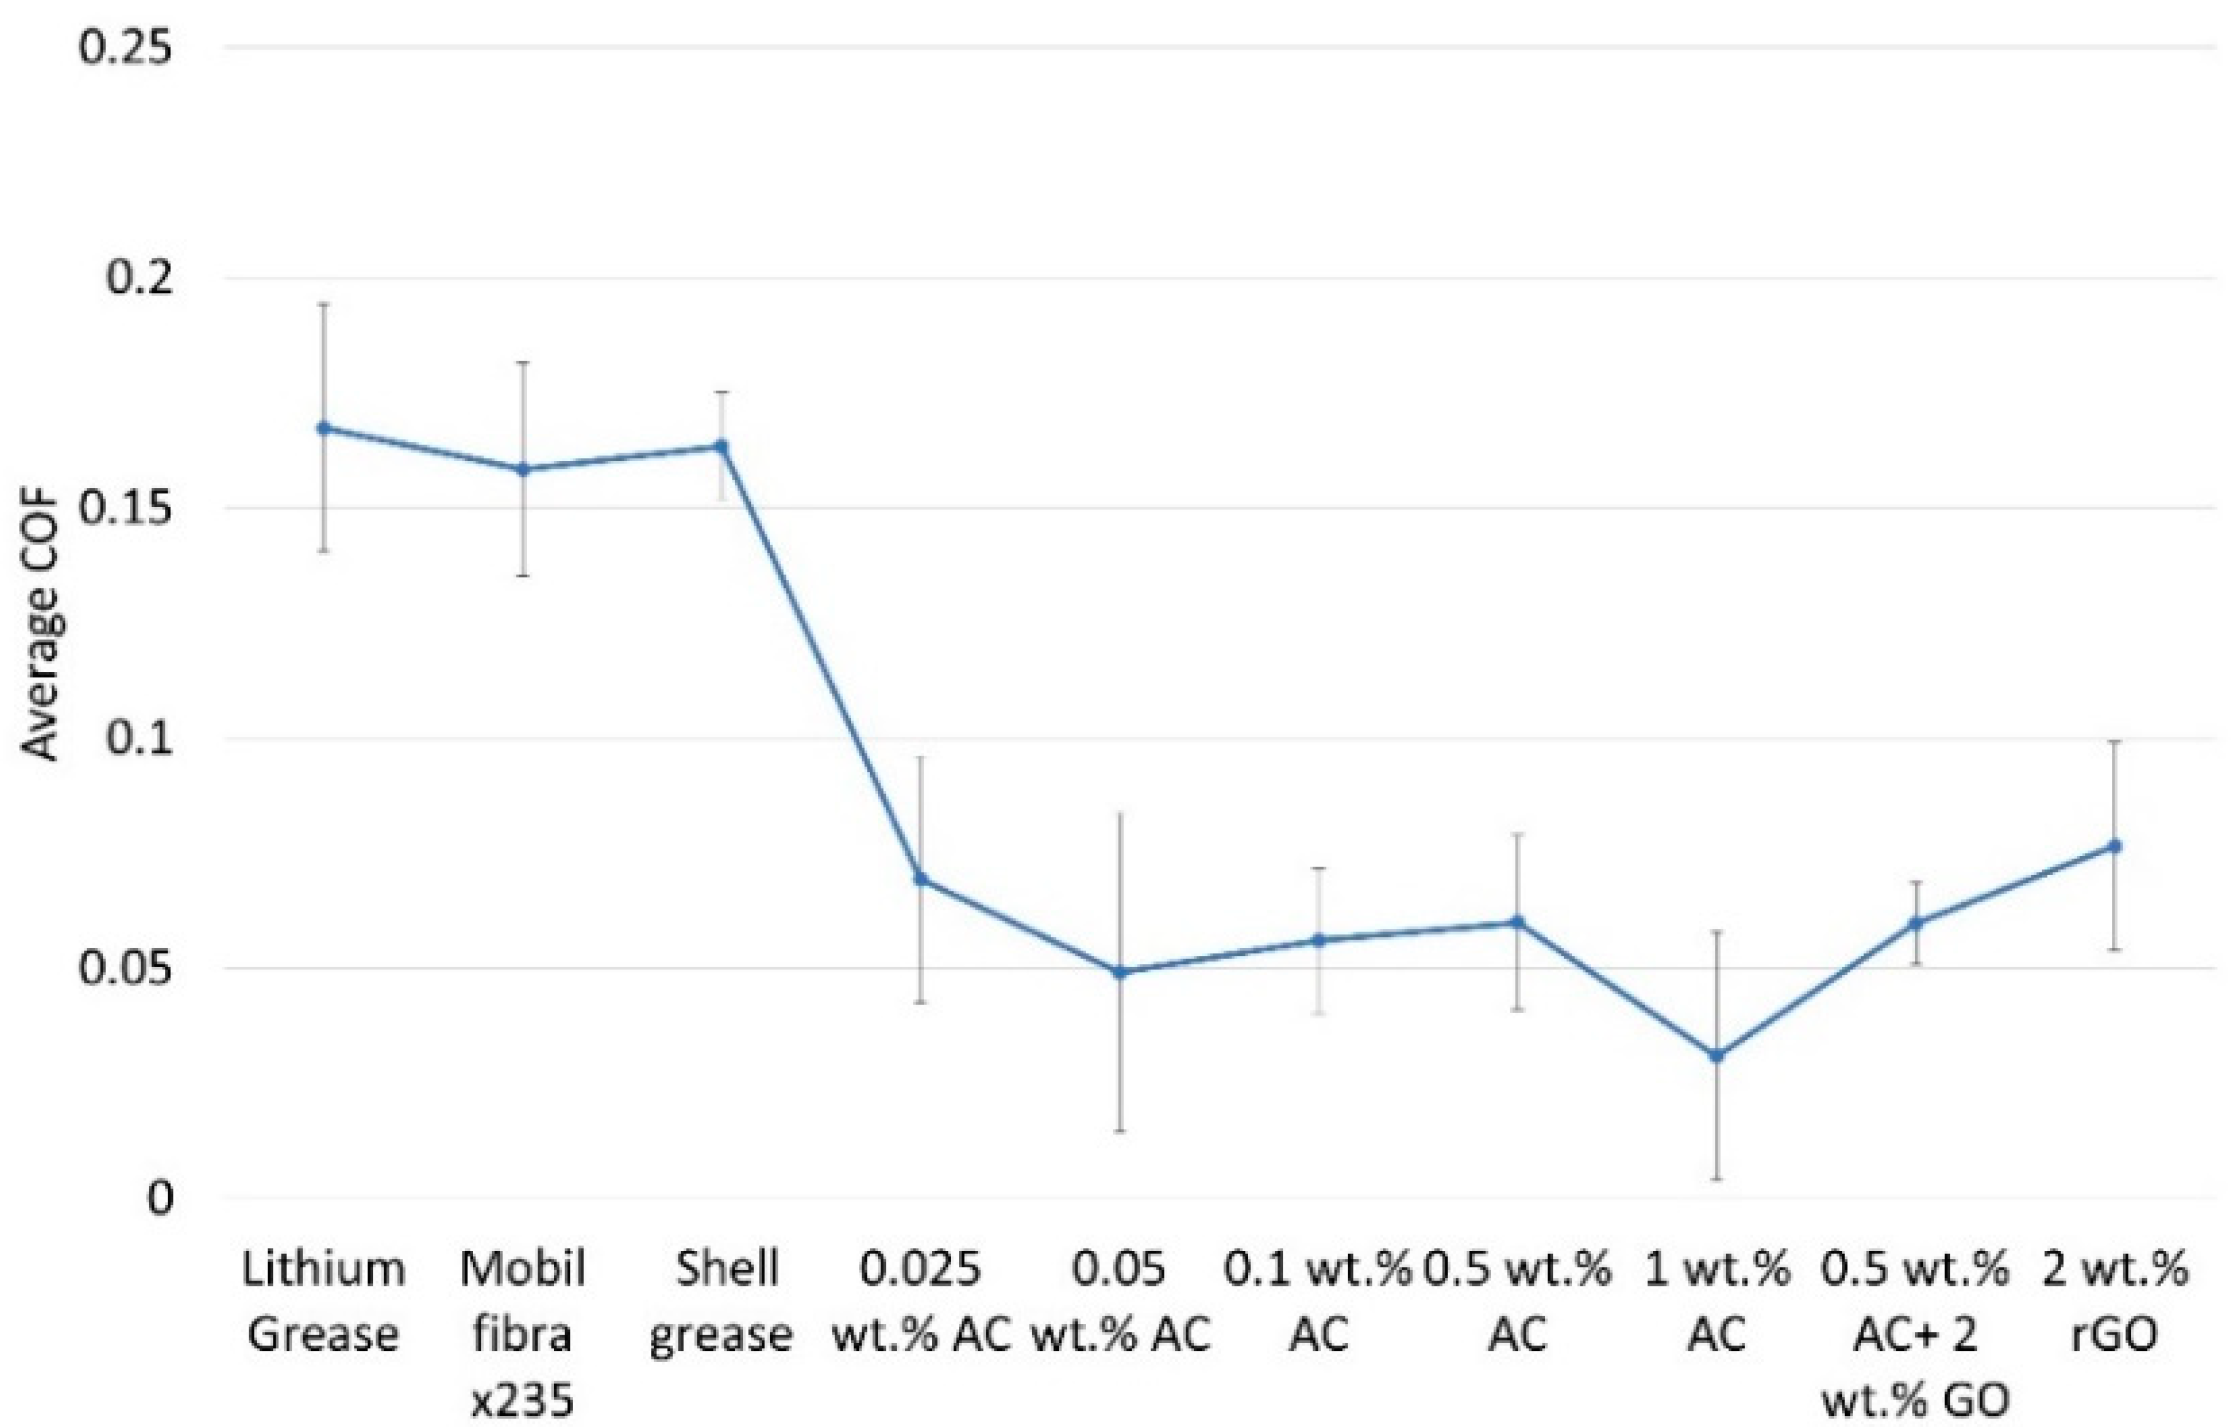
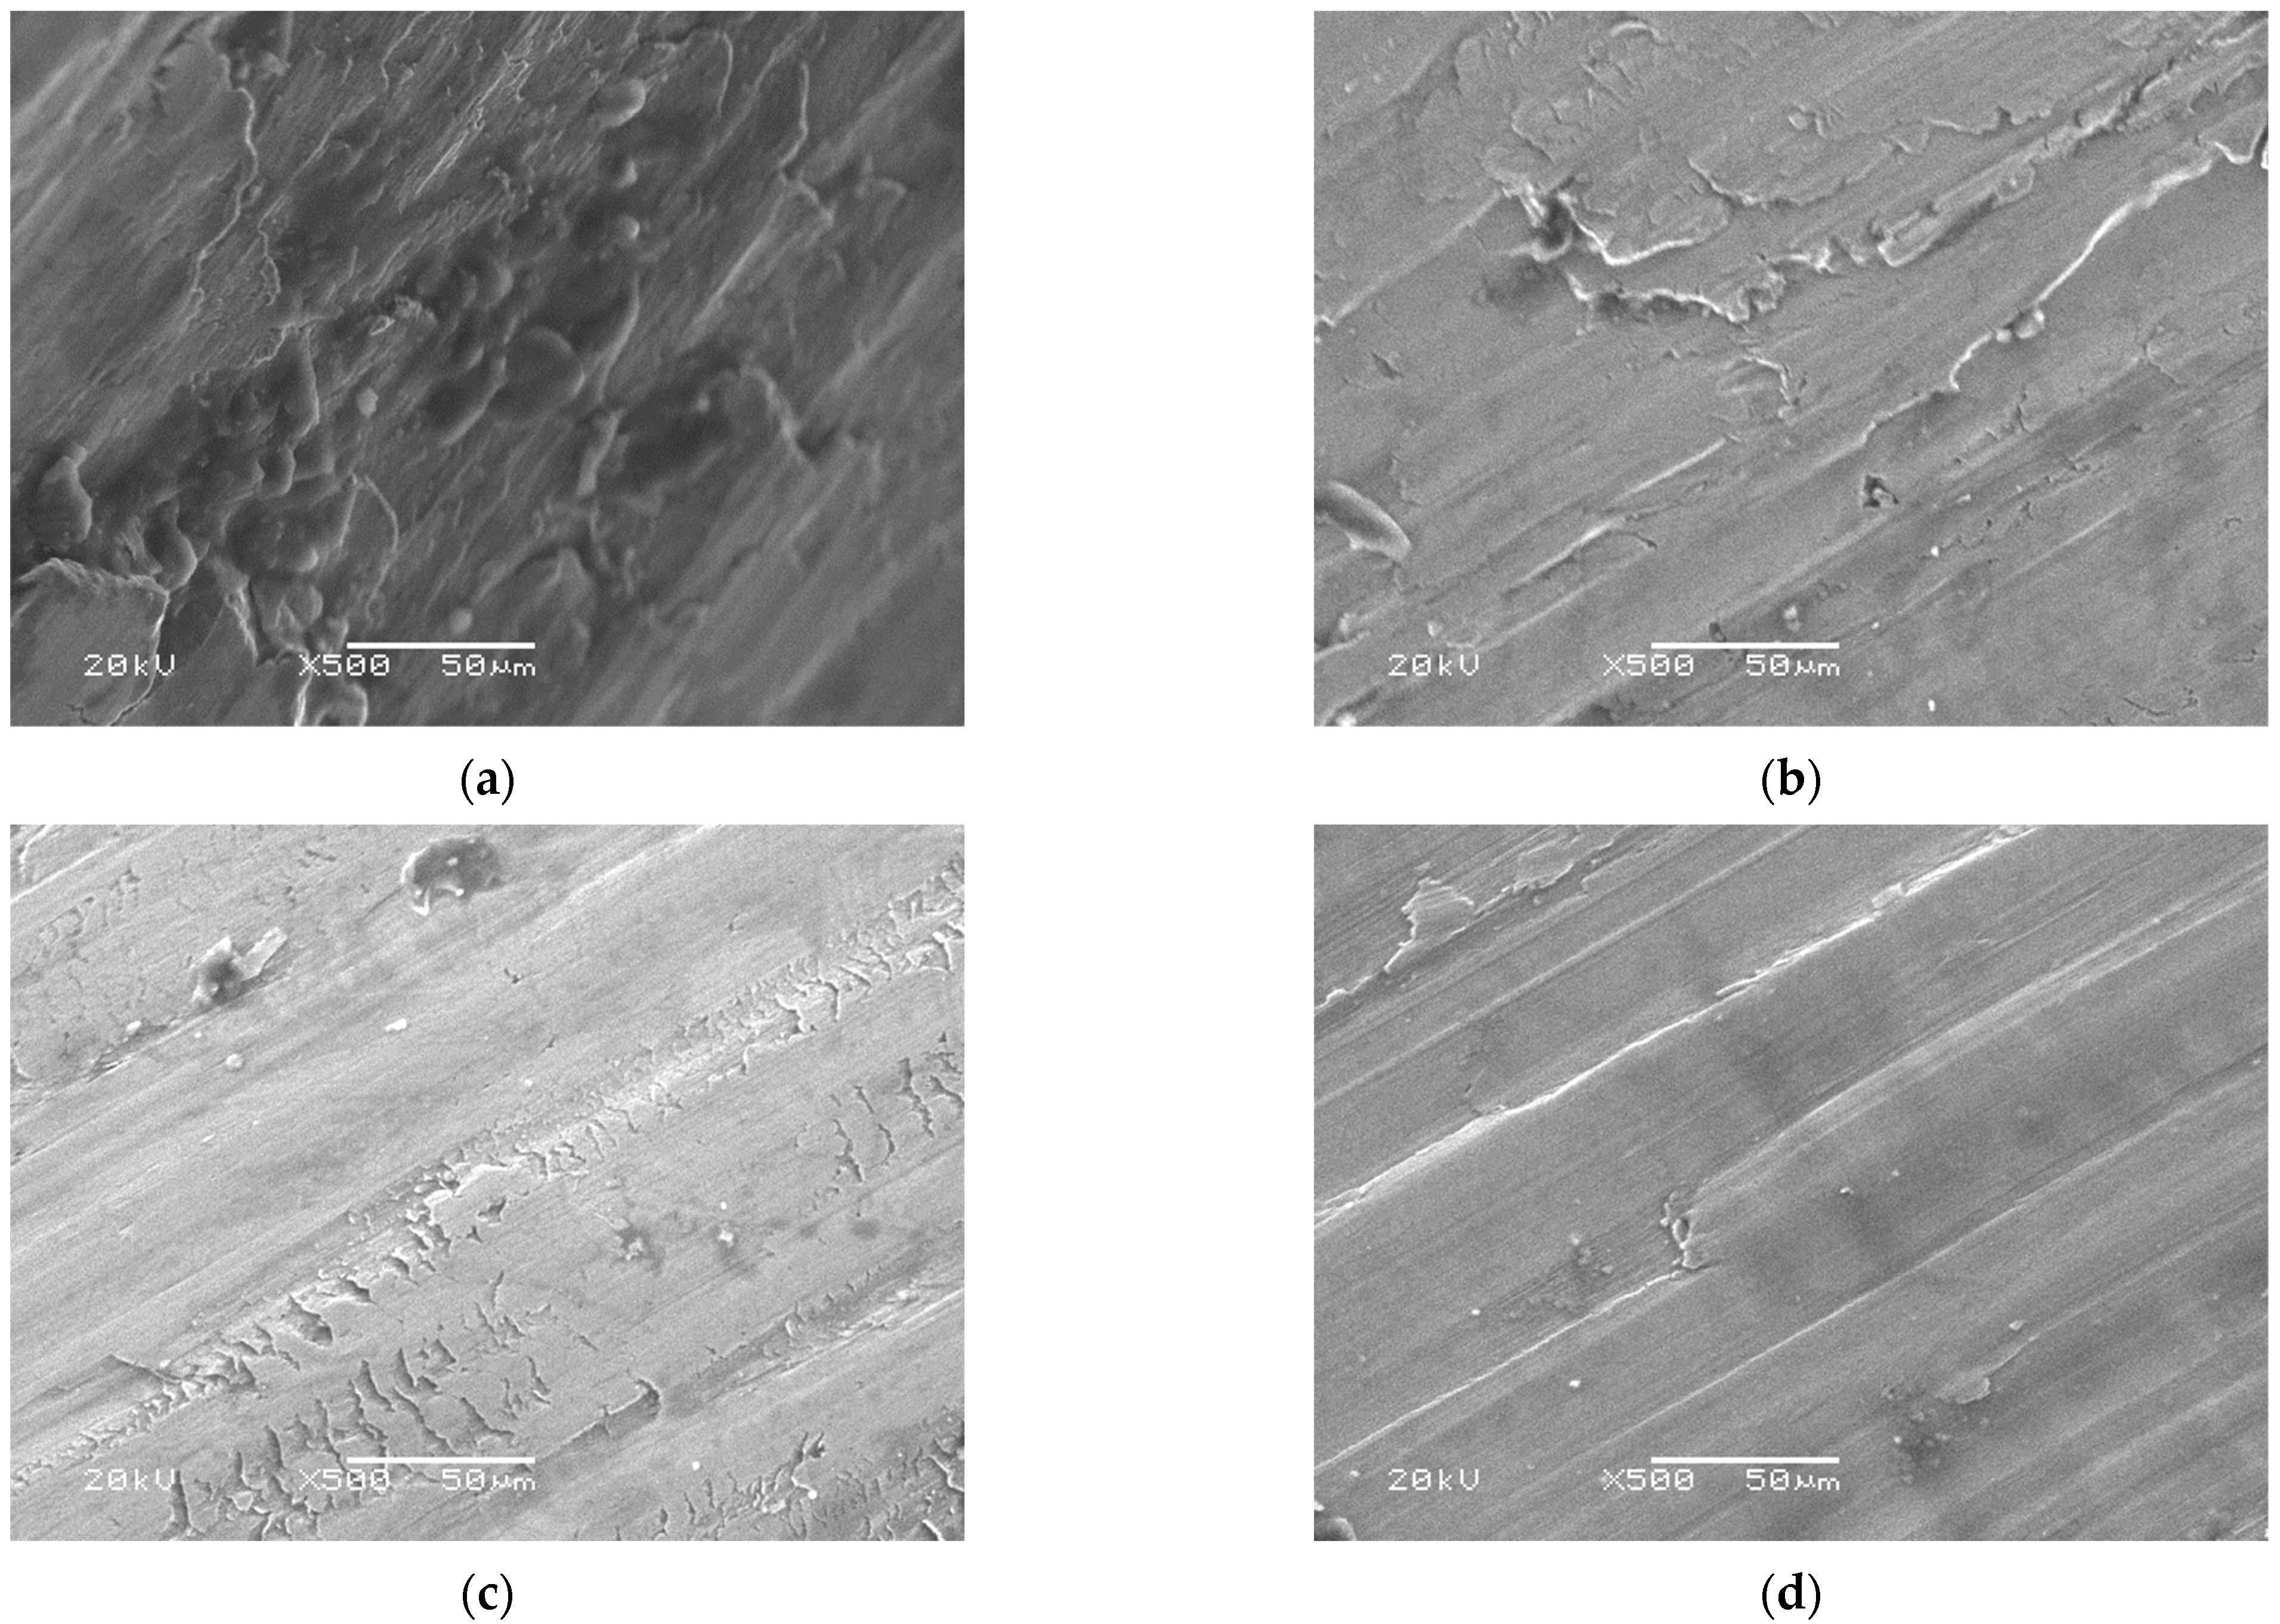
3.3. Wear Properties and Coefficient of Friction

The WSD of the lower test balls using each lubricant blend is determined according to ASTM D2266. Two measurements are taken for the scar on each test ball; one measurement along the striations and the other measurement across the striations. The average WSD and scar area for each test lubricant blend are recorded in Table 2.
It can be seen that the WSD and wear scar area are the largest in the case of commercial lithium grease, Mobil fibrax 235, and Shell grease. Lithium grease with AC nano-additives concentrations reduced the WSD values to 63–67% of those produced in the case of lithium grease. Compared to AC nano-additives, 2 wt.% rGO samples show larger WSD by 10–15%. However, the addition of 0.5 wt.% AC to the 2 wt.% rGO as a hybrid blend reduced the WSD by 18%. This reflects a significant impact of AC nanoparticles in enhancing the anti-wear (AW) properties of the lithium grease lubrication. The calculated mass loss (%) for each lubricant blend follows the same trend of WSD results, as seen in Figure 9a. It is obvious that mass loss is reduced in case of grease samples with AC wt.% by 65–70% as compared to commercial grease samples (without additives), as shown in Figure 9b. In case of the hybrid blend (0.5 wt.% AC + 2 wt.% rGO), the wear weight loss is inhibited by 80% as compared to base grease sample.
The COF values are determined as the average of the obtained individual values at each applied load during 10 min time interval according to formula in ASTM 5183. Figure 10 and Table 3 show that COF values for commercial grease samples are between 0.16 and 0.17. Adding AC nanoparticles to lithium grease reduced COF by different percentages depending on weight content of additive. 1 wt.% AC nano-additives shows the minimum COF value of only 0.031 which is lower than that of 2 wt.% rGO by around two folds. Furthermore, the development of a hybrid additives from 0.5 wt.% AC and 2 wt.% rGO improved the COF value by 20%, in comparison with rGO results, which indicates the effectiveness of AC as a hybrid nano additive element.

4. Discussion

This research addresses the applicability and effectiveness of AC nanoparticles, recycled from polymer waste, as nano-additives to enhance the tribological performance of commercial lithium grease. A 2 wt.% rGO blend is used in this work for comparison as an optimum concentration in grease, reported by previous investigators [23,48]. By observing results of tribological tests, it is clear that the WSD and the reduction in mass loss results have similar trends. However, the mass loss values show a steeper trend when adding AC to grease. For further understanding of mass loss results along with the wear scar topography of the surface, SEM integrated with energy dispersive X-ray (EDX) system is applied. EDX spectra of the wear scar for the test cylinders are determined for SEM images with a magnification of 500× to obtain necessary information from the surface tracks of the wear scar in terms of the precipitated elements (carbon and oxygen) of tribofilms on the contact surface. Figure 11 shows the worn surface morphology when imaged at a magnification 500×. The images depict shallow beside deep grooves in case of commercial grease samples with a rough surface morphology (Figure 11a). On the other hand, the worn surface in the case of AC samples and 2 wt.% rGO (Figure 11b,c) shows shallow grooves with a few spots of deep grooves and a smooth topography, while the scar surface in the case of the hybrid sample of 0.5 wt.%AC + 2 wt.% rGO demonstrates thin grooves only (Figure 11d).
The SEM results have been confirmed by EDX analysis, whose spectra reveal only the carbon and oxygen amounts (related to each other in wt.%) existing in the wear scar. Figure 12a shows the EDX spectrum for the base grease sample, with no obvious oxygen traces, due to the remarkable shielding properties of grease to the lubricated surfaces. By introducing nano-additives to the lubricated surfaces, it is found that the amount of oxygen traces increases as compared to the base grease, which was confirmed by previous investigations [49]. Regarding 1 wt.% AC, it shows a higher contents of C atoms (25.93 wt.%) with a remarkable oxygen amount (74.07 wt.%) as compared to grease only. This finding may be attributed to the porous structure of AC, which allows oxygen atoms to experience a strong presence in the worn surface. Looking at the 2 wt.% rGO additions (shown in Figure 12c), it has the highest carbon presence (70.63 wt.%) with a low content of oxygen, which can be attributed to the integrated, less porous, and layered structure of graphene. Turning to the hybrid sample (0.5 wt.% AC and 2 wt.% rGO) (shown in Figure 12d), it is considered an optimum blend, which experiences an intermediate carbon peak with insignificant oxygen traces compared to 1 wt.% AC. This may be explained by the ability of graphene to surround the porous structure, which inhibits oxidation of the surface. Moreover, graphene additions to AC enhances the tribofilm created between the rubbing contacts, which is proven by the smoothest structure of the hybrid sample in SEM results.
Furthermore, the addition of AC nanoparticles and rGO to grease is believed to alter the sliding wear mechanism into rolling wear mechanism which significantly decreased friction at the contact area [24,50]. AC has a layered structure similar to rGO, which enables it to have self-lubrication characteristics. From BET test results in Table 1, AC have larger surface area (448.88 m2g−1) than rGO surface area values in the range of 110–300 m2g−1 in review of literature [51]. This means that more particles are exposed to rubbing contact between surfaces, which makes AC a better candidate than rGO in reducing wear and COF.
The power consumption due to friction (in kW) is calculated using the available data of test load, current consumption, and applied torque during load carrying capacity test. In Figure 13, the friction power loss increases gradually for all test samples with the in-crease in applied weights until seizure takes place.
In the case of commercial grease samples, the formed tribofilm between contact surfaces provided insufficient protection against friction resulting in significantly higher power consumption than tests with AC and rGO samples. With the gradual increase in test load, the grease tribolayers starts to fail leading to rapid increase in COF value and associated friction power loss until complete seizure at the lowest load carrying capacity among test samples. Adding AC nanoparticles to grease significantly reduced friction power loss due to the large surface area of AC absorbed layers, proved by BET results and rolling wear mechanism of the carbonaceous element. The increase in AC concentration in grease enhanced the COF values and decreased friction power loss. In the case of 2 wt.% rGO, the absorption layer played a major role in reducing the COF and friction power loss with the increase of load showing higher load carrying capacity than AC results due to the higher modulus of elasticity of graphene (1 TBA). The hybrid additive showed lower power loss than 2 wt.% rGO but it still fell within the same level of higher concentration AC sample results.

5. Conclusions

Carbonaceous nano-additives in lubricants have proven to be an efficient solution to control wear and friction which have great significance for energy conservation during machinery operation. On the other hand, the recycling of polymeric waste into valuable carbonaceous materials represents an effective approach to manage this non-degradable accumulated waste. Accordingly, polyethylene terephthalate (PET) waste was converted into nano-activated carbon via pyrolysis to be utilized as economical nano-additives for lubricant. The chemical, textural, and structural properties of the synthesized nano-activated carbon were evaluated using SEM, TEM, BET surface area analysis, EDX, XRD, and FTIR spectroscopy. The average particle diameter of the nano-activated carbon was estimated at 84 nm with high surface area of 448.88 m2g−1. The influence of AC addition to lithium grease samples at 5 different weight ratios is investigated. For comparison, lithium grease with 2 wt.% rGO and with a hybrid of 0.5 wt.% AC + 2 wt.% rGO were prepared and tested. The following highlights were found:
  • Activated nanoparticles enhanced the tribological properties of commercial lithium grease in terms of WSD, COF, and load carrying capacity. Increasing the AC concentration in grease leads to lower power losses due to friction.
  • The highly porous structure of AC promotes its absorption properties leading to the deposition of more stable tribofilm layers to protect the contact surfaces in comparison with rGO (2 wt.%) which is manifested by lower mass loss values. However, rGO shows higher load carrying capacity than AC due to its higher modulus of elasticity.
It was evident that the inclusion of activated carbon nanoparticles to grease lubricant is a promising approach towards enhancing both friction and wear resistance. Hence, this research highlights an effective environmental solution for the activated carbon nanoparticles derived from plastic wastes as novel nano-additives for machinery grease lubrication.

Author Contributions

Conceptualization, G.A.N., M.G.A.N. and M.F.E.; methodology, M.S., B.G.N. and H.S.H.; samples preparation, B.G.N., H.S.H. and M.G.A.N.; validation, M.S., B.G.N. and G.A.N.; formal analysis, M.G.A.N., B.G.N. and H.S.H.; investigation, M.S., M.F.E. and B.G.N.; resources, M.F.E., B.G.N. and M.G.A.N.; data curation, M.G.A.N., H.S.H. and M.F.E.; writing—original draft preparation, B.G.N. and M.G.A.N.; writing—review & editing, G.A.N. and H.S.H.; visualization, M.G.A.N. and M.F.E.; project administration, G.A.N. All authors have read and agreed to the published version of the manuscript.

Funding

This research received no external funding.

Institutional Review Board Statement

Not applicable.

Informed Consent Statement

Not applicable.

Data Availability Statement

Not applicable.

Conflicts of Interest

The authors declare no conflict of interest.

References

  1. He, F.; Xie, G.; Luo, J. Electrical bearing failures in electric vehicles. Friction 2020, 8, 4–28. [Google Scholar] [CrossRef]
  2. Holmberg, K.; Erdemir, A. Influence of tribology on global energy consumption, costs and emissions. Friction 2017, 5, 263–284. [Google Scholar] [CrossRef]
  3. Holmberg, K.; Andersson, P.; Nylund, N.O.; Mäkelä, K.; Erdemir, A. Global energy consumption due to friction in trucks and buses. Tribol. Int. 2014, 78, 94–114. [Google Scholar] [CrossRef]
  4. Jost, H.P. Tribology Micro Macro Economics: A Road to Economic Savings. Tribol. Lubr. Technol. 2005, 61, 18–22. [Google Scholar]
  5. Gupta, B.; Kumar, N.; Panda, K.; Dash, S.; Tyagi, A.K. Energy efficient reduced graphene oxide additives: Mechanism of effective lubrication and antiwear properties. Sci. Rep. 2016, 6, 18372. [Google Scholar] [CrossRef]
  6. Deepika, S. Nanotechnology implications for high performance lubricants. SN Appl. Sci. 2020, 2, 1128. [Google Scholar] [CrossRef]
  7. Rudnick, L.R. Lubricant Additives: Chemistry and Applications, 3rd ed.; CRC Press: Boca Raton, FL, USA, 2009. [Google Scholar]
  8. Townsend, D.; Zaretsky, E.; Scibbe, H. Lubricant and additive effects on spur gear fatigue life. J. Synth. Lubr. 1986, 6, 83–106. [Google Scholar] [CrossRef]
  9. Soul, D.M. 10 Lubricant Additives, Their Application, Performance and Limitations. Tribol. Int. 1983, 8, 242–266. [Google Scholar] [CrossRef]
  10. Nassef, B.G.; Nassef, G.A.; Daha, M.A. Graphene and Its Industrial Applications–A Review. Int. J. Mater. Eng. 2020, 10, 1–12. [Google Scholar] [CrossRef]
  11. Zhang, J.; Li, J.; Wang, A.; Edwards, B.J.; Yin, H.; Li, Z.; Ding, Y. Improvement of the Tribological Properties of a Lithium-Based Grease by Addition of Graphene. J. Nanosci. Nanotechnol. 2018, 18, 7163–7169. [Google Scholar] [CrossRef]
  12. Mohamed, A.; Osman, T.A.; Khattab, A.; Zaki, M. Tribological Behavior of Carbon Nanotubes as an Additive on Lithium Grease. J. Tribol. 2014, 137, 011801. [Google Scholar] [CrossRef]
  13. Rawat, S.S.; Harsha, A.P.; Khatri, O.P.; Wäsche, R. Pristine, Reduced, and Alkylated Graphene Oxide as Additives to Paraffin Grease for Enhancement of Tribological Properties. J. Tribol. 2020, 143, 021903. [Google Scholar] [CrossRef]
  14. Rosenkranz, A.; Liu, Y.; Yang, L.; Chen, L. 2D nano-materials beyond graphene: From synthesis to tribological studies. Appl. Nanosci. 2020, 10, 3353–3388. [Google Scholar] [CrossRef]
  15. Marian, M.; Berman, D.; Rota, A.; Jackson, R.; Rosenkranz, A. Layered 2D Nanomaterials to Tailor Friction and Wear in Machine Elements—A Review. Adv. Mater. 2022, 9, 2101622. [Google Scholar] [CrossRef]
  16. Senatore, A.; Hong, H.; D’Urso, V.; Younes, H. Tribological Behavior of Novel CNTs-Based Lubricant Grease in Steady-State and Fretting Sliding Conditions. Lubricants 2021, 9, 107. [Google Scholar] [CrossRef]
  17. Wu, L.; Xie, Z.; Gu, L.; Song, B.; Wang, L. Investigation of the tribological behavior of graphene oxide nanoplates as lubricant additives for ceramic/steel contact. Tribol. Int. 2018, 128, 113–120. [Google Scholar] [CrossRef]
  18. Kamel, B.M.; Mohamed, A.; El Sherbiny, M.; Abed, K.A.; Abd-Rabou, M. Tribological properties of graphene nanosheets as an additive in calcium grease. J. Disper. Sci. Technol. 2017, 38, 1495–1500. [Google Scholar] [CrossRef]
  19. Cameron, A.; Ocvirk, F.W. Principles of Lubrication. J. Lubr. Tech. 1967, 89, 227. [Google Scholar] [CrossRef]
  20. Yang, Y.; Yamabe, T.; Kim, B.S.; Kim, I.S.; Enomoto, Y. Lubricating Characteristic of Grease Composites with CNT Additive. Tribol. Online 2011, 6, 247–250. [Google Scholar] [CrossRef]
  21. El-Adly, R.; Hussein, M.F.; Mohamed, A. Preparation and evaluation of lubricating greases based on carbon nanotube. Int. J. Adv. Pharm. Biol. Chem. 2015, 4, 675–684. [Google Scholar]
  22. Pape, F.; Poll, G. Investigations on Graphene Platelets as Dry Lubricant and as Grease Additive for Sliding Contacts and Rolling Bearing Application. Lubricants 2020, 8, 3. [Google Scholar] [CrossRef]
  23. Nassef, B.G.; Labban, H.; Al-Oufy, A.; Daha, M.A. Effect of Graphene Addition to Lithium-Based Grease on the Performance of Rolling Element Bearings. Key Eng. Mater. 2022, 913, 279–284. [Google Scholar] [CrossRef]
  24. Talib, N.; Jamaluddin, N.A.; Sheng, T.K.; Kiow, L.W.; Haslina, A.; Said, A.; Aslinda, S. Tribological Study of Activated Carbon Nanoparticle in Nonedible Nanofluid for Machining Application. Evergreen. J. Nov. Carbon Resour. Sci. Green Asia Strategy 2021, 8, 454–460. [Google Scholar] [CrossRef]
  25. Mensah, K.; Mahmoud, H.; Fujii, M.; Shokry, H. Upcycling of Polystyrene Waste Plastics to High Value Carbon by Thermal Decomposition. Key Eng. Mater. 2021, 897, 103–108. [Google Scholar] [CrossRef]
  26. Dias, J.M.; Alvim-Ferraz, M.C.M.; Almeida, M.F.; Rivera-Utrilla, J.; Sánchez-Polo, M. Waste materials for activated carbon preparation and its use in aqueous-phase treatment: A review. J. Environ. Manag. 2007, 85, 833–846. [Google Scholar] [CrossRef]
  27. Mensah, K.; Mahmoud, H.; Fujii, M.; Shokry, H. Novel nano-ferromagnetic activated graphene adsorbent extracted from waste for dye decolonization. J. Water Process Eng. 2022, 45, 102512. [Google Scholar] [CrossRef]
  28. Brisebois, P.P.; Siaj, M. Harvesting graphene oxide—Years 1859 to 2019: A review of its structure, synthesis, properties and exfoliation. J. Mater. Chem. C 2020, 8, 1517–1547. [Google Scholar] [CrossRef]
  29. Kaur, M.; Kaur, H.; Kukkar, D. Synthesis and characterization of graphene oxide using modified Hummer’s method. AIP Conf. Proc. 2018, 1953, 030180. [Google Scholar] [CrossRef]
  30. Sawant, S.Y.; Somani, R.S.; Panda, A.B.; Bajaj, H.C. Formation and characterization of onions shaped carbon soot from plastic wastes. Mater. Lett. 2013, 94, 132–135. [Google Scholar] [CrossRef]
  31. Linares-Solano, A.; Lillo-Rodenas, M.A.; Marco Lozar, J.P.; Kunowsky, M.; Romero Anaya, A.J. NaOH and KOH for preparing activated carbons used in energy and environmental applications. Int. J. Energy Environ. Econ. 2012, 20, 59–92. [Google Scholar]
  32. Thommes, M.; Kaneko, K.; Neimark, A.V.; Olivier, J.P.; Rodriguez-Reinoso, F.; Rouquerol, J.; Sing, K.S.W. Physisorption of gases, with special reference to the evaluation of surface area and pore size distribution (IUPAC Technical Report). Pure Appl. Chem. 2015, 87, 1051–1069. [Google Scholar] [CrossRef]
  33. Daud, W.M.A.W.; Ali, W.S.W.; Sulaiman, M.Z. Effect of carbonization temperature on the yield and porosity of char produced from palm shell. J. Chem. Technol. Biotechnol. 2001, 76, 1281–1285. [Google Scholar] [CrossRef]
  34. El Essawy, N.A.; Ali, S.M.; Farag, H.A.; Konsowa, A.H.; Elnouby, M.; Hamad, H.A. Green synthesis of graphene from recycled PET bottle wastes for use in the adsorption of dyes in aqueous solution. Ecotoxicol. Environ. Saf. 2017, 145, 57–68. [Google Scholar] [CrossRef]
  35. Pol, V.G. Upcycling: Converting waste plastics into paramagnetic, conducting, solid, pure carbon microspheres. Environ. Sci. Technol. 2010, 44, 4753–4759. [Google Scholar] [CrossRef] [PubMed]
  36. Shen, Y.; Lua, A.C. A facile method for the large-scale continuous synthesis of graphene sheets using a novel catalyst. Sci. Rep. 2013, 3, 3037. [Google Scholar] [CrossRef] [PubMed]
  37. Shokry, H.; Elkady, M.; Hamad, H. Nano activated carbon from industrial mine coal as adsorbents for removal of dye from simulated textile wastewater: Operational parameters and mechanism study. J. Mater. Res. Technol. 2019, 8, 4477–4488. [Google Scholar] [CrossRef]
  38. Rai, P.; Singh, K.P. Valorization of Poly (ethylene) terephthalate (PET) wastes into magnetic carbon for adsorption of antibiotic from water: Characterization and application. J. Environ. Manag. 2018, 207, 249–261. [Google Scholar] [CrossRef]
  39. Krishnamoorthy, K.; Veerapandian, M.; Mohan, R.; Kim, S.J. Investigation of Raman and photoluminescence studies of reduced graphene oxide sheets. Appl. Phys. A 2012, 106, 501–506. [Google Scholar] [CrossRef]
  40. Thakur, S.; Karak, N. Green reduction of graphene oxide by aqueous phytoextracts. Carbon 2012, 50, 5331–5339. [Google Scholar] [CrossRef]
  41. Tai, M.J.-Y. Green synthesis of reduced graphene oxide using green tea extract. AIP Conf. Proc. 2018, 2045, 020032. [Google Scholar] [CrossRef]
  42. Song, P.; Cao, Z.; Cai, Y.; Zhao, L.; Fang, Z.; Fu, S. Fabrication of exfoliated graphene-based polypropylene nanocomposites with enhanced mechanical and thermal properties. Polymer 2011, 52, 4001–4010. [Google Scholar] [CrossRef]
  43. Hidayah, N. Comparison on graphite, graphene oxide and reduced graphene oxide: Synthesis and characterization. AIP Conf. Proc. 2017, 1892, 150002. [Google Scholar] [CrossRef]
  44. Stankovich, S.; Dikin, D.A.; Piner, R.D.; Kohlhaas, K.A.; Kleinhammes, A.; Jia, Y.; Wu, Y.; Nguyen, S.T.; Ruoff, R.S. Synthesis of graphene-based nanosheets via chemical reduction of exfoliated graphite oxide. Carbon 2007, 45, 1558–1565. [Google Scholar] [CrossRef]
  45. Tuinstra, F.; Koenig, J.L. Raman spectrum of graphite. J. Chem. Phys. 1970, 53, 1126–1130. [Google Scholar] [CrossRef]
  46. Ferrari, A.C.; Meyer, J.C.; Scardaci, V.; Casiraghi, C.; Lazzeri, M.; Mauri, F.; Piscanec, S.; Jiang, D.; Novoselov, K.S.; Roth, S.; et al. Raman Spectrum of Graphene and Graphene Layers. Phys. Rev. Lett. 2006, 97, 187401. [Google Scholar] [CrossRef]
  47. Gupta, B.; Kumar, N.; Panda, K.; Kanan, V.; Joshi, S.; Visoly-Fisher, I. Role of oxygen functional groups in reduced graphene oxide for lubrication. Sci. Rep. 2017, 7, 45030. [Google Scholar] [CrossRef]
  48. Nassef, M.G.A.; Soliman, M.; Nassef, B.G.; Daha, M.A.; Nassef, G.A. Impact of Graphene Nano-Additives to Lithium Grease on the Dynamic and Tribological Behavior of Rolling Bearings. Lubricants 2022, 10, 29. [Google Scholar] [CrossRef]
  49. Vyavhare, K.; Aswath, P.B. Tribological Properties of Novel Multi-Walled Carbon Nanotubes and Phosphorus Containing Ionic Liquid Hybrids in Grease. Front. Mech. Eng. 2019, 5, 15. [Google Scholar] [CrossRef]
  50. Senatore, A.; D’Agostino, V.; Petrone, V.; Ciambelli, P.; Sarno, M. Graphene Oxide Nanosheets as Effective Friction Modifier for Oil Lubricant: Materials, Methods, and Tribological Results. Int. Sch. Res. Not. 2013, 9, 2013. [Google Scholar] [CrossRef]
  51. Rahim, A.H.; Ramli, N.; Nordin, A.N.; Abd. Wahab, M.F. Supercapacitor performance with activated carbon and graphene nanoplatelets composite electrodes, and insights from the equivalent circuit model. Carbon Trends 2021, 5, 100101. [Google Scholar] [CrossRef]
Figure 1. (a) Electric Grain Spices Multifunctional grinder (b) synthesized AC powder.
Lubricants 10 00214 g001
Figure 2. A customized tribotester for determining the carrying load capacity of grease samples.
Lubricants 10 00214 g002
Figure 3. (a) SEM micrograph, (b) TEM micrograph of ACNPs.
Lubricants 10 00214 g003
Figure 4. (a) XRD pattern and (b) Raman spectrum of synthesized AC.
Lubricants 10 00214 g004
Figure 5. FTIR spectra of the synthetic AC.
Lubricants 10 00214 g005
Figure 6. (a) TEM analysis of rGO structure with a resolution of 50 nm, (b) TEM analysis of rGO structure with a resolution of 200 nm, (c) XRD pattern of reduced graphene oxide, (d) Raman spectrum of rGO sample.
Lubricants 10 00214 g006
Figure 7. FTIR analysis results of rGO sample.
Lubricants 10 00214 g007
Figure 8. Load carrying capacity (Non-seizure Load) values for test samples.
Lubricants 10 00214 g008
Figure 9. (a) WSD, (b) Mass loss values for all test samples.
Lubricants 10 00214 g009
Figure 10. Average friction coefficient values for all samples.
Lubricants 10 00214 g010
Figure 11. SEM images at magnification 500× of the wear scars from the customized tribotester setup for test samples: (a) lithium grease, (b) 1 wt.% AC, (c) 2 wt.% rGO, and (d) 0.5 wt.% AC + 2 wt.% rGO.
Lubricants 10 00214 g011
Figure 12. EDX spectra for SEM wear scars images at magnification 500× for test samples: (a) lithium grease, (b) 1 wt.% AC, (c) 2 wt.% rGO, and (d) 0.5 wt.% AC + 2 wt.% rGO.
Lubricants 10 00214 g012
Figure 13. Power consumption values due to friction for all samples under different loading conditions.
Lubricants 10 00214 g013
Table 1. BET surface area, total pore volume, and mean pore diameter and of AC nano-powder.
SampleBET Surface Area (m2 g−1)Total Pore Volume (cm3 g−1)Mean Pore Diameter (nm)
AC448.880.20291.808
Table 2. Average WSD and corresponding wear area and mass loss for the test lower balls.
SampleTest GreaseAverage WSD (mm)Relative Reduction in WSD (%)Wear Scar Area (mm2)Relative Reduction in Wear Scar Area (%)Mass Loss (g)
1Lithium Grease0.73100%0.418100.000.0633
2Mobil fibrax 2350.73100%0.418100.000.065
3Shell grease0.67592.47%0.35785.500.0587
40.025 wt.% AC0.48566.44%0.18544.140.0087
50.05 wt.% AC0.4865.75%0.18043.240.019
60.1 wt.% AC0.46563.70%0.16940.580.0199
70.5 wt.% AC0.46563.70%0.16940.580.0195
81 wt.% AC0.49567.81%0.19245.980.0174
90.5 wt.% AC + 2 wt.% rGO0.4561.64%0.15838.000.0107
102 wt.% rGO0.5575.34%0.2456.760.0186
Table 3. Average COF and relative improvement for the test lower balls.
SampleTest GreaseAverage COF Relative Reduction in COF (%)
1Lithium Grease0.17100.00
2Mobil fibrax 2350.1694.62
3Shell grease0.1697.61
40.025 wt.% AC0.0741.43
50.05 wt.% AC0.0529.37
60.1 wt.% AC0.0633.48
70.5 wt.% AC0.0635.84
81 wt.% AC0.0318.48
90.5 wt.% AC + 2 wt.% rGO0.0635.71
102 wt.% rGO0.0845.76
Publisher’s Note: MDPI stays neutral with regard to jurisdictional claims in published maps and institutional affiliations.

