Influence of Adsorption Characteristics of Surfactants Sodium Dodecyl Sulfate and Aerosol–OT on Dynamic Process of Water-Based Lubrication


 , , ,
, , , 
Abstract
:1. Introduction
2. Materials and Methods
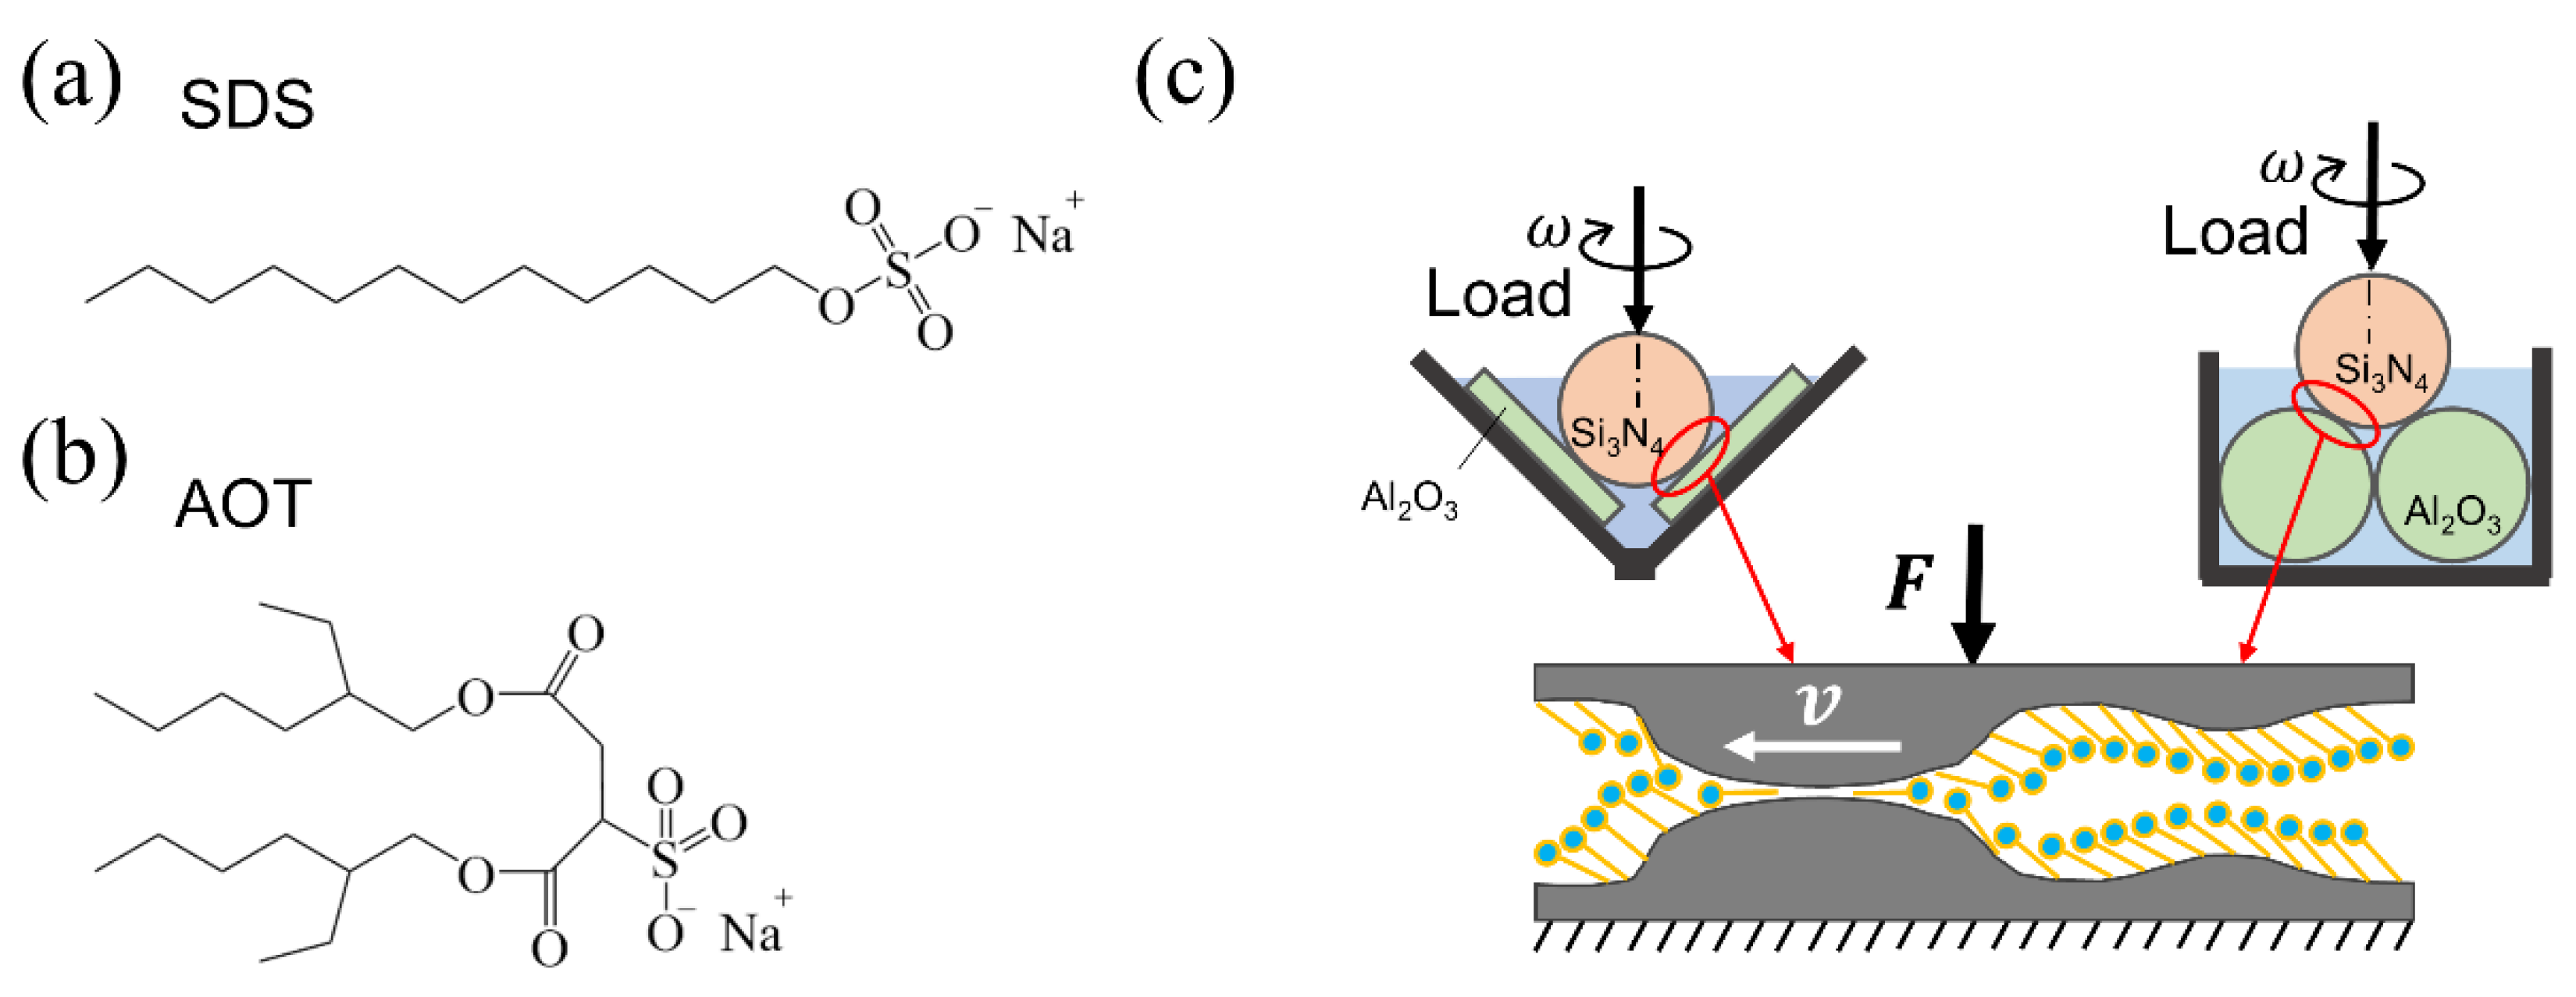
2.1. Materials
2.2. Tribology Tests
2.3. Adsorption Measurement at Solid–Liquid Interface
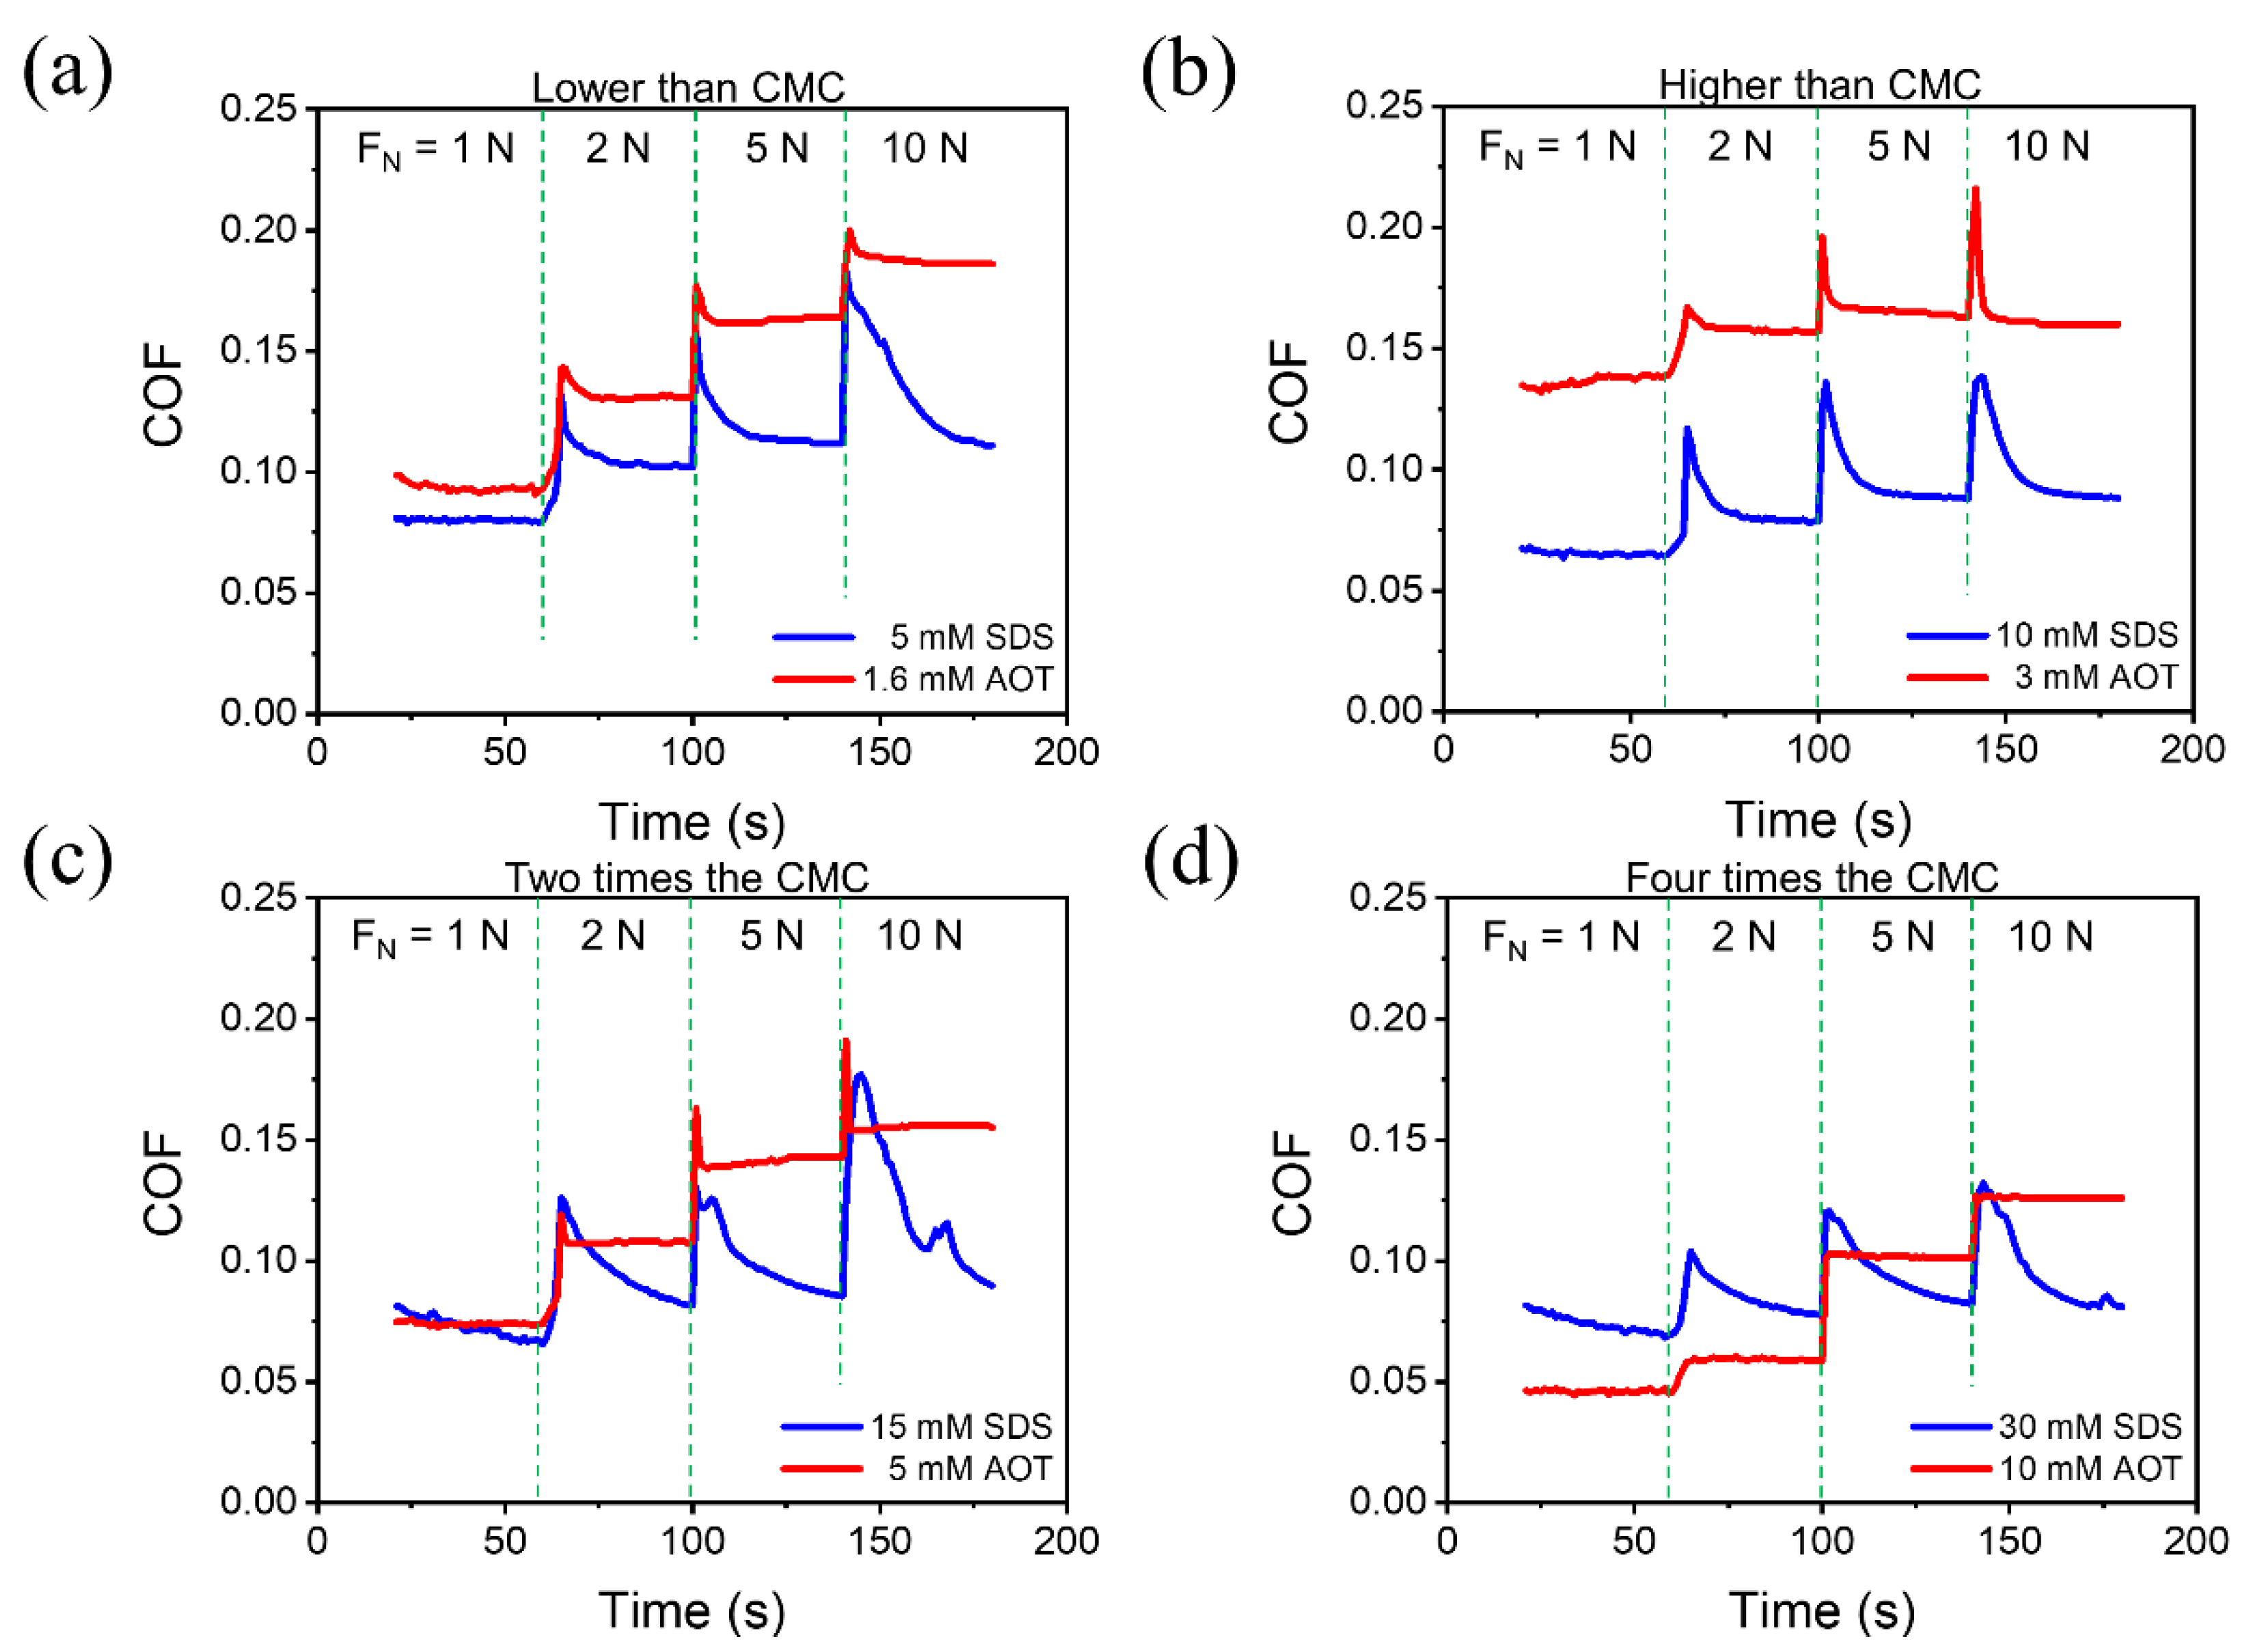
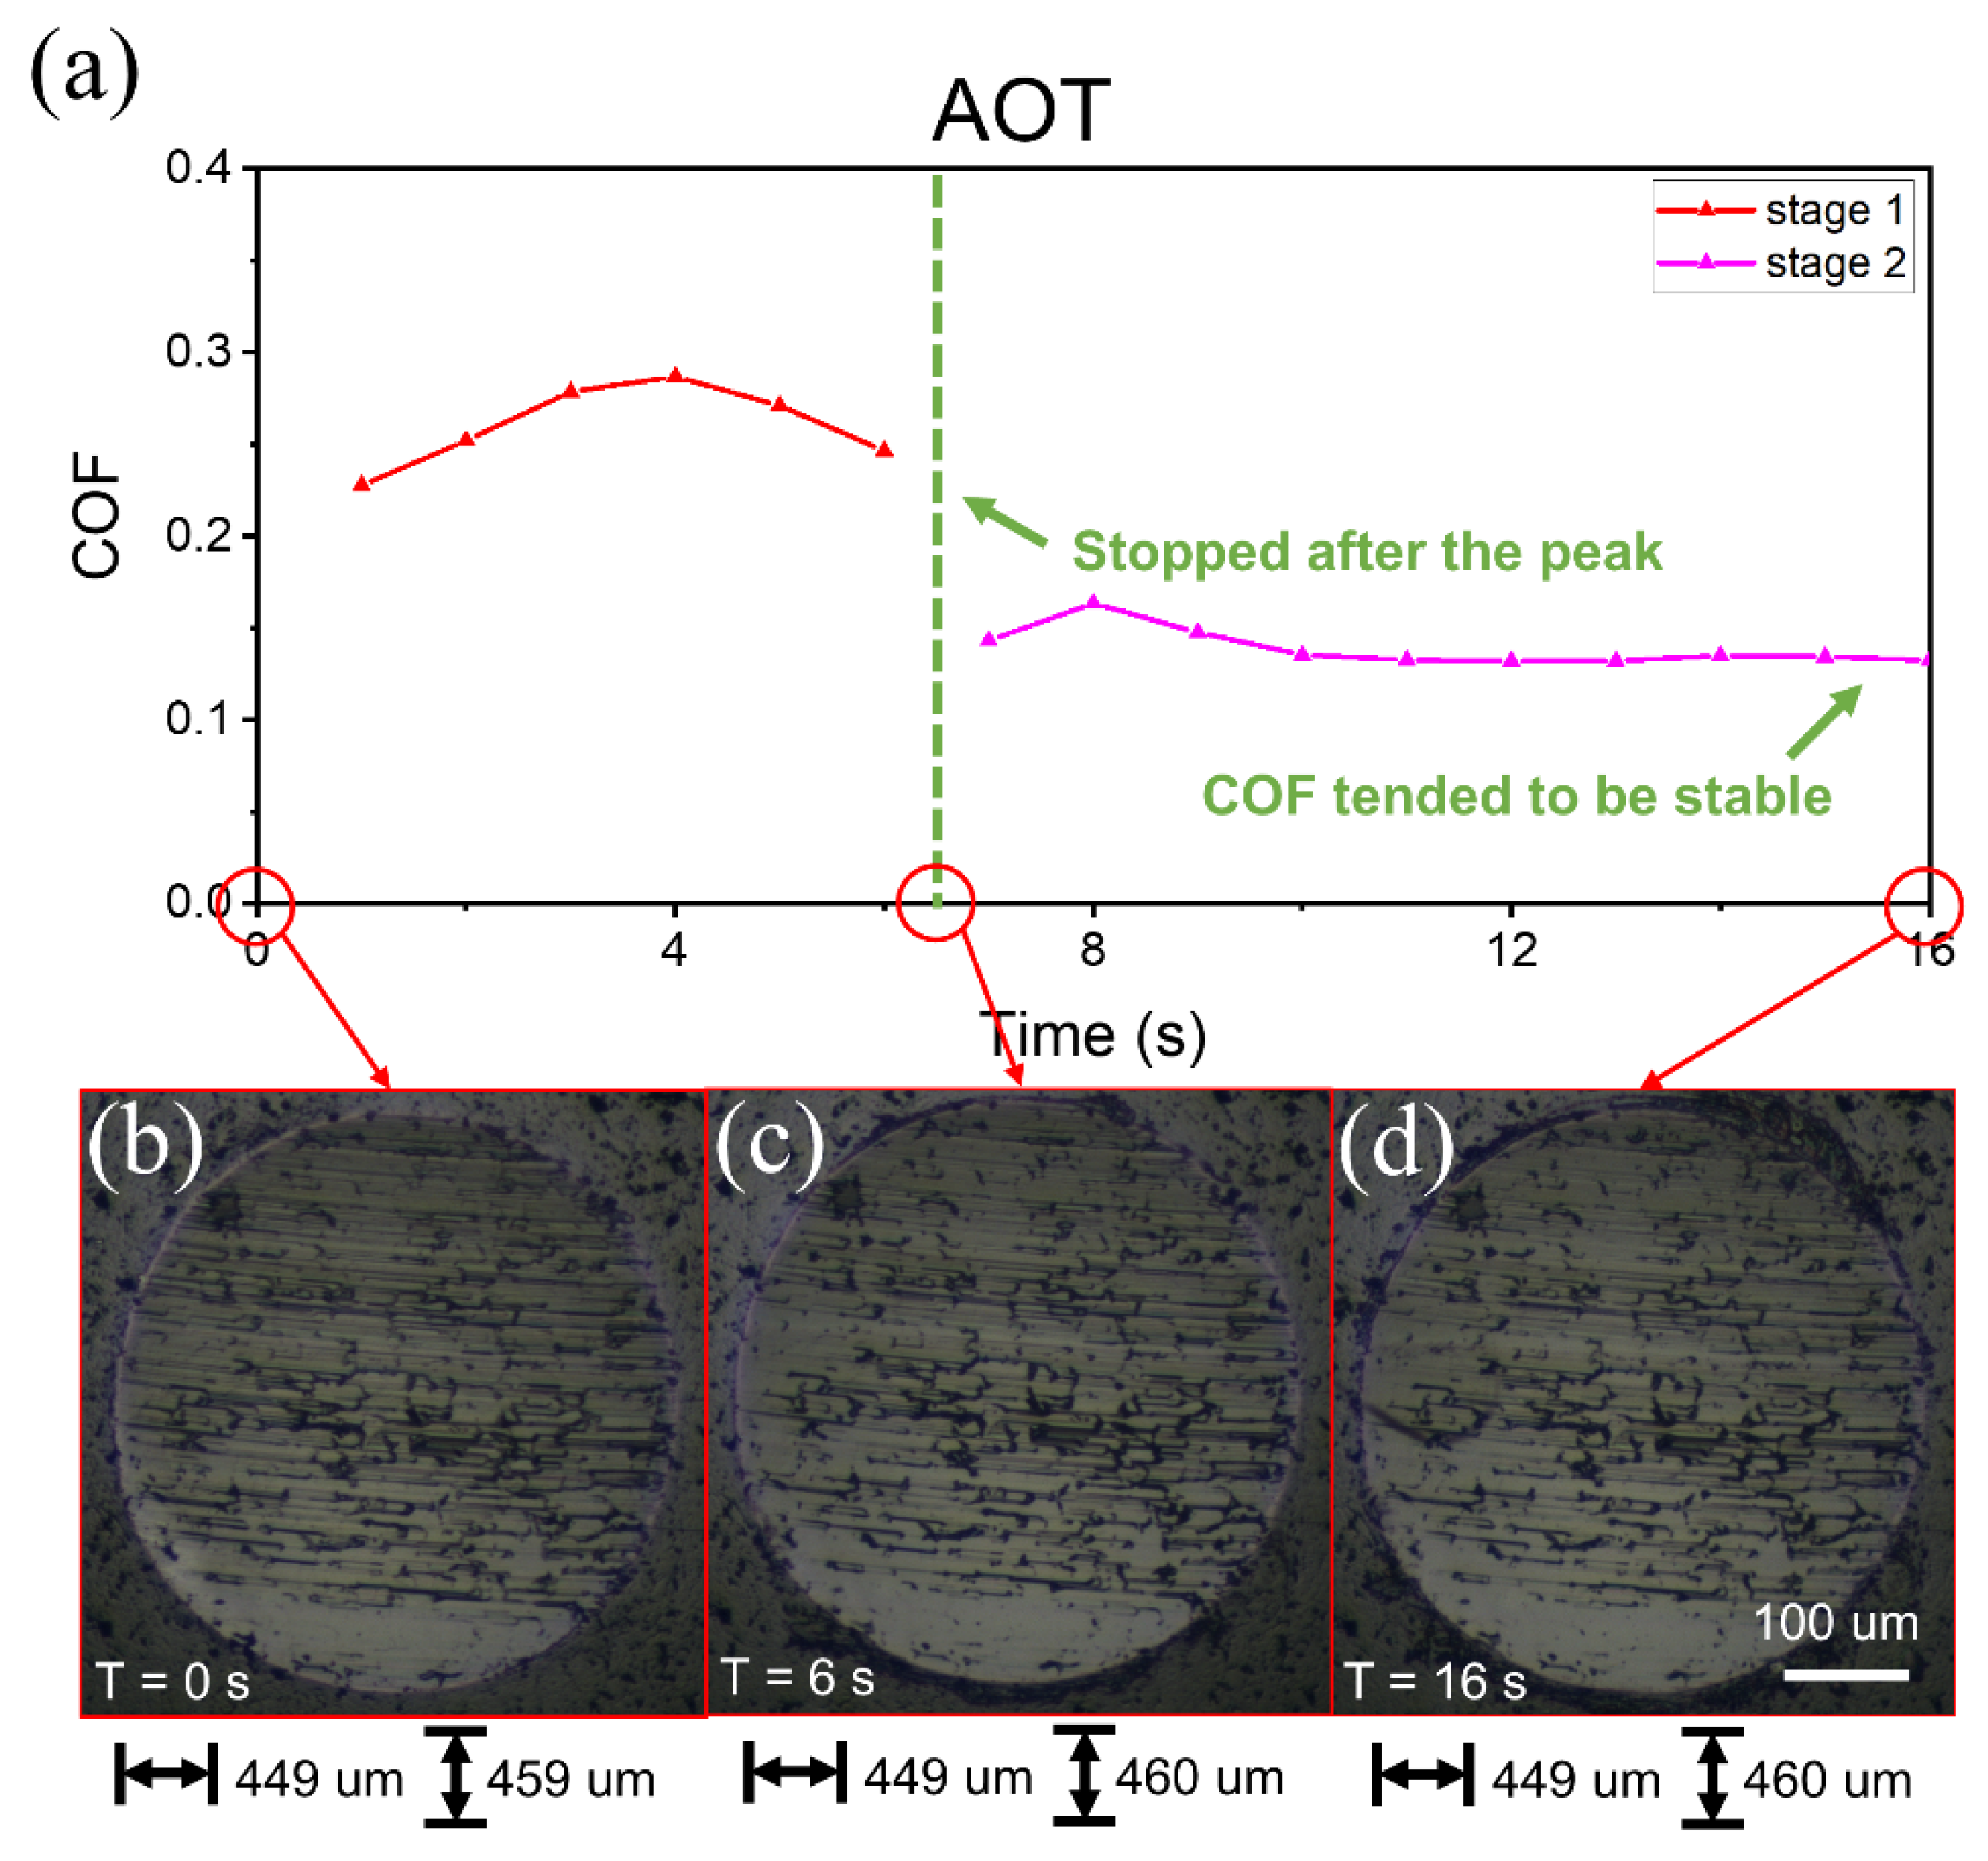
3. Results
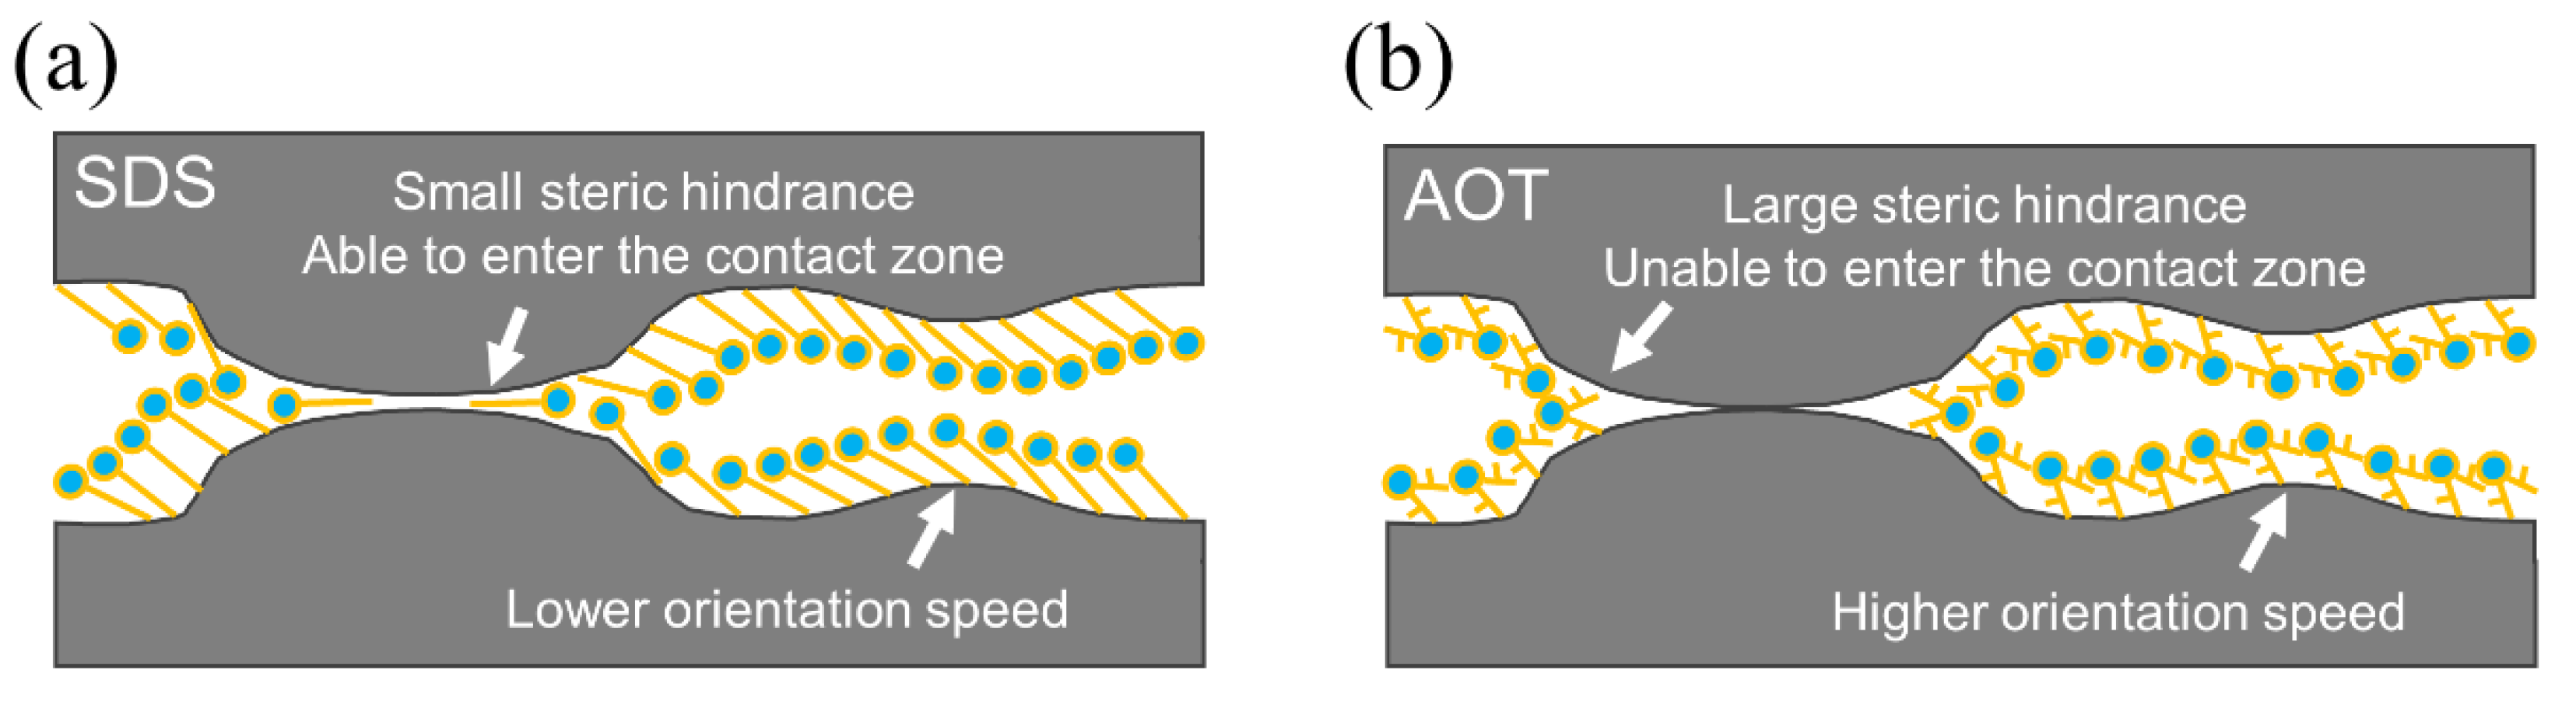
4. Discussion
5. Conclusions
Author Contributions
Funding
Data Availability Statement
Conflicts of Interest
References
- Klein, J. Hydration lubrication. Friction 2013, 1, 1–23. [Google Scholar] [CrossRef] [Green Version]
- Ma, L.; Zhang, C.; Liu, S. Progress in experimental study of aqueous lubrication. Chin. Sci. Bull. 2012, 57, 2062–2069. [Google Scholar] [CrossRef] [Green Version]
- Wang, H.; Liu, Y. Superlubricity achieved with two-dimensional nano-additives to liquid lubricants. Friction 2020, 8, 1007–1024. [Google Scholar] [CrossRef]
- Dong, R.; Yu, Q.; Bai, Y.; Wu, Y.; Ma, Z.; Zhang, J.; Zhang, C.; Yu, B.; Zhou, F.; Liu, W.; et al. Towards superior lubricity and anticorrosion performances of proton-type ionic liquids additives for water-based lubricating fluids. Chem. Eng. J. 2020, 383, 123201. [Google Scholar] [CrossRef]
- Wang, Y.; Cui, L.L.; Cheng, G.G.; Yuan, N.Y.; Ding, J.N.; Pesika, N.S. Water-Based Lubrication of Hard Carbon Microspheres as Lubricating Additives. Tribol. Lett. 2018, 66, 148. [Google Scholar] [CrossRef]
- Chen, W.; Amann, T.; Kailer, A.; Ruhe, J. Macroscopic Friction Studies of Alkylglucopyranosides as Additives for Water-Based Lubricants. Lubricants 2020, 8, 11. [Google Scholar] [CrossRef] [Green Version]
- Spikes, H. Friction Modifier Additives. Tribol. Lett. 2015, 60, 5. [Google Scholar] [CrossRef] [Green Version]
- Bowden, F.P.; Leben, L. The friction of lubricated metals. Philos T R Soc S-A 1940, 239, 1-U10. [Google Scholar]
- Hardy, W.B. Boundary lubrication—The paraffin series. P R Soc Lond A-Conta 1922, 100, 550–574. [Google Scholar]
- Okabe, H.; Masuko, M.; Sakurai, K. Dynamic Behavior of Surface-Adsorbed Molecules under Boundary Lubrication. Asle Trans. 1981, 24, 467–473. [Google Scholar] [CrossRef]
- Pesika, N.S.; Stebe, K.J.; Searson, P.C. Kinetics of desorption of alkanethiolates on gold. Langmuir 2006, 22, 3474–3476. [Google Scholar] [CrossRef] [PubMed]
- Jahanmir, S.; Beltzer, M. Effect of Additive Molecular-Structure on Friction Coefficient and Adsorption. J. Tribol. 1986, 108, 109–116. [Google Scholar] [CrossRef]
- Jahanmir, S.; Beltzer, M. An Adsorption Model for Friction in Boundary Lubrication. ASLE Trans. 1986, 29, 423–430. [Google Scholar] [CrossRef]
- Beltzer, M.; Jahanmir, S. Role of Dispersion Interactions between Hydrocarbon Chains in Boundary Lubrication. Asle Trans. 1987, 30, 47–54. [Google Scholar] [CrossRef]
- Yu, B.J.; Qian, L.M.; Yu, J.X.; Zhou, Z.R. Effects of Tail Group and Chain Length on the Tribological Behaviors of Self-Assembled Dual-Layer Films in Atmosphere and in Vacuum. Tribol. Lett. 2009, 34, 1–10. [Google Scholar] [CrossRef]
- Blau, P.J. On the nature of running-in. Tribol. Int. 2005, 38, 1007–1012. [Google Scholar] [CrossRef]
- Khonsari, M.M.; Ghatrehsamani, S.; Akbarzadeh, S. On the running-in nature of metallic tribo-components: A review. Wear 2021, 474, 203871. [Google Scholar] [CrossRef]
- Li, J.; Zhang, C.; Luo, J. Superlubricity behavior with phosphoric acid-water network induced by rubbing. Langmuir 2011, 27, 9413–9417. [Google Scholar] [CrossRef]
- Jia, W.; Bai, P.; Zhang, W.; Ma, L.; Meng, Y.; Tian, Y. On Lubrication States after a Running-In Process in Aqueous Lubrication. Langmuir 2019, 35, 15435–15443. [Google Scholar] [CrossRef] [PubMed]
- Ken Nakano, H.A.S. Process of Boundary Film Formation from Fatty Acid Solution. Tribol. Online 2012, 7, 1–7. [Google Scholar] [CrossRef] [Green Version]
- Fry, B.M.; Moody, G.; Spikes, H.A.; Wong, J.S.S. Adsorption of Organic Friction Modifier Additives. Langmuir 2020, 36, 1147–1155. [Google Scholar] [CrossRef] [PubMed]
- Hirayama, T.; Maeda, M.; Sasaki, Y.; Matsuoka, T.; Komiya, H.; Hino, M. Growth of adsorbed additive layer for further friction reduction. Lubr. Sci. 2019, 31, 171–178. [Google Scholar] [CrossRef]
- Khanmohammadi, H.; Wijanarko, W.; Espallargas, N. Ionic Liquids as Additives in Water-Based Lubricants: From Surface Adsorption to Tribofilm Formation. Tribol. Lett. 2020, 68, 130. [Google Scholar] [CrossRef]
- Chen, W.; Amann, T.; Kailer, A.; Ruhe, J. Thin-Film Lubrication in the Water/Octyl beta-d-Glucopyranoside System: Macroscopic and Nanoscopic Tribological Behavior. Langmuir 2019, 35, 7136–7145. [Google Scholar] [CrossRef] [PubMed]
- Ewen, J.P.; Gattinoni, C.; Morgan, N.; Spikes, H.A.; Dini, D. Nonequilibrium Molecular Dynamics Simulations of Organic Friction Modifiers Adsorbed on Iron Oxide Surfaces. Langmuir 2016, 32, 4450–4463. [Google Scholar] [CrossRef] [PubMed] [Green Version]
- Charrault, E.; Banquy, X.; Kristiansen, K.; Israelachvili, J.; Giasson, S. Investigation on the Molecular Shear-Induced Organization in a Molecularly Thin Film of N-hexadecane. Tribol. Lett. 2013, 50, 421–430. [Google Scholar] [CrossRef]
- Gao, M.; Li, H.; Ma, L.; Gao, Y.; Ma, L.; Luo, J. Molecular behaviors in thin film lubrication—Part two: Direct observation of the molecular orientation near the solid surface. Friction 2019, 7, 479–488. [Google Scholar] [CrossRef] [Green Version]
- Gao, Y.; Ma, L.; Luo, J. Friction Anisotropy Induced by Oriented Liquid Crystal Molecules. Tribol. Lett. 2016, 61, 27. [Google Scholar] [CrossRef]
- Lu, R.; Mori, S.; Tani, H.; Tagawa, N.; Koganezawa, S. Low friction properties of associated carboxylic acids induced by molecular orientation. Tribol. Int. 2017, 113, 36–42. [Google Scholar] [CrossRef]
- Lianos, P.; Zana, R. Fluorescence Probe Studies of the Effect of Concentration on the State of Aggregation of Surfactants in Aqueous-Solution. J. Colloid Interface Sci. 1981, 84, 100–107. [Google Scholar] [CrossRef]
- Zhang, J.; Meng, Y. Stick–Slip Friction of Stainless Steel in Sodium Dodecyl Sulfate Aqueous Solution in the Boundary Lubrication Regime. Tribol. Lett. 2014, 56, 543–552. [Google Scholar] [CrossRef]
- He, S.Q.; Meng, Y.G.; Tian, Y. Correlation between Adsorption/Desorption of Surfactant and Change in Friction of Stainless Steel in Aqueous Solutions Under Different Electrode Potentials. Tribol. Lett. 2011, 41, 485–494. [Google Scholar] [CrossRef]
- He, S.; Meng, Y.; Tian, Y.; Zuo, Y. Response Characteristics of the Potential-Controlled Friction of ZrO2/Stainless Steel Tribopairs in Sodium Dodecyl Sulfate Aqueous Solutions. Tribol. Lett. 2010, 38, 169–178. [Google Scholar] [CrossRef]
- Liu, C.X.; Fang, J.B.; Wen, X.L.; Tian, Y.; Meng, Y.G. Active Control of Boundary Lubrication of Ceramic Tribo-Pairs in Sodium Dodecyl Sulfate Aqueous Solutions. Tribol. Lett. 2021, 69, 144. [Google Scholar] [CrossRef]
- Li, Z.X.; Weller, A.; Thomas, R.K.; Rennie, A.R.; Webster, J.R.P.; Penfold, J.; Heenan, R.K.; Cubitt, R. Adsorption of the lamellar phase of aerosol-OT at the solid/liquid and air/liquid interfaces. J. Phys. Chem. B 1999, 103, 10800–10806. [Google Scholar] [CrossRef]
- Petrov, P.G.; Ahir, S.V.; Terentjev, E.M. Rheology at the phase transition boundary: 1. Lamellar L-alpha phase of AOT surfactant solution. Langmuir 2002, 18, 9133–9139. [Google Scholar] [CrossRef]
- Boissiere, C.; Brubach, J.B.; Mermet, A.; de Marzi, G.; Bourgaux, C.; Prouzet, E.; Roy, P. Water confined in lamellar structures of AOT surfactants: An infrared investigation. J. Phys. Chem. B 2002, 106, 1032–1035. [Google Scholar] [CrossRef]
- Song, M.R.; Ju, J.; Luo, S.Q.; Han, Y.C.; Dong, Z.C.; Wang, Y.L.; Gu, Z.; Zhang, L.J.; Hao, R.R.; Jiang, L. Controlling liquid splash on superhydrophobic surfaces by a vesicle surfactant. Sci. Adv. 2017, 3, e1602188. [Google Scholar] [CrossRef] [PubMed] [Green Version]
- Atay, N.Z.; Yenigun, O.; Asutay, M. Sorption of anionic surfactants SDS, AOT and cationic surfactant hyamine 1622 on natural soils. Water Air Soil Pollut. 2002, 136, 55–67. [Google Scholar] [CrossRef]
- Wang, T.; Si, Y.; Luo, S.; Dong, Z.; Jiang, L. Wettability manipulation of overflow behavior via vesicle surfactant for water-proof surface cleaning. Mater. Horiz. 2019, 6, 294–301. [Google Scholar] [CrossRef]
- Liu, N.; Wang, J.Z.; Chen, B.B.; Yan, F.Y. Tribochemical aspects of silicon nitride ceramic sliding against stainless steel under the lubrication of seawater. Tribol. Int. 2013, 61, 205–213. [Google Scholar] [CrossRef]
- Naderi, A.; Claesson, P.M. Adsorption properties of polyelectrolyte-surfactant complexes on hydrophobic surfaces studied by QCM-D. Langmuir 2006, 22, 7639–7645. [Google Scholar] [CrossRef]
- Karlsson, P.M.; Palmqvist, A.E.C.; Holmberg, K. Adsorption of Sodium Dodecyl Sulfate and Sodium Dodecyl Phosphate on Aluminum, Studied by QCM-D, XPS, and AAS. Langmuir 2008, 24, 13414–13419. [Google Scholar] [CrossRef] [PubMed]
- Ouyang, C.; Bai, P.; Wen, X.; Zhang, X.; Meng, Y.; Ma, L.; Tian, Y. Effects of conformational entropy on antiwear performances of organic friction modifiers. Tribol. Int. 2021, 156, 106848. [Google Scholar] [CrossRef]
- Xiang, L.; Zhang, J.W.; Gong, L.; Zeng, H.B. Surface forces and interaction mechanisms of soft thin films under confinement: A short review. Soft Matter 2020, 16, 6697–6719. [Google Scholar] [CrossRef]
- Ramachandran, S.; Tsai, B.L.; Blanco, M.; Chen, H.; Tang, Y.C.; Goddard, W.A. Self-assembled monolayer mechanism for corrosion inhibition of iron by imidazolines. Langmuir 1996, 12, 6419–6428. [Google Scholar] [CrossRef]
- Bhushan, B.; Liu, H. Nanotribological properties and mechanisms of alkylthiol and biphenyl thiol self-assembled monolayers studied by AFM. Phys. Rev. B 2001, 63, 245412. [Google Scholar] [CrossRef]
- Ziegler, V.M.; Handy, L.L. Effect of Temperature on Surfactant Adsorption in Porous-Media. Soc. Pet. Eng. J. 1981, 21, 218–228. [Google Scholar] [CrossRef]


Publisher’s Note: MDPI stays neutral with regard to jurisdictional claims in published maps and institutional affiliations. |
© 2022 by the authors. Licensee MDPI, Basel, Switzerland. This article is an open access article distributed under the terms and conditions of the Creative Commons Attribution (CC BY) license (https://creativecommons.org/licenses/by/4.0/).
Share and Cite
Fang, J.; Bai, P.; Ouyang, C.; Liu, C.; Wen, X.; Li, Y.; Meng, Y.; Ma, L.; Tian, Y. Influence of Adsorption Characteristics of Surfactants Sodium Dodecyl Sulfate and Aerosol–OT on Dynamic Process of Water-Based Lubrication. Lubricants 2022, 10, 147. https://doi.org/10.3390/lubricants10070147
Fang J, Bai P, Ouyang C, Liu C, Wen X, Li Y, Meng Y, Ma L, Tian Y. Influence of Adsorption Characteristics of Surfactants Sodium Dodecyl Sulfate and Aerosol–OT on Dynamic Process of Water-Based Lubrication. Lubricants. 2022; 10(7):147. https://doi.org/10.3390/lubricants10070147
Chicago/Turabian StyleFang, Jingbo, Pengpeng Bai, Chuke Ouyang, Chenxu Liu, Xiangli Wen, Yuanzhe Li, Yonggang Meng, Liran Ma, and Yu Tian. 2022. "Influence of Adsorption Characteristics of Surfactants Sodium Dodecyl Sulfate and Aerosol–OT on Dynamic Process of Water-Based Lubrication" Lubricants 10, no. 7: 147. https://doi.org/10.3390/lubricants10070147
APA StyleFang, J., Bai, P., Ouyang, C., Liu, C., Wen, X., Li, Y., Meng, Y., Ma, L., & Tian, Y. (2022). Influence of Adsorption Characteristics of Surfactants Sodium Dodecyl Sulfate and Aerosol–OT on Dynamic Process of Water-Based Lubrication. Lubricants, 10(7), 147. https://doi.org/10.3390/lubricants10070147