1. Introduction
When a high-power disc brake is subjected to high-speed and heavy-load braking conditions, the wear phenomenon of the braking interface is severe. The brake disc and pad surface could have varied damage. Therefore, there is no doubt that the wear characteristics of the braking interface should be studied.
Under braking conditions, wear and fracture as a universal phenomenon affect braking efficiency. The form of material wear is based on the detachment of wear debris, including blocks and particles. The continuous mechanical approaches usually simulate the mechanical behavior of the material. The finite element method (FEM) is difficult to use for the real-time observation of the wear process and estimating the wear amount [
1]. However, simulation of non-continuous phenomena such as multi-fracturing is not well-adapted to a continuous description. In this case, the discrete element method (DEM) is an excellent alternative to consider discontinuities. DEM could simulate the entire friction process more realistically, which has obvious advantages in studying material structure destruction and describes a wear phenomenon of the braking interface. Many researchers have shown interest in this approach for wear and fracture simulation.
In the early years, DEM was proposed by Cundall et al. to separate a non-continuum into rigid elements, which solved the motion equations of each element by iterative methods and then obtained the motion morphology of the non-continuum [
2]. Euser et al. found that DEM could simulate inter-particle connection bond breaking and crack formation, which makes DEM applications more and more widely used in cutting and processing [
3].
The braking interface could produce the third-body and other wear debris during the braking process. In practice, the classical DEM modeling approach is a challenge considering that the flows of the third-body and the wear debris depend on the mechanical properties of the material. Consequently, Renouf et al. considered the mechanical properties of the third-body and its thermal and physicochemical properties, proposed an extended DEM, and applied it to the simulation of third-body flows [
4]. It was found to be an effective numerical method for calculating engineering problems involving particle materials. However, the representation of irregular particles using DEM is a challenging issue. Irazábal et al. presented a new insight in applying one of those simplifications known as rolling friction, which avoided excessive rotation when irregularly shaped materials were simulated as spherical particles [
5].
Similarly, to overcome excessive rolling of such an oversimplified shape of the particle, Aboul et al. considered contact rolling resistance. Meanwhile, the influences of the elastic and the plastic parameters were discussed. The results showed that the plastic macroscopic behavior of the particle assembly only depended on the plastic parameters, which mainly depended on the plastic rolling moment reflecting the shape of the particle [
6].
Particle–particle interactions play an important role in particle flows. Huang et al. found that the flows could have some strong nonlinear characteristics and be different from normal materials, either solids or liquids [
7]. Huang et al. used a developed 2D coupled method to analyze the mechanical response of rocks. Compared with the theoretical approach, the displacement by numerical simulation corresponds with an analytical equation for cases with different ground stress ratios [
8]. These suggest that DEM could be used to model a continuum, including concrete or rocks. However, it requires a significant calibration effort, even to capture just the linear elastic behavior of a continuous model via the classical force-displacement relationships at the contact interfaces between particles. Celigueta et al. proposed a new way for computing the contact force between discrete particles. The newly proposed force considered the surroundings of the contact, not just the contact itself, which provided an accurate approximation to an elastic continuum and avoided calibration of DEM parameters for the purely linear elastic range [
9].
Fracture of the force chain indicates that the material structure is destroyed. Vandenende et al. investigated the effects of inter-particle friction and a distributed grain size on macroscopic strain rates. They found that the discrete element model could reproduce realistic compaction behavior. The strain rates produced by the model corresponded with uniaxial compaction experiments [
10]. Furthermore, the mechanical response of a particle system is influenced by bulk material properties and various factors. Desu et al. investigated the influences of the factors as mentioned above on the macroscopic stress-strain response, which helped understand macroscopic damage in terms of microscopic factors [
11].
With the continuous development of virtual simulation technology, the application range of DEM has become large. DEM could be used to simulate wear prediction. Zha et al. introduced different constitutive laws for contacts to represent the stiffness and strength characteristics of the metal panels and the core materials. The approach could predict detailed local damage and failure modes, an advantage over the conventional numerical methods [
12]. Fillot et al. presented a fundamental approach to studying the wear process by considering the detachment of particles. This numerical model was constructed to visualize and accurately measure the influence of the interfacial layer on the wear process [
13]. In addition, Chaudry et al. found that the maximum tensile stress-based criterion could be used to address computational aspects of crushing/comminution of particle materials [
14]. Damien et al. defined the materials by Young’s modulus, Poisson’s ratio, and density. DEM could be used to fit the static and dynamic mechanical behavior of the material [
15]. Phan et al. demonstrated that it could study abrasive roll wear [
16]. Boemer et al. suggested a generic procedure that predicted the wear evaluation of the lining surfaces [
17].
To ensure the accuracy and stability of the DEM wear prediction, one of the essential tasks is to perform sensitivity analysis at the single-particle level. Chen et al. conducted the pin-on-disc wear tests modeled to predict the sliding wear by individual iron ore particles. The reference demonstrated that accurate and stable results of sliding wear volume could be achieved. Increasing particle density or radius caused more sliding wear at a steady state. By contrast, particle Poisson’s ratio, particle shear modulus, geometry mesh size, rotating speed, coefficient of restitution, and time step had no impact on wear volume [
18].
Meanwhile, Hossein et al. researched the abrasive wear of iron ore pellets by numerical simulation using DEM and an analytical model. The variable parameters of the analysis model, including average normal contact force and sliding distance, were predicted from DEM simulation results [
19].
Moreover, Ke et al. investigated the influences of different normal loads on the seismic moment, macroscopic friction coefficient, kinetic energy, gouge layer thickness, and recurrence time between slips. The simulations revealed the influences of normal loads on the dynamics of sheared particle fault gouges and demonstrated the capabilities of DEM for studying the stick-slip dynamic behavior of the particle fault system [
20]. In summary, it can be seen that DEM has certain advantages for the wear study of the material.
This paper mainly focuses on the wear process of the braking interface to carry out DEM wear simulation. Combined with elemental damping, the dynamic relaxation method is used to establish the contact relationship between discrete particles. The periodic boundary simulates the dynamic motion of the brake disc and pad. Considering the high-speed and heavy-load conditions, the DEM wear model of the braking interface is established to analyze the dynamic wear process. Based on the simulation results, the velocity, displacement, and force chains of discrete particles can describe the surface wear and fracture process. The effect of initial braking load and initial braking speed on surface wear is discussed. Meanwhile, the simulation results are verified by pin-on-disc wear tests.
3. DEM Wear Simulation of Braking Interface
3.1. Parallel Bond Model
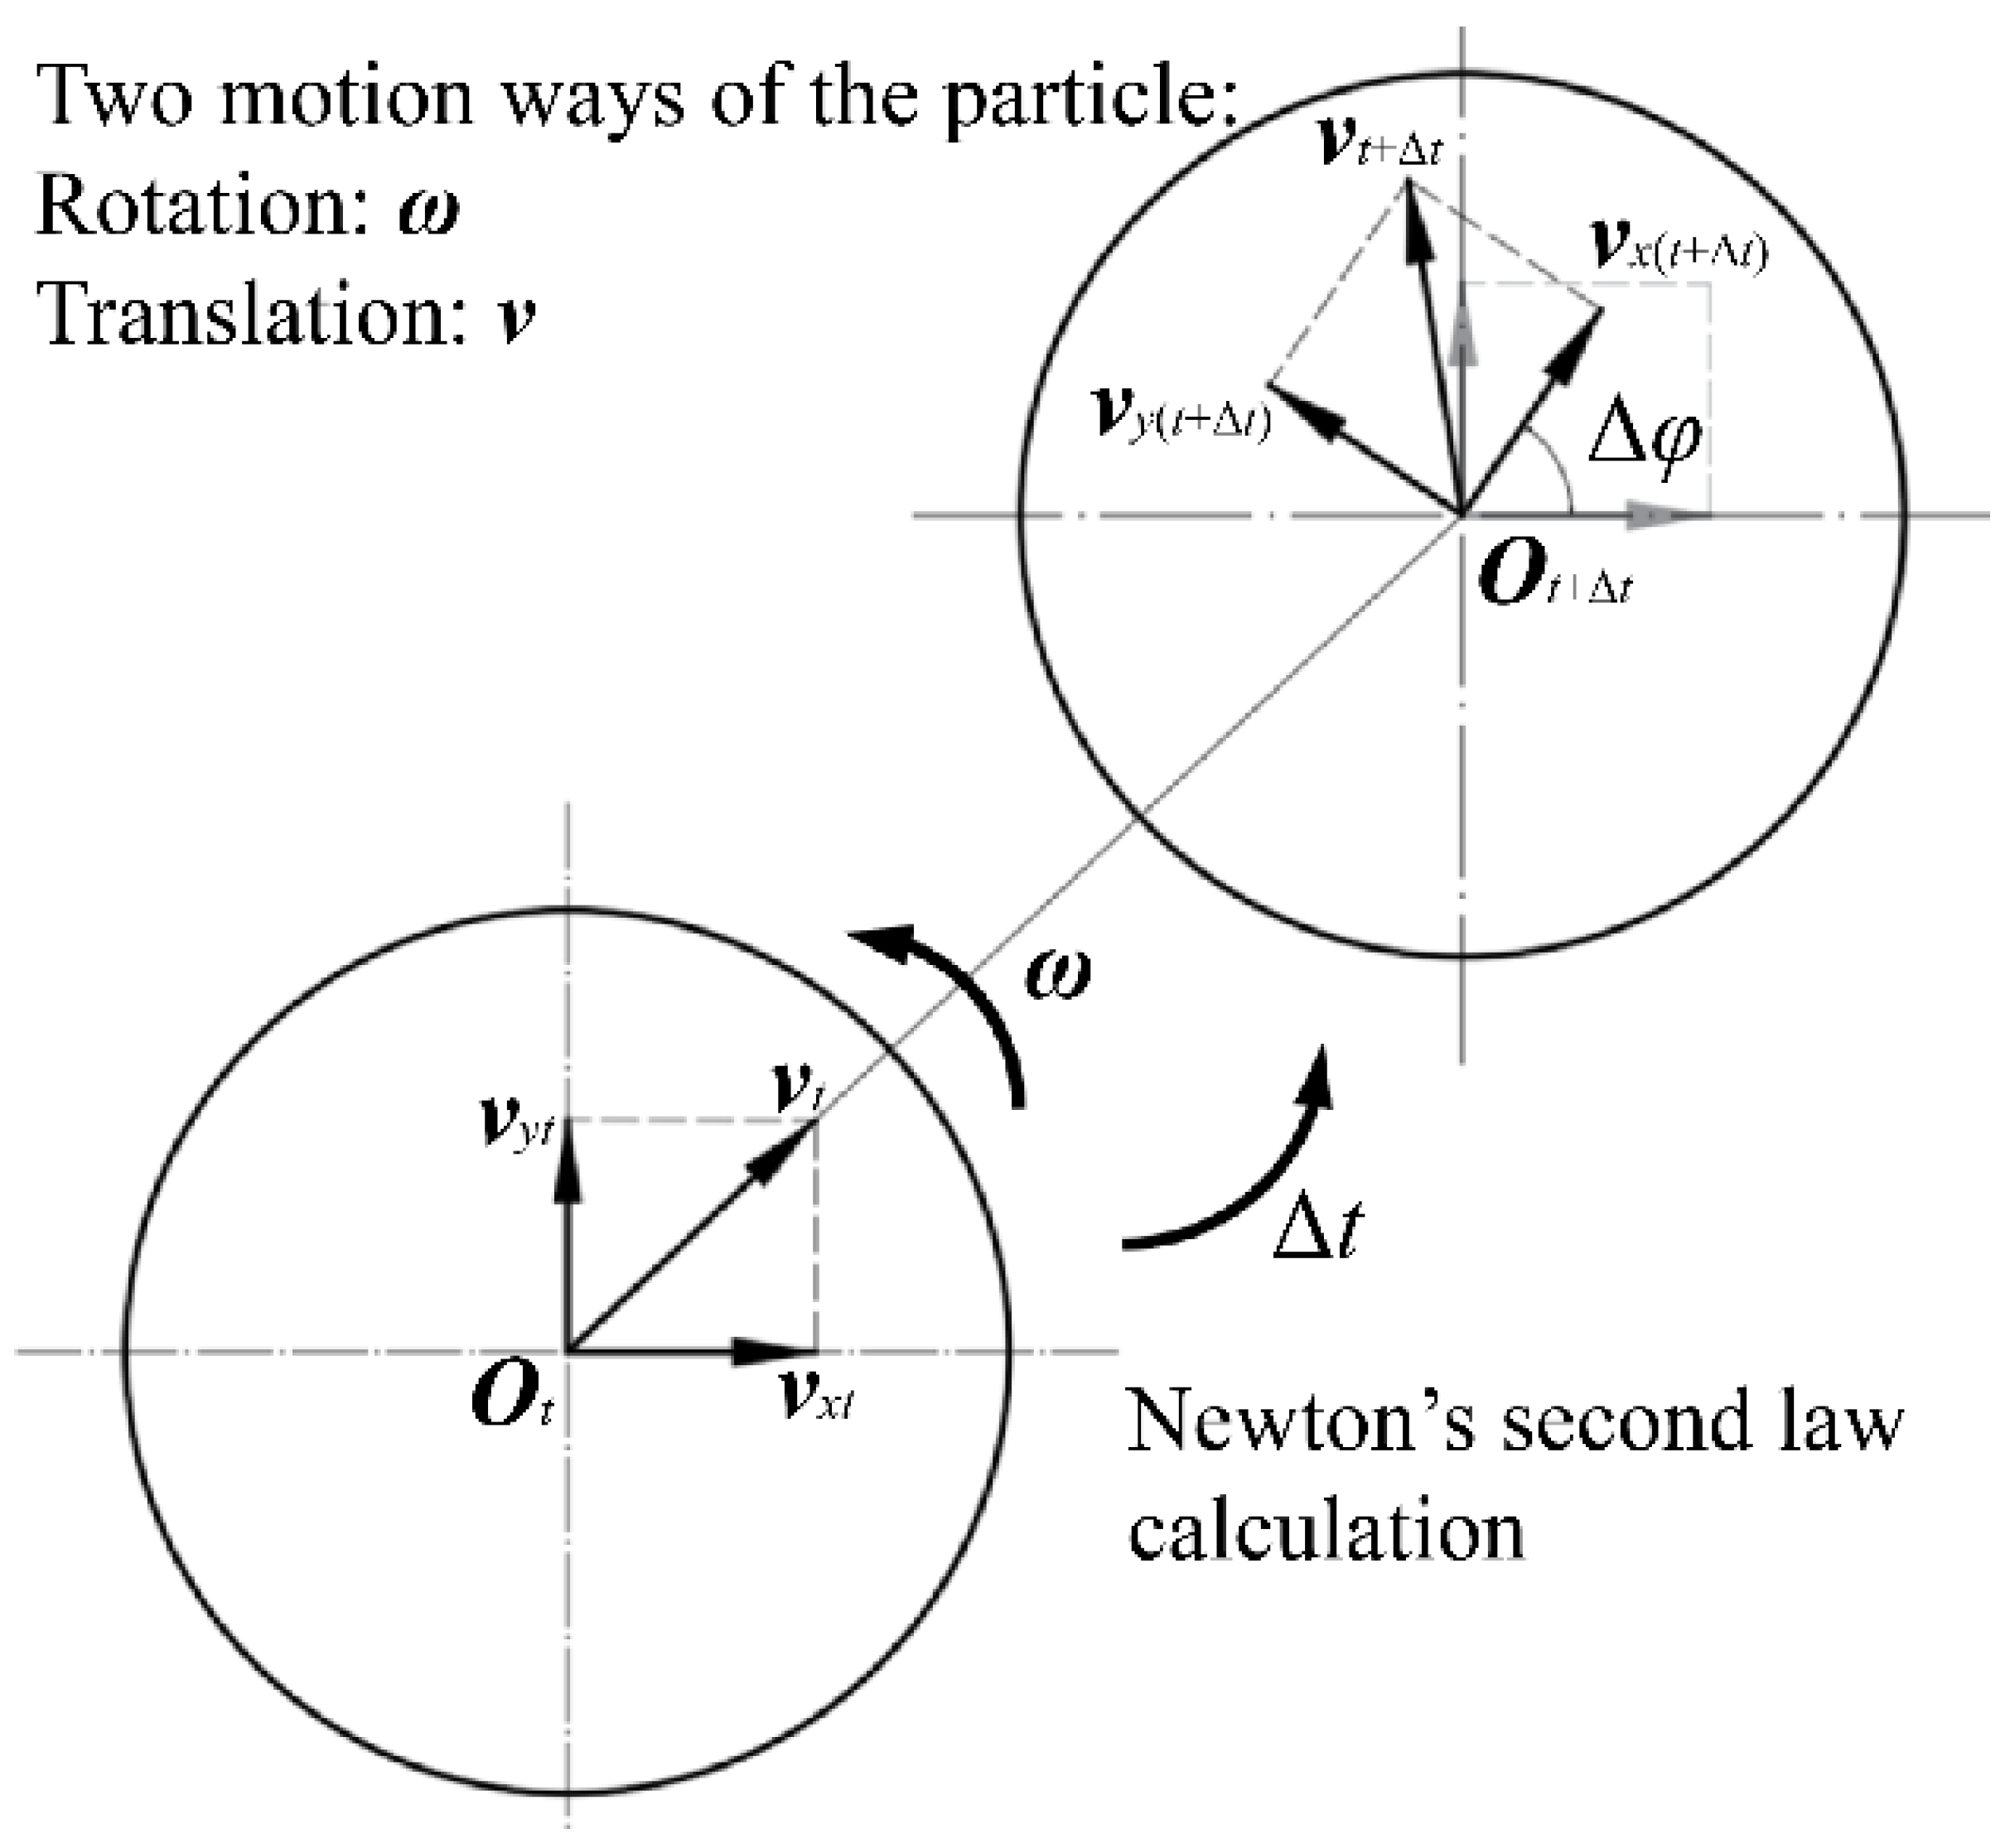
To establish the DEM wear model of the braking interface, the model needs to be simplified appropriately. According to the braking mechanism and wear theory, the wear area of the brake disc and pad is mainly concentrated on the contact surface. Therefore, the wear behavior between the brake disc and pad can be analyzed by constructing a DEM wear model of the braking interface. The following critical assumptions made in particle-based DEM wear simulations can be stated. Elemental particles are rigid, have mass and rotational inertia, and can be analytically described.
- (1)
The motion of each particle is independent, including the translational motion and the rotational motion.
- (2)
The contact between particles occurs over a tiny area, and each contact involves only two particles.
- (3)
Particles can overlap slightly at the contact points, which can transmit tensile and compressive forces in the normal contact direction and a tangential force orthogonal to the normal contact force.
- (4)
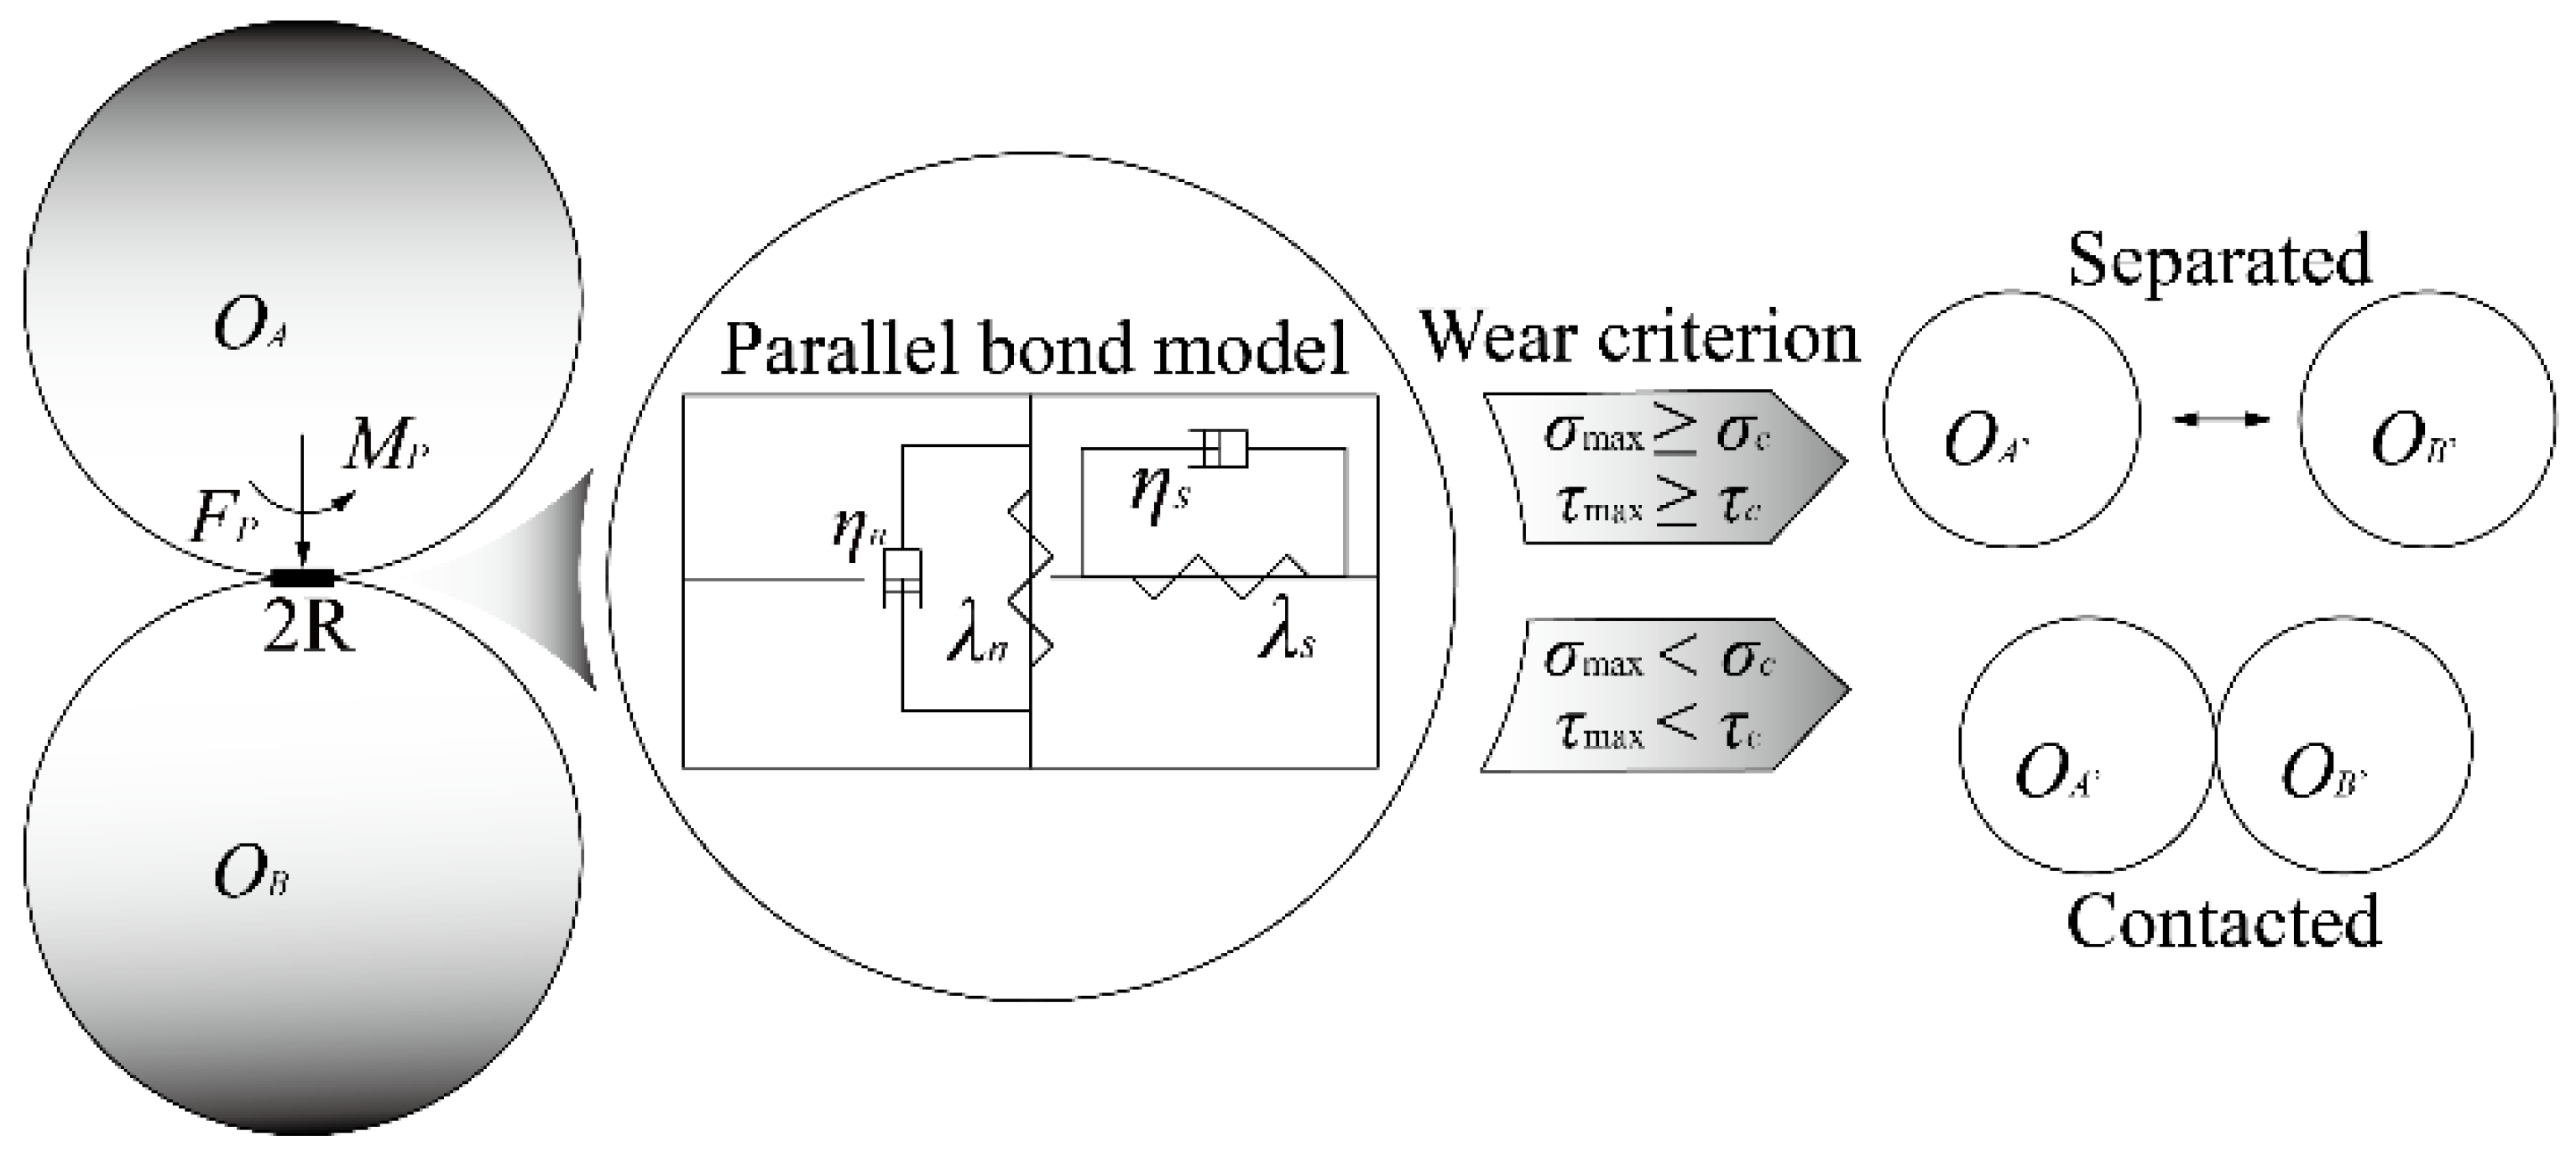
Considering the separation distance between two particles, the tensile force can be calculated. When the tensile force exceeds the maximum tension force at the contact point, particles could move away from each other, and the contact is no longer considered in calculating the contact force.
The discrete element properties of the braking interface need to be determined by the parallel bond model method, whose details are as follows:
- (1)
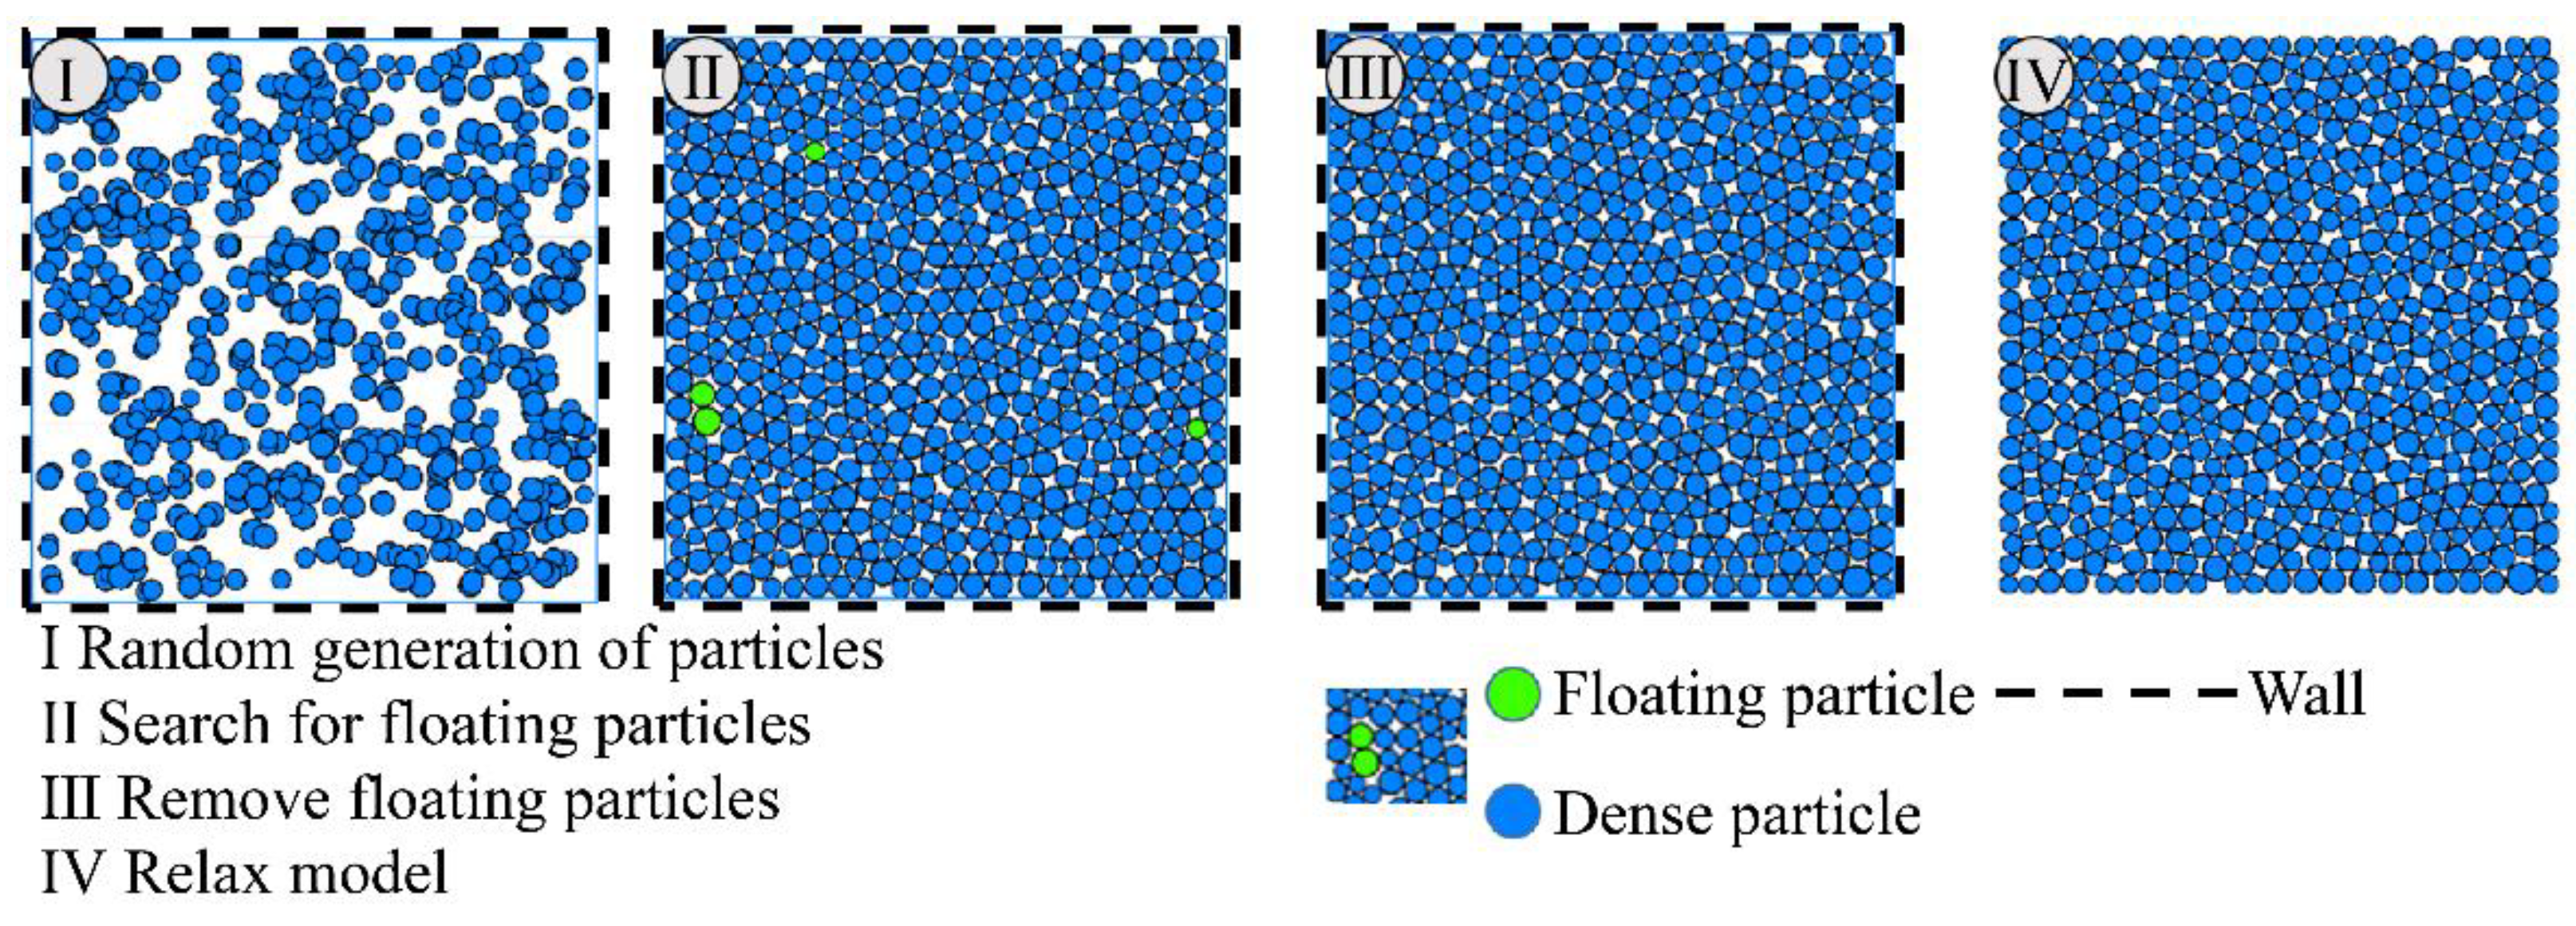
Discrete particles are generated in the specified area based on the micro-parameters of the known model, and each particle has its mechanical properties by assigning mechanical parameters.
- (2)
Pressure is applied to particles to generate isotropic force. To ensure the compactness of the particle model, floating particles with less than three pairs of contact pairs need to be deleted.
- (3)
Parallel bonds are generated, wall constraints are removed, and a parallel bond model with material properties can be obtained, as shown in
Figure 4.
- (4)
The FISH function is used to release the stress of the particle model, which can avoid the influence of the internal stress generated in the modeling process on the simulation.
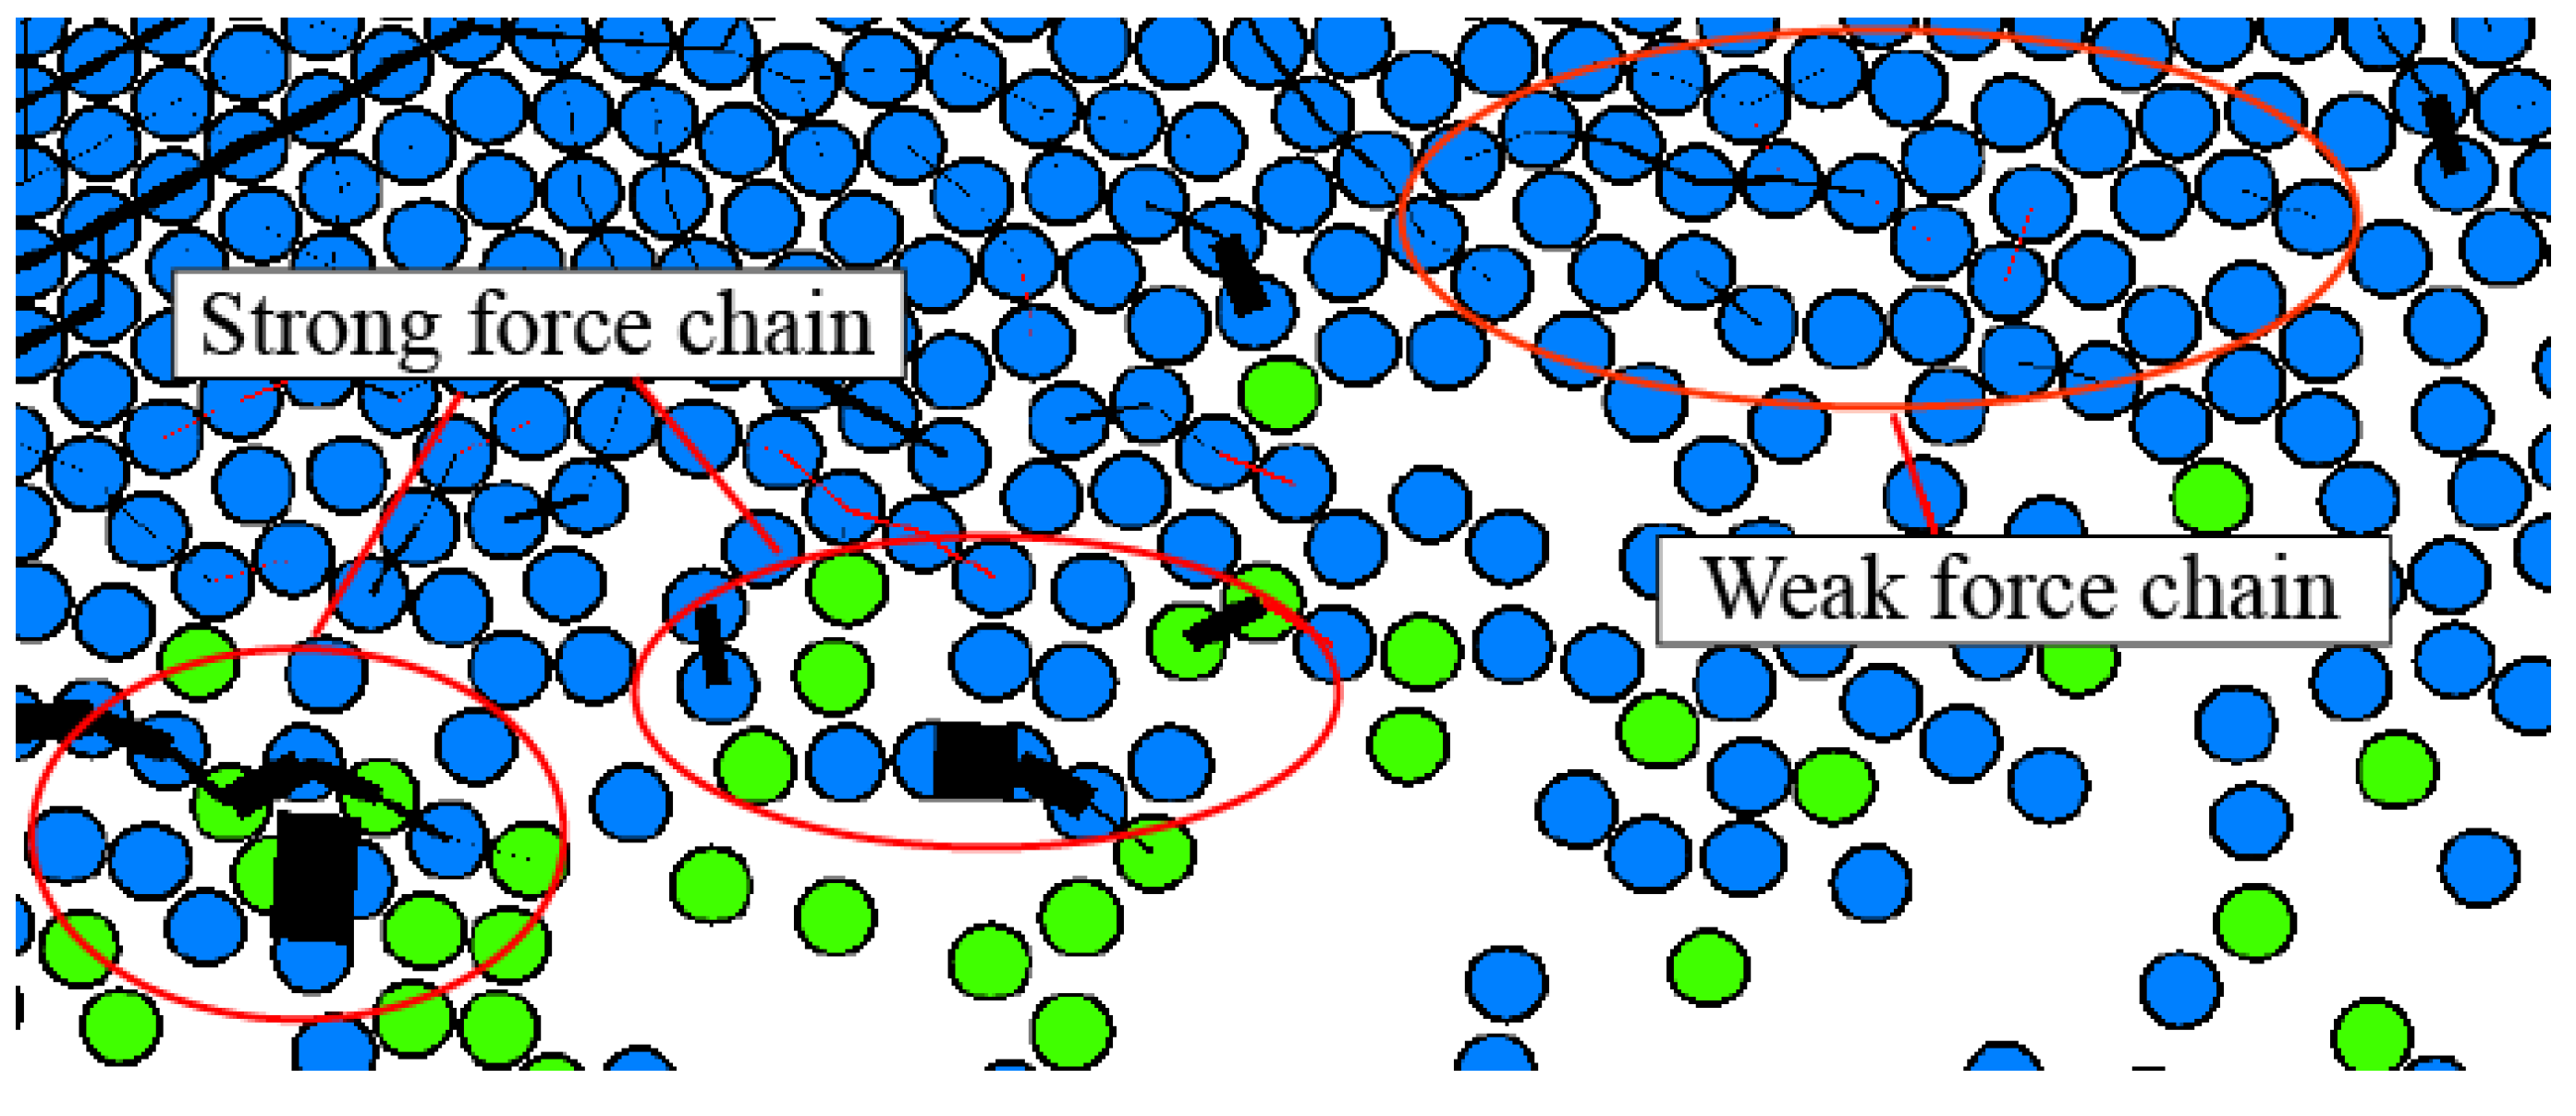
The DEM model requires assumptions regarding aggregate geometry and grain size distribution to solve the contact stress. The force chain represents the contact mode of particles, and the types of force chain can be divided into tensile force chain and compressive force chain. Furthermore, the force chain thickness can describe the force chain strength, as shown in
Figure 5. In the entire DEM system, the strong force chain is responsible for transferring large external force, supporting most of the weight and the external load of the particle system, but the number of strong force chains is small. The weak force chain is responsible for transferring small external force, but the number of weak force chains is huge. Meanwhile, the weak force chain has an auxiliary effect on the stability of the strong force chain and participates in reconstructing the strong force chain after a fracture. Therefore, the fracture of the force chain can characterize the failure of the material structure.
The micro-parameters of the DEM model materials cannot be directly obtained through tests, so the correct micro-parameter settings affect the accuracy of the DEM wear simulation. To make the established DEM wear model have mechanical properties that match the actual material, the macro-mechanical model is used to adjust the micro-parameters of the DEM wear model. When the numerical values of the simulation results match the actual material mechanics test values, the micro-parameter settings in the model are considered reasonable, and the following simulation work can be carried out.
The macroscopic material properties of the friction pair are shown in
Table 1. The mechanical properties of materials can be calibrated by a uniaxial compression test [
24]. Uniaxial compression tests are performed based on the micro-parameters, as shown in
Figure 6. (1) Model establishment: The height value of particle model is 0.1 mm, the width value of particle model is 0.05 mm, and the particle radius is 3.6 × 10
−3 mm. The upper wall and lower wall move to the center at a speed of 0.1 m/s, and a small amount of damping 0.1 is applied. The test is run until stress falls below 70% of the peak, and the stress-strain curve of the particle model is recorded during the uniaxial compression test. (2) Micro-parameter calibration: Based on the stress-strain curve results of the uniaxial compression test, the Young’s modulus and Poisson’s ratio are calculated with the stress peak as the calibration point:
where
E is Young’s modulus,
ν is Poisson’s ratio.
σy is the stress, and
εx and
εy are the strains in the
x and
y directions, respectively.
The calibration tests of the DEM model are performed using the DEM micro-parameters. When the mechanical properties of the DEM model are close to the values in
Table 1 and within the allowable error range of
Table 2, it is considered that the DEM micro-parameters can describe the macroscopic mechanical properties of the brake disc and pad materials. The calibration tests show that the relative error of Young’s modulus on the brake disc is 1.47%, the relative error of Poisson’s ratio on the brake disc is 2.58%, the relative error of Young’s modulus on the brake pad is 1.67%, and the relative error of Poisson’s ratio on the brake pad is 2.00%. Therefore, the revised results for the micro-parameters follow the calibrated material properties and the micro-parameters of the discrete element model can be obtained, as shown in
Table 3.
3.2. Establishment of DEM Model
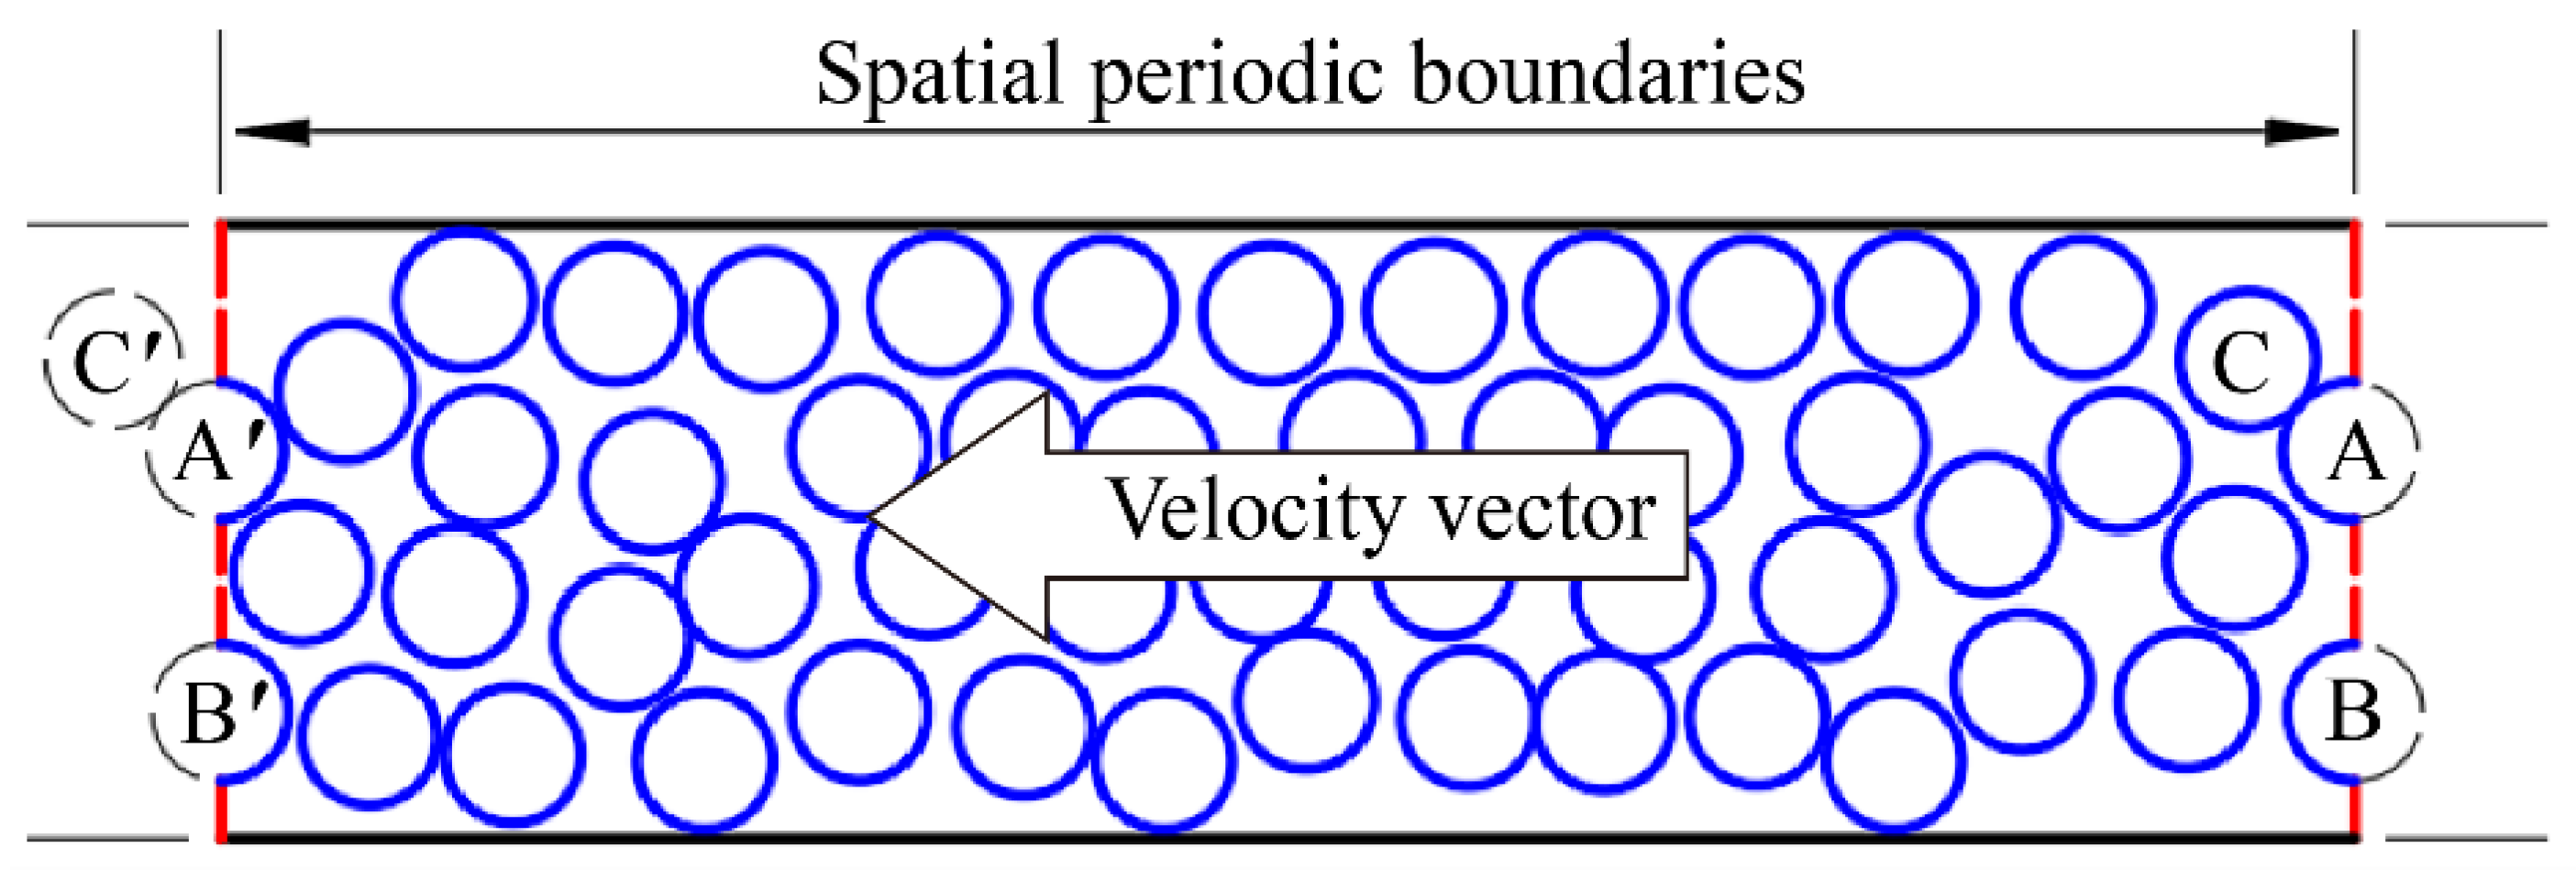
Based on the braking mechanism and wear theory, it is known that the wear area of the brake disc and pad mainly concentrates on the braking interface. Therefore, the wear behavior is analyzed by constructing a DEM wear model of the braking interface. The wear phenomenon is the cumulative result of a long time. When the wear process enters the stable wear stage, the wear trends of the braking interface are unchanged. In the process of DEM analysis, the braking interface wear is simplified. When establishing the DEM wear model of the braking interface, the PFC software’s unique periodic boundary is used to simplify the continuous contact model into a periodic flow model. Using periodic boundaries can simulate huge particle sets by considering only selected subdomains (called periodic cells).
In the periodic space, discrete particles and particle clusters constitute the main components of the material composition, which would tend to move outside the boundaries due to particle motion, as shown in
Figure 7. The simulation region is then ‘remapped’ so that particles re-enter the simulation region at the corresponding location on the opposite periodic face. The criterion for this remapping considers the particle centroid coordinates. When particle B and particle cluster A–C are detected to move outside the boundary wall, they are introduced in the boundary wall at the same elevation as the new particle B’ and particle cluster A’–C’.
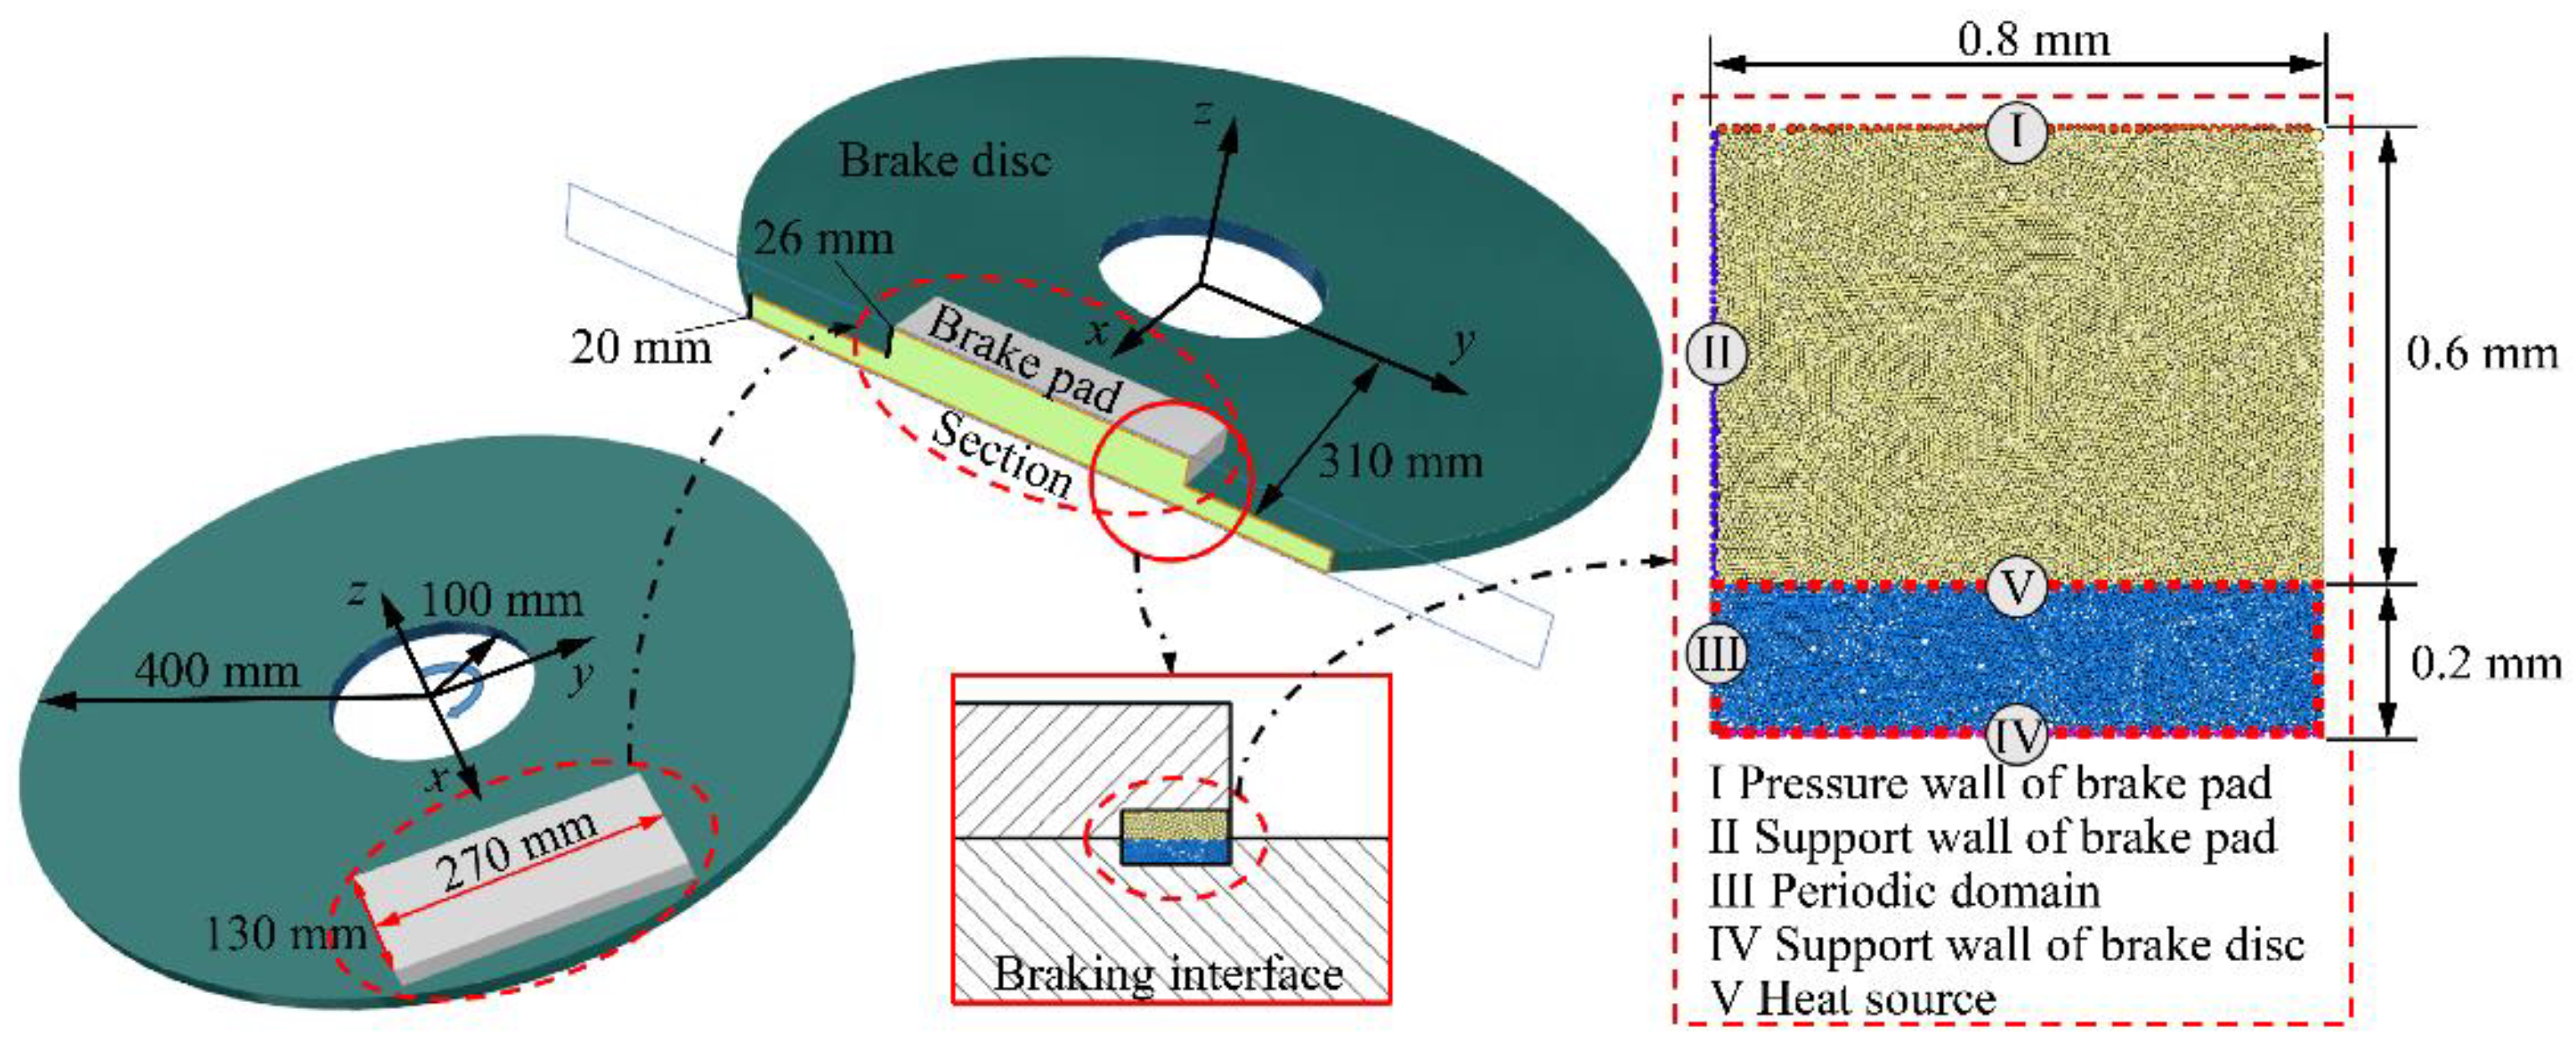
The local wear interface of the brake disc and pad is selected. During the rotation of the brake disc, the change of radian in the local area does not change significantly. Therefore, it is assumed that the local contact between the brake disc and pad is linear relative motion, and the DEM wear model of the braking interface is established, as shown in
Figure 8.
The upper particle area of the model is the brake pad, and the lower particle area is the brake disc. The model boundary conditions are applied by adding constraints on the particle boundary wall, mainly consisting of three parts: the pressure wall, the support wall, and the periodic domain wall. The pressure wall of the brake pad provides the load for the discrete model and ensures the contact state of the brake disc and pad by applying the nodal pressure in the -y-direction. The pressure wall of the brake disc provides support for the brake disc material and restricts the degree of freedom in the y-direction. The support wall supports the brake pad and restricts the degree of freedom in the x-direction. The periodic domain wall sets the particle circulation area. A velocity vector in the -x-direction of particles is applied to simulate the motion of the brake disc. The speed loaded in the model is the linear speed of the brake disc.
In addition, changes in temperature can cause expansion and compression of materials. The thermal stress increment associated with free expansion corresponding to temperature increment Δ
T has the form:
where Δ
σij is the thermal stress increment,
αt is the coefficient of liner thermal expansion, and
δij is the Kronecker delta [
25]. Furthermore, thermal stress affects the value of contact stress.
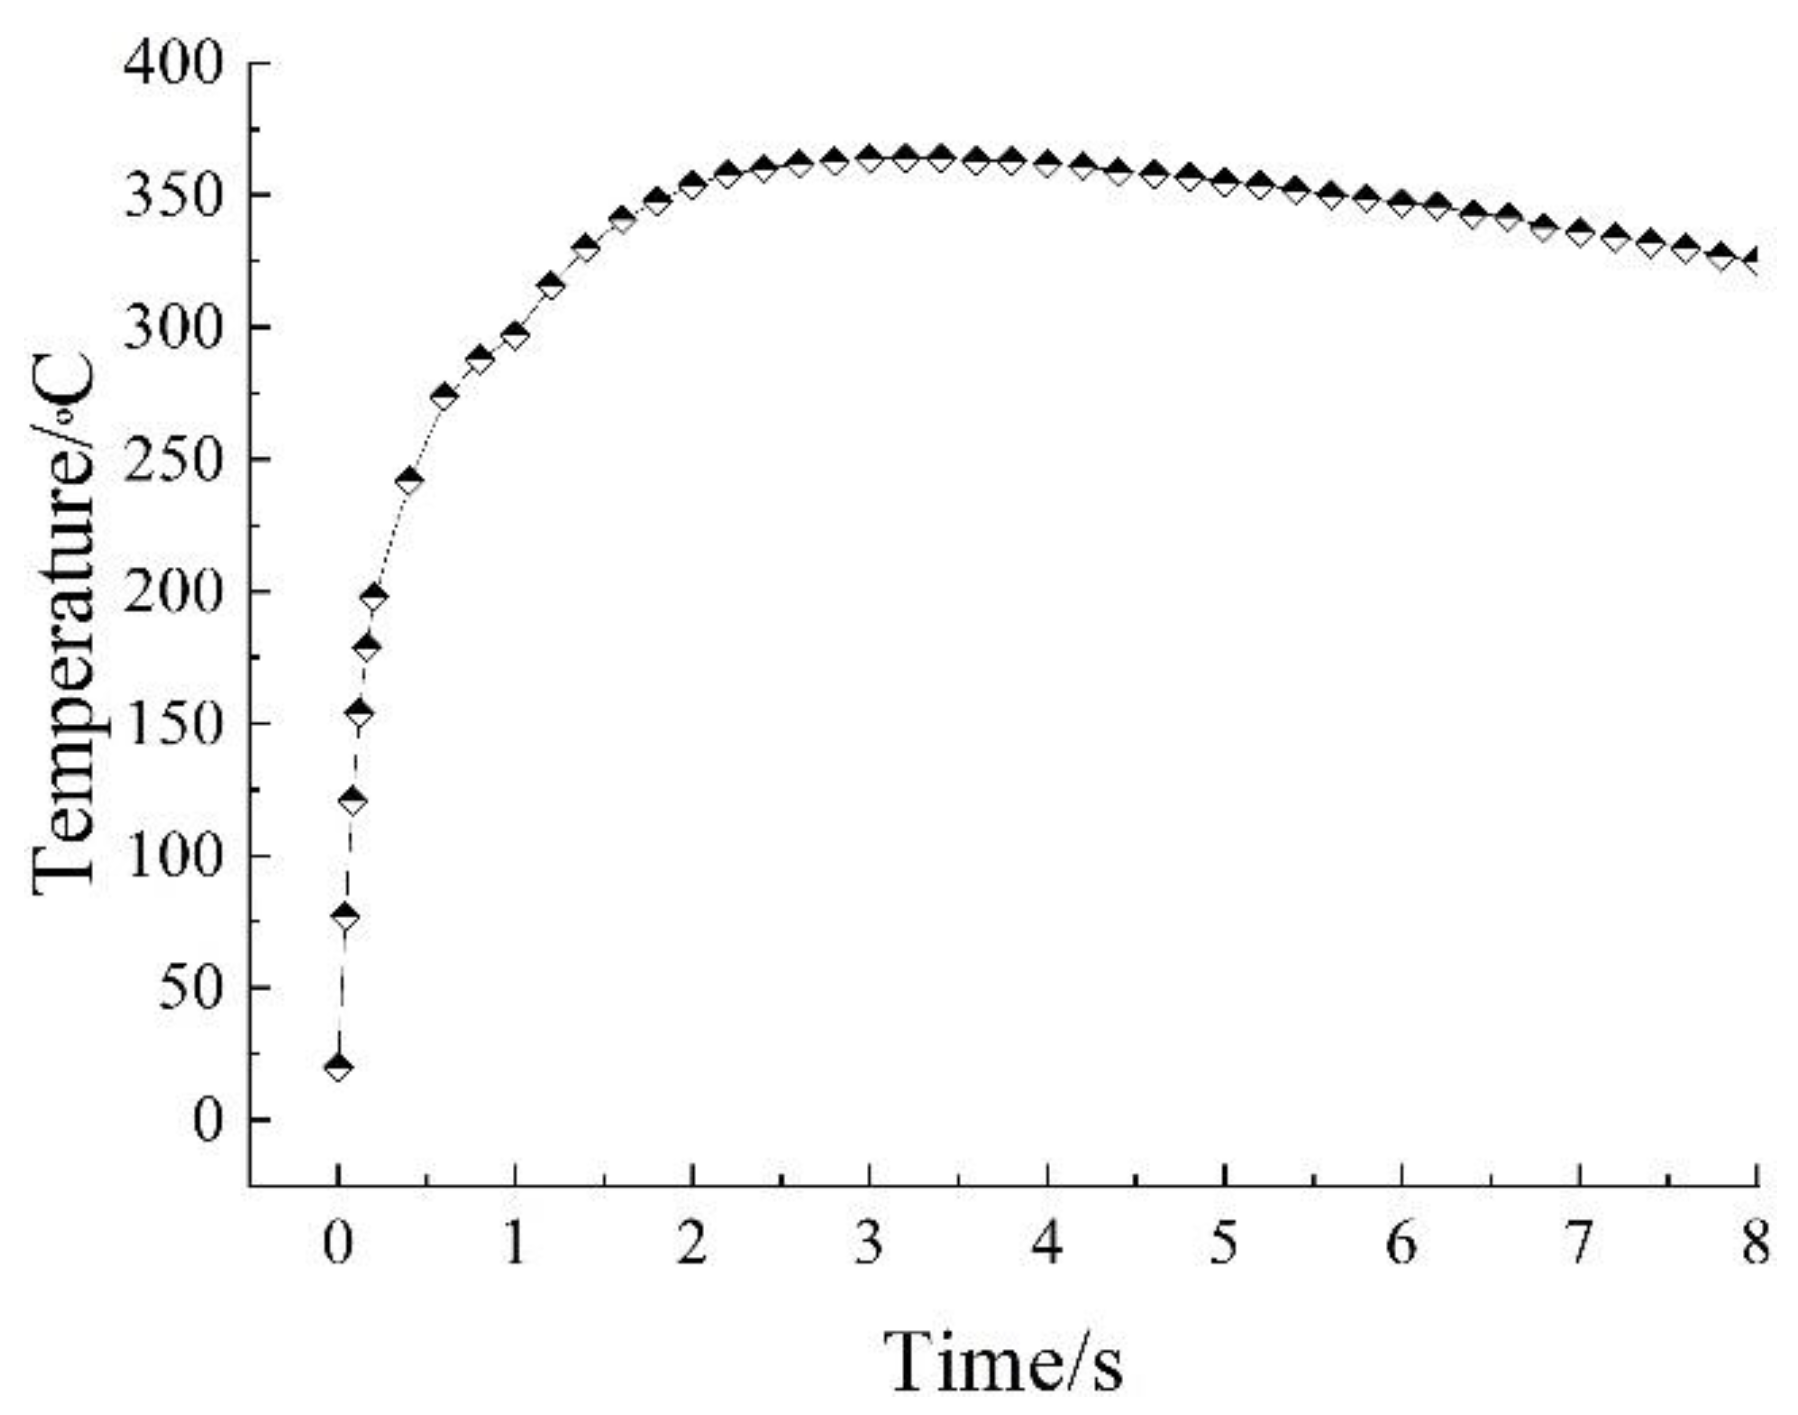
Therefore, heat sources need to be added to the DEM wear model. The temperature curve is extracted from the FEM simulation results in the literature [
26], as shown in
Figure 9. Because the discrete element research scale is small and the temperature change of the overall model is little, the unified heat sources are set as the boundary. Heat transfers only when a parallel bond connection forms between the particles; when the bond is broken, heat cannot be transferred.
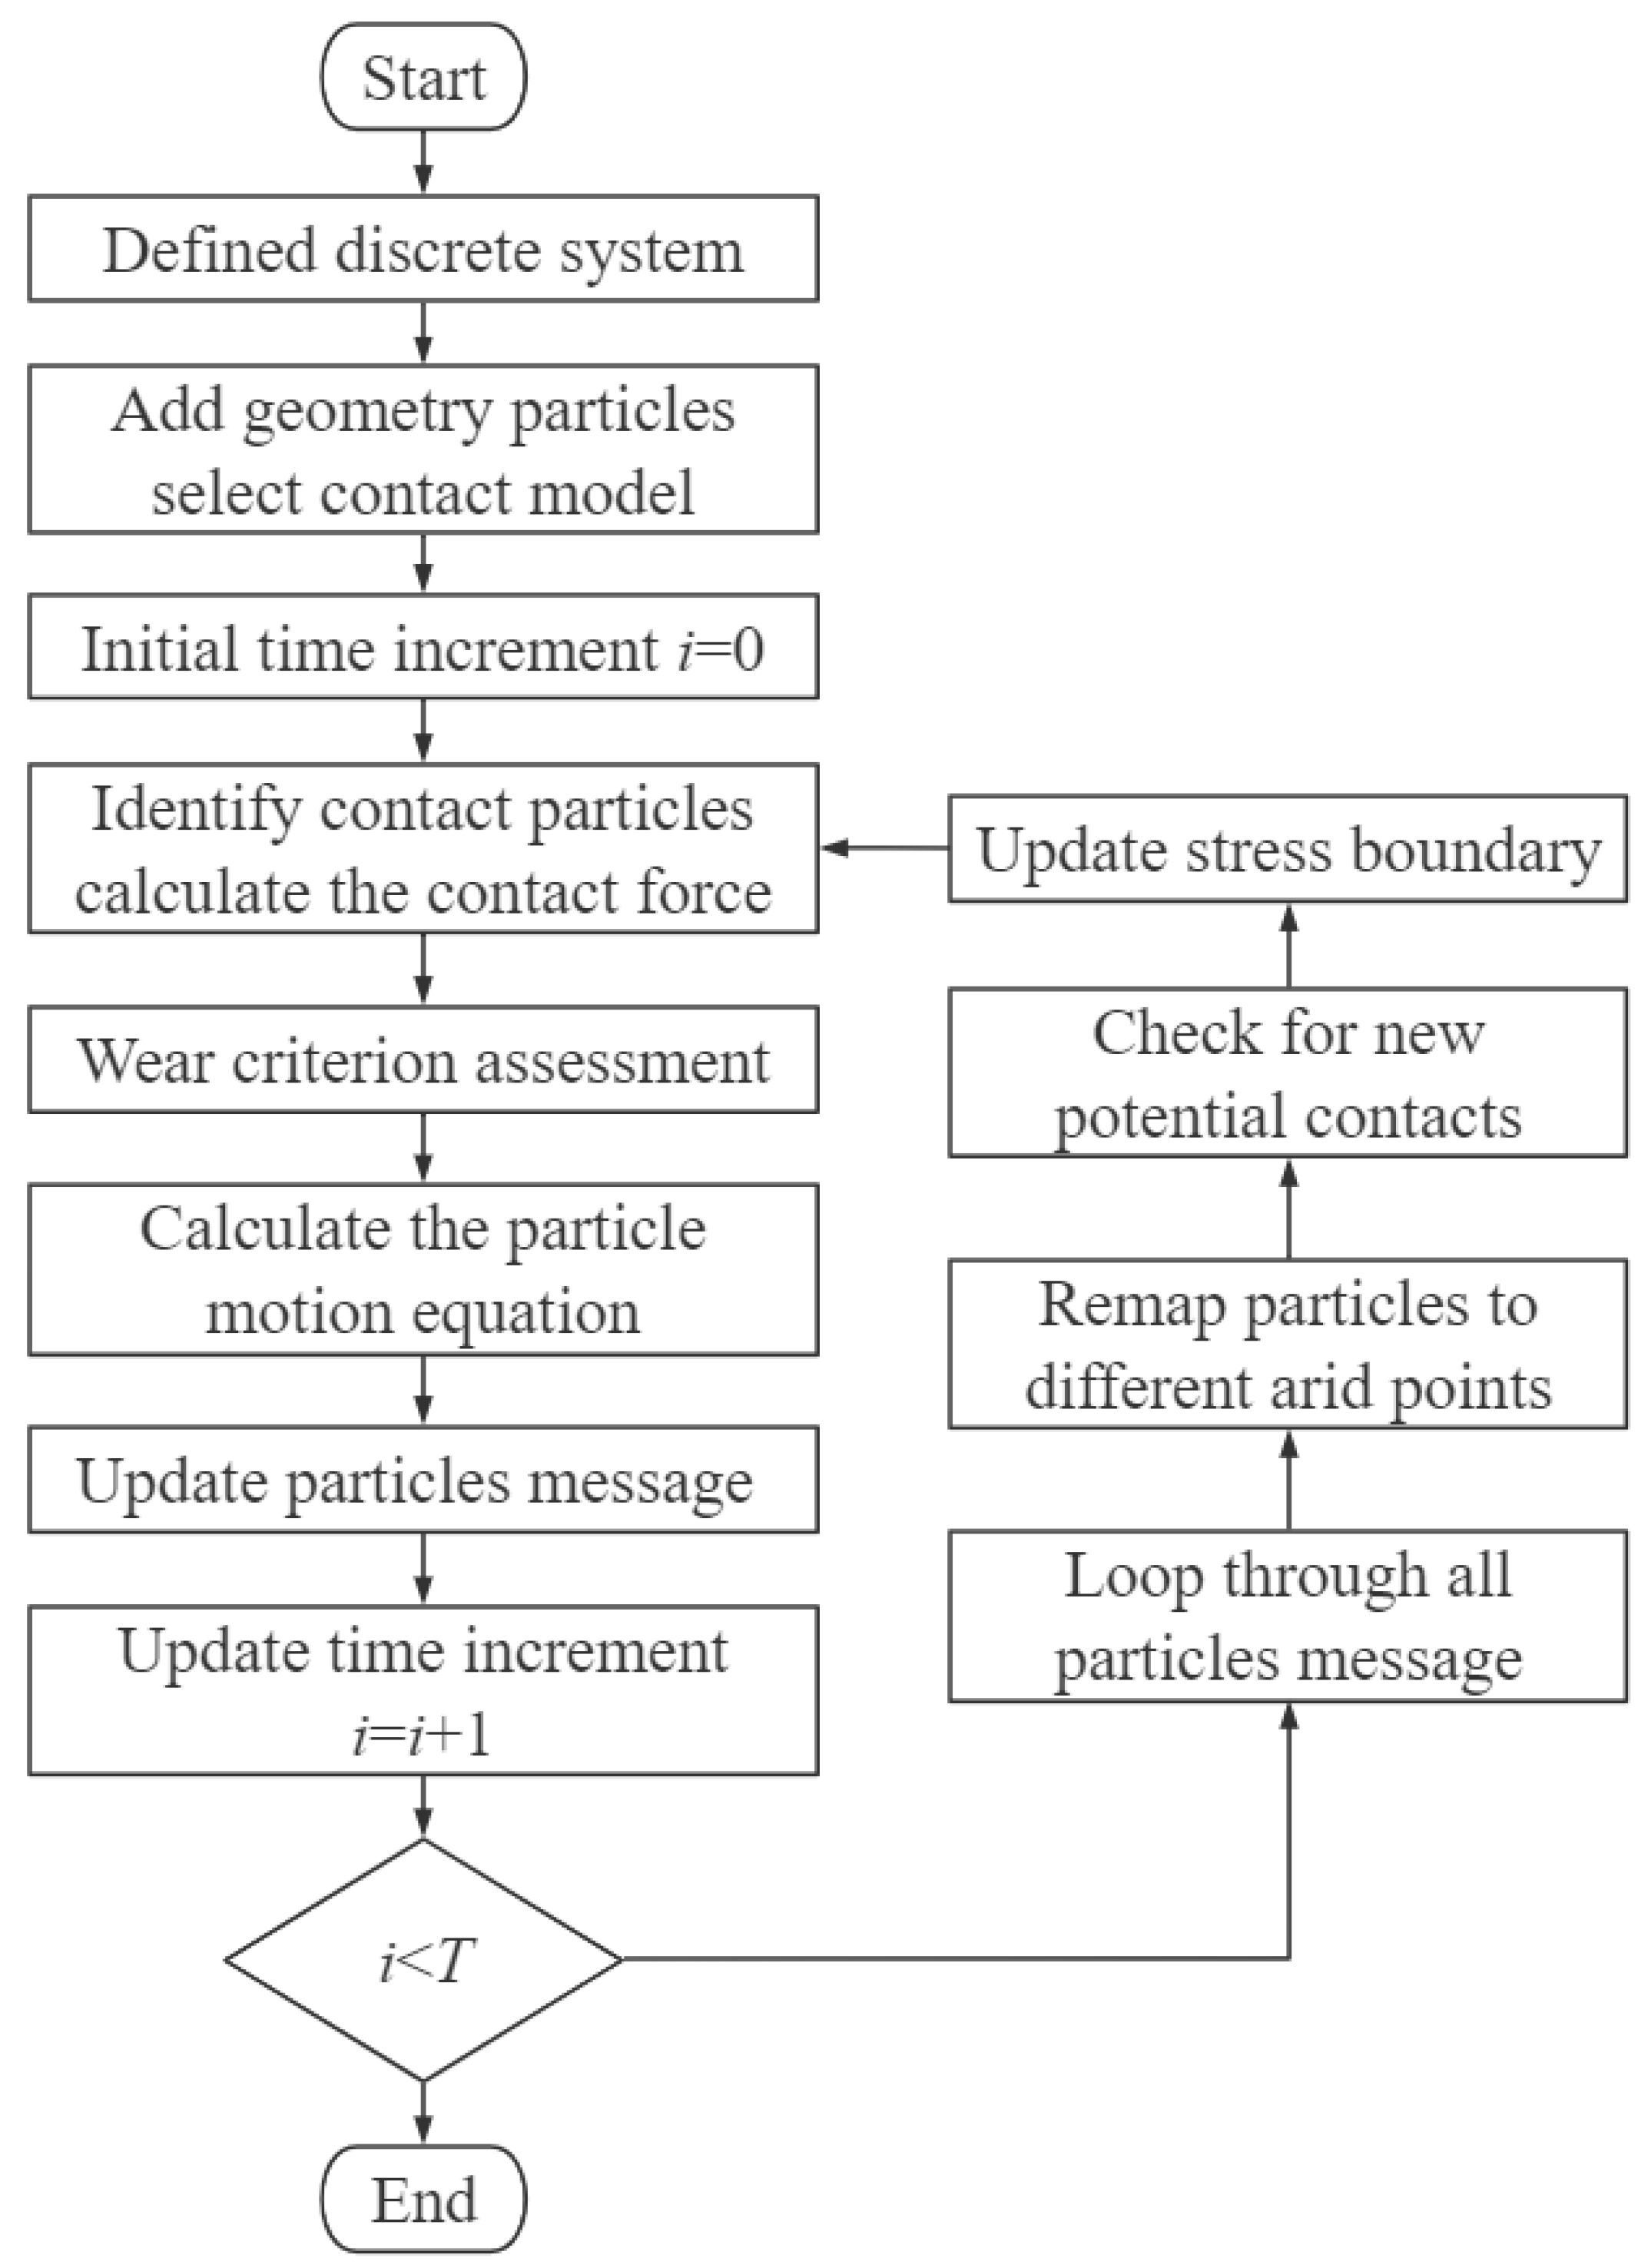
High-power braking conditions can be simulated based on the control variable method. During the loading process of DEM wear simulation boundary conditions, initial braking load and initial braking speed need to be converted into pressure and relative speed. In addition, based on PFC discrete element software simulation, the DEM analysis program is written by particle flow code, and the wear criterion is calculated to analyze the microscopic wear process of the braking interface. During the discrete element simulation, the braking simulation conditions are shown in
Table 4. It is assumed that the braking process is stable and the braking conditions are unchanged. The braking time is set to 8 s.
3.3. Pin-on-Disc Wear Test
A pin-on-disc wear testing machine was used for pin-on-disc wear tests. The friction disc sample adopted Q345B, and the pin sample adopted copper-based powder metallurgy; the material properties are shown in
Table 1. The friction load was 60 N, and the friction speed was 1200 r/min, as shown in
Figure 10. Before tests, the friction surface of the sample was polished to make the surface roughness
Ra = 0.3 μm. During testing, the room temperature was 20 °C, and the relative humidity was 25%~50%. After tests, the friction surface was cleaned with acetone solution, and the solution was filtered and dried to obtain wear debris. An optical microscope measured the size of the wear debris, and the friction surface morphology was observed by an optical three-dimensional surface profile measuring instrument. Then the friction state and the wear degree of the friction pair were judged.
3.4. DEM Simulation Analysis
Based on braking condition 5 in
Table 2, the single braking DEM wear simulation is carried out. According to the wear criterion, when the maximum stress value exceeds its ultimate strength, the material would be damaged and destroyed, which leads to surface wear. In the DEM wear simulation results, the wear debris exists in the form of particles and particle clusters. The vertical displacement of the particle indicates the wear depth of the surface. The range of the wear layer includes the damaged surface of the brake disc and pad, as shown in
Figure 11.
Figure 11a is the particle displacement cloud diagram in the initial simulation. The maximum wear depth is 3.66 × 10
−4 mm. The braking process begins, and the wear area concentrates on the contact surface of the brake disc and pad. The range of the wear layer is small, and the wear depth is low.
Figure 11b is the particle displacement cloud diagram in the end simulation. The maximum wear depth of the surface is 7.69 × 10
−2 mm. The range of the wear layer becomes large, and the wear depth is high. In addition, the detached material forms the wear debris in the wear layer and moves away from the surface.
According to the damage range, the wear range ratio of the brake disc to the brake pad is 1:3. However, only a small part of the brake disc has material wear, and the wear area only occurs on the brake pad surface. The brake pad surface is severely worn, and the wear depth is large. This is because the difference in the properties of friction materials causes the actual wear of the brake pad to be greater than the wear of the brake disc. The mechanical properties of the structural alloy steel used in the brake disc are high. The powder metallurgy used in the brake pads is prone to material damage, and the brake pad is an easy wear part. Therefore, during a single braking process, the wear of the brake disc is often ignored, and the wear of the brake pad is mainly used to analyze the surface wear law.
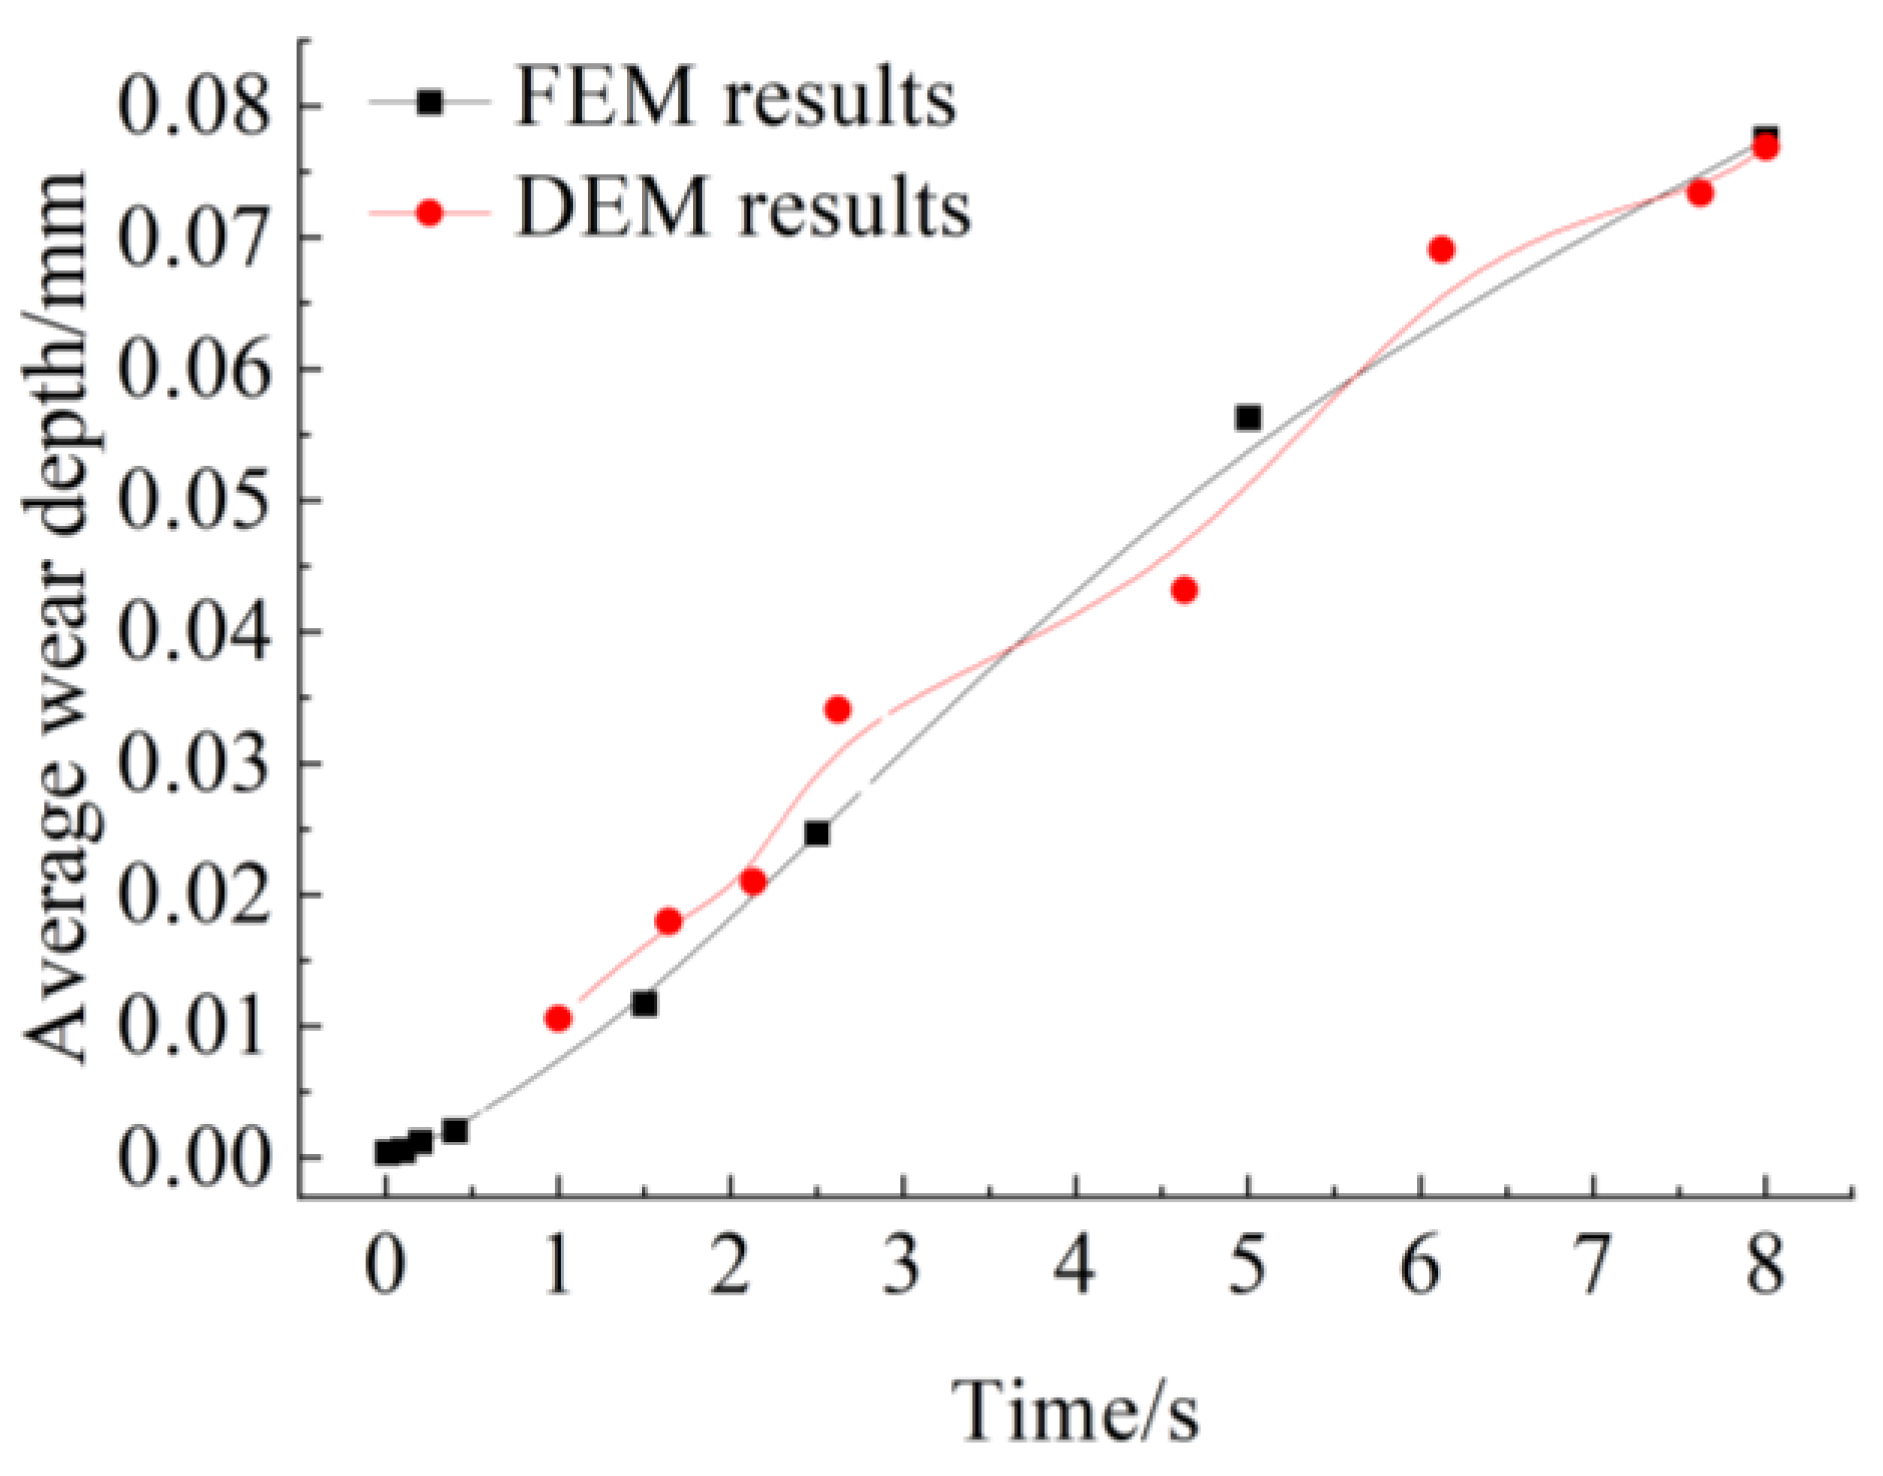
To study surface wear during braking, the maximum displacement of particles under different braking time steps is extracted, as shown in
Figure 12. Friction and wear, cumulative damage, and local fracture of the surface are observed.
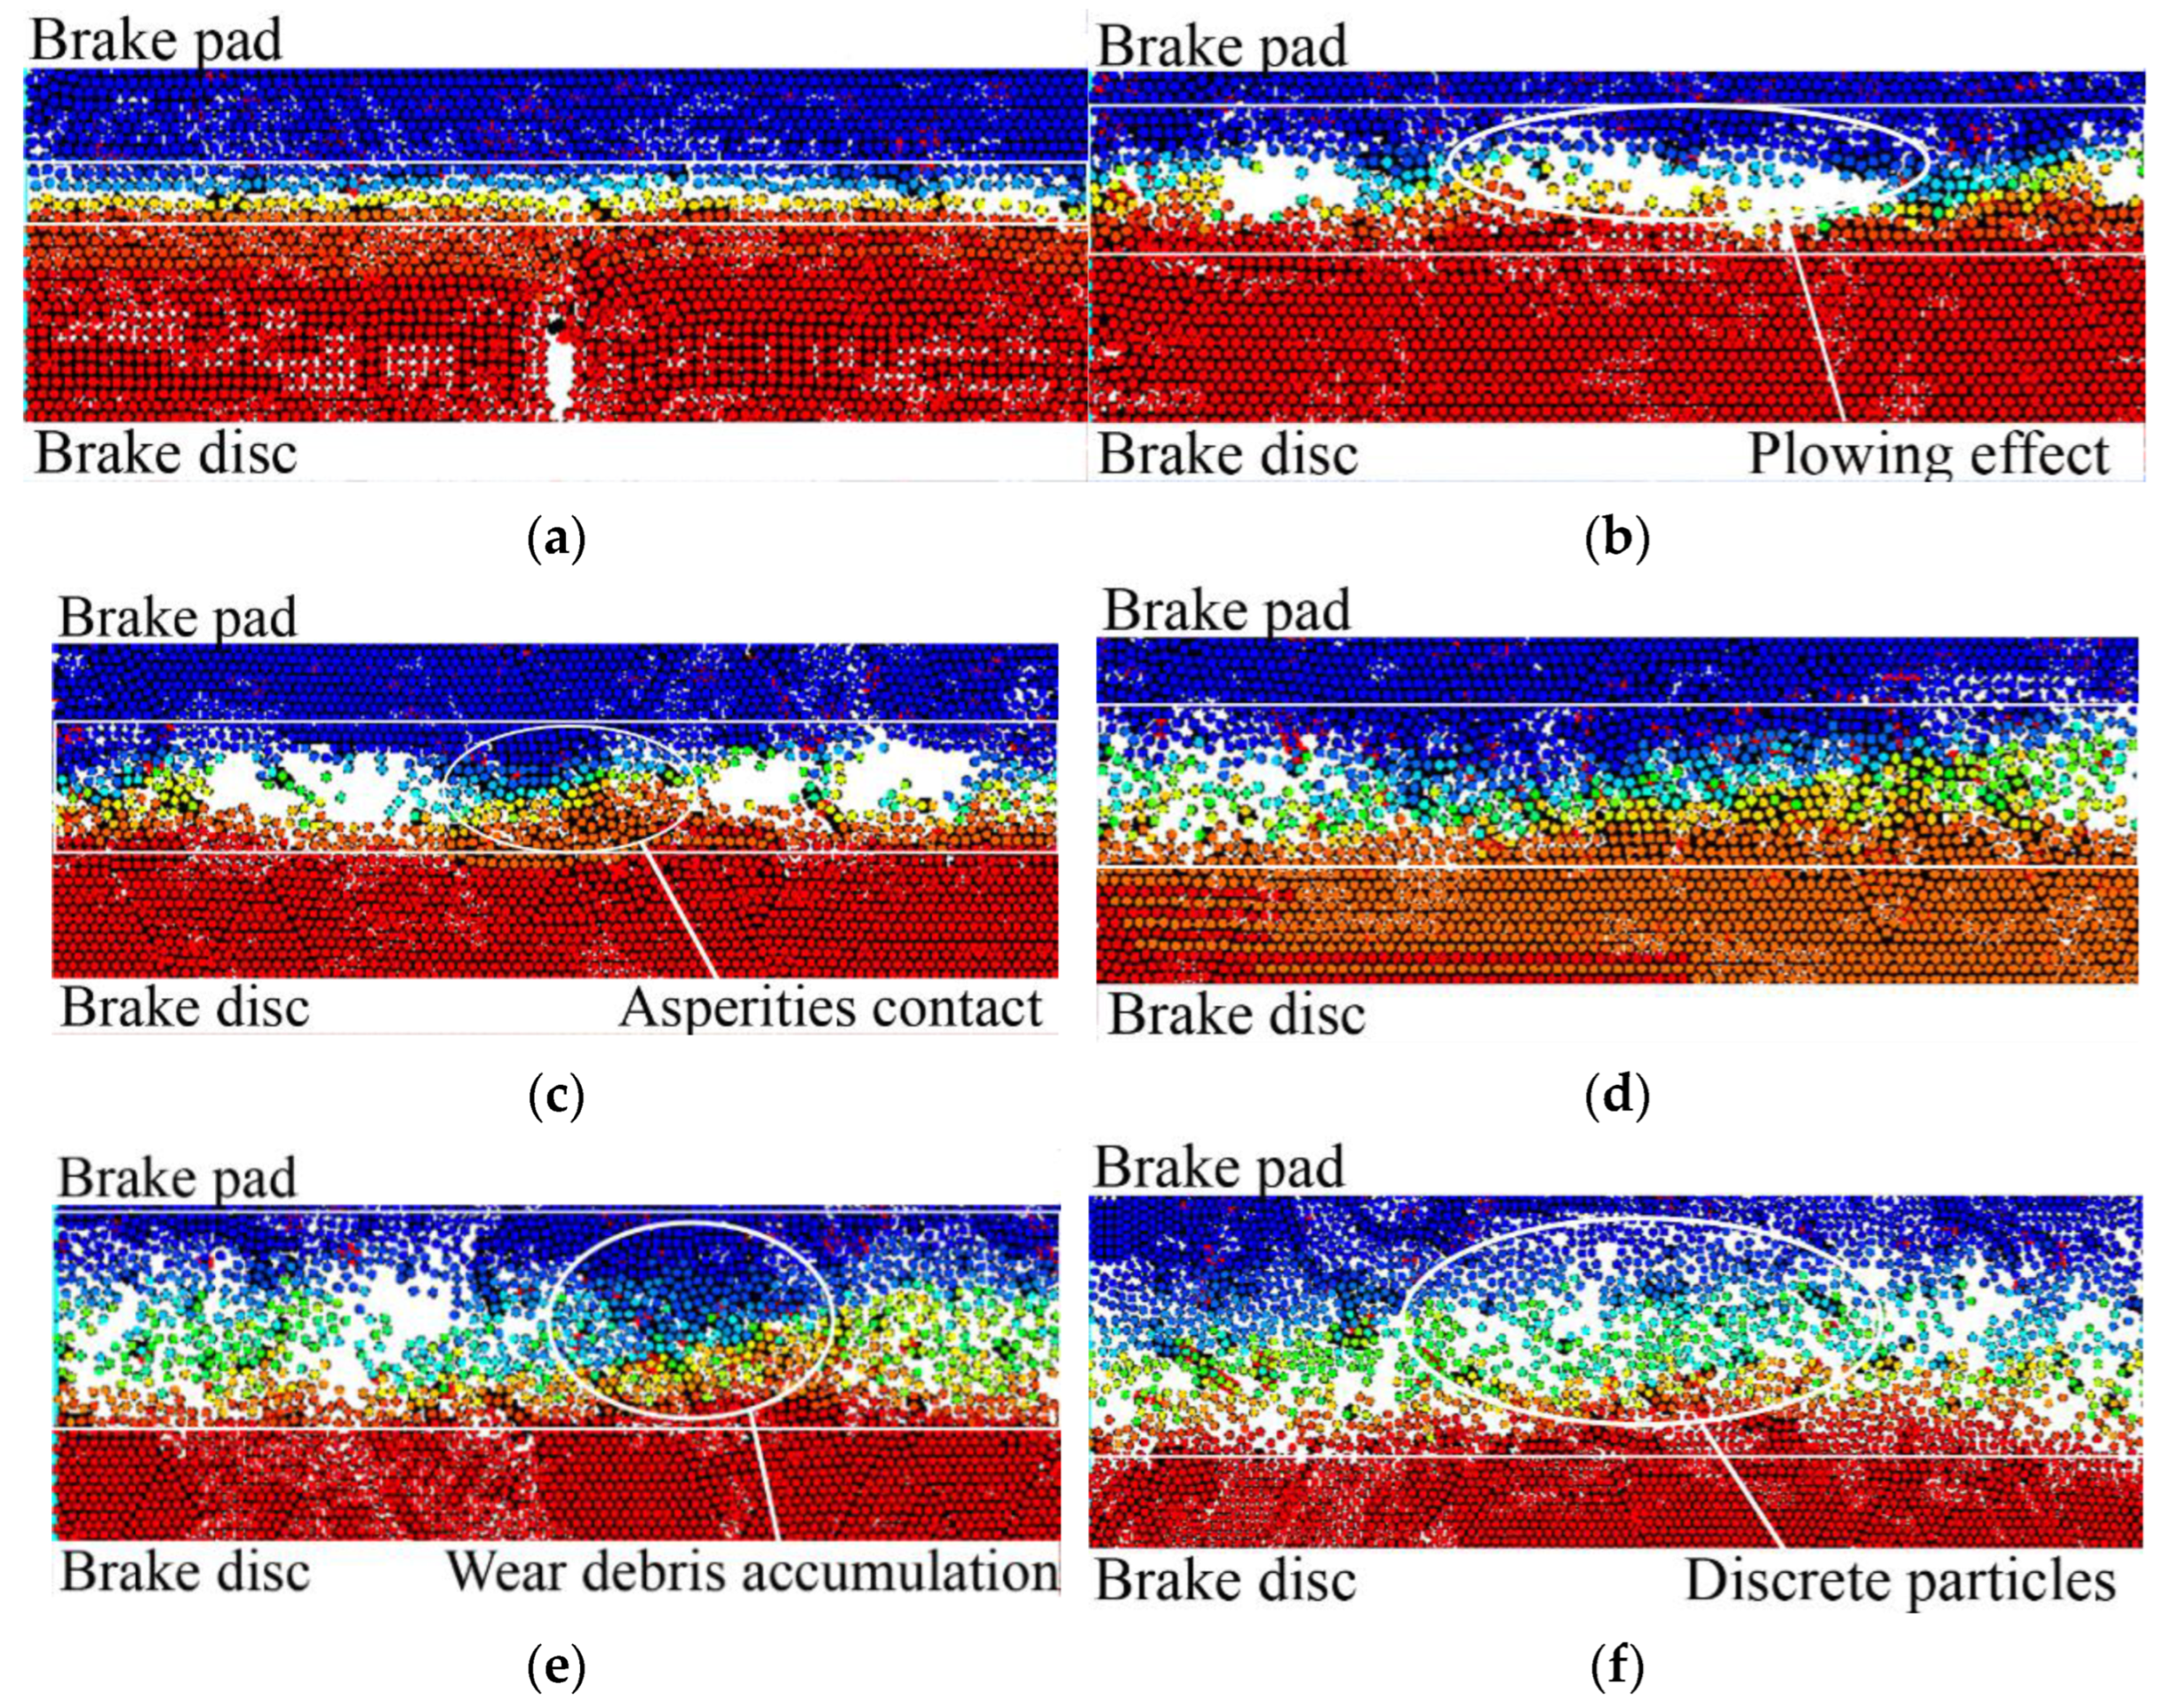
Figure 12a shows the contact state of the brake disc and pad. Because the brake disc and pad have the surface characteristics of pits and asperities, the interface contacts each other and scratches in the initial braking, as shown in
Figure 12b.
Figure 12c further illustrates that the interaction of the asperity with the rough surface aggravates the surface wear. This is because the strength of the brake disc material is higher than that of the brake pad, and the brake pad is the first to suffer material damage.
Figure 12d shows asperities are destroyed, and the material falling off the braking surface turns into wear debris. A part of the wear debris is filled in pits of the rough surface, and the other part leaves the wear layer of the surface with the brake disc movement. When moving in the wear layer, the area of the asperity is stacked with wear debris, as shown in
Figure 12e. Currently, the extrusion phenomenon increases the surface wear. When the wear debris and asperity are destroyed, the surface forms pits and the range of the wear layer is further expanded, as shown in
Figure 12f.
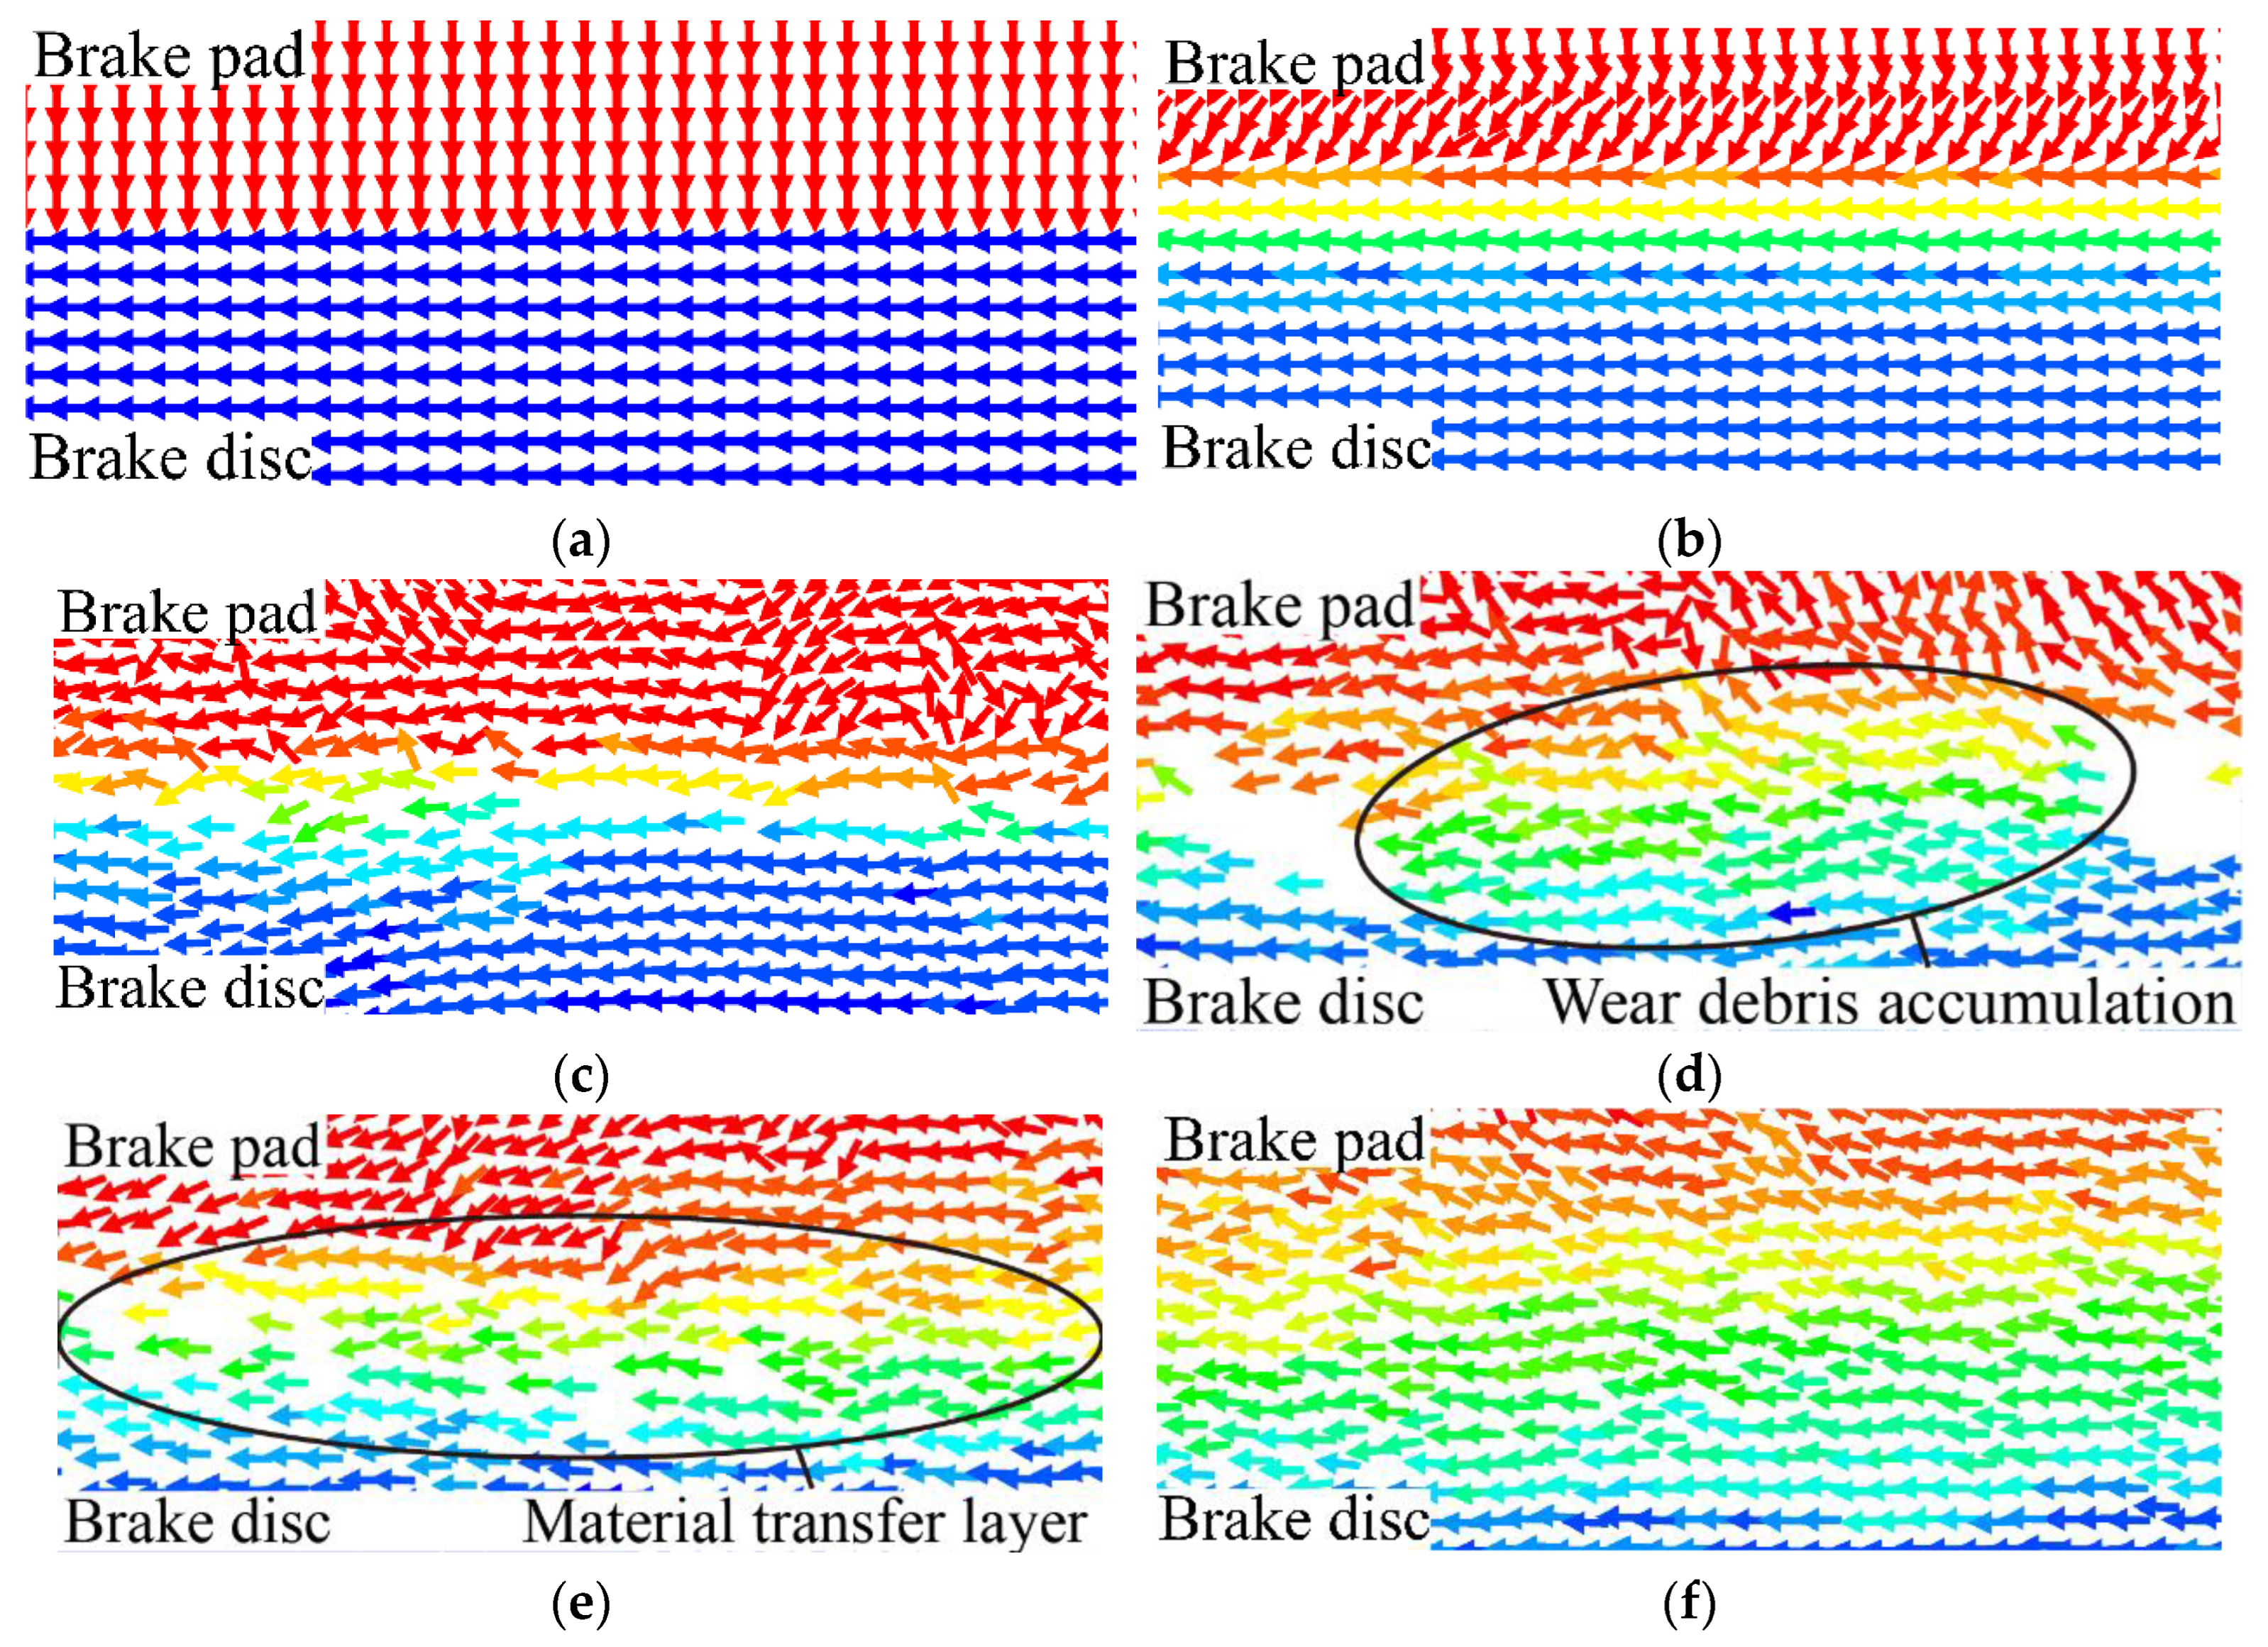
During the braking process of the disc brake, the surface material undergoes elastoplastic deformation. In severe wear cases, the material undergoes shear damage, and the material is separated from the brake disc and pad for transfer, causing surface wear. The velocity vector diagram describes the motion trend of metal materials, and the wear process is analyzed, as shown in
Figure 13.
When the brake disc and pad contact, the brake pad moves downward under the initial braking load. The rotation motion of the brake disc causes its moving speed direction to be horizontal, as shown in
Figure 13a. During the relative motion of the brake disc and pad, the surface material is squeezed. When the tangential force and the normal force exceed the allowable value of the material, shear fracture occurs in part of the material, which leaves the surface and moves in the braking interface, as shown in
Figure 13b,c. However, the brake disc and pad are in a state of squeezing each other, and the detached material accumulates, forming blocks or clusters of wear debris, as shown in
Figure 13d.
Furthermore, a large amount of wear debris forms a material transfer layer at the braking interface. Through the action of the shear force and the extrusion force, the wear debris accumulated in the material transfer layer is destroyed again, forming discrete wear debris with a smaller volume, as shown in
Figure 13e. Discrete wear debris leaves the surface, and the empty positions on the surface are supplemented by new discrete materials. The material transfer layer is always in a dynamic partial detaching and re-repairing process, as shown in
Figure 13f. However, the damage to the surface cannot be repaired, leading to the continuous expansion of the wear layer, so the surface of the brake disc and pad experiences material wear.
5. Effect of Braking Parameters on Brake Disc Wear
5.1. Effect of Initial Braking Load on Brake Disc Wear
In the process of DEM wear simulation, the change in the initial braking load affects the force state of the material. The particle displacement results of the surface in simulation braking conditions 1, 2, and 5 are extracted, respectively, as shown in
Figure 16. The influence mechanism of the initial braking load on surface wear is analyzed. From the simulation results, the material failure trend is distributed in layers, the wear debris leaves the surface during the braking process, and the interspace is generated. However, the interspace variation is minimally affected by macroscopic surface contact. When the relative position of the brake disc and pad remains unchanged, the increase in surface clearance will change the surface wear state.
Figure 16a is a cloud diagram of particle displacement when the initial braking load is 13 kN. The wear phenomenon occurs on the surface of the brake disc and pad, leading to material damage and destruction. The detached material leaves the surface as wear debris, resulting in an interspace in the braking interface. When the initial braking load is 17 kN, the wear becomes severe due to the increase of the load, and the wear debris of the surface clearance increases, as shown in
Figure 16b. The reason is that when the rough surfaces are squeezed against each other, the large load makes the asperity easier to destroy, and the wear debris that does not leave the surface accumulates. When the initial braking load is 21 kN, the wear layer of the surface becomes significant, as shown in
Figure 16c. There is an apparent fault phenomenon between the wear debris and the surface, and the interspace becomes large, which further proves that the increase of the load would aggravate surface wear. Similarly, it shows that surface wear results from the interaction between the rough surfaces and is affected by the motion of the wear debris on the surface.
Initial braking load can directly affect the number of particle force chain breaks, which cause material particles to fall off, as shown in
Figure 17. In the DEM wear simulation, the force chain distribution trend of the particle indicates the severity of the material damage. Black compressive force chains are more, and red tensile force chains are less. During the braking process, the organizational damage of the material is mainly affected by the squeezing force.
When the initial braking load is 13 kN, strong force chains of the primary materials of the brake disc and pad are densely distributed, but strong force chains of the wear area are sparsely distributed, as shown in
Figure 17a. It shows that the load of the primary body material is within the allowable range, but the material structure is unstable. There is a small volume of loose wear debris, and the wear phenomenon only occurs on the surface. When the initial braking load is 17 kN, the number of strong force chains increases, but the number of strong force chains between the brake disc and the main body of the brake pad is significantly reduced. The increased initial braking load causes some strong force chains to break with maximum stress values exceeding their strength limits.
Meanwhile, decreased strong force chains reduce the stability of the particle system, resulting in a sparser distribution trend of force chains, as shown in
Figure 17b. The material structure is damaged, and wear debris increases. Under the action of a large load, the strength of the surface material is weakened, causing material damage to occur more easily, and aggravating surface wear. When the initial braking load is 21 kN, the number of strong force chains between braking interfaces is small. The strong force chain structure of the brake disc and brake pad body close to the surface is loose, and the strong force chain structure far away from the surface is dense, which shows that the damage range of the particle system increases, as shown in
Figure 17c. The surface damage extends to the inside of the material, and the surface wear continues to expand with the material damage.
In addition,
Figure 16 shows the changes in the number of force chains of particles and clearly distinguishes the range of force chains between the brake disc and the main body of the brake pad. The strength limit of the brake disc material is high, but the strength limit of the brake pad material is low. Therefore, in the braking process, the brake pad material undergoes shear failure first under the action of the squeezing force. The surface wear of the brake pad is greater than that of the brake disc.
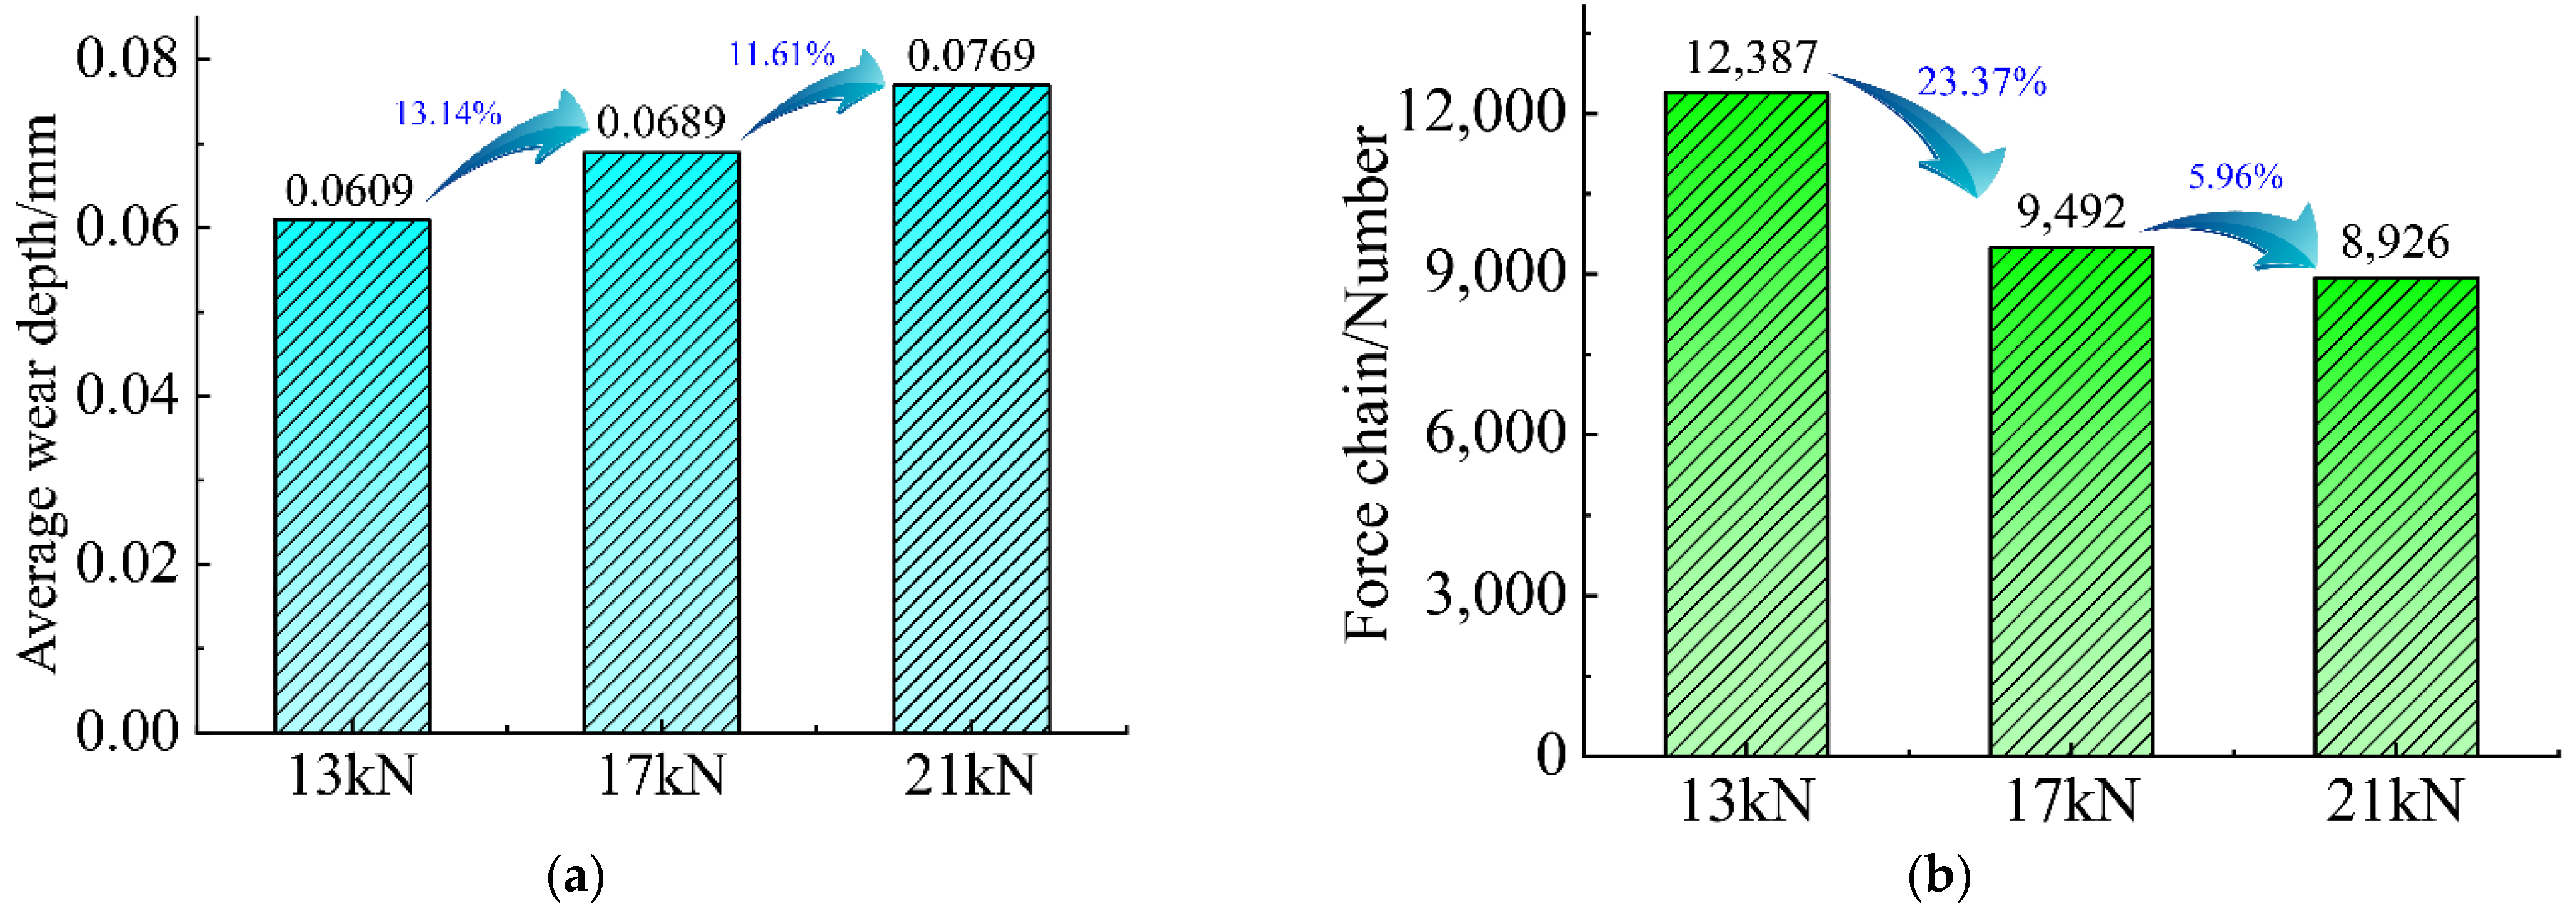
To quantitatively analyze surface wear, the wear depth of the surface and the number of force chains of the material organization are extracted, as shown in
Figure 18. It can be seen from
Figure 18a that the increase in the initial braking load causes surface wear to increase. Braking load affects the formation of the surface material transfer layer. With the increase in the initial braking load, the number of wear debris in the material transfer layer increases to a steady state. It means that the initial braking load is large within a certain range, which causes serious damage to the surface material, and more wear debris is generated on the surface. By counting the number of force chains of particles, it can be found that as the initial braking load increases, the number of force chains of particles shows a downward trend, as shown in
Figure 18b. The large load causes damage and destruction of the material, resulting in a large number of force chains breaking, which reduces the structural strength of the surface material. This is because the initial braking load is large, and the normal force on the surface is large. The material is severely squeezed, and the material reaches the limit of compressive strength early. Meanwhile, the damage degree of material tissue is severe.
In addition, when the initial braking load rises from 13 kN to 17 kN, the wear depth increases by 13.14%, and the number of force chains decreases by 23.37%. When the initial braking load rises from 17 kN to 21 kN, the wear depth increases by 11.61%, and the number of force chains decreases by 5.96%. It can be seen that the initial braking load rises uniformly, and the increase in the wear depth is similar. However, the decrease rate of the break number of force chains is large when the initial braking load is 17 kN, indicating that the material structure is unstable and wear is prone to occur. Therefore, in the actual braking process, it is recommended to select an initial braking load of 13 kN for mechanical braking under the premise of ensuring braking demand.
5.2. Effect of Initial Braking Speed on Brake Disc Wear
The initial braking speed determines the braking speed of the brake disc during braking. The simulation braking conditions 3, 4, and 5 are extracted, and the influence mechanism of the initial braking speed on surface wear is analyzed, as shown in
Figure 19.
It can be seen from
Figure 19a that when the initial braking speed is 800 r/min, the particle distribution is not uniform. Still, the damage of the particle system is concentrated on the surface. When the initial braking speed is 1000 r/min, the damage range of the particle system is enlarged, and the number of discrete particles in the wear layer increases, as shown in
Figure 19b. The initial braking speed increases and the mutual impact of rough surfaces is strengthened. The wear debris impacts the surface under the rotation influence of the brake disc, causing damage to the asperity on the surface. When the initial braking speed is 1200 r/min, it can be found that surface wear is even. The motion speed of particles is accelerated at a high rotation speed, and surface particles fall off by impact force easily, as shown in
Figure 19c. As the initial braking speed increases, the motion speed of particles in the wear layer accelerates, and the particles do not have enough time to fill the interspace, so faults occur during wear.
The initial braking speed affects the motion state of particles and changes the shear force generated by the relative motion. The relative motion speed of the brake disc and pad is large, and the surface material is subjected to a large shear force. Under high-speed braking conditions, the initial braking speed increases the mutual extrusion of the braking surface and the collision between the wear debris and the surface, causing local deformation and plastic fracture on the surface. In addition, a higher relative motion speed causes the wear debris to leave the braking interface faster, and thereby, surface wear is accelerated.
When the initial braking load is the same, the force chain cloud diagram can reveal the influence of the initial braking speed on the surface damage degree, as shown in
Figure 20. When the initial braking speed is 800 r/min, the strong force chain structure of the brake disc and the main body of the brake pad is relatively loose, and the weak force chain assists the strong force chain supporting material structure shown in
Figure 20a. When the initial braking speed is 1000 r/min, the number of strong force chains increases significantly, and the structure of the force chain between the brake disc and the main body of the brake pad is compact. The reason is that the initial braking speed is large, the energy carried by particles is high, and strong force chains are needed to carry the load. When the maximum stress value of the force chain exceeds the strength limit of the strong force chain, strong force chains will break, and parts of weak force chains are transformed into strong force chains as a supplement to maintain the material structure, as shown in
Figure 20b.
Under the same load, the increase of the initial braking speed increases the speed difference between the relative motion of the brake disc and pad. A large amount of kinetic energy is converted into internal energy, leading to changes in material properties and accelerating the surface wear. When the initial braking speed is 1200 r/min, it can be seen from
Figure 20c that the force chain distribution in the wear area is sparse, and the strong force chain distribution between the brake disc and the main body of the brake pad is dense. The reason is that the initial braking speed increases, and the compressive and tensile forces of particles increase, accelerating the formation of strong force chains and making the particle system more stable. It shows that increasing the initial braking speed increases the shear force of the material, making it easier for the shear stress of the material to reach the shear strength, resulting in material failure.
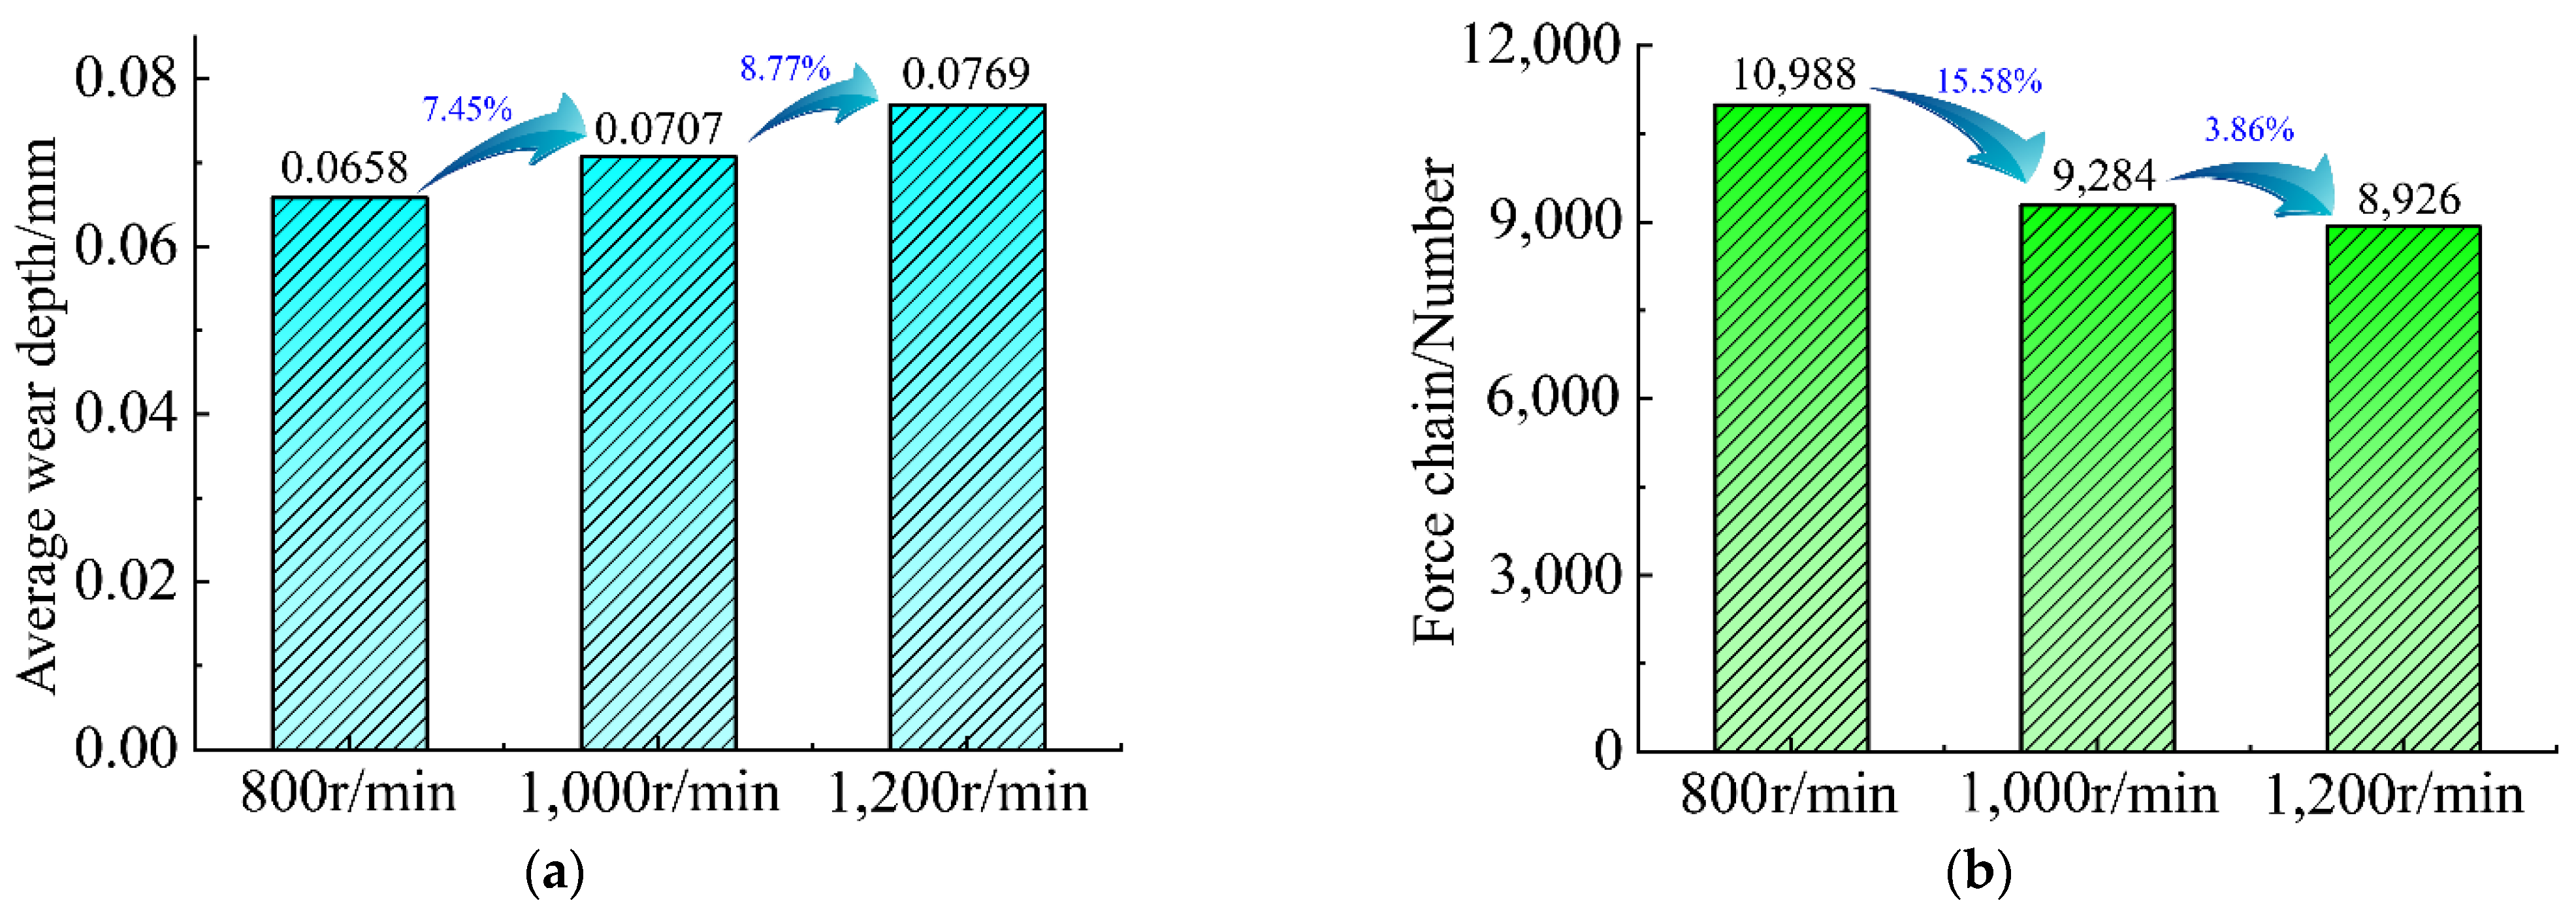
The wear depth and the number of force chains at different initial braking speeds are extracted, as shown in
Figure 21. Increased initial braking speed aggravates the wear of the braking interface, as shown in
Figure 21a. The growth of the initial braking speed increases the friction force and impact force, increasing the mechanical engagement of the rough surfaces. Meanwhile, the process of converting kinetic energy into internal energy releases a large amount of heat, which reduces the hardness and strength of the material. The action of shear force increases the damage range of the surface. As shown in
Figure 21b, the initial braking speed is high and the particle shear stress is large, causing the fracture of strong force chains in the particle system. However, due to the decrease in the number of weak force chains, the structural stability of the particle system decreases, and damage continues to occur. It shows that increased initial braking speed increases the squeezing force of the material, reducing the surface material strength. Furthermore, the interaction with the braking interface becomes intense, and the damage range of the material increases, which eventually leads to severe wear of the braking interface.
Moreover, when the initial braking speed rises from 800 r/min to 1000 r/min, the wear depth increases by 7.45%, and the number of force chains decreases by 15.58%. When the initial braking speed rises from 1000 r/min to 1200 r/min, the wear depth increases by 8.77%, and the number of force chains decreases by 3.86%. It can be seen that the wear depth rises with increasing initial braking speed. However, when the initial braking speed is 1000 r/min, the number of force chain fractures decreases greatly, indicating that increased initial braking speed would increase the damage of the material structure and aggravate the surface wear. This phenomenon can affect the contact state of the surface and reduce the braking capacity of the disc brake. Therefore, in the actual braking process, selecting an initial braking speed of 800 r/min for mechanical braking under the premise of ensuring braking demand is recommended.
