Article

Lubricating Oil Consumption Measurement on Large Gas Engines

1
Large Engines Competence Center GmbH, 8010 Graz, Austria
2
JR AquaConSol GmbH, 8010 Graz, Austria
3
Institute of Organic Chemistry, Graz University of Technology, 8010 Graz, Austria
4
Institute of Combustion Engines and Thermodynamics, Graz University of Technology, 8010 Graz, Austria
*
Author to whom correspondence should be addressed.
Lubricants 2022, 10(3), 40; https://doi.org/10.3390/lubricants10030040
Submission received: 24 January 2022 / Revised: 25 February 2022 / Accepted: 3 March 2022 / Published: 8 March 2022
(This article belongs to the Special Issue Tribology in Mobility)

Abstract

:
Increasing the reliability of combustion engines while further reducing emissions and life cycle costs are the main drivers for optimizing lubricating oil consumption (LOC). However, in order to reduce the lube oil consumption of an engine, it is crucial to measure it accurately. Therefore, a LOC measurement device based on the use of the stable isotope deuterium has been developed. Previous publications have focused on the use of passenger car engines. This publication describes the first application of this newly developed method on a large gas engine. This is of particular interest as large-bore engines might show different oil consumption behavior, much higher LOC in gram per hour and the bigger oil reservoir need larger amounts of tracer. Additionally, a different type of fuel has an effect on oil consumption measurement as well, as presented in this paper. The results showed this method can be applied to large gas engines as well after conducting minor changes to the measurement setup. However, other than liquid fuels, the origin and isotopic composition of the natural gas has to be monitored. Ideally, gas from large storage is used for carrying out these measurements.

1. Introduction

As internal combustion engines operate at high speeds and loads, continuous lubrication of the piston group is indispensable in order to prevent scuffing and provide optimized mechanical efficiency. Moreover, the tribological properties of the piston group—lubrication, wear, and friction—are omnipresent research topics in the field of combustion engines. However, as the combustion engine is an open system, with masses constantly entering and exiting the system boundaries, the lubricating oil itself is continuously consumed as well. Increasing reliability of combustion engines while further reducing emissions and life cycle cost are main drivers for optimizing the lubricating oil consumption (LOC). Above all, lowering the life cycle cost by extending the time between overhaul (TBO) would be a key benefit of a LOC reduction. Contaminants coming from the oil are considered to lead to poisoning of catalytic materials of the exhaust gas after-treatment system. Precious metal catalysts as used in catalytic oxidation catalysts to convert residual organic compounds and also as a part of selective catalytic reaction (SCR) and ammonia slip catalyst (ASC) systems to reduce nitrogen oxide emissions from large engines are very sensitive to poisoning by sulfur and phosphorus from the engine oil. Another highly important point is the influence of oil droplets on combustion anomalies, for example, as a preignition resulting knocking of an engine, described in [1].
Currently, these are the main drivers for reducing the oil consumption of an engine. However, further legislative limitations of carbon dioxide emissions of engines already operating on carbon-free fuels will address the oil consumption of an engine. Therefore, a further reduction of the oil consumption of an engine will keep engine manufacturers and research facilities busy. However, as the oil consumption of engines often undergoes lower detection limits of state-of-the-art methods, a new measurement method, based on the use of the stable isotope deuterium as a tracer, was developed and patented, as described in [2,3,4]. In order to provide an overview of the various approaches to this topic, Table 1 lists different tracers, their advantages and downsides, and respective literature sources. The method presented in this paper is supposed to solve or at least scale down the challenges and downsides of state-of-the-art methods. This method is based on marking synthetic base oil with a non-radioactive isotope of hydrogen: deuterium by a two-step hydrogen/deuterium exchange process.
The product of this reaction will be called “tracer” throughout this publication. This tracer is then blended into the lubricating oil of the engine. Subsequently, the amount of deuterium in the water vapor of the exhaust gas of the engine is determined using a cavity ring-down spectrometer (CRDS). The LOC can then be calculated by setting up a mass balance, using the combustion chamber as a system boundary, taking into account the concentration of deuterium in the intake air, fuel, oil, and exhaust gas.
This method has been successfully applied on passenger cars and heavy-duty engines operated with gasoline and diesel fuel. Current trends towards the electrification of passenger car engines might reduce the range of application of this method. Therefore, this publication shall focus on the application of this newly developed method on large gas engines, as those will become even more important in terms of transportation and power generation during the next decades.
The following chapters shall describe the challenges, respective solutions, and results applying this method to a large single-cylinder gas engine. The paper is structured in describing the measurement device, three major challenges when applying the deuterium method on a large engine, and respective solutions. In the last chapter, results and comparisons to a reference method will be presented.

2. Materials and Methods

This chapter focuses on the materials and methods and especially on the prototype used to achieve the results.

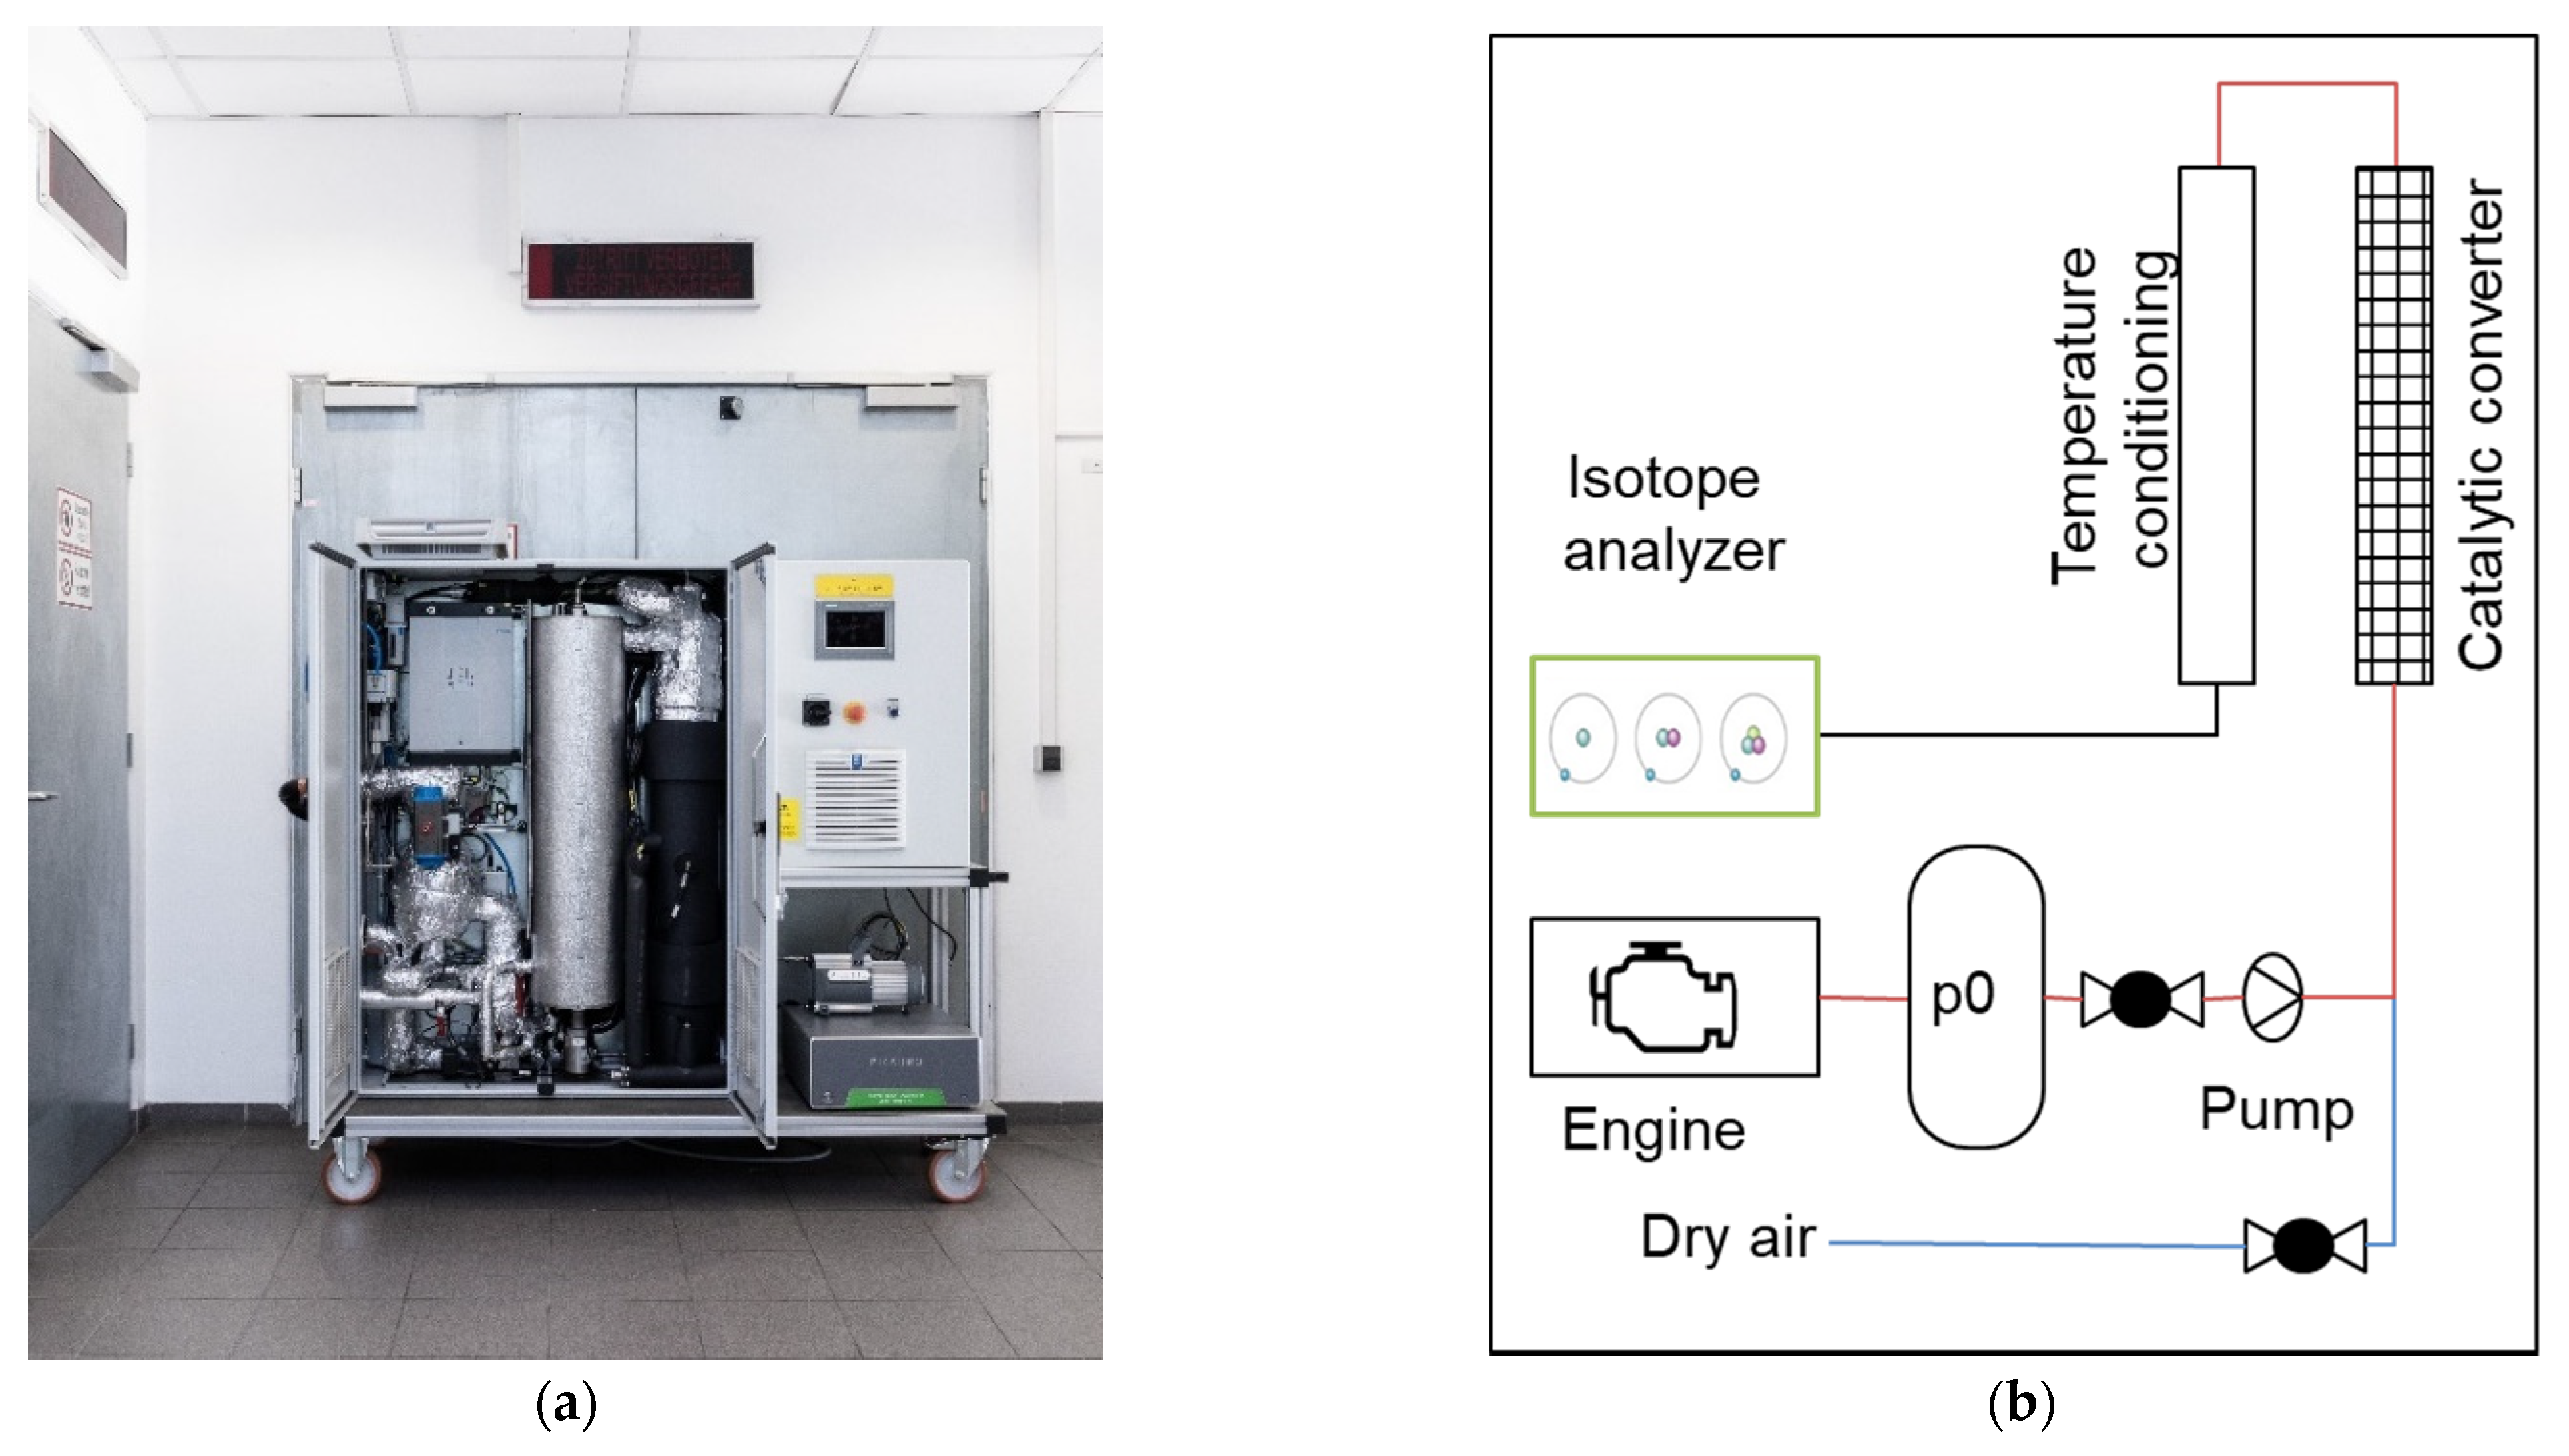
The Measurement Device

In order to fully understand the challenges described in the following chapter, it is necessary to provide a brief description of the measurement setup. Figure 1a shows a photograph of the device and the components it contains, whereas a schematic overview can be found in Figure 1b. As mentioned above, the main component is an isotopic water vapor analyzer capable of measuring the hydrogen/deuterium-ratio (1H/2H-ratio) in the sample gas. Due to limitations of the analyzer regarding the sample gas and to prevent tracer slip, the exhaust gas needs to be conditioned before reaching the analyzer. In order to avoid condensation inside the analyzer, the maximum humidity of the sample gas is limited to 50,000 ppm. Therefore, the prototype is fed by two media–the exhaust gas of the engine and pressurized air. The pressurized air is led through a drying unit and then mixed with the exhaust gas of the engine to reduce the humidity of up to 150,000 ppm down to 50,000 ppm. As the analyzer is capable of measuring the 1H/2H ratio in water vapor only, the exhaust gas needs to go through a catalytic oxidizer, converting unburned hydrocarbons to water (and carbon dioxide). Finally, the sample gas is conditioned to a temperature of 70 °C, right at the inlet of the analyzer. The lower limit is predetermined by the dew point of the exhaust gas at this point. In order to lower the dew point temperature and avoid condensation in the sample line, the exhaust gas needs to be dried, as the inlet temperature of the analyzer is limited to 70 °C. Moreover, the ideal operating range of the analyzer regarding humidity lies between 20,000 and 40,000 ppm water (H2O).
The output signal is then transferred to the test bench software via ethernet connection, where the lube oil consumption is calculated.

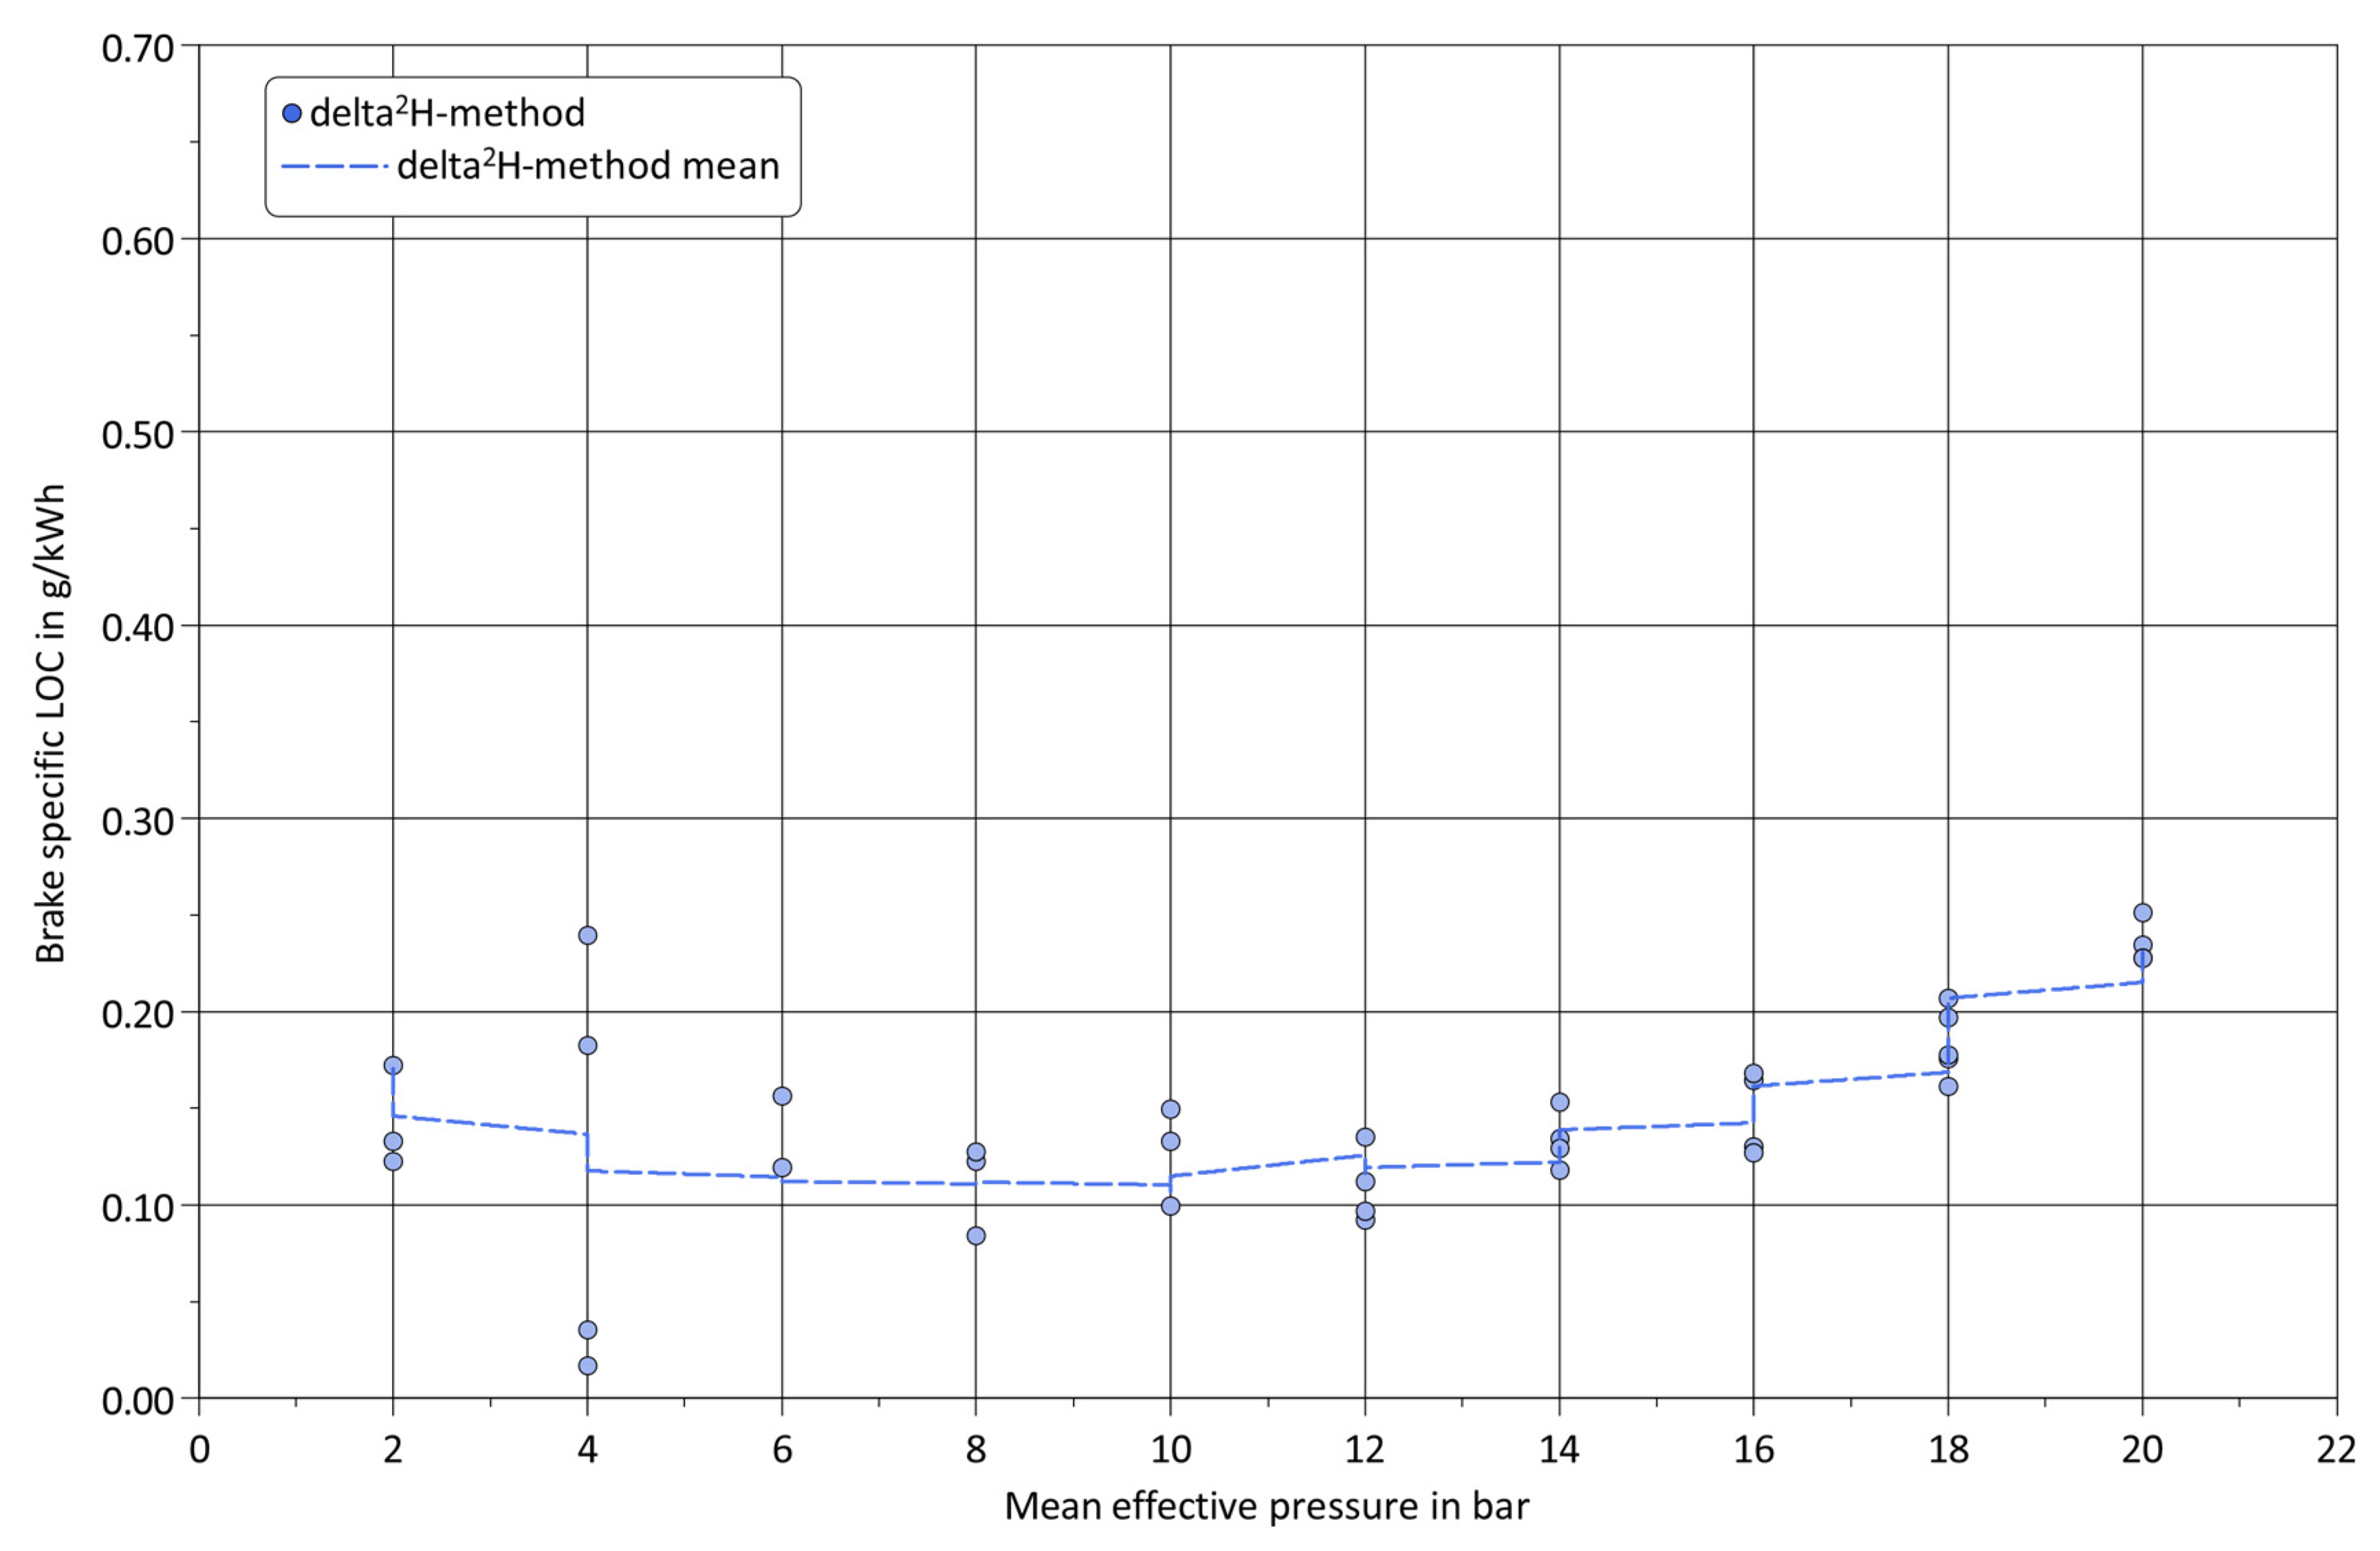
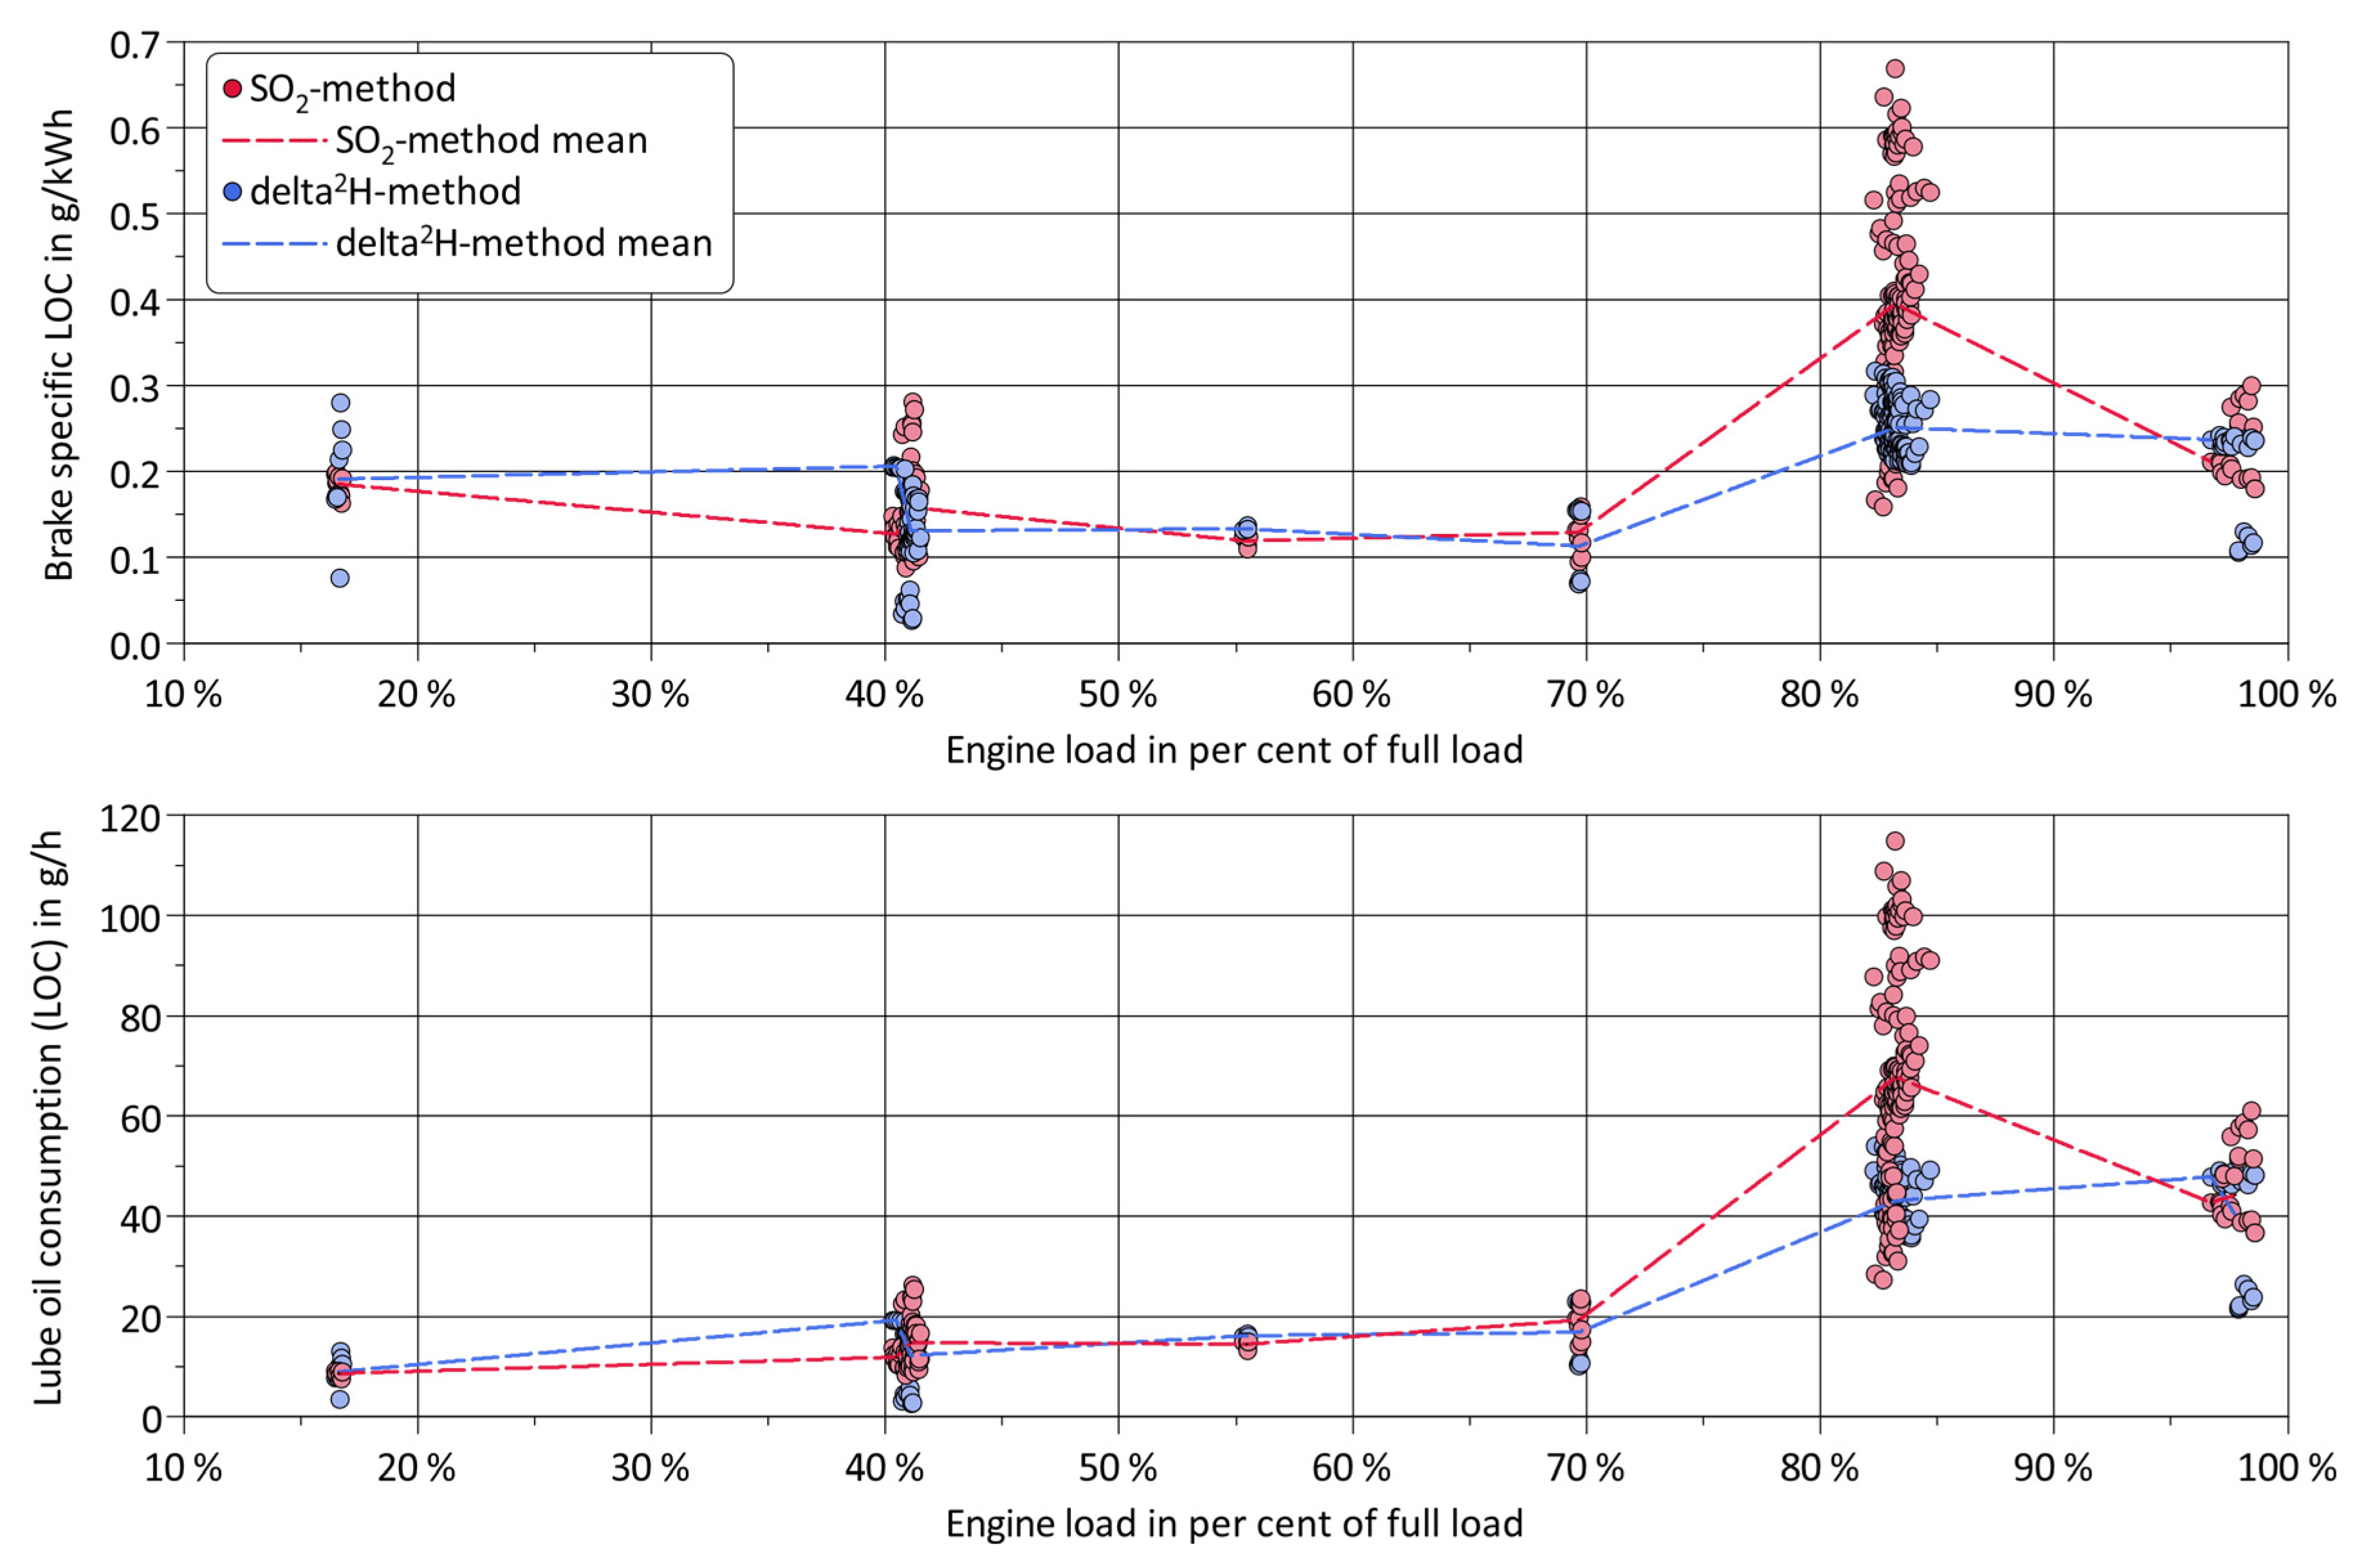
3. Results and Discussion

Before presenting the results, at this point, the test carrier shall be described. The test engine is a large-bore single-cylinder engine operated by natural gas. For reasons of confidentiality, a more detailed description of the test carrier must, unfortunately, be omitted at this point.
The results section consists of two types of results. One part focuses on the challenges and respective results achieved when these challenges were analyzed and finally overcome. The second part described the actual engine test bench experiments and comparisons to a state-of-the-art method for LOC measurement.

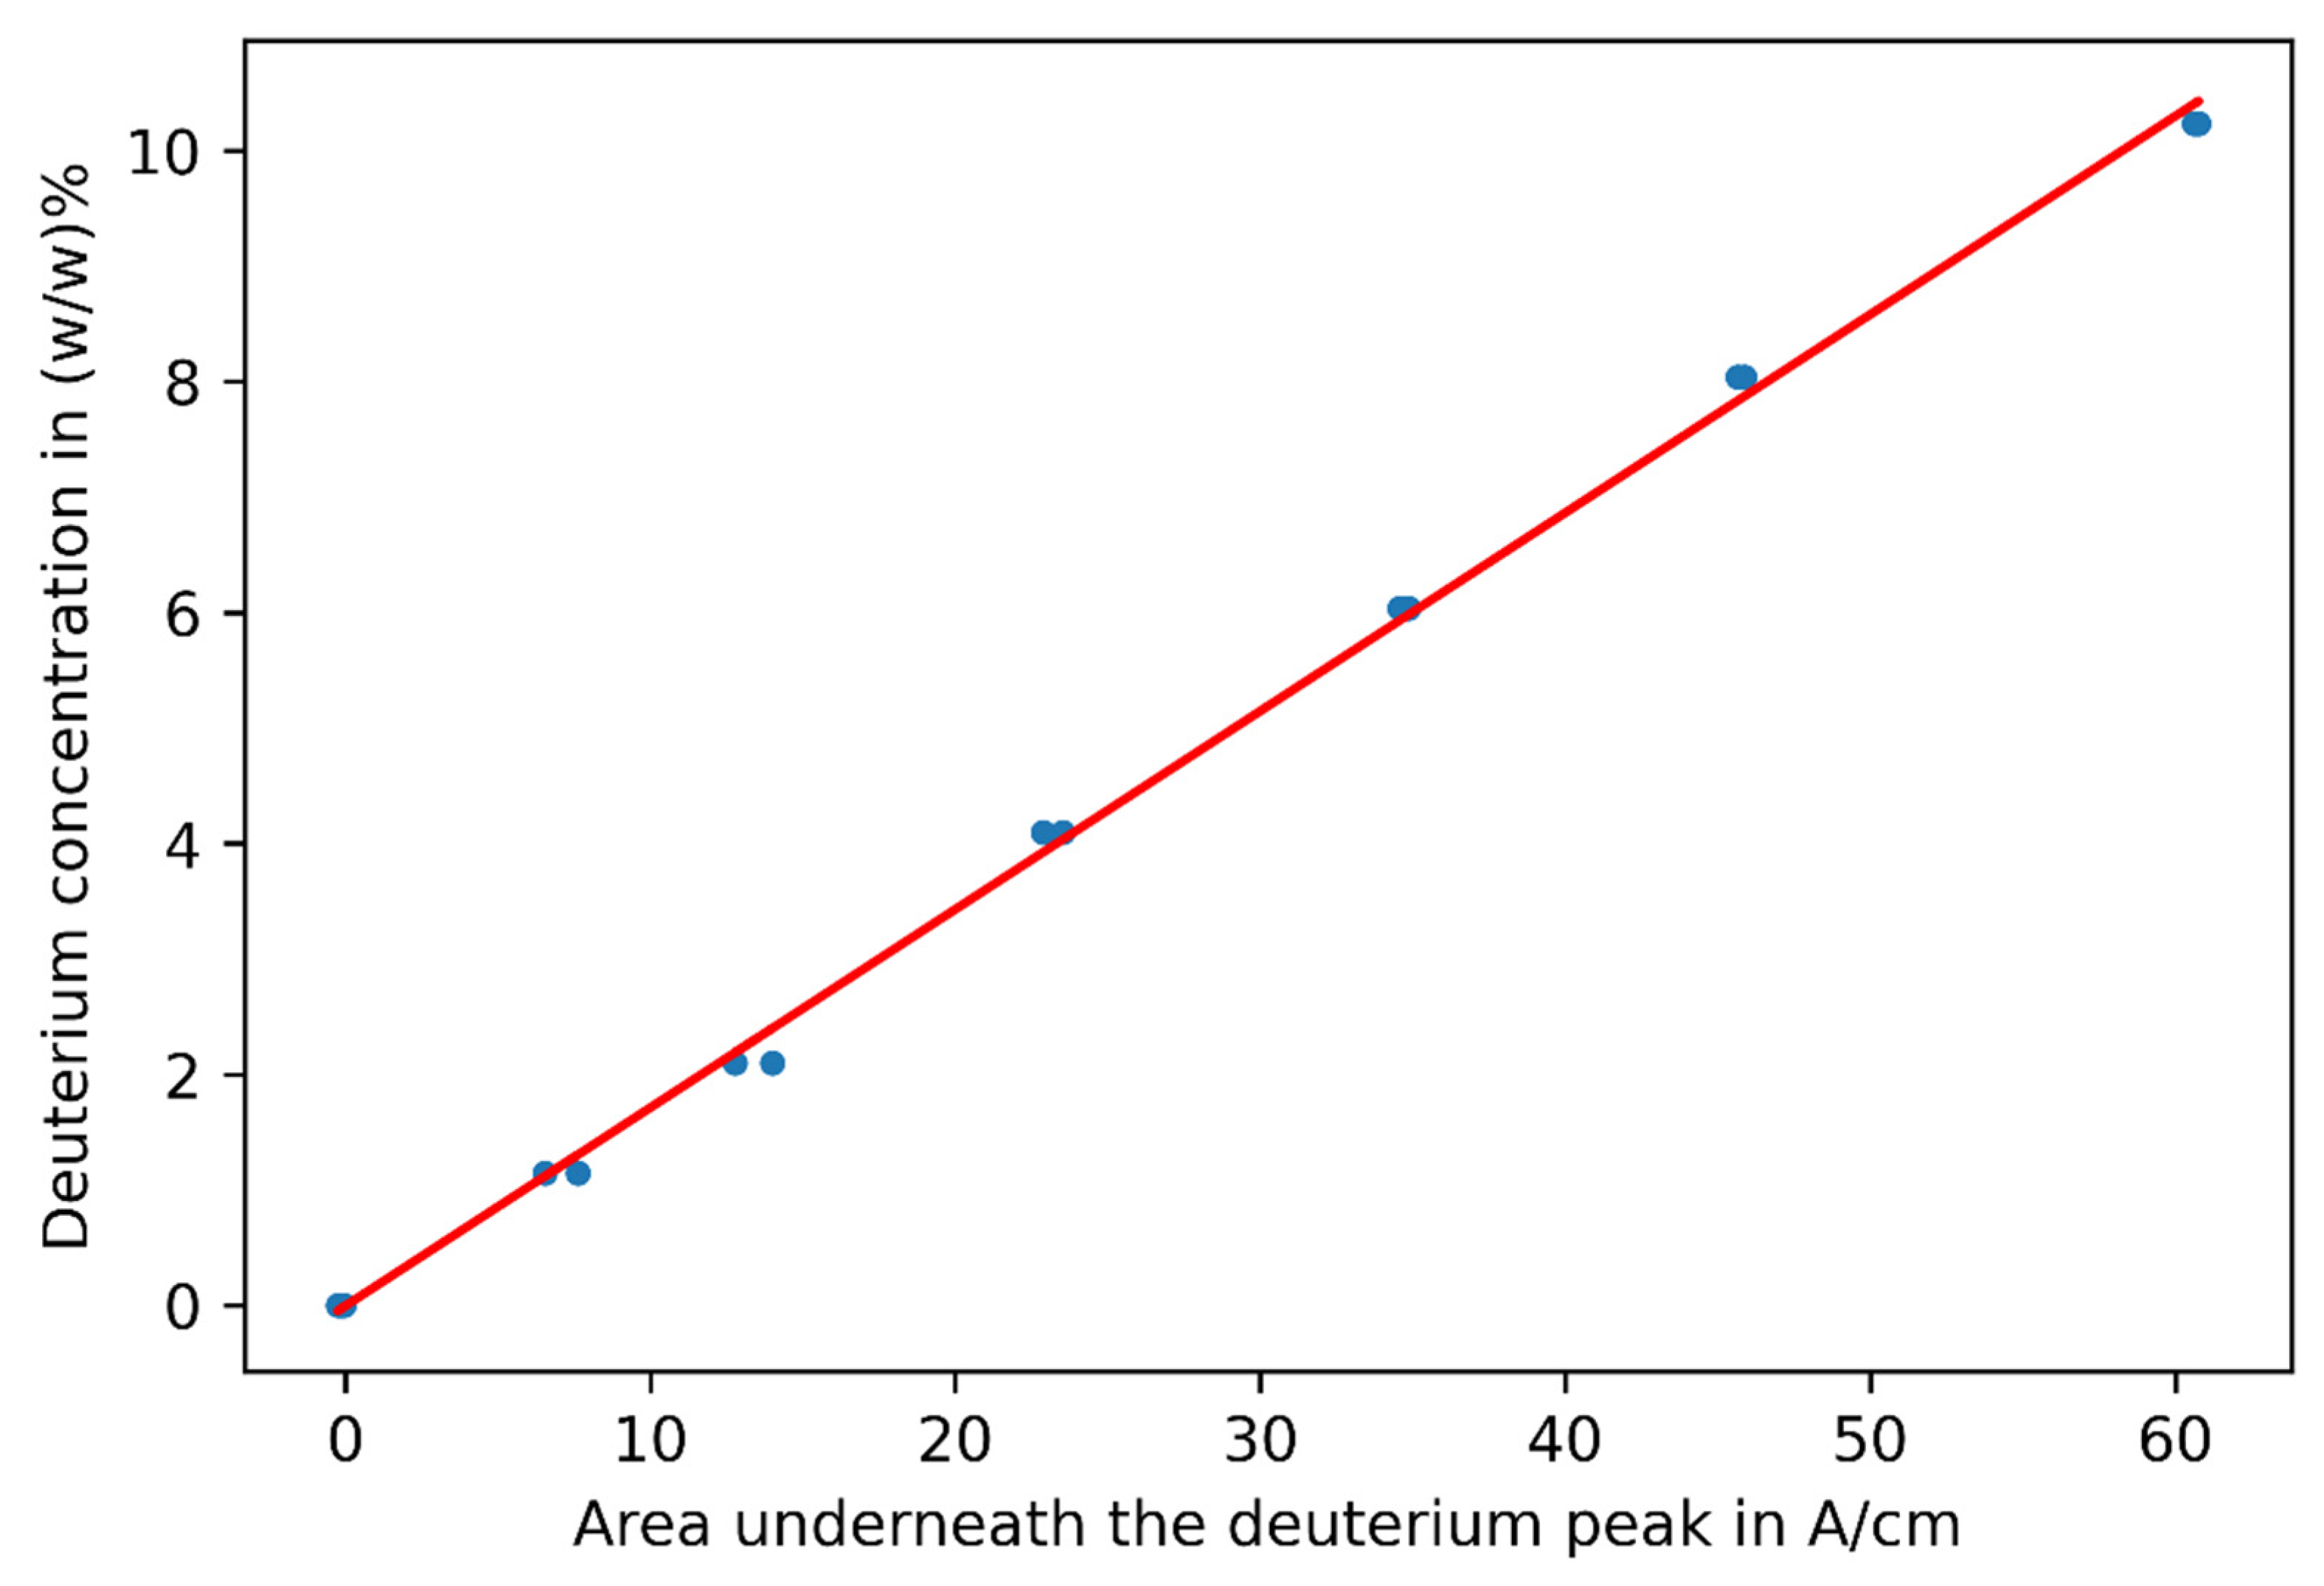
3.1. Challenge 1: Amount of Tracer

As mentioned previously, the tracer is manufactured by conducting a hydrogen/deuterium-exchange reaction on synthetic base oil. This reaction is based on the findings described in [13,14] but has been further improved in the course of the present research project. One of the first obvious challenges is the amount of tracer (deuterated base oil) needed in order to spike a complete oil filling of a large engine with deuterium. In order to achieve a deuterium signal in the exhaust gas, clearly distinguishable from the background, around 1% (w/w) of deuterium needs to be added to the oil. Assuming a hydrogen-deuterium exchange ratio of around 70–80 at%, this means around 5% (w/w) of tracer need to be added to the oil. For passenger car engines, this means, around 200 to 600 g of base oil have to undergo the hydrogen/deuterium-exchange process. However, large single-cylinder engines installed at research facilities have oil conditioning systems and, therefore, large systems circulating big amounts of lubricating oil. In this case, the lubricating system contains around 200 L of engine oil. This means an amount of roughly 10 L of synthetic base oil has to be deuterated. This entails two challenges: cost and time for the reaction. These challenges were solved using a pressure reactor with a volume of 5 L, so 1 L of oil could be deuterated at once. In addition, the heavy water used as a deuterium source and the palladium catalyst was recycled after the second reaction, further lowering the cost.
Continuous monitoring not only of the efficiency of the reaction but also of the stability and concentration of deuterium in the lubricating oil of the engine is crucial for the successful application of this newly developed method. This monitoring was carried out using a portable Fourier transform infrared spectrometer (FTIR) from the company eralytics GmbH. The eralytics ERASPEC OIL (Figure 2) is capable of determining a variety of parameters such as total base number (TBN), total acid number (TAN), contaminants, degradation products by predefined methods. In addition, it is possible to receive the complete infrared spectrum. Different algorithms for determining the deuterium concentration in the oil have been defined and evaluated. By calibration with 1H-nuclear magnetic resonance (NMR) spectroscopy, the most accurate and promising algorithm in terms of linearity has been chosen for further consideration.
The following figures show typical infrared (IR) spectra of complete engine oil without (Figure 3) and with (Figure 4) deuterium tracer added. After deuteration, a significant peak in the highlighted region between 1900 and 2400 wavenumbers is visible. Additionally, the area and the new baseline chosen by the algorithm are highlighted.
Comparisons to 1H-NMR measurements have shown there is a strong linear correlation (coefficient of determination or R2 score of 0.9984) between the concentration of deuterium and the area underneath the respective peak in the IR spectrum (Figure 5). The blue dots represent the collected measurement data for each concentration, whereas the red line depicts the calculated regression line.

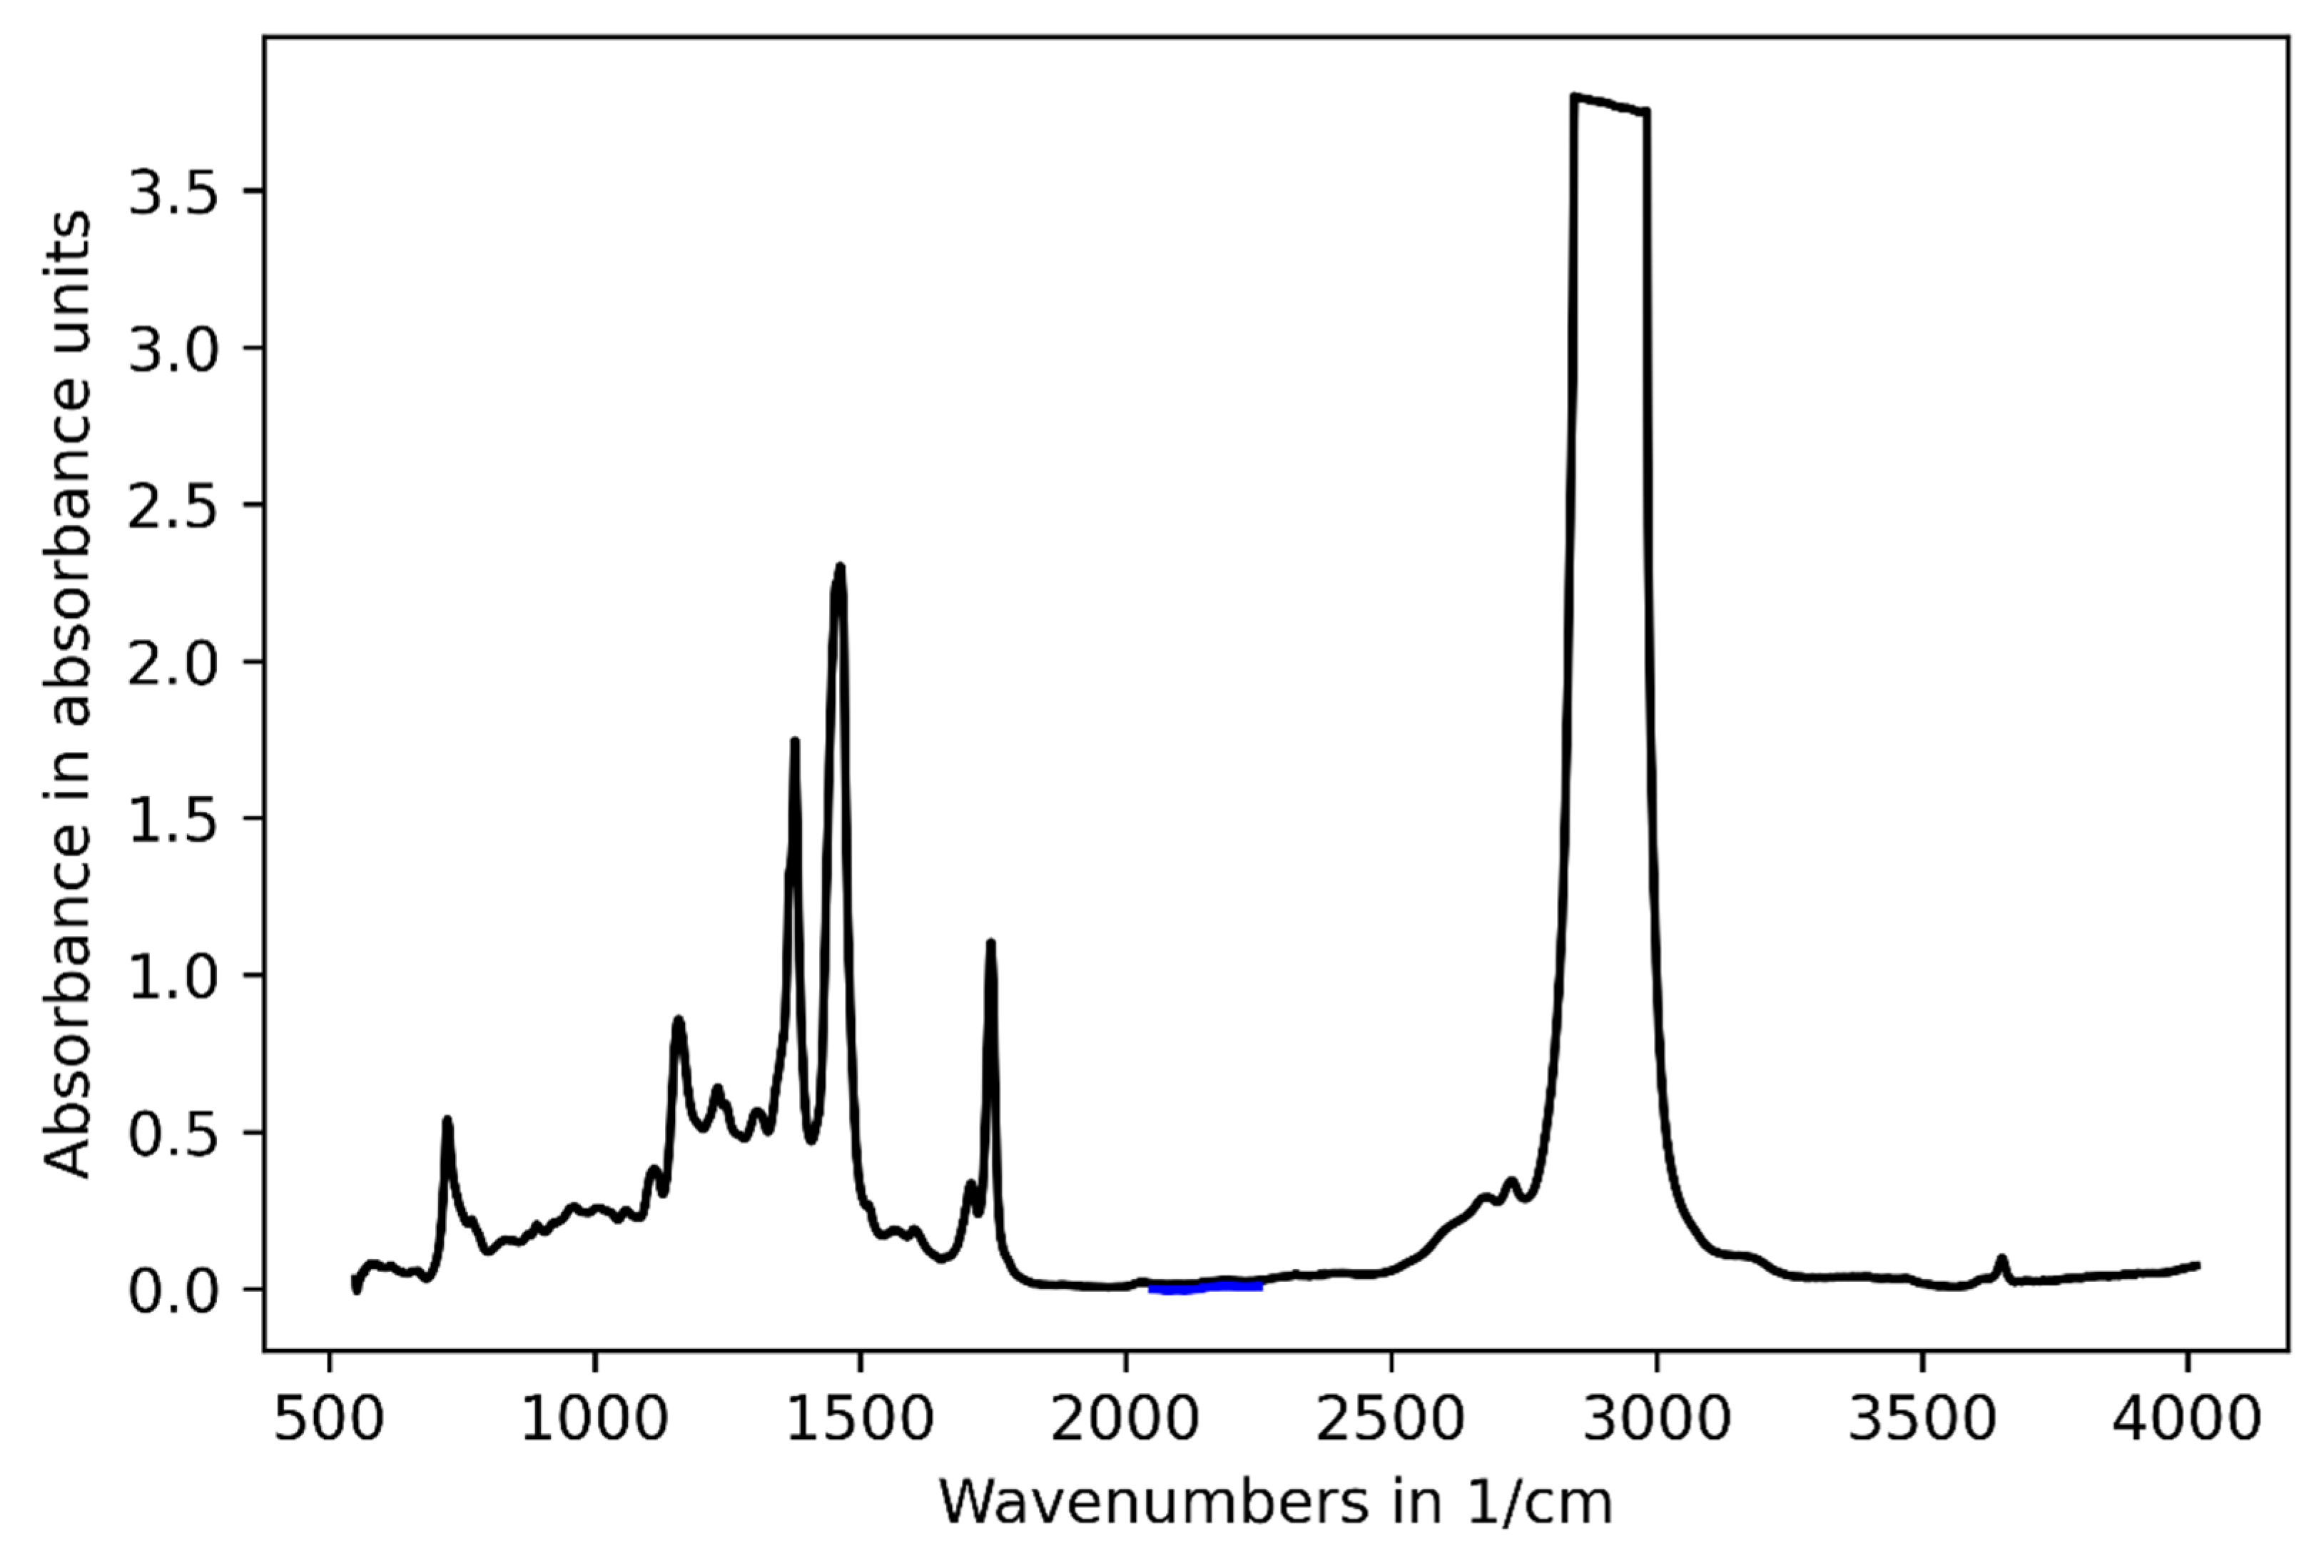
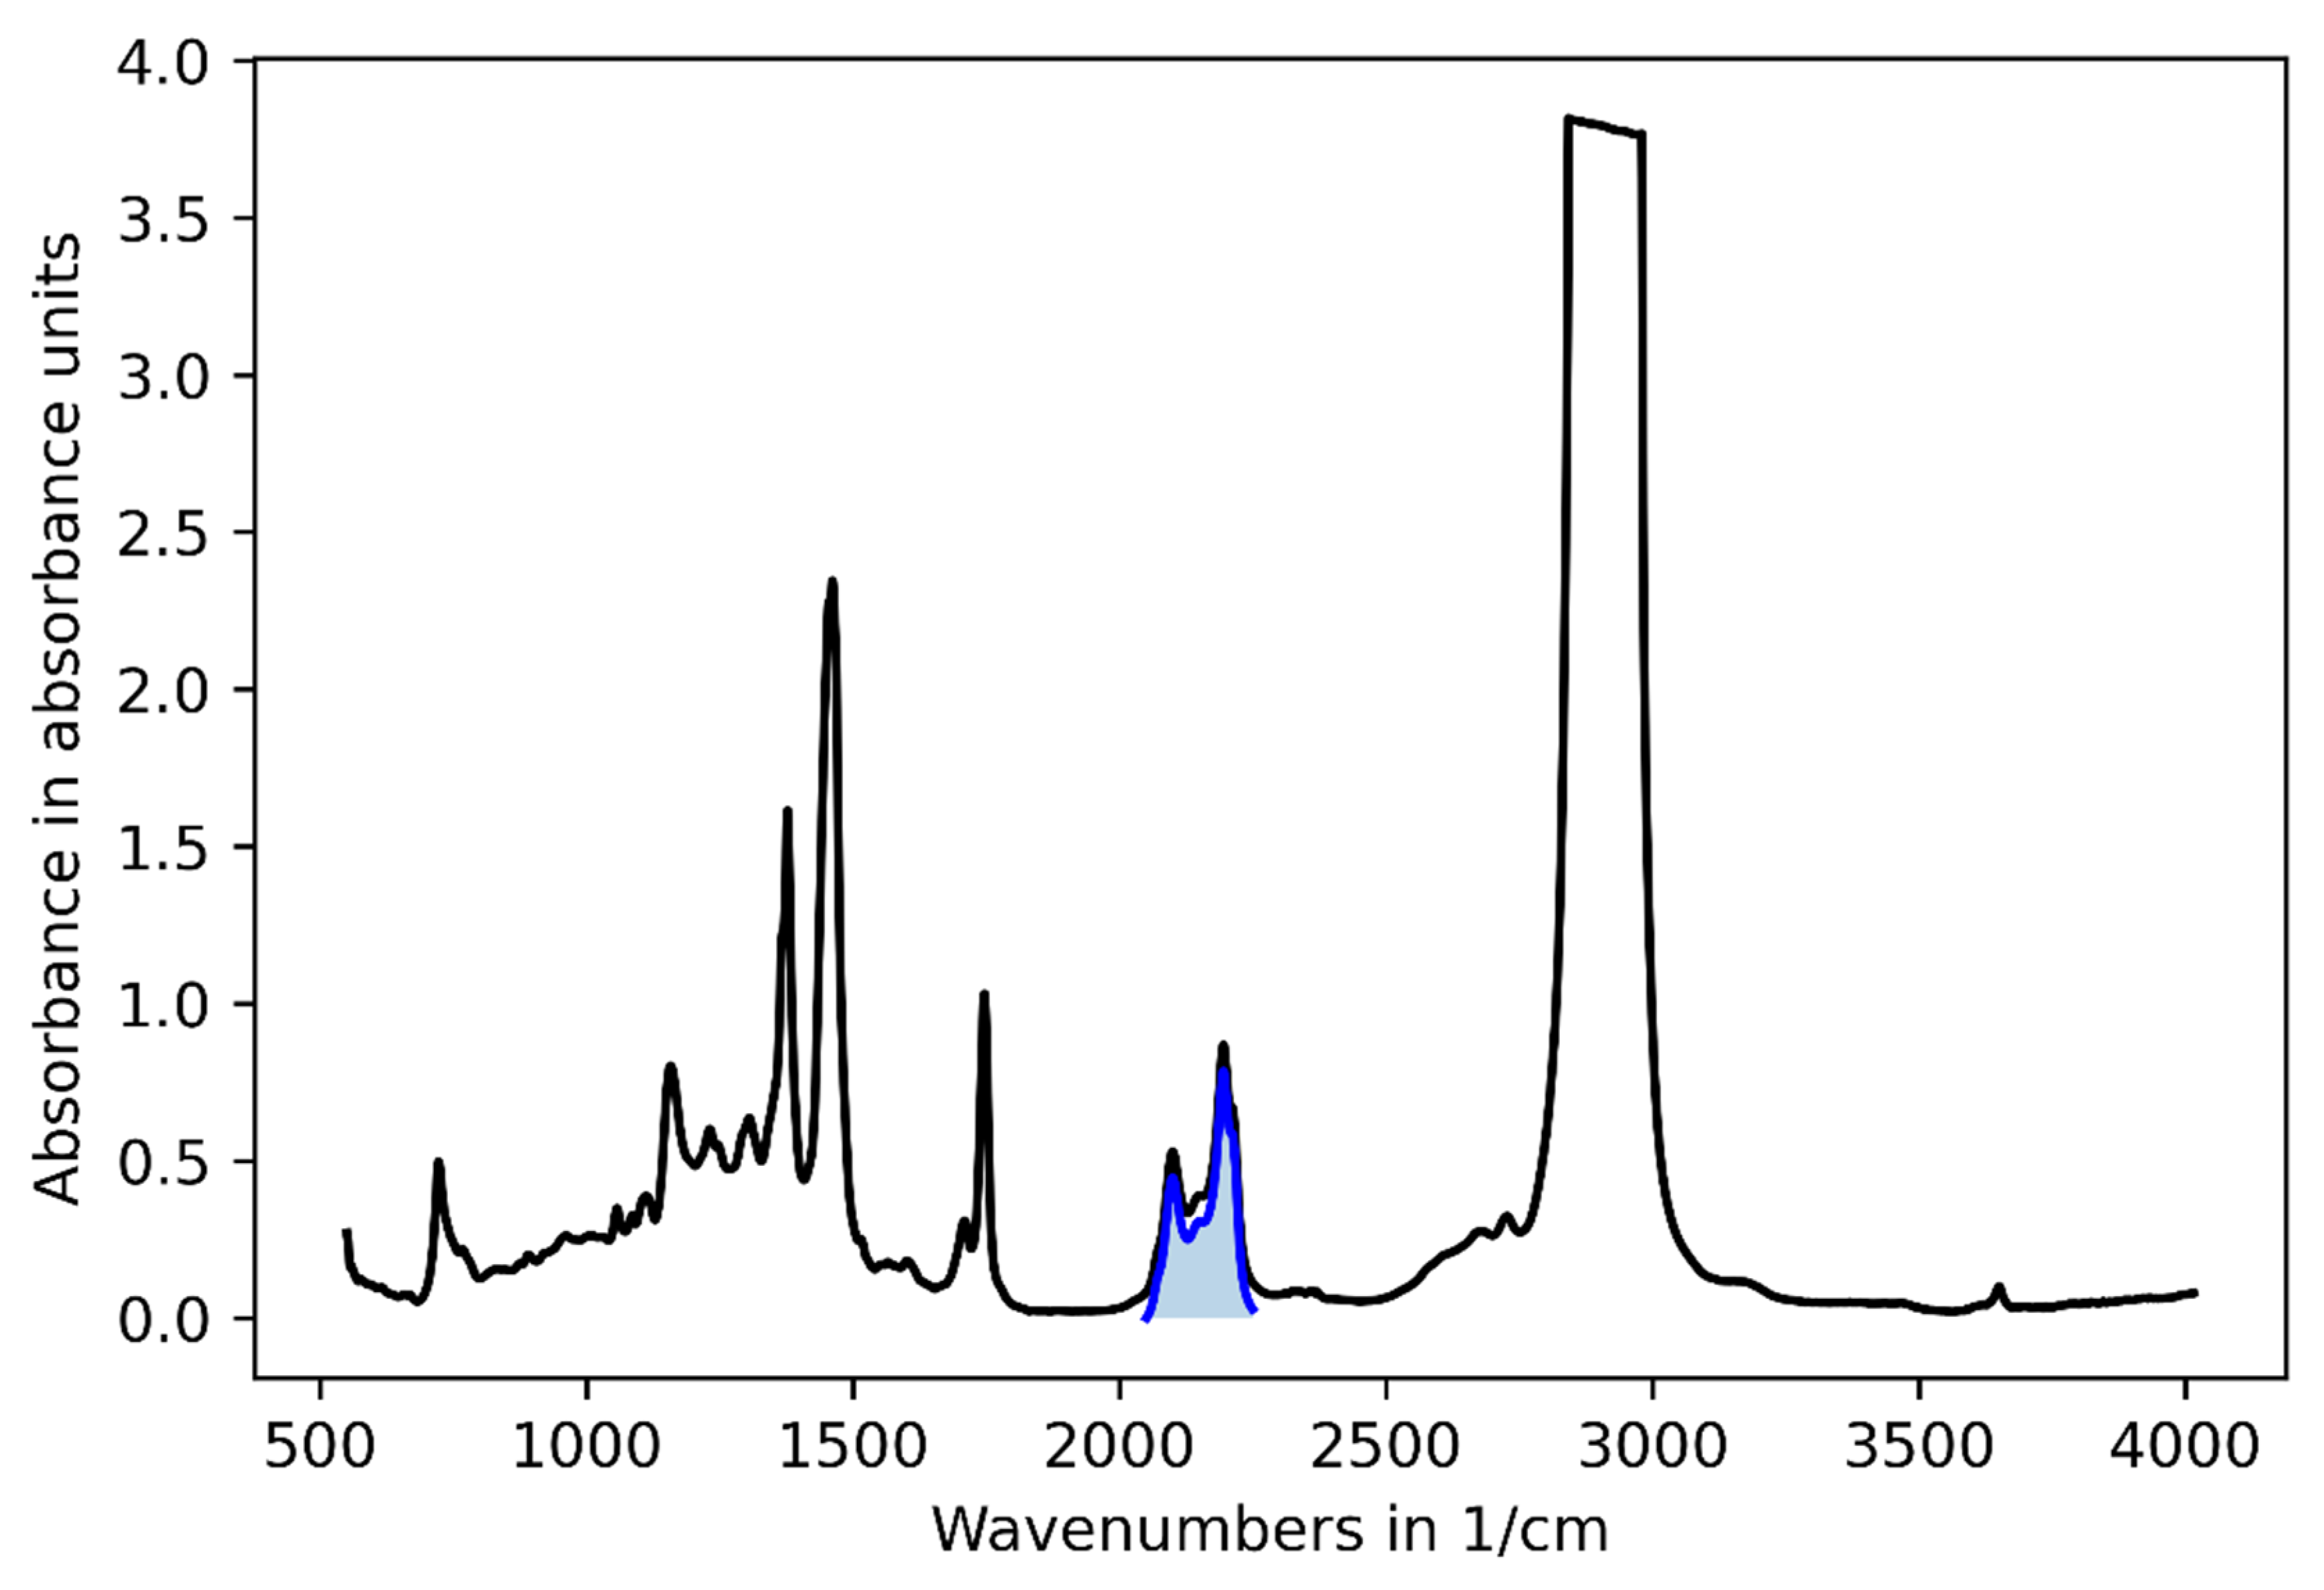
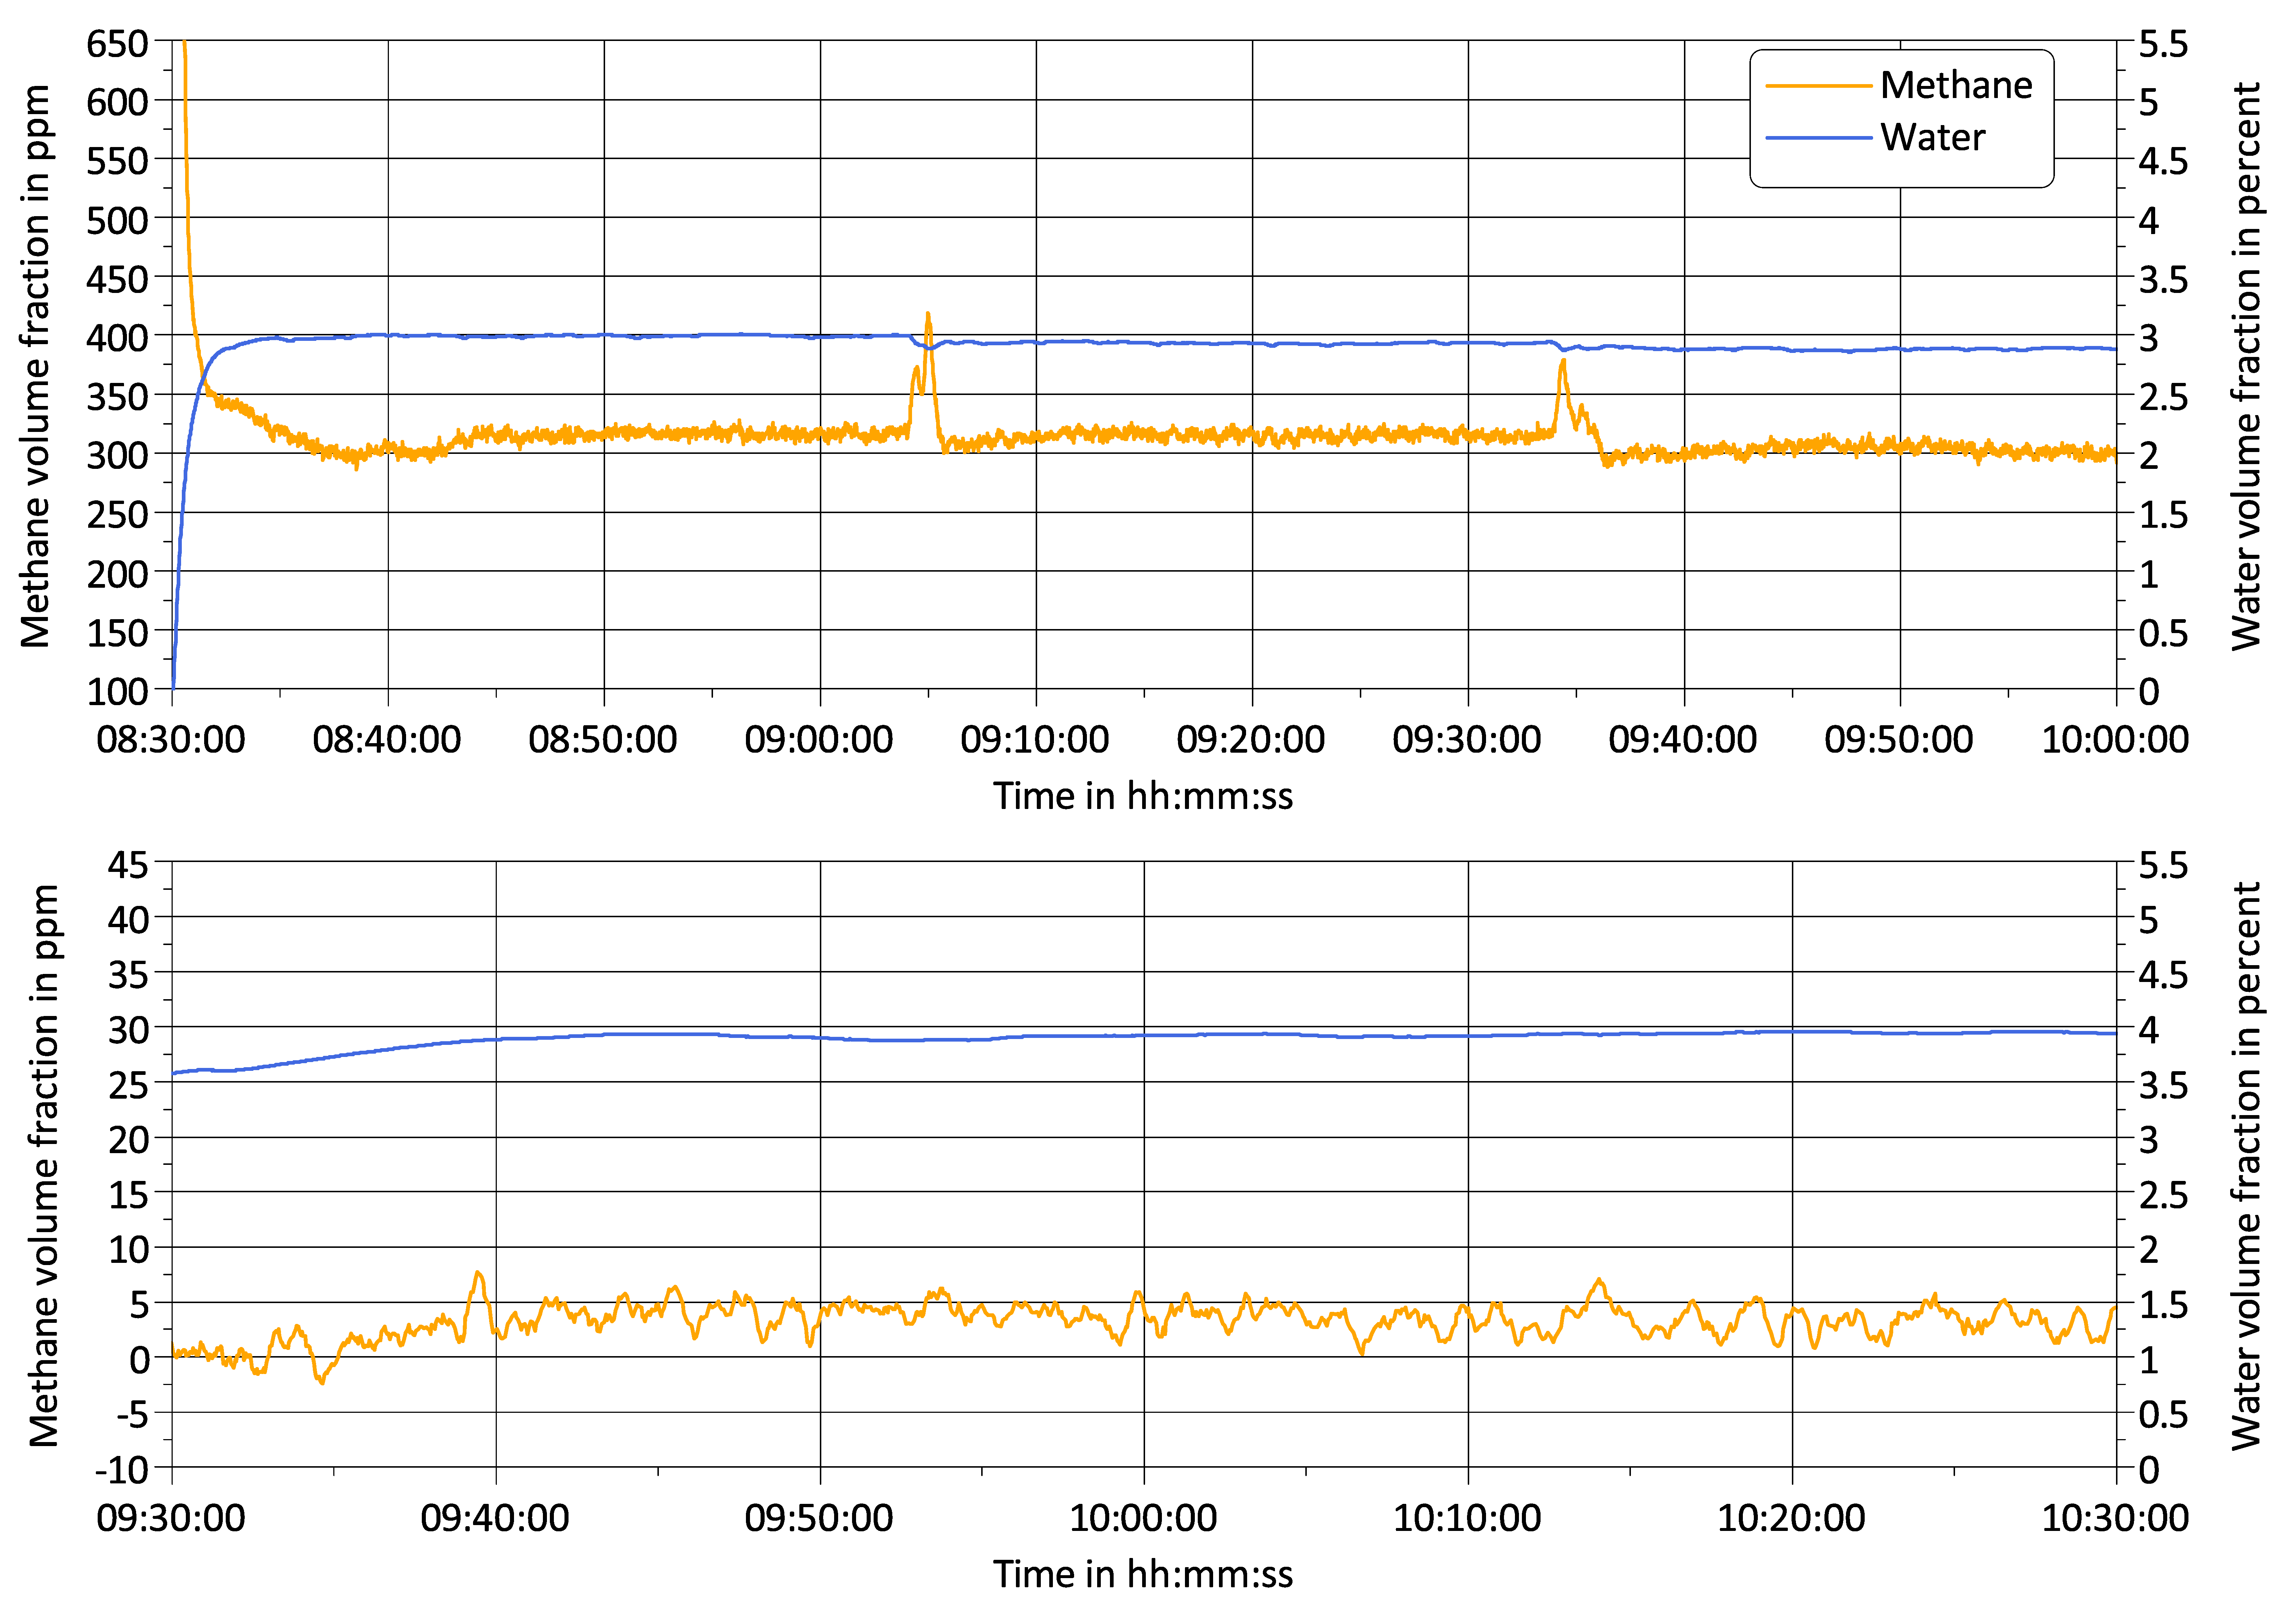
3.2. Challenge 2: Signal Bias by Unburned Methane

Cross-sensitivities towards oxygen, carbon dioxide and nitrogen, such as described in [15,16] have been investigated in earlier publications. It turned out, that the effects on the calculated LOC are almost negligible and a mathematical correction is feasible, even though the parameters for respective corrections seem to differ between literature sources and experimental investigations.
As described in [17], methane (CH4) can as well interfere with the water isotope spectra and bias the measurement of the 1H/2H-ratio. Therefore, the isotopic water vapor analyzer has a built-in algorithm correcting for this effect. According to [17], the deviation should be linear; however, the CH4 measurement of the analyzer is being calibrated for 2 ppm CH4 in dry air. As in the exhaust gas of the engine, a volume share of around 1000 to 2000 ppm of unburned CH4 is expected; the built-in correcting algorithm might not work properly.
As described in [18], the reactivity of platinum for the conversion of methane is low compared to other materials such as palladium or rhodium. Therefore, the platinum catalyst used for diesel and gasoline fuels needed to be exchanged for palladium. Figure 6 the CH4 concentration measured by the analyzer using a platinum (Pt) or a palladium (Pd) catalyst. Due to the dilution of the exhaust gas with dry air, the CH4 volume fraction in the sample gas is already much lower than in the raw engine exhaust gas (around 300 ppm instead of 1500 ppm); however, this still leads to a significant bias of the 1H/2H signal of the analyzer.
As palladium is very sensitive to poisoning by sulfur or phosphorus coming from the engine oil or fuel, the reactivity might decrease after some time. In the course of the experiment (50 engine operating hours), however, the catalyst did not seem to be deteriorating. According to [18], rhodium as a catalyst would be less sensitive to poisoning; however, the reactivity with methane is slightly lower. At temperatures of 500 °C total oxidation of methane can be reached with both palladium and rhodium. In terms of cost, palladium still is a more economical option than rhodium, even if it has to be exchanged more often. As described in [18], platinum reaches a maximum conversion efficiency of 35%, even at 500 °C. As for all catalysts, the temperature is a crucial parameter for reactivity; the catalytic converter is (pre)-heated to 450 °C. This temperature was limited by the catalytic material itself minus the temperature increase due to the energy released during the conversion of methane.
Additionally, the dilution with dry air increases the reactivity by both increasing the share of excess oxygen and lowering the humidity of the exhaust gas. Further information on the catalytic materials and correlations with humidity and temperature is [19] highly recommended.

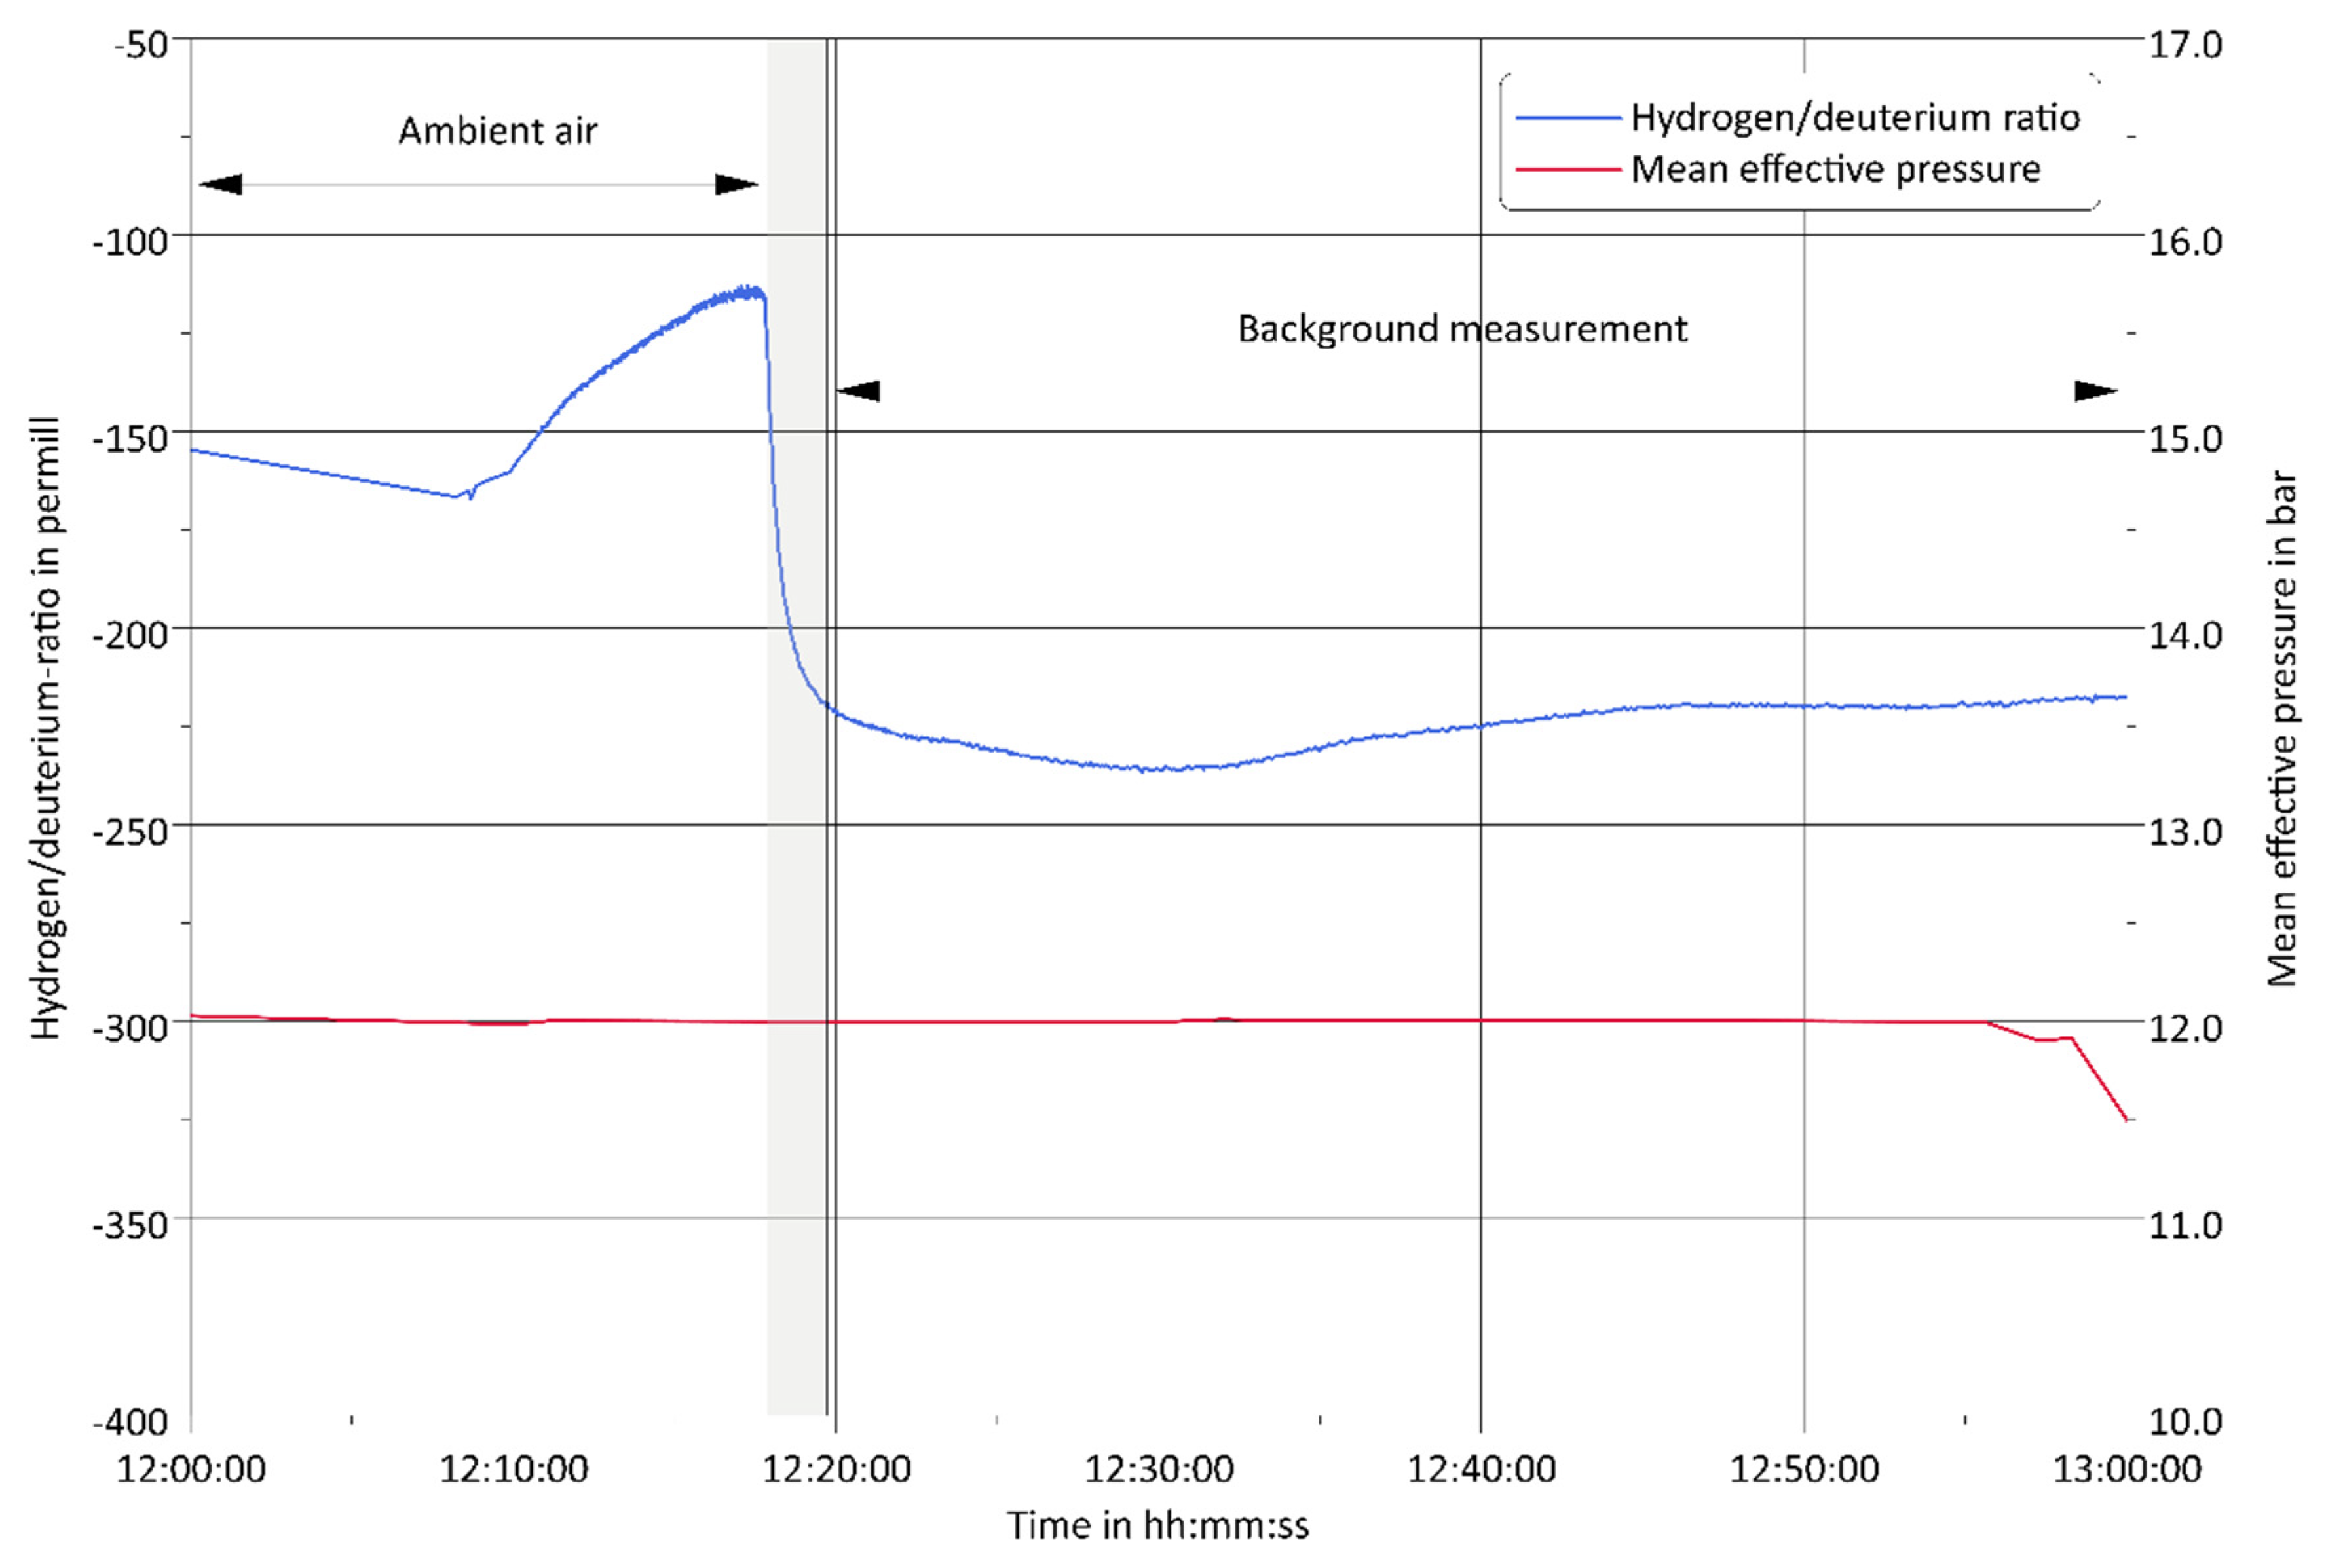
3.3. Challenge 3: Background Fluctuations

As deuterium (2H) is a stable, non-radioactive isotope, it is abundant in every compound containing hydrogen. Even though its natural abundance of 0.0156 at% is very low compared to the other stable hydrogen isotope protium (1H) with 99.98 at%, its occurrence in fuel and in the humidity of the ambient air has to be taken into account when calculating the lubricating oil consumption. The abundance in ambient air can be easily measured with the installed water isotope analyzer by just disconnecting it from the exhaust gas sample line. However, the procedure for fuels is more complicated. Liquid fuels can only be measured with the help of isotope-ratio mass spectrometry (IRMS) or 1H-NMR. For liquid fuels, the deuterium concentration is assumed to be equal to the natural abundance.
However, for gaseous fuels—especially methane—the actual source has an impact on the respective deuterium abundance. According to Figure 7 ([20]), the isotopic hydrogen ratio (delta2H, or δ2H) may fluctuate in a range from roughly −100‰ to −400‰ (the isotopic ratio of hydrogen is usually compared to the Vienna Standard Mean Ocean Water, which is defined to be 0‰). A negative ratio characterizes a deuterium-depleted sample compared to ocean water.
For the city of Graz, where the present experiments have been carried out, energy suppliers obtain the natural gas from the Baumgarten gas hub. The gas itself is a mix of various fossil natural gas sources, mainly from Russia and Ukraine, and a certain proportion of Austrian natural gas and purified biogas. The latter, in particular, naturally has very light isotope contents. The proportions are not constant over time but are recorded by the energy supplier. The gas itself is temporarily stored in underground reservoirs with a total capacity of about 92 TW (conversion 11.5 kWh/Nm3), so it can be assumed that the temporal changes in isotopic composition are relatively stable over the course of one day. In the longer term, the isotopic composition is probably already subject to certain fluctuations. However, there are records at Gas Connect Austria about temporal changes of the share of the different sources.
For an accurate online oil consumption measurement, this means that the composition of the intake gas mixture has to be monitored in certain intervals. The investigation of these background fluctuations will be a topic of further research in order to find out about the maximum length of monitoring intervals. With the current setup, continuous monitoring of the background during engine operation is not possible without additional effort, as the catalyst is designed for volume fractions of roughly 0–4000 ppm of methane. If this fraction exceeds a certain value (e.g., when sampling the inlet gas/air mixture), the temperature generated at the catalyst due to the reaction enthalpy will exceed 500 °C, which could harm the catalyst.
Potential solutions might be an intermittent measurement of the inlet concentration by increasing the air-fuel ratio in order to reach methane volume fractions of 1500 ppm or by using a tube furnace instead of the catalyst, which could enable continuous monitoring throughout the engine operation. However, two downsides come along with using a tube furnace. First, the sample gas flow must be low, in order to reach a high catalytic efficiency, which would imply long measurement cycle times. Second, in the past, it has turned out that a tube furnace is not robust enough to permanently withstand the rough conditions on an engine test bench (temperature changes, vibrations, etc.). Therefore, for the presented prototype, a pellet-type catalyst has been installed.
For the measurement campaign described in this paper, background measurements have been carried out only once before the start of the actual measurement, as depicted in Figure 8. In this case, the hydrogen/deuterium-ratio was first measured at ambient air. Then, the sample line was connected to the engine inlet in order to measure the isotopic signature of the air/fuel mixture. This was done using a tube furnace instead of the catalytic reactor to prevent damage to the reactor. During the test, the engine was operated at a constant load and speed.
The isotopic ratio in the background of the intake air/fuel mixture consists of two compounds: the humidity in the intake air, which, during those experiments, was set to only 0.1 g/kg, thus, has a very low influence on this value. Therefore, the 1H/2H-ratio is mainly driven by the water coming from the combustion of natural gas. The average 1H/2H-ratio in the background (mainly natural gas) was found to be −225‰, meaning the used natural gas is deuterium depleted, increasing the selectivity of the oil consumption measurement.
In addition to the preparatory measurements described above, the measurement program included the recording of several load curves to check the reproducibility of the method. The results of the deuterium method were compared to the SO2-method, which is based on the use of sulfur as a tracer. The sum of collected measurement data is depicted in Figure 9. Both diagrams depict the mean effective pressure on the abscissa. On the ordinate, the lower diagram shows the lubricating oil consumption (LOC), whereas the upper diagram shows the LOC divided by the engine power, the so-called brake specific lube oil consumption.
At a qualitative level, both measurement methods show very similar trends. The quantitative deviation of the average values is as well satisfactory in most of the operating points. However, both methods show fluctuations to a certain extent. The coefficient of variation is much higher for the SO2 method. This is mainly caused by fluctuations of total sulfur in the natural gas due to the odorization processes of the gas supplier. In combination with the use of a low-sulfur oil (total sulfur 2300 ppm), low fluctuations in the intake mixture and SO2-measurement in the exhaust gas led to large deviations in the LOC measurement. For the SO2 method, sulfur concentrations in the lubricating oil of more than 5000 ppm are required to achieve satisfactory measurement accuracy. However, the measurement uncertainty of the total sulfur analysis for fuel and oil is generally a major challenge in the application of this method.
Although the signal from the deuterium method can also be distorted by background fluctuations, their effect on the LOC measurement does not appear to be that great. The theoretical measurement accuracy of the experimental setup, calculated by Gaussian error propagation of the measurement of all mass flows and their respective deuterium concentration, was found to lie in a range between 0.01 g/kWh and 0.03 g/kWh depending on the operating point.
Two major improvements could be made to the deuterium method with little effort. First, more tracer can be added to the engine oil, further increasing the selectivity and accuracy of the method. Second, the isotope pattern of the aspirated gas-air mixture could be monitored more regularly to avoid the signal being distorted by the origin of the gas.
At this point, for the sake of completeness, results from passenger car engine (PCE) tests shall be displayed. In previous experiments, engine characteristic maps of passenger car engines have been recorded using the same method [3]. In order to compare both results, a load curve has been cut out from the engine characteristic map, as depicted in Figure 10. As seen before, the bullets represent actual measurement points, whereas the line represents average values.
According to literature, but also to past experiments at the facilities at the LEC, the brake-specific lubricating oil consumption should follow the shape of a bathtub-curve, when depicted in relation to the mean effective pressure. This shape can be seen for both the large engine as well as for the passenger car engine, though it seems to be more pronounced for the PCE. This study strongly emphasizes the usefulness of the variable “brake specific oil consumption”, as the reference to engine power allows a comparison of different engine types, regardless of size or fuel used. For both engines, the brake-specific lube oil consumption (BSLOC) lies within a range of roughly 0.1 to 0.3 g/kWh.

4. Summary and Conclusions

The lubricating oil consumption of an internal combustion engine is one of the main topics of engine research and development. Not only life cycle costs but also emissions are two major concerns addressed by optimizing LOC. Since the level and variance of LOC in modern engines are very low, the development of an accurate and sensitive method for LOC measurement is crucial for further optimization. Since test bench capacities are severely limited, not only accuracy but also online capability and independence from fuel and combustion design are two important requirements.
This publication describes the application of a newly developed LOC measurement method on a large single-cylinder gas engine. The method described is based on the use of the stable isotope deuterium as a tracer. This tracer is introduced by a two-step hydrogen-deuterium exchange reaction with a synthetic base oil, which is subsequently mixed into the engine oil.
Important physical properties of the lubricating oil, such as viscosity, remain largely unaffected even after the addition of 10% tracer to the oil. The measurements of the physical properties of the oil, the monitoring of the oil quality, and the regular analysis of the tracer concentration in the oil were carried out with the portable infrared spectrometer ERASPEC OIL, which was kindly provided by the company eralytics GmbH. For this purpose, a new method was developed and calibrated with 1H-NMR spectroscopy.
For the LOC measurement on the engine test bench, a prototype device with an isotope water vapor analyzer was designed and implemented on the test bench. The analyzer is able to determine the hydrogen/deuterium ratio in the water vapor of the engine exhaust. With the help of this measurement and knowledge of the deuterium concentrations in the oil and in the air/fuel mixture entering the engine, the lubricating oil consumption can be calculated. Other important components such as a catalytic converter, an exhaust gas drying unit and a temperature conditioning unit are important to meet the analyzer’s sample gas requirements.
The actual measurement campaign was carried out on a test bench equipped with a large single-cylinder natural gas engine.
Three challenges arose during the test campaign. First, the amount of tracer required for large engines, or rather engines with a large engine oil volume, is naturally greater than for a passenger car engine. This challenge was solved with a 5-litre pressure reactor and a two-step process that recycles the deuterium source heavy water. The second challenge, specific to large engines, was to adapt the LOC measurement device’s catalytic reactor. Since the isotope analyzer’s deuterium signal is distorted by methane, any methane slip from the engine must be avoided. Therefore, the catalyst material was changed from platinum to palladium, resulting in a methane conversion efficiency of about 99.6%. Future tests will investigate the chemical degradation and lifetime of the catalyst due to sulfur and phosphorus from the exhaust gas. The third challenge in the tests described is fluctuations in the deuterium background signal. Since deuterium is a stable isotope, it is naturally abundant in the moisture of the intake air, but also in the hydrocarbons of the fuel used. In the case of natural gas, the origin of the gas has been shown to have a strong influence on the isotopic signature. Therefore, the background signal may vary over time. In the present tests, it was assumed that the daily variations of the deuterium concentration in natural gas are negligible. In future tests, the amplitudes and period duration of any fluctuations and their influence on the measurement result should be investigated in more detail.
Despite these fluctuations, comparisons with the SO2 method showed very good consistency and reproducibility of the deuterium method.
Future investigations will include the use of hydrogen as a fuel, fluctuations in the deuterium concentration in natural gas and improving the quality of the tracer with regard to engine oil properties.

5. Patents

  • Title: Verfahren zur Bestimmung von Isotopenverhältnissen (Method for determining isotope ratios)
  • Application Number: A 51070/2019
  • Granted: 15/11/2021
  • State: Granted/Registered
  • Applicant: LEC GmbH
  • Representative: Hübscher & Partner Patent Attornys GmbH
  • Inventor: Bernhard Rossegger, Michael Engelmayer

Author Contributions

Conceptualization, B.R.; Methodology, B.R., M.V. and A.L.; Software, B.R.; Validation, B.R. and M.V.; Formal Analysis, B.R. and M.V.; Investigation, B.R. and M.V.; Resources, B.R. and M.V.; Data Curation, B.R. and M.V.; Writing—Original Draft Preparation, B.R.; Writing—Review & Editing, A.L. and M.V.; Visualization, B.R.; Supervision, M.E.; Project Administration, A.W.; Funding Acquisition, M.E. and A.W. All authors have read and agreed to the published version of the manuscript.

Funding

The publication of this article was supported by TU Graz Open Access Publishing Fund. This research was funded by the Austrian Federal Ministry for Transport, Innovation and Technology (BMVIT), the Austrian Federal Ministry for Digital and Economic Affairs (BMDW) and the Provinces of Styria, Tyrol and Vienna: ‘COMET-Competence Centres for Excellent Technologies’ Programme: K1-Centre LEC EvoLET. The COMET Programme is managed by the Austrian Research Promotion Agency (FFG). Project partners: ‘Kristl, Seibt und Co. GmbH’, ‘Forschungsgesellschaft für Verbrennungskraftmaschinen und Thermodynamik mbH’ and the ‘Institute of Internal Combustion Engines and Thermodynamics’ of the Graz University for Technology. Open Access Funding by the Graz University of Technology.

Data Availability Statement

No new data were created or analyzed in this study. Data sharing is not applicable to this article.

Acknowledgments

The authors would like to acknowledge eralytics GmbH (Vienna, Austria) for their support in terms of installation, handling and for the generous provision of the ERASPEC OIL portable FTIR device. In addition, the authors would like to express special thanks to Rolf Breinbauer from the Institute of Organic Chemistry and Albrecht Leis from JR AquaConSol GmbH for sharing their comprehensive knowledge and laboratory equipment. At this point, we would also like to thank the publication fund of Graz University of Technology for taking over the APC. The authors would like to acknowledge the financial support of the “COMET-Competence Centres for Excellent Technologies” Programme of the Austrian Federal Ministry for Transport, Innovation and Technology (BMVIT), the Austrian Federal Ministry for Digital and Economic Affairs (BMDW) and the Provinces of Styria, Tyrol and Vienna for the K1-Centre LEC EvoLET. The COMET Programme is managed by the Austrian Research Promotion Agency (FFG). The authors would like to express their sincere thanks to our project partners, “Kristl, Seibt und Co. GmbH”, “Forschungsgesellschaft für Verbrennungskraftmaschinen und Thermodynamik mbH” and the “Institute of Internal Combustion Engines and Thermodynamics” of the Graz University for Technology.

Conflicts of Interest

The authors declare no conflict of interest.

Abbreviations

% (w/w)Weight-percent
1HProtium
2HDeuterium
BSLOCBrake specific lube oil consumption
CH4Methane
CRDSCavity ring-down spectroscopy
delta2H or δ2HHydrogen isotopic ratio
FTIRFourier transform infrared spectroscopy
IRInfrared
IRMSIsotope ratio mass spectroscopy
H2ODihydrogen oxide/water
LOCLubricating oil consumption
NMRNuclear magnetic resonance
PCEPassenger car engine
PdPalladium
ppmParts per million
PtPlatinum
RhRhodium
SCESingle-cylinder engine
SCRSelective catalytic reaction
SO2Sulfur dioxide
TANTotal acid number
TBNTotal base number
TBOTime between overhaul

References

  1. Schweizer, T.; Zöbinger, N.; Eder, M.; Schießl, R. Initial Pre-Ignition; FVV: Frankfurt, Germany, 2021. [Google Scholar]
  2. Rossegger, B.; Engelmayer, M. Verfahren zum Bestimmen des Ölverbrauchs von Maschinen. Austria Patent A 50410/2018, 15 May 2018. [Google Scholar]
  3. Rossegger, B.; Eder, M.; Vareka, M.; Engelmayer, M.; Wimmer, A. A novel method for lubrication oil consumption measurement for tribological assessments of internal combustion engines. Tribol. Int. 2021, 162, 107141. [Google Scholar] [CrossRef]
  4. Rossegger, B.; Schneider, M.; Leis, A.; Engelmayer, M.; Wimmer, A. New Approaches to Lube Oil Consumption Measurement Based on the Tracer Method; SAE Technical Paper: Graz, Austria, 2019. [Google Scholar] [CrossRef]
  5. Evans, R. A Tritium-Tracer Technique for the Measurement of Oil Consumption in Gasoline and Diesel Engines. Int. J. Appl. Radiat. Isot. 1973, 24, 19–27. [Google Scholar] [CrossRef]
  6. Robota, J.; Plückers, T.; Delvigne, O. Courtois, Oil Emission Measurement for a Holistic Estimation of Oil Consumption; ATZ extra; Springer Fachmedien Wiesbaden GmbH: Wiesbaden, Germany, 2015. [Google Scholar]
  7. Zellbeck, H.; Roethig, J.; Seibold, J.; Zeuner, A. A method for measuring oil consumption by labelling with radioactive bromine. Tribotest 2006, 6, 251–265. [Google Scholar] [CrossRef]
  8. Lee, P.; Majkowksi, R.; Schreck, R. Method for Determining Fuel and Engine Oil Consumption Using Tunable Diode Laser Spectroscopy. U.S. Patent 4,990,780, 5 February 1991. [Google Scholar]
  9. Rossegger, C.; Schubert-Zallinger, A. Wimmer, Lube Oil Consumption Measurement on Internal Combustion Engines. In Proceedings of the STLE Annual Meeting, Atlanta, Georgia, 21–25 May 2017. [Google Scholar]
  10. Sellmeier, S.; Alonso, E.; Boesl, U. Dynamic Oil Consumption Measurement of Internal Combustion Engines Using Laser Spectroscopy; Analytical Chemistry: Garching, Germany, 2013. [Google Scholar]
  11. V&F Analyse. Messtechnik GmbH, IMR-MS—How It Works; Technical Description: Absam, Austria, 2013. [Google Scholar]
  12. Buttini, P.; Manni, M. Emissions of Deuterated Tracers from Oil in Light and Heavy Duty Diesel Engine. In SAE Transactions; Section 4: Journal of Fuels and Lubricants; SAE International: Warrendale, PA, USA, 2001; Volume 110, pp. 1748–1756. [Google Scholar]
  13. Atkinson, J.G.; Luke, M.O. Deuterated Lubricating Oils. U.S. Patent No. US3746634A, 17 July 1973. [Google Scholar]
  14. Satller, A. Hydrogen/Deuterium (H/D) Exchange Catalysis in Alkanes, Corporate Strategic Research, ExxonMobil Research & Engineering Company; ACS Catalysis: Annandale, NJ, USA, 2018; Volume 8, pp. 2296–2312. [Google Scholar]
  15. Gralher, B.; Herbstritt, B.; Weiler, M.; Wassenaar, L.I.; Stumpp, C. Correcting Laser-Based Water Stable Isotope Reading Biased by Carrier Gas Changes. Environ. Sci. Technol. 2016, 50, 7074–7081. [Google Scholar] [CrossRef] [PubMed]
  16. Johnson, J.; Rella, C. Effects of Variation in Background Mixing Ratios of N2, O2, and Ar on the Measurement of D18-H2O and D2H-H2O Values by Cavity Ring-Down Spectroscopy; Department of Ecology and Evolutionary Biology, University of Arizone, Atmospheric Measurement Techniques: Tucson, AZ, USA, 2017. [Google Scholar]
  17. Hendry, M.; Richman, B.; Wassenaar, L. Correcting for Methane Interferences on δ2H and δ18O Measurements in Pore Water Using H2O(liquid)–H2O(vapor) Equilibration Laser Spectroscopy. Anal. Chem. 2011, 83, 5789–5796. [Google Scholar] [CrossRef] [PubMed]
  18. Boukha, Z.; de Rivas, B.; Gonzalez-Velasco, J.; Gutierrez-Ortiz, J.; Lopez-Fonseca, R. Comparative Study of the Efficiency of Different Noble Metals. Materials 2021, 14, 3612. [Google Scholar] [CrossRef] [PubMed]
  19. Treschnitzer, K.; Lux, S.; Schulze, K. Bewertung von Reaktormodellen zur Mathematischen Beschreibung des Katalytischen Abbaus von Organischen Kohlenwasserstoffverbindungen in Industriellen Rauchgasreinigungsanlagen; Graz University of Technology, Chemische Thermische Prozesstechnik GmbH: Graz, Austria, 2014. [Google Scholar]
  20. Sherwood, S.; Schwietzke, V.; Arling, G. Etiope, Global Inventory of Gas Geochemistry Data from Fossil Fuel, Microbial, and Burning Sources, version 2017. Earth Syst. Sci. Data 2017, 9, 639–656. Available online: https://essd.copernicus.org/articles/9/639/2017 (accessed on 3 December 2020). [CrossRef] [Green Version]
Figure 1. (a) The measurement device; (b) the respective flow schematic.
Lubricants 10 00040 g001
Figure 2. The eralytics ERASPEC OIL portable FTIR.
Lubricants 10 00040 g002
Figure 3. Complete IR spectrum of engine oil without tracer added (black) including the selected area for the determination of the deuterium concentration (blue).
Lubricants 10 00040 g003
Figure 4. Complete IR spectrum of engine oil with tracer added (black) including the selected area for the determination of the deuterium concentration (blue).
Lubricants 10 00040 g004
Figure 5. Linear correlation between 2H concentration and area in the IR spectrum (blue dots: measurement points, red line: regression line).
Lubricants 10 00040 g005
Figure 6. Methane in sample gas using a platinum (Pt) catalyst (upper) and a palladium (Pd) catalyst (lower).
Lubricants 10 00040 g006
Figure 7. Hydrogen/carbon Isotopic ratios of methane depending on its origin [20].
Lubricants 10 00040 g007
Figure 8. Background measurements. The gray area shows the switching phase between ambient air and background measurements.
Lubricants 10 00040 g008
Figure 9. Lube oil consumption load curves were measured with the deuterium and SO2-method. The dots show the actual measurement points, whereas the lines represent average values. The red color represents the SO2 method, blue the Deuterium method.
Lubricants 10 00040 g009
Figure 10. LOC load curve from the passenger car engine. As seen before, the bullets represent actual measurement points, whereas the line represents average values.
Lubricants 10 00040 g010
Table 1. Different approaches towards lubricating oil consumption measurement on engines.
TracerMajor AdvantageMajor DownsideSource
Tritium (T; 3H) tracerUnique substance in the systemCost, effort, radioactive[5]
Germanium (69Ge)High sensitivityGamma emitter[6]
Bromine (82Br)Precisely detectableShort half-life, radioactive[7]
Halogens (X)Precisely detectableCorrosive[8]
Alkaline Earth Metals (AEMs)Present in oil/additives by natureNot detectable online[9]
Zinc (Zn)Present in oil/additives by natureAdsorption/memory effects[10]
Sulfur (S or SO2)Precisely detectableInsufficient lower detection limit and selectivity[11]
Pyrene (C16H10)Oil-like physicochemical propertiesDecomposes during combustion[10]
Deuterated polyaromatic hydrocarbonsDetectable onlineCost, low accuracy[12]
Publisher’s Note: MDPI stays neutral with regard to jurisdictional claims in published maps and institutional affiliations.

