Article

History-Dependent Stress Relaxation of Liquids under High-Confinement: A Molecular Dynamics Study

Department of Materials Science and Engineering, Saarland University, 66123 Saarbrücken, Germany
Lubricants 2022, 10(2), 15; https://doi.org/10.3390/lubricants10020015
Submission received: 26 October 2021 / Revised: 16 December 2021 / Accepted: 17 January 2022 / Published: 19 January 2022
(This article belongs to the Special Issue Advances in Friction Modifiers and Liquid Confinement)

Abstract

:
When liquids are confined into a nanometer-scale slit, the induced layering-like film structure allows the liquid to sustain non-isotropic stresses and thus be load-bearing. Such anisotropic characteristics of liquid under confinement arise naturally from the liquids’ wavenumber dependent compressibility, which does not need solidification to take place as a prerequisite. In other words, liquids under confinement can still retain fluidity with molecules being (sub-)diffusive. However, the extensively prolonged structural relaxation times can cause hysteresis of stress relaxation of confined molecules in response to the motions of confining walls and thereby rendering the quasi-static stress tensors history-dependent. In this work, by means of molecular dynamics, stress tensors of a highly confined key base-oil component, i.e., 1-decene trimer, are calculated after its relaxation from being compressed and decompressed. A maximum of 77.1 MPa normal stress discrepancy has been detected within a triple-layer boundary film. Analyses with respect to molecular morphology indicate that among the effects (e.g., confinement, molecular structure, and film density) that can potentially affect confined stresses, the ordering status of the confined molecules plays a predominant role.

1. Introduction

Liquid under confinement, as a subject, has been studied extensively in diverse fields, such as tribology and lubrication, porous media and biomembranes, and electrochemistry, over the past several decades [1,2,3,4]. When liquids are confined into a nanometer-scale slit, they often exhibit layered structures [5,6], significantly enhanced shear viscosities [7,8,9], and oscillatory solvation forces while being continuously compressed [5,10,11]. Those characteristics, deviating from the bulk, are typically due to perturbation (i.e., the presence of confining surfaces) induced molecular ordering, which is inherently a natural consequence of liquid wavenumber dependent compressibility [12,13]. In the framework of a density-functional theory-based description [12,13,14,15], one may discern that the one-particle density of a confined liquid holds a similar functional form as that of the two-particle density of a bulk liquid. Such a similarity has been confirmed by recent simulation works [16,17].
Compared to the Brownian motion of molecules in bulk liquids, as described by the Rouse model [18], the mobility of a liquid under high-confinement (with only a few molecular layers) can be largely impeded. Instead of random walks, motions of confined molecules become collective (known as molecular ordering or orientational correlation), which leads to prolonged structural relaxation times up to several orders of magnitudes [19,20]. In the case of large surface area to film thickness ratio, e.g., when using surface force apparatus (SFA) [21], the confining/shear rate typically, if not significantly, exceeds the inverse structural relaxation time with an increasing discrepancy as the number of confined monolayers decreases. Effective shear viscosity ( η eff ) increases correspondingly given such an inverse dependence on the relaxation time ( τ relax ), i.e., η eff τ relax 1 , beyond which liquid flow obeys Newton’s law. Reversible phase transformation can take place when a liquid is close to a liquid–solid or liquid–glass transformation [4,22,23,24], for which, however, one should be aware that confinement alone [24] cannot be served as the sole explanation since, for example, the effects of thermodynamic anomalies are omitted [25]. In fact, the behavior of a liquid confined within a finite space shall be affected by a series of cross effects including molecular structures and chemical compositions [8,24,26], confining/shear rates [27], the nature of confining walls [8,11,28,29] and dimensions [30], and contaminations [31].
Solidification is not a necessity for a confined liquid to manifest solid-like behavior (e.g., a finite yield point and critical shear stress [32]), particularly when the liquid has complex molecular structures. It has been reported [17,19,33,34] that highly confined liquids can remain fluidity in a quasi-static state, with molecules being sub-diffusive. The heterogeneity of liquids under confinement, in light of the oscillatory film density, allows them to possess non-isotropic stress tensors and thereby to sustain shear and load irrelevant to the surface tension [35]. Our previous work [17], for example, shows that a triple-layer boundary film (made of 1-decene trimer) can sustain normal loads on the order of 100 MPa over sufficiently long times, which requires neither crystallization nor glass transition to occur. Note, merely ‘anisotropy’ cannot guarantee a sustainable load-bearing ability as flow may still occur in response to anisotropic stresses. In fact, for many liquids, such a load-bearing ability builds up rather continuously with a decreasing number of the confined monolayers [5]. Interestingly, we also found that the mobility of confined molecules can rise (against an overall trend) with increasing confinement right after a monolayer molecule is expelled from the central confined region [17]. This observation suggests that, in addition to confinement, confining pressure can matter as well [7]. It also explains why a less dense film is able to endure higher loads than a denser film [34], which is far-fetched to be simply understood as a competition of disorderly statistics of a polymer chain and specific surface-segment interaction.
Drainage dynamics of liquids under confinement stems from the change of confining geometry induced molecular restructuring, which can be history-dependent owing to the prolonged structural relaxation time [27]. As an extension of our previous work [17], the focus herein is to investigate the hysteresis of confined stress tensors after the liquid relaxed from being compressed (from n + 1 to n monolayers) or decompressed (from n 1 to n monolayers) by a blunt tip using molecular dynamics (MD). In the two cases studied, the initial pressure differences between the central confined region and the ambient drive the liquid to flow in opposite directions, of which the aim is to clarify to what extent the stress anisotropy persists and whether the relaxed stresses end up comparable. Connections between the stress status and molecular morphology are established to clarify the origin of confinement-dependent stress discrepancy.

2. Methodology

The simulation model is shown in Figure 1, where the liquid is sandwiched between a blunt ridge and a flat substrate. Here we continue to focus on a branched hydrocarbon, namely 1-decene trimer (C 30 H 62 , a snapshot of a single molecule is shown as the inset of Figure 1), as in our previous work [17] since it is an important base-oil component and less likely to order compared to linear alkanes. Both the tip and the substrate are made of iron with a (100) surface and are atomically flat. Using a flat punch instead of a curved tip simplifies the problem and improves statistics, but it can also lead to a slight increase in the free energy barrier when a monolayer is expelled. From sideways along the x-direction, molecules can be squeezed into (or sucked from) a reservoir with a nominally constant chemical potential [36]. The in-plane dimensions of the substrate and the bottom of the ridge are 20.0 × 5.1 nm 2 and 9.9 × 5.1 nm 2 , respectively. The region underneath the latter is, by default, defined as the ‘central confined region’. There is a total of 450 liquid molecules in the model system, giving rise to an adsorbing liquid film of an approximately six-monolayer thickness in the absence of a counter surface. The substrate and the bottom of the ridge (in mauve) are strongly adhesive to the liquid molecules, whereas other solid walls (in gray) are repulsive with a cutoff of 2 6 σ ( σ is the distance at which the pairwise potential energy is zero). Atoms from the solid walls remain fixed relative to their center-of-mass velocities throughout the simulations provided that deformation of the solids is negligible.
The inter- and intra-molecular interactions of the liquid are described by a united-atom variant—the transferable potentials for a phase equilibria (TraPPE) [37,38] force-field, in which monomers, i.e., CH 3 , CH 2 , and CH, are represented by single interaction sites (pseudo-atoms). This force-field can faithfully reproduce experimentally measured thermophysical properties [17,39] and can significantly lower the computational cost compared to all-atom variants [40,41]. The intra-molecular (bonded) interactions contain harmonic energy expressions for bond stretching, bond angle bending, and torsional motions. Meanwhile, the inter-molecular (non-bonded) interactions are governed by 12–6 Lennard–Jones (LJ) potential with a cutoff of 1.0 nm. Long-range Coulomb interactions are not taken into account because the pseudo-atoms are electronically neutral. The Lorentz–Berthelot (L-B) mixing rules [42,43] are applied for differing atom pairs, including both the liquid–liquid and liquid–solid interactions [44]. Detailed force-field parameters and functional forms can be found in References [37,38,44]. Note, the purpose here is prone to construct a boundary condition to mimic macroscopic observations rather than to accurately simulate iron-hydrocarbon interactions at an interface, otherwise the iron surfaces would have been passivated with oxygen [45].
There are two sets of simulations carried out: (1) compress/decompress the liquid at a constant rate, and (2) relax the liquid at fixed separations. Regarding (1), the displacing rate of the indenter is 0.2 m/s (along z-axis), which is the lowest rate used in our previous work [17]. In the case of decompression runs, unloading of the indenter takes place either right after it reaches the lowest position (at which the separation between the tip and the substrate is ∼0.8 nm) or after halting the indenter for 100 ns. Regarding (2), the liquid is relaxed at a fixed separation d (d = 1.68, 1.48, and 1.38 nm) for a time-span of 105 ns after a compression or a decompression run. At each separation, a boundary film with a total number of n = 3 monolayers persists. The relaxation duration is chosen based on the fact that all the confining stresses reach ostensibly stable (quasi-static) states at the end of the simulation. Results reported in Section 3.1 correspond to (1), while those in Section 3.2, Section 3.3, Section 3.4 and Section 3.5 correspond to (2). In both sets of simulations, periodic boundary conditions are applied in the x y -plane; in the z-direction, atom movements are confined by the solid walls. The system is maintained at 300 K using a Langevin thermostat with a damping time constant of 100 fs. The thermostat is only applied in parallel to the y-component of the velocities of liquid molecules so as not to interfere with the flow dynamics and molecular diffusion. The simulation time-step is 2 fs. Results reported in this work are each averaged over three independent simulations in terms of different seeds. All the simulations are carried out using the open-source code LAMMPS [46].

3. Results and Discussion

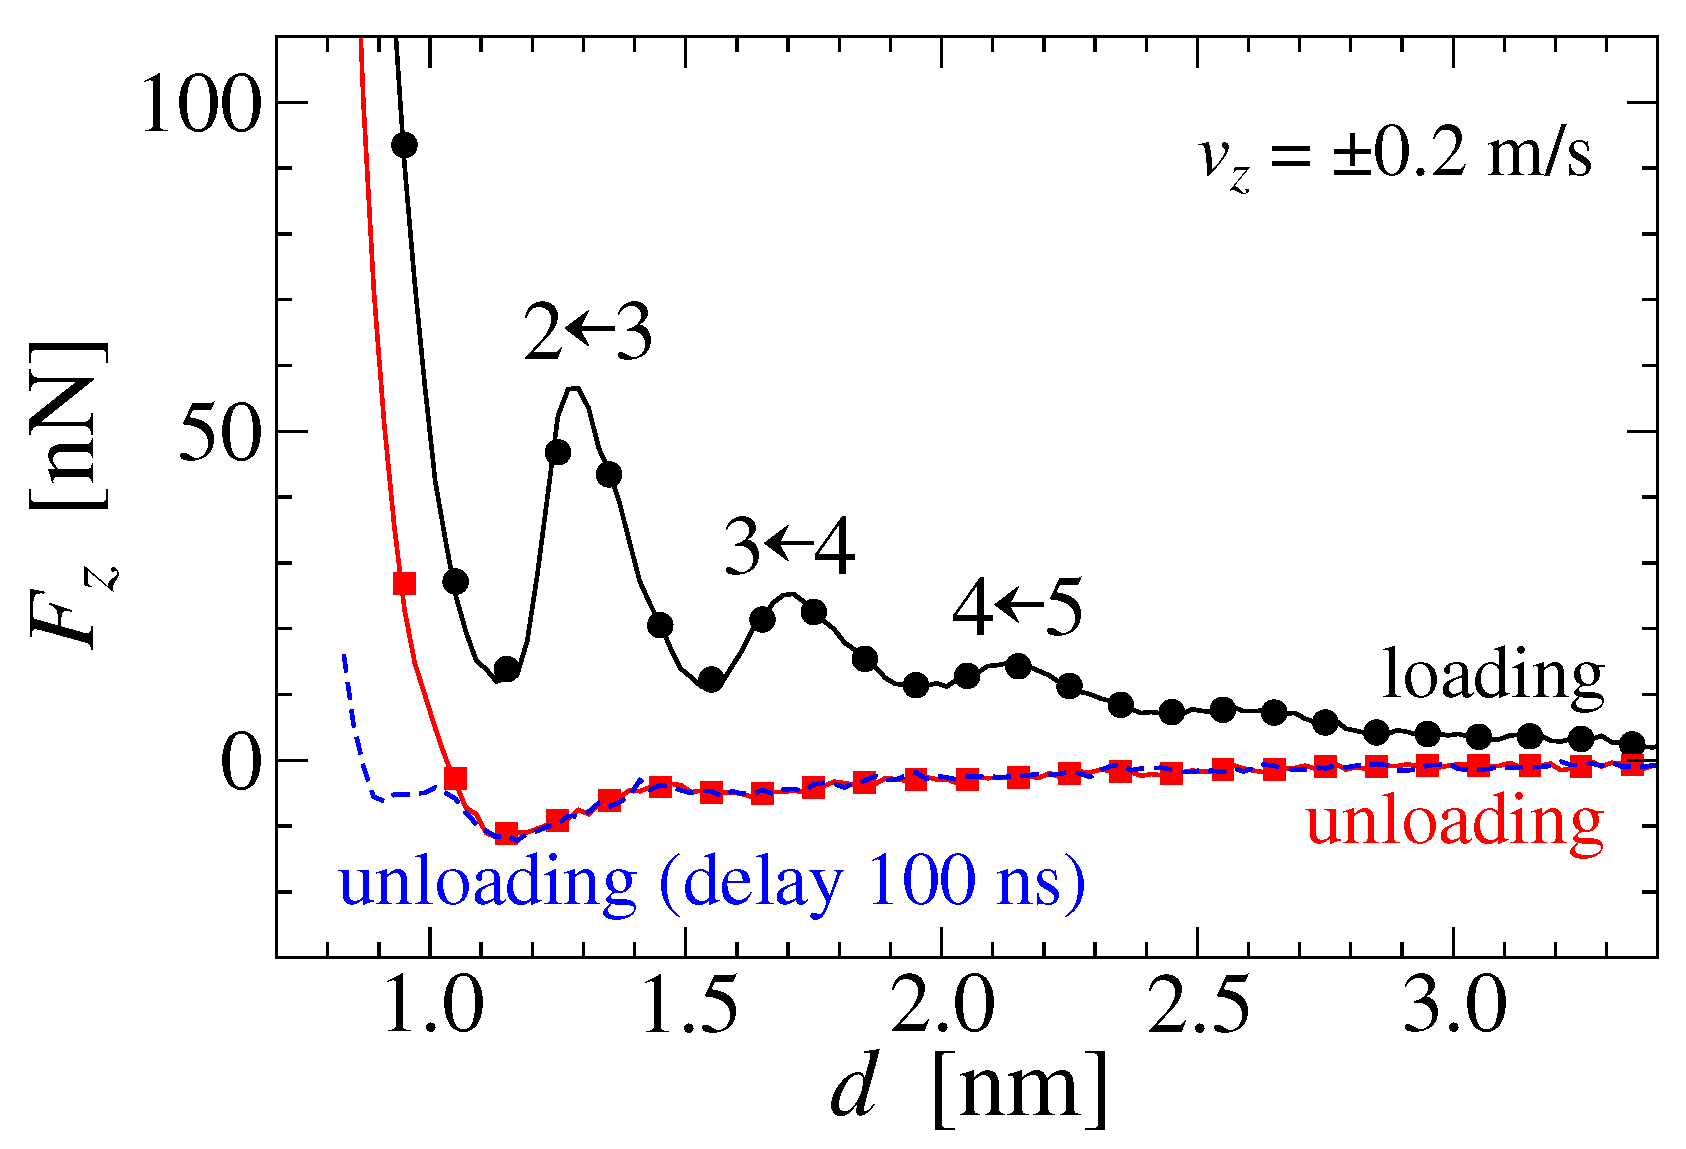
3.1. Solvation Force

Solvation forces ( F z ), measured as the normal forces on the indenter, are shown as functions of wall–wall separations (d) in Figure 2, where results from the two cases appear contrasting. First, forces from prompt decompression (red squares) are predominantly attractive as opposed to the solely repulsive forces during compression (black circles). Given the opposite flow directions and viscous nature of the liquid, this is mainly because the inertia forces from liquid molecules resist tip motion while the molecules are being either squeezed or sucked. Second, undulation, as an indicator of transition of monolayers from ( n ± 1 ) to n, appears only when the molecules are expelled (during compression). Such collective behavior of molecules in response to the external forces, often described as a ‘layer-by-layer’ transition [16,47], is, however, not detected in the case of decompression even after the system is pre-equilibrated for 100 ns before unloading (blue dashed curve). This simply suggests that the current displacing rate (0.2 m/s) is much too fast for molecules to flow and restructure into analogous arrangements within the confining geometry. Also irrelevant to the lowest tip position, discrepancies between the curves in Figure 2 will remain existing as long as the deforming rate surpasses the inverse of the structural relaxation time of molecules confined. In that sense, the transient solvation forces will be dependent on the moving history of the tip.

3.2. Stress Relaxation

To study stress anisotropy and its sustainability, evolution of the stress tensors ( σ ) of liquid at the central confined region is monitored at fixed separations ( d 1 3 ). Using the virial estimator [48], stress tensor components are calculated right after the indenter halted from either a compression or a decompression run with the number of monolayers evolved from n ± 1 to n (n = 3). The virial estimator includes kinetic energy contribution and virial contribution, in which the latter consists of both the intra- and inter-molecular interactions. Although the virial theorem is known to be rigorous for homogeneous systems in thermal equilibrium [49], it predicts, according to our tests, fairly close mean stresses of a multi-layer film as those from the method of planes (MOP) [50]. Furthermore, the normal stresses predicted using the virial estimator agree reasonably well (the errors are less than 5%) with the mechanical definition of the normal pressure: P z = F z / A , where F z denotes the total normal forces on the indenter and A the contact area.
Stress anisotropy, detected on both simple [51] and complex [17] molecules, can be attributed to the heterogeneity of liquids under confinement. Compared to being compressed (as demonstrated in our previous work [17]), the anisotropic characteristics of the liquid after decompression appear less pronounced due to the lack of molecular ordering (discuss next). Figure 3 shows a comparison of normal stresses ( σ z z ) evolution after compression (solid symbols) and decompression (open symbols) runs, where stresses from each pair of cases first rapidly approach each other from the opposite ends, then gradually evolve into nominally stable states after approximately 50 ns. Notably, the discrepancy between the quasi-static pair stresses (at ∼100 ns) rises from trivial to somewhat significant as the confining gap decreases. Specifically, according to the fitting curves, the stress differences read 6.1, 28.6, and 77.1 MPa for the gaps of d 1 , d 2 , and d 3 , respectively. Those discrepancies, as one can imagine, would slowly decay with time until finally disappearing once the corresponding structural relaxation times are exceeded, provided that fluidity is remained within the confined zone [17]. However, the corresponding time-span can easily extend beyond the typical time-scale of MD [8], which is assuredly out of the scope of the current study. Nevertheless, before reaching such a threshold, the ability of a confined liquid to sustain non-isotropic stresses persists and ought to be dependent on both the confinement and the moving history of the tip.

3.3. Radius of Gyration

The aforementioned quasi-static history dependence of stress tensors and earlier claimed stress anisotropy [17] are inherently determined by the detailed confined molecular arrangement, which is not readily accessible by the experimental techniques. To elaborate such correlations, the radius of gyration ( R g ) of central confined molecules is calculated based on time-dependent MD configurations via R α α 2 = 1 N mol i = 1 N mol 1 N mon j = 1 N mon δ r α i , j · δ r α i , j . In these calculations, only molecules located within the mid-monolayer are taken into consideration for reasons to exclude boundary effects from the confining walls. In the expression, α denotes Cartesian coordinates, δ r is the relative position between monomer j and the center-of-mass of molecule i it belongs to, N mol and N mon are the total numbers of embraced molecules and monomers in every single molecule, respectively, and angle brackets denote an ensemble average. The principle moments of R g 2 at d 1 3 during the last 25 ns of relaxation are shown in Figure 4.
Within the confining space, liquid molecules are highly deformed and parallel to the confining walls, as opposed to those in a bulk phase of which the three principle components of R g 2 are comparable ( R α α 2 10.8 Å 2 for 1-decene trimer) [17]. As shown in Figure 4, the in-plane components ( R x x 2 and R y y 2 ) are at least two-fold as that in the normal direction ( R z z 2 ), indicating a sheet-like film structure that complements the observed oscillatory density profile. In the case of compression, the extension of molecules along the flow direction (x-axis) appears more sensitive to the confinement change given a rapidly increased pressure gap between the initial and the final states (see Figure 3). High pressure inducing a strong tendency to flow can ease molecular alignment along the streaming direction and thereby yield stretched molecular appearances. In contrast, the bottleneck effect, particularly at high confinement, would hamper the traveling of disordered molecules from an open space into a narrow channel (decompression case), resulting in a relatively low film density in the central void (discuss next). Under low confining pressure, the inert response of molecular conformation to the confinement change suggests that a much longer time is required for molecules to replenish the central void and become orderly arranged thereafter. This explains why there is no sign of collective behavior (e.g., undulations on the solvation force curve) in the course of continuous decompression, as shown in Figure 2.

3.4. Mean-Squared Displacement

Diffusion of central confined molecules at d 1 3 is characterized via measuring the in-plane mean-squared displacement (MSD) of monomers in the mid-confined-layer: MSD = 1 N mol i = 1 N mol 1 N mon j = 1 N mon | r i , j ( t ) r i , j ( t 0 ) | 2 , where r i , j ( t ) is the position of the j-th monomer from the i-th molecule at time t ( t t 0 = 80 ns). A comparison of the results between compression and decompression runs is shown in Figure 5. For all the cases studied, the confined liquid remains fluidity with molecules being sub-diffusive given that the smallest mean displacement (∼4 Å) of monomers over a 25 ns time window exceeds the typical diffusion rates of polymers adsorbed on solid surfaces [52] as well as atoms within crystalline structures, even those located along the high-diffusivity paths (dislocations, grain boundaries, and free surfaces) [53]. Clearly, at a given separation, molecules relaxed from decompression are more diffusive compared to those after compression, particularly evident in the case of high-confinement (see the blue curves in Figure 5). It is the discrepancies between film densities and thereby between molecular morphologies that render the mobility of confined molecules history-dependent. It ought to clarify that higher molecular mobility in the central confined region does not necessarily refer to an easier incoming flow at the entrance of the confined channel (i.e., the edges of the tip) but the opposite instead. Moreover, as pointed out in our previous work [17], diffusivity of confined molecules may not necessarily hold a monotonic function of confinement given the fact that it is the confining pressure that plays an essential role. Hereby, this claim is partially endorsed by the results shown in Figure 5, where molecules at a higher confinement (blue dashed curve) can be more diffusive than those at a lower confinement (red curves for example). Note, at d 3 , neither of the cases are in equilibrium states (at least the one from decompression is apparently not); otherwise, the two curves will be comparable with molecules presumably being less diffusive compared to those at d 2 . However, after relaxing the system for an additional 100 ns, diffusion of molecules at d 3 (from decompression) remains momentarily higher than those at d 2 .

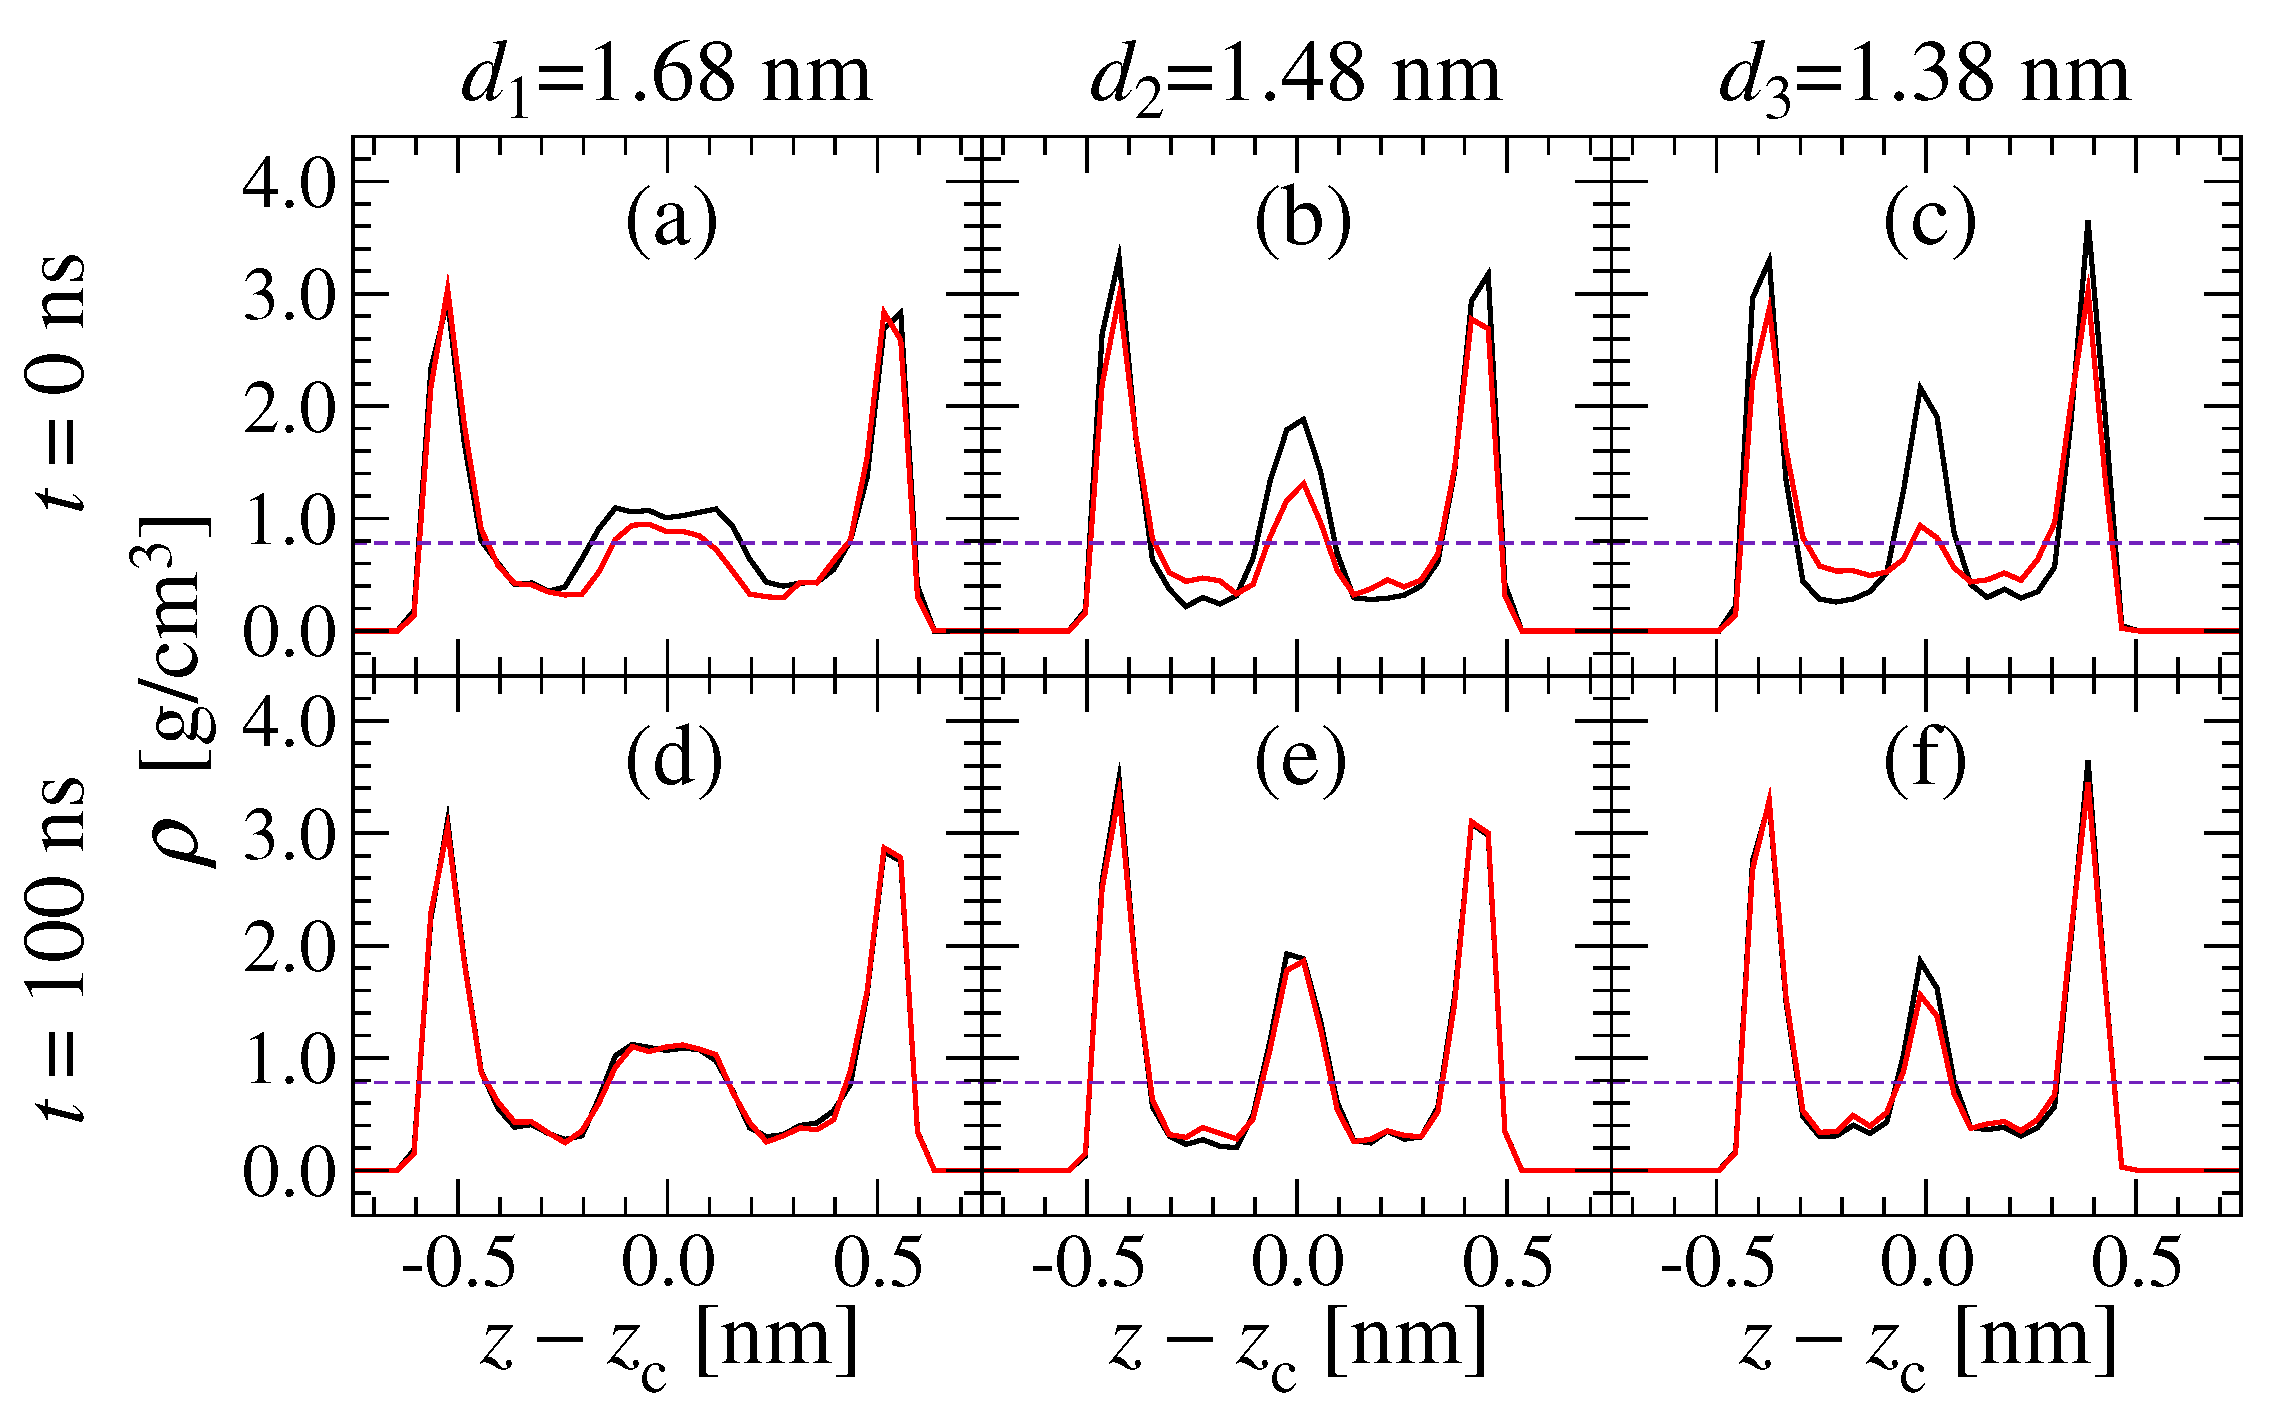
3.5. Density Profile

Figure 6 shows confined liquid density profiles ( ρ ) along the normal direction (z-axis) with a bin size of 0.5 Å. At each separation, three molecular layers, evolved from t = 0 to 100 ns, can be identified (according to the oscillation periods). Evidently, wider wall–wall separation ( d 1 ) inhibits molecular transfer to a lesser degree given the analogous density profiles ending up after 100 ns relaxation (Figure 6d). While, at high confinement ( d 3 ), the notable discrepancy between the density peaks of the mid-layer (Figure 6f) shall be the origin of the aforementioned dissimilarities in molecular morphology and stress tensors at rest. That being said, the lower the density peak, the less pronounced molecular ordering and thereby the lower confining stresses. Note, the correlation between confining stresses and film density is not ubiquitous. As an example, the average film density in the case of d = 1.68 nm at 100 ns (∼0.97 g/cm 3 ) is 24% higher than that of the bulk liquid density (0.78 g/cm 3 ) [17] at ambient conditions, whereas the normal stresses appear attractive (the negative stress at 100 ns reads –27.9 MPa). Essentially, what determines the stress tensors of a liquid confined within a limited space is not merely whether the molecules are densely packed (mean film density) but rather to what extent they are orderly arranged (oscillatory peak height).

4. Conclusions

The heterogeneity of liquids under confinement enables them to sustain non-isotropic stresses that are irrelevant to the surface tension. In this work, stress relaxation of a key base-oil component, 1-decene trimer, under nanoscale confinement was studied by means of molecular dynamics. In terms of a triple-layer boundary film within a fixed slit, a stress discrepancy was identified while the liquid relaxed from tip compression and decompression in nominally quasi-static states. Such a discrepancy, increasing with confinement, stems from the differing ordering status of molecules in the central confined region that is dominated by the confining pressure. Although highly relevant, factors such as confinement and film density are rather extrinsic. The comparably lower normal stresses in the case of decompression can be attributed to the impeded flow of disordered molecules from an open space into a narrow channel, and thus, a much longer time is required for molecules to evolve into an orderly arranged film structure. Such prolonged structural relaxation times can induce hysteresis of molecular restructuring in response to the external forces and thereby yield the stress tensors history-dependent. Findings from this work, along with our previous study [17], may complement the understanding of dynamic and mechanical drainage responses of liquids with non-granular molecular structures under small-scale confinement.

Funding

This research was funded by the German Research Foundation (DFG) grant number GA 3059/2-1.

Acknowledgments

H.G. thanks Martin H. Müser for useful discussions.

Conflicts of Interest

The author declares no conflict of interest.

References

  1. Simon, P.; Gogotsi, Y. Materials for electrochemical capacitors. Nat. Mater. 2008, 7, 845–854. [Google Scholar] [CrossRef] [Green Version]
  2. Hayes, R.; Warr, G.G.; Atkin, R. Structure and Nanostructure in Ionic Liquids. Chem. Rev. 2015, 115, 6357–6426. [Google Scholar] [CrossRef] [Green Version]
  3. Rasaiah, J.C.; Garde, S.; Hummer, G. Water in Nonpolar Confinement: From Nanotubes to Proteins and Beyond. Annu. Rev. Phys. Chem. 2008, 59, 713–740. [Google Scholar] [CrossRef] [Green Version]
  4. Jackson, C.L.; McKenna, G.B. Vitrification and Crystallization of Organic Liquids Confined to Nanoscale Pores. Chem. Mater. 1996, 8, 2128–2137. [Google Scholar] [CrossRef]
  5. Horn, R.G.; Israelachvili, J.N. Direct measurement of structural forces between two surfaces in a nonpolar liquid. J. Chem. Phys. 1981, 75, 1400–1411. [Google Scholar] [CrossRef]
  6. Ballamudi, R.K.; Bitsanis, I.A. Energetically driven liquid–solid transitions in molecularly thin n-octane films. J. Chem. Phys. 1996, 105, 7774–7782. [Google Scholar] [CrossRef]
  7. Van Alsten, J.; Granick, S. Molecular Tribometry of Ultrathin Liquid Films. Phys. Rev. Lett. 1988, 61, 2570–2573. [Google Scholar] [CrossRef]
  8. Granick, S. Motions and Relaxations of Confined Liquids. Science 1991, 253, 1374–1379. [Google Scholar] [CrossRef] [Green Version]
  9. Sivebaek, I.M.; Samoilov, V.N.; Persson, B.N.J. Effective Viscosity of Confined Hydrocarbons. Phys. Rev. Lett. 2012, 108, 036102. [Google Scholar] [CrossRef] [Green Version]
  10. Christenson, H.K. Experimental measurements of solvation forces in nonpolar liquids. J. Chem. Phys. 1983, 78, 6906–6913. [Google Scholar] [CrossRef]
  11. Krass, M.D.; Krämer, G.; Dellwo, U.; Bennewitz, R. Molecular Layering in Nanometer-Confined Lubricants. Tribol. Lett. 2018, 66, 87. [Google Scholar] [CrossRef]
  12. Nygård, K. Local structure and density fluctuations in confined fluids. Curr. Opin. Colloid Interface Sci. 2016, 22, 30–34. [Google Scholar] [CrossRef] [Green Version]
  13. Nygård, K.; Sarman, S.; Hyltegren, K.; Chodankar, S.; Perret, E.; Buitenhuis, J.; van der Veen, J.F.; Kjellander, R. Density Fluctuations of Hard-Sphere Fluids in Narrow Confinement. Phys. Rev. X 2016, 6, 011014. [Google Scholar] [CrossRef] [Green Version]
  14. Fisher, M.E.; Wiodm, B. Decay of Correlations in Linear Systems. J. Chem. Phys. 1969, 50, 3756–3772. [Google Scholar] [CrossRef]
  15. Kjellander, R.; Sarman, S. Pair correlations of non-uniform hard-sphere fluids in narrow slits and the mechanism of oscillatory solvation forces. J. Chem. Soc. Faraday Trans. 1991, 87, 1869–1881. [Google Scholar] [CrossRef]
  16. Krass, M.D.; Gosvami, N.N.; Carpick, R.W.; Müser, M.H.; Bennewitz, R. Dynamic shear force microscopy of viscosity in nanometer-confined hexadecane layers. J. Phys.-Condens. Matter. 2016, 28, 134004. [Google Scholar] [CrossRef]
  17. Gao, H.; Müser, M.H. Why liquids can appear to solidify during squeeze-out–Even when they don’t. J. Colloid Interface Sci. 2020, 562, 273–278. [Google Scholar] [CrossRef]
  18. Rouse, P.E. A Theory of the Linear Viscoelastic Properties of Dilute Solutions of Coiling Polymers. J. Chem. Phys. 1953, 21, 1272–1280. [Google Scholar] [CrossRef]
  19. Hu, H.W.; Carson, G.A.; Granick, S. Relaxation time of confined liquids under shear. Phys. Rev. Lett. 1991, 66, 2758–2761. [Google Scholar] [CrossRef]
  20. Granick, S.; Hu, H.W. Nanorheology of Confined Polymer Melts. 1. Linear Shear Response at Strongly Adsorbing Surfaces. Langmuir 1994, 10, 3857–3866. [Google Scholar] [CrossRef]
  21. Israelachvili, J.N.; Adams, G.E. Measurement of forces between two mica surfaces in aqueous electrolyte solutions in the range 0–100 nm. J. Chem. Soc. Faraday Trans. 1978, 74, 975–1001. [Google Scholar] [CrossRef]
  22. Cui, S.T.; Cummings, P.T.; Cochran, H.D. Molecular simulation of the transition from liquidlike to solidlike behavior in complex fluids confined to nanoscale gaps. J. Chem. Phys. 2001, 114, 7189–7195. [Google Scholar] [CrossRef]
  23. Alba-Simionesco, C.; Coasne, B.; Dosseh, G.; Dudziak, G.; Gubbins, K.E.; Radhakrishnan, R.; Sliwinska-Bartkowiak, M. Effects of confinement on freezing and melting. J. Phys.-Condens. Matter. 2006, 18, R15–R68. [Google Scholar] [CrossRef] [PubMed]
  24. Klein, J.; Kumacheva, E. Confinement-Induced Phase Transitions in Simple Liquids. Science 1995, 269, 816–819. [Google Scholar] [CrossRef]
  25. Kienle, D.F.; Kuhl, T.L. Density and Phase State of a Confined Nonpolar Fluid. Phys. Rev. Lett. 2016, 117, 036101. [Google Scholar] [CrossRef] [Green Version]
  26. Atkin, R.; Warr, G.G. Structure in Confined Room-Temperature Ionic Liquids. J. Phys. Chem. C 2007, 111, 5162–5168. [Google Scholar] [CrossRef]
  27. Bureau, L. Rate Effects on Layering of a Confined Linear Alkane. Phys. Rev. Lett. 2007, 99, 225503. [Google Scholar] [CrossRef] [Green Version]
  28. Müser, M.H.; Robbins, M.O. Conditions for static friction between flat crystalline surfaces. Phys. Rev. B 2000, 61, 2335–2342. [Google Scholar] [CrossRef]
  29. Stevens, M.J.; Mondello, M.; Grest, G.S.; Cui, S.T.; Cochran, H.D.; Cummings, P.T. Comparison of shear flow of hexadecane in a confined geometry and in bulk. J. Chem. Phys. 1997, 106, 7303–7314. [Google Scholar] [CrossRef] [Green Version]
  30. O’Shea, S.J.; Welland, M.E.; Rayment, T. Solvation forces near a graphite surface measured with an atomic force microscope. Appl. Phys. Lett. 1992, 60, 2356–2358. [Google Scholar] [CrossRef]
  31. Heuberger, M.; Zäch, M. Nanofluidics: Structural Forces, Density Anomalies, and the Pivotal Role of Nanoparticles. Langmuir 2003, 19, 1943–1947. [Google Scholar] [CrossRef]
  32. Gee, M.L.; McGuiggan, P.M.; Israelachvili, J.N.; Homola, A.M. Liquid to solidlike transitions of molecularly thin films under shear. J. Chem. Phys. 1990, 93, 1895–1906. [Google Scholar] [CrossRef]
  33. Carson, G.; Hu, H.W.; Granick, S. Molecular Tribology of Fluid Lubrication: Shear Thinning. Tribol. Trans. 1992, 35, 405–410. [Google Scholar] [CrossRef]
  34. Leng, Y.; Cummings, P.T. Hydration structure of water confined between mica surfaces. J. Chem. Phys. 2006, 124, 074711. [Google Scholar] [CrossRef]
  35. Wang, J.C.; Fichthorn, K.A. A method for molecular dynamics simulation of confined fluids. J. Chem. Phys. 2000, 112, 8252–8259. [Google Scholar] [CrossRef]
  36. Wang, Y.; Hill, K.; Harris, J.G. Confined thin films of a linear and branched octane. A comparison of the structure and solvation forces using molecular dynamics simulations. J. Chem. Phys. 1994, 100, 3276–3285. [Google Scholar] [CrossRef]
  37. Martin, M.G.; Siepmann, J.I. Novel Configurational-Bias Monte Carlo Method for Branched Molecules. Transferable Potentials for Phase Equilibria. 2. United-Atom Description of Branched Alkanes. J. Phys. Chem. B 1999, 103, 4508–4517. [Google Scholar] [CrossRef]
  38. Wick, C.D.; Martin, M.G.; Siepmann, J.I. Transferable Potentials for Phase Equilibria. 4. United-Atom Description of Linear and Branched Alkenes and Alkylbenzenes. J. Phys. Chem. B 2000, 104, 8008–8016. [Google Scholar] [CrossRef] [Green Version]
  39. Ewen, J.P.; Gao, H.; Müser, M.H.; Dini, D. Shear heating, flow, and friction of confined molecular fluids at high pressure. Phys. Chem. Chem. Phys. 2019, 21, 5813–5823. [Google Scholar] [CrossRef]
  40. Jorgensen, W.L.; Maxwell, D.S.; Tirado-Rives, J. Development and Testing of the OPLS All-Atom Force Field on Conformational Energetics and Properties of Organic Liquids. J. Am. Chem. Soc. 1996, 118, 11225–11236. [Google Scholar] [CrossRef]
  41. Price, M.L.P.; Ostrovsky, D.; Jorgensen, W.L. Gas-phase and liquid-state properties of esters, nitriles, and nitro compounds with the OPLS-AA force field. J. Comput. Chem. 2001, 22, 1340–1352. [Google Scholar] [CrossRef]
  42. Lorentz, H.A. Ueber die Anwendung des Satzes vom Virial in der kinetischen Theorie der Gase. Ann. Phys. 1881, 248, 127–136. [Google Scholar] [CrossRef] [Green Version]
  43. Berthelot, D. Sur le melange des gaz. Comptes. Rendus. Acad. Sci. 1898, 126, 1703–1855. [Google Scholar]
  44. Savio, D.; Fillot, N.; Vergne, P.; Zaccheddu, M. A Model for Wall Slip Prediction of Confined n-Alkanes: Effect of Wall-Fluid Interaction Versus Fluid Resistance. Tribol. Lett. 2012, 46, 1573–2711. [Google Scholar] [CrossRef]
  45. Gao, H.; Ewen, J.P.; Hartkamp, R.; Müser, M.H.; Dini, D. Scale-Dependent Friction–Coverage Relations and Nonlocal Dissipation in Surfactant Monolayers. Langmuir 2021, 37, 2406–2418. [Google Scholar] [CrossRef]
  46. Plimpton, S. Fast Parallel Algorithms for Short-Range Molecular Dynamics. J. Comput. Phys. 1995, 117, 1–19. [Google Scholar] [CrossRef] [Green Version]
  47. Hoth, J.; Hausen, F.; Müser, M.H.; Bennewitz, R. Force microscopy of layering and friction in an ionic liquid. J. Phys.-Condens. Matter. 2014, 26, 284110. [Google Scholar] [CrossRef]
  48. Tsai, D.H. The virial theorem and stress calculation in molecular dynamics. J. Chem. Phys. 1979, 70, 1375–1382. [Google Scholar] [CrossRef]
  49. Zhou, M. A new look at the atomic level virial stress: On continuum-molecular system equivalence. Proc. R. Soc. London. Ser. A Math. Phys. Eng. Sci. 2003, 459, 2347–2392. [Google Scholar] [CrossRef]
  50. Todd, B.D.; Evans, D.J.; Daivis, P.J. Pressure tensor for inhomogeneous fluids. Phys. Rev. E 1995, 52, 1627–1638. [Google Scholar] [CrossRef]
  51. Hartkamp, R.; Ghosh, A.; Weinhart, T.; Luding, S. A study of the anisotropy of stress in a fluid confined in a nanochannel. J. Chem. Phys. 2012, 137, 044711. [Google Scholar] [CrossRef]
  52. Mukherji, D.; Müser, M.H. Possible explanation of the Λ-shape anomaly in polymer surface diffusion. Phys. Rev. E 2006, 74, 010601. [Google Scholar] [CrossRef]
  53. Shewmon, P. High Diffusivity Paths. In Diffusion in Solids; Springer: Cham, Switzerland, 2016; pp. 189–222. [Google Scholar] [CrossRef]
Figure 1. A perspective view of the model system with a confining gap d = 1.68 nm. Mauve and gray atoms represent adhesive and repulsive iron walls with (100) faces, respectively. Structure of a 1-decene trimer molecule is shown as the inset in the center. During compression/decompression runs, the tip moves at a constant rate of v z = 0.2 m/s while the substrate remains stationary.
Lubricants 10 00015 g001
Figure 2. Solvation forces ( F z ) as functions of wall–wall separations (d) from continuous compression (black) and decompression (red and blue) at a constant rate of 0.2 m/s. The numbers on top of the force maxima from the loading curve indicate transitions of monolayers from n + 1 to n as the confining gap decreases. The blue dashed line shows the results after the system pre-equilibrated for 100 ns before unloading.
Lubricants 10 00015 g002
Figure 3. Evolution of confined liquid normal stresses ( σ z z ) at fixed separations ( d 1 3 ) followed tip compression (filled symbols) and decompression (open symbols). Solid and dashed lines are the corresponding fitting curves. Similar to what has been demonstrated in our previous work [17], the other two principal stresses (i.e., σ x x and σ y y ) are comparable to each other and weakly increase with confinement (not show).
Lubricants 10 00015 g003
Figure 4. Principle components ( R α α 2 ) of the radius of gyration in the (a) x-, (b) y-, and (c) z-direction of molecules in the mid-confined-layer at fixed separations ( d 1 3 ). Each data point represents a mean value averaged over the last 25 ns relaxation with error bars representing the standard deviation. Black circles and red triangles represent the results after compression and decompression runs, respectively.
Lubricants 10 00015 g004
Figure 5. Mean-squared displacement (MSD) of monomers in the mid-confined-layer during the last 25 ns ( t 0 = 80 ns) relaxation at fixed separations. Filled and open symbols represent the results after compression and decompression runs, respectively. Solid and dashed lines are the corresponding fitting curves.The power-law exponents are 0.74, 0.79, 0.79, 0.76, 0.79, and 0.96 for d 1 , 2 , 3 -compression and d 1 , 2 , 3 -decompression, respectively.
Lubricants 10 00015 g005
Figure 6. Confined liquid density profiles ( ρ ) at time t = 0 (ac) and t = 100 ns (df) in the cases of d 1 3 . Black and red curves represent results after compression and decompression, respectively. Dashed lines in indigo denote bulk liquid density at ambient conditions (∼0.78 g/cm 3 ) [17].
Lubricants 10 00015 g006
Publisher’s Note: MDPI stays neutral with regard to jurisdictional claims in published maps and institutional affiliations.

