Article

Effects of Tempering Temperature on Mechanical and Tribological Behavior of Ductile Iron

School of Materials Science and Engineering, Xi’an University of Technology, Xi’an 710048, China
*
Author to whom correspondence should be addressed.
Lubricants 2022, 10(12), 326; https://doi.org/10.3390/lubricants10120326
Submission received: 4 November 2022 / Revised: 20 November 2022 / Accepted: 21 November 2022 / Published: 23 November 2022
(This article belongs to the Special Issue Frictional Behavior and Wear Performance of Cast Irons)

Abstract

:
The mechanical properties and tribological behavior of ductile iron tempered at different temperatures were investigated. The tempered sample was composed of spheroidal graphite, α phase, and carbides. The strength and hardness decreased near-linearly but the plasticity increased with the increase of tempering temperature, which was mainly because carbon atoms precipitated from martensite and thus reduced the distortion of martensite. Wear tests indicated that the friction coefficient of the sample tempered at 420 °C decreased first and then increased with the increasing loads and exhibited the lowest friction coefficient of 0.37. No obvious change was detected for the friction coefficient of the sample tempered at 500 °C at different loads. The friction coefficient of the sample tempered at 580 °C increased to a stable value with the increase of loads. The wear rate of tempered ductile iron was increased with the increase of tempering temperature, which indicated that hardness was the critical factor for wear properties of ductile iron. The main wear mechanisms of tempered ductile iron were adhesive and abrasive wear. Adhesive wear was predominant for the sample tempered at low temperature but was gradually replaced by abrasive wear with the increase of tempering temperature and normal loads.

1. Introduction

Cast iron is used in many industrial applications due to low cost and a superior combination of mechanical and physical properties [1]. In recent years, ductile irons with high strength, good toughness, and superior wear resistance have been obtained by tailoring the matrix microstructure [2,3], which has been attempted to be used as transmission parts to replace forged steels due to the self-lubricant properties of graphite.
As other metal materials, the properties of ductile iron are determined by its microstructure [4]. Because the spheroidal shape of graphite in ductile iron ultimately reduces the negative effects of graphite on mechanical properties, the heat treatment processes of steels are usually applied to tailor the microstructure of ductile iron to improve its mechanical properties [5]. For example, austempered ductile iron (ADI) composed of acicular ferrite and rich-carbon retained austenite with an acceptable mechanical property was developed by referring to the heat treatment process of bainitic steels [6,7]; a microstructure with martensite and carbon-rich retained austenite obtained in ductile iron by quenching and partitioning (Q&P) treatment [8,9]; and a ductile iron with dual matrix structure (DMS) of ferrite and martensite was achieved by applying the heat treatment process of dual-phase steels [10,11]. However, it is worth noting that there are significant differences between steel and ductile iron during the heat treatment process. One is that about 2–3 wt% Si in ductile iron has the ability to delay and suppress the formation of carbides [12,13]. Another is that graphite embedded in the matrix of ductile iron provides enough carbon atoms during heat treatment, which results in the formation of high temperature austenite with high carbon concentration and thus affects phase transformation during cooling. Therefore, even the heat treatment processes similar to steels are adopted to ductile iron, although the microstructure differs [14]. For example, bainitic steels and ADI both consist of acicular bainite and retained austenite, but the carbon concentration in retained austenite differ greatly [15,16,17].
Quenching and tempering is a common heat treatment process for steels [18,19]. Different microstructures and mechanical properties of steels can be obtained through tempering at different temperatures. For instance, tempered martensite could be obtained by tempering at low temperature (150~250 °C) for high carbon steels, which has a high hardness, but the plasticity is very limited [20]. The tempered troostite with balanced mechanical properties could be obtained by tempering at medium temperature (350~500 °C) in medium and high carbon steels [21]. For medium and high carbon steels, a tempered sorbite is produced by tempering at high temperature (500~650 °C), which exhibits a high plasticity, but the strength is not satisfactory [22]. For ductile iron, high-temperature austenite with a carbon concentration higher than 1.5% is easily achieved [9], which results in a severe distortion of martensitic lattice and extremely brittle characteristics after quenching [23]. Therefore, the martensite obtained in ductile iron is tempered to reduce internal stress and improve its ductility for practical applications as transmission parts. The tempering process is critical to achieve an acceptable mechanical performance. Hence, the microstructure and mechanical properties of ductile iron with different tempering processes are investigated in the present study.
The self-lubricating property of ductile iron due to the existence of graphite contributes to the superior wear resistance of ductile iron compared with forged steels [24,25,26]. According to Archard’s law [27], the wear rate of materials is proportional to the friction coefficient on tribosurface and inversely proportional to the hardness of material. For ductile iron, the amounts of graphite on the tribosurface determines the friction coefficient during service [28], which is directly affected by the hardness of ductile iron. Generally, the ductile iron with high hardness is hard to be plastically deformed, which is adverse to the reduction of friction coefficient because graphite embedded in the matrix cannot act as lubricant. Therefore, the coupling effects of hardness and friction coefficient would affect the tribological behavior of ductile iron. It can be inferred that there should exist an appropriate hardness value for ductile iron with the optimal wear resistance. It has been mentioned above that the hardness of ductile iron is sensitive to the tempering temperature [29]. Therefore, the tribological behavior of ductile iron tempered at different temperatures is investigated. The present study can optimize mechanical performance and the wear resistance of ductile iron and give guidelines and improvements for the microstructural design of ductile iron for transmission parts.

2. Materials and Methods

As-cast samples were prepared from outside of the cylindrical ductile iron casting with a diameter of 80 mm fabricated by a horizontal continuous casting process, which is detailed in [30]. The chemical composite of as-cast ductile iron used in the present study was 3.53 wt% C, 2.41 wt% Si, Mn ≤ 0.1 wt%, 0.015 wt% S, 0.022 wt% P, 0.049 wt% Mg, 0.011 wt% RE, and balanced Fe, which was analyzed using a spark optical emission spectrometer. Strips with dimensions of 15 mm × 40 mm × 100 mm were cut from the cast profiles, then the samples were heated to 900 °C and held for 90 min in a vertical furnace. After that, the samples were quenched into oil. Then, the quenched samples were tempered at 420 °C, 500 °C, and 580 °C for 60 min, respectively.
The microstructure of heat-treated samples was examined by OLYMPUS GX71 optical microscope (OM) and JSM-6700F scanning electron microscopy (SEM) with an accelerating voltage of 30 kV after being ground, polished, and etched by 4% nital solution. XRD was carried out on an XRD-7000 diffractometer with a scanning angle from 35° to 85°, and the scanning speed was 4°/min.
Samples were machined into dimension with a cross-section of 4 mm × 2 mm and a gauge length of 20 mm for tensile tests. Tensile tests were conducted at room temperature by a universal testing machine (HT-2402) with a crosshead speed of 1 mm/min. The fracture surface was observed by SEM. Hardness measurement was carried out using HR-150 (Rockwell hardness tester) under the load of 150 kg and holding time of 4 s. At least 6 points were obtained for each condition, and the average values were taken out.
Wear tests were performed on a ball-on-plate machine under dry condition, as shown in Figure 1. A GCr15 steel ball with a diameter of 9.5 mm and hardness higher than 62 HRC was set as the ball, and the tempered ductile iron with a diameter of 30 mm and thickness of 4 mm was set as the plate. The normal loads of 10 N, 15 N, and 20 N were applied, the reciprocating stroke was 5 mm, the sliding velocity was 0.05 m/s, and the total sliding distance was 120 m. To keep repeatability, at least three samples were performed for each wear test. Prior to and after each wear test, the specimens were ultrasonically cleaned with absolute ethanol each for 10 min. The worn surfaces were observed by optical microscopes (OM), scanning electron microscopes (SEM). The wear track profiles of the disc specimens were measured with a surface profilometer, and the computational formula for the wear rate k is:
k = V F · S
where V is the wear volume (mm3), F is the applied load (N), and S is the sliding distance (m).

3. Results and Discussions

3.1. Effects of Tempering Temperature on Microstructure

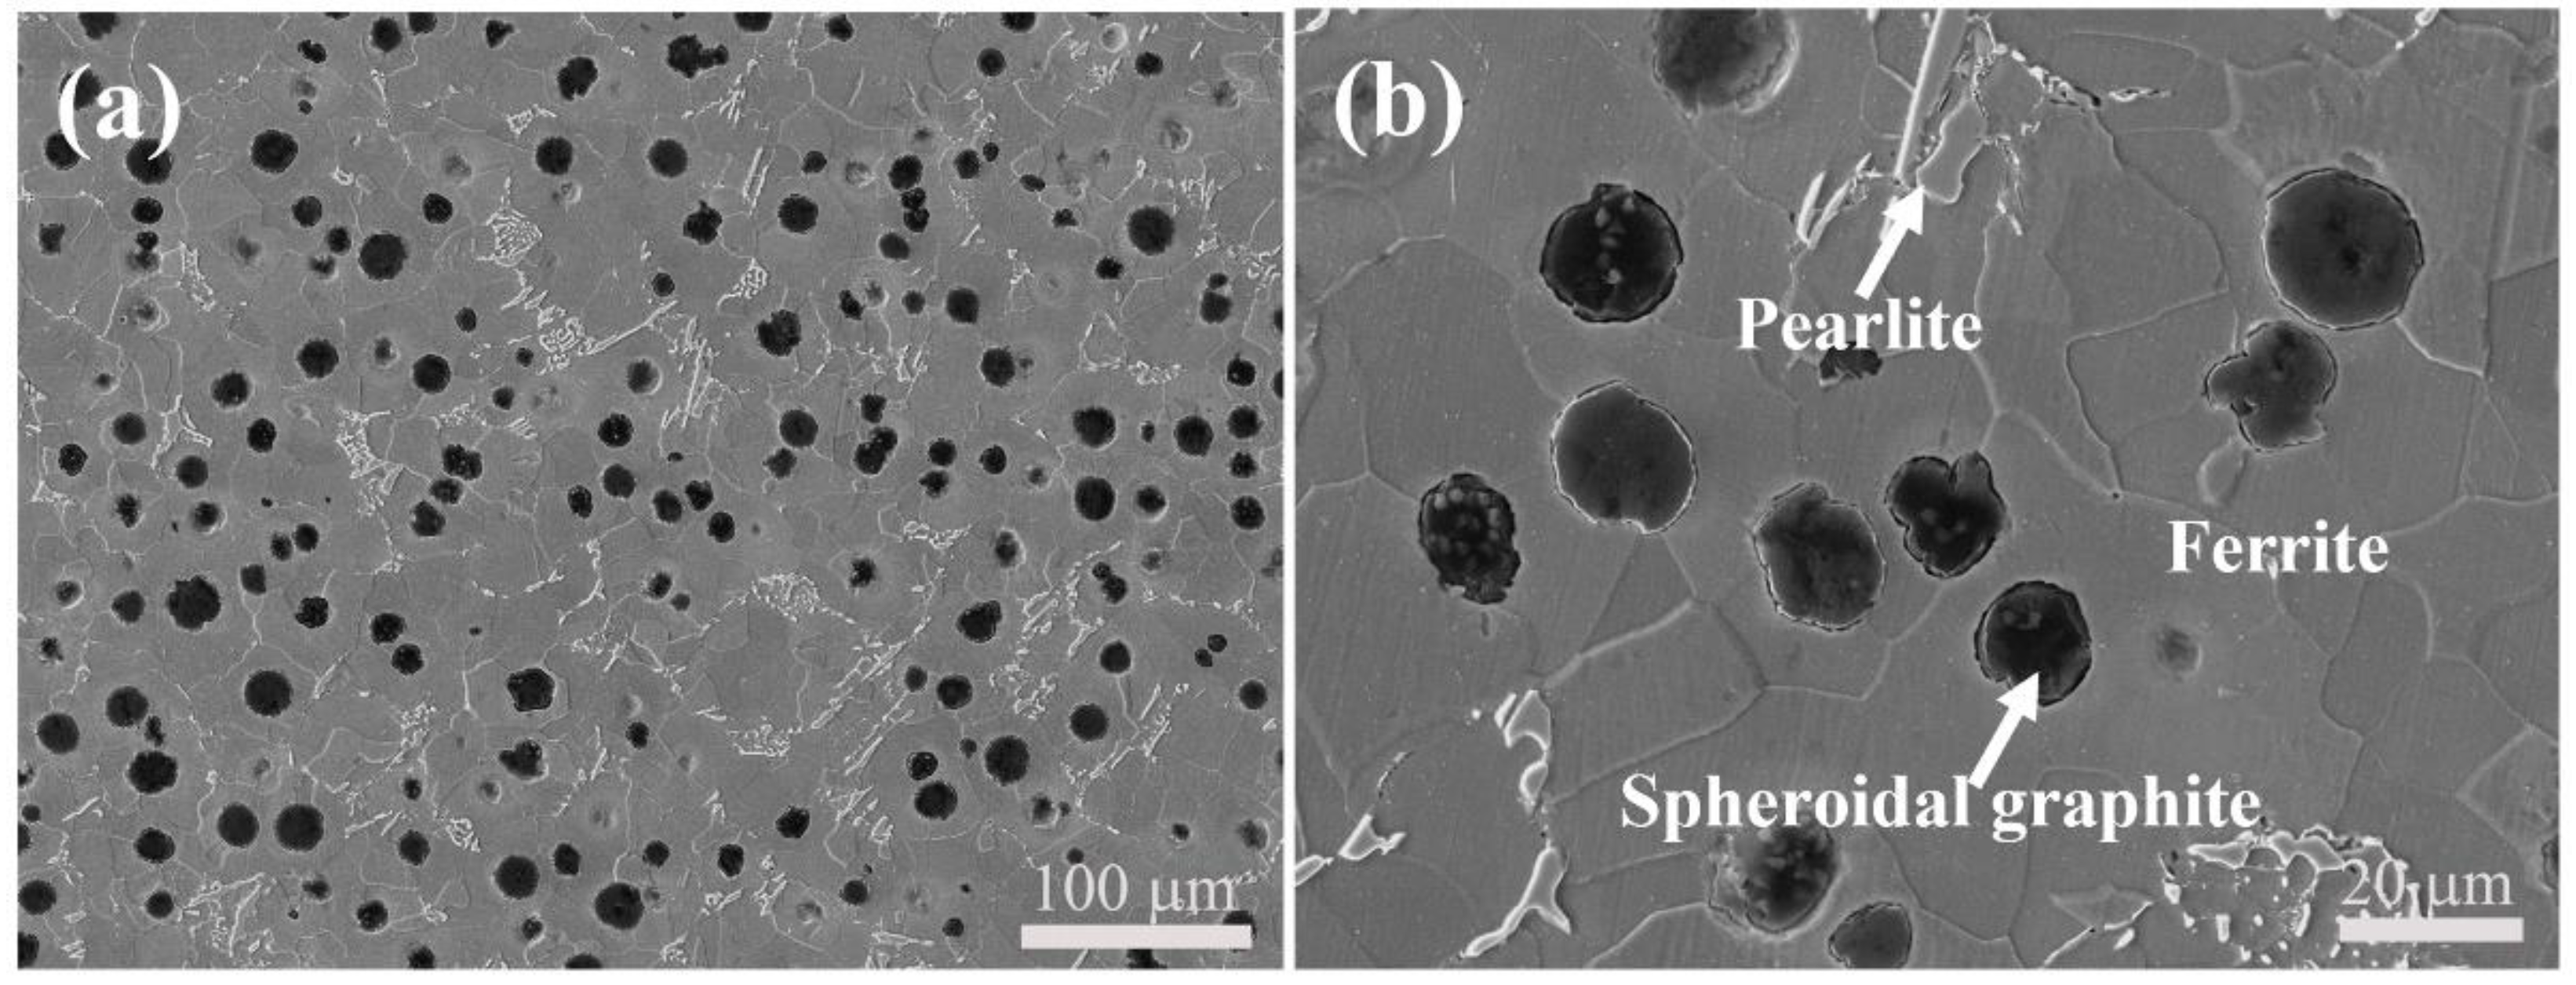
Figure 2 shows the SEM images of the as-cast sample. The spheroidal graphite with a diameter of about 10 μm was distributed homogeneously in the matrix. The volume of spheroidal graphite was estimated to be 10.6% (Figure 2a). It could be clearly observed that the matrix was composed of ferrite and pearlite (Figure 2b).
Figure 3 presents the optical images of the tempered samples. It is known that high carbon martensite with a plate-like morphology and retained austenite could be obtained in the ductile iron by quenching treatment [23]. Martensite and retained austenite reduced in quantity, and some black particles were observed in the tempered sample (Figure 3). The individual carbide particle could hardly be seen due to the small size, and only the aggregation of carbides with a deeply black appearance could be observed by optical microscope. Tempered martensite usually shows as a deeply black contrast compared with directly quenched martensite under optical microscope because it is easily etched [31]. The black area was evenly distributed for samples tempered at 420 °C and 500 °C (Figure 3a,b), indicating a relatively uniform carbide precipitation. However, the black area became obviously uneven in the sample tempered at 580 °C, suggesting that the coarsening of carbide occurs when tempering at high temperature (Figure 3c). High temperature provided a high driving force for carbide precipitation and growth. Consequently, the size and amounts of carbides increased with the increase of tempering temperature.
Figure 4 shows the SEM images of tempered samples. It could be seen that the matrix of the sample tempered at 420 °C mainly consisted of tempered martensite (Figure 4a), which was similar to the morphology of quenched martensite. Through high magnification observation, small amounts of fine carbide particles could be observed on the coarse martensite (Figure 4d). With the increase of tempering temperature to 500 °C, the needle martensite was difficult to recognize (Figure 4b), indicating that martensite was gradually decomposed. For the sample tempered at 580 °C, the morphology of martensite almost disappeared (Figure 4f), which indicates that martensite was completely decomposed into carbides and ferrite when tempered at 580 °C, and the size of carbide was estimated about 0.3 µm. It was worth emphasizing that the samples tempered at 420 °C and 500 °C contained only a small amounts of carbides, which was because Si effectively inhibits the precipitation of carbides and delays the decomposition of martensite [12]. However, a large number of carbides was detected for the sample tempered, which suggested that the effect of Si delaying the formation of carbide was weakened at high tempering temperature.
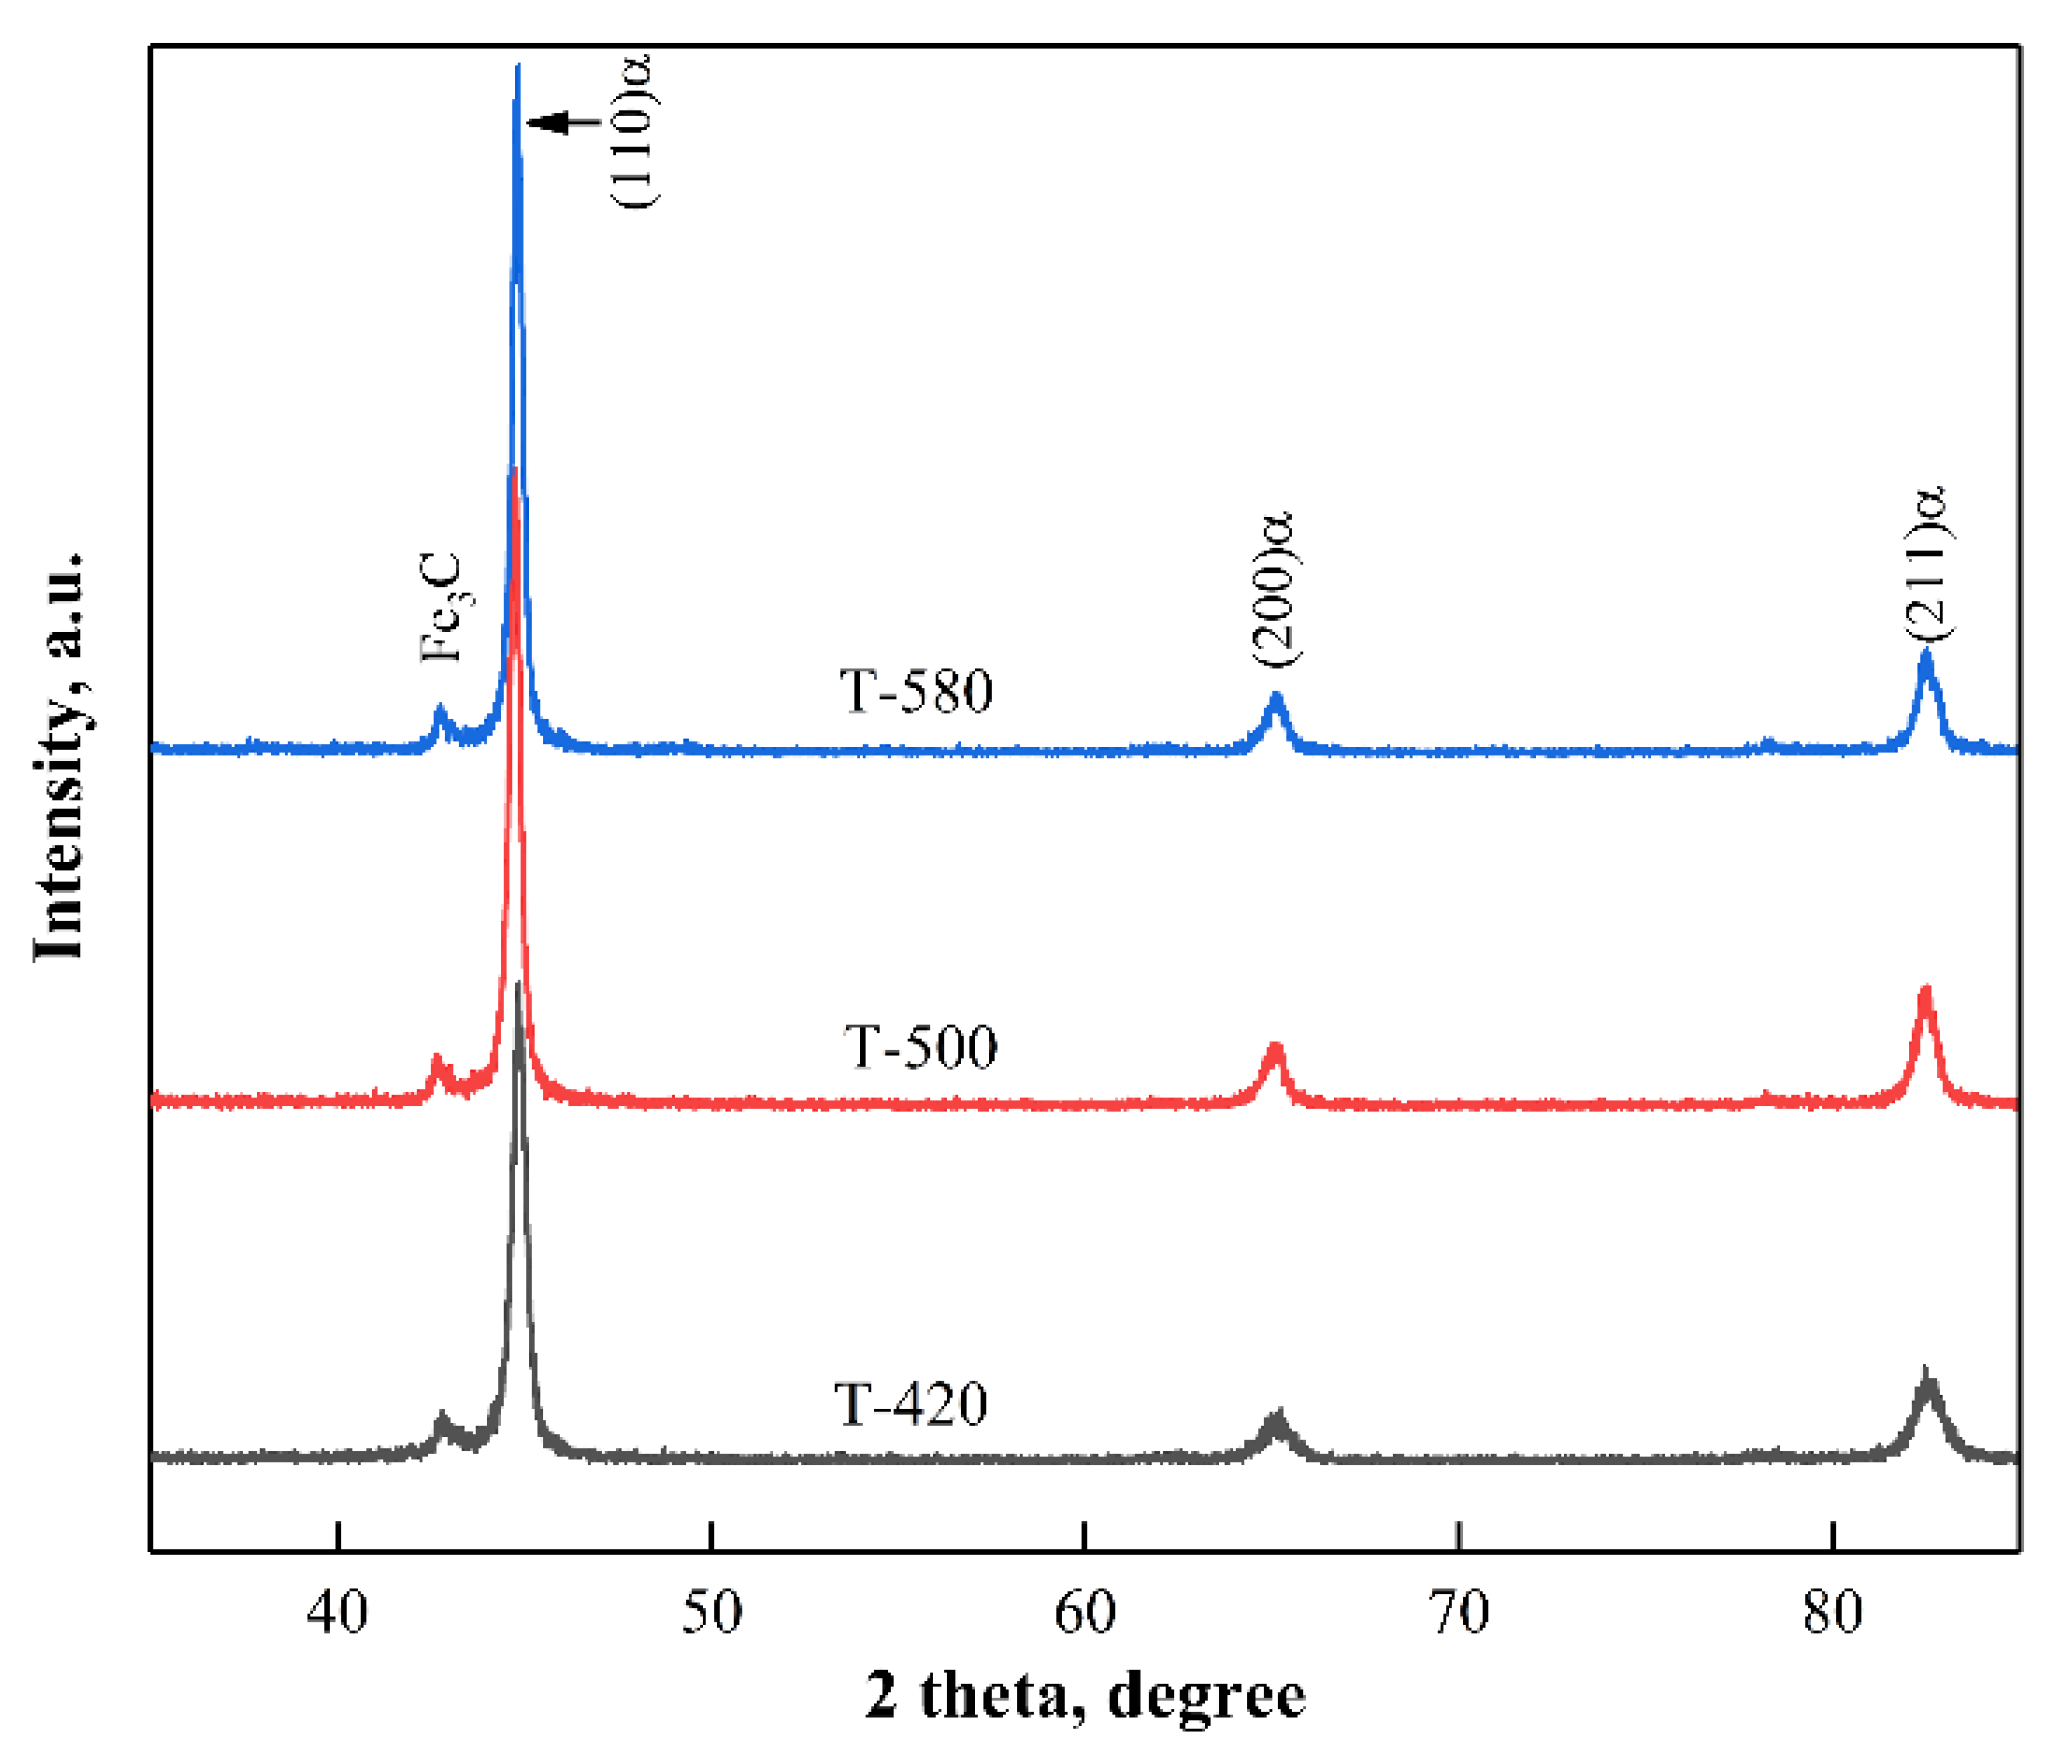
Figure 5 displays the XRD patterns of the tempered samples. All the tempered samples contained diffraction peaks of α phase and carbides diffraction peaks. No diffraction peaks of austenite were detected in the tempered samples, which indicated that the retained austenite was transformed into α phase and carbides when tempered at a temperature higher than 420 °C. The relative intensity of carbides’ diffraction peak increased with the increasing tempered temperature, which demonstrates that the amounts of carbides increased with the increase of tempering temperature. This is in good agreement with the SEM results.

3.2. Effects of Tempering Temperature on Mechanical Properties

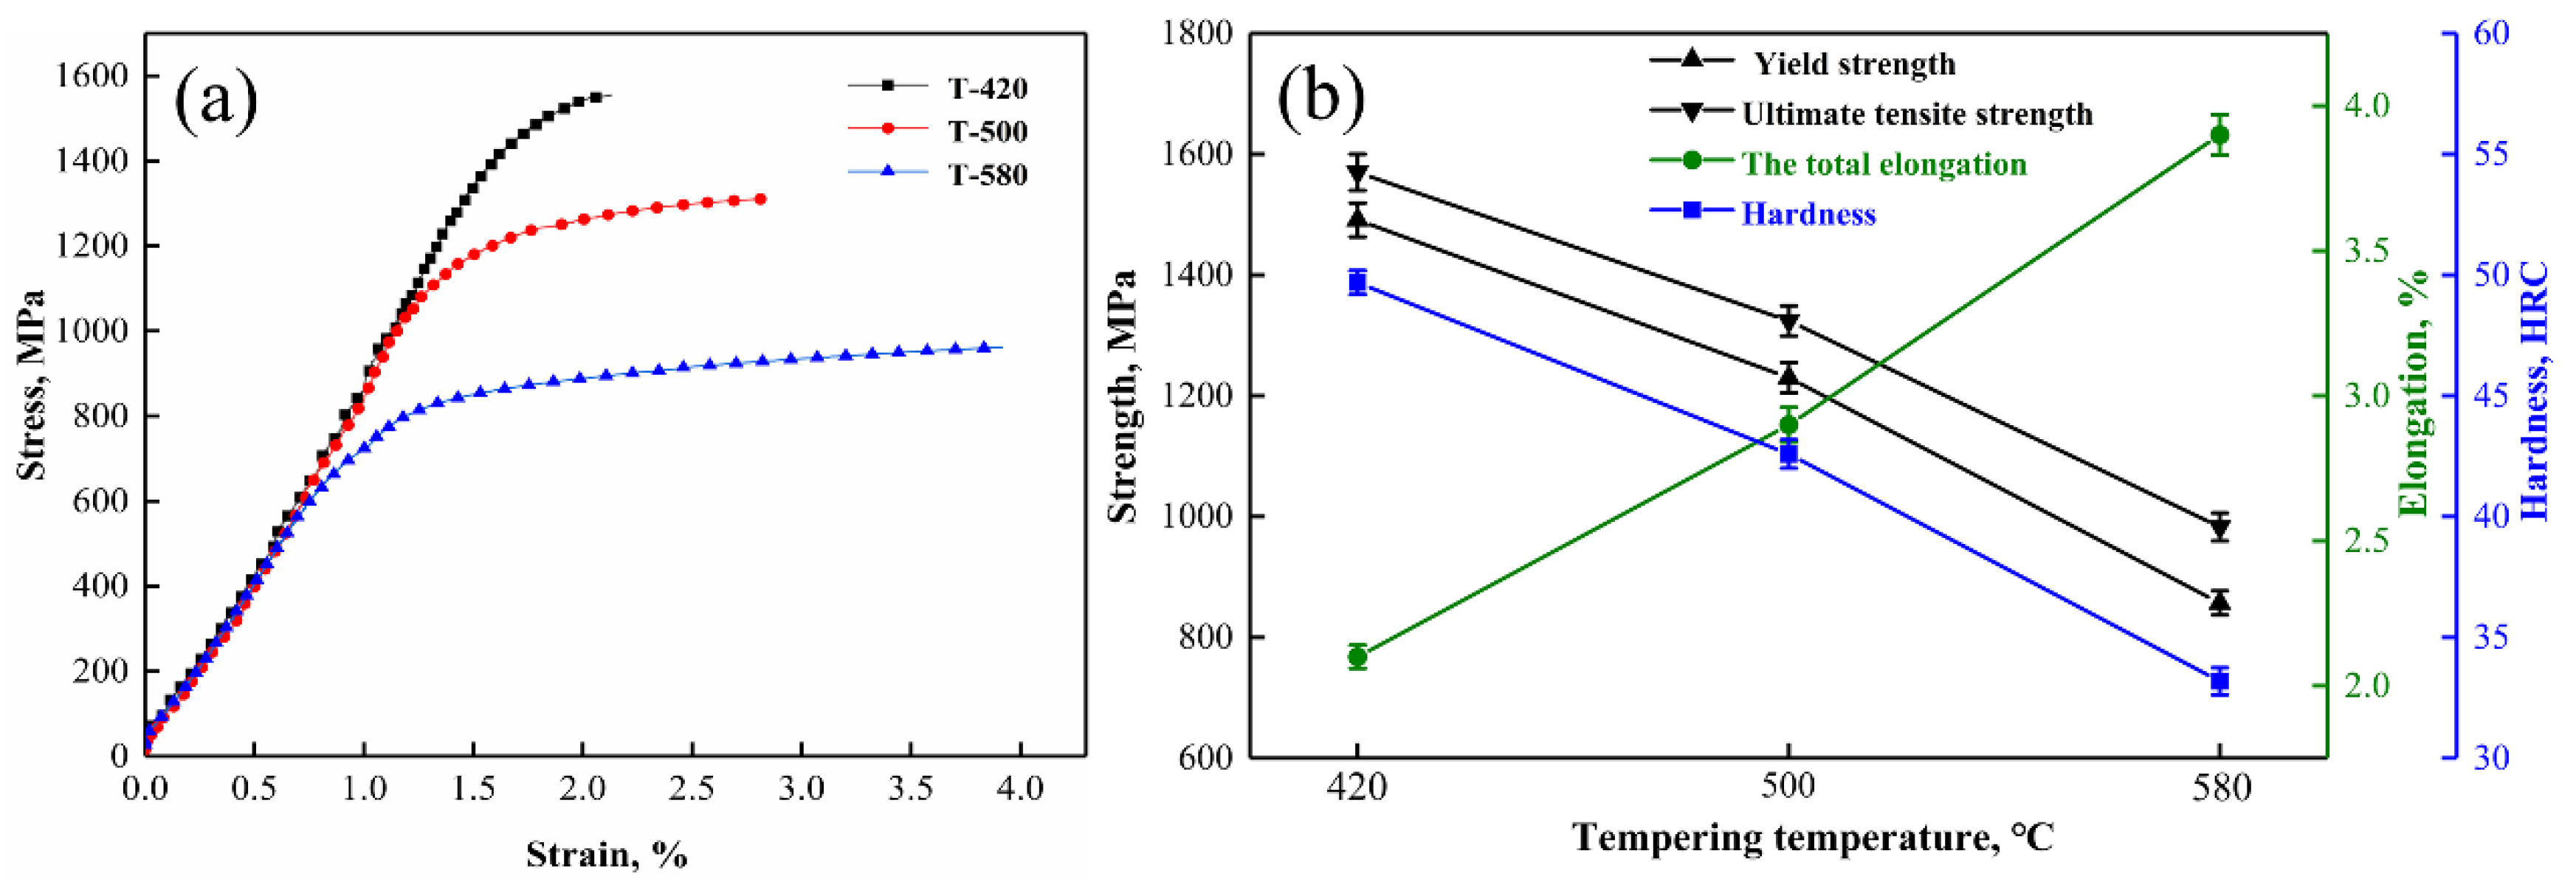
Figure 6 presents the mechanical properties of tempered samples. The mechanical responses of the tempered samples differed significantly (Figure 6a). The variation of mechanical properties with tempering temperature was shown in Figure 6b. The strength and hardness decreased with the increase of tempering temperature, whereas the ductility increased. The ultimate tensile strength (UTS) decreased from 1570 MPa for the sample tempered at 420 °C to 983 MPa for the sample tempered at 580 °C, but the elongation increased from 2.1% to 3.9%.
High carbon martensite was obtained from ductile iron after quenching. It is well known that high-carbon martensite exhibits a high strength [32]. However, a very large internal stress exists in martensite for the as-quenched sample, which usually leads to limited plasticity. The sample tempered at 420 °C exhibited a high strength that was higher than that which was previously reported for ductile iron [33,34,35]. This was mainly because the tempered martensite still contained a high amount of carbon atoms. Additionally, some of the carbon atoms in martensite precipitated and formed carbide, which reduced the internal stress of materials. Hence, a certain plasticity was achieved for the sample tempered at 420 °C. The strength decreased with the tempering temperature increasing from 420 °C to 580 °C. When the tempering temperature was 580 °C, the UTS and YS decreased to 983 MPa and 857 MPa, respectively, whereas the elongation increased to 3.9%. This was mainly because more carbon atoms precipitated from the matrix, and the size of carbide was increased with the increase of tempering temperature. It could be seen that the hard martensite was almost replaced by carbides and ferrite for the sample tempered at 580 °C (Figure 4f).
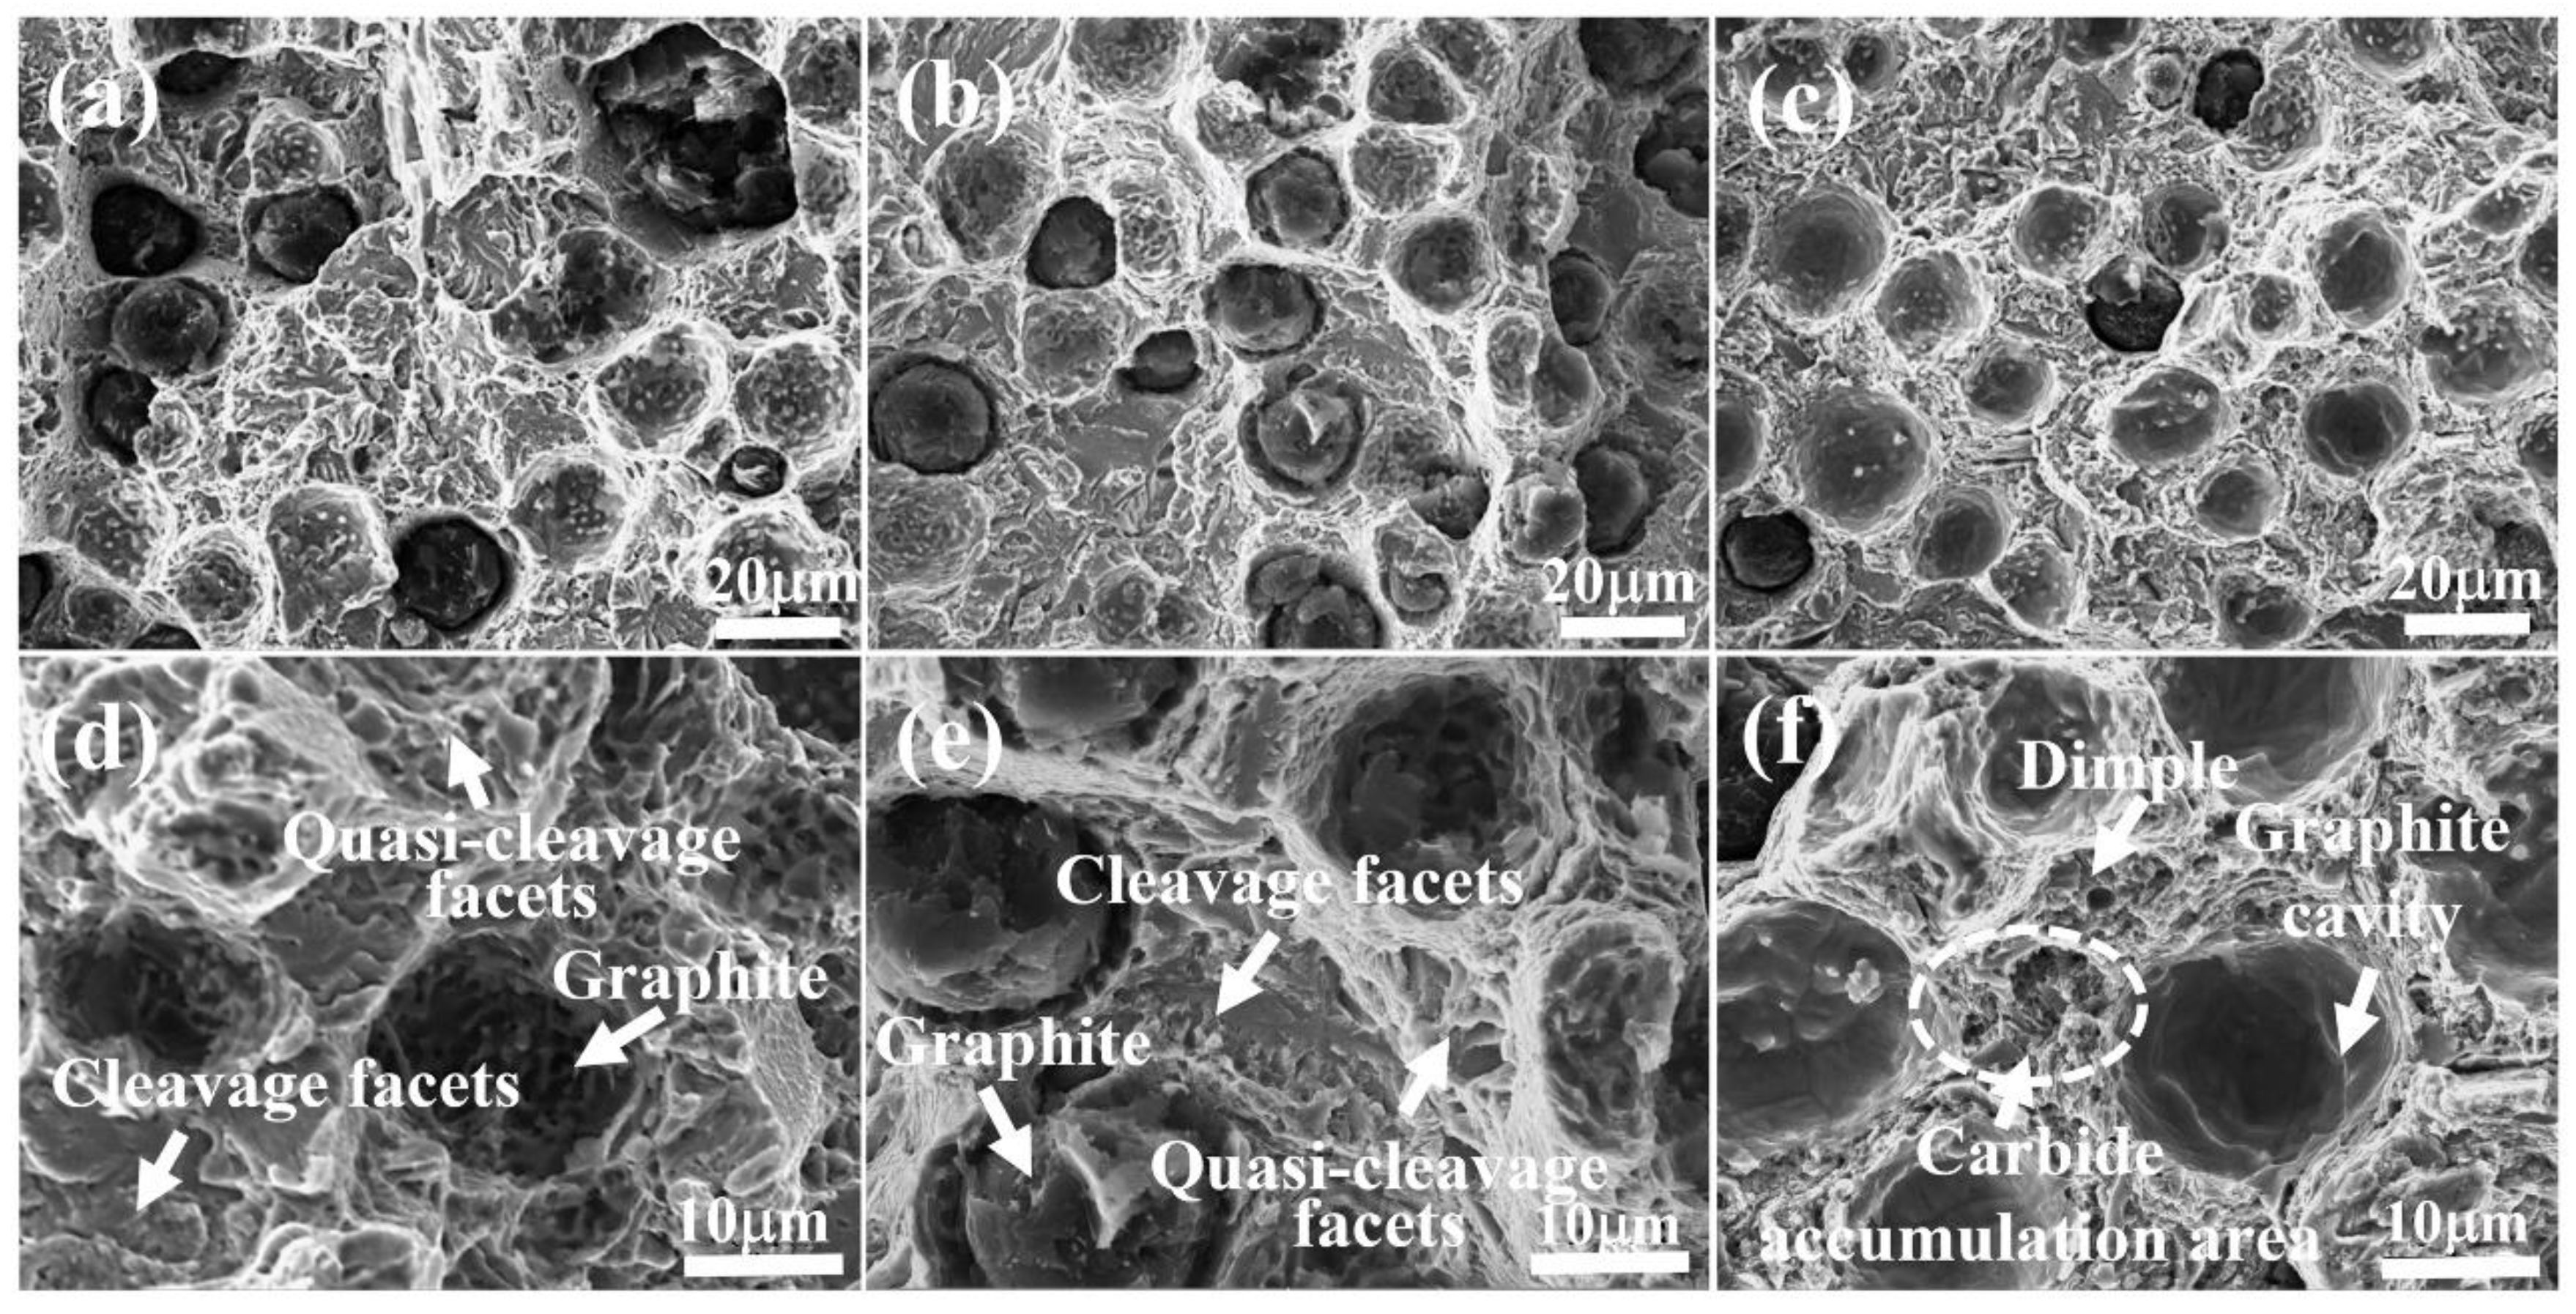
Figure 7 shows the fracture morphology of the tempered samples after tensile tests. Some cleavage facets were clearly observed for the samples tempered at 420 °C and 500 °C (Figure 7d,e), which were indicators of brittle fracture. Additionally, it could be clearly seen that there were a lot of quasi-cleavage facets in all tempered samples. However, after tempering at 580 °C, some dimples could be observed (Figure 7f), indicating that the fracture mode gradually evolved into ductile fracture. Additionally, a tear characteristic was detected for the area in the vicinity of graphite (Figure 7f), which indicates that the graphite in the matrix deteriorated the ductility.

3.3. Effects of Tempering Temperature on Tribological Behavior

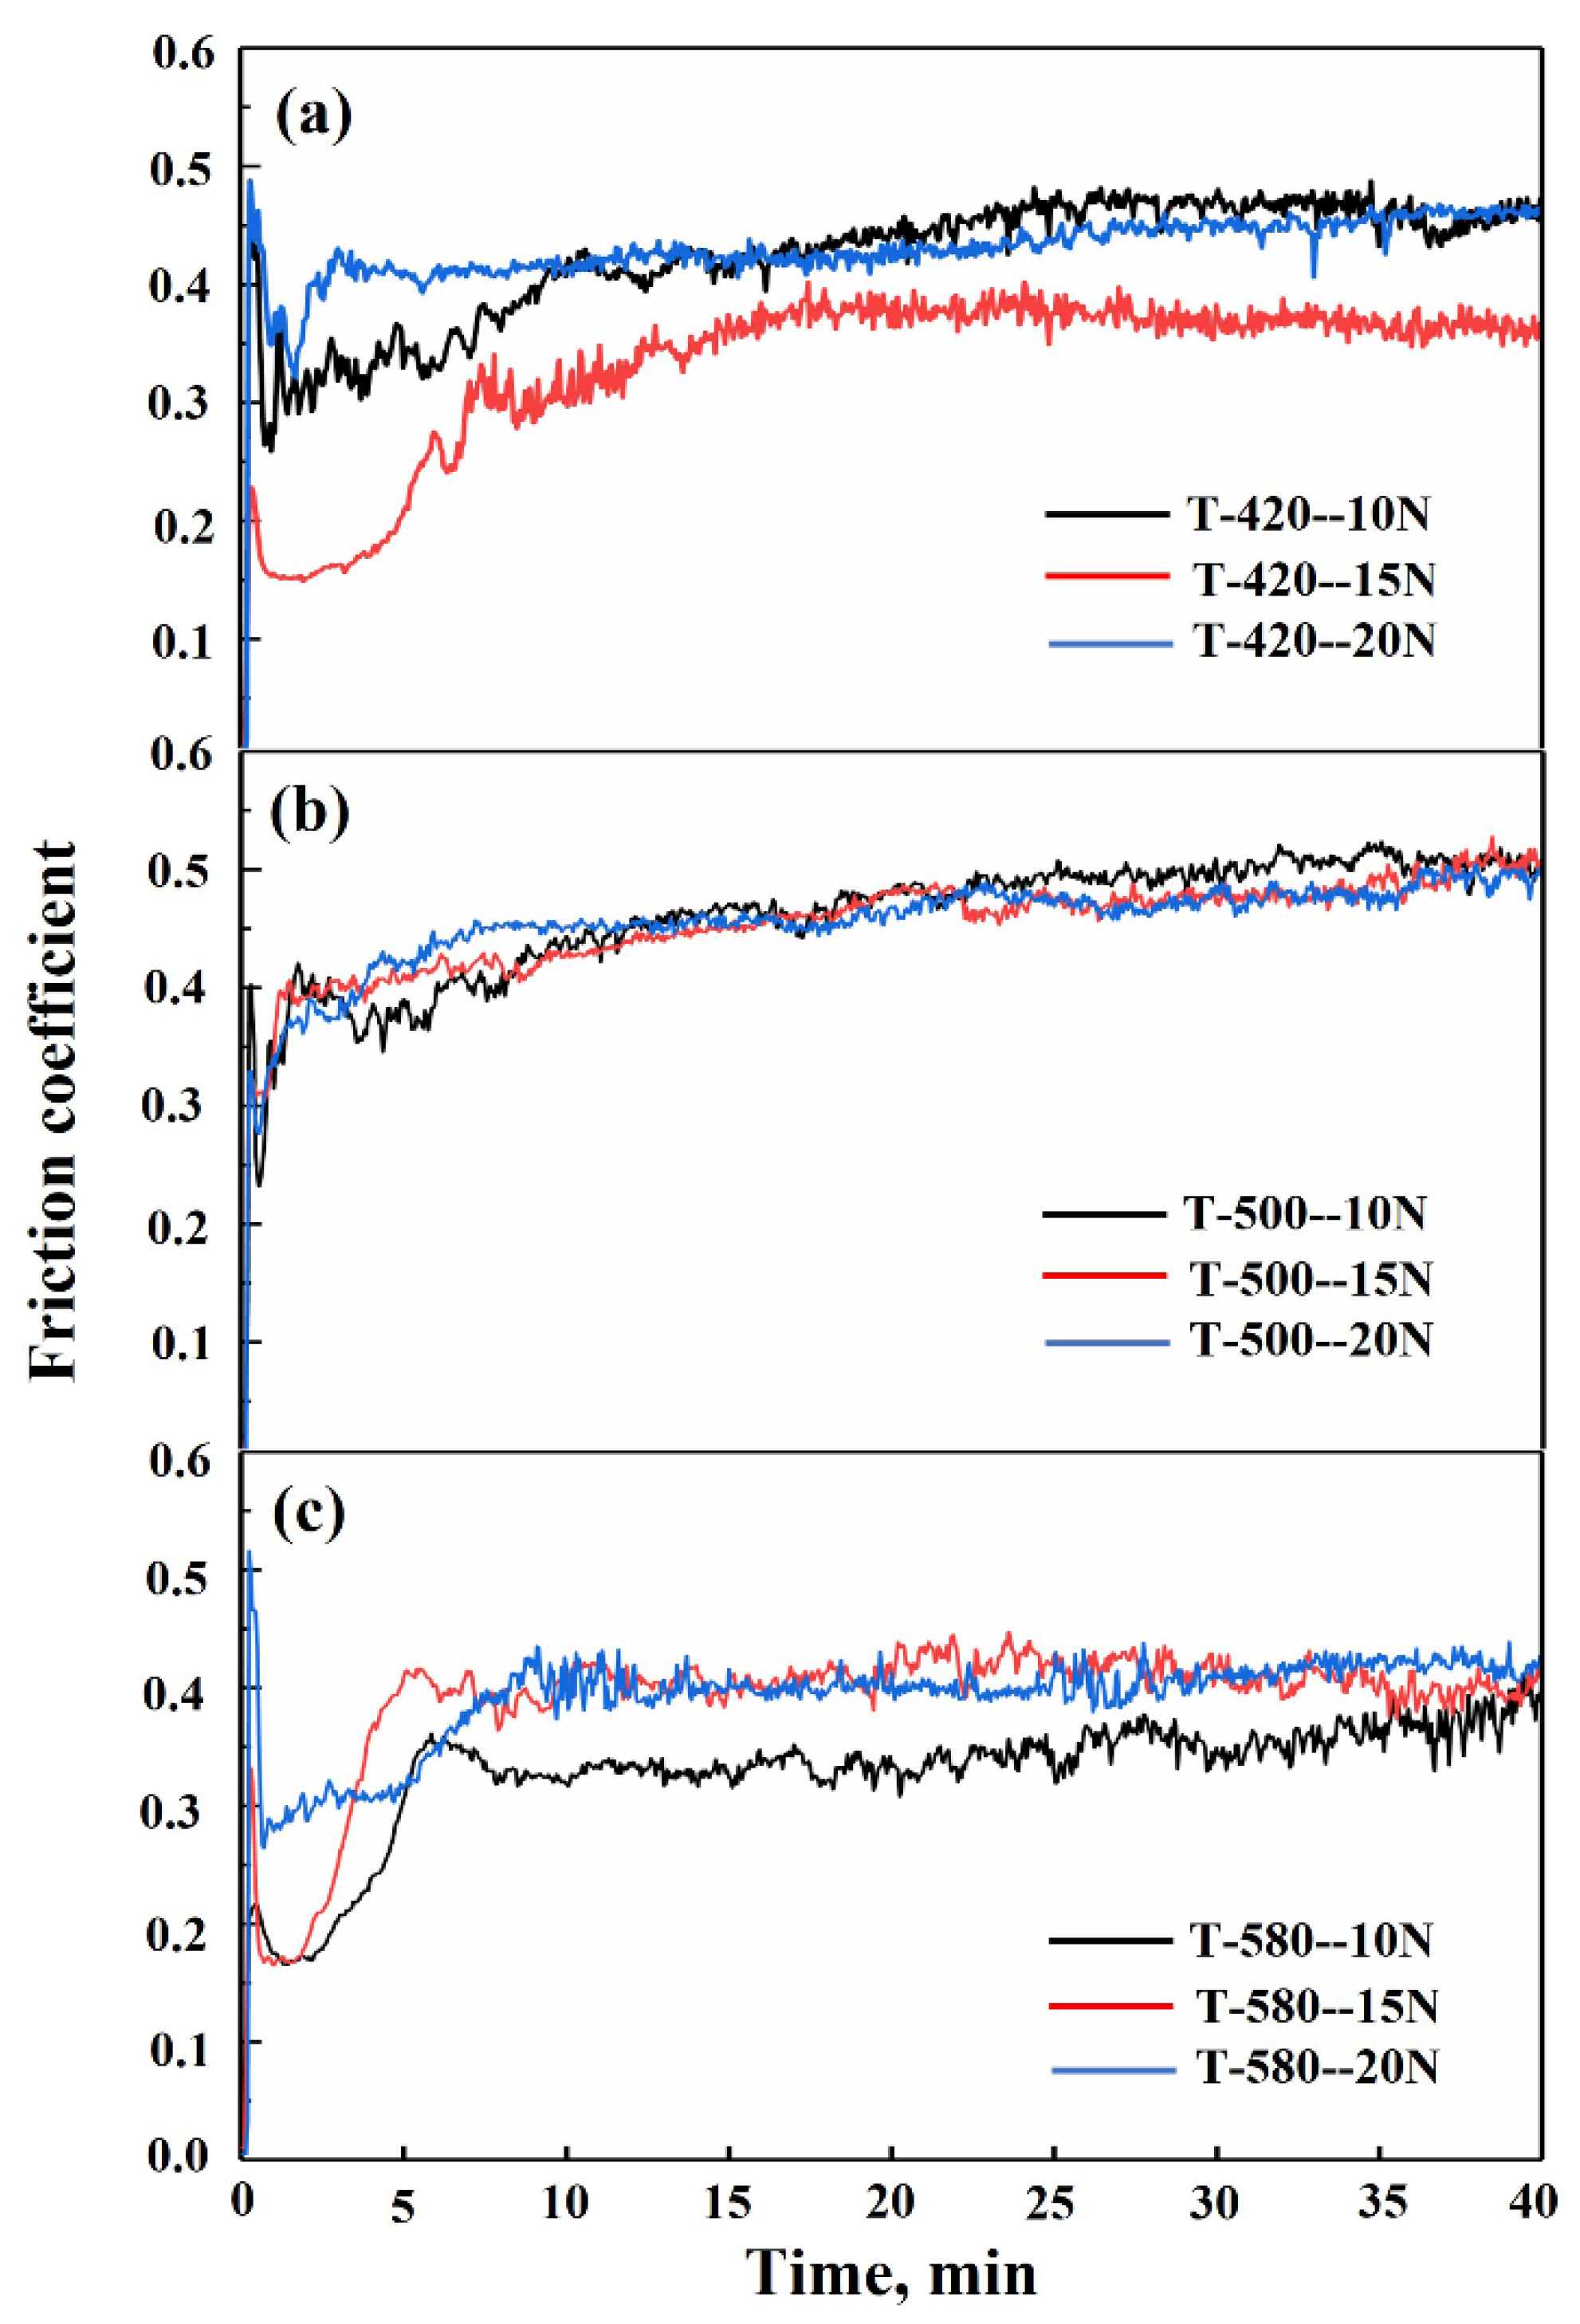
Figure 8 shows the friction coefficient curves of tempered samples. It could be seen that the friction coefficient showed an upward trend at the initial stage and then fluctuated slightly and went into a steady stage. At the initial stages, the frictional resistance generated by the asperities on the tribosurface resulted in the increase of the friction coefficient. As the asperities gradually became flat and the spherical graphite was dragged to the tibosurface, forming a lubricating layer, the friction coefficient reached a stable value and even decreased slightly. However, the friction coefficient of samples tempered at different temperatures exhibited obvious differences even under the same load.
Figure 9 shows the variation of the friction coefficient at a steady stage of tempered samples with normal loads. The friction coefficient of samples tempered at 420 °C decreased first and then increased with the increase of normal loads. When the load was 15 N, the sample tempered at 420 °C exhibited a minimum friction coefficient of 0.37. However, for the sample tempered at 580 °C, the friction coefficient firstly increased and then tended to stabilize with the increase of loads, and the lowest friction coefficient was obtained (0.34) at the load of 10 N. Additionally, it is worth nothing that the friction coefficient of the sample tempered at 500 °C changed little with the increase of load. Ductile iron can be regarded as a special composite material composed of spheroidal graphite embedded in the matrix of iron [5,36]. Therefore, the friction coefficient of ductile iron was closely related to the extent of the graphite self-lubricating effect. The samples tempered at different temperatures exhibited different hardness, which plays an important role in the self-lubricating effect of graphite. In addition, the friction coefficient of commercial GCr15 under dry sliding wear condition was reported in the previous literature to be about 0.8 [37], which is high compared with that of tempered ductile iron in this study. The result is mainly attributed to the advantage of the graphite self-lubricating effect in the tempered ductile iron. Common ADI materials with a friction coefficient of 0.5 have been reported in the literature [25], and their friction coefficient is also slightly higher than that of the tempered ductile iron in this study.
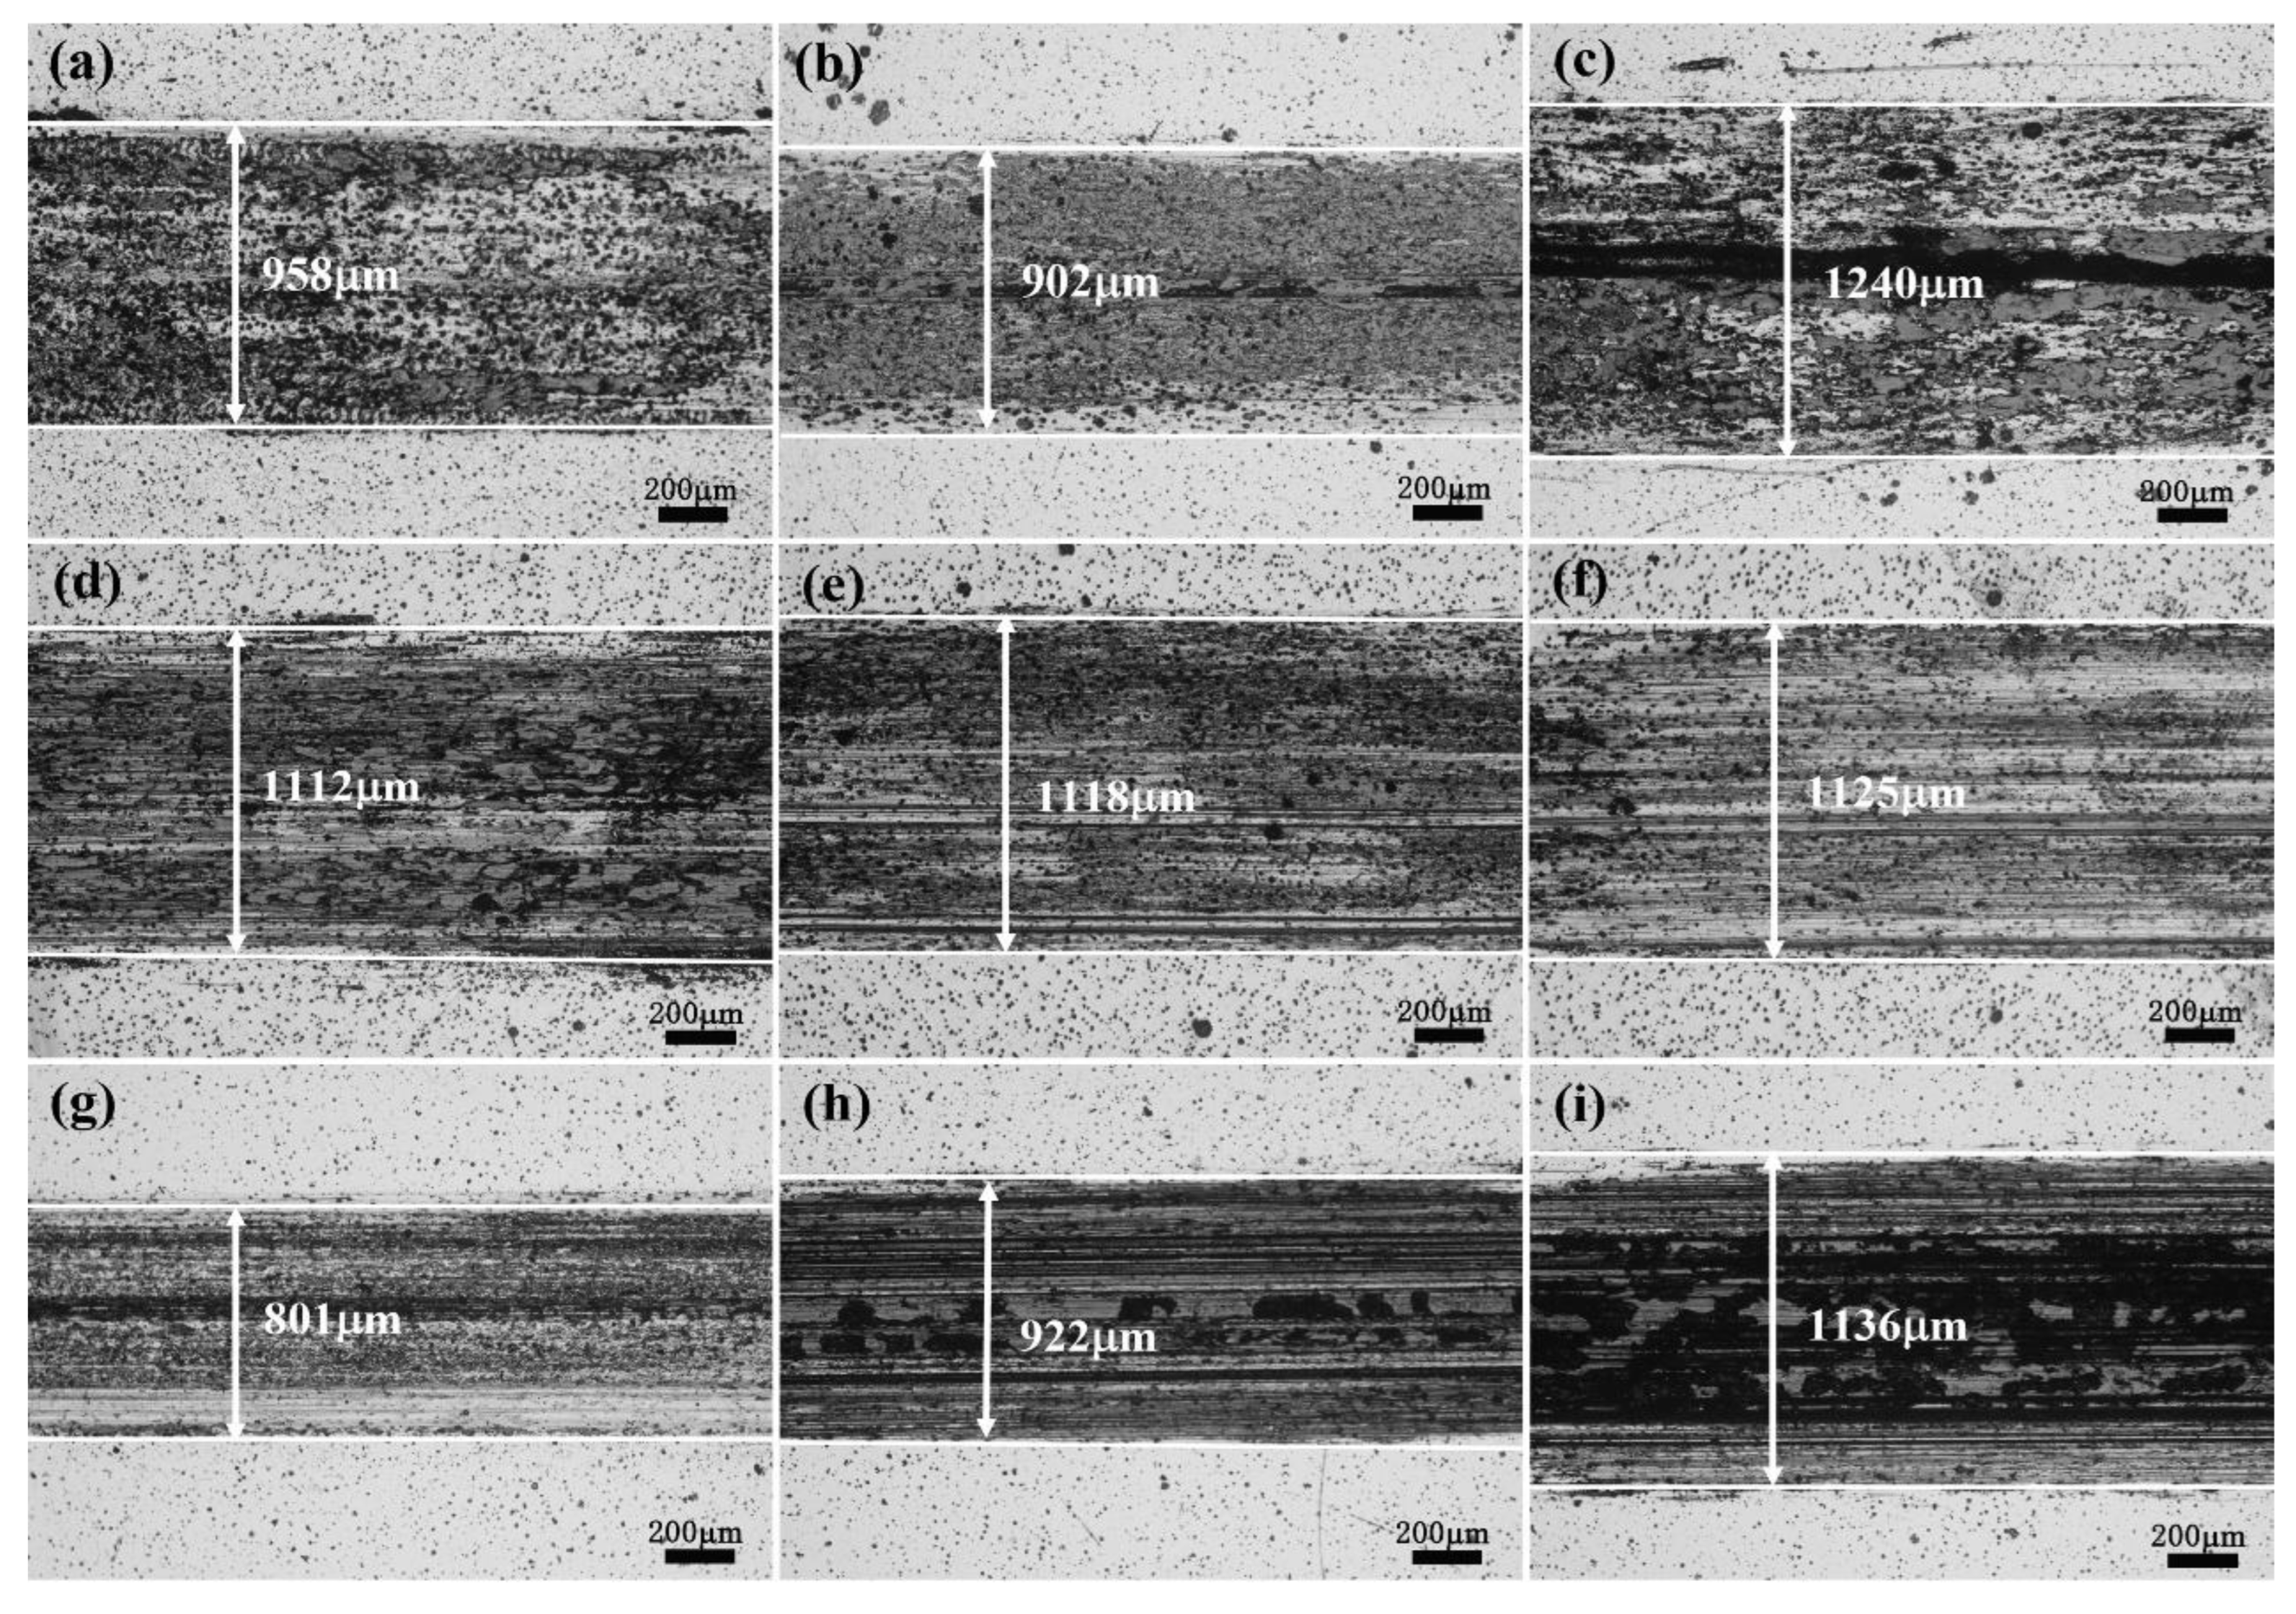
Figure 10 shows the worn surface microstructure of tempered samples under different loads. It can be seen that the worn surface of the sample tempered at 420 °C was very uniform at the normal load of 15 N. The width of the worn surface of the sample tempered at 420 °C under the load of 15 N was about 902 μm, which was smaller than that of under the load of 10 N and 20 N. Additionally, it can be seen that the worn surface of the sample tempered at 420 °C was not uneven when the normal loads were 10 N or 20 N. Consequently, the sample tempered at 420 °C showed the lowest friction coefficient when the load was 15 N. The width of the worn surface of the sample tempered at 500 °C was similar under all loads, which gave rise to similar friction coefficients. It can be clearly seen that the worn surface of the sample tempered at 580 °C was very uniform and the width was about 801 μm under the load of 10 N (Figure 10g). However, the worn surface of the sample tempered at 580 °C was severe under the loads of 15 N and 20 N, which was because the surface was seriously damaged during the wear test under high load due to the relatively low hardness. Therefore, a high-friction coefficient was obtained for the sample tempered at 580 °C under the loads of 15 N and 20 N.
Figure 11 shows the variation of wear rate of tempered ductile iron under different loads. The wear rate of materials was determined by the hardness and friction coefficient [27]. The hardness of ductile iron was decreased with the increase of tempering temperature. The sample tempered at 420 °C exhibited a lower wear rate compared with the samples tempered at 500 °C and 580 °C, which indicated that hardness was a determined factor for wear properties. For samples tempered at 500 °C and 580 °C, the wear rate presented an increasing trend with the increase of loads. However, the sample tempered at 420 °C exhibited a lower wear rate of 1.7 × 10⁻⁶ mm3/N·mm under the load of 15 N, which was mainly attributed to the low friction coefficient of 0.37 under the load of 15 N. It is interesting to find that the samples tempered at 500 °C and 580 °C exhibited a similar wear rate. The hardness values of the samples tempered at 500 °C and 580 °C were 42.6 HRC and 33.2 HRC, respectively. Under the load of 15 N, the sample tempered at 580 °C was more easily plastically deformed. Consequently, graphite is more easily extracted from the matrix and distributed on the tribosurface, which could effectively reduce the friction coefficient. Therefore, the couple effects of hardness and friction coefficient gave rise to the similar wear rate for the samples tempered at 500 °C and 580 °C.
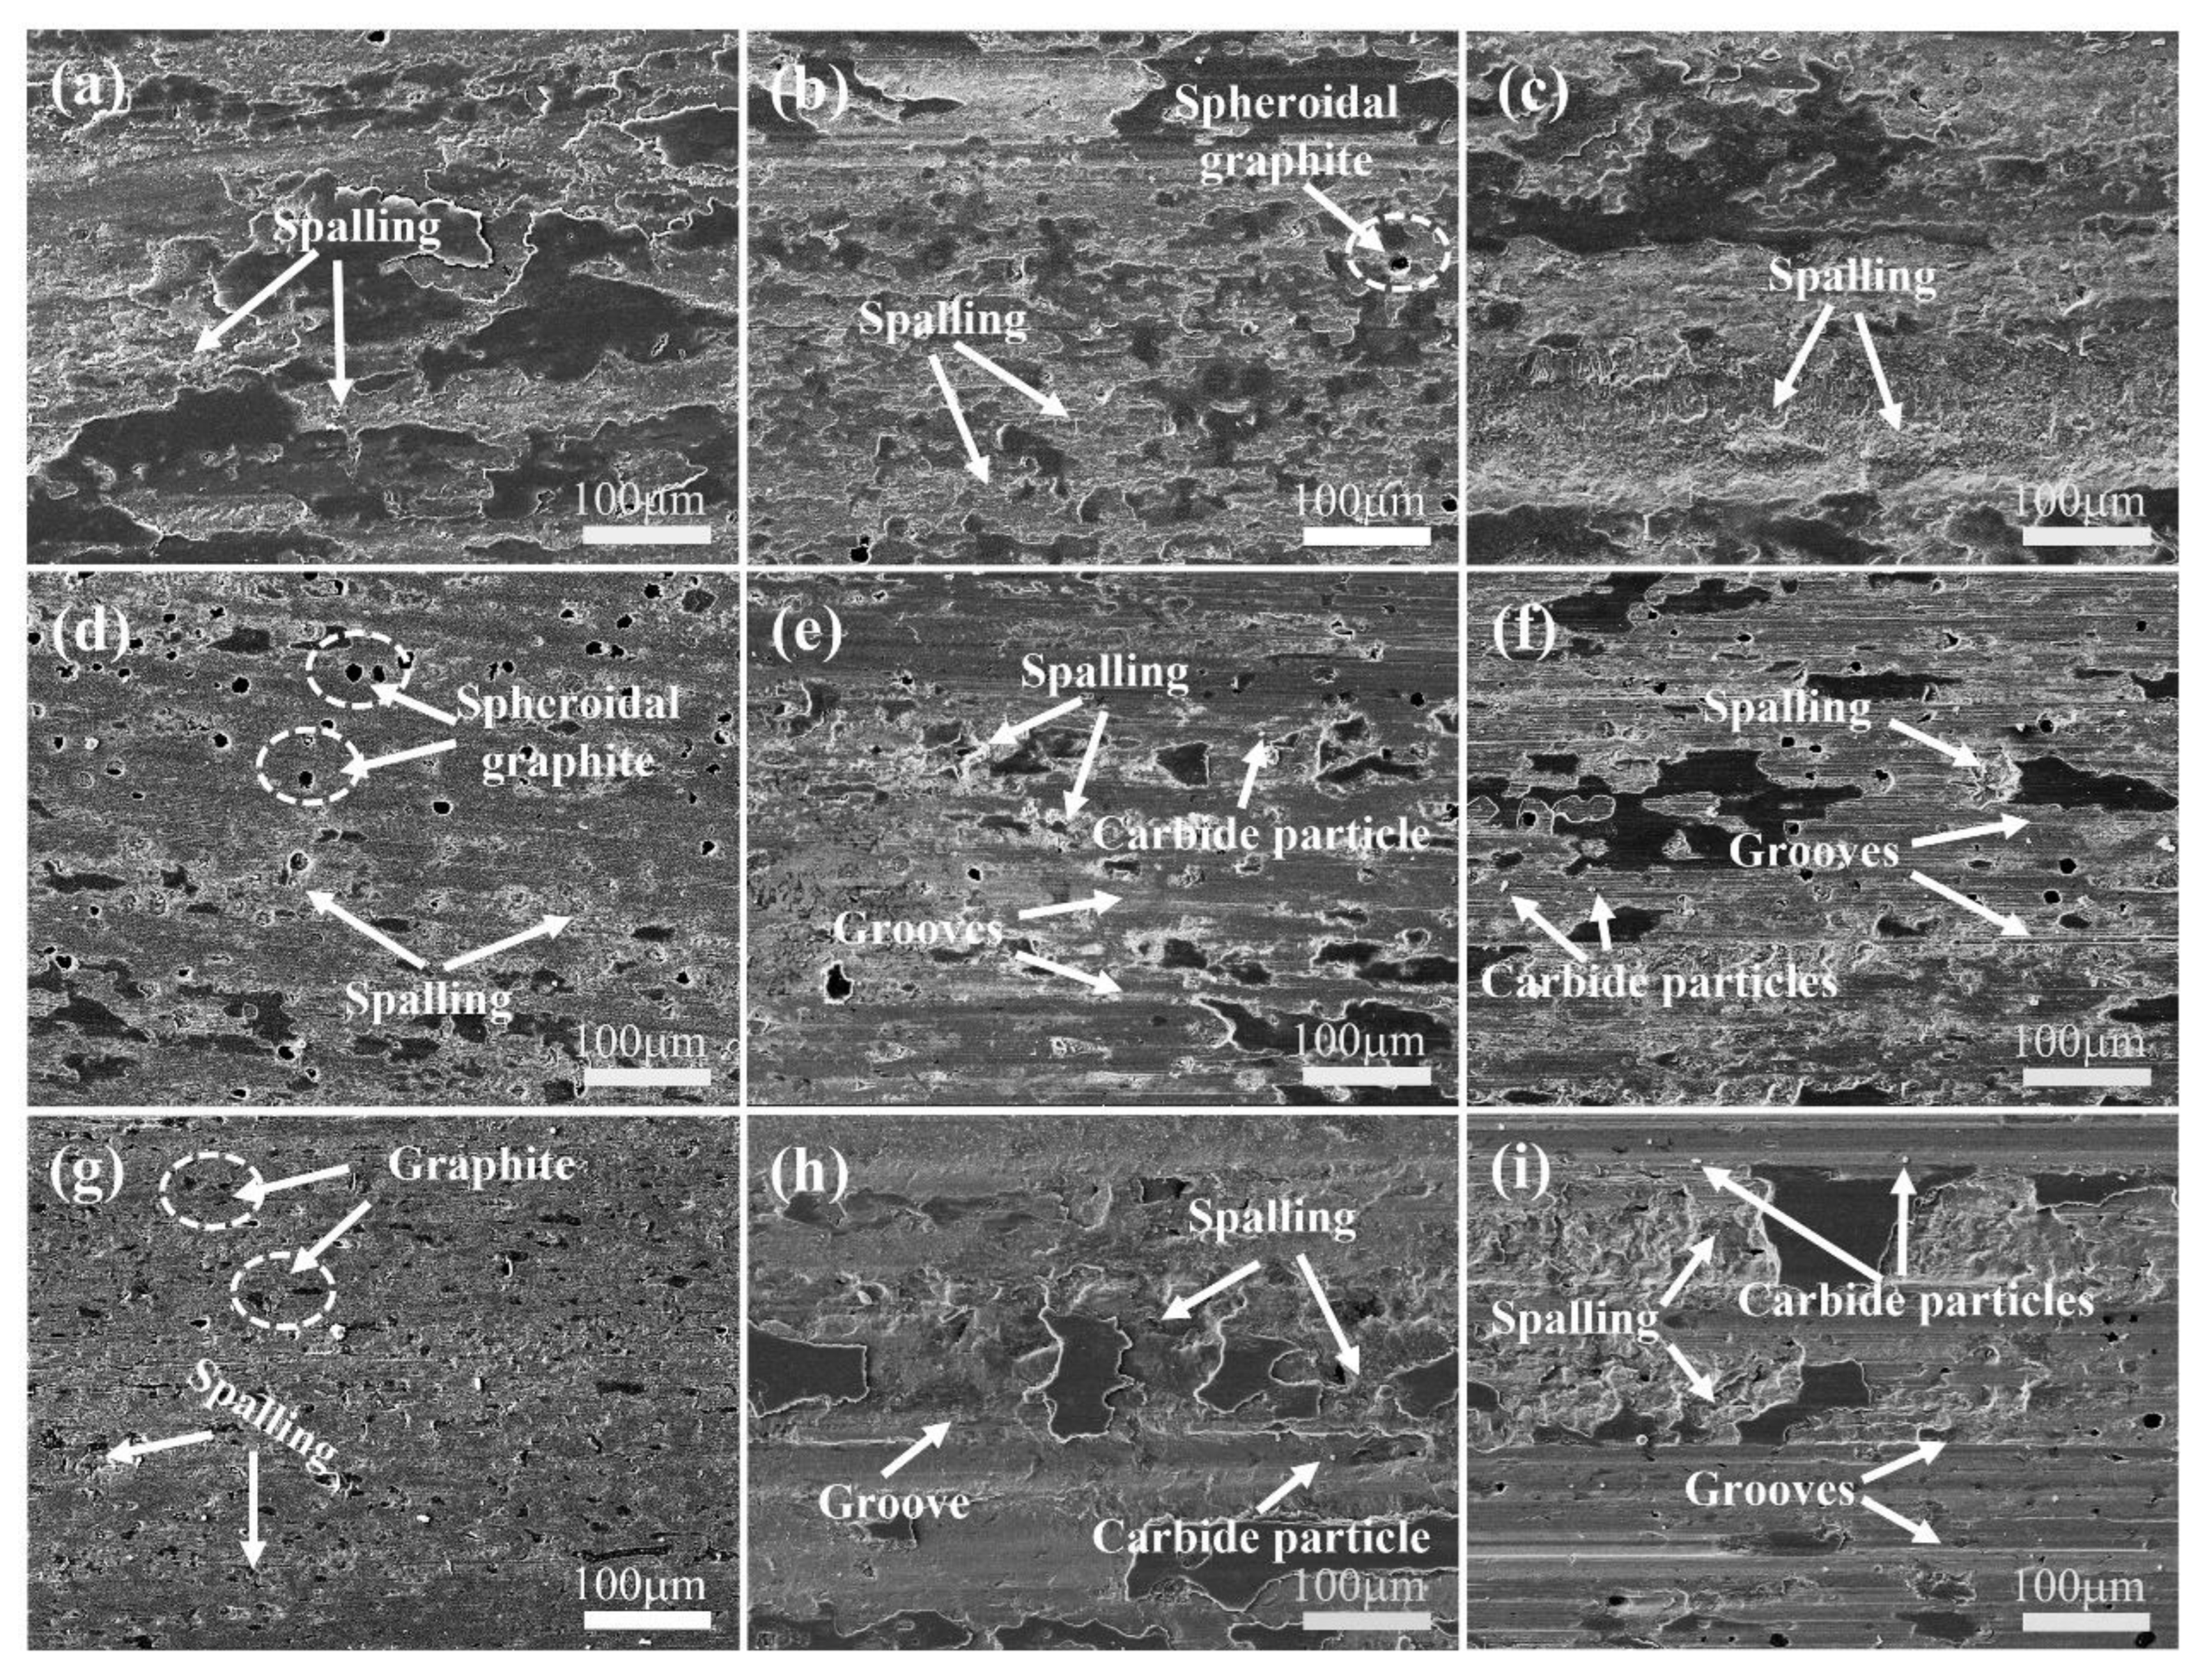
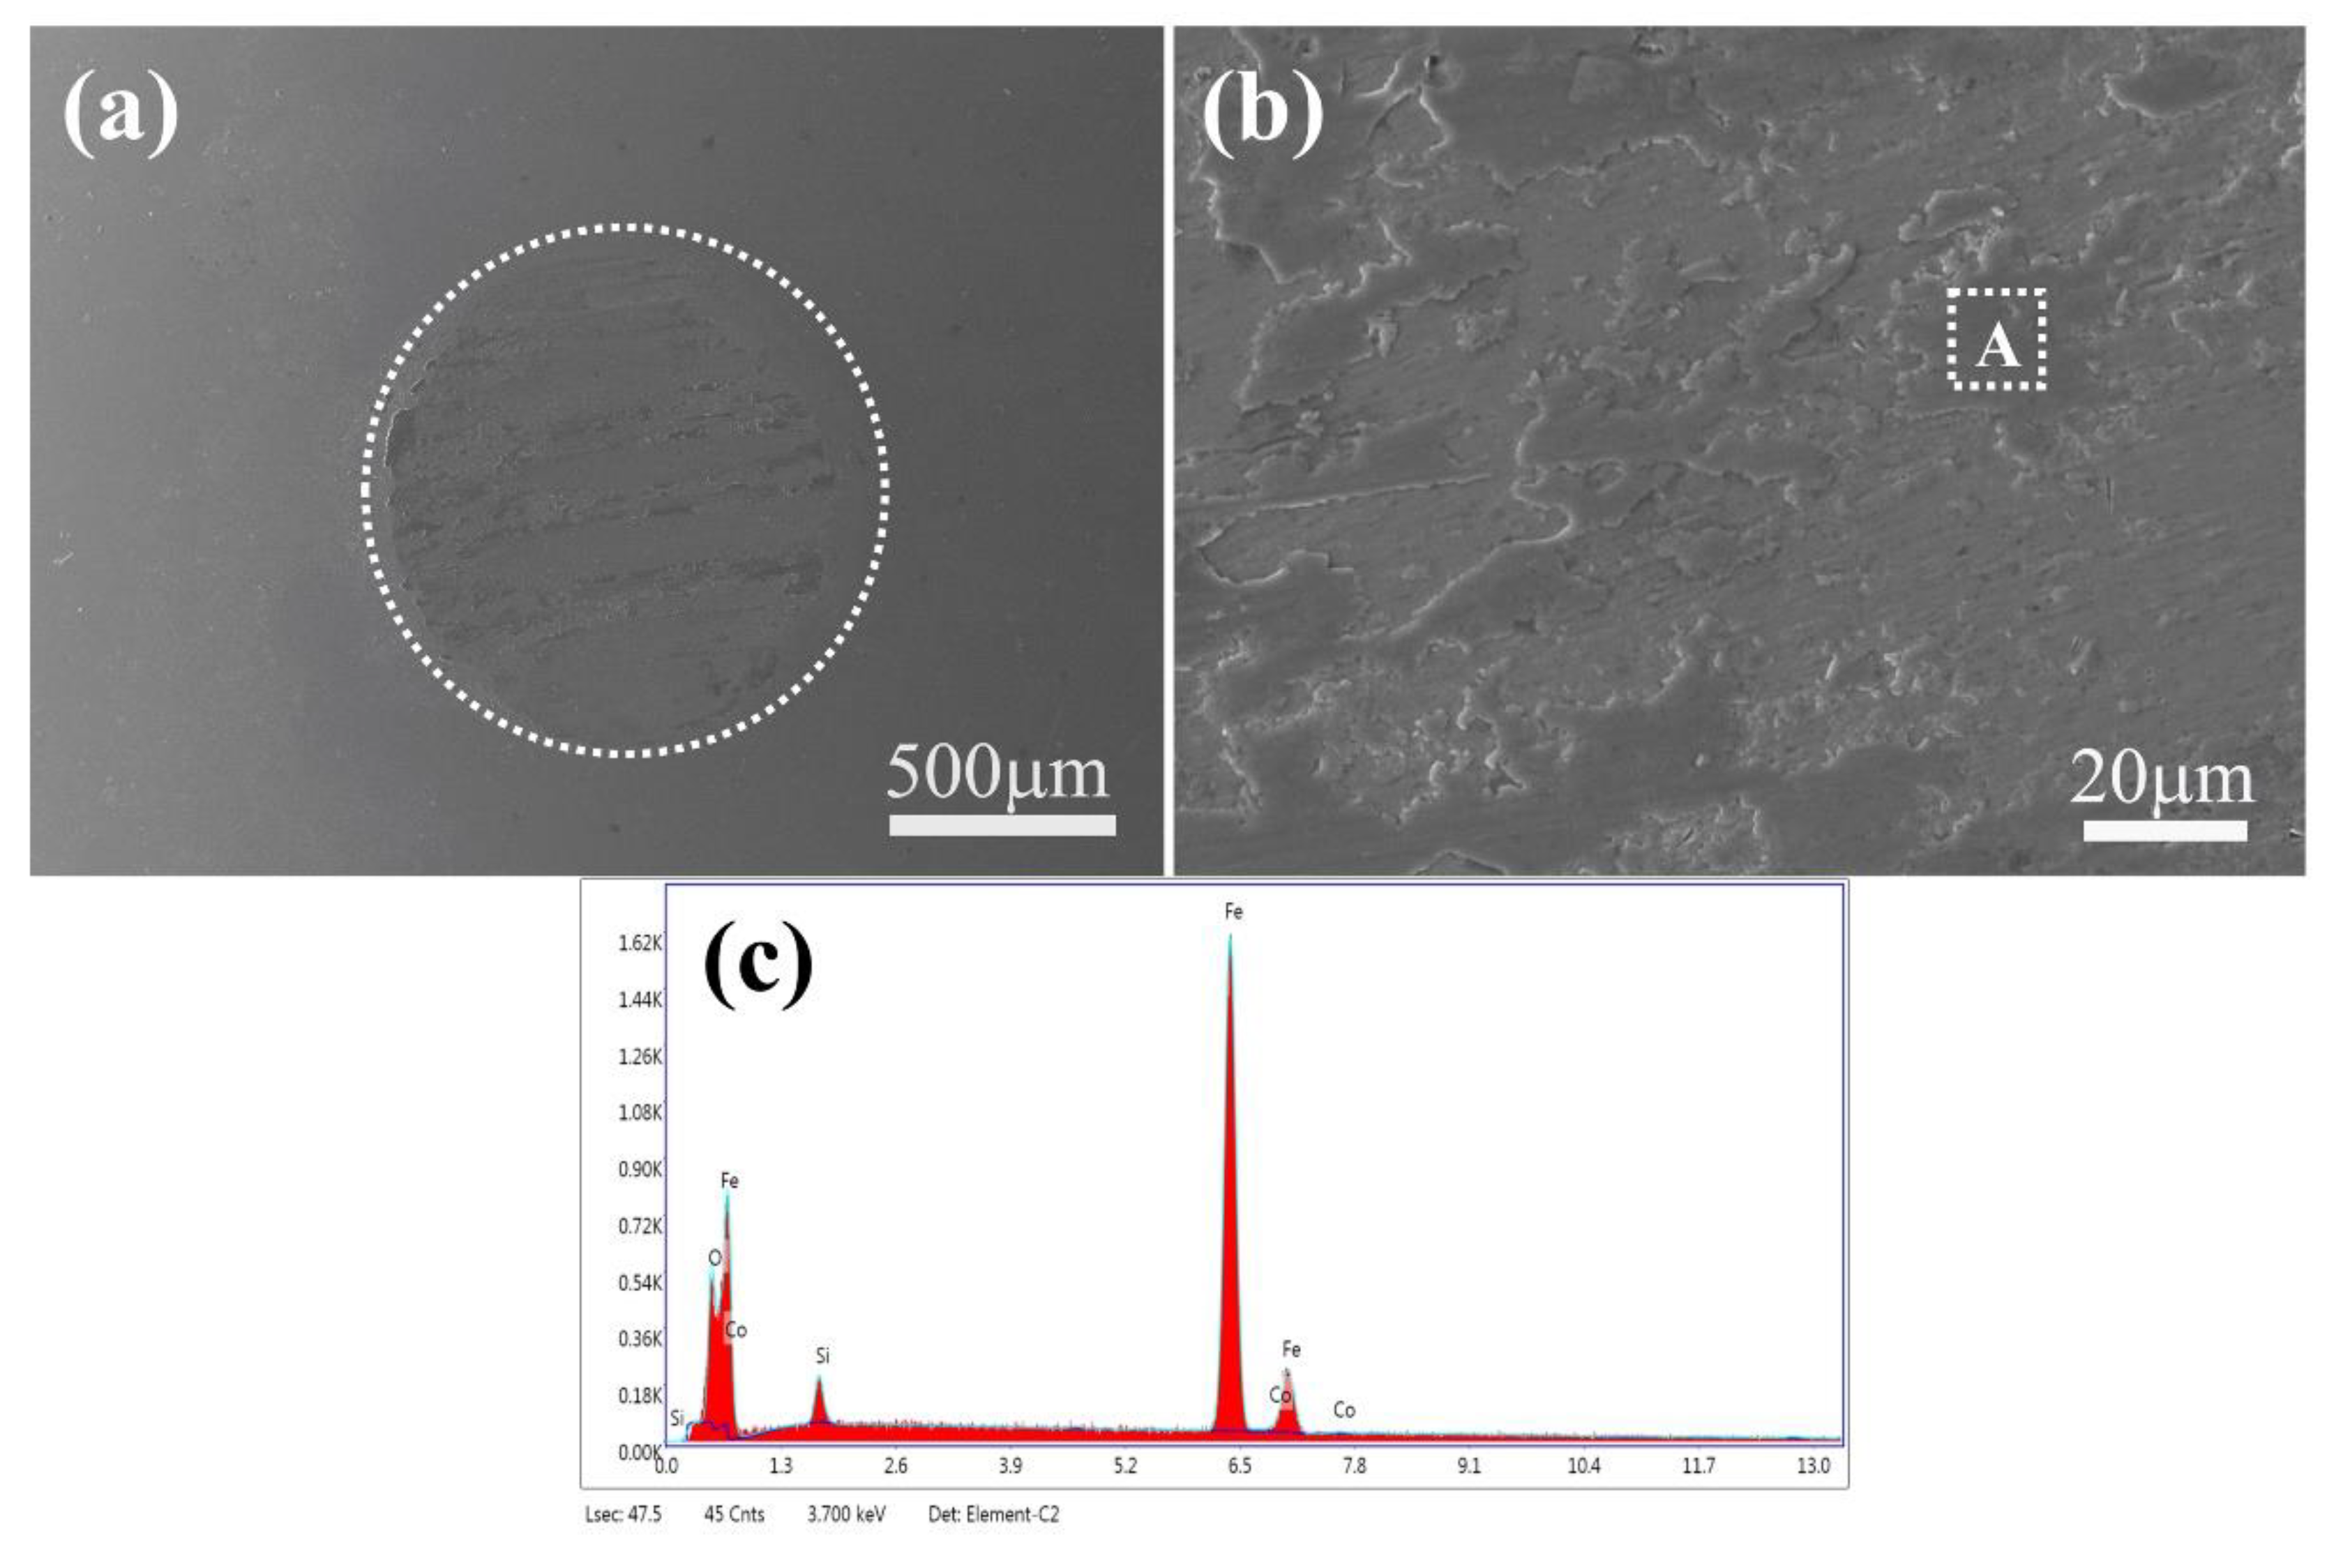
Figure 12 presents the SEM images of the worn surface. The worn surface was covered by spalling and grooves, indicating that adhesive and abrasive wear occurred for the tempered ductile iron. The SEM morphology of the counterpart during the wear test is given in Figure 13. Adhesion can be clearly observed on the surface of the counterpart (Figure 13a,b). EDS confirmed that Si existed in the adhesion, which indicates that the surface substance of ductile iron was transferred and adhered to the worn surface of GCr15 steel during the wear test. This further confirmed the occurrence of adhesive wear. The morphology characteristics of adhesive wear could be observed for the sample tempered at 420 °C under various load conditions, and the worn surface gradually became severe with the increase of normal loads. With the increase of load, the contact area of the GCr15 ball and ductile iron disc increased, which led to more severe adhesive wear. The sample tempered at 500 °C exhibited a slight adhesive wear under the load of 10 N. Many furrows were observed in the worn surface of the sample tempered at 500 °C with the increasing loads (15 N and 20 N), and abrasive particles were detected on the wear track at the loads of 15 N and 20 N (Figure 12e,f). This indicates that abrasive wear is predominant for the sample tempered at 500 °C under high loads. The sample tempered at 580 °C presented similar worn characteristics to the sample tempered at 500 °C. However, it should be noted that the worn surface of the sample tempered at 580 °C had a deeper groove, which was mainly related to the low hardness of the sample tempered at 580 °C.
At the initial stage of wear tests, only the tribosurface of the tempered surface was deformed, which would give rise to the adhesive wear. With the increase of normal loads, the graphite and the carbide embedded in the matrix of the tempered ductile iron could be peeled off to be distributed on the tribosurface, where the graphite’s friction coefficient would be reduced, but the carbide would act as abrasive particles, accelerating wear rate. For the sample tempered at 420 °C with a high hardness and small amounts of carbide, the carbide and the graphite could be exposed to the tribosurface only under high normal loads. Hence, adhesive wear was predominant and only slight abrasive wear was observed. However, when the tempering temperature was increased, the hardness was reduced and the amounts of carbide was increased. Therefore, the carbide was easily exposed to the tribosurface under a certain stress because of the easy deformation of the matrix. The carbide would act as abrasive particles in the following wear test. Consequently, abrasive wear was predominant for the samples with low hardness and high loads.

4. Conclusions

The effects of tempering temperature on the microstructure and mechanical and wear properties of ductile iron were investigated in the present study. The main conclusions are summarized as follows.
  • The tempered ductile iron was composed of α phase, carbides, and spheroidal graphite.
  • The strength and hardness of ductile iron decreased linearly with the increase of tempering temperature, but the plasticity was increased, which was mainly attributed to the carbide’s precipitation causing the gradual decomposition of martensite.
  • The friction coefficient of the tempered samples differed significantly. The friction coefficient of the sample with high hardness tempered at 420 °C increased first and then decreased with increasing loads; no obvious change was detected for the friction coefficient of the sample tempered at 500 °C at different loads, and the friction coefficient of the sample tempered at 580 °C increased with the increase of loads.
  • The wear rate was increased with the increasing of tempering temperature, indicating that hardness is the determined factor for wear properties for the tempered ductile iron under the wear conditions.
  • The main wear mechanism of tempered ductile iron was adhesive and abrasive wear. Adhesive wear was dominant for the sample tempered at 420 °C, and the abrasive wear predominated for the samples tempered at 500 °C and 580 °C.

Author Contributions

Methodology, X.Z.; Software, X.W.; Formal analysis, Z.H.; Investigation, Z.H.; Resources, B.J.; Writing—original draft, C.L.; Writing—review & editing, Y.D. All authors have read and agreed to the published version of the manuscript.

Funding

This work was supported by the Applied Technology Research Project of Beilin District (No. GX2250) and Xi’an University of Technology Youth Nova Fund (No. 101-451320005).

Data Availability Statement

The data that support this study are available from the corresponding author upon reasonable request.

Conflicts of Interest

The authors declare that they have no known competing financial interests or personal relationships that could have appeared to influence the work reported in this paper.

References

  1. Balachandran, G.; Vadiraj, A.; Kamaraj, M.; Kazuya, E. Mechanical and wear behavior of alloyed gray cast iron in the quenched and tempered and austempered conditions. Mater. Des. 2011, 32, 4042–4049. [Google Scholar] [CrossRef]
  2. Wang, B.; Barber, G.C.; Tao, C.; Han, X.; Sun, X. Tribological Performance of Austempered and Tempered Ductile Iron. Metall. Mater. Trans. B 2018, 49, 2261–2269. [Google Scholar] [CrossRef]
  3. Wang, B.; Barber, G.C.; Qiu, F.; Zou, Q.; Yang, H. A review: Phase transformation and wear mechanisms of single-step and dual-step austempered ductile irons. J. Mater. Res. Technol. 2019, 9, 1054–1069. [Google Scholar] [CrossRef]
  4. Zhang, H.; Wu, Y.-X.; Li, Q.-J.; Hong, X. Effect of matrix structure on mechanical properties and dry rolling–sliding wear performance of alloyed ductile iron. J. Iron Steel Res. Int. 2019, 26, 888–897. [Google Scholar] [CrossRef]
  5. Ghassemali, E.; Heretnando, J.C.; Stefanescu, D.M.; Dioszegi, A.; Jarfors, A.E.W.; Dluhoš, J.; Petrenec, M. Revisiting the graphite nodule in ductile iron. Scr. Mater. 2019, 161, 66–69. [Google Scholar] [CrossRef]
  6. Kobayashi, T.; Yamamoto, H. Development of High Toughness in Austempered Type Ductile Cast Iron and Evaluation of Its Properties. Metall. Mater. Trans. A 1988, 19, 319–327. [Google Scholar] [CrossRef]
  7. Bhadeshia, H.K.D.H.; Edmonds, D.V. The mechanism of bainite formation in steels. Acta Metall. 1980, 28, 1265–1273. [Google Scholar] [CrossRef]
  8. Wang, X.; Du, Y.; Liu, B.; Jiang, B. Enhanced plasticity of austempered ductile iron (ADI) by partitioning treatment. Mater. Sci. Eng. A 2021, 804, 140513. [Google Scholar] [CrossRef]
  9. Nishikawa, A.S.; Miyamoto, G.; Furuhara, T.; Tschiptschin, A.P.; Goldenstein, H. Phase transformation mechanisms during of a ductile cast iron. Acta Mater. 2019, 179, 1–16. [Google Scholar] [CrossRef]
  10. Sahin, Y.; Erdogan, M.; Cerah, M. Effect of martensite volume fraction and tempering time on abrasive wear of ferritic ductile iron with dual matrix. Wear 2008, 265, 196–202. [Google Scholar] [CrossRef]
  11. Kocatepe, K.; Cerah, M.; Erdogan, M. Effect of martensite volume fraction and its morphology on the tensile properties of ferritic ductile iron with dual matrix structures. J. Mater. Process. Technol. 2006, 178, 44–51. [Google Scholar] [CrossRef]
  12. Wu, H.D.; Miyamoto, G.; Yang, Z.G.; Zhang, C.; Chen, H.; Furuhara, T. Incomplete bainite transformation in Fe-Si-C alloys. Acta Mater. 2017, 133, 1–9. [Google Scholar] [CrossRef]
  13. Veerababu, R.; Satya Prasad, K.; Phani, S.K.; Balamuralikrishnan, R.; Karthikeyan, S. Austenite stability and M2C carbide decomposition in experimental secondary hardening ultra-high strength steels during high temperature austenitizing treatments. Mater. Charact. 2018, 144, 191–204. [Google Scholar] [CrossRef]
  14. Zhou, W.; Northwood, D.O.; Liu, C. A steel-like unalloyed multiphase ductile iron. J. Mater. Res. Technol. 2021, 15, 3836–3849. [Google Scholar] [CrossRef]
  15. Clarke, A.J.; Speer, J.G.; Miller, M.K.; Hackenberg, R.E.; Edmonds, D.V.; Matlock, D.K. Carbon partitioning to austenite from martensite or bainite during the quench and partition (Q&P) process: A critical assessment. Acta Mater. 2008, 56, 16–22. [Google Scholar]
  16. Ravi, A.M.; Sietsma, J.; Santofimia, M.J. The role of grain-boundary cementite in bainite formation in high-carbon steels. Scr. Mater. 2020, 185, 7–11. [Google Scholar] [CrossRef]
  17. Nishikawa, A.S.; Santofimia, M.J.; Sietsma, J.; Goldenstein, H. Influence of bainite reaction on the kinetics of carbon redistribution during the Quenching and Partitioning process. Acta Mater. 2018, 142, 142–151. [Google Scholar] [CrossRef] [Green Version]
  18. Fontanari, V.; Benedetti, M.; Girardi, C.; Giordanino, L. Investigation of the lubricated wear behavior of ductile cast iron and quenched and tempered alloy steel for possible use in worm gearing. Wear 2016, 350, 68–73. [Google Scholar] [CrossRef]
  19. Morsdorf, L.; Emelina, E.; Gault, B.; Herbig, M.; Tasan, C.C. Carbon redistribution in quenched and tempered lath martensite. Acta Mater. 2021, 205, 116521. [Google Scholar] [CrossRef]
  20. Tao, Q.; Wang, J.; Galindo-Nava, E.I. Effect of low-temperature tempering on confined precipitation and mechanical properties of carburised steels. Mater. Sci. Eng. A 2021, 822, 141688. [Google Scholar] [CrossRef]
  21. Sun, C.; Liu, S.L.; Misra, R.D.K.; Li, Q.; Li, D.H. Influence of intercritical tempering temperature on impact toughness of a quenched and tempered medium-Mn steel: Intercritical tempering versus traditional tempering. Mater. Sci. Eng. A 2018, 711, 484–491. [Google Scholar] [CrossRef]
  22. Li, J.; Zhang, C.; Liu, Y. Influence of carbides on the high-temperature tempered martensite embrittlement of martensitic heat-resistant steels. Mater. Sci. Eng. A 2016, 670, 256–263. [Google Scholar] [CrossRef]
  23. Li, S.; He, M.; Hu, G.; Tian, Y.; Wang, C.; Jing, B.; Ping, D. Pearlite formation via martensite. Compos. Part B Eng. 2022, 238, 109859. [Google Scholar] [CrossRef]
  24. Zhang, N.; Zhang, J.; Lu, L.; Zhang, M.; Zeng, D.; Song, Q. Wear and friction behavior of austempered ductile iron as railway wheel material. Mater. Des. 2016, 89, 815–822. [Google Scholar] [CrossRef]
  25. Du, Y.; Gao, X.; Wang, X.; Wang, X.; Ge, Y.; Jiang, B. Tribological behavior of austempered ductile iron (ADI) obtained at different austempering temperatures. Wear 2020, 456–457, 203396. [Google Scholar] [CrossRef]
  26. Akinribide, O.J.; Akinwamide, S.O.; Obadele, B.A.; Ogundare, O.D.; Ayeleru, O.O.; Olubambi, P.A. Tribological behaviour of ductile and austempered grey cast iron under dry environment. Mater. Today Proc. 2020, 38, 1174–1182. [Google Scholar] [CrossRef]
  27. Archard, J.F. Contact and rubbing of flat surfaces. J. Appl. Phys. 1953, 24, 981–988. [Google Scholar] [CrossRef]
  28. Stachowiak, A.; Wieczorek, A.N. Comparative tribocorrosion tests of 30CrMo12 cast steel and ADI spheroidal cast iron. Tribol. Int. 2021, 155, 106763. [Google Scholar] [CrossRef]
  29. Kayali, Y.; Yalçin, Y.; Taktak, Ş. Adhesion and wear properties of boro-tempered ductile iron. Mater. Des. 2011, 32, 4295–4303. [Google Scholar] [CrossRef]
  30. Xu, C.J.; Xu, X.F.; Zhao, Z.; Ma, M.; Zhang, Z.M.; Liu, Y.H. Horizontal Continuous Casting Technology of Cast Iron and Application of Dense Bars. Foundry Technol. 2017, 38, 2559–2564. [Google Scholar]
  31. Sun, C.; Fu, P.-X.; Ma, X.-P.; Liu, H.-H.; Du, N.-Y.; Cao, Y.-F.; Liu, H.; Li, D. Effect of matrix carbon content and lath martensite microstructures on the tempered precipitates and impact toughness of a medium-carbon low-alloy steel. J. Mater. Res. Technol. 2020, 9, 7701–7710. [Google Scholar] [CrossRef]
  32. Sun, J.; Jiang, T.; Wang, Y.; Guo, S.; Liu, Y. Effect of grain refinement on high-carbon martensite transformation and its mechanical properties. Mater. Sci. Eng. A 2018, 726, 342–349. [Google Scholar] [CrossRef]
  33. Rashidi, A.M.; Moshrefi-Torbati, M. Effect of tempering conditions on the mechanical properties of ductile cast iron with dual matrix structure (DMS). Mater. Lett. 2000, 45, 203–207. [Google Scholar] [CrossRef] [Green Version]
  34. Pereira, L.; do Amaral, R.F.; Wolfart, M.; de Barcellos, V.K. Microstructural and mechanical properties of Cu-Ni-Mn-Mo austempered ductile iron obtained from two-step hot air austempering. J. Mater. Res. Technol. 2020, 9, 3055–3063. [Google Scholar] [CrossRef]
  35. Melado, A.C.; Nishikawa, A.S.; Goldenstein, H.; Giles, M.A.; Reed, P.A.S. Effect of microstructure on fatigue behaviour of advanced high strength ductile cast iron produced by quenching and partitioning process. Int. J. Fatigue 2017, 104, 397–407. [Google Scholar] [CrossRef] [Green Version]
  36. Andriollo, T.; Zhang, Y.; Fæster, S.; Kouznetsova, V. Analysis of the correlation between micro-mechanical fields and fatigue crack propagation path in nodular cast iron. Acta Mater. 2020, 188, 302–314. [Google Scholar] [CrossRef] [Green Version]
  37. Du, Y.; Wang, X.; Zhang, D.; Wang, X.; Ju, C.; Jiang, B. A superior strength and sliding-wear resistance combination of ductile iron with nanobainitic matrix. J. Mater. Res. Technol. 2021, 11, 1175–1183. [Google Scholar] [CrossRef]
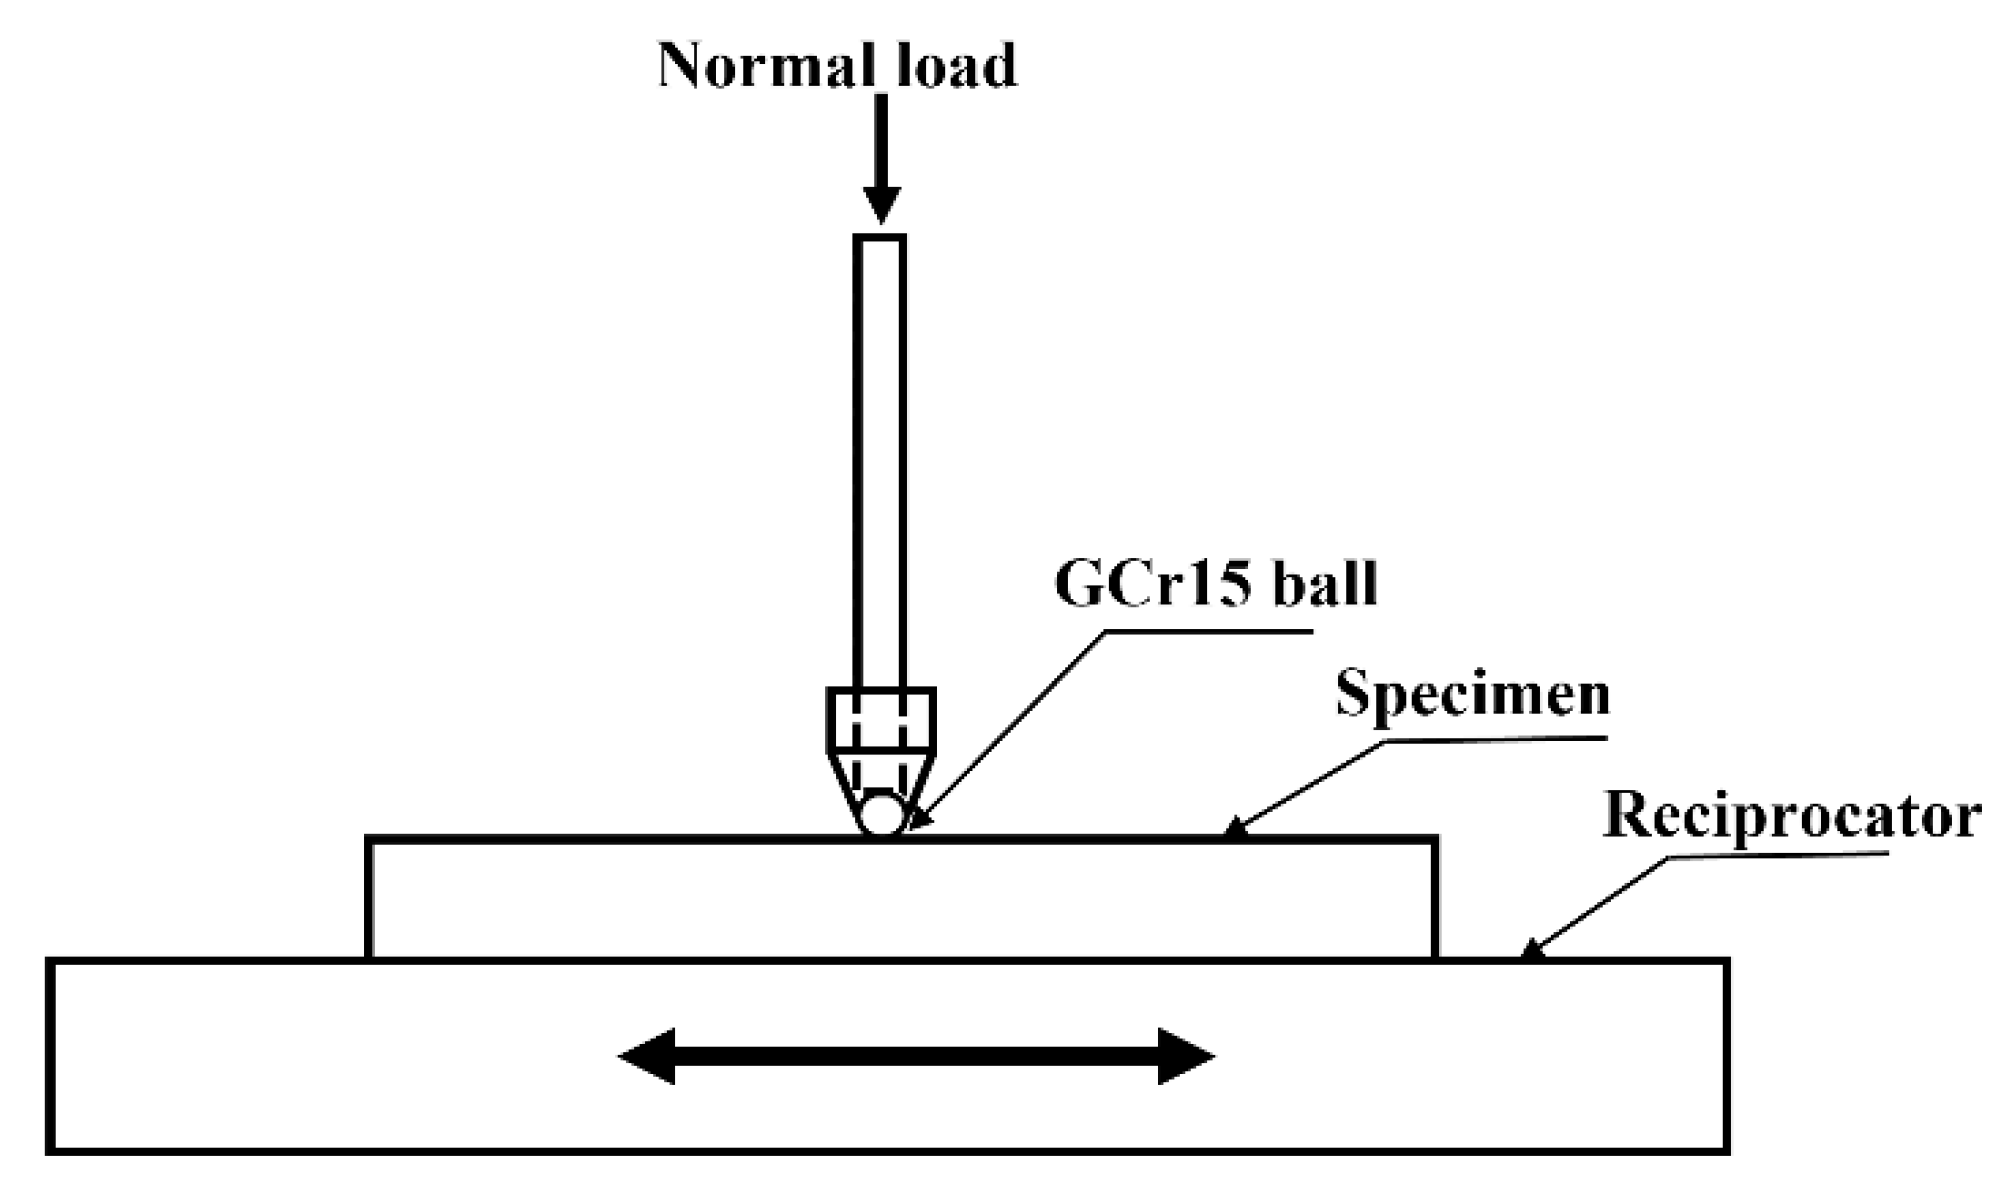
Figure 1. Schematic diagram of ball-on-disk tribotester.
Lubricants 10 00326 g001
Figure 2. SEM images of the as-cast ductile iron with (a) low and (b) high magnifications.
Lubricants 10 00326 g002
Figure 3. Optical images of the samples tempered at (a) 420 °C, (b) 500 °C, and (c) 580 °C.
Lubricants 10 00326 g003
Figure 4. SEM images of oil-quenched specimens tempered at (a,d) 420 °C, 500 °C (b,e), and (c,f) 580 °C.
Lubricants 10 00326 g004
Figure 5. XRD patterns of the tempered samples.
Lubricants 10 00326 g005
Figure 6. (a) The typical stress-strain curves of the tempered samples and (b) variation of mechanical properties with tempering temperature.
Lubricants 10 00326 g006
Figure 7. Fracture surfaces of the samples tempered at (a,d) 420 °C, (b,e) 500 °C, and (c,f) 580 °C for 60 min.
Lubricants 10 00326 g007
Figure 8. Friction coefficient curves of the sample tempered at (a) 420 °C, (b) 500 °C, and (c) 580 °C.
Lubricants 10 00326 g008
Figure 9. Variation of friction coefficient at steady stage of samples at different tempered temperature with different loads.
Lubricants 10 00326 g009
Figure 10. Optical images of worn surface of the tempered ductile iron under different loads: T-420: (a) 10 N, (b) 15 N and (c) 20 N; T-500: (d) 10 N, (e) 15 N and (f) 20 N; T-580: (g) 10 N, (h) 15 N, and (i) 20 N.
Lubricants 10 00326 g010
Figure 11. Variation of wear rate of ductile iron at different tempering temperatures with the increase of loads.
Lubricants 10 00326 g011
Figure 12. SEM images of worn surface of ductile iron at different tempering temperatures under different loads: T-420: (a) 10 N, (b) 15 N and (c) 20 N; T-500: (d) 10 N, (e) 15 N and (f) 20 N; T-580: (g) 10 N, (h) 15 N, and (i) 20 N.
Lubricants 10 00326 g012
Figure 13. The worn area formed at counter grinding GCr15 steel ball: (a) low magnification, (b) high magnification, and (c) the energy spectrum of the A region in (b).
Lubricants 10 00326 g013
Publisher’s Note: MDPI stays neutral with regard to jurisdictional claims in published maps and institutional affiliations.