Article

Measurement of Piston Pin-Bore Oil Film Pressure under Engine Operation

1
Division of Mechanics, Graduate School of Tokyo City University, 1-28-1, Tamazutsumi, Setagaya-ku, Tokyo 158-8557, Japan
2
Sustainable Engine Research Center Co., Ltd., 1-33, Yayoicho, Inage-ku, Chaba-shi, Chiba 263-8522, Japan
3
Department of Mechanical Engineering, Tokyo City University, 1-28-1, Tamazutsumi, Setagaya-ku, Tokyo 158-8557, Japan
4
Art Metal MFG. Co., Ltd., 2-2-43, Tokiwagi, Ueda-shi, Nagano 386-0027, Japan
*
Author to whom correspondence should be addressed.
Lubricants 2022, 10(10), 258; https://doi.org/10.3390/lubricants10100258
Submission received: 5 September 2022 / Revised: 20 September 2022 / Accepted: 10 October 2022 / Published: 13 October 2022
(This article belongs to the Special Issue Friction and Wear of Coatings/Films)

Abstract

:
Thin-film sensors were used to measure the oil film pressure distribution at the piston pin-bore interface in order to ascertain the stress distribution on the piston pin of a gasoline engine during actual operation. Thin-film sensors have been manufactured by a sputtering method to a total film thickness of about 3–6 μm. The features of thin-film sensors have been utilized to successfully measure the oil film pressure on engine main bearings, connecting rod bearings and piston skirts of both diesel and gasoline automotive engines. However, as engine lubrication conditions have become more severe year by year, it has become necessary to develop thin-film pressure sensors with higher durability. The use of diamond-like carbon (DLC) coating for the protective film of the thin-film sensor has enabled accurate measurement of oil film pressure under engine operating conditions. The AVL EXCITETM Power Unit was used in simulations with the application of elastic fluid lubrication theory. The calculated values were compared with measured data, and a comparison was made of the effect of the model constraint condition.

1. Introduction

Internal combustion engines have been required to provide cleaner exhaust emissions and higher fuel economy in recent years. At the same time, hybrids and plug-in hybrids will increase the number of electrified parts, requiring further downsizing of the engine itself. Consequently, it is expected that piston pin bore will experience higher surface pressures and temperatures owing to increased maximum cylinder pressure and reduced bearing surface area. These parts have so far been designed on the basis of experience and theoretical calculations, such as those conducted with computer-aided engineering (CAE) software [1,2]. Further improvement of CAE capabilities requires accurate comparisons with corresponding experimental data. Automobile engines have many sliding parts, and various tribological problems such as friction loss reduction to improve thermal efficiency, oil consumption, wear, and seizure that are contradictory phenomena for friction reduction. Designs are needed that can optimally balance these issues at low friction levels without causing abnormal noise or reliability problems. This is why predictive studies based on CAE simulations are indispensable. From the development of fundamental technologies to the engineering of products, it is necessary to be able to determine specifications enabling engine operation under optimal lubrication conditions, based on accurate theoretical predictions of lubrication regimes under wide-ranging operating conditions.
Based on this background, our laboratory has been engaged in the development of thin-film sensors. These thin-film sensors have a metal film resistor of approximately 5 μm in thickness and are characterized by inducing virtually no shape or rigidity changes in the object being measured. To date, these thin-film sensors have been successfully applied to measure the oil film pressure on main bearings [3,4,5], big-end bearings [5,6], and piston skirts [7,8,9,10] where clearances are narrow, and measurements are difficult to obtain. In this study, in which unit fatigue tests were conducted on the piston pin bore, thin-film sensors were formed on the piston pin to successfully measure the oil film pressure at three positions. Subsequently, tests were conducted under harsh engine operating conditions that made it extremely difficult to perform measurements [11,12,13]. The reason for this difficulty in measuring oil film pressure under engine operating conditions was that the thin-film sensor had durability problems due to film damage and peeling caused by metal particles in the oil under high surface pressure. With the aim of solving this problem, we focused on DLC, which has been reported to improve durability in many applications to internal combustion engine parts [14,15,16,17,18]. We improved the durability of the thin-film sensor using DLC and successfully measured the oil film pressure on the piston pin during actual engine operation. This paper describes the substantial improvement of the application range of thin-film pressure sensors resulting from that success.

2. EHL Simulation of Piston Pin-Bore Oil Film Pressure

The AVL EXCITETM Power Unit was used to conduct oil film pressure simulations, and the results were then compared with the experimental values. The conditions simulating the unit fatigue tester used in this study are shown in Figure 1. Finite element (FE) models of the piston and piston pin were created, and a degeneration model was used in evaluating the sliding surface deformation induced by contact pressure between the oil film and surface roughness. Measured physical values were input for the surface properties between the two contacting objects: the piston and the piston pin. The cylinder pressure and inertial force obtained in engine operating tests were input as the loading conditions. An elastohydrodynamics (EHD) joint was applied between the piston and piston pin, and between the piston pin and the connecting rod small end. The same two joints were set up between the piston and the piston pin to apply joints to the front and rear sides, respectively.
The modified Reynolds equation (Equation (1)) proposed by Patir and Cheng, which takes into account the effect of surface roughness, was used in the fluid lubrication evaluation [19,20]. The measured pressure acting on the outer circumference of the piston pin bore in the tests was defined as the boundary condition. The surface roughness contact model [21] shown in Equation (2), which was proposed by Greenwood and Tripp, was used in evaluating contact with surface asperities. In the engine tests, the oil film pressure was measured using the anti-rotation bracket shown in Figure 7 and described in Section 3.4. To replicate this, in the simulation model in Figure 1, the piston and piston pin were restrained using a spring element as an FTAB (force table) joint. Because the actual stiffness of the anti-rotation mechanism was unknown, it was assumed to be 10 N/mm based on a correlation with the experimental results.
x ( φ x h 3 12 η p ¯ x ) + y ( φ y h 3 12 η p ¯ y ) = U 2 h T x + U σ 2 φ s x + h T t
p a ( h ) = 16 2 π 15 ( σ s β η s ) 2 E * ( σ s β ) F 5 2 ( h σ s )
  • h : Nominal oil film thickness
  • h T : Local oil film thickness
  • p ¯ : Mean hydrodynamic pressure
  • η : Viscosity
  • U : Sliding velocity
  • σ : Combined roughness
  • φ x , φ y : Pressure flow factor
  • φ s : Shear flow factor
  • p a : Contact pressure
  • σ s : Standard devitations of combined roughness
  • β : Peak radius at surface summit
  • η s : Surface density of asperity peaks on each surface
  • E * : Composite young’s modulus in contact area
  • F 5 2 : Contact load by shape factor

3. Experimental Equipment and Methodology

3.1. Engine Specifications and Experimental System

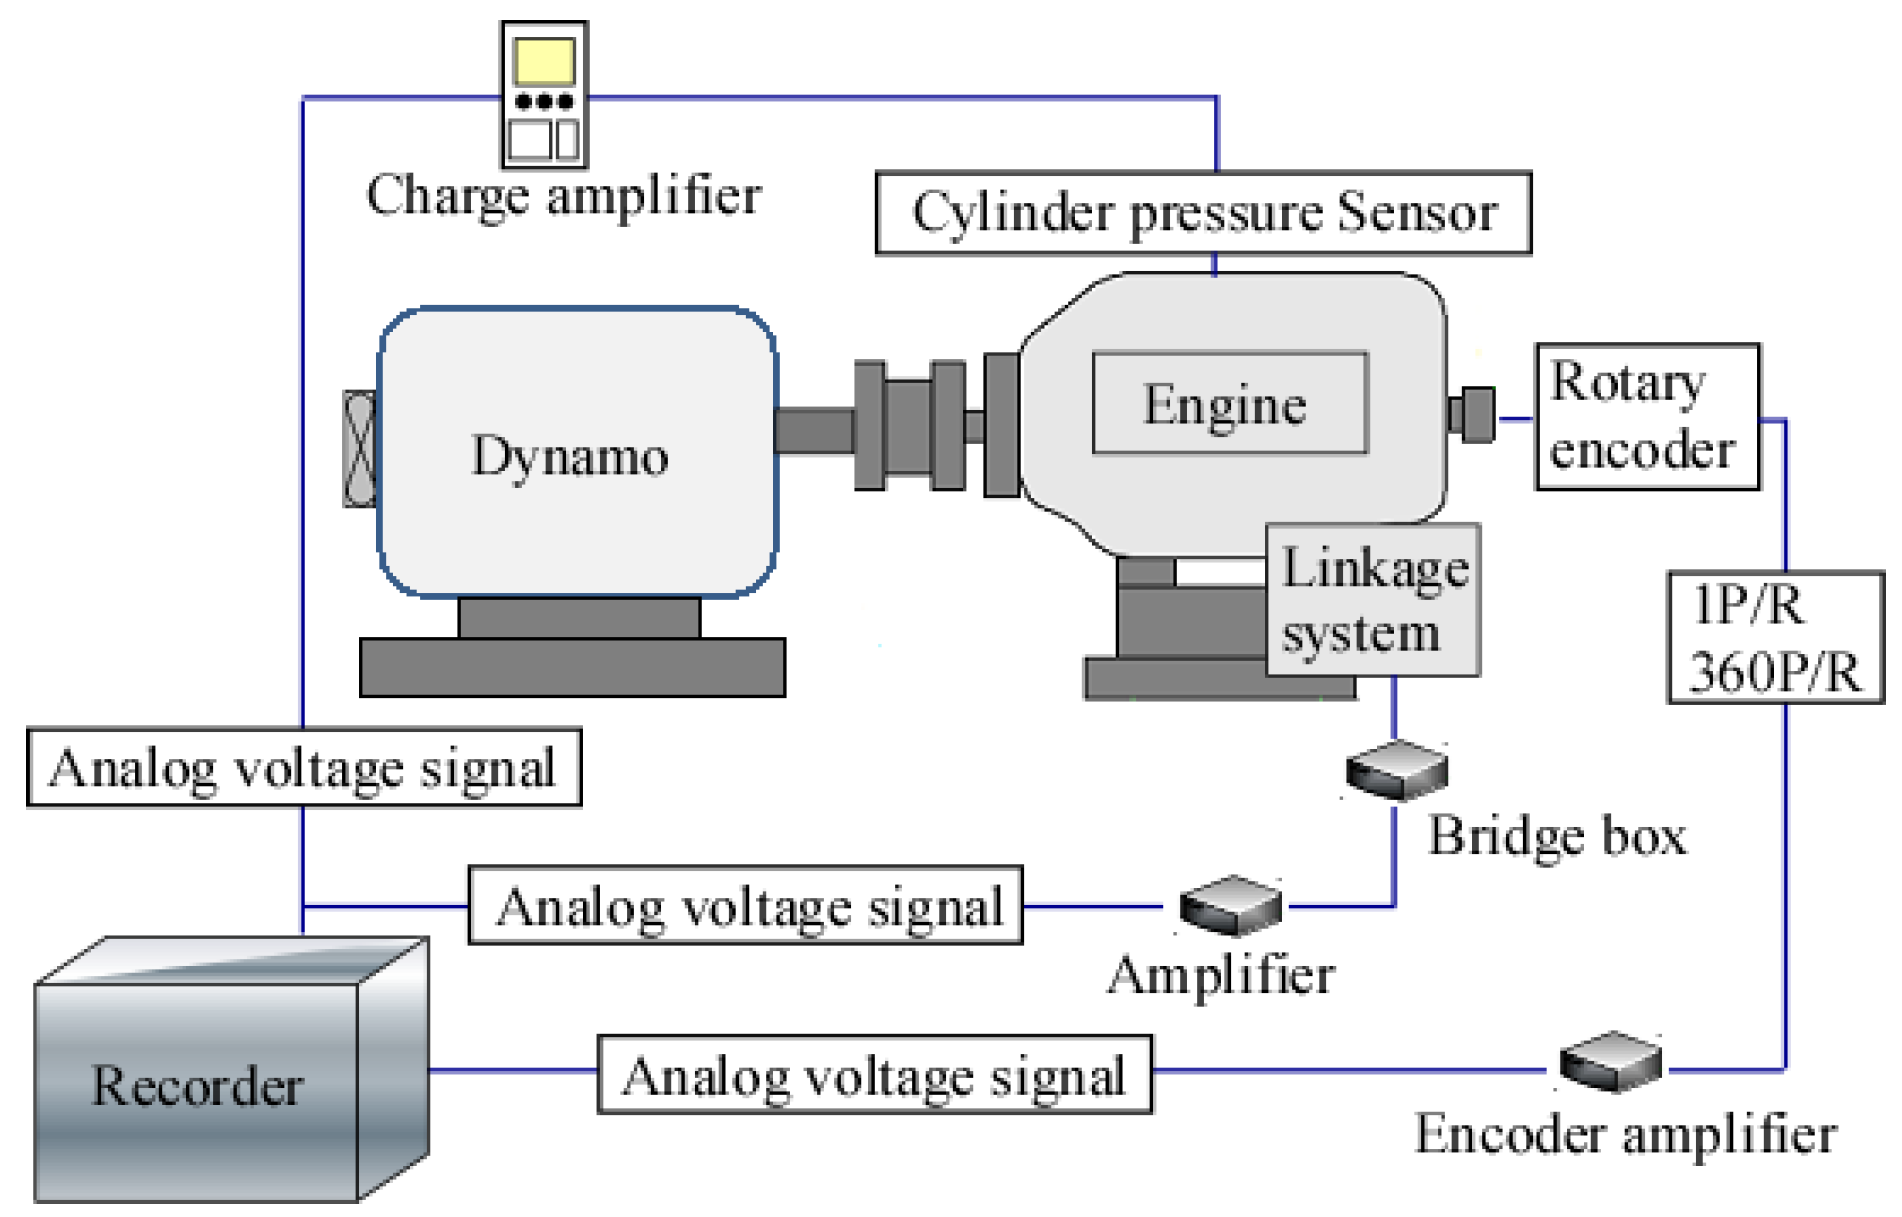
Tests were conducted using a 4-cylinder gasoline engine (made in Japan) with the specifications shown in Table 1. The piston had a 90 mm bore, and the piston pin was 22 mm in diameter and 62 mm long. Thin-film pressure sensors were fabricated on the piston pin. Figure 2 shows the configuration of the experimental system. The signals of the thin-film sensors fabricated on the piston pin were extracted via a cable through a linkage system outside the engine. The cylinder pressure, oil and water temperatures, timing marks and other data were recorded simultaneously. The operating conditions of the test engine are shown in Table 2. Three engine speed levels were defined: from engine start to idling at 1000 rpm, partial load at 2000 rpm and full load at 3000 rpm. The oil and water temperatures rose naturally without any control under each set of operating conditions.

3.2. Structure of Thin-Film Pressure Sensors and Fabricated Positions

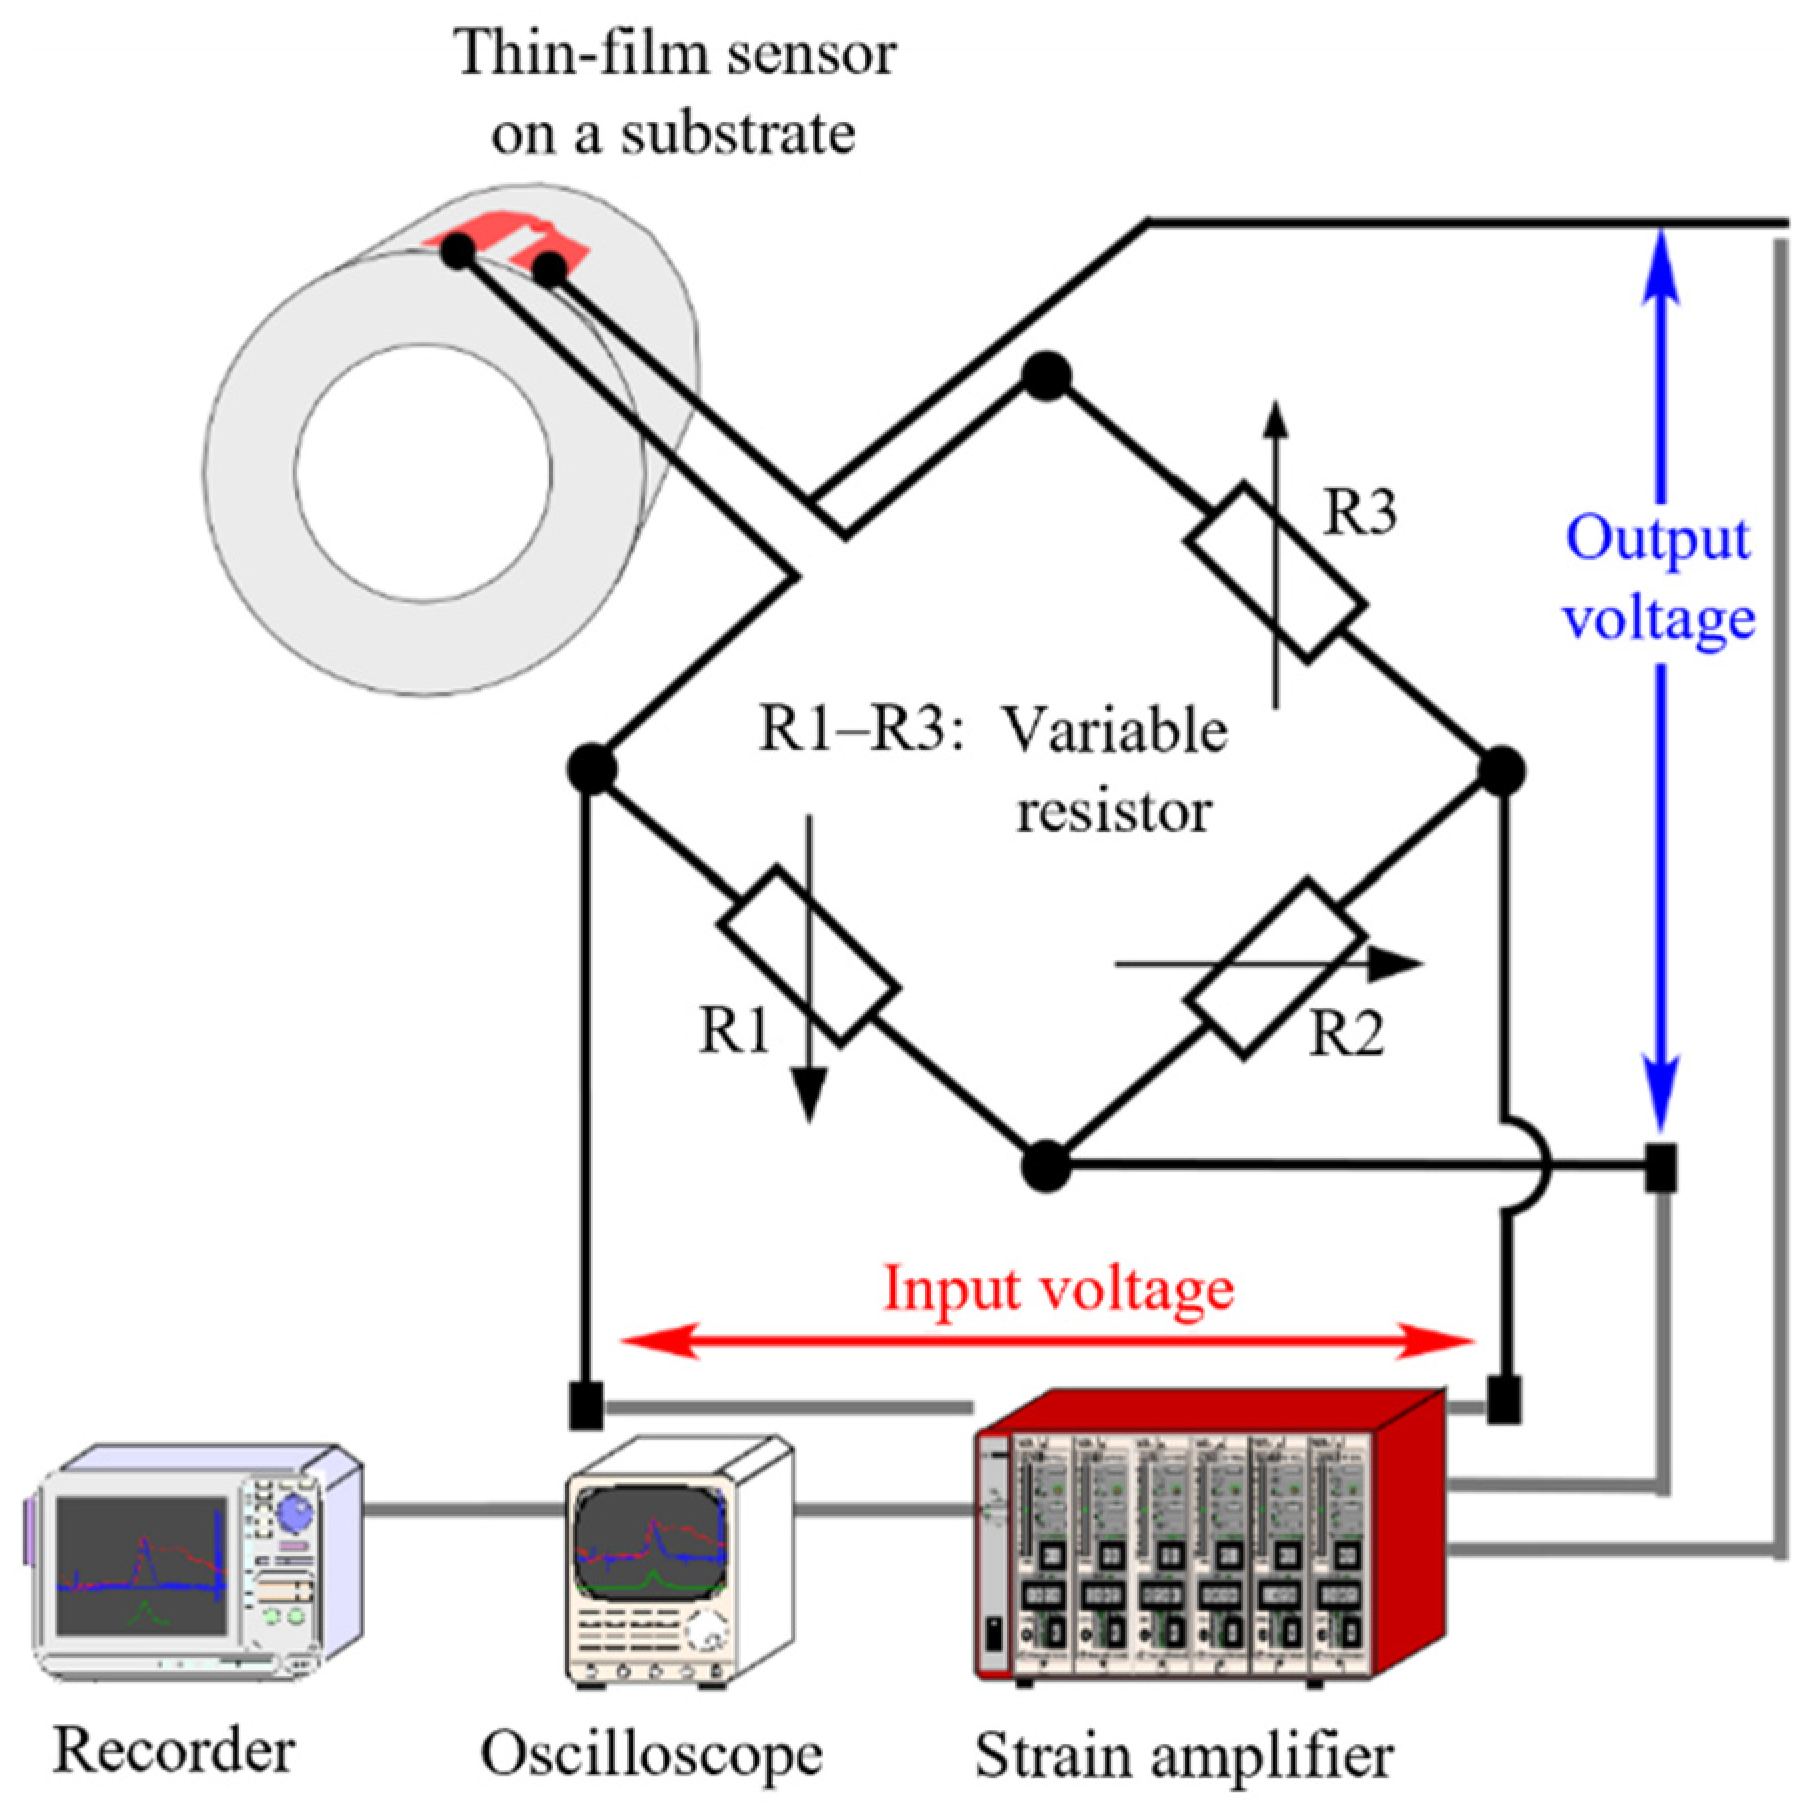
Figure 3 shows the measurement system of the thin-film sensor. The pressure sensing part of the thin-film sensor is a resistance element made of an alloy of about 120 Ω to 500 Ω. Due to the principle that the electrical resistivity of the alloy changes according to a change in pressure, the electrical resistance of the alloy changes slightly. This resistance change is converted into a voltage change by a Wheatstone bridge circuit and recorded by a data logger. Since the thin-film sensor is formed directly on the measurement surface by physical vapor deposition (sputtering), there is no need to process sensor mounting holes that are required for piezo pressure sensors and pressure transducers. Therefore, it has the advantage of not causing a decrease in the rigidity of the measuring part [6].
Figure 4a shows the sensor geometry. The pressure-sensitive part was 0.8 mm in diameter and consisted of two arcs, each having a line width of 20 μm and connected in the center in the shape of two semi-circles. This geometry was selected to minimize the gauge factor of the thin-film pressure sensor [6]. Figure 4b shows the basic structure of the sensors fabricated on the piston pin of the gasoline test engine. The structure of the thin film sensor is to deposit a 3 μm alumina film on the surface of the pin boss to ensure insulation between the sensor film and the piston pin, and then deposit a 0.2 μm sensor film that senses pressure on this alumina film. In order to prevent functional deterioration due to contact with the piston pin bosses facing this sensor film, DLC was formed as a protective film to a thickness of 2 μm. The total thickness of the sensor was 5.2 μm. In this research, by changing the protective film material from Al2O3 to DLC (diamond-like carbon), the durability of the sensor could be increased significantly.
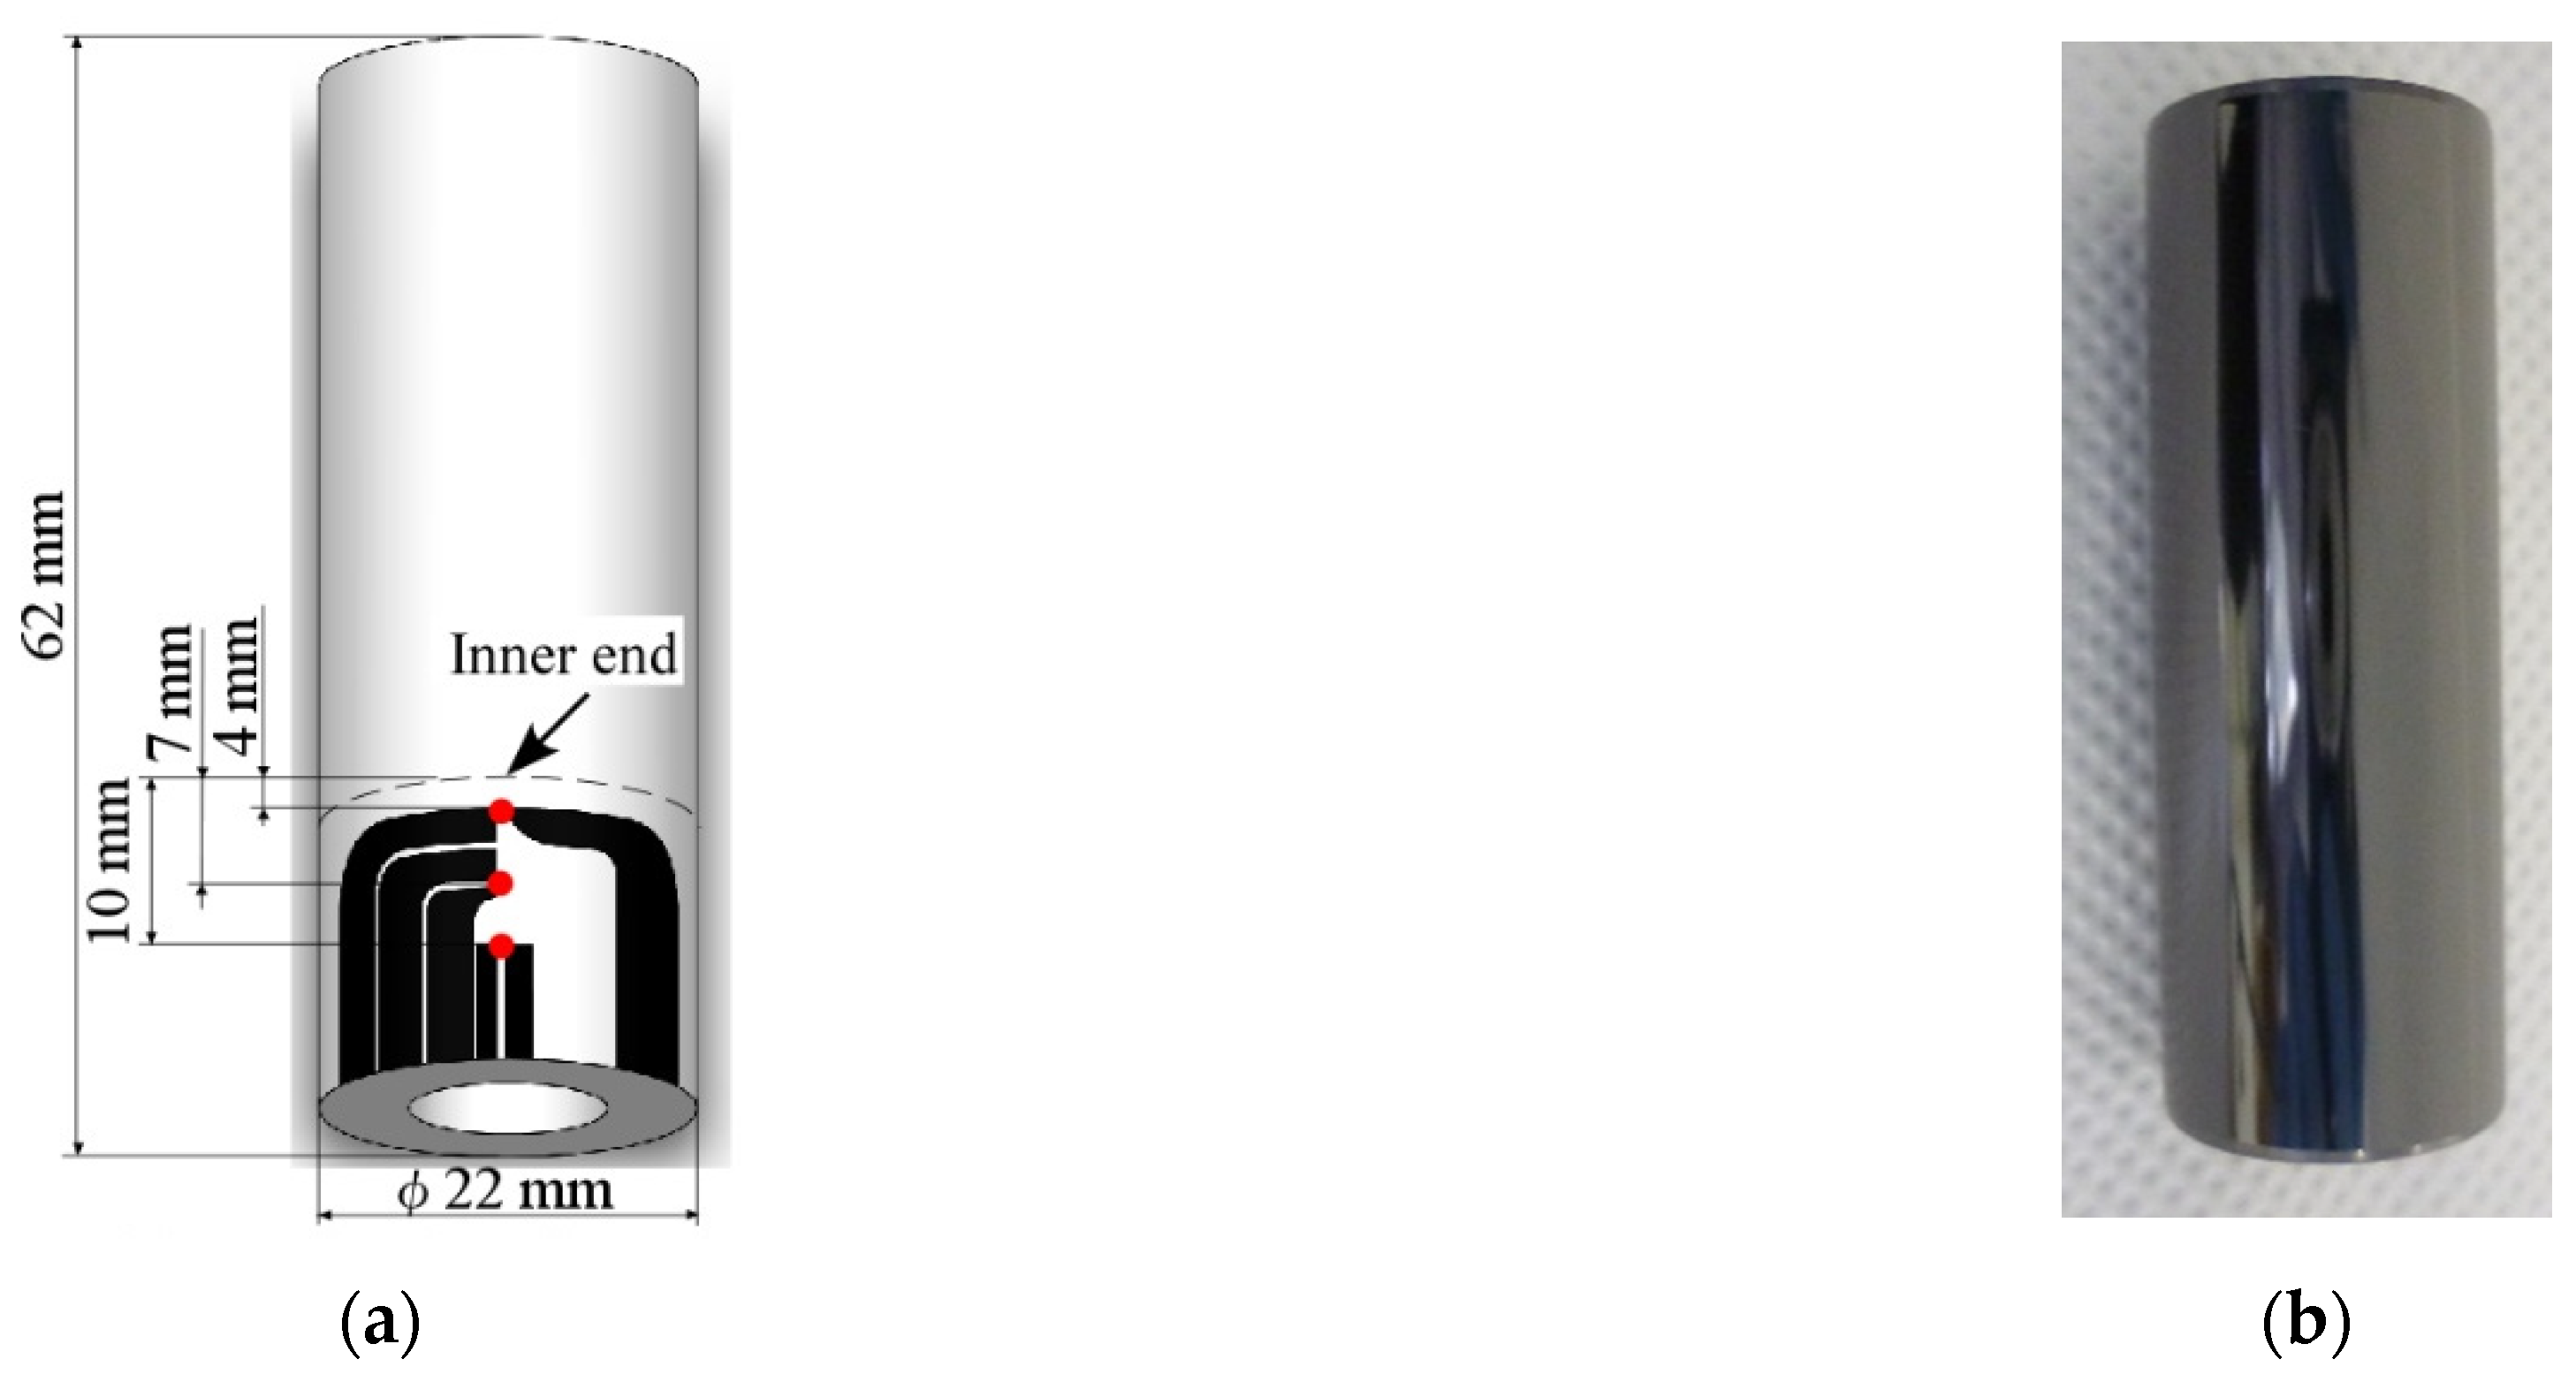
For the sensors used in the engine operating tests, the piston pin diameter was narrowed beforehand, taking into account the total sensor thickness of 5.2 μm, so that the specified piston pin diameter would be obtained after the sensor was fabricated. This was intended to ensure optimal oil clearance between the piston pin and piston pin bore following sensor fabrication. Figure 4c shows the positions of the thin-film sensors fabricated on the piston pin sliding surface and the piston pin-bore geometry. The oil film pressure distribution was measured with thin-film sensors fabricated at three positions: 4, 7 and 10 mm from the inner end of the piston pin bore. The shape of the piston pin bore had a 20 μm taper at its inner end. Figure 5 shows the overall appearance of the piston pin. In the figure, 5(a) shows the sensor design with three sensors positioned at 4, 7 and 10 mm, and 5(b) shows a photo of the overall pressure sensor after the DLC protective film was fabricated. Before evaluation tests were conducted using the linkage mechanism, durability tests were performed on the thin-film sensors fabricated on the piston pin. The test conditions included an engine speed of 6000 rpm, a full load as the upper limit, and 1 h of operation. The results confirmed that there was no peeling of or damage to the thin-film sensors.

3.3. Pressure and Temperature Sensitivities

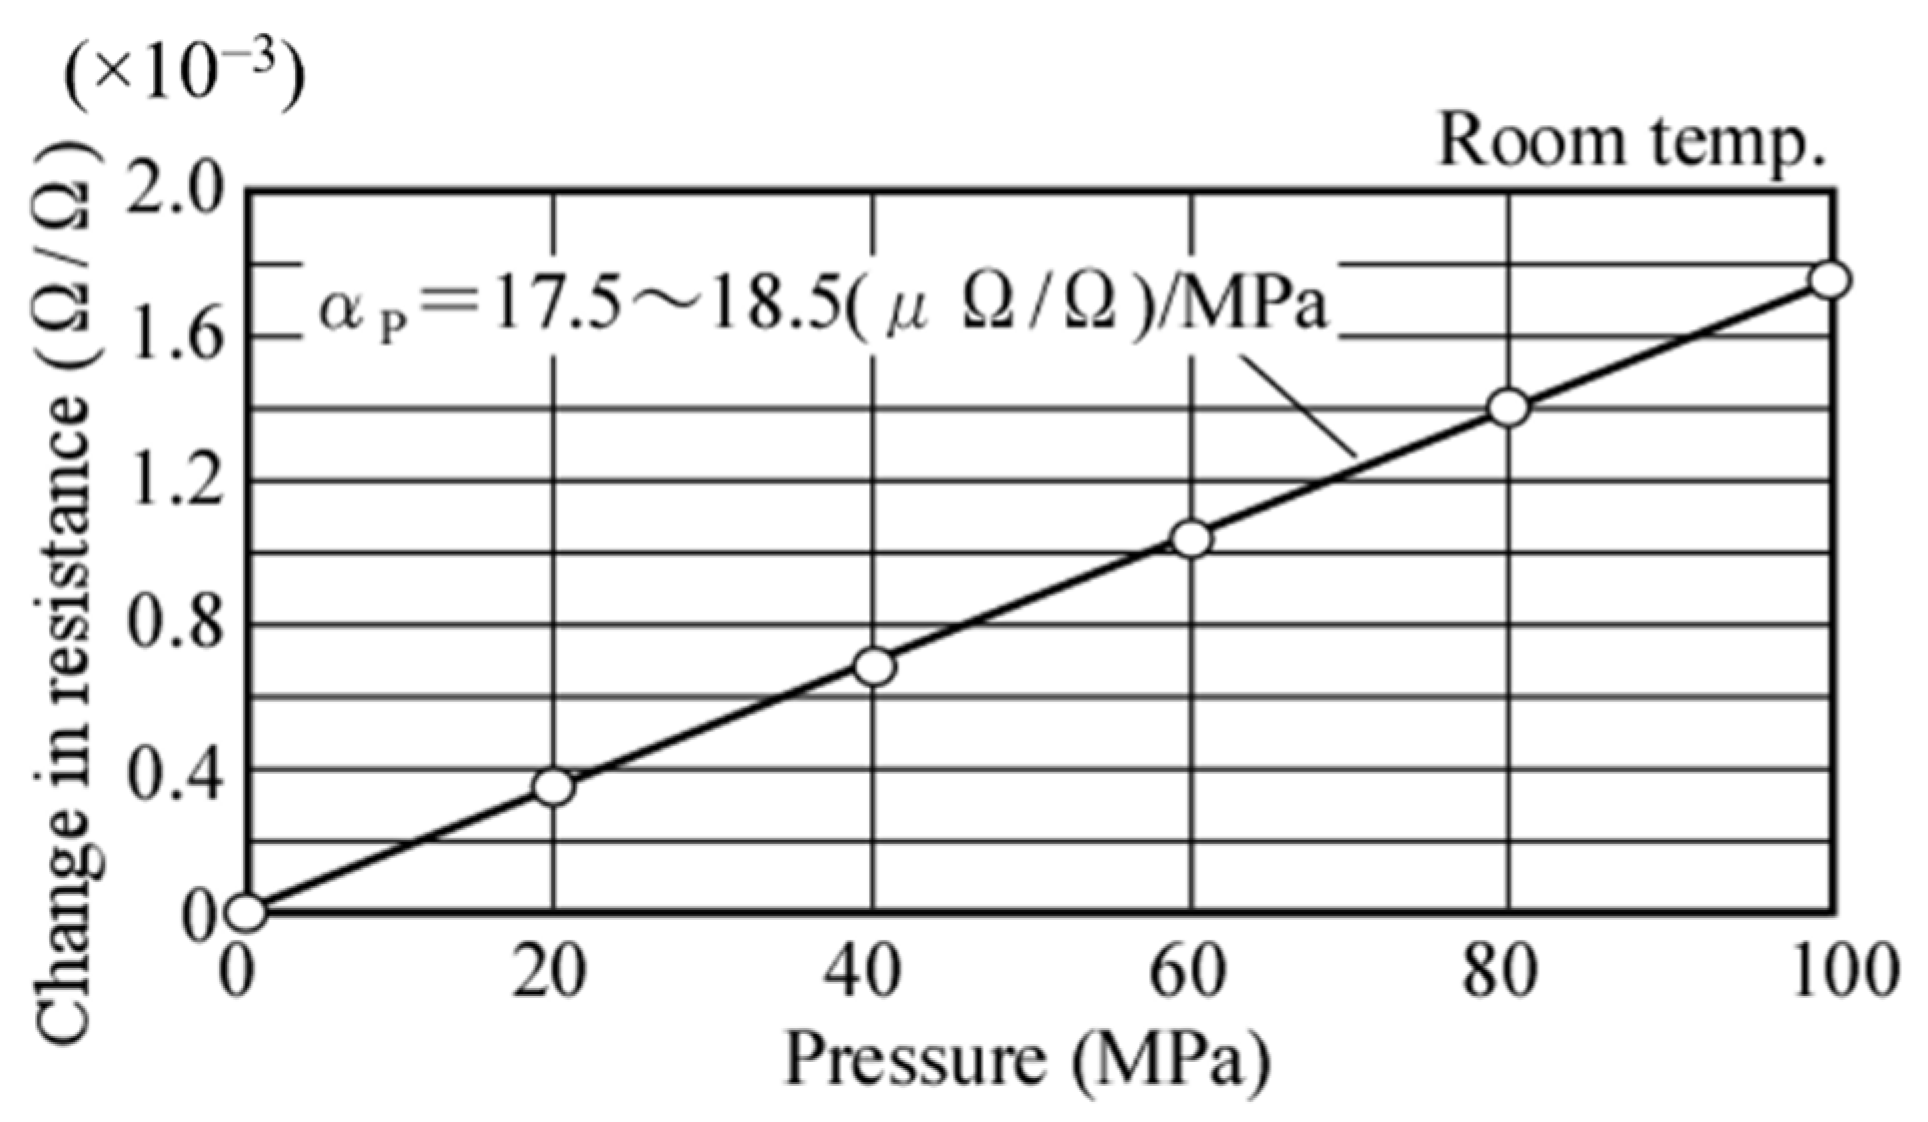
Figure 6 presents the pressure calibration results. The pressure calibration method involved placing the thin-film sensors fabricated on the piston pin in a pressure vessel that was pressurized using an ultrahigh-pressure hydraulic pump. The change in sensor resistance due to the pressure was converted to a voltage variation using a bridge box and a strain amplifier to determine the calibration value. The results in Figure 6 indicate that the thin-film sensors provided pressure sensitivity in a range of αp = 17.5–18.5 μΩ/Ω with nonlinearity and hysteresis of less 1% and temperature sensitivity of αT = −6–−12 (μΩ/Ω)/℃.

3.4. Lubrication Method between Piston and Pin

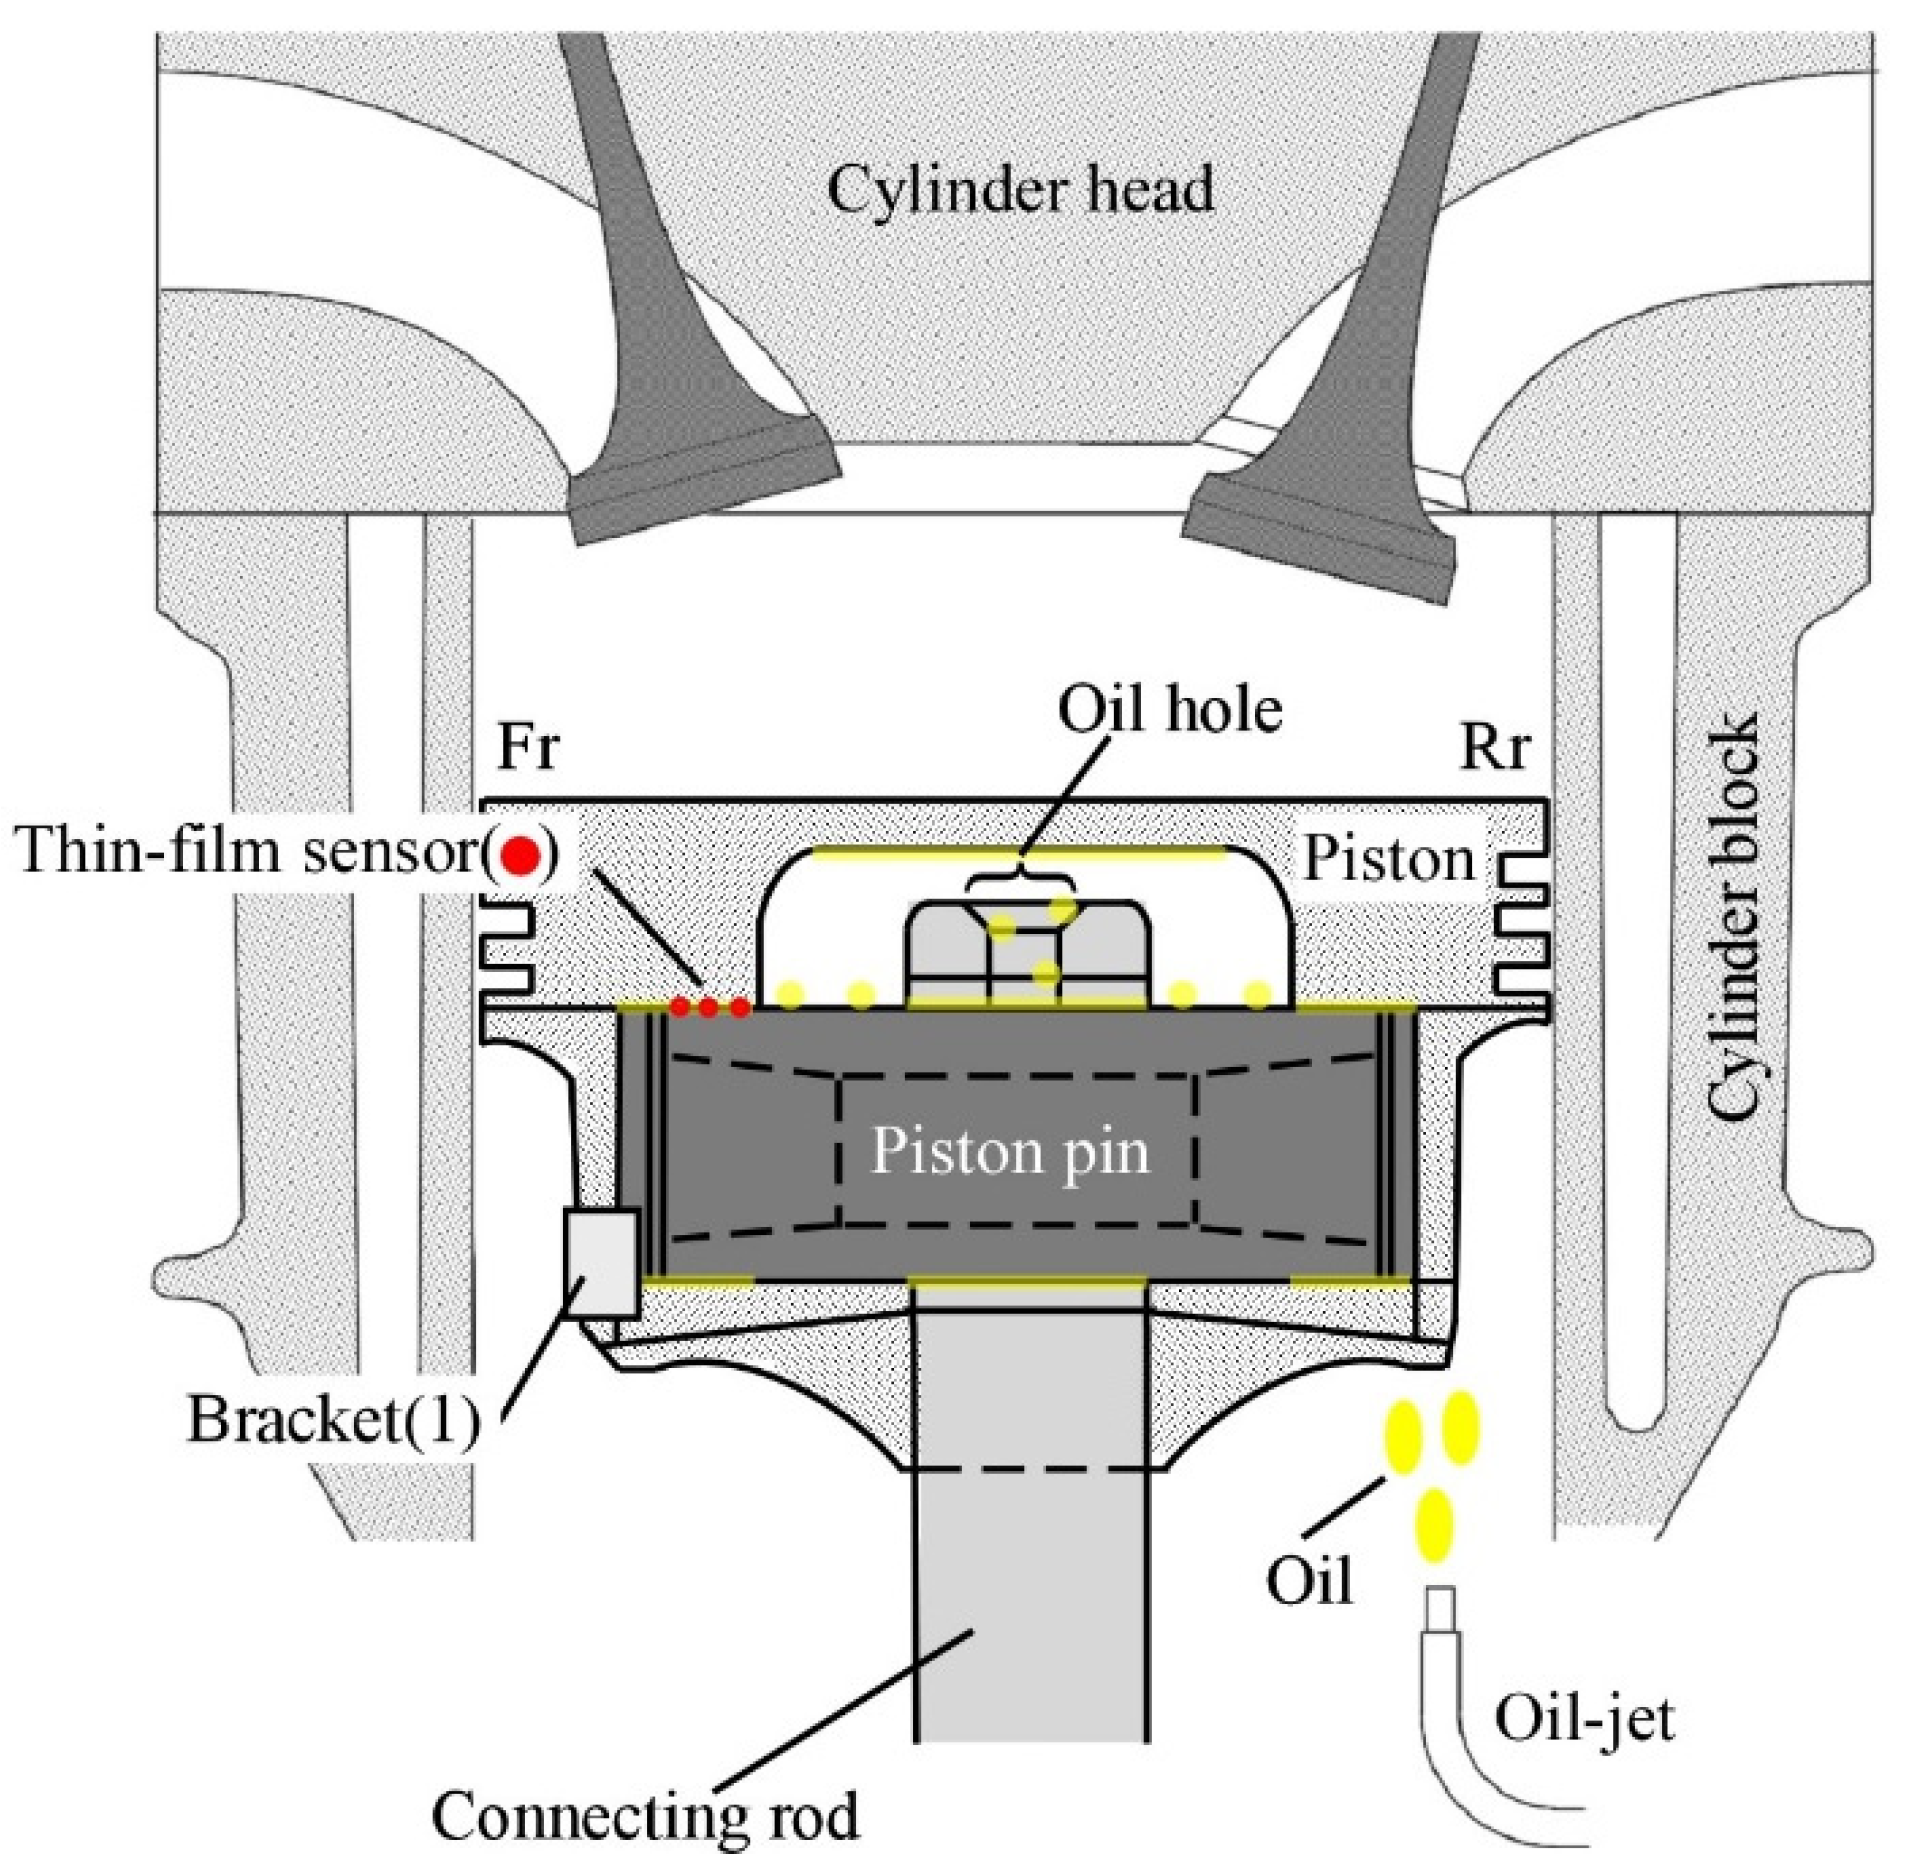
The method used to measure lubrication between the piston and the piston pin is illustrated in Figure 7. The bracket (1) in the figure was used in this study as a means of preventing rotation. The surface of the pin hole must be suitably lubricated to prevent piston pin hole cracking or seizure. Oil was supplied by an oil jet to lubricate the piston and the piston pin, as well as from an oil hole in the connecting rod’s small end and a side relief valve.

4. Experimental Results

4.1. Oil Film Pressure Results Measured with Thin-Film Pressure Sensors

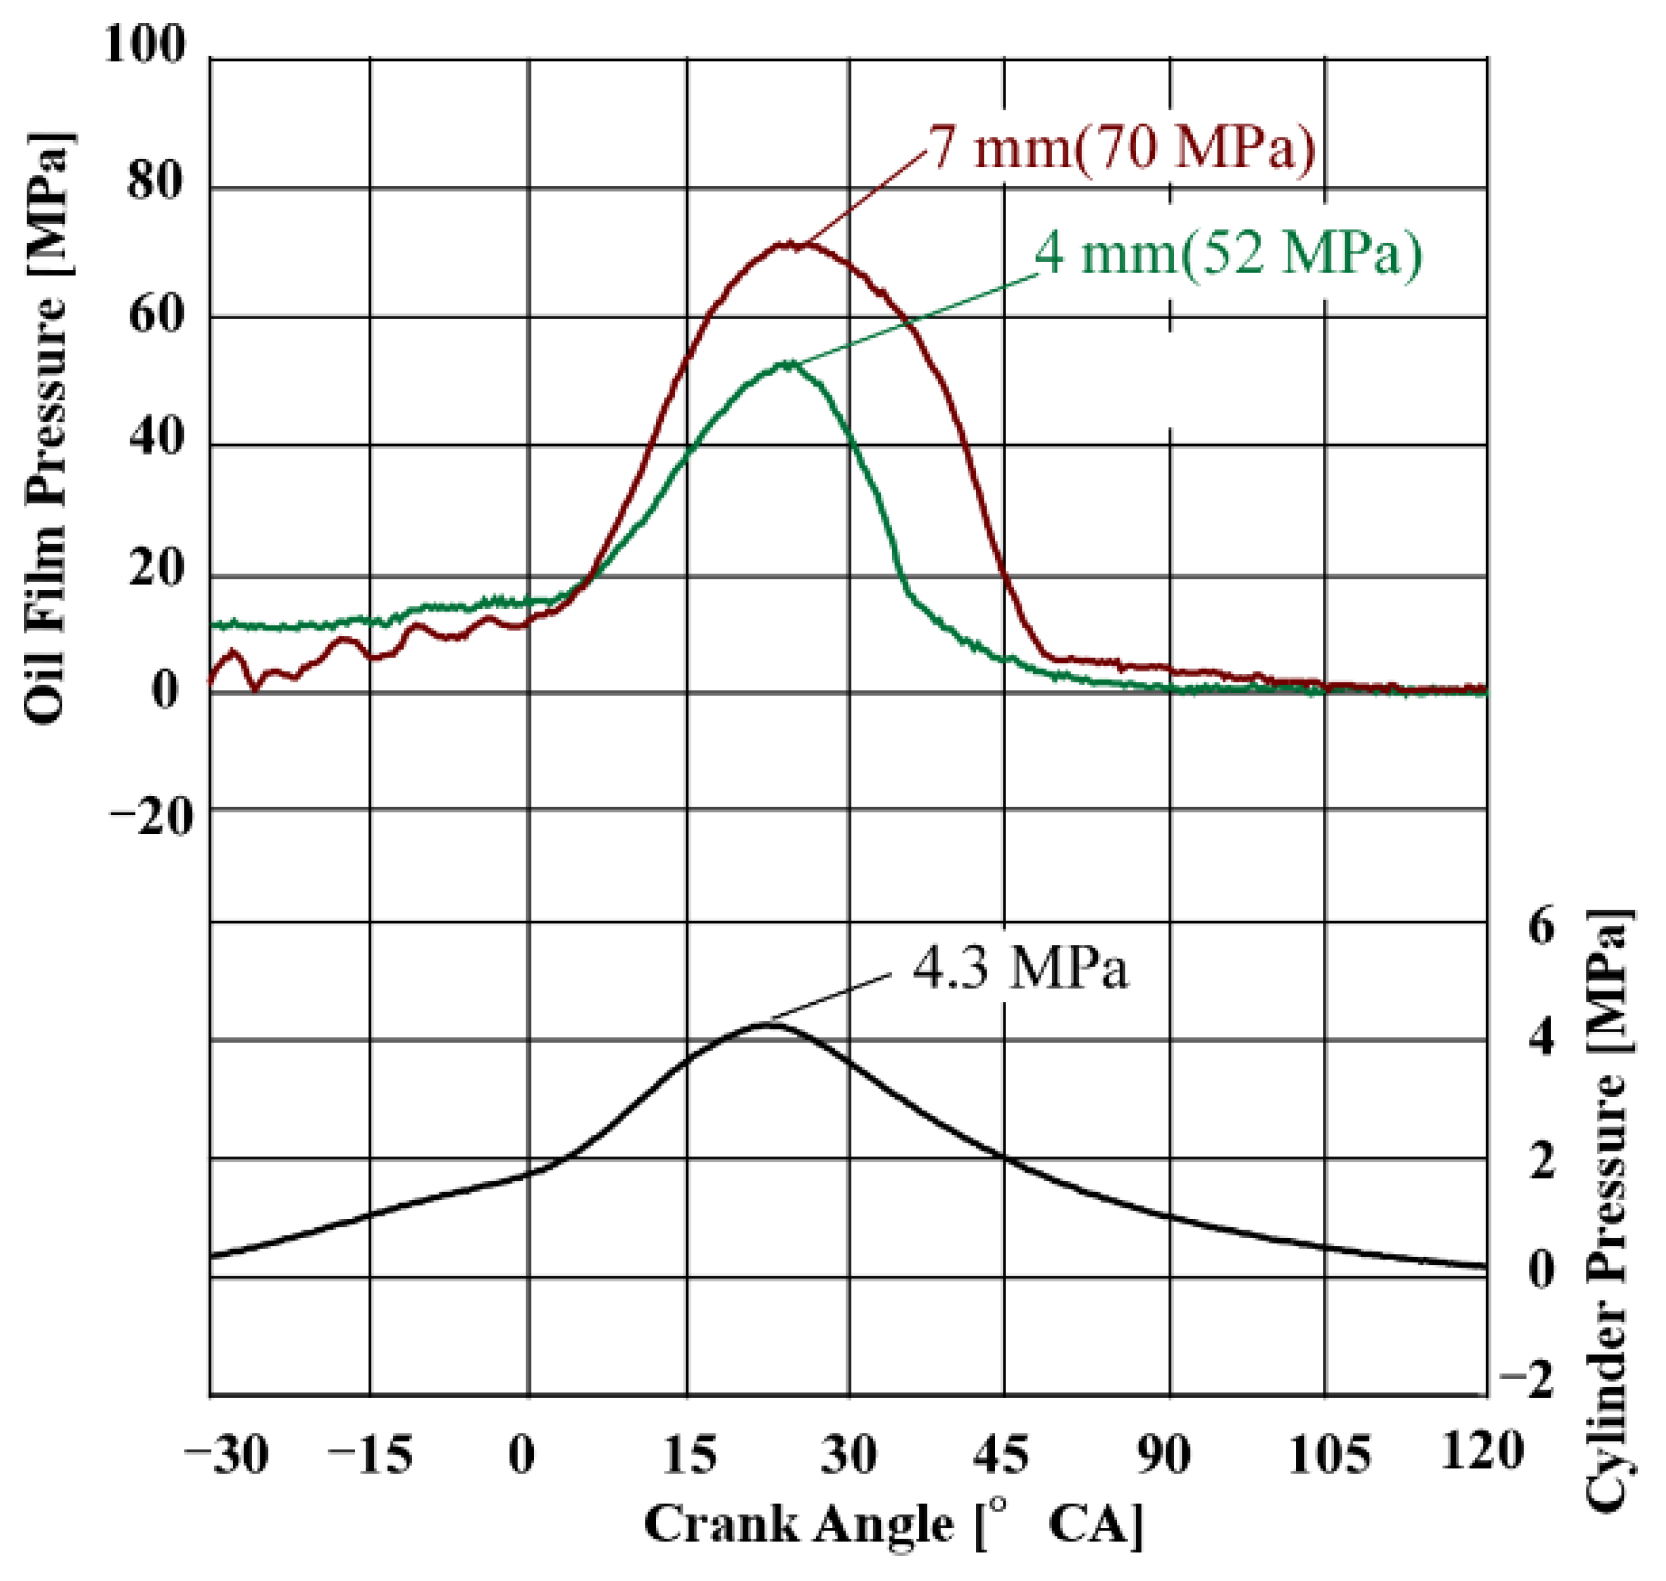
Figure 8 shows the relationship between oil film pressure and cylinder pressure at each sensor position (4 mm, 7 mm, and 10 mm in Figure 3) under partial load from the start of the engine up to 2000 rpm. Figure 9 shows the characteristics of the oil film pressure against the in-cylinder pressure at 3000 rpm full load conditions with sensor positions of 4 mm and 7 mm. In these figures, the left vertical axis indicates the oil film pressure value [MPa], the right vertical axis indicates the in-cylinder pressure [MPa], and the horizontal axis indicates the crank angle [°].
In Figure 8, it can be seen that oil film pressure begins to generate at all three locations almost simultaneously as the cylinder pressure increases up to about 1.4 MPa. It reaches 12 MPa at the 4 mm and 7 mm positions and 51 MPa at the 10 mm position. The oil film pressure also decreased as the cylinder pressure decreased; however, it did not reach 0 MPa at all three measurement points at the same time. In addition, at the 4 mm position, the pressure instantly increased to 19 MPa when the crank angle was 45 °CA. As described above, when using a thin-film sensor, it is possible to observe such a special phenomenon.
In the case of 3000 rpm full load shown in Figure 9, the oil film pressure was generated as the cylinder pressure increased. At a cylinder pressure of 4.3 MPa at 5 °CA, the maximum oil film pressure was measured at 52 MPa at the 4 mm position and 70 MPa at the 7 mm position. The measurement upper limit of the thin-film pressure sensor can be over 1 GPa, however in this experiment, the measurement upper limit was set to 120 MPa by setting the data logger in this study (see the 7 mm data in Figure 11). At 3000 rpm full load at the 10 mm position, the pressure greatly exceeded 120 MPa; therefore, Figure 8 shows the characteristics of the oil film pressure only at the 4 mm and 7 mm positions.
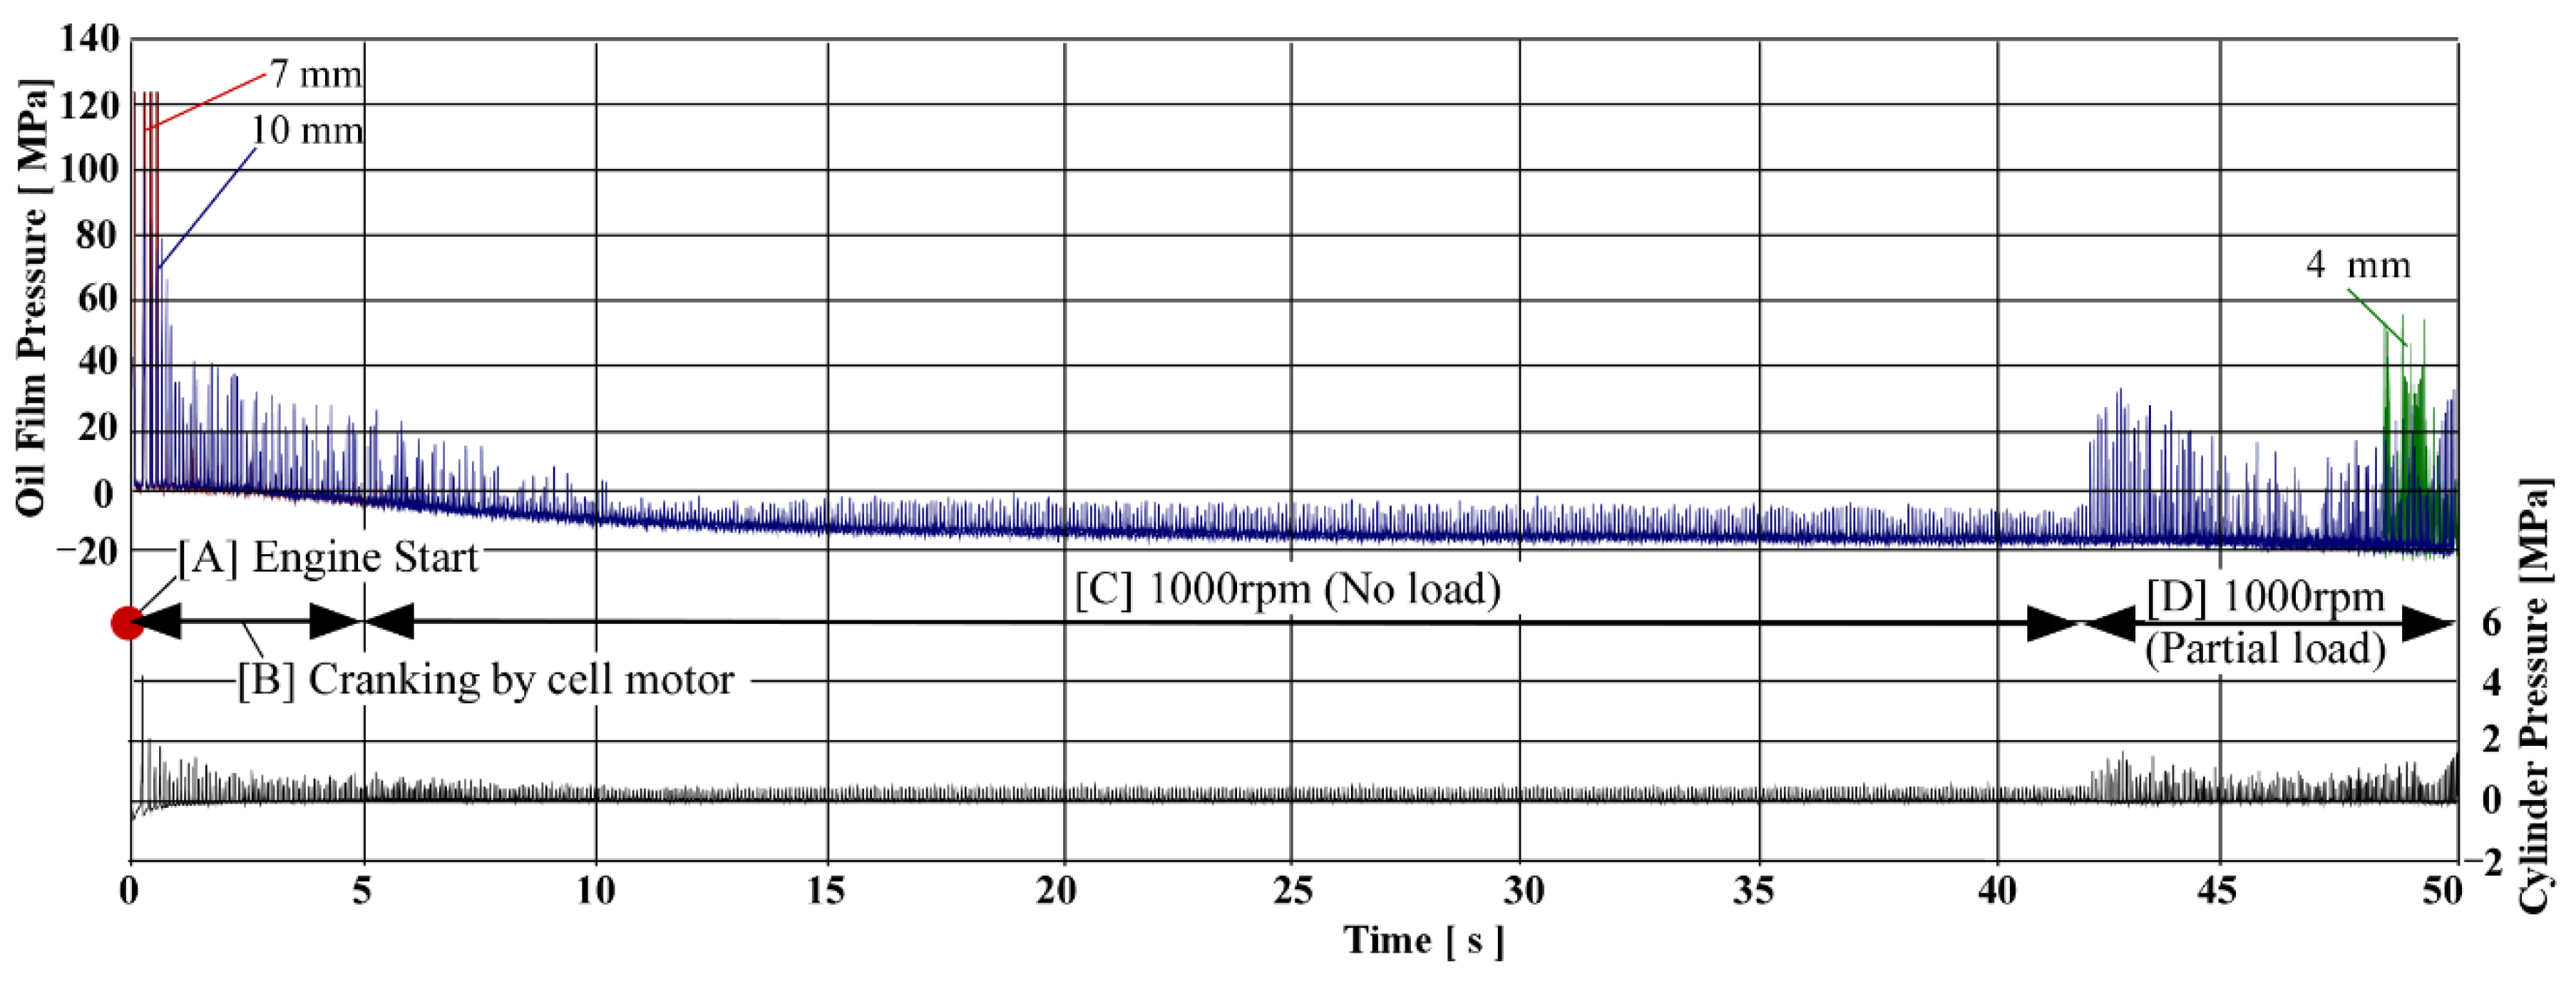
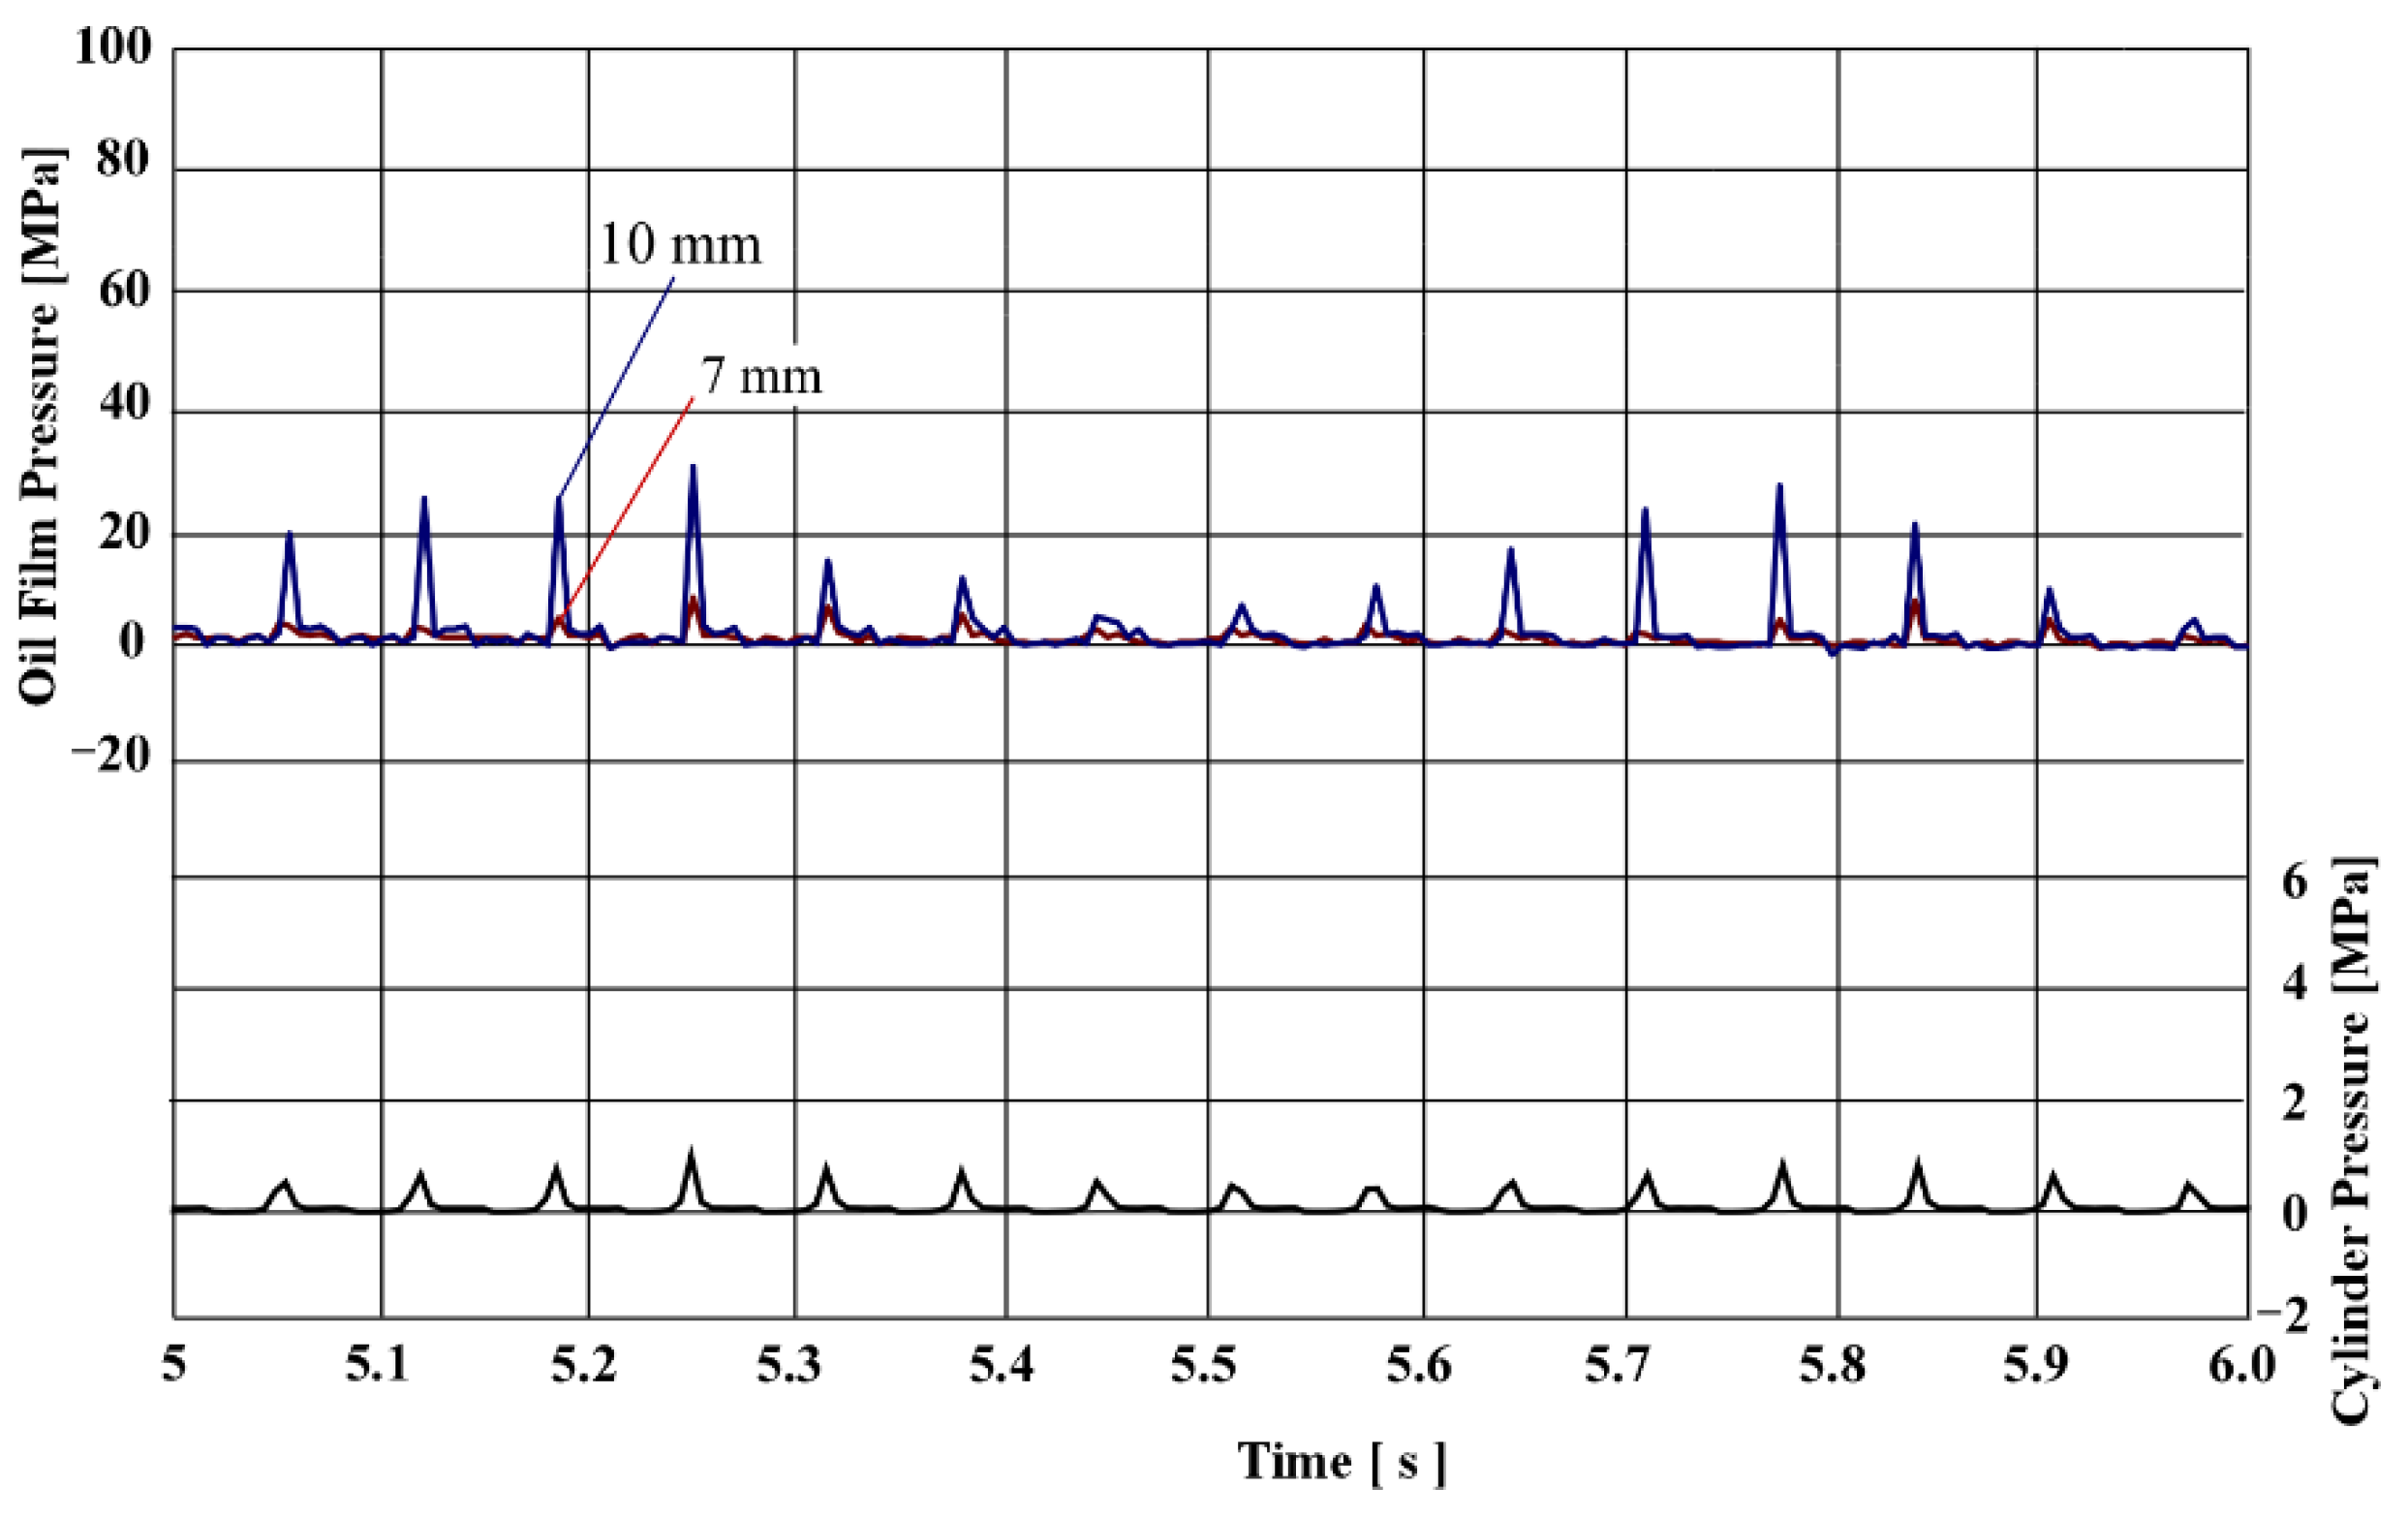
Next, Figure 10 shows the characteristics of the peak oil film pressure under each operating condition: immediately after engine start [A], cranking by cell motor [B], 1000 rpm no load [C], and 1000 rpm partial load [D]. Details of these [A] to [D] features are shown in Figure 11, Figure 12, Figure 13 and Figure 14. At the moment of engine start shown in Figure 11, the in-cylinder pressure increased rapidly due to cranking, and the thin-film sensor indicated about 80 to 100 MPa at the 10 mm position and exceeded 120 MPa at the 7 mm position. (120 MPa was recorded as the maximum value due to the upper limit of data logger settings). It was suggested that the piston pin was in direct contact with the pin bore because the supply oil from the oil jet system shown in Figure 6 to the pin bore was not sufficient immediately after start-up. It was thought that the 7 mm position was especially high because it corresponds to the edge of the piston pin bore.
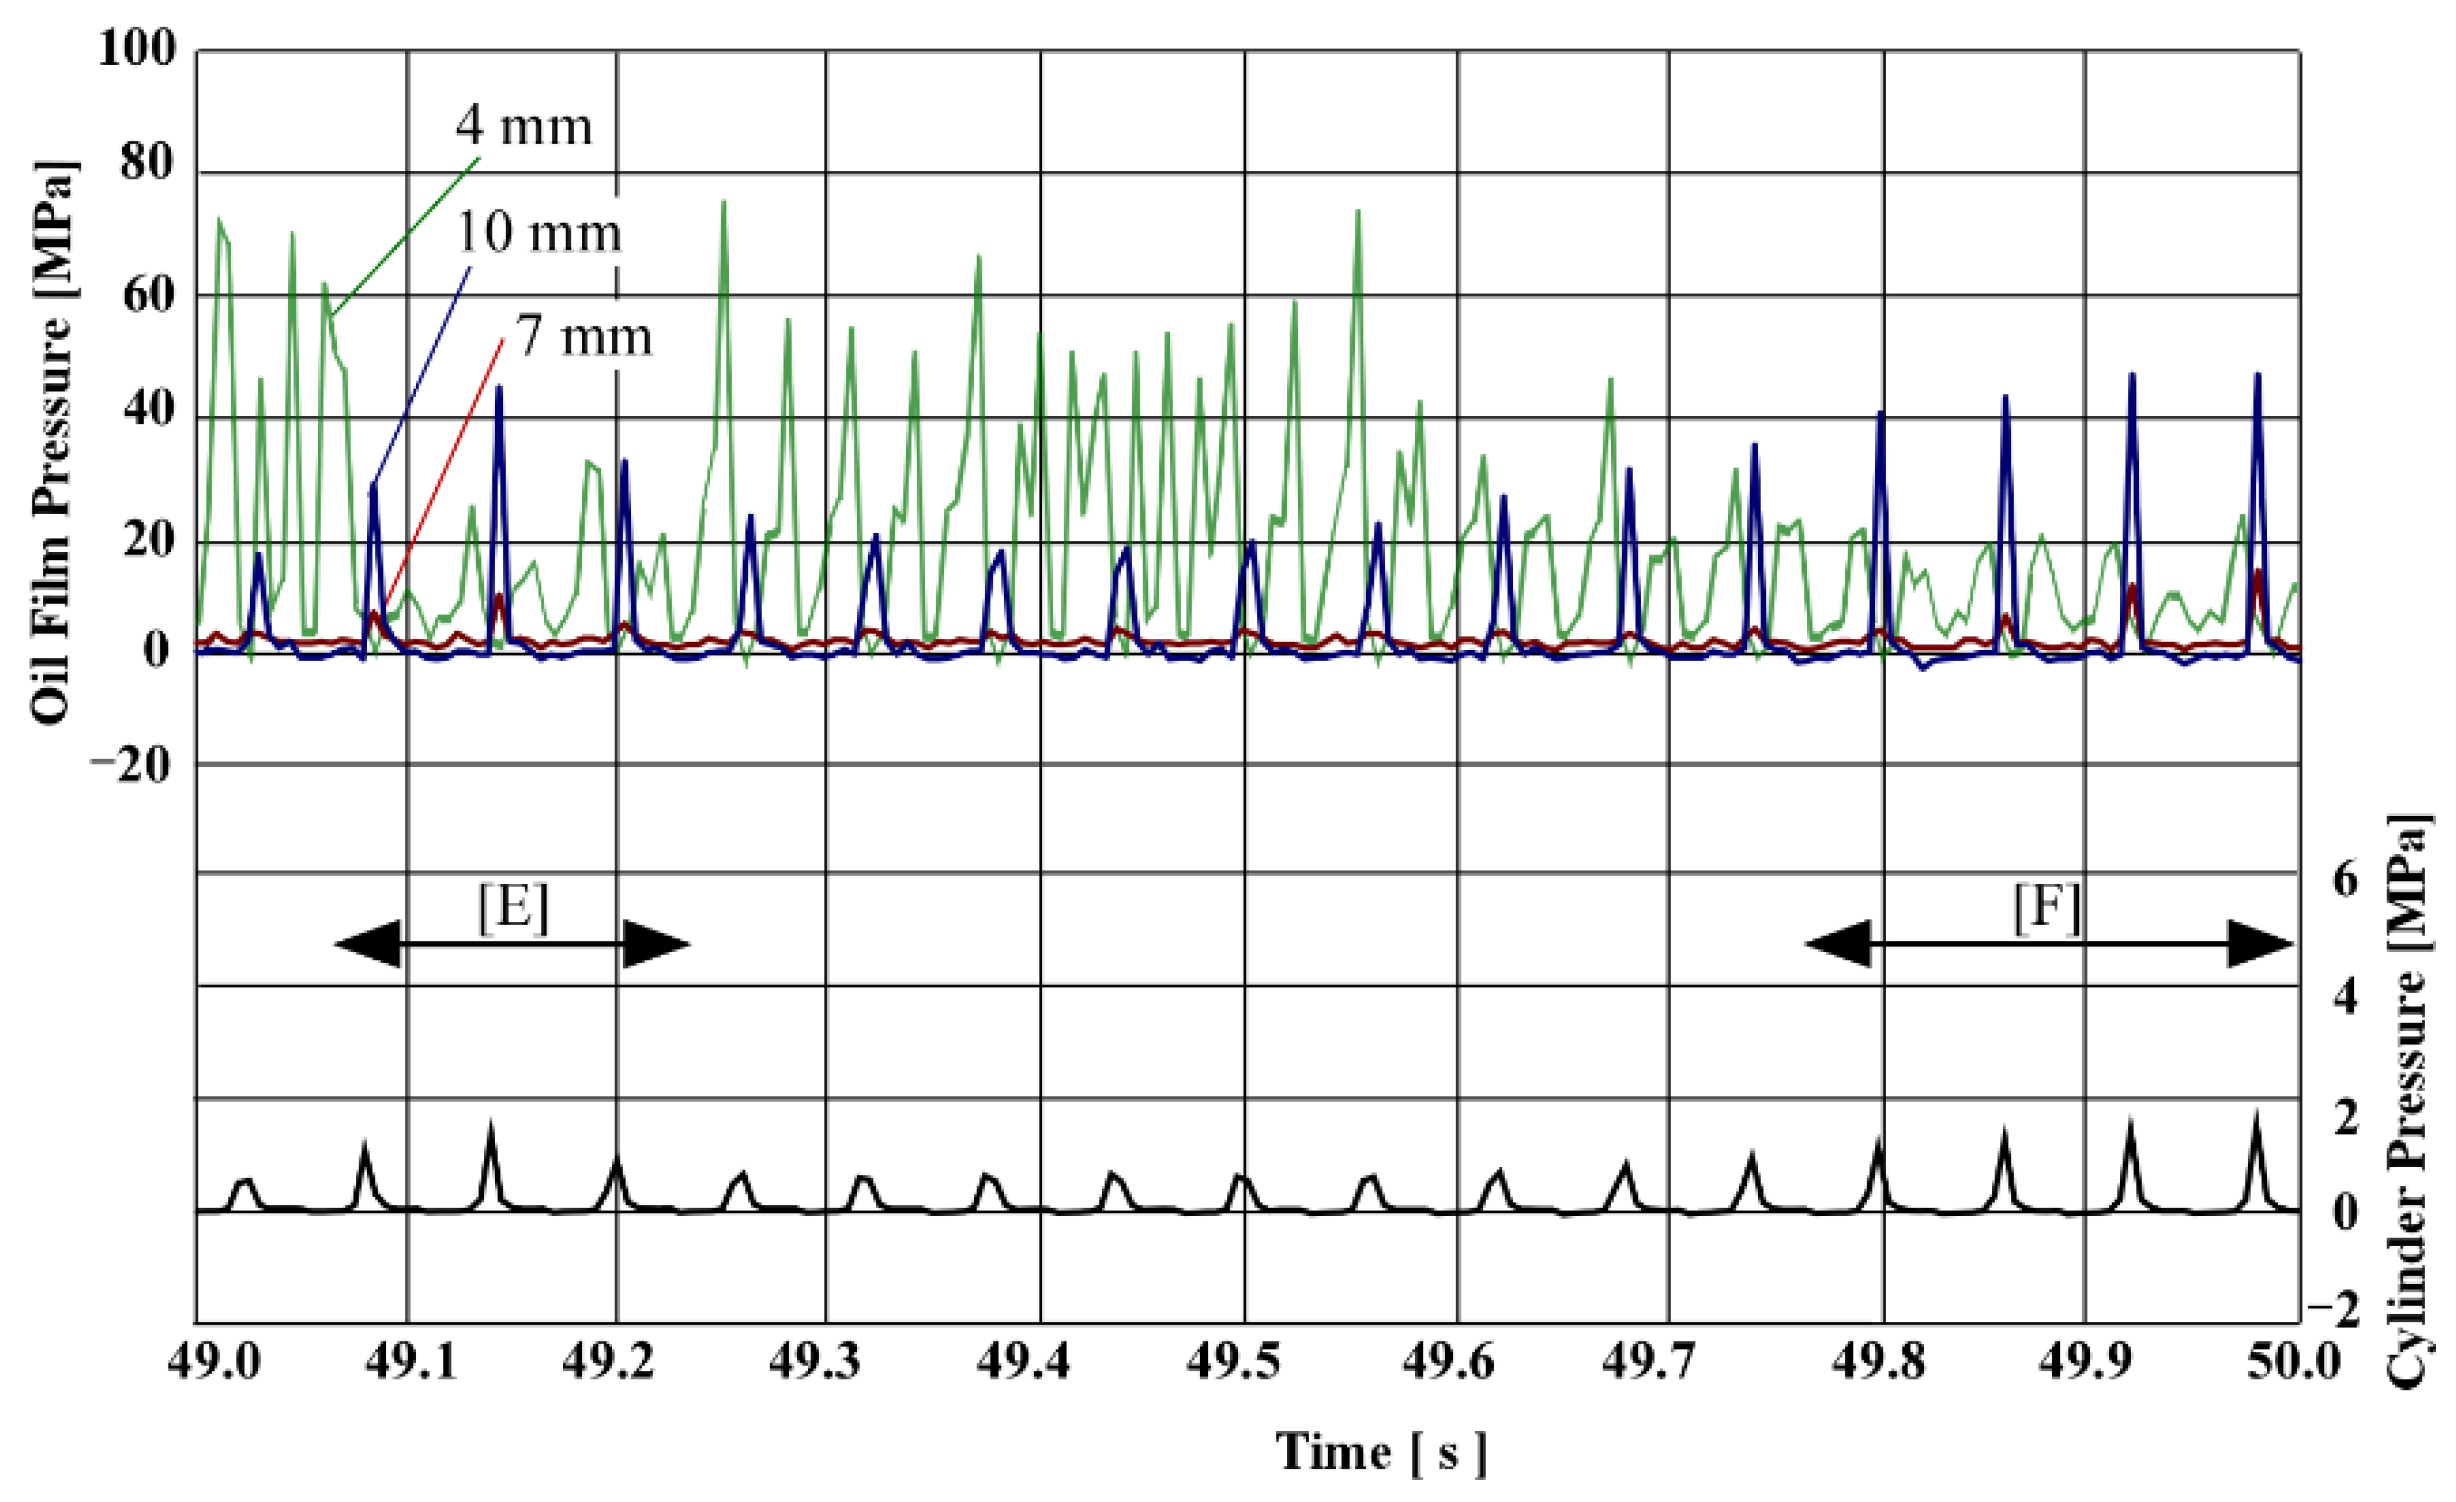
Figure 12 shows cranking with a starter motor and Figure 13 shows idling after starting the engine. The pressure at each measurement point increased according to the action of the cylinder pressure. Figure 14 shows the tendency of the cylinder pressure and the oil film pressure when the load is increased from no load to half load. In this engine, the in-cylinder pressure is unstable, however when the in-cylinder pressure approaches 2 MPa, as shown in [E] and [F] in Figure 14, the oil film pressure exceeds 40 MPa at the 10 mm position. On the other hand, when the cylinder pressure was 1 MPa or less, the oil film pressure showed a pressure value of 50 MPa or more at the 4 mm position. Such a phenomenon is thought to be a factor in the sound vibration of the piston, but this cause will be analyzed in future research.

4.2. Correlation between Actual Engine and Unit Fatigue Tester

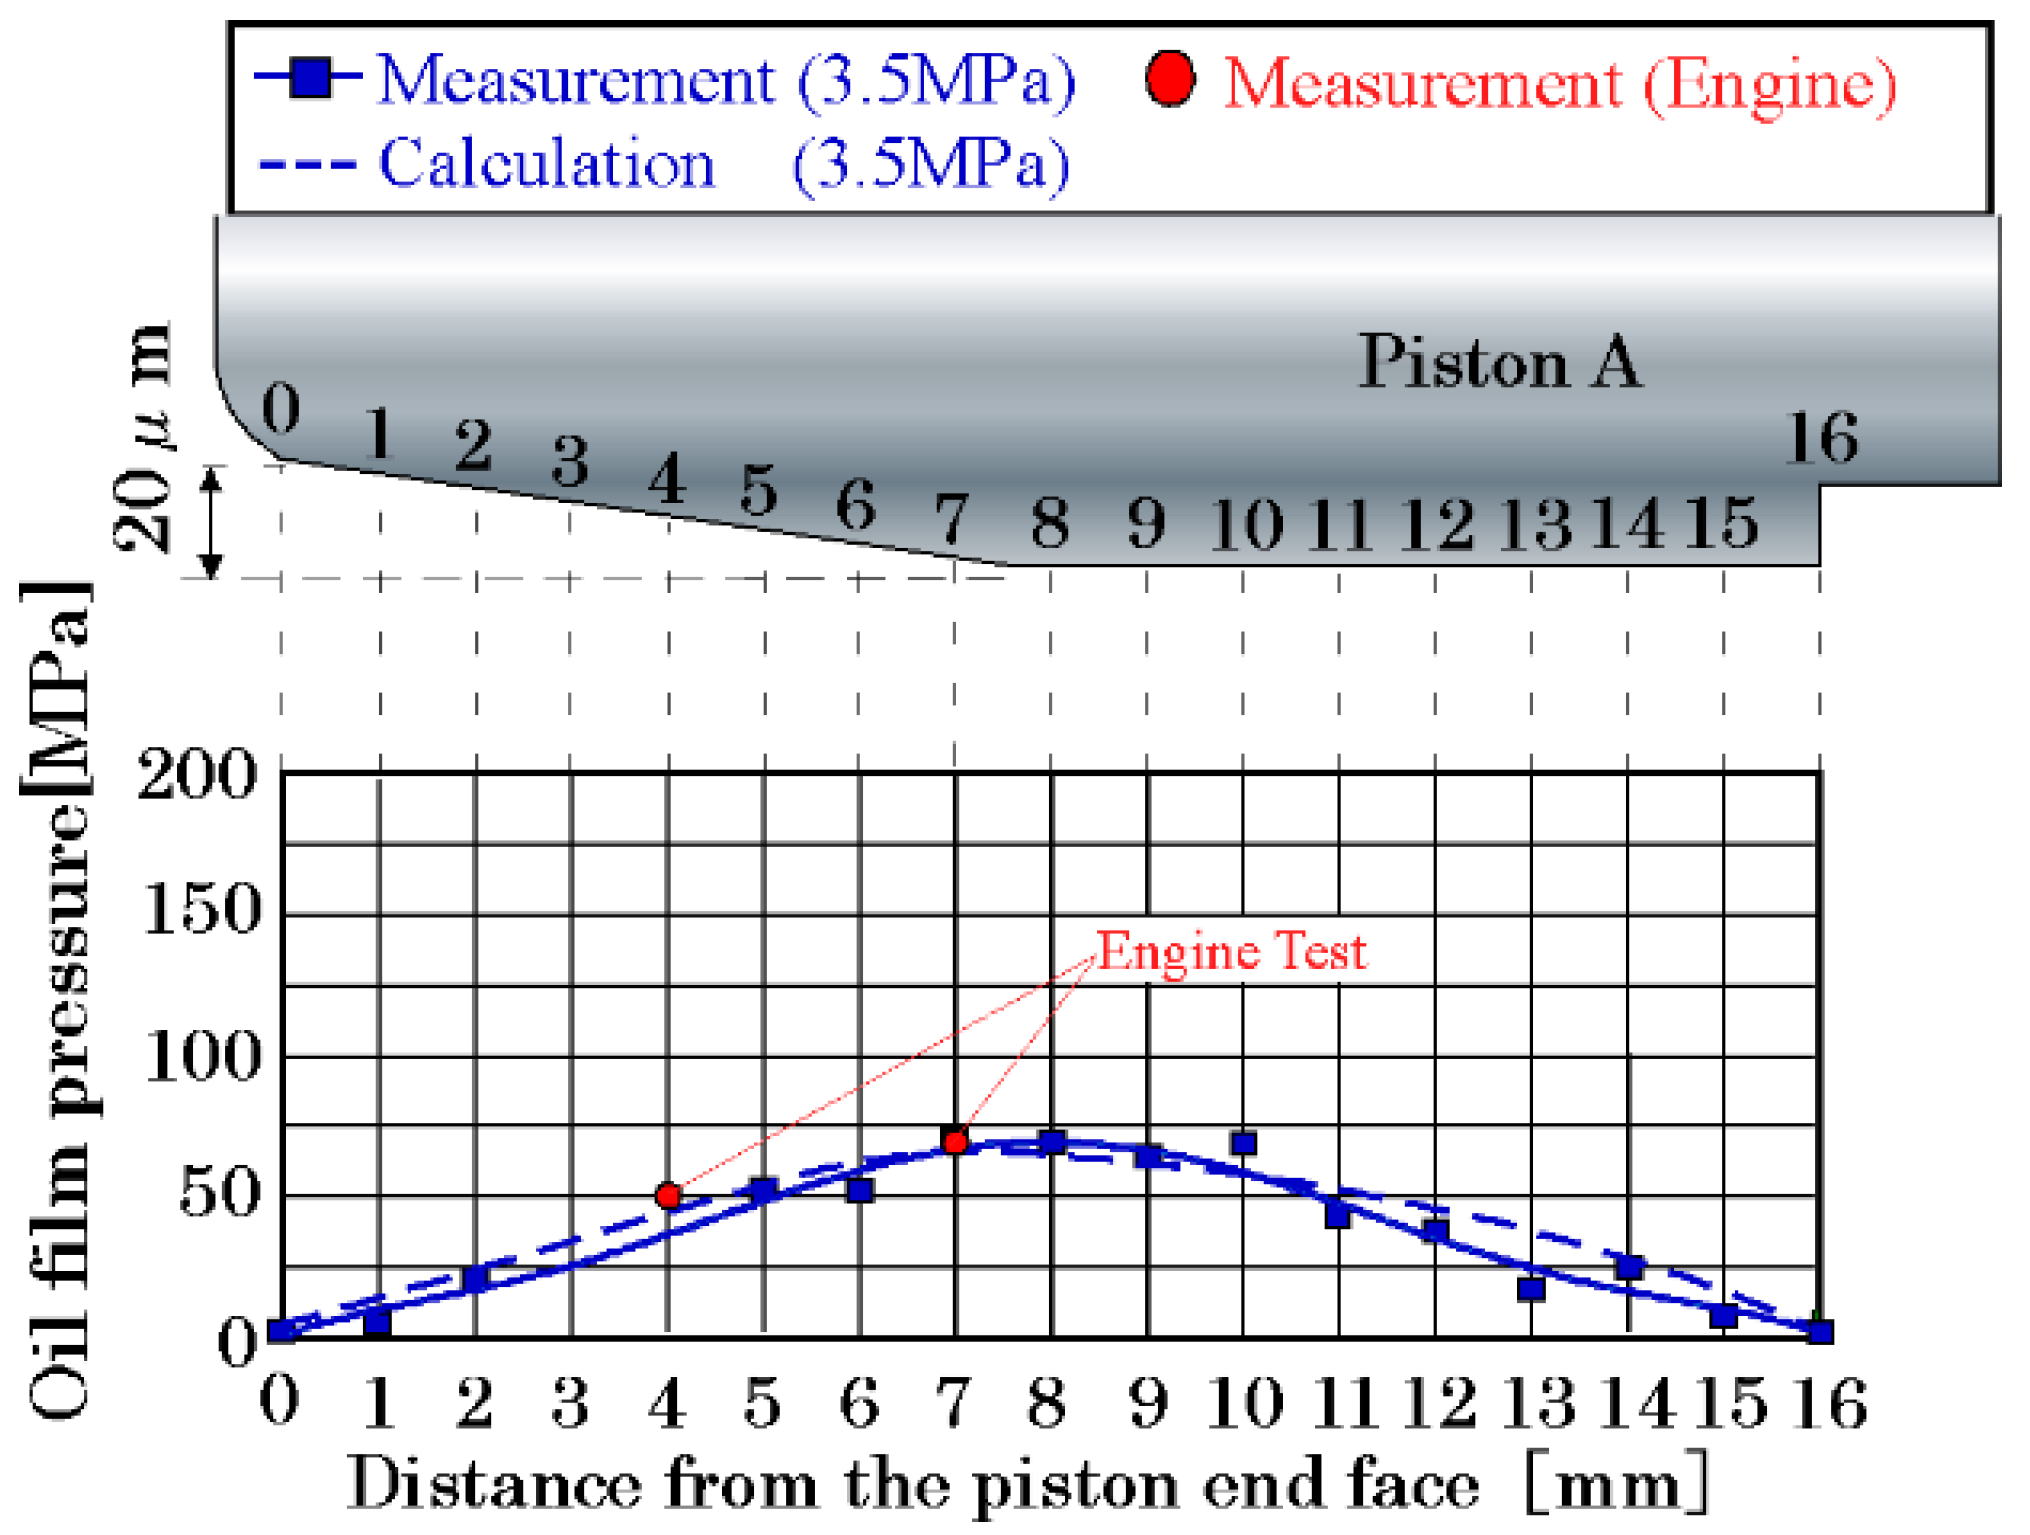
Figure 15 shows the results of a comparison between the measured oil film pressure in the axial direction on the unit fatigue tester (solid blue line) and the oil film pressure measured with the test engine (red plots). The vertical axis shows the measured oil film pressure in relation to the sensor measurement positions on the horizontal axis. The dashed blue line shows the results of the simulation conducted with the EXCITETM Power Unit. Although only a small number of measurements were made in the present study, the oil film pressures obtained at the 4 mm and 7 mm sensor positions with the unit fatigue tester and the test engine showed good agreement. The results of the simulation conducted using the conditions of the unit fatigue tester also showed good agreement. In order to confirm the correlation between the test engine and the unit fatigue tester in future work, it is planned to add more measurement positions in the tests and to conduct theoretical simulations using a model of the test engine.

5. Conclusions

  • The oil film pressure at the piston pin-bore interface was measured during engine operation using thin-film pressure sensors fabricated on the sliding surface of the piston pin.
  • The durability of the thin-film sensor was improved by using DLC as a protective film, and oil film pressure measurement was achieved up to 3000 rpm and full load.
  • Simultaneous measurement of the oil film pressure at each part of the pin boss was performed using a multi-point type thin film sensor, and the pressure change at each measurement position was obtained. Also, the pressure generation state from the start of the engine to the idling of the engine could be measured over time. As a result, we were able to confirm the load sharing state and oil lubrication state of the piston pin boss at each measurement position.
  • Immediately after engine startup, oil supply was not sufficient, and locally high pressures of 100 MPa or higher were detected. Especially at the 7 mm position corresponding to the edge of the pin bore, the pressure was over 120 MPa.
  • In this study, tests were not conducted under high engine speed and load conditions owing to the nature of the test engine used, but it is planned to conduct tests and evaluations under such conditions in future work.

Author Contributions

Conceptualization, Y.M. and N.Y.; methodology, Y.M., M.O. (Michiyasu Owashi) and K.K.; formal analysis, T.I.; investigation, M.O. (Michiyasu Owashi), K.K. and N.Y.; resources, K.K. and N.Y.; data curation, T.I. and M.O. (Michiyasu Owashi); writing—original draft preparation, T.I.; writing—review and editing, M.O. (Michiyasu Owashi), M.O. (Masakuni Oikawa), Y.M., K.K. and N.Y.; visualization, T.I. and M.O. (Michiyasu Owashi); supervision, M.O. (Masakuni Oikawa), Y.M. and K.K.; project administration, Y.M. All authors have read and agreed to the published version of the manuscript.

Funding

This research received no external funding.

Data Availability Statement

Not applicable.

Conflicts of Interest

Author M.O. was employed by the company Sustainable Engine Research Center Co., Ltd. The remaining authors declare that the research was conducted in the absence of any commercial or financial relationships that could be construed as a potential conflict of interest.

References

  1. Ba, L.; He, Z.; Liu, Y.; Zhang, G. Analysis of piston-pin lubrication considering the effects of structure deformation and cavitation. J. Zhejiang Univ. Sci. A 2015, 16, 443–463. [Google Scholar] [CrossRef] [Green Version]
  2. Knoll, G.; Bargende, M.; Lang, J.; Phili, U. Piston pin in mixed friction contact. MTZ Worldw. 2009, 70, 54–60. [Google Scholar] [CrossRef]
  3. Mihara, Y.; Hayashi, T.; Nakamura, M.; Someya, T. Study on the Measurement of Oil-film Pressure of Engine Main Bearing by means of New Developed Thin Film Sensor under Engine Operating Conditions. Trans. JSAE 1995, 26, 40–45. (In Japanese) [Google Scholar]
  4. Inui, M.; Kobayashi, M.; Oowaki, K.; Furukawa, T.; Mihara, Y.; Owashi, Y. Analysis of Oil Film Generation on the Main Journal Bearing Using a Thin-Film Sensor and Elasto-Hydrodynamic Lubrication (EHL) Model. SAE Int. J. Fuels Lubr. 2013, 6, 119–125. [Google Scholar] [CrossRef]
  5. Mihara, Y.; Someya, T. Measurement of Oil-Film Pressure in Engine Bearings Using a Thin-Film Sensor. Trib. Trans. 2002, 45, 11–20. [Google Scholar] [CrossRef]
  6. Mihara, Y.; Someya, T. Study on the Measurement of Oil Film Pressure Distribution on Plain Bearings using Thin-film Sensors. J. Jpn. Inst. Mar. Eng. 2007, 42, 595–600. (In Japanese) [Google Scholar] [CrossRef]
  7. Shibata, M.; Owashi, M.; Mihara, Y.; Tachibana, Y.; Yoshida, H.; Suzuki, T.; Otake, K. Measurement of oil film pressure distribution in piston skirtsusing multi-layer type thin film pressure sensor. In Proceedings of the JSAE Fall Congress (CD-ROM) 2016, Yokohama, Japan, 25–27 May 2016. page ROMBUN No. 2921. (In Japanese). [Google Scholar]
  8. Kamiya, M.; Kobayashi, T.; Mihara, Y.; Someya, T. Measurement of Piston Skirt Oil-film Pressure under Piston Slap; SAE Technical Paper 2007-01-2215; SAE International: Warrendale, PA, USA, 2007. [Google Scholar] [CrossRef]
  9. Miura, K.; Owashi, M.; Mihara, Y. High Durability Thin-Film Pressure Sensor Development. In Proceedings of the Ninth International Conference on Modeling and Diagnostics for Advanced Engine Systems (COMODIA 2017), Okayama, Japan, 25–28 July 2017. C314. [Google Scholar]
  10. Miura, K.; Owashi, M.; Mihara, Y. Thin Film Sensors for Measuring Oil Film Condition in Engine Sliding Surfaces. In Proceedings of the World Tribology Congress 2017, Beijing, China, 17–22 September 2017. [Google Scholar]
  11. Mihara, Y.; Matsuzaki, T.; Someya, T. Measurement of piston pin-boss oil-film pressure in engine operating condition using a thin-film sensor. Trans. JSAE 2007, 39, 125–130. (In Japanese) [Google Scholar]
  12. Mihara, Y.; Yamada, D.; Someya, T.; Goto, T. Study on Measurement of Oil Film Pressure on Piston Pin Boss using Thin-film Sensors. Trans. JSME 1998, 98, 561–562. (In Japanese) [Google Scholar]
  13. Miura, K.; Kobayashi, K.; Yamakawa, N.; Saruwatari, M.; Mihara, Y. Measurement of Oil Film Pressure in Piston Pin-Boss by Thin-Film Pressure Sensor; SAE Technical Paper 2015-01-204; SAE International: Warrendale, PA, USA, 2015. [Google Scholar] [CrossRef]
  14. Kano, M. Diamond-Like Carbon Coating Applied to Automotive Engine Components. Tribol. Online 2014, 9, 135–142. [Google Scholar] [CrossRef] [Green Version]
  15. Iwata, T.; Oikawa, M.; Chida, R.; Ishii, D.; Ogihara, H.; Mihara, Y.; Kano, M. Excellent Seizure and Friction Properties Achieved with a Combination of an a-C:H:Si DLC-Coated Journal and an Aluminum Alloy Plain Bearing. Coatings 2021, 11, 1055. [Google Scholar] [CrossRef]
  16. Higuchi, T.; Mabuchi, Y.; Ichikawa, H.; Murata, T.; Moronuki, M. Development of Hydrogen-Free Diamond-Like Carbon Coating for Piston Rings. Tribol. Online 2017, 12, 117–122. [Google Scholar] [CrossRef]
  17. Toyoda, S. All Toyota Tribological Innovation to Realize “Zeronize” and “Maximize” Society. Tribol. Online 2007, 2, 19–22. [Google Scholar] [CrossRef] [Green Version]
  18. Treutler, C.P.O. Industrial use of plasma-deposited coatings for components of automotive fuel injection systems. Surf. Coat. Technol. 2005, 200, 1969–1975. [Google Scholar] [CrossRef]
  19. Patir, N.; Cheng, H.S. An Average Flow Model for Determining Effects of Three-Dimensional Roughness on Partial Hydrodynamic Lubrication. ASME J. Lubr. Tech. 1978, 100, 12–17. [Google Scholar] [CrossRef]
  20. Patir, N.; Cheng, H.S. Application of Average Flow Model to Lubrication Between Rough Sliding Surfaces. ASME J. Lubr. Tech. 1979, 101, 220–229. [Google Scholar] [CrossRef]
  21. Greenwood, J.A.; Tripp, J.H. The Contact of Two Nominally Flat Rough Surfaces. Proc. Inst. Mech. Eng. 1970, 185, 625–633. [Google Scholar] [CrossRef]
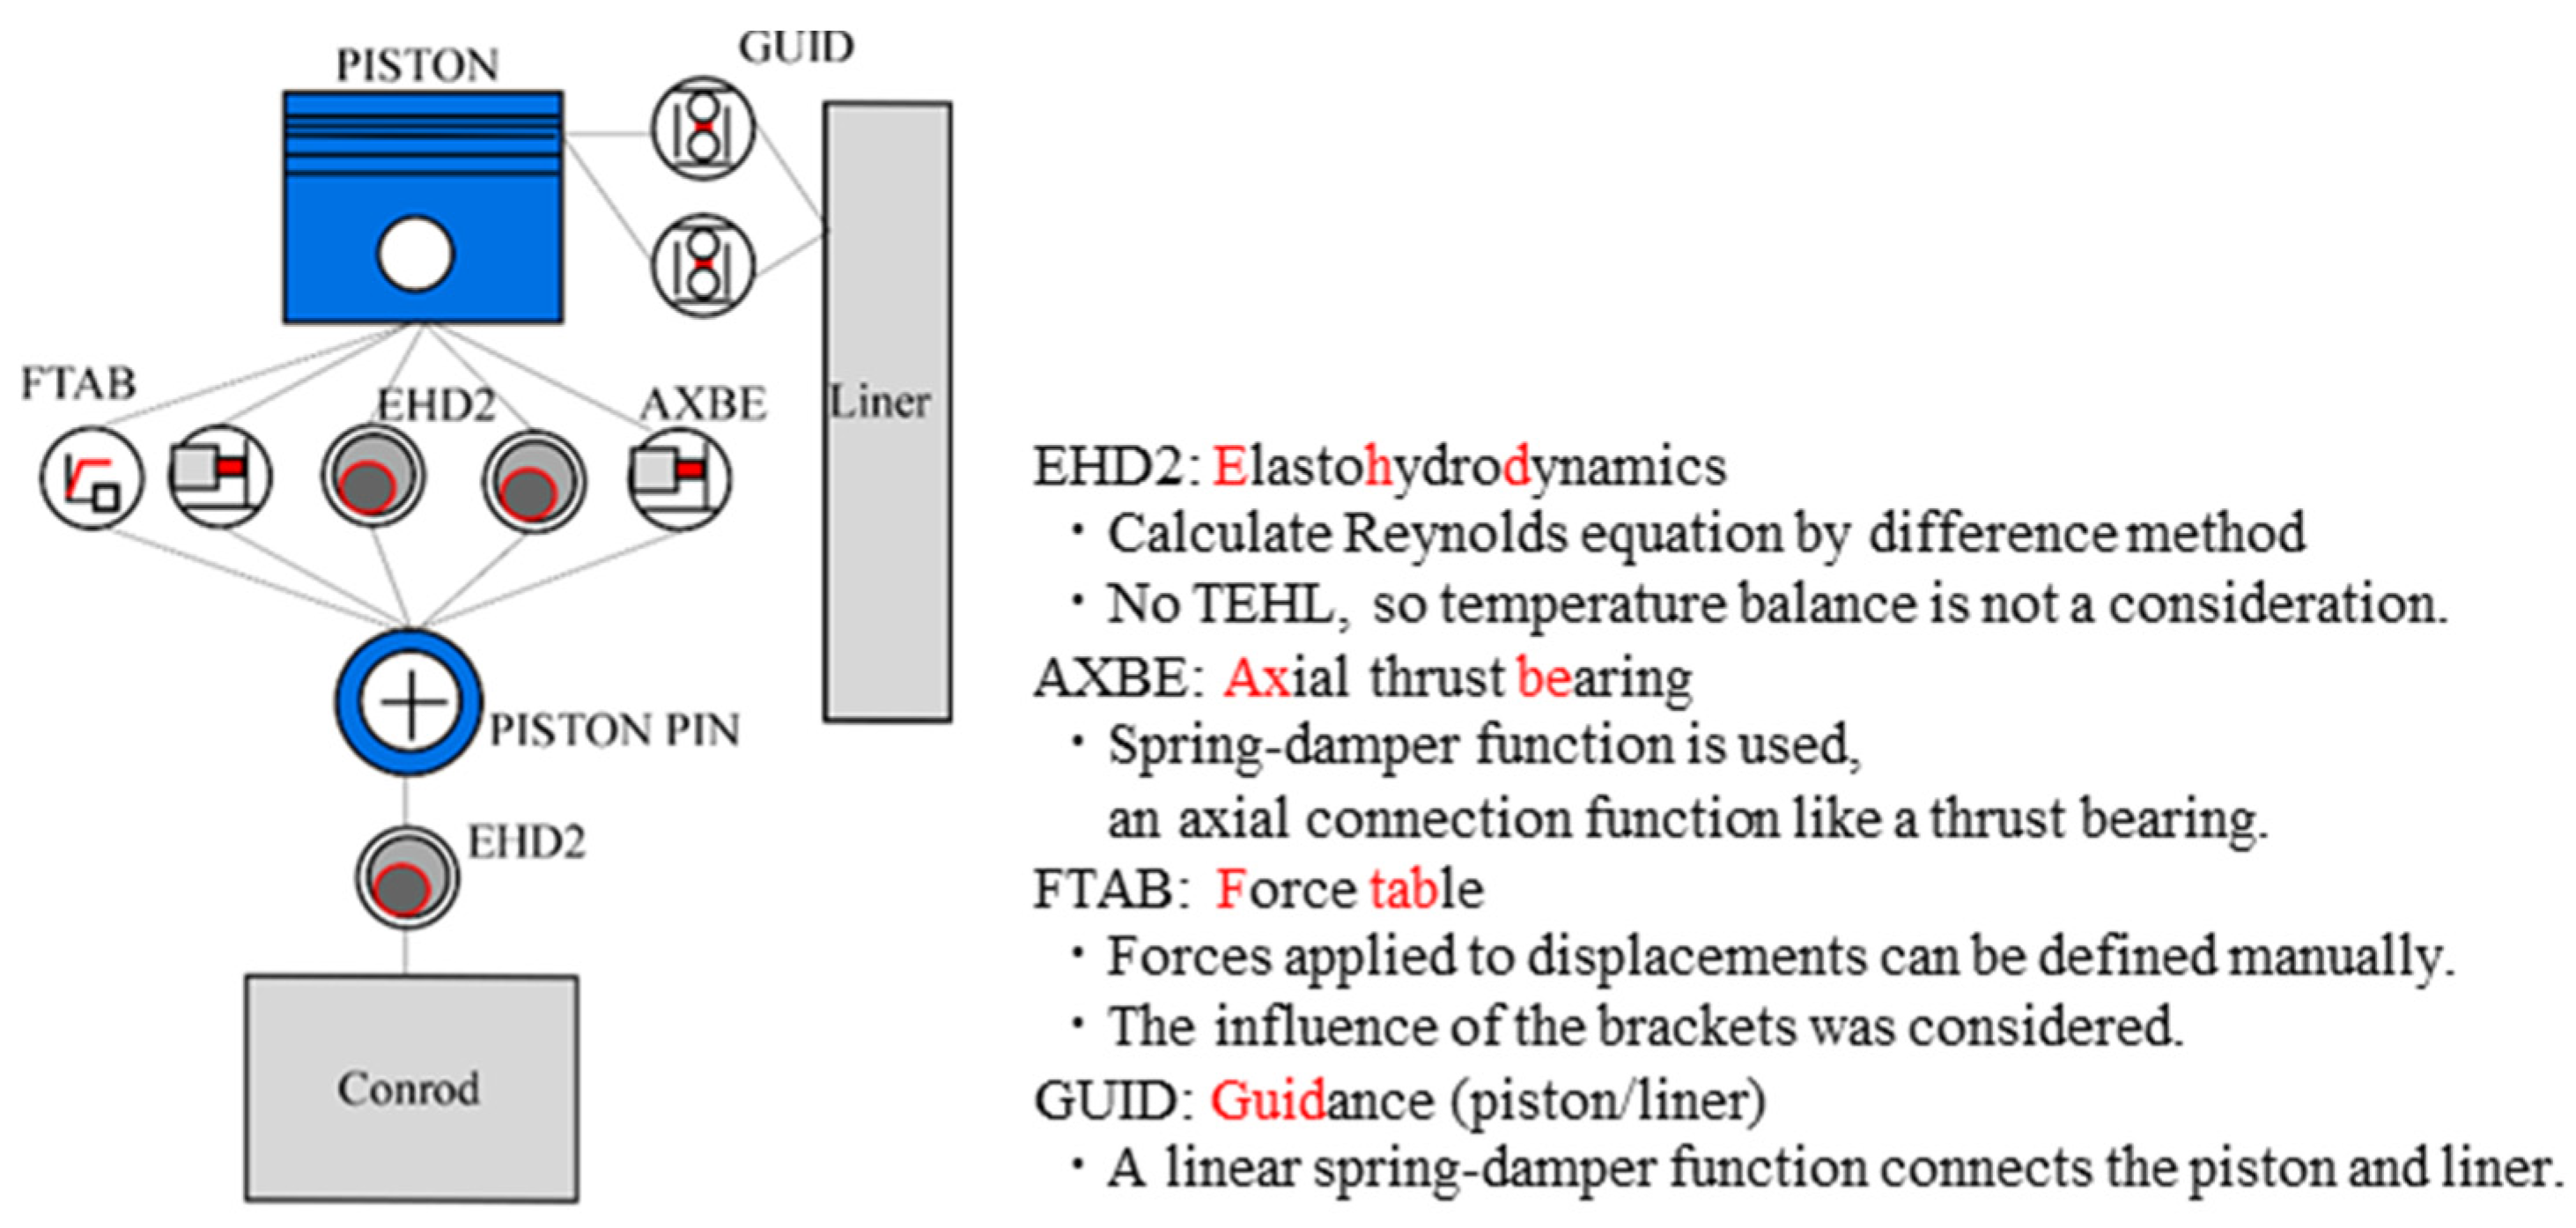
Figure 1. AVL EXCITETM analysis simulation conditions.
Lubricants 10 00258 g001
Figure 2. Experimental equipment.
Lubricants 10 00258 g002
Figure 3. Measurement system.
Lubricants 10 00258 g003
Figure 4. Structure of thin-film sensor and piston pin-bore shape: (a) sensor geometry; (b) structure of thin-film sensor; (c) sensor positions and piston pin-bore shape.
Lubricants 10 00258 g004
Figure 5. Sensor design and measuring positions: (a) measuring location 4, 7, 10 mm from inner end; (b) pressure sensor with DLC protective film.
Lubricants 10 00258 g005
Figure 6. Pressure calibration result of thin-film sensor.
Lubricants 10 00258 g006
Figure 7. Cross-sectional view of the piston-cylinder part and the relationship between the mounting positions of the three pressure sensors attached to the piston pin.
Lubricants 10 00258 g007
Figure 8. Measured results (2000 rpm, partial load).
Lubricants 10 00258 g008
Figure 9. Measured results (3000 rpm, full load).
Lubricants 10 00258 g009
Figure 10. From engine start to firing (partial load).
Lubricants 10 00258 g010
Figure 11. Engine start (detail of [A] in Figure 10).
Lubricants 10 00258 g011
Figure 12. Cranking by cell motor (detail of [B] in Figure 10).
Lubricants 10 00258 g012
Figure 13. Total 1000 rpm no load (detail of [C] in Figure 10).
Lubricants 10 00258 g013
Figure 14. Total 1000 rpm partial load (detail of [D] in Figure 10).
Lubricants 10 00258 g014
Figure 15. Comparison of axial oil film pressure between unit fatigue tester results and test engine results.
Lubricants 10 00258 g015
Table 1. Engine specifications.
ItemSpecification
Engine typeIn-line 4-cylinder
gasoline engine
Bore × Stroke (mm)90 × 98
Displacement (cm3)2494
Compression ratio10.4
Table 2. Operating conditions of engine test.
Engine Speed
(rpm)
Load
(Nm)
Oil Temp.
(°C)
Water Temp.
(°C)
Piston Pin Temp.
(°C)
Engine start to
1000 rpm
No load32.040.450.5–52.1
2000Partial load86.157.3111.4
3000Full load107.078.8141.7
Publisher’s Note: MDPI stays neutral with regard to jurisdictional claims in published maps and institutional affiliations.