Article

Remnant Radio Galaxy Candidates of Small Angular Sizes

1
Physical Research Laboratory, Ahmedabad 380009, India
2
Indian Institue of Technology Gandhinagar, Palaj, Gandhinagar 382355, India
3
National Centre for Radio Astrophysics—TIFR, Pune 411007, India
*
Author to whom correspondence should be addressed.
Galaxies 2021, 9(4), 121; https://doi.org/10.3390/galaxies9040121
Submission received: 25 October 2021 / Revised: 10 December 2021 / Accepted: 12 December 2021 / Published: 16 December 2021

Abstract

:
Remnant radio galaxies (RRGs), characterized by the cessation of AGN activity, represent a short-lived last phase of radio galaxy’s life-cycle. Hitherto, searches for RRGs, mainly based on the morphological criteria, have identified large angular size sources resulting into a bias towards the remnants of powerful FR-II radio galaxies. In this study we make the first attempt to perform a systematic search for RRGs of small angular sizes (<30 ) in the XMM–LSS field. By using spectral curvature criterion we discover 48 remnant candidates exhibiting strong spectral curvature i.e., α 150 MHz 325 MHz α 325 MHz 1.4 GHz ≥ 0.5. Spectral characteristics at higher frequency regime (>1.4 GHz) indicate that some of our remnant candidates can depict recurrent AGN activity with an active core. We place an upper limit on the remnant fraction ( f rem ) to be 3.9%, which increases to 5.4% if flux cutoff limit of S 150 MHz ≥ 10 mJy is considered. Our study unveils, hitherto unexplored, a new population of small-size (<200 kpc) remnant candidates that are often found to reside in less dense environments and at higher redshifts (z) > 1.0. We speculate that a relatively shorter active phase and/or low jet power can be plausible reasons for the small size of remnant candidates.

1. Introduction

Radio galaxies, a subclass of Active Galactic Nuclei (AGN), emit copiously at radio wavelengths and exhibit well defined radio structures—a radio core, highly collimated outflowing bipolar jets eventually terminating into radio lobes. Understanding the evolution of radio galaxies is one of the important aspects of galaxy evolution as AGN jet activity influences host galaxy and surrounding inter-galactic-medium (IGM) via feedback processes [1]. Large-area multi-frequency sensitive radio continuum surveys have played a vital role in advancing our understanding on the radio galaxies evolution by detecting a large number of sources representing different phases of the radio galaxy’s life cycle. According to the evolutionary models infancy phase of a radio galaxy can be depicted by compact sources with Linear-Angular-Size (LAS) less than a kpc. Based on their spectral characteristics these sources are known as High-Frequency-Peakers (HFP) and Gigahertz-Peak-Spectrum (GPS) sources, that evolves into Compact-Steep-Spectrum (CSS) sources with LAS of a few to tens of kpc [2]. CSS radio sources can evolve into large-size radio galaxies of a few hundreds of kpc via sustained supply of plasma through jets that can remain active for tens of millions of years (see [3,4]). Remnant phase begins after the cessation of AGN activity during which jets are no longer sustained and lobes start to fade away. In the remnant phase, radio core and jets disappear but the radio lobes can still be detected for a time-scale of a few times of 10 7 years before they disappear due to radiative and adiabatic losses [5]. The time-scale over which remnant lobes can be detected is arguably much shorter than the active phase, and hence, remnant phase represents a short-lived final phase of radio galaxy evolution [6]. The short-lived remnant phase makes remnant radio galaxies (RRGs) rare objects to be detected.
In recent times, deep low-frequency radio surveys have been exploited to search for the population of RRGs with an expectation to find a large number of remnant sources exhibiting diffuse low-surface-brightness emission of steep spectrum. However, contrary to the predictions of evolutionary models based on radiative cooling of lobes plasma, the fraction of RRGs is found to be as low as 5% to 10%. For instance, using deep 150 LOFAR survey (5 σ = 0.1–2.0 mJy beam 1 ) and deep 6 GHz (5 σ = 0.02 mJy beam 1 ) observations [7] identified only 11/127 < 9% potential RRGs with absent-core criterion in the Herschel-ATLAS field. In a similar study [8] found only 11/158 < 8% RRGs in the Lockman Hole field. Recently, we carried out a search for RRGs in the the XMM-Newton Large–Scale Structure (XMM–LSS) field using deep 325 MHz Giant Metrewave Radio Telescope (GMRT) survey, 150 MHz Low-Frequency Array (LOFAR) survey and 1.4 GHz Jansky Very Large Array (JVLA) surveys, and found that the RRGs fraction is even lower upto <5% if fainter population (S 325 MHz ≥ 6.0 mJy) is probed (Dutta et al. 2021, submitted, D21 hereafter). Unlike D21 both [7,8] have introduced a high flux density cutoff limits i.e., S 150 MHz ≥ 40 mJy and S 150 MHz ≥ 80 mJy in their samples, respectively. In addition to relatively high flux density cutoff limit, all the previous studies have also introduced a cutoff limit of 30 –60 on LAS [6,9,10]. For instance, [6] identified RRGs using a sample of extended source with LAS ≥ 60 , while [7] limited their search to the radio sources with LAS ≥ 40 in the 150 MHz LOFAR images. In the XMM–LSS field, D21 attempted to identify RRGs in a sample of extended sources with LAS ≥ 30 in the 325 MHz GMRT images. We note that the requirement of placing a cutoff limit on the LAS arises due the use of morphological criteria i.e., absence of radio core, hotspots, in the radio images of few arcsec resolution. Moreover, the cutoff limit placed on the angular size introduces a bias towards large and powerful radio galaxies. In their sample of RRGs with LAS ≥ 60 [8] found that all RRGs show double-lobe morphology with high radio luminosity (L 150 MHz > 10 25 W Hz 1 ) suggesting their progenitors to be powerful FR-II radio galaxies.
We point out that the bias towards the remnants of large powerful radio galaxies continues to exist even in case of individual RRGs reported in the literature. In fact, individual RRGs were discovered primarily owing to their peculiar radio morphology that appeared extended, amorphous, and lacked compact features (e.g., [11,12,13,14]). Individual RRGs such as blob1 [12], NGC 1534 [14], J021659-044920 [11], B2 0924+30 [13,15,16] were identified based on their unusual amorphous-shaped large-scale radio morphology of low-surface-brightness emission at low-frequencies (≤325 MHz). Considering the biases and limitations introduced by the angular size cutoff we attempt to search and characterize the nature of RRGs of small angular sizes (LAS < 30 ) that have remained unexplored, hitherto. We note that small angular size poses difficulty in deciphering radio morphology, and hence, morphological criteria cannot be applied to search for small size remnants detected with the radio images of several arcsec resolution. Although, remnant characteristics are manifested in the radio spectra in the form of strong spectral curvature resulted from the frequency-dependent radiative losses. Therefore, we exploit spectral curvature criterion to identify RRGs of small angular sizes. In this paper, we use the terms remnants and RRGs interchangeably.
This paper is structured as follows. In Section 2 we provide the details of available radio and optical data in the XMM–LSS field. Section 3 describes the selection criteria and the sample of identified remnant candidates. In Section 4 we report the characteristic properties of our remnant candidates and compare them with active sources. In Section 5 we attempt to identify plausible reasons for existence of small-size remnants. Section 6 is devoted on the discussion for biases that can influence the remnant fraction. Section 7 lists the conclusions of our study.
In this paper we adopt following cosmological parameters: H 0 = 70 km s 1 Mpc 1 , Ω Λ = 0.7, Ω M = 0.3. Radio spectrum is characterized by a power law S ν ν α , where α represents the spectral index.

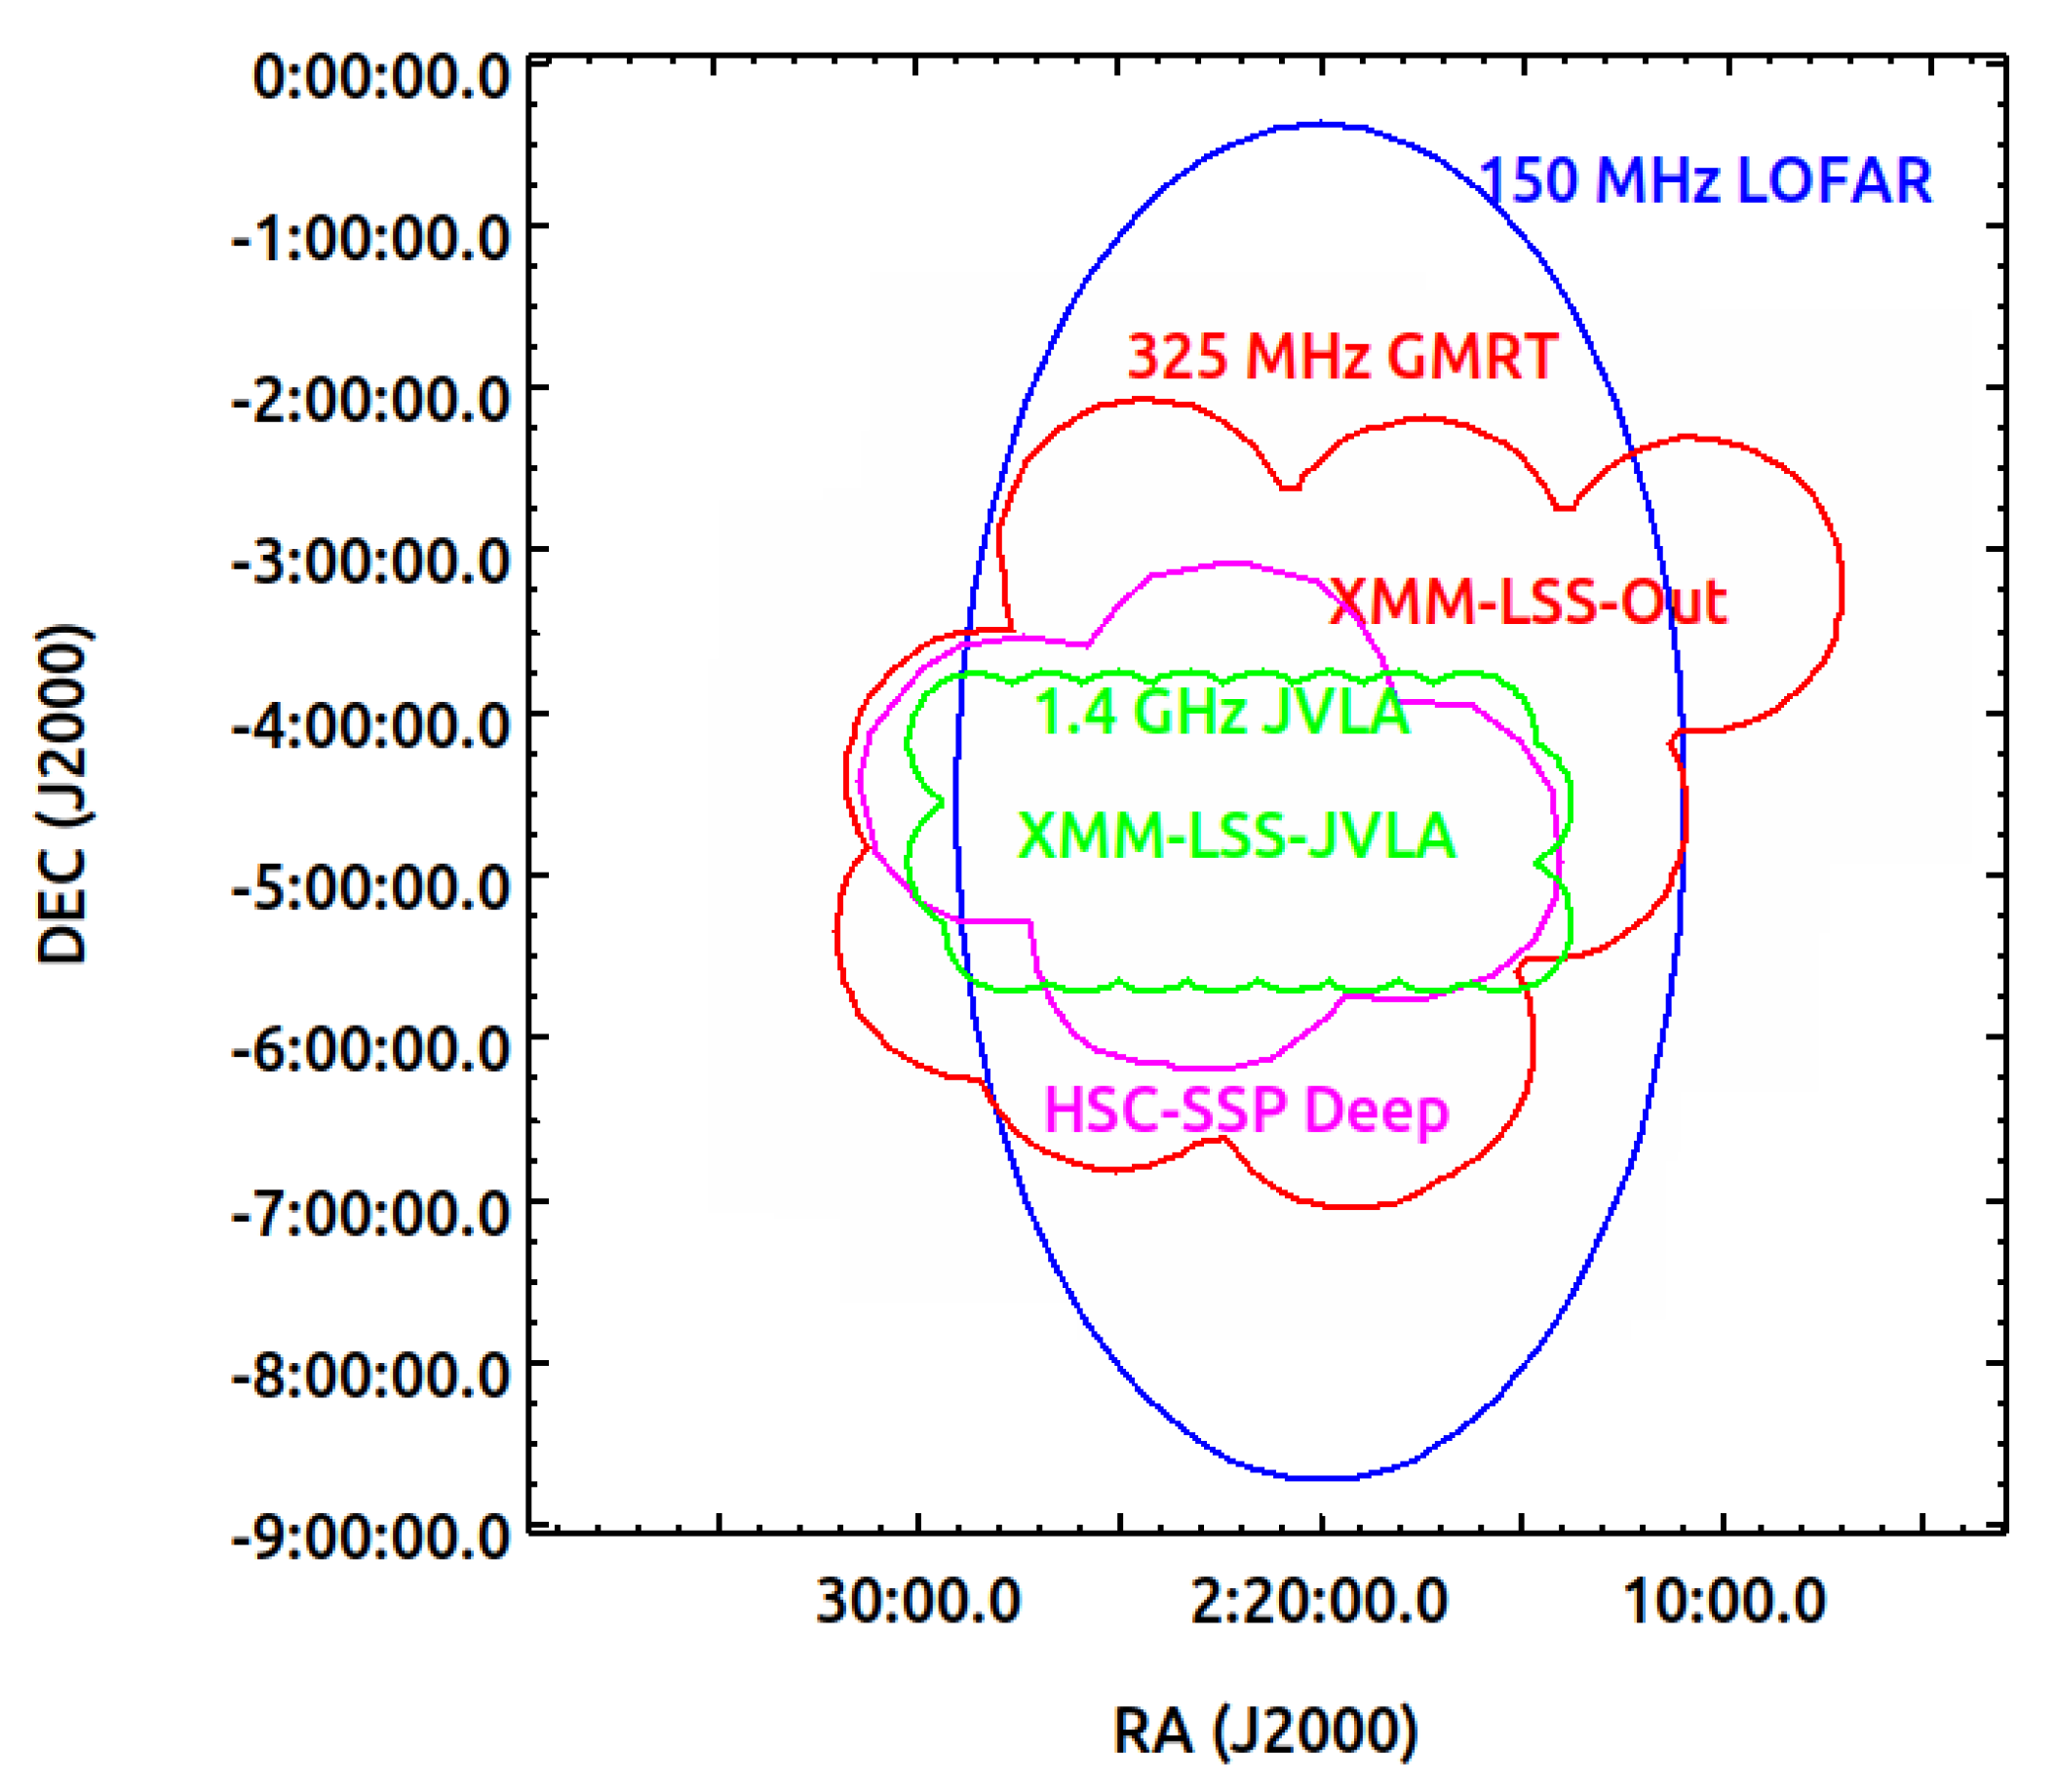
2. Radio and Optical Surveys in the XMM–LSS Field

To identify RRG candidates and their host galaxies we use deep multi-frequency radio and optical data available in the XMM–LSS field. In our study we mainly utilize 150 MHz LOFAR survey, 325 MHz GMRT survey, 1.4 GHz JVLA survey and the Hyper Suprime–Cam Subaru Strategic Program (HSC–SSP) optical survey. Figure 1 shows the footprints of all three radio surveys and of the HSC–SSP deep component survey. The HSC–SSP wide component survey covers a much larger sky area including the full XMM–LSS field. We note that 1.4 GHz JVLA survey overlaps partially with the 325 MHz GMRT survey. Therefore, we divide 325 MHz survey region into two parts—(i) 5.0 deg 2 area covered with the deep 1.4 GHz JVLA survey named as the XMM–LSS–JVLA, and (ii) 325 MHz GMRT survey region not covered with the 1.4 GHz JVLA survey named as the XMM–LSS–Out. We use relatively less sensitive 1.4 GHz FIRST survey in the XMM–LSS–Out region. In following subsections we provide brief details of the surveys that are used in our study.

2.1. Radio Surveys

150 MHz LOFAR survey: 150 MHz LOFAR survey covers 27 deg 2 sky area with elliptical footprints centered at RA = 35 ° DEC = −4 ° .5 in the XMM–LSS field [17]. This survey is carried out with the High Band Antenna (HBA; 110–240 MHz) having central frequency at 144 MHz. Final image has a median noise-rms of 0.394 mJy beam 1 and a noise-rms of 0.28 mJy beam 1 in the central region and angular resolution of 7 .5 × 8 .5. There are a total of 3044 individual radio sources detected in this survey.
325 MHz GMRT survey: 325 MHz GMRT survey centered at RA = 02 h 21 m 00 s and DEC = −04 ° 30 00 covers a total sky area of 12.5 deg 2 with 16 pointings in the XMM–LSS field. This survey was performed in semi-snapshot mode with the legacy GMRT having an instantaneous bandwidth of 32 MHz. The final 325 MHz GMRT mosaiced image achieves nearly a uniform sensitivity with an average noise-rms of 150 μ Jy beam 1 and the synthesized beam-size of 10 .2 × 7 .9. There are a total of 3739 individual radio sources detected in this survey. We refer reader to [18] for more details on the 325 MHz GMRT survey. Assuming a typical spectral index of −0.7, the sensitivity of 325 MHz GMRT survey (5 σ = 0.75 mJy) scales to 1.34 mJy at 150 MHz, that is comparable to the sensitivity of 150 MHz LOFAR survey (5 σ = 1.4 mJy) in the deeper regions. Therefore, combination of 325 MHz GMRT survey and 150 MHz LOFAR survey of similar depths and angular resolution will enhance our chances to detect remnants, in particular at the fainter regime.
1.4 GHz JVLA radio survey: 1.4 GHz JVLA radio survey carried out with B configuration in the wide-band continuum mode with the spectral coverage of 0.994–2.018 GHz, covers sky area of 5.0 deg 2 over the near-IR VISTA Deep Extragalactic Observations (VIDEO) survey region in the XMM–LSS field [19]. Final image mosaiced of 32 pointings shows a median noise-rms of 16 μ Jy beam 1 and an angular resolution of 4 .5. It is the deepest 1.4 GHz survey over the largest area (5.0 deg 2 ) in the XMM–LSS field, and it detects a total of 5762 individual radio sources above 5 σ flux limit.
We note that the XMM–LSS field is also surveyed at 610 MHz with GMRT covering a total area of 30.4 deg 2 with a non-uniform noise-rms −200 μ Jy beam 1 in the inner area of 11.9 deg 2 , and 45 μ Jy beam 1 in the outer area of 18.5 deg 2 —and it detects 5434 radio sources at ≥7 σ level with an angular resolution of 6 .5 [20]. In principle, 610 MHz can be used to select sources showing strong spectral curvature at frequencies ≥610 MHz, however, D21 found that 610 MHz flux densities are often underestimated and unreliable. Therefore, we prefer not to use 610 MHz GMRT survey. Further, shallow 240 MHz GMRT survey (noise-rms of ∼2.5 mJy beam 1 ) and 74 MHz VLA survey with a noise-rms of 20–55 mJy beam 1 are also available in the XMM–LSS field. However, majority of our 325 MHz detected sources lack the detections in 240 MHz GMRT and 74 MHz VLA surveys owing to the large differences in their sensitivities. Hence, we find that 74 MHz and 240 MHz surveys are not useful to be combined with deep 150 MHz LOFAR and 325 MHz GMRT survey for identifying remnant candidates.

2.2. Optical Surveys in the XMM–LSS

The XMM–LSS field is covered with the HSC–SSP1, a three-tiered (wide, deep and ultra-deep), multi-band (g, r, i, z, y and four narrow-band filters) imaging survey. HSC–SSP survey is carried out with the Hyper Suprime-Cam, a wide-field camera, installed at the 8.2–m Subaru telescope. The wide component of HSC–SSP survey has a sensitivity limit of 26.2 0.3 + 0.2 mag at 5 σ level in i band, while deep component is nearly one magnitude deeper with 5 σ limit of 26.9 0.3 + 0.2 mag. We note that deep component covers only 7.0 deg 2 in the XMM–LSS (see Figure 1), hence, we use HSC–SSP wide component in the regions not covered with the deep component. The ultra-deep component is nearly 0.8 magnitude deeper than the deep component and covers only 1.7 deg 2 sky area over Subaru XMM-Newton Deep field Survey (SXDS). The 5 σ limiting AB magnitudes are measured within 2 .0 diameter apertures. For our study we use optical data from the HSC–SSP third public data release (PDR3) that provides source catalogues and images with the median seeing of 0 .6. The HSC–SSP PDR3 also provides publicly available spectroscopic redshifts (spec-z table in the data access website2 ). We note that spectroscopic redshifts are available only for relative bright sources. Therefore, we obtain photometric redshifts from [21] who derived photo-z estimates of the HSS-SSP objects.

3. Identification of Remnant Candidates of Small Angular Sizes

In the literature, remnants are identified mostly by using morphological criteria v i z . , absence of radio core and presence of diffuse amorphous shaped low-surface-brightness emission [7,8,10]. For sources of small angular sizes (LAS < 30 ) morphological details cannot be deciphered from the images with a typical resolution of 5 .0–10 . Notably, spectral curvature criterion can allow us to identify remnant candidates even among unresolved sources. One of the key examples of such RRGs is J1615+5452 which is identified mainly using the spectral curvature criterion and does not reveal much morphological details in the images of 5 .0–10 angular resolution (see [22]). Also, the absence of core supporting the remnant status of J1615+5452 was inferred from its non-detection in the moderately deep (5 σ = 0.45 mJy) 1.4 GHz VLA observations of 5 .0 resolution. We note that the core detection particularly in small sources (<30 ) poses requirement for deep (noise-rms less than a few μ Jy), high-resolution (of sub-arcsec level or even better) observations at higher frequencies (>1.4 GHz). Also, we cannot rule out the possibility of existence of a faint core falling below the detection limit even in the deep high-frequency observations. Hence, we exploit the spectral curvature criterion to identify candidates of remnant sources of small angular sizes.

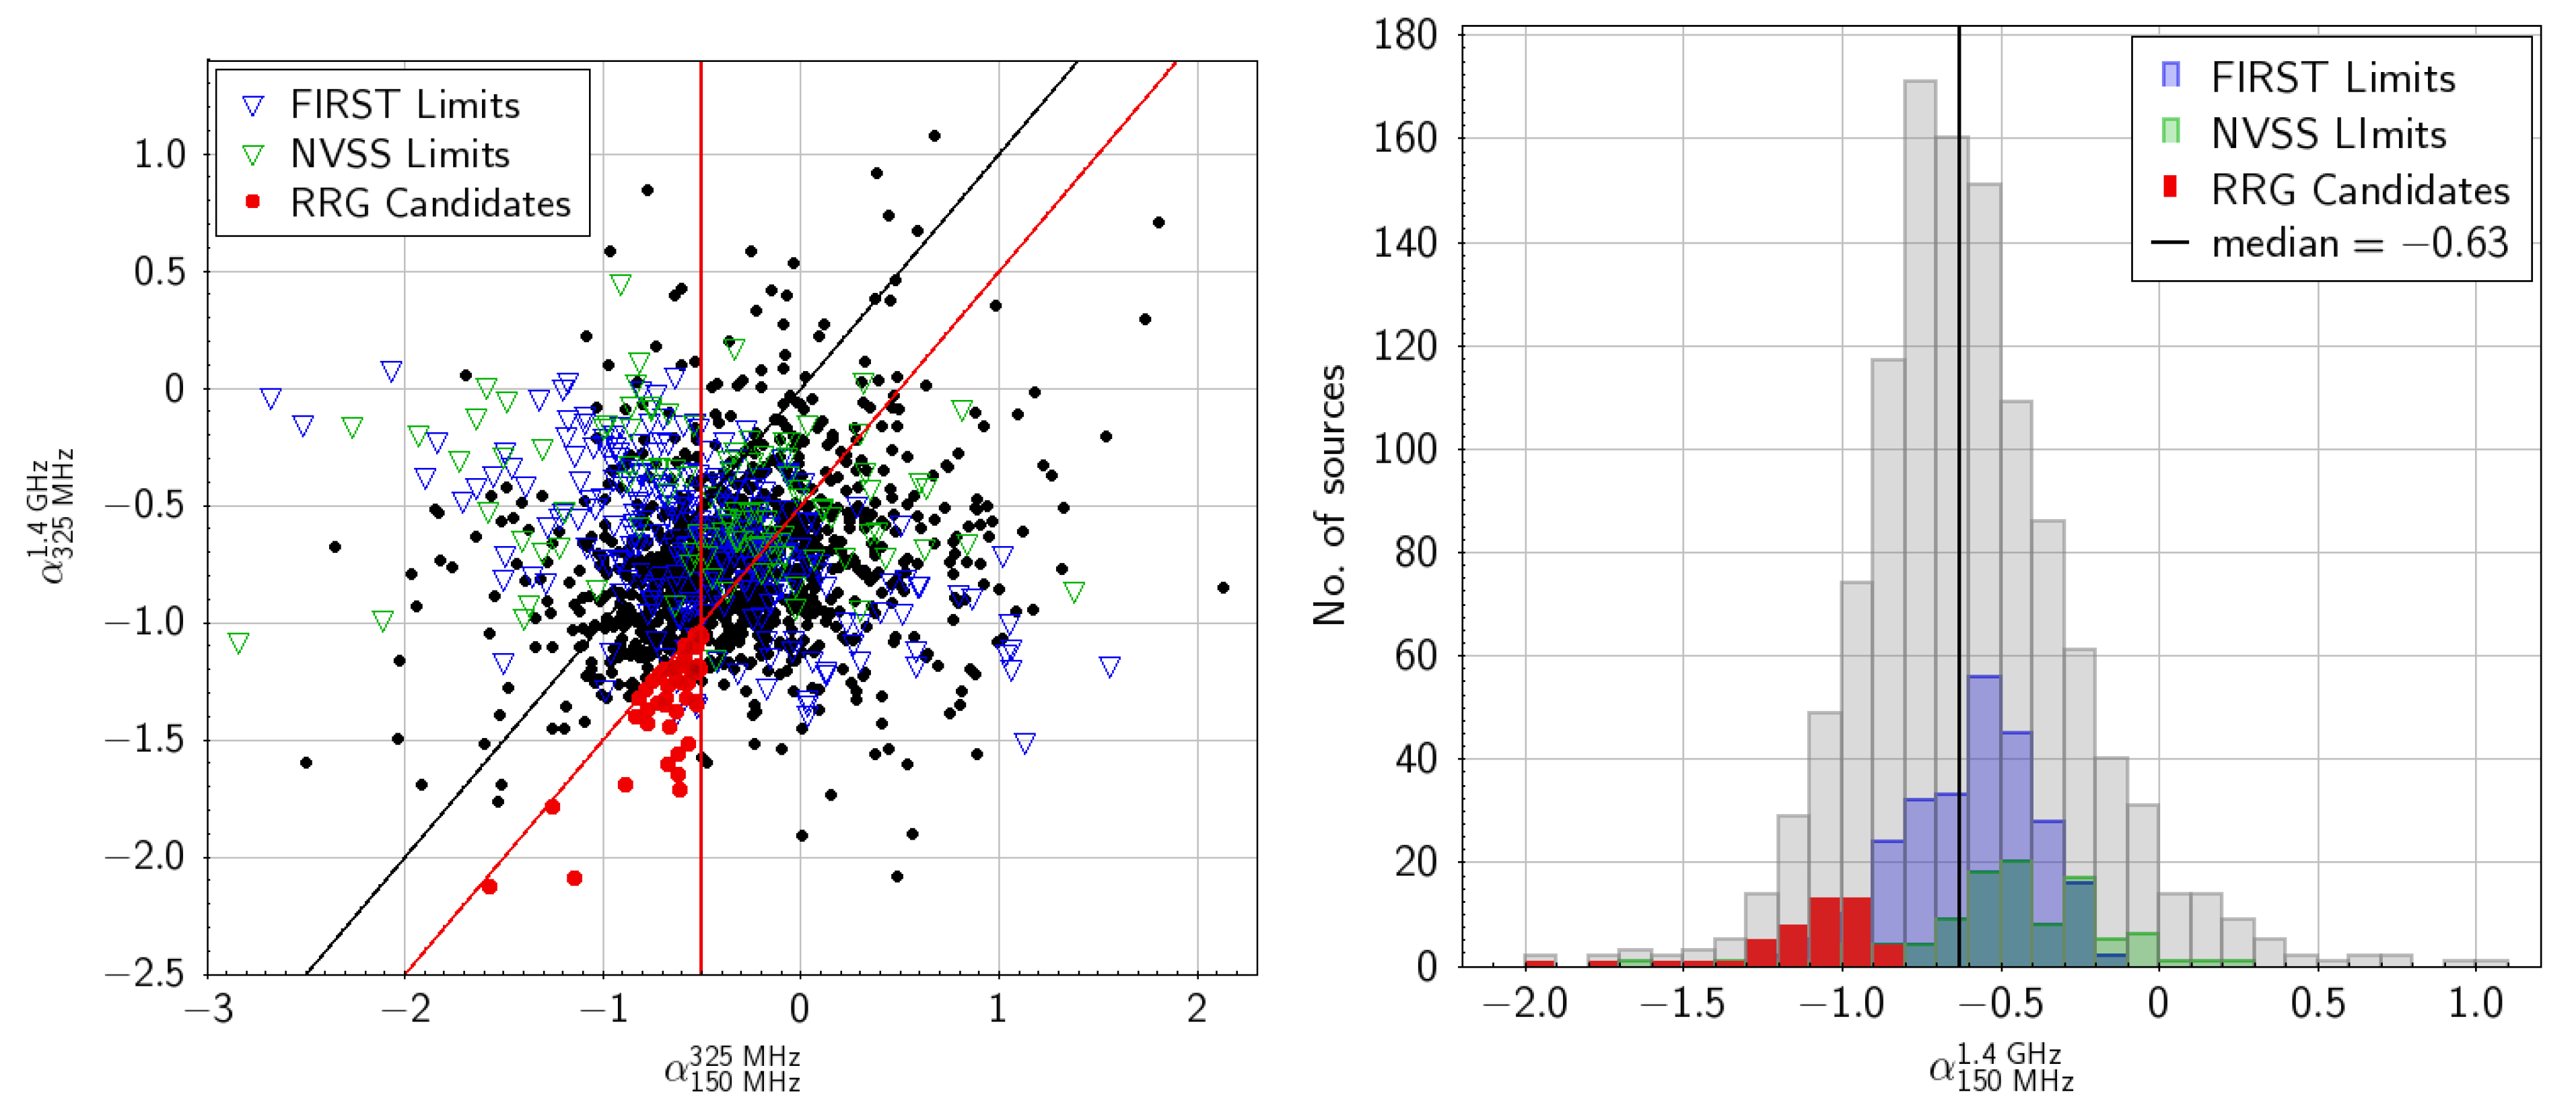
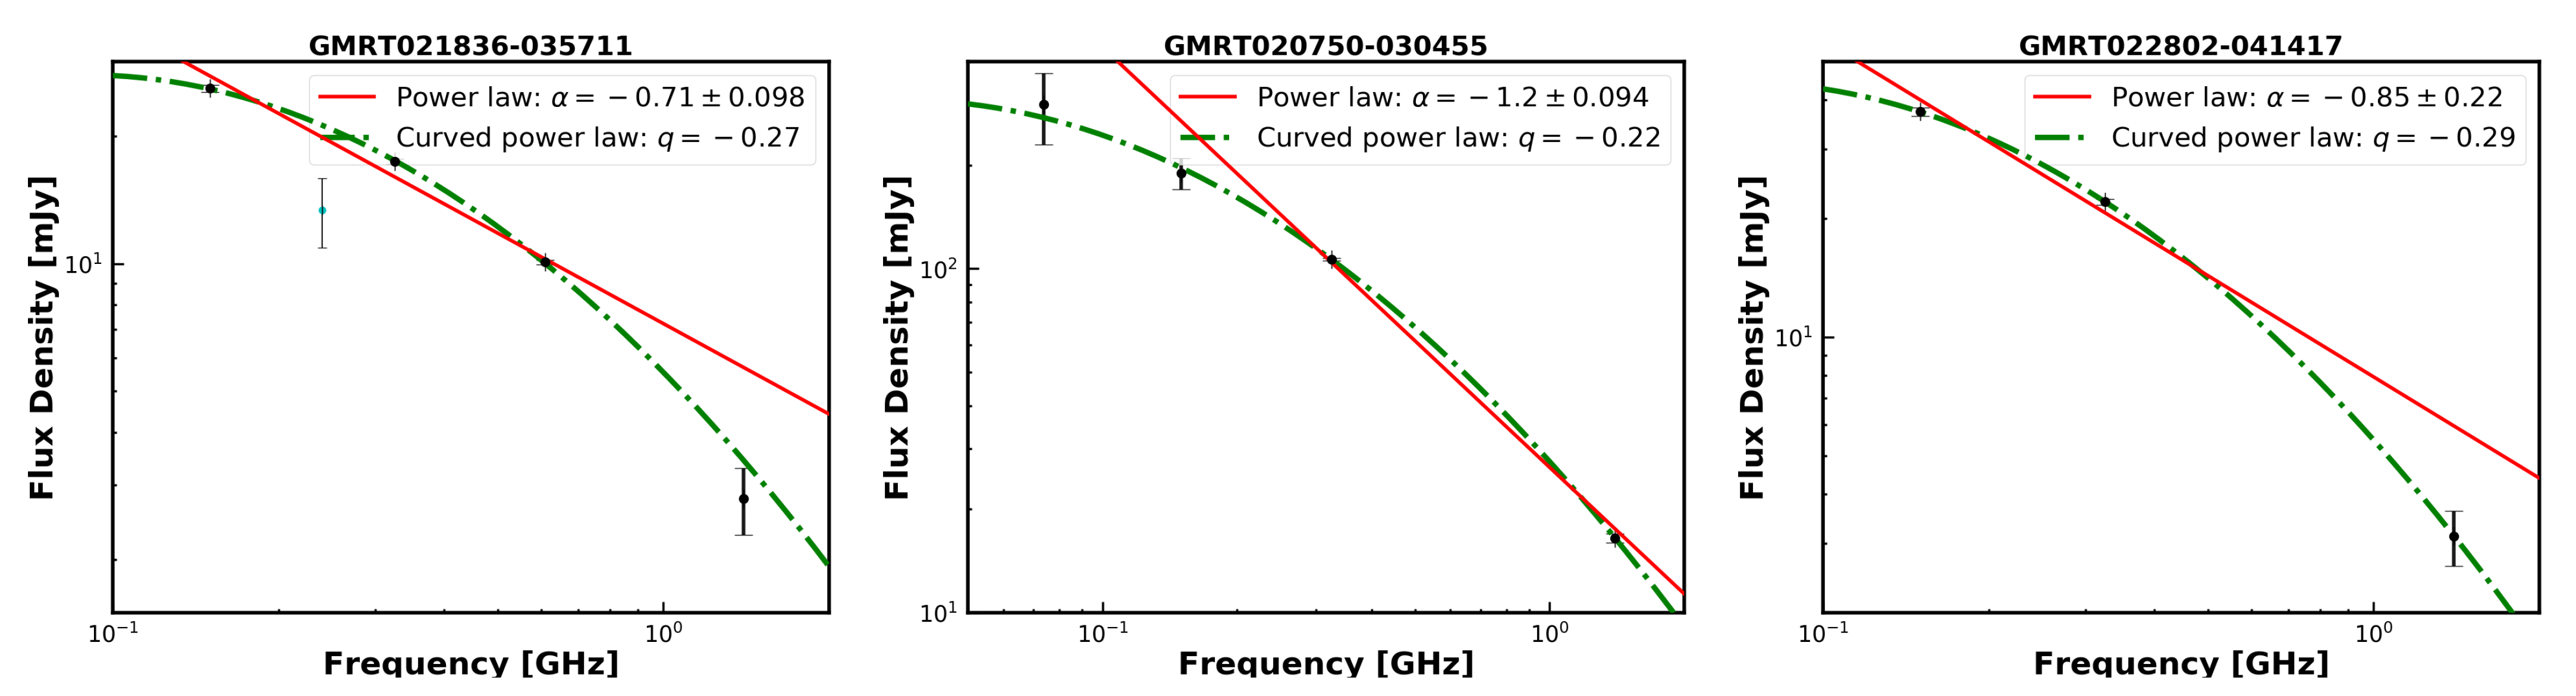
3.1. Spectral Curvature Selection Criterion

Cessation of AGN activity results into the stoppage of jets supplying plasma to the lobes. Plasma contained in radio lobes suffers radiative losses without the injection of any fresh plasma. Relativistic electrons present in the plasma lose their energy via synchrotron emission as well as Inverse Compton (IC) scattering with the Cosmic Microwave Background (CMB) photons [23]. Since electrons of higher-energy lose their energy faster than the low-energy electrons, a spectral break in the power law radio spectrum develops such that the spectrum becomes steeper at higher frequency above the break frequency ( ν b ), while spectrum continues to exhibit original spectral index below ν b . Thus, radio spectrum of a remnant source can be represented by a broken power law or a curved power law that exhibits spectral index same to that of injected plasma α inj , typically in the range −0.5 to −1.0, below ν b , and a steeper spectral index α inj − 0.5 above ν b [5,24]. According to spectral aging models, with time, ν b progressively shifts towards lower frequencies [25]. To identify radio sources showing curved radio spectrum we examine the difference between low-frequency and high-frequency spectral indices i.e., Δ α = α low α high . In fact, Δ α depicts spectral curvature parameter (SCP)—an indicator of evolutionary stage of a radio galaxy, and the typical value of Δ α is ≥0.5 for a RRG (see [5]). In our study, we define Δ α = α 150 MHz 325 MHz α 325 MHz 1.4 GHz , and consider Δ α ≥ 0.5 as a characteristic signature of remnant. We note that the spectral curvature criterion selects only a fraction of remnants that show strong curvature (≥0.5) within the considered frequency coverage of 150 MHz–1.4 GHz. Remnants with spectral break ( ν b ) falling outside the frequency window of 150 MHz–1.4 GHz and even below 325 MHz would be missed in our study. In following subsection we describe the identification of remnant candidates.

3.2. 325 MHz GMRT Sources of Small Angular Sizes

Our initial sample is consisted of 2513 radio sources detected in the 325 MHz GMRT survey with the signal-to-noise ratio (SNR) ≥ 7 and LAS < 30 . The SNR cutoff is chosen to avoid any contamination from spurious sources. While, cutoff on the LAS is applied owing to the fact that the sample of extended radio sources with LAS ≥ 30 is already probed to search for RRGs reported in D21. To use spectral curvature criterion we obtain low-frequency ( α 150 MHz 325 MHz ) and high-frequency ( α 325 MHz 1.4 GHz ) spectral indices of 325 MHz GMRT sources by finding their counterparts at 150 MHz and 1.4 GHz. Table 1 lists the number of 325 MHz sources with counterparts at 150 MHz and 1.4 GHz.

3.2.1. Counterparts at 150 MHz and 1.4 GHz

We search 150 MHz counterparts of 325 MHz GMRT sources using 150 MHz LOFAR survey, whenever available, otherwise a relatively shallow 150 MHz TIFR GMRT Sky Survey (TGSS; [26]) is used. We find that 2179 out of 2513 (86.7%) sources fall within the LOFAR survey region owing to a substantially large overlap between 325 MHz GMRT survey and 150 MHz LOFAR survey (see Figure 1). Cross-matching of 325 MHz GMRT sources to 150 MHz source catalogue with a search radius of 15 gives only 1480 sources. We note that a larger search radius of 15 is considered due to large positional uncertainties (a few arcsec) associated with faint diffuse sources detected at both frequencies. In fact, majority of sources are found to be matched within 5 radius. The number of cross-matched sources by chance is only 1.6%, if source density of 300 deg 2 in the 325 GMRT survey is considered. The non-detection of 699/2179 (32%) of 325 MHz GMRT sources in the LOFAR survey can be understood due to their low flux densities i.e., fainter source population. We find that the 325 MHz flux density distribution for the non-detected sources peaks around 1.0 mJy and most of the sources are fainter than 2.0 mJy.
For 334 radio sources falling outside the LOFAR survey region we searched 150 MHz counterparts using TGSS source catalogue having flux density limit of 24.5 mJy at 7 σ . We find that only 36 relatively bright sources (S 325 MHz ≥ 11 mJy) show counterparts in the TGSS. Thus, we have a total of 1516 sources detected at both 325 MHz and 150 MHz frequencies, providing the estimates of spectral index between 150 MHz–325 MHz ( α 150 MHz 325 MHz ). We do not consider sources for which low-frequency spectral indices are unconstrained i.e., no detected counterparts at 150 MHz. Hence, our study is limited to the sample of 1516 radio sources detected at the both 325 MHz and 150 MHz frequencies.
To estimate high-frequency (325 MHz–1.4 GHz) spectral index we attempt to find 1.4 GHz counterparts for 1516 sources by using the NVSS, whenever available, otherwise JVLA and FIRST surveys are used. We prefer to use the NVSS survey due to its large beam-size (45 ) that is more effective in capturing low-surface-brightness-emission often associated with remnant sources. We find that only 599/1516 sources show 1.4 GHz counterparts in the NVSS catalogue within a search radius of 15 . Low detection rate in the NVSS is due to its higher detection limit of 2.5 mJy at 5 σ , that corresponds to nearly 7.0 mJy at 325 MHz, if a typical spectral index of −0.7 is assumed. We caution that the large beam-size of NVSS (45 ) can occasionally suffer contamination from the neighboring sources which can result spectral index flatter than the true value. For 917 sources with no counterparts in the NVSS we search for the 1.4 GHz counterparts using JVLA survey, if available, otherwise the FIRST survey. We find that only 434 sources fall within the JVLA survey region, and 430/434 sources show counterparts in the 1.4 GHz JVLA survey. High detection rate in the JVLA survey is due to its high sensitivity (0.08 mJy at 5 σ ). Among remaining 483 sources we find 1.4 GHz counterparts of only 131 sources in the FIRST survey. We note that, for 356 sources with no detected counterparts at 1.4 GHz, we place an upper limit of 2.5 mJy based the NVSS detection limit, if source is resolved, otherwise a more stringent upper limit of 1.0 mJy is placed based the FIRST survey.

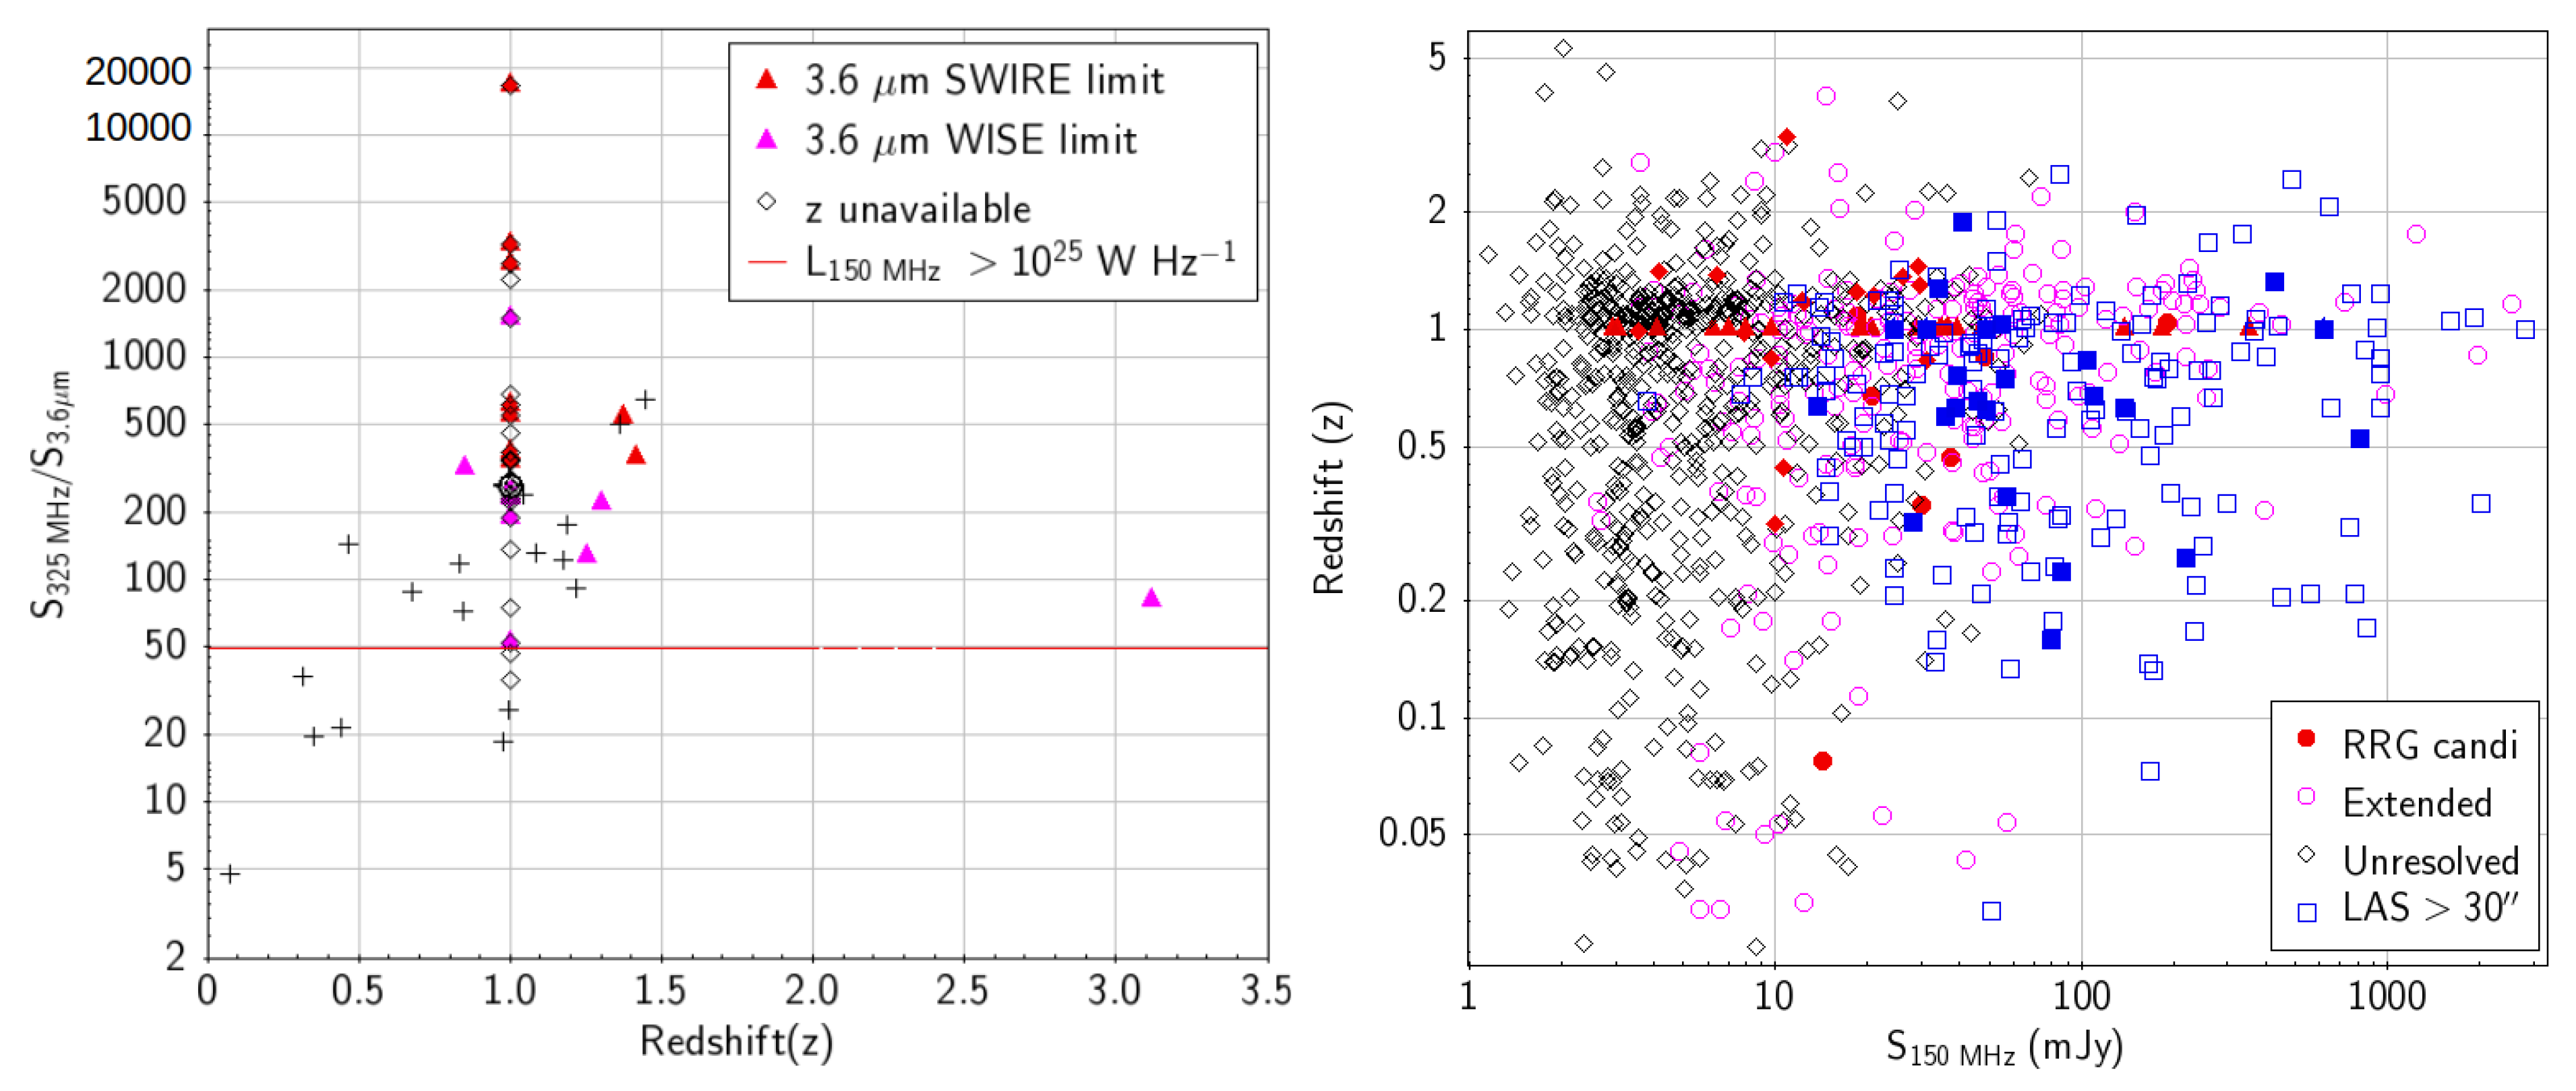
3.2.2. Remnant Candidates Identified from α low vs. α high Diagnostic Plot

We use α low versus α high diagnostic plot to identify remnant candidates exhibiting strong spectral curvature. With our spectral coverage limited to only three frequencies i.e., 150 MHz, 325 MHz and 1.4 GHz, we consider α low = α 150 MHz 325 MHz and α high = α 325 MHz 1.4 GHz .
Figure 2 (Left panel) shows α 150 MHz 325 MHz versus α 325 MHz 1.4 GHz plot for our sample of 1516 sources that include upper limits on α 325 MHz 1.4 GHz for 356 sources. We find that our sources exhibit concentration at α 150 MHz 325 MHz = −0.36, and α 325 MHz 1.4 GHz = −0.79 that are the median values of respective spectral index distributions. The substantial difference between the median spectral indices at lower and higher frequencies suggests spectral aging even in active sources. This fact is also evident from a systematic shift for a majority of sources from the line representing α 150 MHz 325 MHz = α 325 MHz 1.4 GHz (black diagonal line) towards α 150 MHz 325 MHz = α 325 MHz 1.4 GHz + 0.5 (red diagonal line) in Figure 2 (Left panel). Sources showing strong spectral curvature of Δ α (= α 150 MHz 325 MHz α 325 MHz 1.4 GHz ) ≥ 0.5 fall beyond the α 150 MHz 325 MHz = α 325 MHz 1.4 GHz + 0.5 line. We note that while identifying remnant candidates of strong spectral curvature we avoid radio sources showing flat and inverted spectral index at lower frequency i.e., α 150 MHz 325 MHz > −0.5, that is understood to arise from Self-Synchrotron Absorption (SSA) caused by an active core. Thus, we identify sources showing spectral curvature ( Δ α ) ≥ 0.5, and low-frequency spectral index steeper than −0.5 (sources falling within the region bounded by α 150 MHz 325 MHz = α 325 MHz 1.4 GHz + 0.5 line and α 150 MHz 325 MHz =−0.5 line in Figure 2, (Left panel)) as the potential candidates of remnants. We find only 48 remnant candidates with 06 sources having only upper limit on the 1.4 GHz flux density. Table 2 shows the list of our 48 remnant candidates. We caution that strong spectral curvature seen for our remnant candidates can be affected by the resolution bias i.e., unlike 150 MHz and 325 MHz, 1.4 GHz observations especially from the JVLA and FIRST can underestimate the flux density by missing the detection of diffuse low-surface-brightness emission.

4. Characteristics of RRG Candidates

In this section we describe characteristics properties of our remnant candidates and compare them with active sources.

4.1. Broad-Band Spectral Index ( α 150 MHz 1.4 GHz )

Active sources are generally expected to show power law radio spectrum with a spectral index in the range of −0.5 to −1.0. Spectral turn over caused by SSA is often seen in active sources with a peak ( ν p ) ≤ 1.0 GHz, that shifts towards lower frequencies as a radio source evolves and becomes lobe-dominated [3]. In contrast, remnant sources exhibit power law spectrum with a spectral break that progressively shifts towards lower frequency as the remnant source evolves with time [5]. Therefore, spectral index measured over a broad range can give us a clue about the evolutionary stage of a radio source. We estimate spectral index between 150 MHz and 1.4 GHz ( α 150 MHz 1.4 GHz ), the widest spectral coverage available, for our sample sources. Figure 2 (Right panel) shows the spectral index ( α 150 MHz 1.4 GHz ) distributions of our remnant candidates and active sources. Spectral index ( α 150 MHz 1.4 GHz ) for our remnant candidates is found to be distributed in the range of −1.94 to −0.86 with a median value of −1.04. While, active sources have α 150 MHz 1.4 GHz is the range of −1.91 to 1.09 with a median value of −0.61. Thus, it is evident that our remnant candidates show systematically steeper spectral index than that for the active sources. The two-sample KS test shows that the distributions of α 150 MHz 1.4 GHz for our remnant candidates and active sources are different (see Table 3). We caution that the systematically steeper spectral index of our remnant candidates can be the result of selection criteria bias i.e., strong spectral curvature ( Δ α ≥ 0.5) and α 150 MHz 325 MHz < −0.5. We find that the radio spectra of our remnant candidates are better fitted by a curved power law that is defined as S ν = S 0 ( ν / ν 0 ) α e q ( l n ν ) 2 , where q parameterises the curvature of spectrum such that q < 0 represents a convex spectrum (see [10]). For optically-thin synchrotron emission arising from radio lobes, typical value of q ranges over 0.2 q 0 . We find that values of q parameter of our remnant candidates is generally <−0.2 consistent with an optically-thin emission from the relic lobes.
We point out that the two point spectral index α 150 MHz 325 MHz of our remnant candidates is similar to that found for the large-size remnants. For instance, large-size remnant candidates reported in D21 show α 150 MHz 1.4 GHz distributed in the range of −1.71 to −0.74 with a median value of −1.02. It is worth to note that the majority (18/24) of remnant candidates in D21 are identified using mainly morphological criteria. Also, using only morphological criterion, ref. [7] found that the spectral index ( α 150 MHz 1.4 GHz ) of their remnant candidates is distributed in the range of −1.5 to −0.5 with a median value of −0.97. Thus, we find that the spectral index distribution for our small-size remnant candidates is similar to that for the large-size remnant candidates despite being selected using different criteria. The similar spectral index distributions for our remnant candidates and large-size remnants selected from morphological criteria strengthens the remnant status of our candidates.

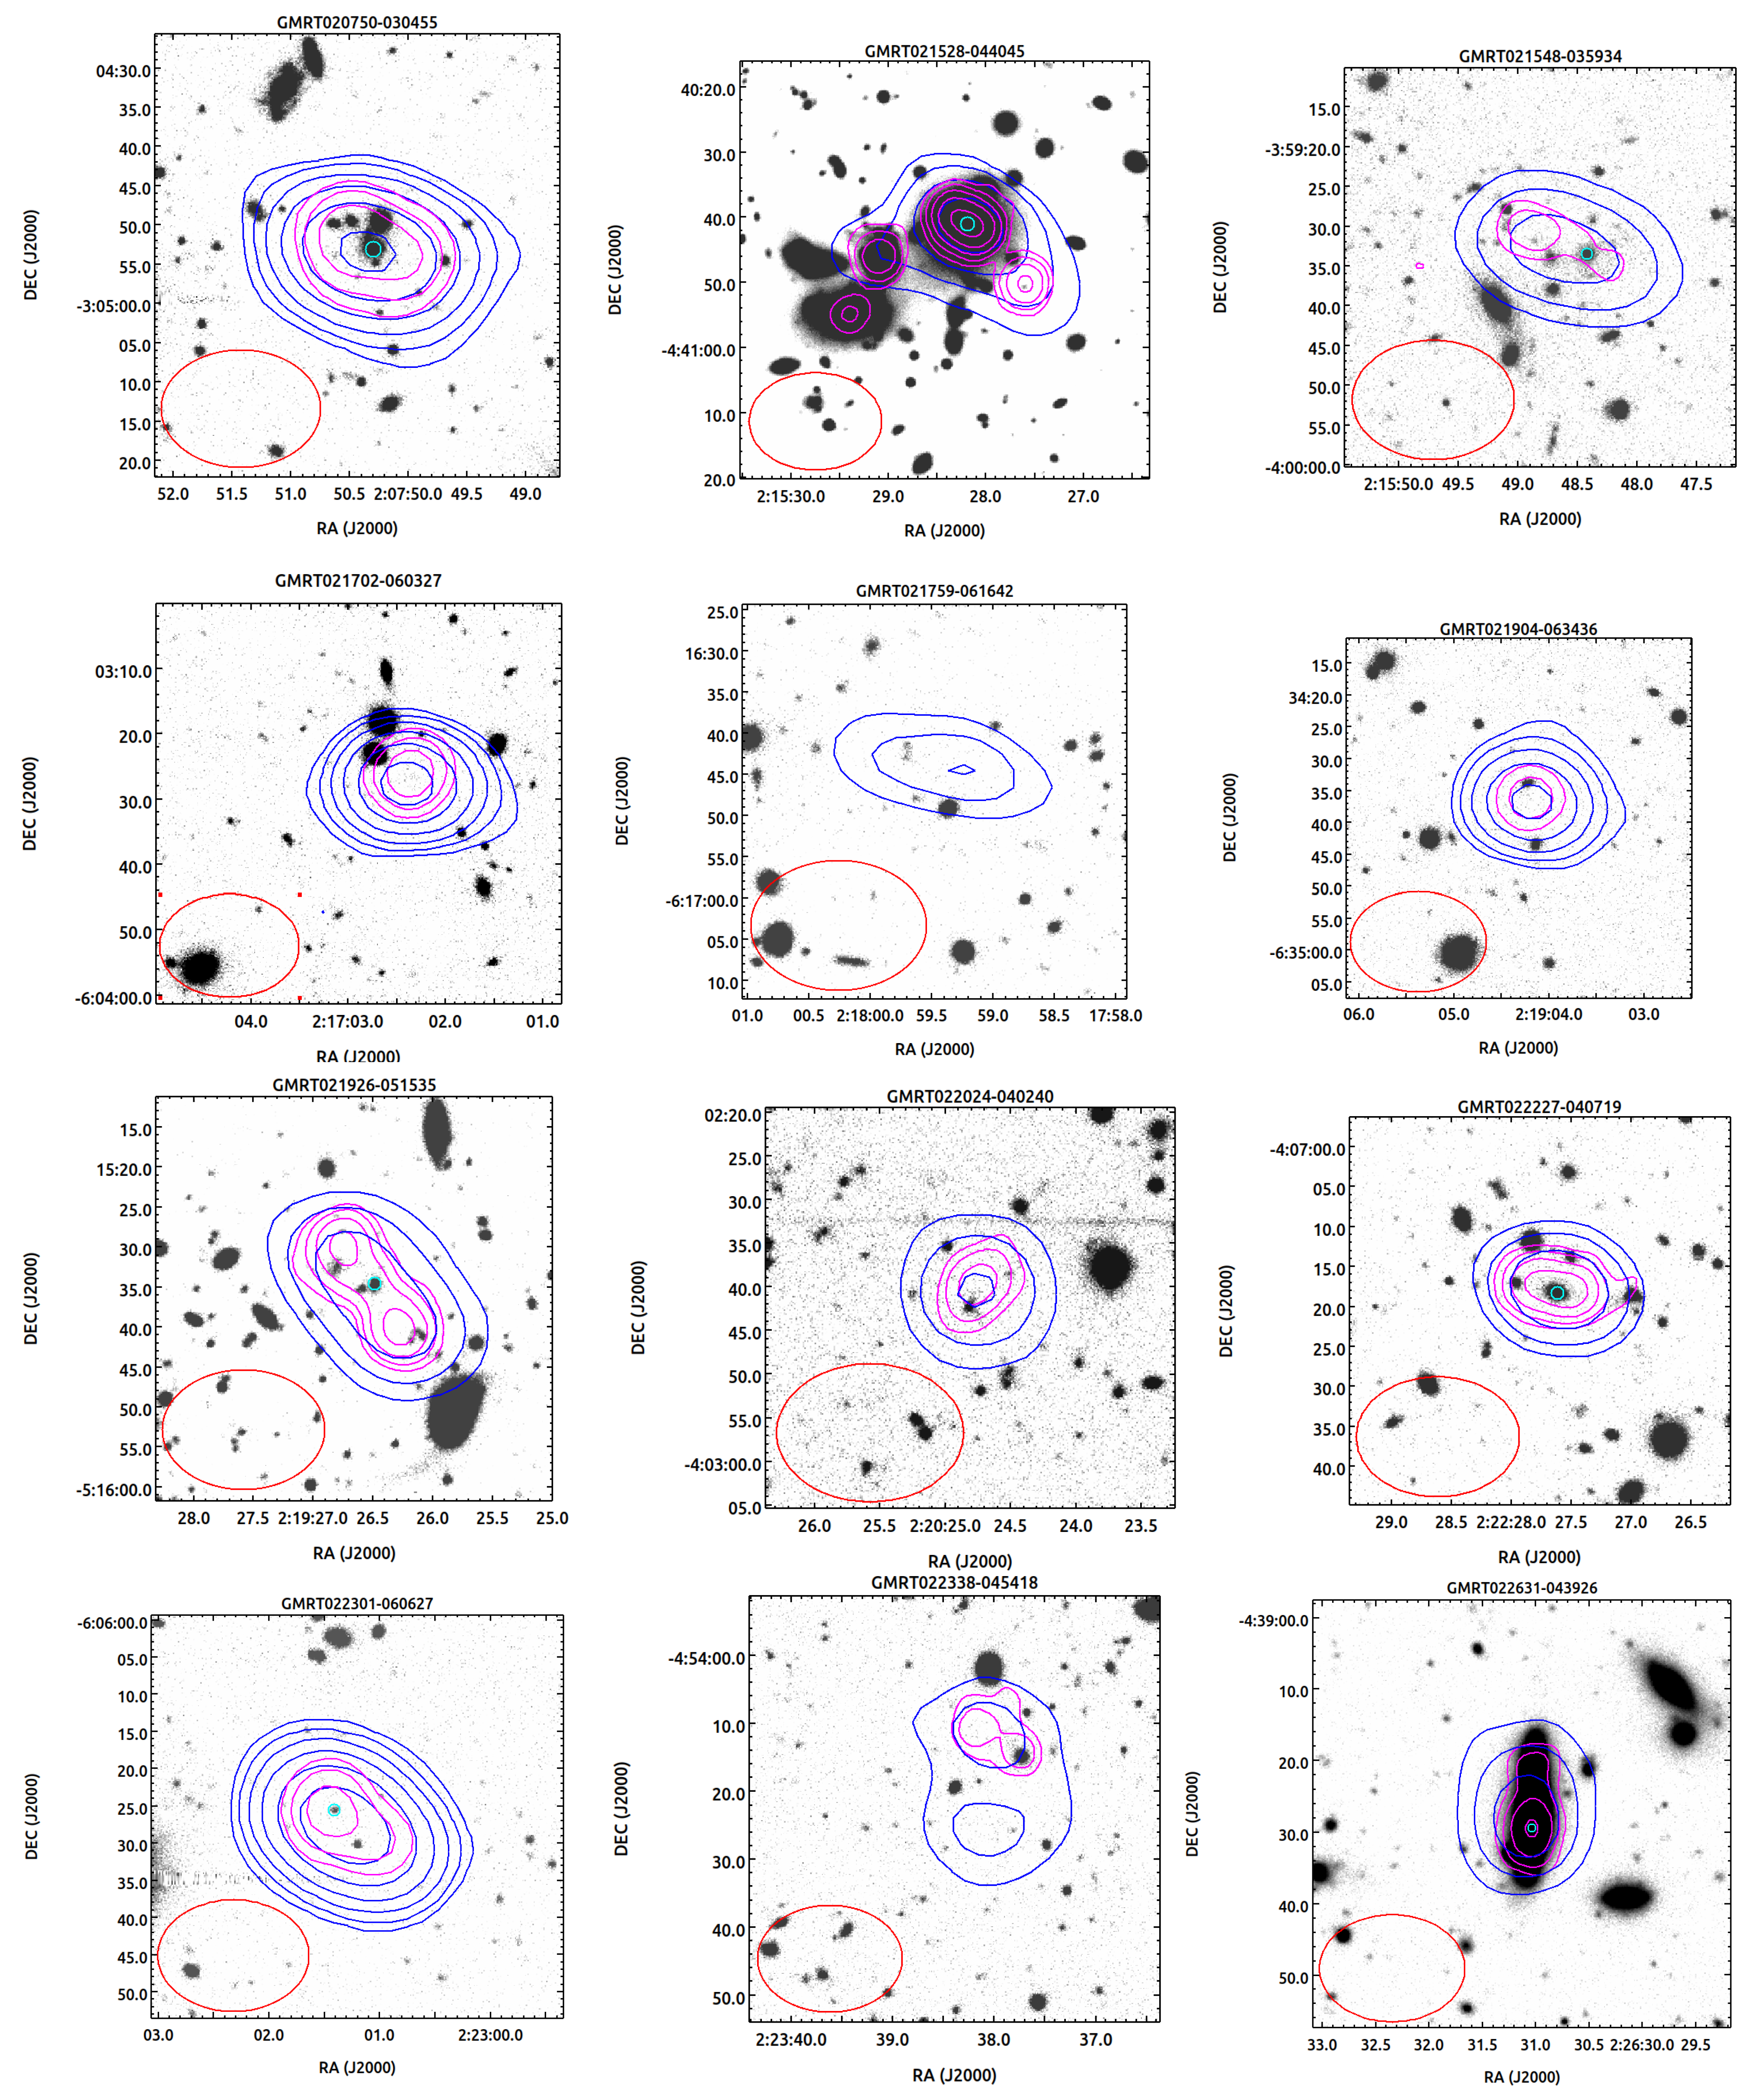
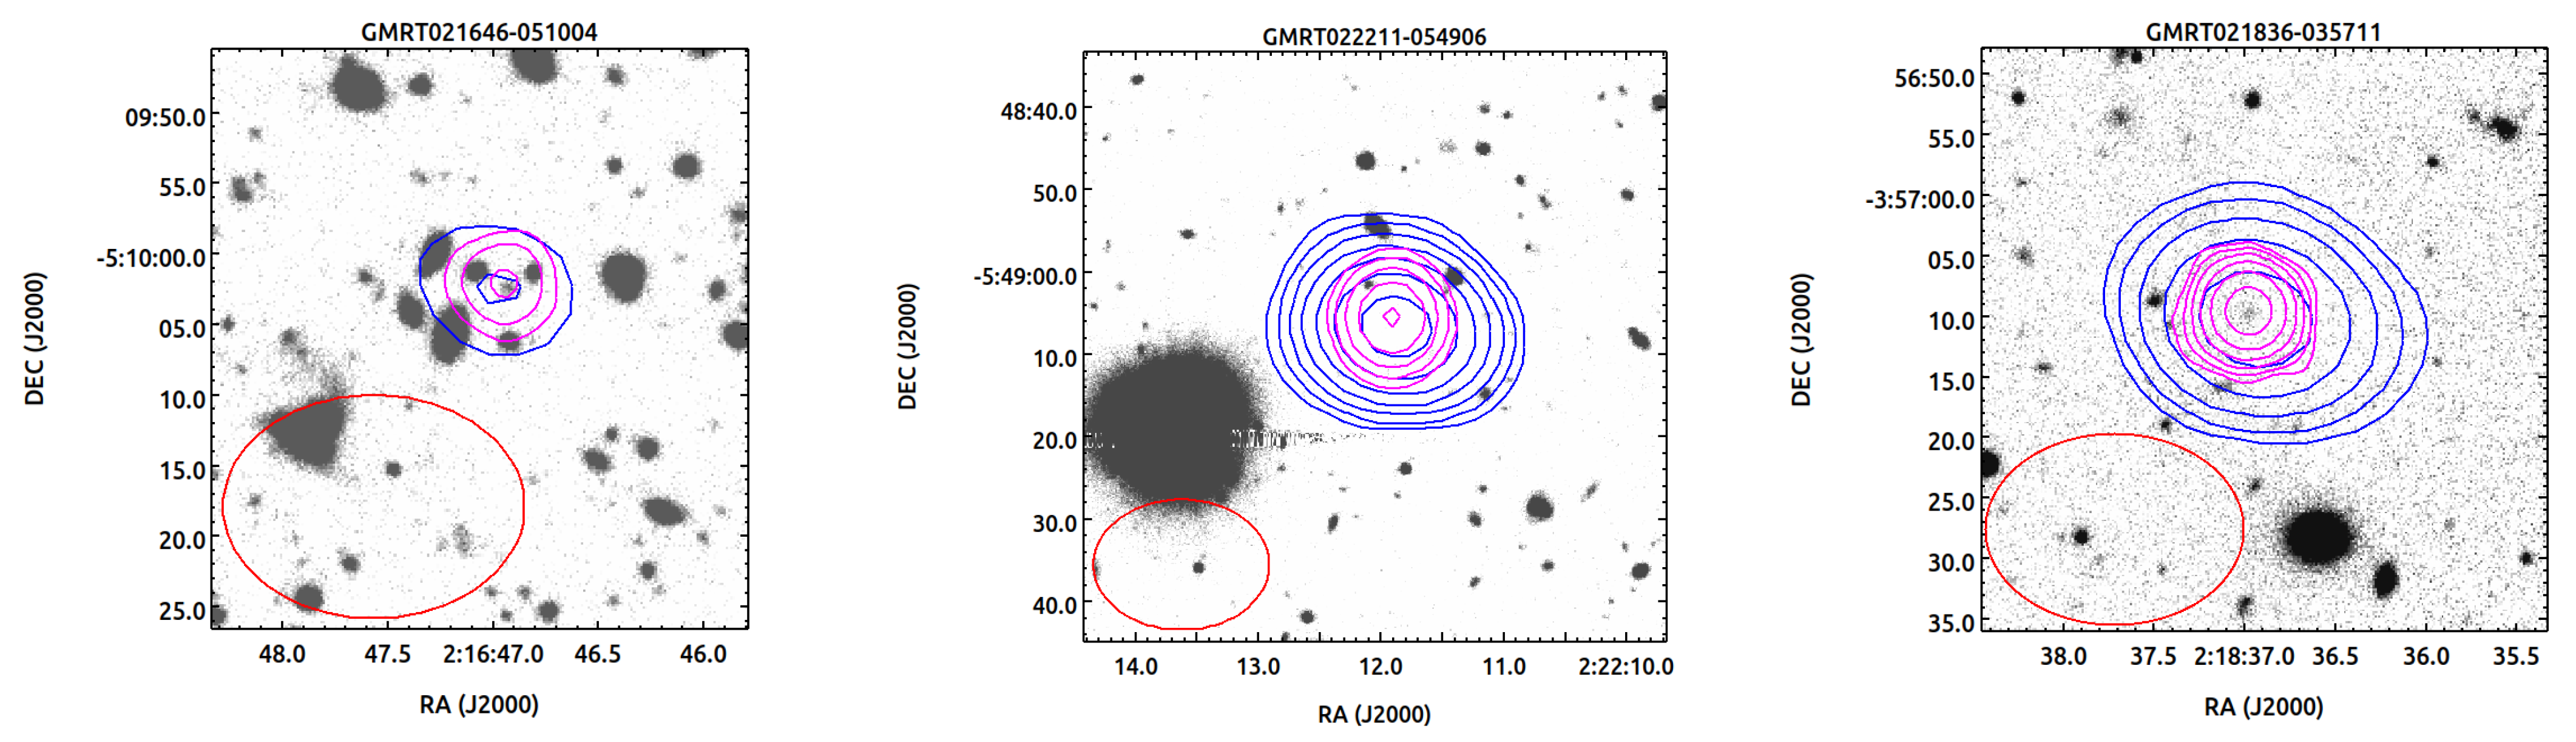
4.2. Radio Morphology

Our remnant candidates are selected to be of small-sizes (LAS ≤ 30 ), and hence, they are not well suited for revealing the morphological details. Despite the limitations imposed by small size we examine radio morphologies of our remnant candidates by inspecting 325 MHz GMRT and 1.4 GHz radio images. We use 1.4 GHz images either from the JVLA survey, whenever available, or from the FIRST survey due to their relatively higher resolution of 5 .0. We classify a source as resolved if extended emission is seen either in the 1.4 GHz image or in the 325 MHz image. We find that only 15/48 (31%) of our remnant candidates show resolved emission i.e., emission at scales larger than the synthesized beam. As expected morphological features are often seen only in the 1.4 GHz images due to its higher resolution. In Figure 3 we show radio contours (325 MHz (in Blue) and 1.4 GHz (in Magenta)) over-plotted onto the i band HSC–SSP optical images for all 15 remnant candidates. In several sources 1.4 GHz radio contours clearly show double-lobe radio morphology, for example, GMRT021926-051535, GMRT022723-051242, and GMRT022802-041417 (see Figure 3). In a few cases (GMRT022338-045418 and GMRT021759-061642), 325 MHz radio emission appears much extended than that at 1.4 GHz, suggesting the presence of diffuse relic emission detected only at the low-frequency. We note that the majority (33/48) of our remnant sources appear unresolved at both frequencies. In Figure 4 we show three examples of remnant candidates exhibiting unresolved emission—(i) a bright unresolved source GMRT022211-054906 with S 325 MHz = 121.4 ± 0.3 mJy, (ii) an unresolved source GMRT021836-035711 with intermediate level of flux density S 325 MHz = 17.4 ± 0.2 mJy, and (iii) a faint unresolved source GMRT021646-051004 with S 325 MHz = 1.93 ± 0.12 mJy. We find that both resolved and unresolved sources are present at the wide range of flux densities with S 325 MHz spanning from 1.93 mJy to 132.8 mJy with a median value of 11.2 mJy.
Also, we inspected 3 GHz Very Large Array Sky Survey (VLASS) quick look image cut-outs for all our remnant candidates. The VLASS provides wide-band (2–4 GHz) images with median noise-rms of 0.145 mJy and angular resolution of 2 .5 [27]. We find that only 10/48 of our remnant candidates show detection in the VLASS. One of our sample source GMRT020750-030455 exhibits a clear double lobe morphology with a total end-to-end projected size of 13 .6 (∼112 kpc at z = 1.04) in the VLASS image. Table 2 lists 3.0 GHz total flux densities derived from the VLASS epoch 1 quick look catalogue and the spectral index measured between 1.4 GHz and 3.0 GHz. We used only catalogue source components with duplicate_flag < 2 and quality_flag = 0, and corrected for 10% systematic underestimation of flux density. The non-detection of a large fraction (38/48 = 79%) of our remnant candidates, in particular for relatively bright sources at low-frequency (S 150 MHz > 20 mJy), in the VLASS can be understood if they posses relic emission of low-surface-brightness characterised with steep spectral index. The non-detection of relatively fainter remnant candidates can also be attributed to the shallow sensitivity of the VLASS. We note that, as expected, our remnant candidates continue to exhibit steep spectral index at higher frequency (1.4–3.0 GHz) regime. While, 05/10 of our remnant candidates detected in the VLASS show flatter spectral index ( α > −0.5) in the higher frequency regime, despite exhibiting steeper spectrum at low-frequency regime (<1.4 GHz). The changing spectral characteristics of these remnant candidates can be understood if these candidate sources depict recurrent AGN activity such that a new phase of AGN activity showing flat or inverted radio spectrum at higher frequencies co-exists along with the relic emission from the previous episode of AGN activity showing steep spectrum at lower frequencies (see [5]). In Figure 5 we show three examples of the radio spectra of our remnant candidates. Therefore, we note that a fraction of our remnant candidates can possibly show the existence of active core, if deep high-frequency observations are performed.

4.3. Redshifts

We find that only 858/1516 (56.6%) of our sample sources have optical counterparts with redshift estimates in the HSC–SSP catalogues. Spectroscopic redshifts are available for 353 sources and remaining 505 sources have photometric redshifts. Among the 48 remnant candidates only 23 sources have redshift estimates that include spectroscopic redshifts for four sources and photometric redshifts for remaining 19 sources. We find that 23 remnant candidates have redshifts in the range of 0.077 to 3.12 with a median value of 1.04. While, 835 active radio sources have a wide redshift distribution ranging from 0.026 to 5.29 with a median value of 0.81. Thus, in compared to active sources, our remnant candidates are relatively at higher redshifts. The two-sample KS test shows that the redshift distributions of our remnant candidates and active sources are somewhat different with p-value = 0.13 (see Table 3). Our 25 remnant candidates with no available redshift estimates have either undetected or too faint optical counterparts. We attempt to place a lower limit on the redshifts of these remnant candidates by using a diagnostic plot based on the ratio of 325 MHz flux density to 3.6 μ m flux density (S 325 MHz /S3.6 μm). In Figure 6 we plot S 325 MHz /S3.6 μm versus redshift plot for our remnant candidates.
We obtain 3.6 μ m flux density from the Spitzer Wide-area Infrared Extragalactic Survey (SWIRE; [28]), whenever available. For sources falling outside the SWIRE coverage we check their detection in 3.4 μ m band of the WISE all-sky imaging survey [29]. We convert 3.4 μ m flux density to 3.6 μ m by assuming a power law spectrum with index of −2 in the near-IR regime. For sources with no detection in the SWIRE and WISE images we placed an upper limit on 3.6 μ m flux density based on the 5 σ detection limits.
From Figure 6 it is evident that the ratio S 325 MHz /S3.6 μm increases with the increase in redshift, which is analogous to the well known correlation between K band magnitude and redshift (K z relation) for radio galaxies [30]. We note that all but one of our remnant candidates at z > 1.0 have ratio S 325 MHz /S3.6 μm > 100. Hence, high ratio of S 325 MHz /S3.6 μm can be considered as an indicator for high redshift. Our remnant candidates with no detected 3.6 μ m counterparts have high upper limits on S 1.4 GHz /S3.6 μm in the range of 52 to 16632 with a median value 338, similar to HzRGs. In fact, six of the 20 remnant candidates with no detected 3.6 μ m counterparts have photometric redshift estimates in the range of 0.85 to 3.11 with a median value of 1.33. Hence, considering the fact that all of our remnant candidates with no redshift estimates show high values or limits of S 325 MHz /S3.6 μm, similar to HzRGs or radio-loud AGN at z > 2 [31], we place an upper limit of z > 1.0 for all our remnant candidates with no available redshifts.

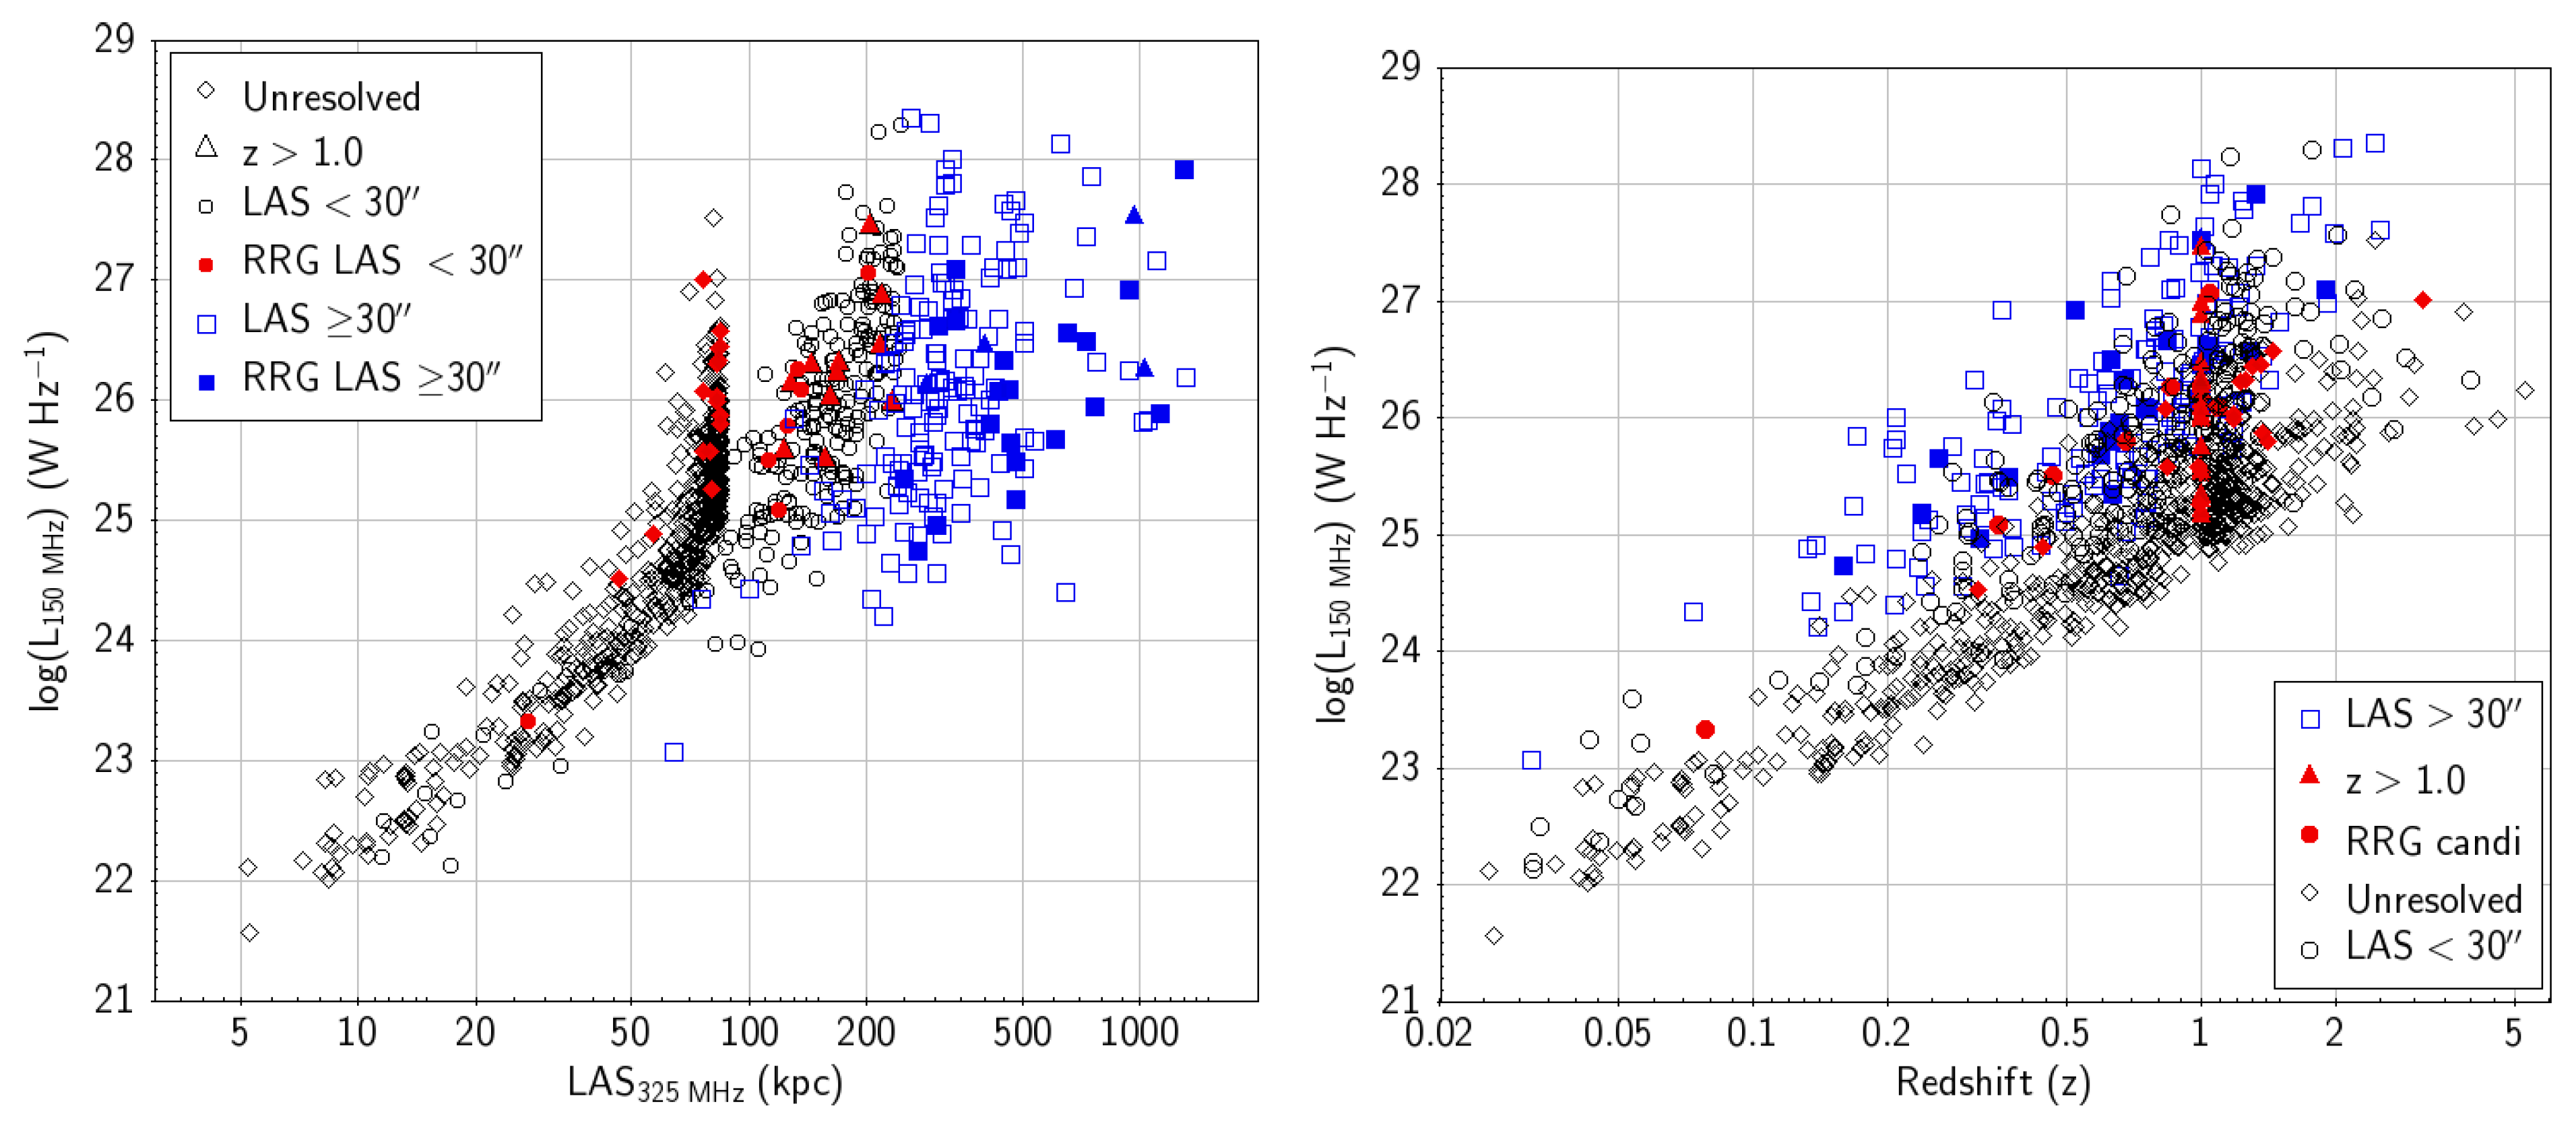
4.4. Radio Luminosity vs. Radio Size (P-D Plot)

According to the dynamical evolutionary models radio size and radio luminosity of a radio galaxy continues to increase till it becomes fully evolved with total end-to end radio size in the range of a few hundreds of kpc to even a few Mpc [3]. Once AGN activity switches off radio luminosity begins to decrease due to radiative cooling. Therefore, in compared to active sources, RRGs are expected to show lower radio luminosities but larger radio sizes similar to that for fully evolved radio galaxies. We use radio luminosity versus radio size plot, commonly known as P–D plot, to infer the evolutionary stage of our remnant candidates and compare them with active sources. We derive 150 MHz luminosity for all our sources with available redshift estimates and apply K-correction using spectral index measured between 150 MHz and 1.4 GHz (L 150 MHz = 4 π S 150 MHz D L 2 (1+z) 1 + α , where D L is luminosity distance and α = α 150 MHz 1.4 GHz ). Figure 7 (Left panel) shows the 150 MHz radio luminosity versus radio size plot for our sample sources. We note that the radio size estimates are available for only 395/1516 (26%) of our sample sources that show emission on scales larger than the synthesized beam of 10 in the 325 MHz GMRT survey. For remaining (1121/1516 = 74%) unresolved sources we place an upper limit of 10 . It is worth to mention that 1.4 GHz JVLA and FIRST images of higher resolution (5 .0) can place a tighter constraint on the radio size of apparently unresolved sources, but it would result a bias towards sources of higher surface-brightness. Also, a substantial fraction (356/1516 ∼23%; see Table 2) of our sample sources remained undetected at 1.4 GHz. Therefore, we prefer to use radio size obtained with the 325 MHz GMRT survey.
We compare linear radio sizes of our remnant candidates and active sources by considering only sources that have angular size estimates and redshifts. Sources with angular size estimates but no redshift estimates have only upper limits on their linear radio sizes. Also, unresolved sources with no redshift estimates do not allow us to place any limit on their radio sizes, hence, these sources are discarded from our analysis. We note that the redshift estimates are available for only 226/395 sources that include seven remnant candidates. We find that seven remnant candidates have linear radio size in the range of 27.1 kpc to 201.2 kpc with a median value of 124 kpc. The linear radio sizes of 219 active radio sources are distributed in the range of 11.5 kpc to 245.1 kpc with a median value of 155.4 kpc. Thus, we find that the linear radio sizes of our remnant candidates and active sources are similar. The two-sample KS test suggests that the distributions of radio sizes of active and remnant candidates not very different with D = 0.52 and p-value = 0.03 (see Table 3), even when the sample size of remnant candidates is too small. Also, our remnant candidates with upper limit z > 1.0 corresponds to the upper limit of 200 kpc for the radio sizes (see Figure 7, Left panel). Thus, we find that our remnant candidates of small angular sizes are small (<200 kpc) in their physical sizes too. It is worth to point out that the remnant candidates of large sizes reported in D21 have radio sizes distributed in the range of 241.6 kpc to 1301 kpc with a median value of 478.3 kpc (see blue points in Figure 7). Therefore, we conclude that the SPC criterion applied on the small angular size sources (LAS < 30 ) allows us to identify remnant candidates of small sizes (≤200 kpc).
To understand the nature of small-size remnant candidates we examine their radio luminosities. We find that our 23/48 remnant candidates have 150 MHz radio luminosities in the range of 2.14 × 10 23 W Hz 1 to 1.15 × 10 27 W Hz 1 with a median value of 6.17 × 10 25 W Hz 1 . While, active sources have 150 MHz luminosities distributed in the range of 3.6 × 10 21 W Hz 1 to 1.94 × 10 28 W Hz 1 with a median value of 1.48 × 10 25 W Hz 1 . The two-sample KS test shows that the 150 MHz luminosity distributions of remnant candidates and active sources are different i.e., probability that the two distributions come from same distribution is only 2 × 10 4 . We note that the active radio sources are on average less luminous and contain a substantial fraction of sources at lower luminosities down to 3.6 × 10 21 W Hz 1 . Sources of low radio luminosities can be possibly be radio-quiet AGN and star-forming galaxies. We find that, unlike active radio sources, both extended as well as unresolved remnant candidates are luminous i.e., all but one remnant candidates have L 150 MHz ≥ 10 24 W Hz 1 . Our 25/48 remnant candidates with upper limit on their redshifts (z) > 1.0 have high 150 MHz luminosities (L 150 MHz > 10 25 W Hz 1 ). Also, we point out that 150 MHz radio luminosities of our remnant candidates are similar to those of large-size remnant candidates reported in D21. Thus, we find that our remnant candidates represent a population of small-size (≤200 kpc) luminous radio sources. High 150 MHz radio luminosity of our remnant candidates can be understood if they are at high redshifts, and/or appear bright at low-frequency due to their steep radio spectra. In Section 5 we discuss the plausible reasons for their small size.

5. Remnant Candidates of Small Sizes

From P-D plot it is evident that, in general, our remnant candidates have small radio size (<200 kpc) but high radio luminosity (L 150 MHz ≥ 10 25 W Hz 1 ). The trend shown by our remnant candidates in the P-D plot is rather unusual as remnants are expected to show relatively large radio size and low radio luminosity. We note that the time evolution of both luminosity and physical size depends on the jet kinetic power, longevity of active phase, and large-scale environment of a radio source [32]. Assuming radio luminosity as the proxy for jet power, the progenitors of our remnant candidates are expected to possess high jet power. Thus, small radio-size can be expected if our remnant candidates reside in the centers of cluster environments wherein dense surrounding medium confines the growth of radio source [5]. We investigated the large-scale environments of our remnant candidates by checking their association with the clusters detected in the XMM–LSS region. We used optically-selected cluster catalogue derived from the HSC–SSP survey [33] and X-ray selected cluster catalogue based on the deep XMM-N survey [34]. Deep multi-band images of the HSC–SSP survey detect clusters over a wide range of redshifts 0.1 < z < 1.1 with photometric redshift accuracy of Δ z/ (1 + z) < 0.01 and richness (N gal ) ≥ 15 accounting galaxies brighter than 24 magnitude in z band [33]. The XMM-N survey detects hot X-ray emitting gas present in the Intra-Cluster Medium (ICM) with the flux limit of a few times of 10 15 erg s 1 cm 2 in 0.5–10 keV band within 1 . 0 aperture [34]. Follow-up optical spectroscopic observations found X-ray detected clusters to be distributed over 0.0 < z < 1.2 with one cluster at z = 2.0. We find that only two of our remnant candidates GMRT021408-053456 and GMRT021528-044045 are associated with clusters at z = 0.445 and z = 0.348, respectively, within a matching radius of 1 .0 and the redshift uncertainty of Δ z/ (1 + z) < 0.01. Remnant candidates GMRT021408-053456 and GMRT021528-044045 lie at the projected distance of nearly 2 .2 (12.7 kpc) and 5 .4 (26.8 kpc) away from the optically assigned cluster centers, respectively. Since only 15 remnant candidates fall within the clusters redshift cutoff limit z < 1.2, the fraction of remnant candidates associated with clusters is merely 13% (02/15) in our sample. Our result is consistent with [8] who found that only a small fraction (23%) of their remnants reside in the cluster environments. Hence, we conclude that our small size remnant candidates generally reside in a less dense environments.
The small size of our remnant candidates showing high radio luminosity and residing in non-cluster environments can be plausible if the active phase of these radio sources is unusually short (<50 × 10 6 years). Also, we caution that the high monochromatic radio luminosity may not necessarily imply high jet kinetic power due to degeneracy caused by variable parameters such as magnetic field strength in lobes and spectral curvature [35]. Thus, it is possible that progenitors of our remnant candidates can possess low power jets resulting into smaller radio size. Further, projection effect can also play a role i.e., a remnant in which jet axis were closely aligned to the line-of-sight would appear smaller in size. In addition to above factors we cannot rule out that if some of our remnant candidates possess very low-surface-brightness emission that remained undetected in the 325 MHz GMRT images, and hence, we underestimate their radio sizes.

6. Remnant Fraction

The fraction of remnant sources in a sample of radio galaxies can allow us to constrain the AGN duty cycle and remnant evolutionary models. We attempt to determine the remnant fraction ( f rem ) in our sample of small size (LAS < 30 ) radio sources. The small size of our sources does not allow us to characterise their radio morphologies in detail, and hence, we cannot rule out the possibility of some of them being active with the presence of a faint core. Also, the identification of remnants based on the spectral curvature can be erroneous due to the resolution bias i.e., when 1.4 GHz flux density from the FIRST or JVLA observations of relatively higher resolution is used. Thus, remnant sources identified in our study are only candidates and allow us to place only an upper limit on f rem . With the identification of 48 remnant candidates in a sample of 1516 radio sources we obtain f rem ≤ 3.2%. The upper limit on the remnant fraction would reduce to 2.8% if we exclude five remnant candidates with possible recurrent AGN activity. We note that f rem found in our sample of small-size sources is much lower than that reported for large-size radio sources. For instance, using absent-core criterion [7] found f rem ≤ 9% in a sample of 127 bright (S 150 MHz ≥ 80 mJy) and large (LAS ≥ 40 ) radio sources detected in the 150 MHz LOFAR survey. In the Lockman Hole field [8] reported f rem ≤ 8.0% in a sample of 158 sources with S 150 MHz ≥ 40 mJy and size ≥ 40 . D21 obtained f rem ≤ 9% in a sample of 268 sources with flux density limit cutoff of 6.0 mJy at 325 MHz that corresponds to 10 mJy at 150 MHz, and a size cutoff limit of 30 . With the availability of deep 1.4 GHz JVLA survey in the XMM–LSS–JVLA region D21 placed a tighter constraint on f rem to be ≤5%. A significantly lower value of f rem ≤ 3.2% found in our sample consists of small-size sources (<30 ) can be attributed to various factors such as—(i) a single criterion based on the spectral curvature fails to identify all remnants and selects only those remnants for which spectral break falls within the frequency coverage of 150 MHz to 1.4 GHz, (ii) remnants depicting the last evolutionary phase of radio galaxies are generally of larger size, and only a low fraction of remnants appear small as they fail to grow large, (iii) sources at fainter flux densities have substantial contamination from radio-quiet AGN and star-forming galaxies. In following subsection we discuss the effects of various biases.

6.1. Selection Criteria Bias

Radio spectrum of a remnant source can be characterized with a broken or curved power law wherein break frequency ( ν b ) depends on the time elapsed since the cessation of AGN activity (see Section 3.1). As the relic plasma ages ν b shifts progressively towards the lower frequency. Our spectral curvature criterion used in the frequency range of 150 MHz to 1.4 GHz would miss old remnants with ν b < 150 MHz as well as young remnants with ν b > 1.4 GHz. Limitations of the spectral curvature criterion are evident from the fact that D21 identified only 09/24 of their remnant candidates using spectral curvature criterion. Thus, spectral curvature criterion allows us to identify only a fraction of remnant candidates and not the full population. Hence, a low fraction of remnant (3.2%) found in our study can partly be attributed to the use of only one criterion.

6.2. Flux Density and Luminosity Bias

Our 1516 sample sources have 325 MHz flux densities in the range of 0.78 mJy to 1511 mJy with a median value of 4.8 mJy, while 48 remnant candidates are distributed across 1.93 mJy to 132.0 mJy with a median of 11.2 mJy (see Table 3). From Figure 6 (Right panel) it is evident that our sample contains increasingly a large fraction of sources at the fainter end reaching down to 1.0 mJy. If we place a flux density limit of S 325 MHz ≥ 6.0 mJy or S 150 MHz ≥ 10 mJy, similar to that used by D21, we obtain only 34 remnant candidates among 655 radio sources, yielding f rem to be ≤ 5.2%. Thus, one of the reasons for the low remnant candidates fraction ( f rem ≤ 3.2%) in our sample is flux density bias. This can be understood as the faint source population is likely to be dominated by non radio-loud AGN while remnant candidates belong to the radio-loud AGN population. The flux density bias also translates into luminosity bias. If we place a luminosity cutoff limit of L 150 MHz ≥ 10 24 W Hz 1 we recover a high fraction 22/23 (95.7%) of our remnant candidates but a relatively lower fraction 680/835 (81%) of active sources, where only sources with estimated radio luminosities or available redshifts are considered. The different recovery rates for remnant and active sources can be explained if remnant candidates are of higher luminosities and active sources contain a large fraction of low-luminosity sources from non radio-loud sources. Therefore, we demonstrate that a substantial contamination by non radio-loud population, in particular towards fainter flux densities, is one of the reasons for the low remnant fraction.

6.3. Redshift Bias

In our sample only 23/48 remnant candidates have redshift estimates distributed in the range of 0.077 to 3.12 with a median value of 1.04. For remaining 25/48 remnant candidates we place an upper limit of z > 1.0 based on the ratio of 325 MHz flux density to 3.6 μ m flux density. Thus, we find that our remnant candidates tend to lie at higher redshift with 37/48 (77%) sources at z > 1.0. It is worth to point out that using the same data D21 found that their remnant candidates of large-size (LAS ≥ 30 ) lie systematically at lower redshifts in the range of 0.139 to 1.895 with a median value of 0.65. Therefore, unlike large-size remnant candidates reported in D21 majority of our remnant candidates appear small due to higher redshifts. From Figure 6 (Right panel) it is clear that many remnant candidates of small angular sizes identified in our study tend to lie at higher redshifts and fainter flux densities. Hence, our study probes a somewhat different phase space in the flux density versus redshift plot. Therefore, it is possible that the sample containing high–z radio sources may have different remnant fraction.

6.4. Fraction in the XMM–LSS−JVLA Region

There are a total of 637 radio sources falling within the 5.0 deg 2 of the XMM–LSS–JVLA region, while only 25 remnant candidates are identified within this region. We obtain f rem < 3.9% in the XMM–LSS region which is little higher than that found for the full sample ( f rem < 3.2%). Slightly higher fraction in the JVLA survey region can be due to the availability of deeper 1.4 GHz data (5 σ = 0.08 mJy). We note that all but four of 356 sources with no detected 1.4 GHz counterparts fall outside the XMM–LSS–JVLA region, and upper limits on 1.4 GHz flux density is based on the FIRST (5 σ = 1.0 mJy) and NVSS (5 σ = 2.5 mJy). It is fairly possible that several sources with no detected 1.4 GHz counterparts can have 1.4 GHz flux densities much lower than their upper limits, and hence, these sources can show strong spectral curvature ≥0.5, if 1.4 GHz flux density estimates are available. Therefore, a fraction of active sources having only 1.4 GHz flux density upper limits can possibly turn out to be remnant candidates. These sources remained unidentified in our study due to the unavailability of 1.4 GHz flux densities. Therefore, the remnant fraction ( f rem < 3.9%) obtained in the XMM–LSS–JVLA region provides a better constraint. If we place 6.0 mJy flux density cutoff limit, same as used by D21, we obtain only 13 remnant candidates yielding f rem < 5.4% (13/240) that is similar to the one ( f rem < 5%) obtained by D21 for the extended sources (LAS ≥ 30 ) in the XMM–LSS region. Therefore, we find similar remnant fractions for both small-size (LAS < 30 ) as well as for large-size (LAS ≥ 30 ) sources once the bias introduced by flux density limit is taken into account.

7. Results and Conclusions

We carried out a search for RRG candidates of small angular sizes (LAS < 30 ) using deep multi-frequency radio surveys (150 MHz LOFAR, 325 MHz GMRT and 1.4 GHz JVLA, NVSS and FIRST) in the XMM–LSS field. Our study is the first attempt to perform a systematic search for RRGs of small sizes. Owing to the small angular sizes of our sample sources we exploit spectral curvature criterion and discover 48 remnant candidates exhibiting strong spectral curvature i.e., α low α high ≥ 0.5; where α low = α 150 MHz 325 MHz and α high = α 325 MHz 1.4 GHz . Main conclusions of our study are outlined below.
(i) Unlike most of the previous studies limited to large and bright remnant sources our study identified remnant candidates of small angular sizes (LAS < 30 ) that include faint sources with flux density reaching down to 1.0 mJy at 150 MHz. Thus, our study unveils remnant candidates at the faintest flux density regime than that reported earlier.
(ii) Using 1.4 GHz images of higher resolution mainly from the JVLA survey we find that a fraction (15/48 = 31%) of our RRG candidates have extended double-lobe like radio morphology, while majority of RRG candidates appear unresolved or slightly resolved in the 325 MHz GMRT images of 10 resolution. Our remnant candidates show steep radio spectral index with α 150 MHz 1.4 GHz distributed in the range of −1.94 to −0.86 with a median value of −1.04, which is similar to that found for large-size RRGs identified mainly with morphological criteria.
(iii) 3 GHz VLASS quick look image cutouts show the detection of only 10/48 remnant candidates. Some of our remnant candidates continue to show steep spectral index at higher frequency (1.4–3.0 GHz). While, five remnant candidates show a flatter spectral index at higher frequency regime inferring the possibility of recurrent AGN activity. Deep high-frequency imaging of our remnant candidates would be useful in deciphering their nature. Thus, our study presents a sample of remnant candidates for follow-up observations.
(iv) Unlike large-size remnant candidates reported in the previous studies our remnant candidates are found at relatively higher redshifts. There are 23/48 remnant candidates with redshift estimates in the range of 0.077 to 3.12 with a median value of 1.04, while, remaining 25 remnant candidates have upper limit of z > 1.0.
(v) Radio luminosity versus size plot shows that our remnant candidates are of smaller sizes (≤200 kpc) but have high 150 MHz luminosities similar to that found for large-size remnant candidates. 150 MHz luminosities of our 23 remnant candidates with redshift measurements are distributed in the range of 2.12 × 10 23 W Hz 1 to 1.15 × 10 27 W Hz 1 with a median value of 9.77 × 10 25 W Hz 1 . Remaining 25 remnant candidates with z > 1.0 have L 150 MHz > 10 25 W Hz 1 . We find that only a small fraction (02/15 ∼ 13%) of our remnant candidates reside in clusters, and hence, small radio size is unlikely to be caused by dense large-scale environment. We speculate that a relatively short active phase (<50 × 10 6 years) can plausibly limit the growth of radio source to the size of <200 kpc, although projection effect can also make apparent size smaller.
(vi) Our study allows us to place an upper limit on the remnant fraction ( f rem ) to be 3.2%. In the XMM–LSS–JVLA region f rem is slightly higher (3.9%) due to the availability of deep 1.4 GHz JVLA survey. Therefore, it is fairly possible that a fraction of sources having only upper limits on 1.4 GHz flux density may turn out to be remnant candidates, if actual 1.4 GHz flux density is much lower than the upper limit. Further, we find that the a low value of f rem can arise due to various factors such as the usage of single selection criterion, contamination from non radio-loud AGN at fainter flux densities, and redshifts bias. Notably, using a flux density cutoff of 6.0 mJy at 325 MHz we find f rem < 5.4% in the XMM–LSS–JVLA region, which is similar to that for large-size remnant candidates in the same region. Therefore, f rem is nearly same for both small-size and large-size remnant candidates once bias introduced by the flux density limit is accounted for.

Author Contributions

Conceptualization, methodology, software, validation, V.S., S.D., Y.W. and C.H.I.-C.; formal analysis, V.S. and S.D.; investigation, V.S. and S.D.; resources, V.S., Y.W. and C.H.I.-C.; data curation, V.S., S.D., Y.W. and C.H.I.-C.; writing—original draft preparation, V.S. and S.D.; writing—review and editing, V.S., S.D., Y.W. and C.H.I.-C.; visualization, V.S., S.D., Y.W. and C.H.I.-C.; supervision, V.S., Y.W. and C.H.I.-C.; project administration, V.S., Y.W. and C.H.I.-C. All authors have read and agreed to the published version of the manuscript.

Funding

This research received no external funding.

Institutional Review Board Statement

Not applicable.

Informed Consent Statement

Not applicable.

Data Availability Statement

The GMRT data reported in this study are available via the GMRT online archive https://naps.ncra.tifr.res.in/goa (accessed on 10 December 2021). Auxilary data from the LOFAR, JVLA, VLASS and HSC–SSP are available through the respective websites that are mentioned in the manuscript.

Acknowledgments

VS and SD acknowledge the support from Physical Research Laboratory, Ahmedabad, funded by the Department of Space, Government of India. CHI and YW acknowledge the support of the Department of Atomic Energy, Government of India, under project no. 12-R&D-TFR5.02-0700. We thank the staff of GMRT who have made these observations possible. GMRT is run by the National Centre for Radio Astrophysics of the Tata Institute of Fundamental Research. GMRT survey was carried out under program No. 4404-3 supported by the Indo-French Center for the Promotion of Advanced Research (Centre Franco-Indien pour la Promotion de la Recherche Avancée).

Conflicts of Interest

The authors declare no conflict of interest.

Notes

1
https://hsc-release.mtk.nao.ac.jp/doc/ (accessed on 10 December 2021).
2

References

  1. McNamara, B.R.; Nulsen, P.E.J. Heating Hot Atmospheres with Active Galactic Nuclei. Annu. Rev. Astron. Astrophys. 2007, 45, 117–175. [Google Scholar] [CrossRef] [Green Version]
  2. O’Dea, C.P.; Saikia, D.J. Compact steep-spectrum and peaked-spectrum radio sources. Astron. Astrophys. Rev. 2021, 29, 3. [Google Scholar] [CrossRef]
  3. An, T.; Baan, W.A. The Dynamic Evolution of Young Extragalactic Radio Sources. Astrophys. J. 2012, 760, 77. [Google Scholar] [CrossRef] [Green Version]
  4. Turner, R.J.; Shabala, S.S. Energetics and Lifetimes of Local Radio Active Galactic Nuclei. Astrophys. J. 2015, 806, 59. [Google Scholar] [CrossRef] [Green Version]
  5. Murgia, M.; Parma, P.; Mack, K.H.; de Ruiter, H.R.; Fanti, R.; Govoni, F.; Tarchi, A.; Giacintucci, S.; Markevitch, M. Dying radio galaxies in clusters. Astron. Astrophys. 2011, 526, A148. [Google Scholar] [CrossRef] [Green Version]
  6. Brienza, M.; Godfrey, L.; Morganti, R.; Prandoni, I.; Harwood, J.; Mahony, E.K.; Hardcastle, M.J.; Murgia, M.; Röttgering, H.J.A.; Shimwell, T.W.; et al. Search and modelling of remnant radio galaxies in the LOFAR Lockman Hole field. Astron. Astrophys. 2017, 606, A98. [Google Scholar] [CrossRef] [Green Version]
  7. Mahatma, V.H.; Hardcastle, M.J.; Williams, W.L.; Brienza, M.; Brüggen, M.; Croston, J.H.; Gurkan, G.; Harwood, J.J.; Kunert-Bajraszewska, M.; Morganti, R.; et al. Remnant radio-loud AGN in the Herschel-ATLAS field. Mon. Not. R. Astron. Soc. 2018, 475, 4557–4578. [Google Scholar] [CrossRef] [Green Version]
  8. Jurlin, N.; Brienza, M.; Morganti, R.; Wadadekar, Y.; Ishwara-Chandra, C.H.; Maddox, N.; Mahatma, V. Multi-frequency characterisation of remnant radio galaxies in the Lockman Hole field. arXiv 2021, arXiv:2106.13161. [Google Scholar] [CrossRef]
  9. Saripalli, L. Understanding the Fanaroff-Riley Radio Galaxy Classification. Astron. J. 2012, 144, 85. [Google Scholar] [CrossRef]
  10. Quici, B.; Hurley-Walker, N.; Seymour, N.; Turner, R.J.; Shabala, S.S.; Huynh, M.; Andernach, H.; Kapińska, A.D.; Collier, J.D.; Johnston-Hollitt, M.; et al. Remnant radio galaxies discovered in a multi-frequency survey. Publ. Astron. Soc. Aust. 2021, 38, e008. [Google Scholar] [CrossRef]
  11. Tamhane, P.; Wadadekar, Y.; Basu, A.; Singh, V.; Ishwara-Chandra, C.H.; Beelen, A.; Sirothia, S. J021659-044920: A relic giant radio galaxy at z ∼ 1.3. Mon. Not. R. Astron. Soc. 2015, 453, 2438–2446. [Google Scholar] [CrossRef] [Green Version]
  12. Brienza, M.; Morganti, R.; Shulevski, A.; Godfrey, L.; Vilchez, N. A LOFAR view on the duty cycle of young radio sources. Astronomische Nachrichten 2016, 337, 31. [Google Scholar] [CrossRef] [Green Version]
  13. Shulevski, A.; Morganti, R.; Harwood, J.J.; Barthel, P.D.; Jamrozy, M.; Brienza, M.; Brunetti, G.; Röttgering, H.J.A.; Murgia, M.; White, G.J.; et al. Radiative age mapping of the remnant radio galaxy B2 0924+30: The LOFAR perspective. Astron. Astrophys. 2017, 600, A65. [Google Scholar] [CrossRef] [Green Version]
  14. Duchesne, S.W.; Johnston-Hollitt, M. The remnant radio galaxy associated with NGC 1534. Publ. Astron. Soc. Aust. 2019, 36, e016. [Google Scholar] [CrossRef] [Green Version]
  15. Cordey, R.A. IC 2476: A possible relic radio galaxy. Mon. Not. R. Astron. Soc. 1987, 227, 695–700. [Google Scholar] [CrossRef] [Green Version]
  16. Jamrozy, M.; Klein, U.; Mack, K.H.; Gregorini, L.; Parma, P. Spectral ageing in the relic radio galaxy B2 0924+30. Astron. Astrophys. 2004, 427, 79–86. [Google Scholar] [CrossRef] [Green Version]
  17. Hale, C.L.; Williams, W.; Jarvis, M.J.; Hardcastle, M.J.; Morabito, L.K.; Shimwell, T.W.; Tasse, C.; Best, P.N.; Harwood, J.J.; Heywood, I.; et al. LOFAR observations of the XMM-LSS field. Astron. Astrophys. 2019, 622, A4. [Google Scholar] [CrossRef]
  18. Singh, V.; Beelen, A.; Wadadekar, Y.; Sirothia, S.; Ishwara-Chandra, C.H.; Basu, A.; Omont, A.; McAlpine, K.; Ivison, R.J.; Oliver, S.; et al. Multiwavelength characterization of faint ultra steep spectrum radio sources: A search for high-redshift radio galaxies. Astron. Astrophys. 2014, 569, A52. [Google Scholar] [CrossRef]
  19. Heywood, I.; Hale, C.L.; Jarvis, M.J.; Makhathini, S.; Peters, J.A.; Sebokolodi, M.L.L.; Smirnov, O.M. VLA imaging of the XMM-LSS/VIDEO deep field at 1-2 GHz. Mon. Not. R. Astron. Soc. 2020, 496, 3469–3481. [Google Scholar] [CrossRef]
  20. Smolčić, V.; Intema, H.; Šlaus, B.; Raychaudhury, S.; Novak, M.; Horellou, C.; Chiappetti, L.; Delhaize, J.; Birkinshaw, M.; Bondi, M.; et al. The XXL Survey. XXIX. GMRT 610 MHz continuum observations. Astron. Astrophys. 2018, 620, A14. [Google Scholar] [CrossRef] [Green Version]
  21. Schuldt, S.; Suyu, S.H.; Cañameras, R.; Taubenberger, S.; Meinhardt, T.; Leal-Taixé, L.; Hsieh, B.C. Photometric redshift estimation with a convolutional neural network: NetZ. Astron. Astrophys. 2021, 651, A55. [Google Scholar] [CrossRef]
  22. Randriamanakoto, Z.; Ishwara-Chandra, C.H.; Taylor, A.R. J1615+5452: A remnant radio galaxy in the ELAIS-N1 field. Mon. Not. R. Astron. Soc. 2020, 496, 3381–3389. [Google Scholar] [CrossRef]
  23. Komissarov, S.S.; Gubanov, A.G. Relic radio galaxies: Evolution of synchrotron spectrum. Astron. Astrophys. 1994, 285, 27–43. [Google Scholar]
  24. Blandford, R.D.; Ostriker, J.P. Particle acceleration by astrophysical shocks. Astrophys. J. 1978, 221, L29–L32. [Google Scholar] [CrossRef]
  25. Jaffe, W.J.; Perola, G.C. Dynamical Models of Tailed Radio Sources in Clusters of Galaxies. Astron. Astrophys. 1973, 26, 423. [Google Scholar]
  26. Intema, H.T.; Jagannathan, P.; Mooley, K.P.; Frail, D.A. The GMRT 150 MHz all-sky radio survey. First alternative data release TGSS ADR1. Astron. Astrophys. 2017, 598, A78. [Google Scholar] [CrossRef] [Green Version]
  27. Gordon, Y.A.; Boyce, M.M.; O’Dea, C.P.; Rudnick, L.; Andernach, H.; Vantyghem, A.N.; Baum, S.A.; Bui, J.P.; Dionyssiou, M. A Catalog of Very Large Array Sky Survey Epoch 1 Quick Look Components, Sources, and Host Identifications. Res. Notes Am. Astron. Soc. 2020, 4, 175. [Google Scholar] [CrossRef]
  28. Lonsdale, C.J.; Smith, H.E.; Rowan-Robinson, M.; Surace, J.; Shupe, D.; Xu, C.; Oliver, S.; Padgett, D.; Fang, F.; Conrow, T.; et al. SWIRE: The SIRTF Wide-Area Infrared Extragalactic Survey. Publ. Astron. Soc. Pac. 2003, 115, 897–927. [Google Scholar] [CrossRef] [Green Version]
  29. Wright, E.L.; Eisenhardt, P.R.M.; Mainzer, A.K.; Ressler, M.E.; Cutri, R.M.; Jarrett, T.; Kirkpatrick, J.D.; Padgett, D.; McMillan, R.S.; Skrutskie, M.; et al. The Wide-field Infrared Survey Explorer (WISE): Mission Description and Initial On-orbit Performance. Astron. J. 2010, 140, 1868–1881. [Google Scholar] [CrossRef]
  30. Willott, C.J.; Rawlings, S.; Jarvis, M.J.; Blundell, K.M. Near-infrared imaging and the K-z relation for radio galaxies in the 7C Redshift Survey. Mon. Not. R. Astron. Soc. 2003, 339, 173–188. [Google Scholar] [CrossRef] [Green Version]
  31. Singh, V.; Wadadekar, Y.; Ishwara-Chandra, C.H.; Sirothia, S.; Sievers, J.; Beelen, A.; Omont, A. On the nature of infrared-faint radio sources in the Subaru X-ray Deep and Very Large Array-VIMOS VLT Deep Survey fields. Mon. Not. R. Astron. Soc. 2017, 470, 4956–4973. [Google Scholar] [CrossRef] [Green Version]
  32. Hardcastle, M.J.; Williams, W.L.; Best, P.N.; Croston, J.H.; Duncan, K.J.; Röttgering, H.J.A.; Sabater, J.; Shimwell, T.W.; Tasse, C.; Callingham, J.R.; et al. Radio-loud AGN in the first LoTSS data release. The lifetimes and environmental impact of jet-driven sources. Astron. Astrophys. 2019, 622, A12. [Google Scholar] [CrossRef] [Green Version]
  33. Oguri, M.; Lin, Y.T.; Lin, S.C.; Nishizawa, A.J.; More, A.; More, S.; Hsieh, B.C.; Medezinski, E.; Miyatake, H.; Jian, H.Y.; et al. VizieR Online Data Catalog: HSC Wide S16A cluster catalog (Oguri+, 2018). VizieR Online Data Cat. 2021, J/PASJ/70/S20. [Google Scholar]
  34. Adami, C.; Giles, P.; Koulouridis, E.; Pacaud, F.; Caretta, C.A.; Pierre, M.; Eckert, D.; Ramos-Ceja, M.E.; Gastaldello, F.; Fotopoulou, S.; et al. The XXL Survey. XX. The 365 cluster catalogue. Astron. Astrophys. 2018, 620, A5. [Google Scholar] [CrossRef]
  35. Turner, R.J.; Shabala, S.S.; Krause, M.G.H. RAiSE III: 3C radio AGN energetics and composition. Mon. Not. R. Astron. Soc. 2018, 474, 3361–3379. [Google Scholar] [CrossRef]
Figure 1. Footprints of the 150 MHz LOFAR survey (in Blue), 325 MHz GMRT survey (in Red), 1.4 GHz JVLA (in Green) and the optical HSC–SCP deep component survey (in Magenta) available in the XMM–LSS field. Region covered by the 1.4 JVLA survey is marked as the XMM–LSS–JVLA, while region outside to it survey is marked as the XMM–LSS–Out.
Galaxies 09 00121 g001
Figure 2. (Left panel): Diagnostic plot of α 150 MHz 325 MHz versus α 325 MHz 1.4 GHz . Vertical red line represents α 150 MHz 325 MHz = −0.5, while diagonal black and red lines depict α 150 MHz 325 MHz = α 325 MHz 1.4 GHz and α 150 MHz 325 MHz = α 325 MHz 1.4 GHz + 0.5, respectively. (Right panel): Histogram of spectral index between 150 MHz and 1.4 GHz.
Galaxies 09 00121 g002
Figure 3. Images of remnant candidates showing extended radio emission. The 325 MHz GMRT radio contours (in Blue) and 1.4 GHz JVLA radio contours (in Magenta) are overlaid on the corresponding i band HSC–SSP optical images. Radio contours are at 3 σ × (1, 2, 4, 8, 16……) levels and the corresponding optical image is logrithmically scaled. Potential host galaxy is marked with a small circle (in Cyan) around it. The 325 MHz GMRT synthesized beam of 10 .7 × 7 .9 is shown by an ellipse (in Red) in the bottom left corner in each plot. The HSC–SSP deep survey images, whenever available, are preferred over the HSC–SSP wide survey.
Galaxies 09 00121 g003aGalaxies 09 00121 g003b
Figure 4. Three examples of unresolved remnant candidates. (Left panel): A faint source with S 325 MHz = 1.93 ± 0.12 mJy. (Middle panel): A source with an intermediate level flux density of S 325 MHz = 17.4 ± 0.2 mJy. (Right panel): A bright source with S 325 MHz = 121.4 ± 0.3 mJy.
Galaxies 09 00121 g004
Figure 5. Three examples of radio spectra showing strong spectral curvature. Spectra are fitted with the curved power law and power law models. (Left panel): GMRT 021836-035711—an unresolved remnant candidate. (Middle panel): GMRT020750-030455—a remnant candidate showing slightly resolved emission. (Right panel): GMRT022802-041417—a remnant candidate showing double-lobe morphology in the 1.4 GHz JVLA image.
Galaxies 09 00121 g005
Figure 6. (Left panel): Ratio of 325 MHz radio flux density to 3.6 μ m flux density plotted against the redshift. Sources with no redshift estimates are assigned an upper limit of z > 1.0 based the ratio of 325 MHz to 3.6 μ m flux densities similar to the high-z radio sources. (Right panel): 150 MHz flux density versus redshift plot.
Galaxies 09 00121 g006
Figure 7. (Left panel): 150 MHz rest-frame radio luminosity versus radio size plot. For unresolved sources an upper limit of 10 on the radio size is considered. (Right panel): Redshift versus 150 MHz rest-frame radio luminosity.
Galaxies 09 00121 g007
Table 1. Selection steps for remnant candidates.
SampleCriteriaSize
Detected at 325 MHz GMRTSNR ≥ 7 and size < 30 2513
Detected at 150 MHz 1516
LOFAR 1480/2179
TGSS (outside LOFAR region) 36/334
Detected at 325 MHz and 150 MHz α 150 MHz 325 MHz constrained1516
Detected at 1.4 GHz 1160
NVSS 599/1516
JVLA 430/434
FIRST (outside JVLA region) 131/483
150 MHz, 325 MHz and 1.4 GHz α 150 MHz 325 MHz and α 325 MHz 1.4 GHz 1160
150 MHz, 325 MHz but no 1.4 GHz α 150 MHz 325 MHz but α 325 MHz 1.4 GHz upper limits356
Remnant candidates Δ α ≥ 0.5 and α 150 MHz 325 MHz ≤ −0.548/1516 (3.2%)
Redshift estimatesspec-z353
photo-z505
no redshift658
Table 2. Sample of remnant candidates.
SourceS150 MHzS325 MHzS1.4 GHzS3.0 GHz α 150 MHz 325 MHz α 325 MHz 1.4 GHz Δ α α 150 MHz 1.4 GHz α 1.4 GHz 3.0 GHz LASzlogL150 MHz
Name(mJy)(mJy)(mJy)(mJy) (kpc) (W Hz 1 )
GMRT020750-030455189.6 ± 19.5106.4 ± 0.617.1 ± 0.74.39 ± 0.57−0.75 ± 0.13−1.25 ± 0.030.51−1.08 ± 0.05−1.78 ± 0.1824.9 (201.2)1.041 ± 0.10527.06
GMRT021109-03324431.0 ± 5.517.1 ± 0.22.29 ± 0.42.03 ± 0.33−0.77 ± 0.23−1.37 ± 0.120.60−1.16 ± 0.11−0.16 ± 0.31<10 (<80.1)>1.0>26.26
GMRT021146-04140234.3 ± 0.820.6 ± 0.352.5 ± 0.5 −0.66 ± 0.04−1.44 ± 0.140.78−1.17 ± 0.09 21.1 (168.9)>1.0>26.31
GMRT021408-05345610.6 ± 0.57.0 ± 0.6<1.0 −0.53 ± 0.13<−1.33>0.80<−1.06 <10 (<57)0.442 ± 0.03624.89
GMRT021446-05394129.5 ± 0.819.6 ± 0.563.9 ± 0.4 −0.53 ± 0.05−1.11 ± 0.070.58−0.91 ± 0.05 <10 (<83.8)1.30 ± 0.10226.43
GMRT021504-03042031.0 ± 0.616.3 ± 0.182.1 ± 0.41.50 ± 0.29−0.83 ± 0.03−1.40 ± 0.130.57−1.20 ± 0.09−0.44 ± 0.35<10 (<76.1)0.834 ± 0.06526.07
GMRT021528-04404529.9 ± 1.020.3 ± 0.304.4 ± 0.02 −0.51 ± 0.05−1.05 ± 0.010.54−0.86 ± 0.01 24 (119)0.353 ± 0.02325.08
GMRT021536-0452203.1 ± 0.52.01 ± 0.180.34 ± 0.01 −0.55 ± 0.25−1.21 ± 0.060.67−0.98 ± 0.08 <10 (<80.1)>1.0>25.19
GMRT021548-03593420.8 ± 0.98.61 ± 0.450.41 ± 0.01 −1.14 ± 0.09−2.09 ± 0.040.95−1.76 ± 0.02 17.7 (124.8)0.677 ± 0.04225.79
GMRT021555-0412454.1 ± 0.52.56 ± 0.260.26 ± 0.01 −0.62 ± 0.19−1.56 ± 0.060.95−1.24 ± 0.05 <10 (<84.4)1.413 ± 0.13225.79
GMRT021603-02564720.8 ± 0.611.1 ± 0.201.60 ± 0.15 −0.81 ± 0.04−1.32 ± 0.070.51−1.15 ± 0.04 <10 (<83.1)1.221 ± 0.15426.30
GMRT021646-0510042.9 ± 0.51.93 ± 0.120.38 ± 0.01 −0.54 ± 0.23−1.10 ± 0.040.57−0.91 ± 0.07 <10 (<80.1)>1.0>25.16
GMRT021702-060327350.3 ± 4.0132.8 ± 0.49.8 ± 0.54.73 ± 0.54−1.25 ± 0.02−1.78 ± 0.030.53−1.60 ± 0.02−0.96 ± 0.1625.4 (203.4)>1.0>27.44
GMRT021706-03151336.7 ± 0.723.3 ± 0.434.70 ± 0.5 −0.58 ± 0.04−1.09 ± 0.070.51−0.92 ± 0.05 <10 (<80.1)>1.0>26.26
GMRT021759-06164219.5 ± 0.413.2 ± 0.622.8 ± 0.6 −0.50 ± 0.07−1.06 ± 0.150.56−0.87 ± 0.10 29 (232.3)>1.0>25.97
GMRT021836-03571125.9 ± 0.517.41 ± 0.133.10 ± 0.52.46 ± 0.36−0.52 ± 0.03−1.18 ± 0.110.67−0.95 ± 0.07−0.30 ± 0.29<10.0 (<84.1)1.362 ± 0.14526.44
GMRT021904-06343648.1 ± 0.828.3 ± 0.33.94 ± 0.16 −0.69 ± 0.02−1.35 ± 0.030.66−1.12 ± 0.02 17.3 (132.6)0.853 ± 0.065226.26
GMRT021907-06161136.5 ± 0.821.69 ± 0.203.40 ± 0.52.26 ± 0.25−0.67 ± 0.03−1.27 ± 0.100.59−1.06 ± 0.07−0.53 ± 0.24<10 (<80.1)>1.0>26.29
GMRT021917-0426549.7 ± 0.52.87 ± 0.160.12 ± 0.01 −1.58 ± 0.09−2.13 ± 0.090.55−1.94 ± 0.03 <10 (<80.1)>1.0>25.99
GMRT021926-05153520.4 ± 0.713.3 ± 0.372.3 ± 0.5 −0.55 ± 0.06−1.20 ± 0.150.64−0.98 ± 0.10 20.1 (160.9)>1.0>26.02
GMRT022024-0402406.4 ± 0.53.9 ± 0.180.68 ± 0.01 −0.63 ± 0.11−1.20 ± 0.030.56−0.99 ± 0.03 <10 (<84.2)1.377 ± 0.13625.87
GMRT022106-0439253.6 ± 0.42.3 ± 0.160.40 ± 0.01 −0.54 ± 0.17−1.21 ± 0.050.68−0.98 ± 0.05 <10 (<79.9)0.993 ± 0.086225.25
GMRT022127-06380829.4 ± 0.618.6 ± 0.353.40 ± 0.41.95 ± 0.24−0.59 ± 0.04−1.16 ± 0.080.57−0.96 ± 0.05−0.73 ± 0.22<10 (<84.5)1.446 ± 0.14426.57
GMRT022145-03293034.8 ± 0.619.0 ± 0.192.90 ± 0.52.68 ± 0.53−0.78 ± 0.02−1.29 ± 0.120.51−1.11 ± 0.08−0.10 ± 0.3418 (144.2)>1.0>26.29
GMRT022152-0536199.7 ± 0.56.2 ± 0.200.67 ± 0.01 −0.57 ± 0.08−1.52 ± 0.030.95−1.19 ± 0.02 <10 (<76.4)0.843 ± 0.076525.57
GMRT022207-0400554.1 ± 0.52.75 ± 0.210.48 ± 0.01 −0.51 ± 0.18−1.20 ± 0.050.69−0.96 ± 0.05 <10 (<80.1)>1.0>25.32
GMRT022211-054906182.9 ± 2.1121.4 ± 0.2621.4 ± 0.88.31 ± 0.23−0.53 ± 0.01−1.19 ± 0.030.66−0.96 ± 0.02−1.24 ± 0.06<10 (<80.1)>1.0>26.97
GMRT022227-04071918.4 ± 0.510.6 ± 0.241.79 ± 0.01 −0.71 ± 0.05−1.22 ± 0.020.50−1.04 ± 0.01 16.6 (135.4)1.087 ± 0.10426.09
GMRT022250-03115239.2 ± 1.023.5 ± 0.364.10 ± 0.50 −0.66 ± 0.04−1.19 ± 0.080.54−1.01 ± 0.06 <10 (<80.1)>1.0>26.31
GMRT022301-060627137.3 ± 1.588.6 ± 0.3514.2 ± 0.604.88 ± 0.32−0.57 ± 0.01−1.25 ± 0.030.68−1.01 ± 0.02−1.40 ± 0.1027.3 (218.6)>1.0>26.86
GMRT022302-02465610.8 ± 1.17.2 ± 0.35<1.0 −0.53 ± 0.15<−1.35>0.83<−1.07 <10 (<76.1)3.117 ± 0.31827.01
GMRT022302-04285012.3 ± 0.67.2 ± 0.131.26 ± 0.01 −0.69 ± 0.06−1.19 ± 0.010.50−1.02 ± 0.02 <10 (<82.7)1.176 ± 0.11225.99
GMRT022338-0454187.04 ± 0.34.42 ± 0.470.70 ± 0.01 −0.60 ± 0.15−1.25 ± 0.070.65−1.03 ± 0.02 15.3 (122.5)>1.0>25.57
GMRT022413-0446437.97 ± 0.74.02 ± 0.150.34 ± 0.01 −0.89 ± 0.14−1.69 ± 0.030.80−1.41 ± 0.04 <10 (<80.1)>1.0>25.74
GMRT022433-0437094.1 ± 0.52.47 ± 0.110.43 ± 0.01 −0.65 ± 0.17−1.19 ± 0.030.54−1.00 ± 0.06 <10 (<80.1)>1.0>25.33
GMRT022455-03290620.7 ± 0.612.9 ± 0.170.85 ± 0.15 −0.61 ± 0.04−1.71 ± 0.101.10−1.33 ± 0.06 16 (<128.1)>1.0>26.13
GMRT022611-05050818.8 ± 0.711.2 ± 0.161.08 ± 0.01 −0.67 ± 0.05−1.60 ± 0.010.93−1.28 ± 0.02 <10 (<80.1)>1.0>26.08
GMRT022627-03330118.4 ± 0.711.37 ± 0.210.62 ± 0.15 −0.62 ± 0.05−1.65 ± 0.101.37−1.29 ± 0.07 <10 (<83.4)1.253 ± 0.12626.37
GMRT022631-04392614.2 ± 0.49.11 ± 0.381.32 ± 0.01 −0.57 ± 0.06−1.32 ± 0.030.75−1.06 ± 0.01 18.4 (27.1)0.0778 ± 0.00623.33
GMRT022654-0258217.1 ± 0.74.67 ± 0.35<1.00 −0.53 ± 0.16<−1.05>0.52<−0.87 <10 (<80.1)>1.0>25.53
GMRT022713-0312477.9 ± 0.85.02 ± 0.27<1.00 −0.58 ± 0.14<−1.10>0.52<−0.92 <10 (<79.7)0.979 ± 0.084825.57
GMRT022717-0618329.9 ± 0.86.16 ± 0.42<1.00 −0.63 ± 0.14<−1.25>0.62<−1.03 <10 (<46.3)0.317 ± 0.02924.52
GMRT022720-03303928.7 ± 1.016.4 ± 0.272.30 ± 0.5 −0.72 ± 0.05−1.35 ± 0.150.62−1.13 ± 0.10 21.0 (168.2)>1.0>26.22
GMRT022723-05124247.1 ± 0.825.9 ± 0.633.20 ± 0.5 −0.77 ± 0.04−1.43 ± 0.110.66−1.20 ± 0.07 27 (216.3)>1.0>26.45
GMRT022737-0521396.3 ± 0.83.99 ± 0.200.75 ± 0.01 −0.58 ± 0.17−1.14 ± 0.040.56−0.94 ± 0.05 19.5 (156.2)>1.0>25.49
GMRT022750-02452412.1 ± 0.97.46 ± 0.65<1.0 −0.63 ± 0.15<−1.38>0.79<−1.12 <10 (<82.8)1.18526.02
GMRT022759-0513544.1 ± 0.82.73 ± 0.160.58 ± 0.01 −0.52 ± 0.25−1.05 ± 0.040.53−0.86 ± 0.08 <10 (<80.1)>1.0>25.29
GMRT022802-04141737.3 ± 0.922.06 ± 0.73.20 ± 0.5 −0.68 ± 0.05−1.32 ± 0.110.64−1.09 ± 0.07 19.1 (112.3)0.467 ± 0.034425.49
Notes—An upper limit of 10 is kept for the size of unresolved sources.
Table 3. Comparison between remnant candidates and active sources.
ParameterRemnant CandidatesActive SourcesKS Test
NsourceRangeMedianNsourceRangeMedianDp-Value
S150 MHz (mJy)482.9–350.319.514681.15–2543.35.80.322 × 10 4
S 325 MHz (mJy)481.93–132.811.214680.78–1511.24.80.210.03
α 150 MHz 1.4 GHz 48−1.94–−0.86−1.041118−1.91–1.09−0.610.811.6× 10 6
Δ α 480.50–1.100.621118−3.81–2.980.380.582.1× 10 4
z230.077–3.121.048350.026–5.290.810.250.13
LAS (kpc)727.1–201.212426611.5–245.1157.40.520.032
logL 150 MHz (W Hz 1 )2323.33–27.0625.9983521.56–28.2925.170.462 × 10 4
Notes—The two sample Kolmogorov–Smirnov (KS) test is non-parametric statistical test that examines the hypothesis that two samples come from same distribution. D represents the maximum difference between the cumulative distributions of two samples and p-value is the probability that the null hypothesis, i.e., two samples comes from same distribution, is true.
Publisher’s Note: MDPI stays neutral with regard to jurisdictional claims in published maps and institutional affiliations.

