1. Introduction
Galaxy clusters characterized by major merger events have been observed to host diffuse synchrotron sources classified as radio halos and radio relics according to their properties and location with respect to the cluster center. They are faint with an average radio brightness ∼0.1 μJy/arcsec
2, extended up to maximum projected linear size ∼Mpc, and easier to detect and study at lower frequencies due to their steep spectra (
1–1.5, see e.g., [
1]), where
is related to the flux density
at the observing frequency
via
). While radio halos have typically a spherical morphology tracing the thermal gas distribution, polarized emission down to a few percent and are found at the center of massive galaxy clusters, radio relics are elongated, highly polarized above 1 GHz (
) and observed in the cluster periphery often associated with merger shock waves in clusters covering a wide range in mass (see e.g., [
1,
2]). According to the favored scenario for their origin, turbulence and shocks induced by merger phenomena power radio halos and relics respectively. Different spectral behaviour are expected for the two classes of sources: diffuse emission sustained by turbulence is expected to be characterized by a complex spectral index distribution with a spectral steepening at high frequencies, while a spectrum spatial gradient is expected in case of radio emission associated with merger shocks with flatter spectra along the outer edge of the shock. Current data are in agreement with these predictions concerning radio relics but suggest a diversity of spectral behaviours for radio halos (see e.g., [
1]) A detailed knowledge of their spectral properties over a wide frequency range is therefore precious to investigate the properties and understand the origin these sources.
Abell 523 (hereafter A523) is a galaxy cluster hosting a diffuse radio source historically classified as a radio halo [
3], though a radio relic interpretation has been proposed by other authors [
4]. Later works by Girardi et al. [
5] and Cova et al. [
6] revealed some peculiarities: polarized emission associated with the radio halo (
), an offset between the X-ray and the radio peak at 1.410 GHz, a radio signal brighter than expected from the scaling relations derived from the other radio halos [
1,
2], as well as a weak/absent correlation between the radio at 1.410 GHz and the X-ray emission. Recently, Vacca et al. (submitted) studied the properties of the system at 144 MHz with LOFAR observations. They found that the emission at 144 MHz is more extended than at 1.410 GHz, and faint regions of diffuse emission emerge in the north-east and in the south-east of the cluster. Moreover, by locally comparing the radio emission at 144 MHz and the X-ray emission in the energy band 0.5–2.5 keV, they found that we are likely observing the overlapping of two structures, the first fainter in radio and powered by the primary merger and the second brighter in radio and powered by the primary and a possible secondary merger. Though a systematic study has been not done yet, multiple mergers have been observed in other clusters hosting radio halos (e.g., MACS J0717.5+3745 [
7], A2744 [
8]) and a similar radio brightness excess has been not detected. A reason for this could be the peculiarity of the merger geometry in A523, with only a partial overlap of the two mergers.
In this paper, we investigate the spectral properties of the diffuse source in A523 in the frequency range 1.410–1.782 GHz, following up the work presented in Vacca et al. (submitted) and focusing on the bright filaments of the diffuse emission. Better multi-wavelength data are critical to shed light on the origin of these filaments. However, to gain a complete picture, important information can be already derived from radio observations at higher frequency. The paper is organized as follows. In
Section 2 we describe our data and in
Section 3 we present and discuss our results. In
Section 4 we draw our conclusions. In the following we adopt a ΛCDM cosmology with
km/s/Mpc,
and
[
9]. At the distance of A523 (
[
5]),
corresponds to 1.98 kpc.
2. Materials and Methods
We use proprietary observations obtained with the Jansky Very Large Array (VLA) in D configuration over the frequency range 1–2 GHz subdivided in 16 subbands (observing program 13A-168, PI M. Murgia). The data have been collected in spectral line mode and full Stokes with a mosaic of seven pointings, around the region centered at RA 04 h:59 m:10.0 s and Dec +08°:49′:00.0″, for a total observing time of 1.28 h.
The data were reduced following standard procedures using the NRAO’s Astronomical Image Processing System (AIPS) package and are the same as presented in Vacca et al. (submitted). After flagging of radio frequency interference, only spectral windows 6, 7, 8 (central frequency 1.410 GHz, bandwidth 192 MHz,
uv-range 158–4835
λ) and 11–15 (central frequency 1.782 GHz, bandwidth 320 MHz,
uv-range 196–6200 λ) survived and have been used to produce the images presented in the following with the Common Astronomy Software Applications (CASA) package. The uncertainty in the VLA flux density scale has been assumed to be 2.5% [
10].
3. Results and Discussion
In Vacca et al. (submitted) we presented a detailed spectral index image of the diffuse emission in A523 between 144 MHz and 1.410 GHz. Moreover, we studied the integrated spectral index between 144 MHz and 1.782 GHz using measurements in the same spatial region from images produced with the same setting,
uv-range (196–4835 λ) and a negative robust parameter (−0.5 in CASA) to keep the LOFAR point spread function well behaved. Here, we present detailed spectral index images between 1.410 GHz and 1.782 GHz to study the spectral behaviour of the filaments in this frequency range. In order to produce these images, we select the common
uv-range (196–4835 λ) and, since we are not using LOFAR data, we adopt a positive robust parameter (0.5 in CASA) in order to highlight as much as possible diffuse large-scale emission. In
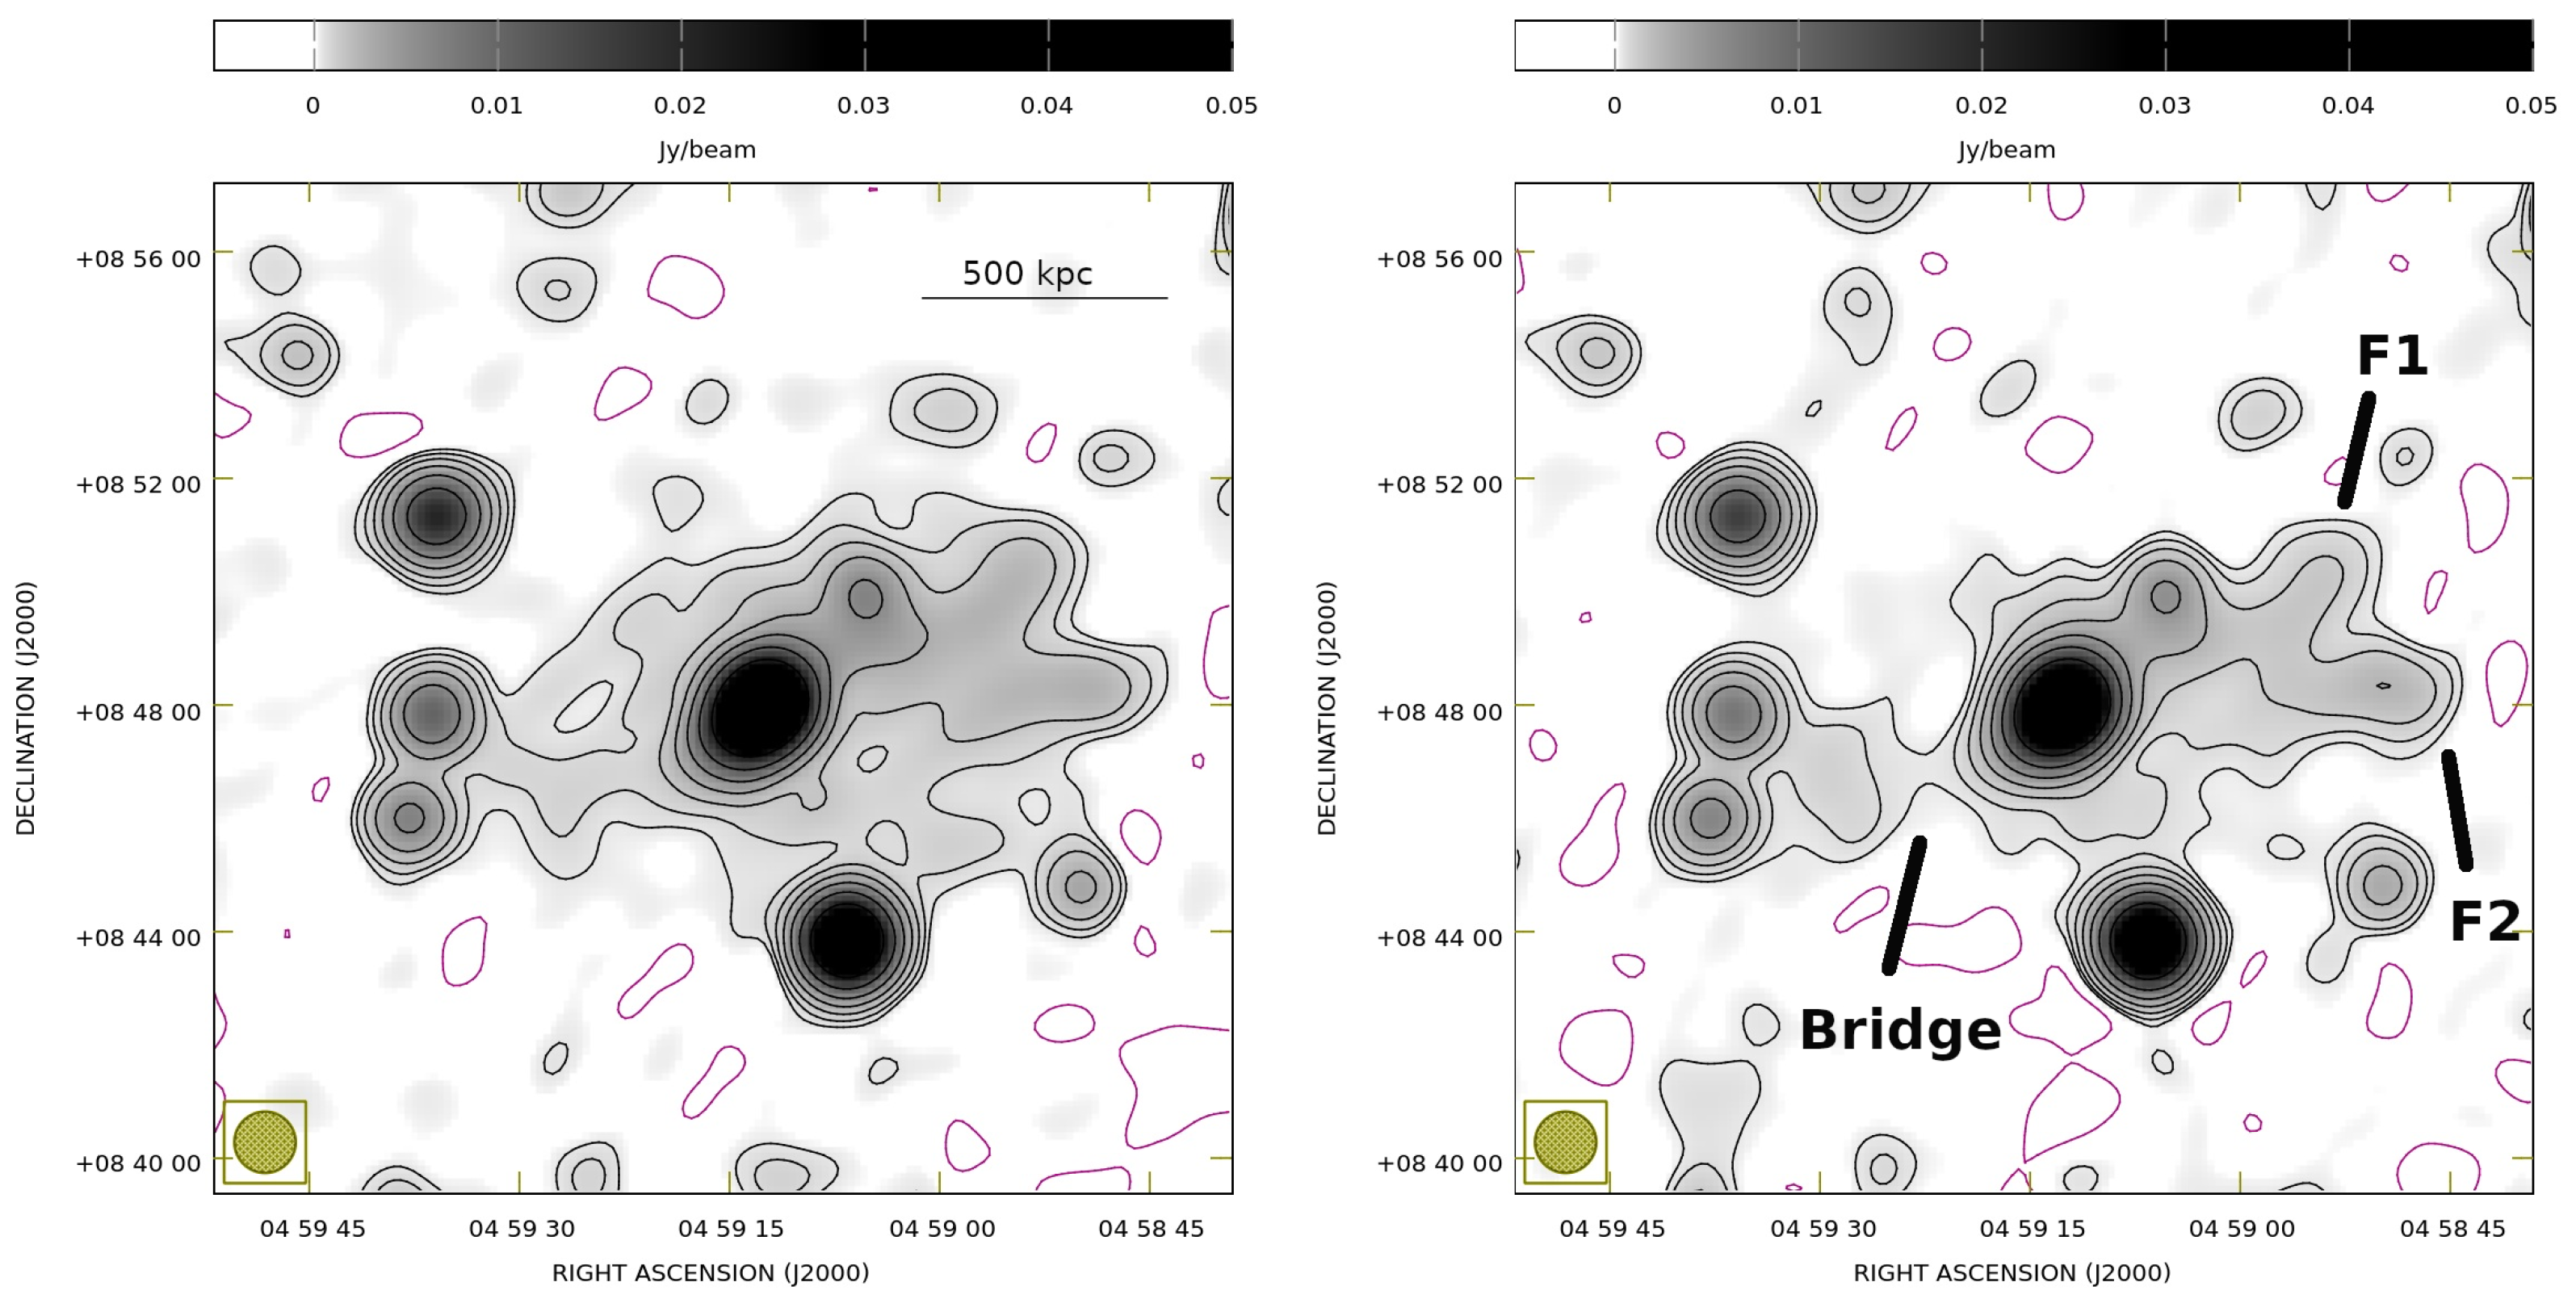
Figure 1, we present the radio images of A523 in total intensity at 1.410 GHz (left panel) and 1.782 GHz (right panel) obtained with these settings. These images are very similar to those presented in Vacca et al. submitted (see the bottom panels of Figure 3 in that paper, produced using the same settings but the full
uv-range available at each frequency). The diffuse emission fills the north of the cluster at 1.410 GHz as previously reported by other authors [
3,
5]. At 1.782 GHz only the brightest regions are still visible: the bright filaments in the north-west (filaments F1 and F2 in Vacca et al. submitted) and the bridge connecting the central AGN to the compact radio sources in the east (see
Figure 1 right panel). The emission in the north-east and in the south of the system is below the noise of the image at this frequency.
In order to produce a spectral index image of the diffuse emission, the same circular restoring beam of 65″ has been used, and a sensitivity cut in radio brightness of 3
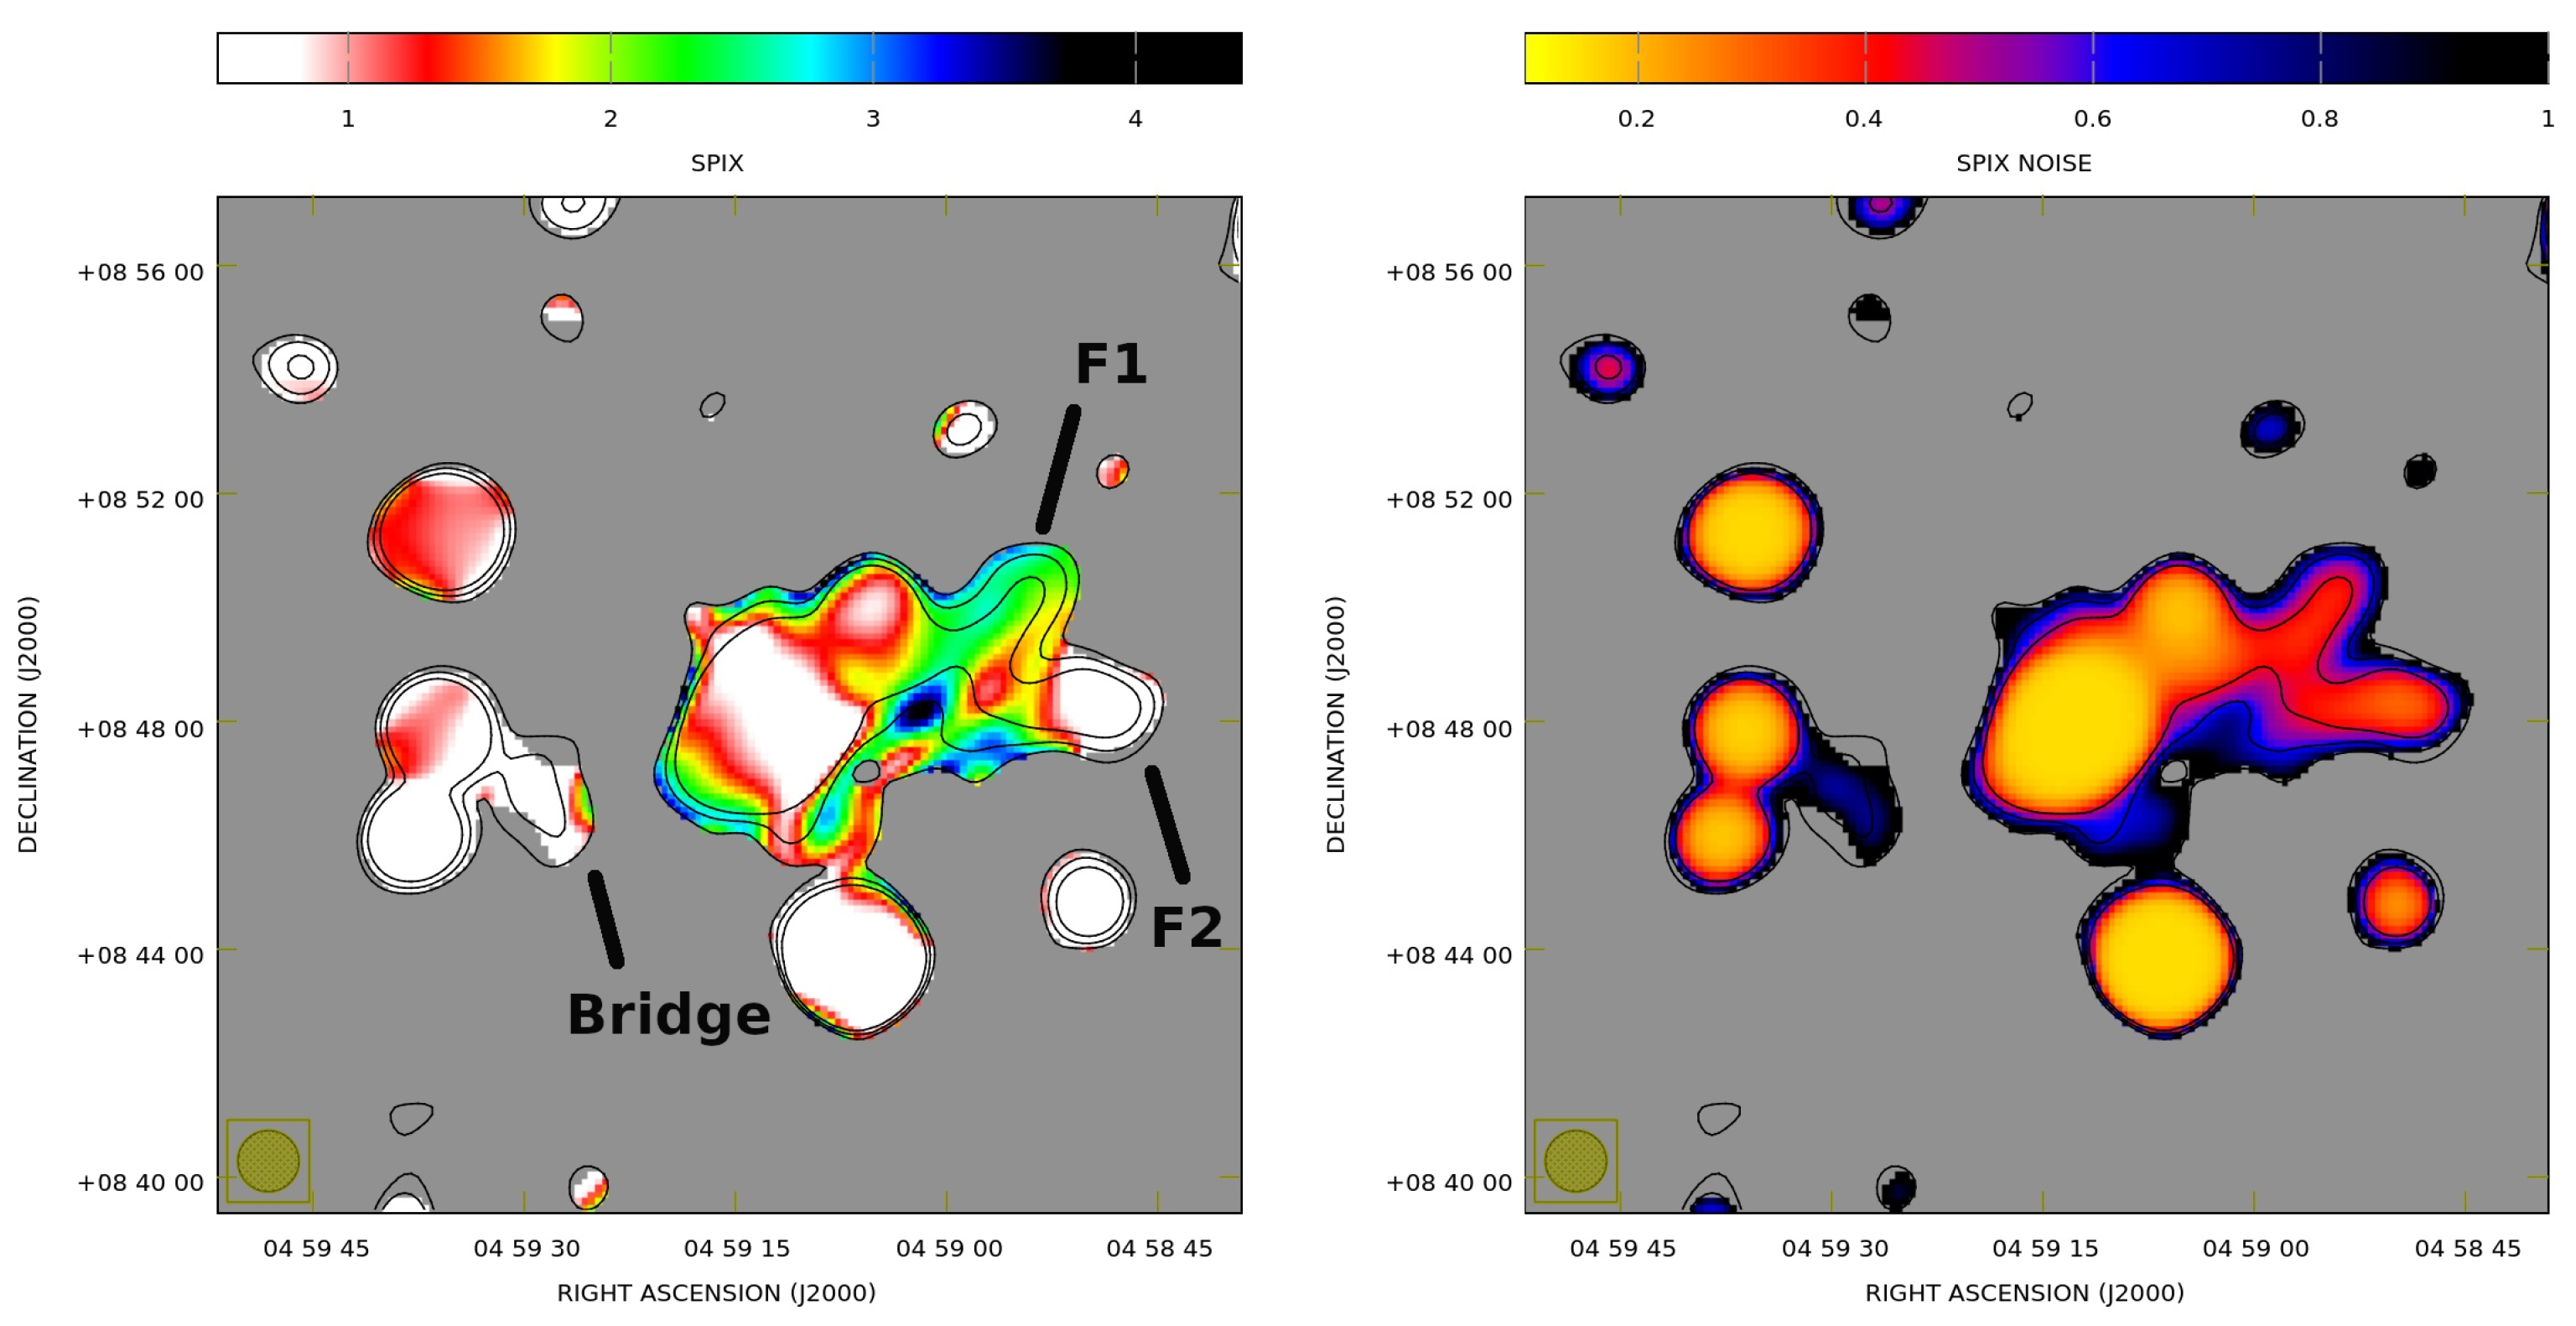
σ has been applied at both frequencies simultaneously. In
Figure 2 we show the spectral index (left panel) and the spectral index uncertainty (right panel) images between 1.410 GHz and 1.782 GHz. The spectral index distribution is complex but no spectral gradient with flattening towards the external region can be detected moving away from the cluster center, disfavoring a radio relic interpretation. The overall average spectral index is
in agreement within the error with the integrated value by Vacca et al. (submitted), while the average spectral index of the filaments is respectively
for filament F1 and
for filament F2. The large uncertainties are due to the small frequency range available. These results indicate a steepening with respect to the frequency range 144 MHz–1.410 GHz, where Vacca et al. (submitted) derived an average spectral index of
for the filaments, and suggest a flattening at the location of the brightest patches.
To explore more this, in the left panel of
Figure 3 we show the spectral index
versus the radio brightness
I at 1.410 GHz (blue) and 1.782 GHz (red). We blanked the spectral index values below three times its uncertainty as derived from the uncertainty map, the total intensity images as the spectral index image and covered the total intensity and spectral index images with a grid with a cell-side equal to the beam FWHM (65″), after masking discrete sources embedded in the diffuse emission. We finally applied an exponential smooth with a smoothing scale comparable to the mean distance of the points in flux density. This plot suggests an hint of an anti-correlation between the spectral index and the radio brightness of the filaments, with brightest regions characterized by a flat spectral index. The Pearson correlation coefficient is −0.52 (
p-value 0.009) at 1.410 GHz and −0.73 (
p-value 0.00005) at 1.782 GHz, supporting the idea of an anti-correlation of the data. In the right panel of
Figure 3, we show the histogram of the spectral index image after blanking spectral index values lower than three times its uncertainty and selecting regions corresponding to a radio brightness at 1.782 GHz above 0.5 (dark gray), 0.8 (green), and 1.3 mJy/beam (purple). When we exclude regions with a radio brightness below 1.3 mJy/beam (13
σ) at 1.782 GHz, only spectral index values between ∼1.2 and ∼2.8 survive. Spectral indices steeper than 2.8 are not observed at the location of the brightest patches.
The emission examined here has the same spatial location of a possible secondary merger in the ESE-WNW direction overlapping the primary one along the SSW-NNE direction [
6] and is brighter in radio as the result of the superposition of the primary and a likely younger secondary merger (Vacca et al. submitted). Merger phenomena are responsible of re-acceleration of relativistic electrons through the injection of turbulence and of amplification of intraclutser magnetic fields [
11]. The spectrum is likely produced by a combination of the spatial distribution of the re-acceleration efficiency and the magnetic field value, therefore bright regions with flat spectra could be explained as the result of strong re-acceleration while regions characterized by spectral steepening are affected by strong radiation losses, as also observed in other systems (e.g., [
12]), and therefore better detected at lower frequencies (≲1GHz). The superposition of the two mergers could further amplify the magnetic field and increase the re-acceleration efficiency with respect to the rest of the clusters.


 ,
, 