Conference Report

On the Age of Galactic Bulge CSPNe: Too Young and Complicated?

by
Foteini Lykou
1,2,*,
Albert Zijlstra
2,3 and
Quentin A. Parker
1,2
1
Department of Physics, C.Y.M. Physics Building, The University of Hong Kong, Pokfulam Road, Hong Kong, China
2
Laboratory for Space Research, The University of Hong Kong, Block A, Cyberport 4, 100 Cyberport Rd, Cyberport, Hong Kong, China
3
Jodrell Bank Centre for Astrophysics, The University of Manchester, Oxford Rd, Manchester M13 9PL, UK
*
Author to whom correspondence should be addressed.
Galaxies 2020, 8(2), 51; https://doi.org/10.3390/galaxies8020051
Submission received: 11 May 2020 / Revised: 12 June 2020 / Accepted: 14 June 2020 / Published: 18 June 2020
(This article belongs to the Special Issue Workplans II: Workshop for Planetary Nebula Observations)

Abstract

:
We present preliminary results of our study of a small sample of planetary nebulae in the Galactic Bulge for which high-angular resolution Hubble Space Telescope imaging is available. From this and from archival spectroscopy, we were able to calculate temperatures and luminosities for their central stars. These were then correlated to up-to-date evolutionary tracks found in the literature to help us estimate stellar masses and therefore ages for the central stars. Our current analysis indicates that our sample appears to represent a somewhat mixed population of planetary nebulae central stars, while at least one of the nebulae might have been formed by a more massive progenitor (i.e., M ZAMS 4 M ).

1. Introduction

The central stars of planetary nebulae (CSPNe hereafter)—their ages, masses, chemical composition and the associated planetary nebulae (PNe) luminosities—are unique tools in the study of older Galactic populations. To name just a few fields, CSPNe provide crucial feedback for the development of theoretical evolutionary models, for the study of Galactic mass/chemical distributions, and a better understanding of low-to-intermediate-mass binary evolution, as many, especially bipolar PNe are thought to emerge from binary systems. Here, we focus on a number of PNe within the Galactic Bulge for which high-angular resolution imagery from the Hubble Space Telescope (HST) is available, a Galactic region whose overall age is over 8 Gyr and that appears to have a mixed population of stars (e.g., Surot et al. [1]).
We report preliminary results from our study of CSPNe of a small sample of PNe in the Galactic Bulge (GBPNe), observed with the Hubble Space Telescope. These nebulae are compact with an average angular size < 8″, i.e., <0.4 pc at 8.5 kpc. We have calculated the stellar photometry in a filter similar to Johnson V, and we have estimated the stellar temperatures and luminosities (Section 2). We give tentative correlations to the latest evolutionary tracks of Miller Bertolami [2], which allow us to estimate progenitor masses and current ages, and identify outliers (Section 3 and Section 4).

2. Methods

2.1. From Hubble Space Telescope Images to Stellar Temperatures

Observations of 17 planetary nebulae in the Galactic Bulge were obtained with the HST WFPC2 instrument in several filters (proposal ID: 9356, PI: A.A. Zijlstra). Here, we report only results from the F547M filter images ( λ eff = 5446 Å, Δ λ = 486.6 Å, transmission 91.3%), which corresponds roughly to the Johnson V filter, and it is not contaminated by the λ λ 5007 [O iii] nebular line. We extracted the data from the Hubble Legacy Archive and calculated the photometry of each visible CSPN in that filter following the WFPC2 Photometry Cookbook1. Where necessary, we corrected the photometry for nebular contamination by subtracting nebular emission within a similar aperture. The final photometry was dereddened for interstellar extinction using the Balmer decrement from the corresponding, available flux-calibrated spectra for this sample from Acker et al. [3].
Stellar temperatures were estimated via the Zanstra method (Zanstra [4]) using the tool PyNeb (Luridiana et al. [5]). A PyNeb recipe calculates the Zanstra temperature from the approximations given by Pottasch [6]. Essentially, the Zanstra temperature is derived from the total stellar ionizing flux, which in turn is defined as the ratio of the nebular recombination line flux (in H β ) to the stellar continuum flux (in the visual). The method demands that the nebula is of low density, but optically thick in Lyman continuum. Only lower limits to the temperature can be obtained, when the latter condition is not satisfied2. PyNeb does not provide error estimates from the derivation of the Zanstra temperature. Our photometry is estimated to have a ∼5% error. We used these errors to roughly estimate upper and lower limits for the Zanstra temperature. The preliminary results are shown in Figure 1. The CSPNe HST photometry (corrected for extinction), the derived Zanstra temperatures and luminosities (see next section) are stated in Table 1.

2.2. CSPNe Luminosities

Frew et al. [7] estimated distances for some of the nebulae in our sample using a surface brightness-radius relation, however we find that the surface areas used in that work (which were derived from digitized photographic plates in H α ) are unsurprisingly over-estimated for some of these compact GBPNe, compared to the H α images from the HST. Furthermore, given the lack of Gaia distances (Gaia Collaboration [8]) for the majority of our sample3, we adopt a distance of 8.5 ± 2.5 kpc for the Galactic Bulge and subsequently for all these PNe in our sample. To calculate the luminosities, we use the method described in Zijlstra & Pottasch [9], where L * = 150 × L H β . This method is an analogous to the Zanstra method, and it therefore stands only for PNe that are optically thick to the ionizing radiation. For the H β fluxes (dereddened), we used the results of Gesicki et al. [10].

3. Results

Figure 1 shows a preliminary Hertzsprung-Russell diagram of our sample with the latest evolutionary tracks of Miller Bertolami [2]. These evolutionary tracks are a result of the most up-to-date study on post-AGB stellar evolution models, which found that post-AGB stars are brighter and can evolve faster as opposed to the results of previous works. Here, we compare our results to the Solar metallicity models of Miller Bertolami [2] from which we interpolate stellar masses and evolutionary timescales.
All seventeen (17) CSPNe appear to correlate well with the evolutionary tracks, indicating progenitor masses between 1 and 4 M . Except for one CSPN (see below), all others are still on the post-AGB track. The Zanstra method requires that the nebula is optically thick to ionizing photons. The fact that the H β -derived luminosities are in accordance with the tracks suggests that flux loss due to leakage is minor4.
Two outliers can be identified in Figure 1, one that has log L 4.1 and another that appears to be descending the white dwarf cooling track. The most luminous one is M 1–31, a bright, multipolar nebula, whose central star can be easily distinguished (left panel, Figure 2). It appears that this star is consistent with a 4 M track. If we assume this evolutionary track as an upper limit, then this star is the youngest in the present sample (<200 Myr). The most evolved one is the faint nebula H 2–15 (right panel, Figure 2). In this case, we presume that the faint central star is located near the geometric center of the nebular waist (yellow cross, Figure 2) and the final photometry might be contaminated by nebular emission. A comparison with deep-imaging from the SuperCosmos H α Survey (Parker et al. [11]) suggests that this nebula is in fact bipolar, while HST imaging recovered only the central waist. Given how faint the star is and taking into account that its distance is not known (cf. Section 2.2), its location in the HR diagram is less certain.

4. Discussion and Future Work

This work shows only preliminary results of 17 CSPNe from our sample5. We find that all but one of the CSPNe are still on the post-AGB track, suggesting that these are young PNe ( a g e < 5000 years), with a progenitor mass range of 1–4 M . The clustering around the 1.5–2 M tracks (Figure 1) may indicate that these compact PNe derive from a younger stellar population in the Galactic Bulge, as proposed in Gesicki et al. [10]. One nebula in our sample may have formed from a more massive star (∼4 M ) suggesting a CSPN age of <200 Myr, and thus much younger than the presumed age of the Galactic Bulge. Only one CSPN appears to be tracing the white dwarf cooling track and therefore this would be the oldest member of our sample.
We acknowledge that hydrogen Zanstra temperatures might not be the most accurate method in estimating CSPN temperatures compared to, for example, the helium Zanstra method (Kaler & Jacoby [12]). However, none of the PNe in our sample show the He ii 4686Å emission line in the nebular spectra indicative of higher degree of ionization. In the absence of spectroscopic data for these central stars6, the use of the Zanstra method for atomic hydrogen can only be a rough indicator of stellar temperature.
In the future, we aim at calculating synthetic photometry from TMAP7 non-LTE model atmospheres of H-rich white dwarfs, and compare them to our findings in an effort to get some better estimates of temperature and surface gravity ranges. Moreover, we intend to use the distances of Frew et al. [7] after re-calibrating them for the surface areas measured from the HST images.

Author Contributions

Conceptualization, A.Z. and F.L.; methodology, F.L. and A.Z.; writing—original draft preparation, F.L.; writing—review and editing, Q.A.P., F.L. and A.Z.; visualization, F.L.; funding for this project obtained by Q.A.P. All authors have read and agreed to the published version of the manuscript.

Funding

This research was funded by The University of Hong Kong and the Research Grants Council of Hong Kong under the RGC General Research fund grant numbers 17300417 and 17304018 (Q.A.P., F.L.). A.Z. is a Hung Hing Ying Distinguished Visiting Professor at the University of Hong Kong.

Conflicts of Interest

The authors declare no conflict of interest.

References

  1. Surot, F.; Valenti, E.; Hidalgo, S.L.; Zoccali, M.; Sökmen, E.; Rejkuba, M.; Minniti, D.; Gonzalez, O.A.; Cassisi, S.; Renzini, A.; et al. Mapping the stellar age of the Milky Way bulge with the VVV. I. The method. A&A 2019, 623, A168. [Google Scholar] [CrossRef] [Green Version]
  2. Miller Bertolami, M.M. New models for the evolution of post-asymptotic giant branch stars and central stars of planetary nebulae. A&A 2016, 588, A25. [Google Scholar] [CrossRef]
  3. Acker, A.; Raytchev, B.; Koeppen, J.; Stenholm, B. An extensive study of planetary nebulae in the galactic bulge. A& AS 1991, 89, 237. [Google Scholar]
  4. Zanstra, H. An Application of the Quantum Theory to the Luminosity of Diffuse Nebulae. ApJ 1927, 65, 50. [Google Scholar] [CrossRef]
  5. Luridiana, V.; Morisset, C.; Shaw, R.A. PyNeb: A new tool for analyzing emission lines. I. Code description and validation of results. A&A 2015, 573, A42. [Google Scholar] [CrossRef]
  6. Pottasch, S.R. Planetary nebulae. A study of late stages of stellar evolution. In Astrophysics and Space Science Library; Reidel: Dordrecht, The Netherlands, 1984. [Google Scholar]
  7. Frew, D.J.; Parker, Q.A.; Bojicic, I. The Hα surface brightness-radius relation: A robust statistical distance indicator for planetary nebulae. MNRAS 2016, 455, 1459. [Google Scholar] [CrossRef] [Green Version]
  8. Gaia Collaboration. Gaia Data Release 2. Summary of the contents and survey properties. A&A 2018, 616, A1. [Google Scholar] [CrossRef] [Green Version]
  9. Zijlstra, A.A.; Pottasch, S. Low mass planetary nebulae near the galactic centre. A&A 1989, 216, 245. [Google Scholar]
  10. Gesicki, K.; Zijlstra, A.A.; Hajduk, M.; Szyszka, C. Accelerated post-AGB evolution, initial-final mass relations, and the star-formation history of the Galactic bulge. A&A 2014, 566, A48. [Google Scholar] [CrossRef] [Green Version]
  11. Parker, Q.A.; Phillipps, S.; Pierce, M.J.; Hartley, M.; Hambly, N.C.; Read, M.A.; MacGillivray, H.T.; Tritton, S.B.; Cass, C.P.; Cannon, R.D.; et al. The AAO/UKST SuperCOSMOS Hα survey. MNRAS 2005, 362, 689. [Google Scholar] [CrossRef] [Green Version]
  12. Kaller, J.B.; Jacoby, G.H. Central Star Temperatures of Low-Excitation Planetary Nebulae. ApJ 1991, 372, 215. [Google Scholar] [CrossRef]
1
2
This discrepancy will be further investigated in the future with the comparison to model atmospheres.
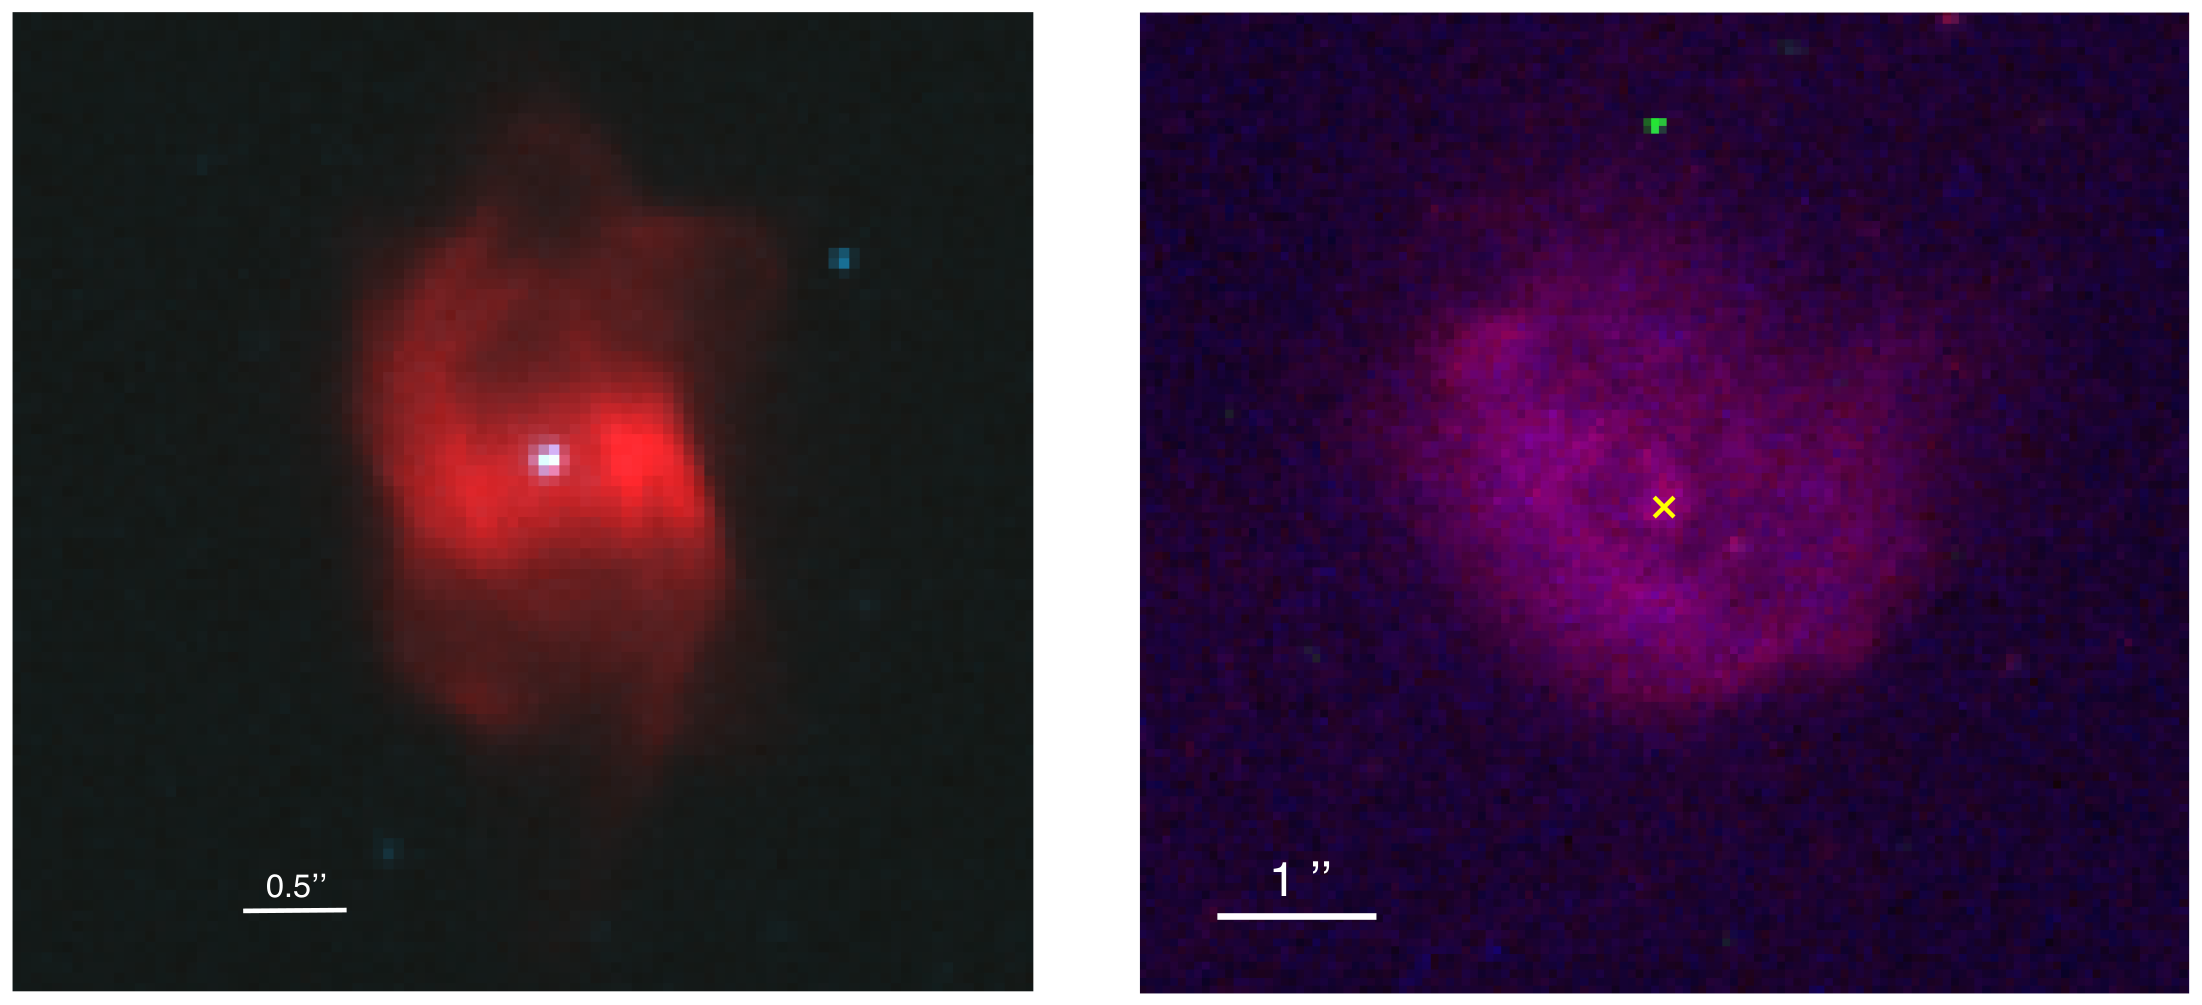
3
A few CSPNe were found in the Gaia Data Release 2, however either the distances are highly unreliable or Gaia has detected nebular features. Therefore, we draw caution to the current Gaia detections for such distant sources, as we have noticed that in some cases, where the nebula is less than 3″ in size, Gaia astrometry indicates that the detected “source” is either a nebular feature or a nearby star. This discrepancy could only be found whilst comparing current Gaia astrometry to high-angular resolution images such as the ones here.
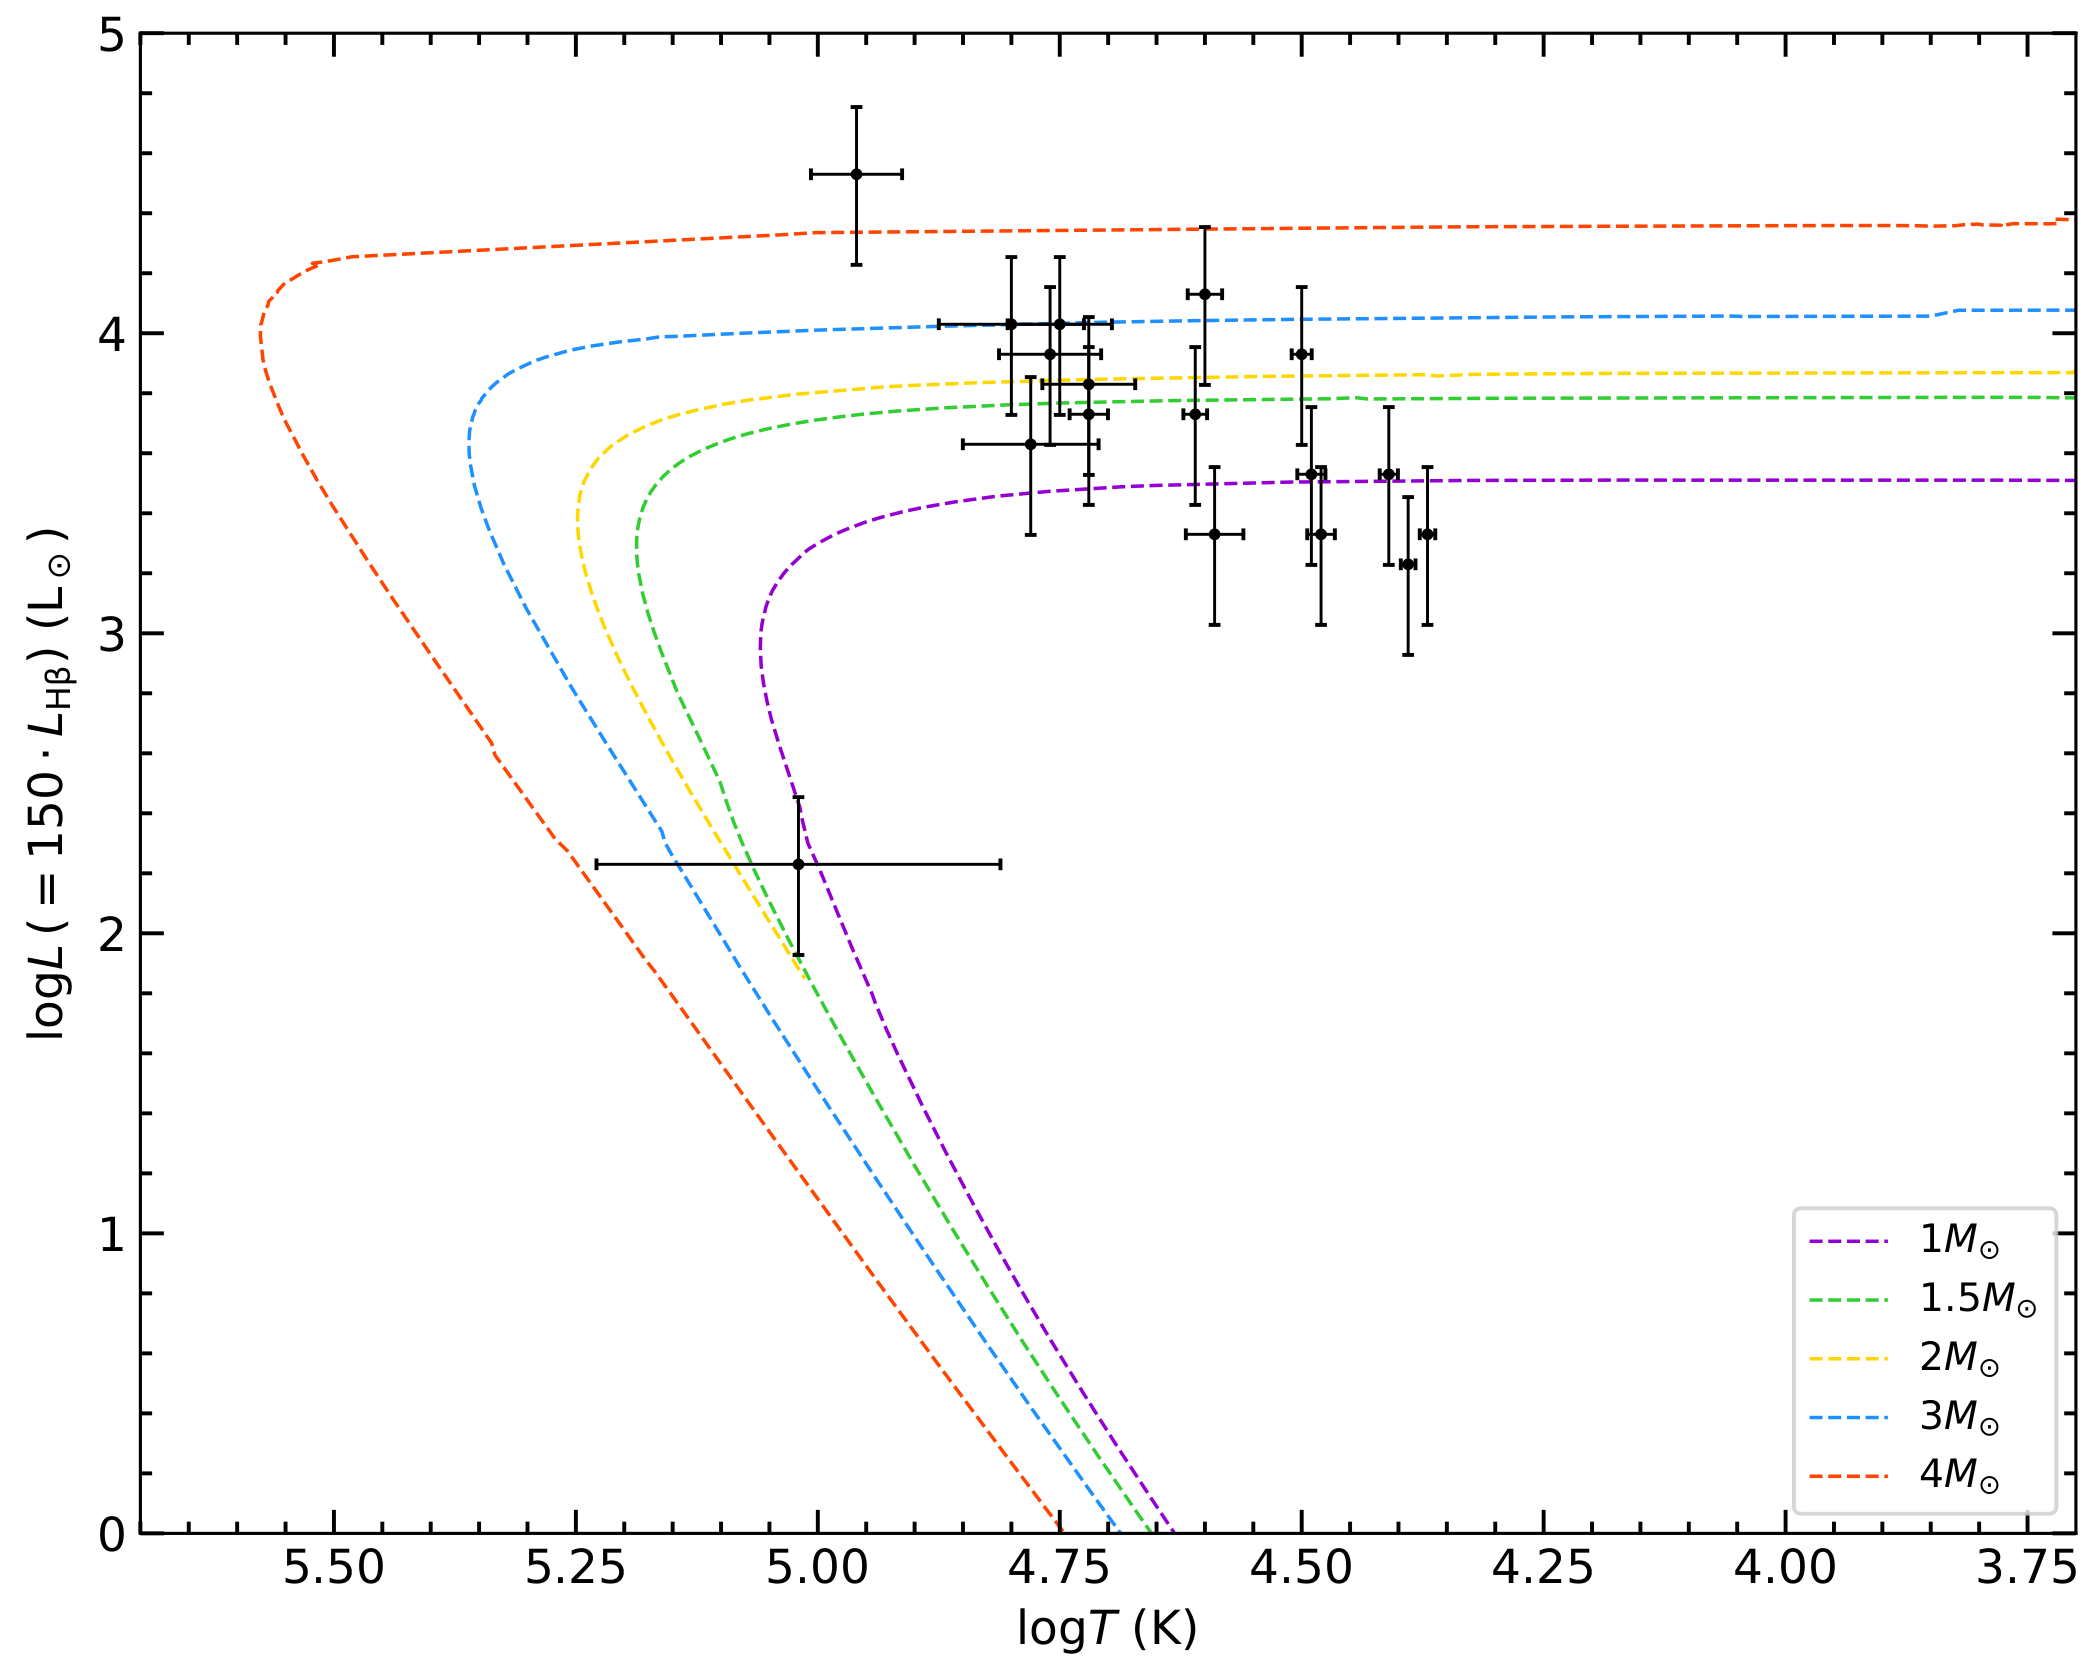
4
Nevertheless, 4 CSPNe in our sample are positioned slightly below the 1 M track. Unless their distances are larger than 10 kpc, the discrepancy in their positions might result from an erroneous assumption that these nebulae are optically thick to ionizing radiation.
5
The final sample will consist 40 CSPNe for which we have HST data.
6
Nebular spectra are available in the literature, however these are of low spectral resolution and perhaps not centered on the CSPNe.
7
Figure 1. A Hertzsprung-Russell diagram for Galactic Bulge CSPNe from this work. Evolutionary tracks by Miller Bertolami [2] are also shown for reference. The error bars for each luminosity correspond to the range of values for the adopted distance of 8.5 ± 2.5 kpc for the Galactic Bulge. Rough estimates to the upper and lower limits for the Zanstra temperature are provided. The wide range of temperature for H 2–15 (CSPN on the white dwarf cooling track) reflects the large uncertainties in the HST photometry for this CSPN.
Galaxies 08 00051 g001
Figure 2. Three-colour images from HST data (corresponding filters, red: H α ; green: F457M; blue: [O iii]) showing characteristics of the two outliers noted in Figure 1 (cf. Section 3). North is up and east is on the left. Left panel: the multipolar M 1–31 and its clearly visible central star. The faint cyan points outside the nebula are background stars. Right panel: the faint waist of H 2–15, where the possible location of the central star is marked by a yellow cross. The bipolar nature of the nebula can only be recovered in deeper images such as those of the SuperCosmos H α Survey. Bad pixels are highlighted in green.
Galaxies 08 00051 g002
Table 1. CSPNe properties derived for this sample.
Name m V (mag) σ ( m ) log T Z (K) σ ( log T Z ) log L (L )
H2-2014.420.184.490.023.53
H2-1714.460.124.390.013.21
H2-2513.720.134.370.013.32
M1-2015.410.174.720.023.73
M1-3116.320.304.960.054.53
M1-1915.150.124.610.013.72
H1-816.680.564.800.084.03
H1-913.760.134.500.013.91
H1-4613.570.184.600.024.12
M3-4013.850.144.410.013.52
H2-1317.430.544.780.073.63
MaC1-1115.350.184.480.013.32
K5-416.660.434.750.054.03
Th3-616.440.314.590.033.32
Th3-416.940.424.760.053.92
H1-1916.820.404.720.053.82
H2-1521.681.195.020.212.23

