Abstract
Dust is an essential component of the interstellar medium (ISM) and plays an important role in many different astrophysical processes and phenomena. Traditionally, dust grains are known to be destroyed by thermal sublimation, Coulomb explosions, sputtering, and shattering. The first two mechanisms arise from the interaction of dust with intense radiation fields and high-energy photons (extreme UV), which work in a limited astrophysical environment. The present review is focused on a new destruction mechanism present in the dust-radiation interaction that is effective in a wide range of radiation fields and has ubiquitous applications in astrophysics. We first describe this new mechanism of grain destruction, namely rotational disruption induced by Radiative Torques (RATs) or RAdiative Torque Disruption (RATD). We then discuss rotational disruption of nanoparticles by mechanical torques due to supersonic motion of grains relative to the ambient gas, which is termed MEchanical Torque Disruption (METD). These two new mechanisms modify properties of dust and ice (e.g., size distribution and mass), which affects observational properties, including dust extinction, thermal and nonthermal emission, and polarization. We present various applications of the RATD and METD mechanisms for different environments, including the ISM, star-forming regions, astrophysical transients, and surface astrochemistry.
1. Introduction
Interstellar dust is an essential component of the interstellar medium (ISM). It plays important roles in astrophysics, including gas heating, star and planet formation (see Draine [1] for a review), and grain-surface chemistry (Herbst and van Dishoeck [2], Hama and Watanabe [3]). The interaction of dust with radiation from starlight causes extinction, emission, and polarization of light, which are the basis of modern astrophysics. Indeed, thermal dust emission in far-infrared/submm is a powerful window to observe dense star-forming regions and to understand how stars and planets form. Dust polarization induced by the alignment of dust grains with the magnetic field allows us to measure magnetic fields in various astrophysical environments (see Andersson et al. [4], Lazarian et al. [5] for recent reviews). Polarized dust emission is a critical foreground component that needs to be accurately removed for the detection of the Cosmic Microwave Background (CMB) B-mode (Kamionkowski and Kovetz [6]). Furthermore, ice mantles on dust grains play a central role in astrochemistry because water and complex organic molecules (COMs) are thought to first form on the ice mantles and subsequently are released into the gas phase due to star formation activity (Herbst and van Dishoeck [2]).
Formation of dust is believed to arise from two leading sources, including Asymptotic Giant Branch (AGB) stars (e.g., Zhukovska and Henning [7]) and core-collapse supernovae (CSNe; Sarangi et al. [8]). Newly formed grains are then injected into the ISM and constantly reprocessed due to collisions with gas and dust (Zhukovska et al. [9]). The subsequent evolution of dust in the ISM consists of accretion of gas species (atoms and molecules) on the grain surface and grain coagulation.
Destruction of dust is widely studied in the literature (see Jones [10]). Four well-known mechanisms of dust destruction include thermal sublimation, Coulomb explosions, sputtering (thermal and non-thermal), and shattering by grain-grain collisions (see Draine and Salpeter [11], Tielens et al. [12], Jones et al. [13] for details). The first two mechanisms are induced by dust-radiation interaction. While thermal sublimation is efficient in intense radiation fields where dust grains can be heated to sublimation temperatures of 1500–1800 K for silicate and graphite grains, Coulomb explosions require high-energy photons (extreme UV or X-ray) to be efficient (Weingartner et al. [14], Hoang et al. [15]). Note that the large majority of volume of astrophysical environments is filled with radiation fields where grains are only heated to a temperature of , which corresponds to the local energy density spanning a wide range, from a radiation strength of (in units of the average interstellar radiation field (ISRF); Mathis et al. [16]) to , assuming for silicates (Draine [17]). Thus, the current paradigm of dust evolution implies that dust properties do not change under such radiation fields.
The above paradigm of dust evolution is challenged by the early-time observations (within weeks since the first light) toward type Ia supernovae (SNe Ia). Indeed, numerous observations reveal anomalous properties of dust, namely the predominance of small grains in the local interstellar medium of SNe Ia (Phillips et al. [18]), which is characterized by the unusually low value of total-to-selective extinction ratio, (Burns et al. [19], Amanullah et al. [20], Cikota et al. [21]). This is inconsistent with the standard model of interstellar dust with the standard value of (Phillips et al. [18]) and requires enhanced abundance of small grains Nozawa [22]. A similar problem is demonstrated through mid-infrared emission excess (1–5 m) in the spectrum of massive young stellar clusters, which requires an enhanced abundance of small grains relative to large ones. Extinction curves with a steep far-ultraviolet (UV) toward Gamma-ray bursts (GRBs) or quasars also reveal anomalous dust properties with the predominance of small grains. These puzzles cannot be explained with previously known mechanisms of dust destruction (Hoang [23]).
In addition to grain heating and charging, dust-radiation interaction is well-known to induce radiation force and radiative torques (RATs) on dust grains (Dolginov and Mitrofanov [24]). Radiation force accelerates grains to high speeds (Spitzer [25]), resulting in the drift of grains through the gas (Hoang et al. [15], Hoang [26]), while RATs can spin-up grains to suprathermal rotation, that is, rotation at velocities above their thermal angular value (Draine and Weingartner [27], Abbas et al. [28], Lazarian and Hoang [29], Hoang and Lazarian [30,31], Herranen et al. [32]). Note that dust grains are widely known to be rotating suprathermally, as required to reproduce starlight polarization and far-IR/submm polarized dust emission (see Andersson et al. [4], Lazarian et al. [5] for reviews).
Recently, Hoang et al. [33] discovered that irregular grains exposed to intense radiation fields (e.g., from massive stars and supernovae) could be spun-up by RATs to extremely fast rotation such that the centrifugal stress exceeds the maximum tensile strength of the grain material, breaking the original grain into small grains (see also Hoang [34]). This is called RAdiative Torque Disruption (RATD) mechanism. It is noted that Purcell [35] first mentioned rotational disruption as a potential consequence of grain suprathermal rotation induced by pinwheel torques from hydrogen formation. Rotational disruption by RATs for fluffy grains in the solar system is also noticed in Silsbee and Draine [36].
The RATD mechanism requires lower radiation energy to be effective than thermal sublimation. The reason is that RATD tends to break the constituents of the grain that are loosely bound by Van der Waals force of binding energy eV (e.g., for composite grains), whereas thermal sublimation needs high energy to break chemical bonds of energy ∼0.1 eV (Hoang [34]). Thus, this RATD mechanism could be effective for the majority of astrophysical environments (cf. to sublimation or Coulomb explosions), from the average ISRF, star-forming regions, circumstellar regions, to environments around cosmic transients. The RATD mechanism is a ubiquitous process because radiation is ubiquitous in the Universe.
Moreover, dust grains drifting through the ambient gas experience mechanical torques due to stochastic collisions with gas species (Gold [37]). A grain of irregular shape experiences regular mechanical torques, which are stronger than the stochastic torques (Lazarian and Hoang [38], Hoang et al. [39]). The fast relative motion of dust to gas can arise from radiation pressure or interstellar shocks (Draine [40]). As a result, grains can also be spun-up to suprathermal rotation by mechanical torques such that centrifugal stress is sufficient to break a small grain into smaller fragments. This mechanism is termed MEchanical Torque Disruption (METD) and most effective for very small grains of size nm (Hoang and Tram [41], Tram and Hoang [42], Hoang and Lee [43]).
In particular, centrifugal forces on rapidly spinning grains have inevitable effects on the formation and desorption of molecules on/in the ice mantles of dust grains. The reason is that water and complex molecules in the ice mantles sublimate at temperatures of (Herbst and van Dishoeck [2]), which corresponds to , that is, much stronger radiation fields than the ISRF for which RATD is important. As shown in Hoang and Tram [44] and Hoang and Tung [45], the grain suprathermal rotation also affects the chemical composition and metallicity of the gas because ice mantles on the grain surface are easily disrupted by centrifugal stress.
Since RATs are strongest for the grains of size comparable to the photon wavelength, that is, (Lazarian and Hoang [29]), the RATD mechanism is most efficient for large grains of m for starlight of 0.1 m. On the other hand, the METD mechanism is most efficient for very small grains (VSGs) or nanoparticles (size nm) because these tiny grains with small inertia moment rotate faster (Hoang and Tram [41], Hoang and Lee [43]). Thus, the RATD and METD mechanisms determine the grain size distribution, including the upper cutoff and abundance of nanoparticles, which affects dust extinction, emission from microwave to infrared wavelengths, and polarization.
This review focuses on the new grain destruction mechanisms (RATD and METD) and their astrophysical applications. The structure of the review is as follows. We first summarize the current knowledge of grain destruction mechanisms in Section 2. In Section 3, we describe the theory of a new mechanism of dust destruction (RATD) and provides an example of grain disruption by a point source. In Section 4, we describe rotational disruption of ice mantles and desorption of molecules from the icy grain mantle. In Section 5, we present the description of rotational disruption of nanoparticles by mechanical torques (METD). In Section 6, we present modeling methods of dust extinction, emission, and polarization that takes into account the rotational disruption effects. In Section 7, we discuss the applications of the RATD and METD mechanisms for different astrophysical environments, including the diffuse ISM, star-forming regions, cosmic explosions, and high-z galaxies. An extended discussion on the implications of our new mechanisms for time-domain astrophysics and astrochemistry is presented in Section 8. Conclusions and future prospects are summarized in Section 9.
2. Destruction Mechanisms of Astrophysical Dust
Here we first review four well-known destruction mechanisms of astrophysical dust, including thermal sublimation, Coulomb explosions, sputtering, and shattering. The first two mechanisms are associated with intense radiation fields, while the last two are related to relative motion between dust and gas.
2.1. Thermal Sublimation
Grains in a strong radiation field are heated to high temperatures and sublimate rapidly when their temperatures are above the sublimation threshold. The sublimation rate for a grain of radius a and temperature is given by:
where – is the atomic number density of dust, B is the sublimation energy per atom, and for silicate grains, and for carbonaceous grains with N being the total number of atoms of the grain (Guhathakurta and Draine [46], Waxman and Draine [47]).
Plugging the numerical parameters into the above equation, we obtain
for silicate grains, and
for graphite grains, where
At 1800 K, one has s for silicates, which is rather short for astronomical timescales.
For a point source of radiation, one can estimate the sublimation distance of dust grains, , from the central source as
where is the luminosity in the optical and UV, which is roughly one half of the bolometric luminosity, and is the dust sublimation temperature between 1500–1800 K for silicate and graphite material (Guhathakurta and Draine [46], Scoville and Norman [48]). This relation is obtained using , which corresponds to for graphite grains and . By setting , one obtains
Equation (5) implies the increase of the sublimation radius with the source luminosity. For active galactic nuclei (AGN) of , the sublimation region is pc.
2.2. Coulomb Explosions and Ion Field Emission
Grains subject to an extreme UV radiation field are positively charged due to photoemission of electrons. Photoelectric emission can rapidly increase the grain charge, Z, electric surface potential, , and electric field on the surface, .
Tensile stress experienced by a surface element of charge is given by
where has been used.
When the tensile stress exceeds the maximum tensile strength that the material can support, , the grain will be disrupted by Coulomb explosions. Setting , we derive the maximum surface potential and charge that the grain still survives:
When a grain is positively charged to a sufficiently strong electric field, the emission of individual ions (i.e., ion field emission) from the grain surface can occur. Experiments show that with an electric field of , ion field emission already occurs for some metals (see Table 1 in Tsong and Müller [49]). Thus, grains may gradually be destroyed by ion field emission without Coulomb explosions in the case of ideal material with (i.e., ).
Coulomb explosions and ion field emission are efficient in intense extreme UV or X-ray radiation fields only (see Weingartner et al. [14]) or for grains moving with relativistic speeds through the ambient radiation field (Hoang et al. [15]).
2.3. Thermal and Nonthermal Sputtering
When grains move rapidly relative to the gas, they are gradually eroded by sputtering induced by the bombardment of energetic gaseous atoms/ions. The physics is as follows. Upon bombardment, energetic ions penetrate the dust grain and interact with the target atoms, transferring part of their kinetic energy to the target atoms via Coulomb nuclear and electronic interactions. If the target atoms receive kinetic energy larger than their binding energy, they can escape from the grain surface, and the grain loses its mass.
In hot gas, sputtering is induced by thermal protons and referred to as thermal sputtering (Draine and Salpeter [11]). Subject to a supersonic gas flow, sputtering is induced by the bombardment of atoms, which is called nonthermal sputtering (Jones et al. [13]).
Let be the average sputtering yield per impinging atom (i.e., H and He) with speed v. The number of target atoms sputtered by the H bombardment per second is given by
The rate of mass loss due to thermal sputtering is given by
yielding
where is the grain mass density, is the average atomic mass number of sputtered atoms, and v is replaced by the mean thermal speed . The thermal sputtering time is equal to
where .
The decrease in the grain radius per time unit due to nonthermal sputtering by grain drifting at speed through the gas is given by (see e.g., Hoang et al. [15])
which implies a characteristic timescale of nonthermal sputtering,
The sputtering yield, , depends on projectile energy and properties of grain material. Following Tielens et al. [12], the sputtering yield is given by
where is the binding energy of dust atoms, for , for , and is the threshold energy for sputtering given by
and is the maximum energy transfer of a head-on elastic collision. The factor is the ratio of the mean projected range to the mean penetrated path length, as given by Bohdansky [50]
where K is a free parameter, and and for silicate and graphite grains, respectively (see Tielens et al. [12]).
2.4. Grain Shattering
A grain moving in the gas has a chance to hit another grain, resulting in grain coagulation or grain shattering, depending on their relative velocity. The threshold velocity for grain shattering depends on the grain size as (Chokshi et al. [51])
If the relative grain velocity , the grains collide and stick together. For , collisions at high velocity produce shock waves inside the grains and shatter them in smaller fragments. For km, the evaporation of dust grain occurs when a part of grains is heated to evaporation temperatures.
Grain shattering is expected to be efficient in breaking large grains into nanoparticles in magnetized shocks (e.g., Jones et al. [52]).
The destruction time by grain shattering can be estimated by the mean time between two successive collisions:
where is the number density of dust grains, with is the gas-to-dust mass ratio, and we have assumed the single-grain size distribution.
3. Rotational Disruption of Dust Grains by Radiative Torques
In this section, we review a new mechanism of dust destruction, so-called RAdiative Torque Disruption (RATD), which is associated to grain suprathermal rotation by RATs.
3.1. Radiative Torques of Irregular Grains
Let be the spectral energy density of radiation field at wavelength . The energy density of the radiation field is then . To describe the strength of a radiation field, let define with being the energy density of the average ISRF in the solar neighborhoord (Mathis et al. [16]). Thus, the typical value for the ISRF is . The dust temperature can be approximately given by with the dust opacity index () and the grain temperature at . Approximately, one has K and for silicates, and K and for graphite (Draine [17]).
Let be the effective size of the dust grain of irregular shape with volume V. Such an irregular grain exposed to an anisotropic radiation field experiences radiative torque (RAT) due to differential absorption and scattering of left-handed and right-handed photons. The magnitude of RATs is defined as
where is the anisotropy degree of the radiation field, and is the RAT efficiency (Draine and Weingartner [27]). for the ISRF (Draine and Weingartner [27]), 0.3–0.7 for molecular clouds (Bethell et al. [53]), and for unidirectional radiation fields (e.g., from a nearby star).
A helical grain model suggested by Lazarian and Hoang [29] to obtain analytical formulae of RATs is shown in Figure 1 (panel (a)). The components of RATs as functions of the angle (panel (b)) obtained from AMO are in good agreement with numerical results using DDSCAT (panel (c)).
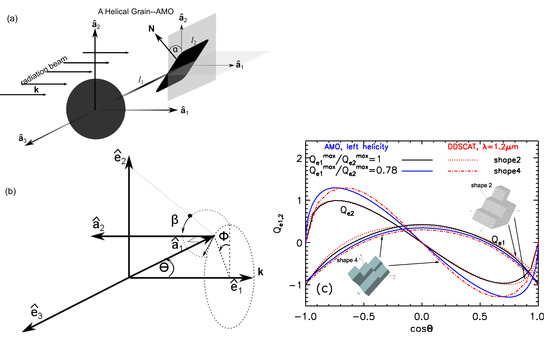
Figure 1.
Panel (a): A helical grain model described by three principal axes, , proposed by Lazarian and Hoang [29] to calculate analytically Radiative Torques (RATs), comprising an oblate spheroid and a massless mirror attached to the spheroid. The normal vector of the mirror is titled by an angle with respect to the principal axis . Panel (b): Scattering coordinate frame of reference used for calculations of RATs, described by three axes, where is defined along , and form a plane perpendicular to . is the angle between the axis of maximum moment of inertia, , with the radiation direction , is the precession angle of around , and is the angle that describes the rotation of the grain around . Panel (c): comparison of the functional form of RATs from AMO and numerical computation using DDSCAT. From Lazarian and Hoang [29].
Numerical calculations of RATs for several shapes and different optical constants using the DDSCAT code (Draine and Flatau [54]) by Lazarian and Hoang [29] find slight differences in RATs among the realization (see Figure 2). The magnitude of RAT efficiency, can be approximated by a power-law (Lazarian and Hoang [29]):
where for and for .
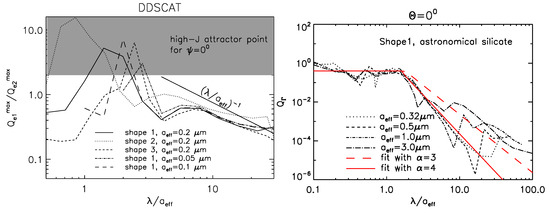
Figure 2.
Radiative torques computed for the different grain sizes and shapes using DDSCAT from Lazarian and Hoang [29]. Left and right panels show the ratio of maximum torque components and RAT magnitude as function of . Astronomical silicate is considered. Power-law fits to the computed results are shown in red lines.
Recently, Herranen et al. [32] calculated RATs for an extensive sample of grain shapes using the T-matrix method, as shown in Figure 3. We can see that the analytical fit (Equation (23)) is in good agreement with their numerical calculations. Therefore, one can use Equation (23) for the different grain compositions and grain shapes, and the difference is an order of unity.
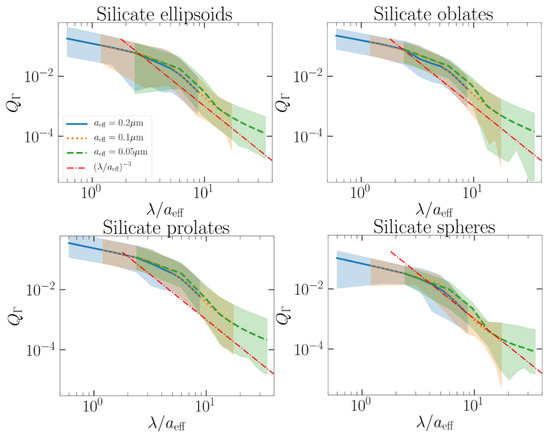
Figure 3.
RATs computed by T-matrix method for the numerous grain shapes of silicate material from Herranen et al. [32]. A power-law fit to the numerical results of slope is given for .
Let be the mean wavelength of the radiation spectrum. For the ISRF, m. The average radiative torque efficiency over the radiation spectrum is defined as
For interstellar grains with , can be approximated to (Hoang and Lazarian [55])
and for .
For convenience, let be the transition size of grains from a flat to the power-law stage of RATs. Plugging into Equation (22) yields the radiative torque averaged over the radiation spectrum,
for , and
for , where .
3.2. Suprathermal Rotation of Dust Grains Induced by RATs
3.2.1. Rotational Damping
The well-known damping process for a rotating grain is sticking collisions with gas species, followed by their thermal evaporation. Thus, for a gas with of H and of He in abundance, the characteristic damping time is given by
where is the thermal velocity of a gas atom of mass in a plasma with temperature and density , and is the grain inertia moment with being a geometrical factor of order unity (Draine and Weingartner [27], Hoang and Lazarian [31]). In the following, we assume for simplicity, and set , .
IR photons emitted by the grain carry away part of the grain’s angular momentum, resulting in the damping of the grain rotation. The characteristic time of the IR damping is where is a dimensionless coefficient. For strong radiation fields or not very small sizes, grains can achieve an equilibrium temperature, and is given by (see Draine and Lazarian [56]),
Other rotational damping processes include plasma drag, ion collisions, and electric dipole emission. These processes are mostly important for polycyclic aromatic hydrocarbons (PAHs) and very small grains (Draine and Lazarian [56], Hoang et al. [57,58]). Thus, the total rotational damping rate of grains by gas collisions and IR emission can be written as
For intense radiation fields with and not very dense gas, one has . Therefore, , which does not depend on the gas properties. In this case, the only damping process is the IR emission. For dense environments and weak radiation fields, , and gas damping dominates.
3.2.2. Maximum Grain Angular Velocity Spun-Up by RATs
Assuming a perfect internal alignment of the grain axis with angular momentum, the equation of motion is given by
where is given by Equation (30). The assumption is valid for suprathermally rotating grains due to internal relaxation (Hoang and Lazarian [31], Purcell [35], Hoang and Lazarian [55], Lazarian and Draine [59], Hoang and Lazarian [60]).
For the radiation source with stable luminosity, the radiative torque is constant, and the grain velocity is steadily increased over time. The maximum angular velocity of grains spun-up by RATs is given by
For strong radiation fields with , such as , plugging (Equations (26) and (27)) and (Equation (30)) into the above equation, one obtains
for grains with , and
for grains with .
For a general radiation field, the maximum rotation rate induced by RATs is given by
for grains with , and
for grains with . Here is the anisotropy of radiation field relative to the typical anisotropy of the diffuse interstellar radiation field.
3.3. Centrifugal Stress Due to Grain Rotation
We assume that the grain is rotating around the axis of maximum inertia moment, denoted by z-axis, with angular velocity . This assumption is valid for suprathermal rotating grains in which internal relaxation can rapidly induce the perfect alignment of the axis of the major inertia with the angular momentum which corresponds to the minimum rotational energy state Purcell [35]. Let us consider a slab at distance x from the center of mass. The average tensile stress due to centrifugal force acting on a plane located at distance is equal to
where the mass of the slab with the area of the circular slab.
The surface average tensile stress is then given by
where .
Equation (38) reveals that the tensile stress is maximum at the grain center and decreases with decreasing the mantle thickness .
By plugging the numerical numbers into Equation (38), one obtains
where . The equation reveals that the centrifugal stress is maximum at the grain center () and decreases with increasing .
3.4. Tensile Strength of Dust
Mechanical properties of dust grains is described by its tensile strength, that is, the maximum strength that the grain material still withstands against an applied tension, denoted by . The tensile strength depends on the internal structure of dust as well as its composition, which is poorly known for astrophysical dust.
In general, compact grains are expected to have higher than composite/fluffy grains. For instance, polycrystalline bulk solid has – (Draine and Salpeter [11], Burke and Silk [61]), while ideal materials, that is, diamond, have (see Hoang et al. [33]). large grains of m) likely have a composite structure, such that the tensile strength is lower, with –, depending on the radius of monomers (Hoang [34]). Nanoparticles or VSGs are likely to have compact structures, thus, their tensile strengths are expected to be large of .
We now consider a composite grain model as proposed by Mathis and Whiffen [62]. This composite model relies on the fact that upon entering the ISM, original silicate and carbonaceous grains are shattered (e.g., by shocks) into small fragments. The subsequent collisions of these fragments reform interstellar composite grains. Following Mathis and Whiffen [62], individual particles are assumed to be compact and spherical of radius . Particles can be of silicate or carbonaceous materials. Let P be the porosity which is defined such that the mass density of the porous grain is with being the mass density of fully compact grain. The value indicates an empty volume of .
Let be the mean intermolecular interaction energy at the contact surface between two particles and h be the mean intermolecular distance at the contact surface. Let be the mean number of contact points per particle between 1–10. The volume of interaction region is . Following Greenberg et al. [63], one can estimate the tensile strength as given by the volume density of interaction energy
We can write eV where is the coefficient of order unity when the interaction between contact particles is only van der Waals forces. The contribution of chemical bonds between ice molecules can increase the value of . The tensile strength can be rewritten as (see Li and Greenberg [64]):
The tensile strength decreases rapidly with increasing the particle radius, as , and decreases with increasing the porosity P. In the following, we fix the porosity , as previously assumed for Planck data modeling (Guillet et al. [65]), and adopt the typical value of .
Numerical simulations for porous grain aggregates from Tatsuuma et al. [66] find that the tensile strength decreases with increasing the monomer radius as
where is the maximum force needed to separate two sticking monomers, is the surface energy per unit area of the material, and is the monomer radius, and is the initial volume filling factor.
3.5. Grain Disruption Size and Disruption Time
When the grain rotation rate is sufficiently high such as the tensile stress, (Equation (38)), can exceed the tensile strength, , the grain is instantaneously disrupted into fragments. The critical angular velocity is obtained by setting :
where , and we assumed , that is, the disruption occurs along the plane going through the grain center (Hoang et al. [67]).
For strong radiation fields such that , from Equations (35) and (43), one can obtain the disruption grain size:
for .
For an arbitrary radiation field and , one obtains
which depends on the local gas density and temperature due to gas rotational damping.
Due to the decrease of the rotation rate for (see Figure 4), there exist a maximum size of grains that can still be disrupted by centrifugal stress (Hoang and Tram [44]):
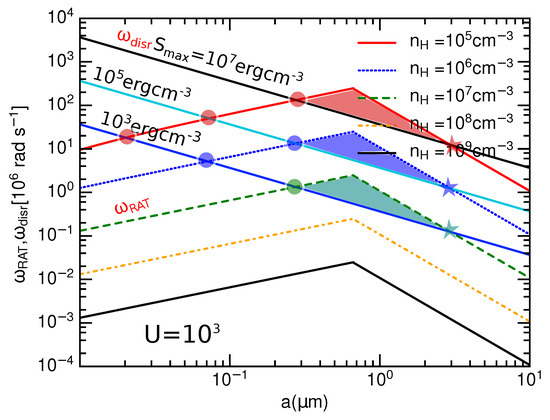
Figure 4.
The grain rotation rate spun-up by RATs () and disruption rate () as functions of the grain size for different gas densities. The radiation strength and three values of tensile strengths are considered. The peak of occurs at . The intersection of and can occur at a lower grain size (marked by a circle) and an upper size (marked by a star), and the shaded area denotes the range of grain sizes in which grains are disrupted by RATs.
For the standard parameters of the diffuse ISM of , one gets 5 m for the typical physical parameters in Equation (46). This is much larger than the maximum grain size of 0.25–0.3 m obtained from modeling of observational data (Mathis et al. [68], Kim and Martin [69], Draine and Fraisse [70]). So, all available grains of a ≳ are disrupted. In dense regions, grains are expected to grow to large sizes due to coagulation and accretion (e.g., Chokshi et al. [51], Ossenkopf [71]). Therefore, not all grains of can be disrupted, and we will find both and for grains in star-forming regions.
The characteristic timescale for rotational desorption can be estimated as (Hoang et al. [33]):
for , and
for .
In Table 1, we compare the timescale of RATD obtained for a strong radiation field with the time from various destruction mechanisms. It is obvious that RATD is the most efficient mechanism to destroy large grains, while the METD mechanism is efficient for nanoparticles. The efficiency of RATD over thermal sublimation is straightforward. While thermal sublimation requires high energy to break molecular bonds within the grain of 10 eV, the RATD only requires low energy to break the Van der Waals force between the monomers/constituents which is only 0.01 eV.

Table 1.
Characteristic timescales of dust destruction by different mechanisms.
3.6. Example of RATD by a Point Radiation Source
For a point radiation source with bolometric luminosity L, the radiation energy density at distance in units of pc is given by
where , and the radiation strength is equal to
For a massive star of at distance pc, Equation (50) implies , and for a supernova of , , which are much stronger than the standard ISRF.
For a given radiation field of constant bolometric luminosity L and mean wavelength , one can calculate for a grid of grain sizes, assuming the gas density () and temperature () for the local environment. We calculate and for the physical parameters of the standard ISM with and , and an H ii region with and .
Figure 5 (panel (a)) shows the grain disruption size as a function of the cloud distance for – for the ISM (blue lines) and H ii regions (orange lines). The results obtained from an analytical formula where the grain rotational damping by gas collisions is disregarded is shown in black lines for comparison. The disruption size increases rapidly with increasing cloud distance and reaches m (marked by a horizontal line in the figure) at some distance. Beyond this distance, grain disruption ceases to occur due to the decrease of radiation energy density (see Figure 5). For , which is typical for OB stars, we get m for for the ISM. For more luminous stars of , m for pc (see dashed line). For a YMSC of , one obtains m for pc, and m for pc.
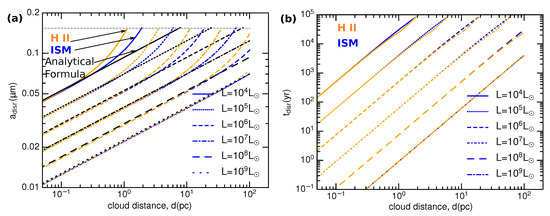
Figure 5.
Grain disruption size and disruption time vs. cloud distance from the central source for massive stars and young massive stellar clusters (YMSCs) of different luminosity, assuming grain tensile strength . Panel (a): Grain disruption size vs. cloud distance computed for the interstellar medium (ISM) (blue lines) and H ii regions (orange lines). Results obtained from an analytical formula in the absence of gas damping are shown in black lines. The horizontal line in the top marks . Panel (b): Grain disruption time vs. cloud distance computed for the ISM and H ii regions. The disruption time is short, below ∼1 Myr for YMSCs of . From Hoang et al. [33].
For a given L, for the ISM and H ii regions is similar at small distances. At large distances from the source, for H ii regions is larger than for the ISM and for the case without gas damping (black lines in Figure 5). The reason is that at large distances, rotational damping by gas collisions becomes dominant over the rotational damping by infrared emission, resulting in the increase of with the gas damping rate which scales as . This can also be seen through the increase in the critical radiation strength required to disrupt grains with the gas damping rate.
Figure 5 (panel (b)) shows the disruption time of grains as a function of the cloud distance for the different values of L. The disruption time increases rapidly with the cloud distance and decreases with increasing L. For grains at 10 pc, one obtains 50–30,000 yr for –.
4. Rotational Desorption of Ice Mantles by Radiative Torques
Ice mantles are formed due to accretion of gas species on the grain surface in cold and dense regions of hydrogen density – or the visual extinction (Whittet et al. [72]). Irradiated by a nearby star or a young star located at the cloud center, icy grains are sublimated when heated to high temperatures of . Here, we discuss the rotational desorption of ice mantles from the grain surface by centrifugal force due to RATs.
4.1. Rotational Desorption of Ice Mantles and Molecule Desorption
Here we consider a grain model consisting of an amorphous silicate core covered by a double-layer ice mantle (see Figure 6, left panel). Let be the radius of silicate core and be the average thickness of the mantle. The exact shape of icy grains is unknown, but we can assume that they have irregular shapes as required by strongly polarized HO and CO ice absorption features (Chrysostomou et al. [73], Whittet et al. [74]). Thus, one can define an effective radius of the grain, a, which is defined as the radius of the sphere with the same volume as the grain. The effective grain size is . The silicate and carbonaceous cores are assumed to have a typical radius of 0.05 Greenberg [75].
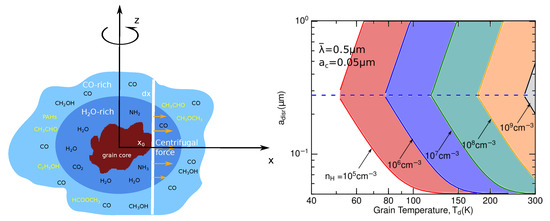
Figure 6.
Left panel: Illustration of a rapidly spinning core-mantle grain of irregular shape, comprising an icy water-rich (blue) and CO-rich (light blue) mantle layers. The core is assumed to be compact silicate material, and complex organic molecules are formed in the ice mantle of the core. Centrifugal force field on a slab is illustrated, which acts to pull off the ice mantle from the grain core at sufficiently fast rotation. Right panel: Range of desorption sizes of ice mantles, constrained by (lower boundary) and (upper boundary), as a function of the grain temperature for the different gas densities for , assuming a fixed core radius and the varying mantle thickness. The horizontal dashed line denotes the transition grain size . Shaded regions mark the range of grain sizes disrupted by RATD. From Hoang and Tram [44].
The tensile strength of the bulk ice is at low temperatures. As the temperature increases to 200–300 K, the tensile strength is reduced significantly to Litwin et al. [76]. The adhesive strength between the ice mantle and the solid surface has a wide range, depending on the surface properties (Itagaki [77], Work and Lian [78]). Here, we adopt a conservative value of for pure ice mantles for our numerical calculations. For the grain core, a higher value of is adopted.
When the rotation rate is sufficiently high such as the tensile stress (Equation (38)) can exceed the maximum limit of the ice mantle, , the ice mantle is separated from the grain surface, which is termed rotational desorption. The critical rotational velocity of the mantle desorption is determined by :
Above, we assume that the grain is spinning along the principal axis of maximum inertia moment. This assumption is valid because internal relaxation within the rapidly spinning grain due to Barnett effect rapidly brings the grain axis to be aligned with its angular momentum (Purcell [35], Roberge and Lazarian [79]).
The grain disruption size of ice mantles is given by
for and , which depends on the local gas density and temperature due to gas damping. The equation indicates that all grains in the size range would be disrupted.
In the absence of rotational damping, the characteristic timescale for rotational desorption of ice mantles can be estimated from Equations (47) and (48):
for , and
for .
The subsequent effect of rotational disruption of ice mantles is the desorption of molecules from the icy fragments, such as water and complex organic molecules (COMs), at temperatures below their sublimation threshold. Figure 7 illustrates a two-step rotational desorption process of molecules from icy grain mantles induced by suprathermal rotation due to RATs. In Figure 8 (left panel), we show the thermal desorption time of icy grains of various sizes, which shows the decrease of with decreasing the grain size. In the right panel, we compare the desorption time with the sublimation time for several molecules.
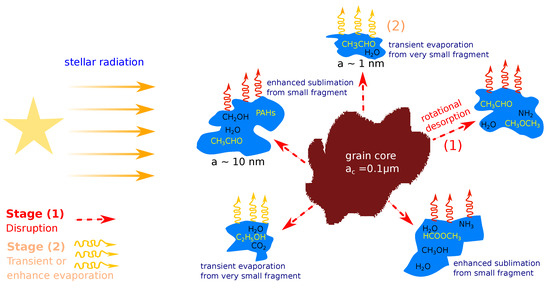
Figure 7.
Schematic illustration of the rotational desorption process of complex organic molecules (COMs) from icy grain mantles comprising two steps: (1) disruption of icy mantes into small fragments by Radiative Torque Disruption (RATD), and (2) rapid evaporation of COMs due to thermal spikes for very small fragments or increased sublimation for larger fragments. From Hoang and Tram [44].
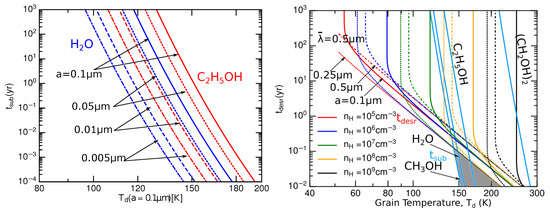
Figure 8.
Left panel: Decrease of sublimation time with decreasing the grain size. Right panel: Comparison of rotational desorption time and thermal sublimation time of various molecules.
4.2. Ro-Thermal Desorption of Molecules from Ice Mantles
The problem of thermal desorption from a non-rotating grain is well studied in the literature (Watson and Salpeter [80], Leger et al. [81]). The underlying physics is that when the grain is heated to high temperatures, molecules on the grain surface acquire kinetic energy from thermal fluctuations within the grain lattice and escape from the surface.
Let be the desorption rate of molecules with binding energy from a grain at rest () which is heated to temperatures . Following Watson and Salpeter [80], one has
where is the characteristic vibration frequency of molecules given by
with being the surface density of binding sites (Tielens and Allamandola [82]).
Table 2 lists the binding energy and sublimation temperature measured from experiments for popular molecules.

Table 2.
Binding energies and sublimation temperatures for selected molecules on an ice surface.
In the presence of grain suprathermal rotation, the centrifugal force acting on a molecule of mass m at distance from the spinning axis (see Figure 9, left panel) is
where is the centrifugal acceleration, and the unit vectors describes the plane perpendicular to the spinning axis.
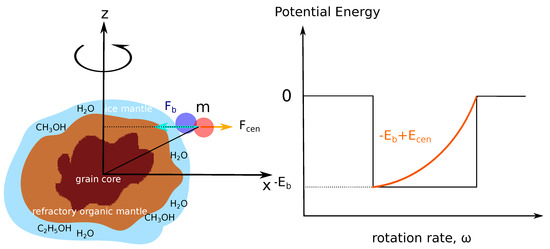
Figure 9.
Left panel: Illustration of a spinning dust grain with ice mantle. A molecule on the surface experiences binding force and centrifugal force in opposite directions. Right panel: Illustration of the potential energy of a molecule on the rotating grain. The potential barrier is reduced significantly as the angular velocity increases as a result of centrifugal potential (). From Hoang and Tung [45].
We can define centrifugal potential such as . Then, the corresponding potential is
Assuming that molecules are uniformly distributed over the grain surface of radius , then, one can obtain the average centrifugal potential as follows:
where .
As a result, the effective binding energy of the molecule becomes
which means that molecules only need to overcome the reduced potential barrier of where to be ejected from the grain surface. The rotation effect is more important for molecules with higher mass and low binding energy.
Figure 9 (right panel) illustrates the potential barrier of molecules on the surface of a rotating grain as a function of . For slow rotation, the potential barrier is determined by binding force. As increases, the potential barrier is decreased due to the contribution of centrifugal potential.
The molecule is instantaneously ejected from the surface if the grain is spinning sufficiently fast such that . From Equation (60), one can obtain the critical angular velocity for the direct ejection as follows:
where .
The ejection angular velocity decreases with increasing grain size and molecule mass m, but it increases with the binding energy .
The rate of ro-thermal desorption (sublimation) rate is given by
where the subscript stands for sublimation, and the second exponential term describes the probability of desorption induced by centrifugal potential.
Equation (62) can be written as
where the function describes the effect of grain rotation on the thermal desorption as given by
which indicates the rapid increase of the ro-thermal desorption rate with the grain size a and angular velocity .
Figure 10 (left) shows the comparison of the timescale of ro-thermal sublimation to classical thermal sublimation for various molecules, assuming the different gas density. The right panel shows the decrease of grain temperature that results in the same desorption rate. The effect of ro-thermal desorption is more efficient for molecules having high binding energy, such as water and ethanol. Figure 10 (right) shows the decrease of the grain temperature required to produce the same desorption rate as the classical mechanism. The decrease is larger for molecules with higher binding energy (sublimation temperature).
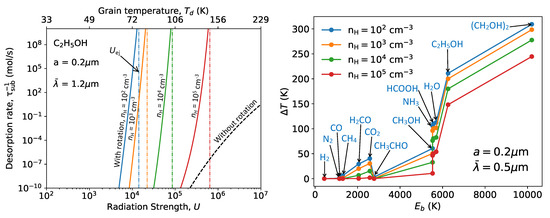
Figure 10.
Left panel: ro-thermal desorption rate of molecules from a thin ice mantle compared to the classical sublimation time. Right panel: decrease of the grain temperature required for desorption at the same rate as classical sublimation. From Hoang and Tung [45].
5. Rotational Disruption of Nanoparticles by Stochastic Mechanical Torques
Radiation pressure from strong radiation fields accelerate dust grains to high speeds, causing them to drift through ambient gas with velocity and experience mechanical torques (Hoang et al. [15]). Rapidly spinning nanoparticles can also be disrupted by centrifugal stress, as first studied by Hoang and Tram [41] for slow speeds in interstellar shocks and generalized for high speeds in Hoang and Lee [43].
5.1. Low-Energy Regime
Let us estimate the rotational excitation of grains due to sticking collisions of gas species. Each atom colliding with the grain surface at radius transfers its entire momentum to the grain, inducing an impulsive torque of (see e.g., Gold [37]). The increase of from each impact is given by
where is the polar angle of the radius vector , and the projectiles are impinging along the horizontal plane.
By averaging the above equation over the grain surface, one has . Thus, Equation (65) becomes
Using the random walk theory for stochastic collisions, one can derive the total increase of squared angular momentum per unit of time as follows:
where the collision rate has been used.
After traversing a time interval , the total average increase of the squared angular momentum is equal to
The rms angular velocity of grains can now be calculated using the total angular momentum from Equation (68):
A rotating grain experiences rotational damping due to sticking collision with gas atoms. Note that sticking collisions do not damp grain rotation due to averaging effect, but subsequent thermal evaporation of atoms that carry away part of the grain angular momentum results in grain rotational damping (see e.g., Draine and Lazarian [56]). Consider a grain rotating along the z-axis with angular velocity .
The mean decrease of grain angular momentum per unit of time is equal to
For the drift velocity with , one has . Therefore, the rotational damping time is
where .
Rapidly spinning dust grains emit strong electric dipole radiation (Draine and Lazarian [56]), which also damps the grain rotation on a timescale of
where is the grain dipole moment and with being the dipole moment per structure due to polar bonds present in the dust grain (Draine and Lazarian [56], Hoang et al. [57,86]).
Comparing with , one can see that, for small grains of nm, the electric dipole damping time is longer than the gas damping time.
Due to the rotational damping, the grain looses angular momentum on a timescale of . Therefore, Equation (69) yields
which can be rewritten as
where with is the dimensionless parameter, and the thermal angular velocity
Equation (74) reveals that nanoparticles can be spun-up to suprathermal rotation if .
5.1.1. Mechanical Torque Disruption (METD) Mechanism
The basic idea of rotational disruption by stochastic mechanical torques (i.e., METD mechanism), is similar to that of RATD (see Section 3). Using Equation (43), the critical angular velocity for the disruption is given by
where is the tensile strength in units of as expected for nanoparticles.
The time required to spin-up a grain of size a to , so-called rotational disruption time, is evaluated as follows:
The above equation implies that nanoparticles of nm moving at are disrupted in yr, while the grain rotation is damped in yr by gas collisions or in yr by electric dipole emission.
We note that METD only occurs when the required time is shorter than the rotational damping time. Let be the grain disruption size as determined by . Thus, comparing Equations (77) and (71), one obtains:
which implies that very small grains ( nm) moving at are disrupted by centrifugal stress, assuming strong grains of . The rotation of larger grains (i.e., ) is damped by gas collisions before reaching the critical threshold.
For a given grain size, the critical speed required for rotational disruption is given by the condition of , which yields
or the dimensionless parameter:
The above equations indicate that the velocity required for METD decreases rapidly with decreasing grain size and with tensile strength. Smallest nanoparticles of sizes nm only require while small grains of require much higher velocities for rotational disruption, assuming .
The rotation of nanoparticles experiences damping and excitation by various interaction processes, including ion collisions, plasma drag, and infrared emission (see Draine and Lazarian [56], Hoang et al. [57]). A detailed analysis of the different damping processes for grains in magnetized shocks is presented in Hoang and Tram [41], Tram and Hoang [42].
5.1.2. Slowing-Down Time by Gas Drag Force
For hypersonic grains, the main gas drag arises from direct collisions with gas atoms, and the Coulomb drag force is subdominant (Draine and Salpeter [87]). Assuming the sticky collisions of atoms followed by their thermal evaporation, the decrease in the grain momentum is equal to the momentum transferred to the grain in the opposite direction:
The gas drag time is given by
5.2. High-Energy Regime
The penetration depth of impinging protons is approximately equal to (Draine and Salpeter [87]):
which reveals that for high-velocity collisions, impinging particles can pass through the grain because . As a result, they only transfer part of their momentum to the grain. We will first find the fraction of ion momentum transferred to the grain and quantify the efficiency of METD.
For interstellar grains with and energetic ions, we have , Hoang [26] derived
where is the energy loss passing the grain, and is the fraction of the ion energy transferred to the grain which is a function of E and a.
Let where be the stopping cross-section of the impinging ion of kinetic energy E in the dust grain of atomic density n (Sigmund [88]). The energy loss of the ion due to the passage of the grain is given by
where the grain is approximated as slab of thickness . Thus,
and for sticking collisions.
Following Equation (66), the impulsive angular momentum from a collision is then given by
which yields the average value
Following the similar procedure as in Section 3.5, one obtain
where S denotes sticking collisions considered in the previous subsection, and is given by Equation (67).
The increase of the grain angular velocity is given by
If the incident ion passes through the grain, the grain rotational damping by gas collisions is not important, and the damping by electric dipole emission takes over. Since is rather long for nanoparticles of nm (see Hoang et al. [57]), the grain angular velocity continues to increase to the critical limit, that is, at , that is, the disruption occurs, in disruption time equal to
where is the disruption time for sticky collisions given by Equation (77). The rate of rotational disruption is decreased rapidly with E when . In the above analysis, we assumed a slab model to calculate the fraction of the momentum transfer (see Hoang and Lee [43] for details).1
For grain velocity below the Bohr velocity of , nuclear interactions dominate, and the stopping cross-section in units of erg cm is given by (Sigmund [88])
where and are the atomic masses and numbers charge of the projectile () and target () atom, and a is the screen length for the nuclei-nuclei interaction potential given by
and
We adopt the approximate function of as in Tielens et al. [12]:
For grain velocities above , electronic interactions dominate, and the stopping power can be approximated as
where is the slope, keV and is the stopping power at . For graphite, we find that and keV/cm. For quartz material, and keV/cm.
Drag force in the high-velocity regime is given by (see also Hoang [26])
For high-energy regime, the drag force is found to decrease with the velocity instead of increasing as in the classical low-energy regime (Hoang [26]).
The drag time is equal to
where is given by Equation (82).
5.3. Grain Disruption Sizes Vs. Grain Velocity
To obtain grain disruption size for arbitrary velocities , we first calculate for a range of grain sizes and compare with rotational damping time . Figure 11 (left panel) shows the values of as a function of grain velocity for various tensile strength. The disruption size increases with increasing and then decreases due to the decrease of ion momentum transfer to the grain ().
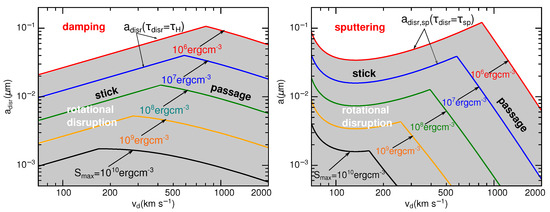
Figure 11.
Grain disruption size vs. grain velocity assuming the different tensile strength of grain material. The solid lines mark the boundary between rotational disruption and damping () and (right panel). Shaded areas mark the parameter space where rotational disruption (METD) is faster than rotational damping (left panel) and nonthermal sputtering (right panel). From Hoang and Lee [43].
Figure 11 (right panel) shows the variation of with . Shaded areas mark the parameter space () in which METD is faster than nonthermal sputtering. For weak grains (e.g., of fluffy structure) with , grains of can be disrupted for . For very strong grains of ideal structures with , very small grains of can be rotational disrupted for . Nonthermal sputtering dominates the destruction of large grains (i.e., ) or at high velocities of .
6. Effects of Rotational Disruption on Dust Extinction, Emission, and Polarization
The RATD and METD processes affects the grain size distribution that determines the observable properties of astrophysical dust, including extinction, thermal emission, and polarization. Nanoparticles produced by RATD emit microwave emission via spinning dust mechanism. Below, we will present modeling of the dust extinction and polarization for grains in the ISM with various radiation strength U.
6.1. Grain Size Distribution From RATD
Grain size distribution is a fundamental parameter of dust. For the diffuse ISM, significant efforts have been made to infer the reliable size distribution (e.g., Mathis et al. [68], Weingartner and Draine [89]).
The most popular dust model consists of two separate populations of amorphous silicate grains and carbonaceous (graphite) grains (see Weingartner and Draine [89], Draine and Li [90]. For both populations, the grain size distribution is usually described by a power-law (Mathis et al. [68], hereafter MRN):
where is the number density of grains of material or gra between , is the number density of hydrogen, and , and the lower and upper cutoff are = 10Å and . We take constant from Weingartner and Draine [89] for MRN size distribution as follows: cm and cm.
The MRN size distribution is widely used for describing dust in our galaxy. We can plausibly assume that the standard MRN size distribution is suitable for the standard ISRF with radiation strength . Toward a stronger radiation field (), the RATD effect changes the upper cutoff of the original size distribution and the abundance of small grains vs. large grains. The new size distribution of grains should depend on the internal structure of grains.
To describe the size distribution in the presence of RATD, we can adopt the power law as in Equation (99), but with the different model parameters that are constrained by the constant dust-to-mass ratio. In general, the RATD effect disrupts large grains of size into smaller ones. In the diffuse ISM, large grains above 1 m are not expected, thus, the RATD mechanism determines the upper limit of the grain size distribution of the ISM because m. Therefore, we set .
To account for the RATD effect, we fix the constant C and change the slope . Such a new slope is determined by the dust mass conservation as given by:
which yields
We obtain by numerically solving the above equation (see Giang et al. [91] for more details).
6.2. Dust Extinction and Starlight Polarization
The radiation intensity of starlight is reduced mainly due to the absorption and scattering (i.e., extinction) of dust along the line of sight. The extinction efficiency of light by a dust grain is defined by where is the extinction cross-section. We use a mixed-dust model comprising silicate and graphite materials (Weingartner and Draine [89], Draine et al. [92]) and take calculated for oblate spheroidal grains of axial ratio from Hoang et al. [93].
The extinction of stellar light at wavelength in magnitude per H atom is given by (see e.g., Hoang et al. [93]):
where with L the path length is the column density, is the grain size distribution of dust component j.
Starlight is polarized due to extinction by aligned dust grains (Hall [94], Hiltner [95]). We assume that only silicate grains can be aligned with the magnetic field, whereas graphite grains are not efficiently aligned (Chiar et al. [96]; see Hoang and Lazarian [97] for a theoretical explanation).2 For the magnetic field in the plane of the sky, the degree of starlight polarization per H atom due to aligned grains in % is given by (Hoang [23]):
where = is the polarization cross-section with the polarization efficiency, and is the alignment function describing the grain-size dependence of the grain alignment degree. For our modeling, we consider the oblate grain shape and take data of computed by Hoang et al. [93].
The alignment function can be modeled by the following function:
which yields the perfect alignment for large grains of and adequately approximates the numerical results from Hoang and Lazarian [97] as well as results from inverse modeling of starlight polarization (Hoang [23], Hoang and Lazarian [55]).
Figure 12 (left panel) shows that the polarization spectrum with in the diffuse media peaks at m when RATD is not taken into account. The polarization at reflects the polarization spectrum from the typical interstellar radiation field. As the radiation field strength increases, moves to shorter wavelengths because of the enhancement of small grains. Figure 12 (right panel) shows the results obtained when RATD is taken into account. The optical-NIR polarization decreases but the UV polarization increases with increasing U due to the conversion of largest grains into smaller ones. As a result, the width of the polarization spectrum becomes narrower as the radiation field strength increases.
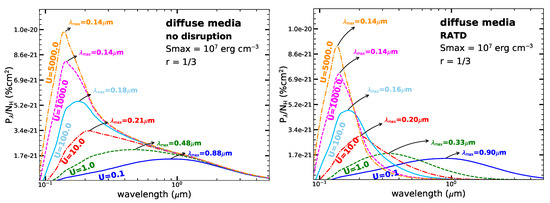
Figure 12.
Polarization spectrum due to extinction of starlight by dust grains aligned with axial ratio by RATs for the diffuse media with various radiation field strengths for two cases without RATD and with RATD. A tensile strength is considered. From Lee et al. [99].
6.3. Thermal Emission and Polarized Emission
Dust grains heated by starlight re-emit thermal radiation in infrared. For the optically thin regime, the total emission intensity and polarized intensity are respectively given by (Draine and Fraisse [70]):
where is the temperature distribution function which depends on the grain size and radiation strength U, and is the Planck function as given by
Above, we disregard the minor effect of grain alignment on the thermal emission, which is considered in Draine and Fraisse [70].
The polarization degree of thermal emission is then given by
Figure 13 shows the polarization spectrum of thermal emission from dust grains aligned by RATs in the absence of RATD (left panel) and presence of RATD (right panel) for prolate grains of axial ratio , assuming the tensile strength . In the absence of RATD (left panel), the maximum polarization increases with increasing the radiation strength U as a result of enhanced alignment of small grains. The peak wavelength () of the polarization spectrum moves toward short wavelengths as U increases, but their spectral profiles remain similar. When the RATD mechanism is taken into account, the polarization degree for is essentially lower than the case without RATD due to the removal of large grains by RATD. Moreover, the peak polarization degree decreases as the radiation strength increases from to .
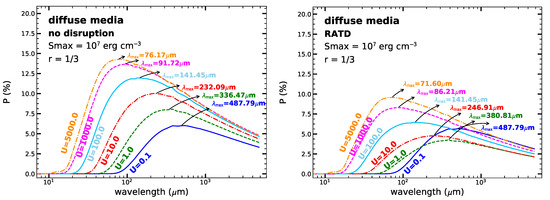
Figure 13.
Polarization spectrum of thermal emission from aligned grains by RATs with axial ratio in the diffuse medium with various radiation field strengths, assuming no grain disruption (left panel) and with disruption by RATD (right panel). The tensile strength is considered. From Lee et al. [99].
6.4. Microwave Emission from Spinning Nanoparticles
Nanoparticles rapidly spinning are suggested to emit microwave emission. We first describe the spinning dust model which will be used in Section 7 to model microwave emission spectrum in the AGB and magnetized shocks where the RATD and METD are considered.
The rotational emission mechanism is built upon the assumption that nanoparticles own non-zero electric dipole moments. PAH molecules can acquire intrinsic dipole moments due to polar bonds (see Draine and Lazarian [56]). The attachment of SiO and SiC molecules to the grain surface gives rise to the electric dipole moment for nanosilicates (Hoang et al. [86]). Let N be the total number of atoms in a spherical nanoparticle of radius a. Assuming PAHs with a typical structure C:H = having mean mass per atom amu, one obtains for the mass density (Draine and Lazarian [56]). Assuming nanosilicates with structure SiOMgFe having amu, one has for (Hoang et al. [86]).
Let be the dipole moment per atom in the grain. Assuming that dipoles have a random orientation distribution, the intrinsic dipole moment of the grain can be estimated using the random walk formula:
for PAHs, and for nanosilicates Hoang et al. [86]. The power emitted by a rotating dipole moment at angular velocity is given by the Larmor formula:
where is the angle between and . Assuming an uniform distribution of the dipole orientation, , then, is replaced by .
In dense regions where gas-grain collisions dominate rotation dynamics of nanoparticles (e.g., in shocked regions), the grain angular velocity can be appropriately described by the Maxwellian distribution:
where I is the moment of inertia of the spherical nanoparticle of mass density , and is the grain rotational temperature (see Draine and Lazarian [56]).
The size distribution of nanoparticles is usually described by a log-normal size distribution (Li and Draine [100]):
where corresponds to PAHs and nanosilicate composition, and are the model parameters, and is a constant determined by
where is the grain mass per atom X, with being the fraction of X abundance contained in very small sizes and being the solar abundance of element X. In our studies, C for PAHs and Si for nanosilicates. In addition, for PAHs, and for nanosilicates of the adopted composition.
The peak of the mass distribution occurs at . Three parameters determine the size distribution of nanoparticles, including .
The effect of METD completely removes nanoparticles smaller than , shifting the lower cutoff to . On the other hand, the effect of RATD enhances the abundance of nanoparticles. So, the total size distribution of nanoparticles include the log-normal form and the power-law term adjusted by RATD (see Tram et al. [101]). Note that the power-law size distribution for nanoparticles is also explored in Hensley and Draine [102].
Let be the emissivity from a spinning nanoparticle of size a where depends on local conditions. Thus, one has
where is the probability that the nanoparticle rotating at emits photons at observed frequency , and the relation is assumed.
Here we disregarded the effect of grain wobbling (Hoang et al. [57]) and assume that nanoparticles are rotating along one axis as in Draine and Lazarian [56]. This assumption is likely appropriate for shocked regions because suprathermal rotation () due to supersonic neutral drift is expected to induce rapid alignment of the axis of maximum inertia moment with the angular momentum (i.e., internal alignment, Purcell [35]).
The rotational emissivity per H nucleon is obtained by integrating over the grain size distribution (see Hoang et al. [58]):
where for spinning PAHs and nanosilicates, respectively.
7. Applications of RATD in Astrophysics
The rotational disruption and desorption mechanisms induced by RATs that rely on dust-radiation interaction are effective in various environments with considerable radiation fields. Figure 14 shows the selected environments for rotational disruption and desorption. Below, we will review the most important applications of these mechanisms for several astrophysical environments.
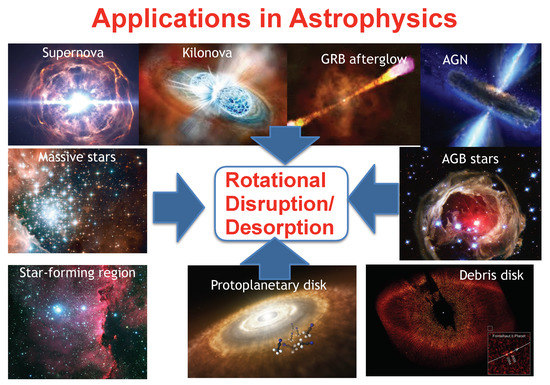
Figure 14.
Illustration of astrophysical environments where rotational disruption and desorption of dust and ice due to radiative torques are most important thanks to strong radiation fields. The interstellar medium of our galaxy and other galaxies is not shown here, but RATD is also important, especially for starburst and high-z galaxies.
7.1. Effect of RATD on Dust Evolution in the Interstellar Medium
The RATD has been used for studying the evolution of the grain size distribution of interstellar dust in our galaxy (Hoang [34]), star-burst galaxies, and high-redshift galaxies (Hirashita and Hoang [103]).
Hoang [34] introduced a dynamical constraint for dust models using the RATD mechanism for the diffuse ISM. To characterize the various radiation fields, we consider the different values of the radiation strength U, assuming the same radiation spectrum, that is, . Figure 15 shows the grain disruption by RATD for the various physical parameters , assuming the radius of monomers and 50 nm (panels (a)-(d)). The rapid disruption by RATD compared to other destruction mechanisms (see Table 1) establishes the upper cut-off of the grain size distribution. For the Galaxy, the RATD successfully reproduces the upper limit of m constrained by observations for a composite structure model of large grains with nm (see panel (a)).
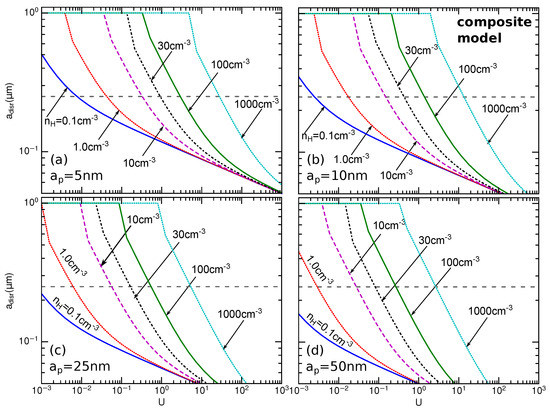
Figure 15.
Disruption grain size as a function of the radiation strength, U, for a composite grain model with porosity for the different gas density , assuming and 50 nm (panels (a)-(d)). The horizontal dashed line marks the upper limit of the MRN size distribution m. We set m in case of no disruption. The disruption size decreases with increasing U due to stronger RATs, but it increases with increasing due to the increase of rotational damping. Rotational disruption is more efficient for larger (panel (d)) due to lower tensile strength (see Equation (41)). From Hoang [34].
The effect of RATD on dust evolution in galaxies is carried out in Hirashita and Hoang [103] where the authors model the grain size distribution for the different ages of the universe. For the typical starburst model, we examine (corresponding to K) for an extreme ISRF environment actually observed in starburst galaxies (e.g., Zavala et al. [104], Lim et al. [105]).
Figure 16 (left panel) shows the resulting grain size distributions. Since the evolutionary time-scale is short, we show , 0.1, 0.3, 0.5, and 1 Gyr. Small grains are abundant already at Gyr because rotational disruption supplies small grains.
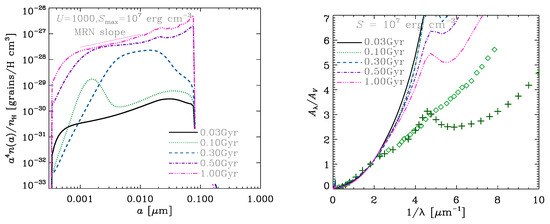
Figure 16.
Evolution of grain size distribution (left panel) and extinction curve (right panel) for the starburst model. The solid, dotted, dashed, dot–dashed, and triple-dot–dashed lines show the grain size distributions at , 0.1, 0.3, 0.5, and 1 Gyr, respectively. The thin dotted line shows the MRN slope. We adopt a typical value and fix . In the right panel, crossed and squared symbols show the MW and Small Magellanic Cloud (SMC) extinction curves. From Hirashita and Hoang [103].
Figure 16 (right panel) shows the extinction curves corresponding to the above grain size distributions for the starburst models. We observe that the extinction curves stay steep for erg cm because of the small maximum grain radius (). A significant steepening of the extinction curve is seen even at Gyr because of the efficient small-grain production by rotational disruption. It is interesting to point out that the extinction curves are similar to the Small Magellanic Cloud (SMC) extinction curve at young ages. The extinction curves become flatter at later stages because of coagulation. Therefore, in starburst galaxies, the small-grain production by rotational disruption could put a significant imprint on the extinction curves, especially at young ages.
For some starburst galaxies, attenuation curves, which include all the radiation transfer effects, are obtained instead of extinction curves (e.g., Calzetti [106]). The effects of dust distribution geometry and of stellar-age-dependent extinction make the attenuation curve significantly different from the original extinction curve (e.g., Witt and Gordon [107], Inoue [108], Seon and Draine [109]). Therefore, the fact that the extinction curves derived in this paper are different from the so-called Calzetti attenuation curve is not a contradiction.
The evolution of grain temperature (radiation strength U) with redshift is still being debated. While there have been some observational evidence that the dust temperature tends to be higher in higher redshift galaxies (Zavala et al. [104], Symeonidis et al. [110], Bethermin et al. [111], Schreiber et al. [112]), the trend could be driven by an observational bias (Lim et al. [105]). Zavala et al. [104] derived the best-fit , which corresponds to . Thus, for , one already has .
At , Lyman break galaxies (LBGs) and Lyman emitters have dust temperatures typically higher than ∼35 K, and some could have dust temperatures as high as ≳70 K (e.g., Hirashita et al. [113], Bakx et al. [114]). Ferrara et al. [115] also theoretically suggested that the dust temperature in the diffuse ISM of high-redshift LBGs could be as high as 35–60 K. These dust temperatures correspond to a few tens to a few thousands. There are also some extreme populations of galaxies whose dust temperatures even reach ∼90 K (Toba et al. [116]). This indicates that rotational disruption could have a significant imprint on the grain size distributions and the extinction curves in high-redshift galaxies.
7.2. Constraining Grain Internal Structures With Observations
One of the least known properties of interstellar dust is its internal structure, which determines the grain tensile strength. Using the RATD, Lee et al. [99] modeled the polarization by aligned grains for various tensile strengths and grain temperatures (radiation strength). Since RATD is most efficient for the largest grains, which dominate the polarized emission in submm/far-IR, it is appropriate to consider how the submm polarization changes with U and . The obtained results are shown in Figure 17.
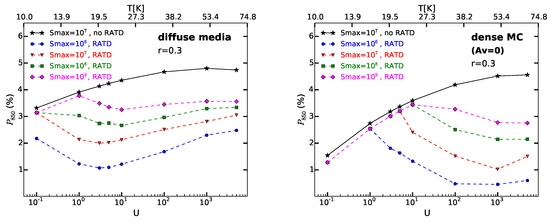
Figure 17.
Polarization degree at 850 m as a function of the radiation strength (U) or grain temperature (, top horizontal axis) for two cases, without RATD (solid lines) and with RATD (dashed lines), assuming the different tensile strength of grains in the diffuse ISM (left panel) and MC (right panel). Grains with axial ratio of are considered. From Lee et al. [99].
In the absence of grain disruption by RATD, the polarization at 850 m, denoted by , increases monotonically with the radiation intensity (i.e., grain temperature) over the considered range of U. The absence of RATD is equivalent to the situation where grains are made of ideal material without impurity such that the tensile strength is as high as (e.g., diamonds). However, when the RATD effect is taken into account for grains made of weaker material (, the polarization degree first increases from a low value of U and then decreases when U becomes sufficiently large. The critical value U at the turning point is determined by the value and local gas density that controls the grain disruption size according to RATD.
Guillet et al. [65] performed a detailed analysis of the variation of with the radiation field using Planck data and discovered that first increases with increasing grain temperature from 16–19 K and then drops as the dust temperature increases to . Such an unusual relationship cannot be reproduced if large grains are not disrupted (i.e., RATD is not taken into account), as shown in Figure 17. However, the observed trend is, in general, consistent with our model with RATD for grains with a tensile strength of . This range of tensile strength favors a composite internal structure of grains over the compact one.
7.3. Effect of RATD on Colors and Light-Curves of Cosmic Transients
Absorption and scattering by foreground dust control the color and light-curves of astrophysical transients (i.e., novae, supernovae, GRBs, kilonovae). In light of the RATD effect, dust properties are rapidly changed under intense radiation of transients, which are essential for the time-domain astronomy era. In this subsection, we apply the RATD to model time-varying extinction, color, and polarization of astrophysical transients. We will focus on Type Ia Supernova and GRB afterglows.
7.3.1. Type Ia Supernovae
Type Ia supernovae (SNe Ia) have widely been used as standard candles to measure the expansion of the universe due to their stable intrinsic luminosity (Riess et al. [117]). To achieve the most precise constraints on cosmological parameters, the effect of dust extinction on the SNe Ia’s intrinsic light curve must be accurately characterized. Optical to near-infrared photometric observations of SNe Ia during the early phase (i.e., within a few weeks after maximum brightness) reveal unusual properties of dust extinction, with unprecedented low values of (Refs. Burns et al. [19], Nobili and Goobar [118]), much lower than the standard Milky Way value of (Ref. Draine [1]). Moreover, polarimetric observations also report unusually low wavelengths of the maximum polarization (m) for several SNe Ia (Kawabata et al. [119], Patat et al. [120]). Numerical modeling of dust extinction (Nozawa [22]) and polarization curves (Hoang [23]) toward individual SNe Ia demonstrate that the anomalous values of and can be reproduced by the enhancement in the relative abundance of small grains to large grains in the host galaxy. The RATD mechanism could resolve this puzzle, as proposed by Hoang et al. [33].
Using the RATD theory, Giang et al. [91] performed modeling of time-varying disruption, extinction, and polarization. Figure 18 shows our results for dust grains having a maximum tensile strength . The disruption occurs on a short time of tens of days for dust clouds located within pc (left panel). Figure 18 (middle panel) shows the extinction curves (see Section 6.2) evaluated at different times for dust grains located at distance pc from the source. The extinction curve at days (red dashed line) is the same as the extinction at days because (see Equation (47)). For days, the optical-NIR extinction decreases rapidly with time due to the removal of large grains by RATD. On the other hand, the UV extinction is increased due to the enhancement in the abundance of small grains by RATD. The extinction at m is essentially unchanged because of the wavelength is much larger than the grain radius, that is, .

Figure 18.
Left panel: Disruption sizes vs. time for dust grains at different distances. Middle panel: Extinction curves evaluated at different times for , assuming the dust cloud at 1 pc from SNe Ia. Optical-NIR extinction decreases while UV extinction increases over time due to RATD. Right panel: Variation of from FUV-R bands with time. Vertical lines mark the disruption time of graphite which occurs earlier than silicates. The ratio is constant initially and starts to vary with time when RATD begins at . After the disruption ceases, the ratio is constant again. From Giang et al. [91].
Figure 18 (right panel) shows the time-dependence of the ratio for the different photometric bands (FUV to R bands) and various cloud distances. Here we choose m for the far-UV band (FUV), m for the mid-UV band (MUV) and m for the near-UV band (NUV). As shown, the ratio is constant during the initial stage of before grain disruption, and it starts to rapidly change when RATD begins at .
From , we can calculate the color excess and to understand how these quantities vary with time due to RATD. Figure 19 (left panel) shows the variation of with time. The value starts to rapidly decrease from the initial standard value of to 1–1.5 after less than 40 days. The moment where starts to decline is similar to the grain disruption time . The time required to decrease from its original value is shorter for grains closer to the source, and the terminal value of is also smaller. Figure 19 (right panel) shows the variation of with time for the different cloud distances. For a given cloud distance, the color excess remains constant until grain disruption begins at . Subsequently, the ratio increases rapidly and then decreases to a saturated level when RATD ceases.
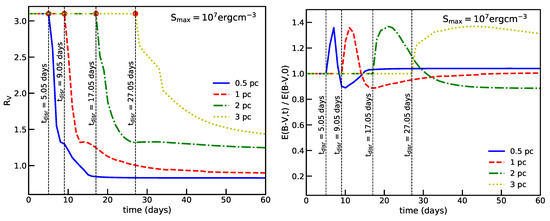
Figure 19.
Time variation of (left panel) and (right panel) for different cloud distances and . Both and begin to change when grain disruption starts at (marked by vertical dotted lines). decreases rapidly from their original values from to 40 days and then almost saturates when RATD ceases. From Giang et al. [91].
Figure 20 (left panel) shows the polarization curve produced by aligned grains with the magnetic field (see Section 6.2) computed at different times for a dust cloud at 1 pc, assuming . At days, dust grains are aligned by the average diffuse interstellar radiation, so the maximum polarization occurs at m. After that, SNe radiation dominates and makes smaller grains to be aligned. As a result, the UV polarization is increased rapidly, and the peak wavelength of is decreased. The degree of optical-NIR polarization (m) is slightly increased. After days, grain disruption by RATD begins, reducing the abundance of large grains. Therefore, the degree of optical-NIR polarization decreases substantially, which results in a narrower polarization profile compared to the original polarization curve.
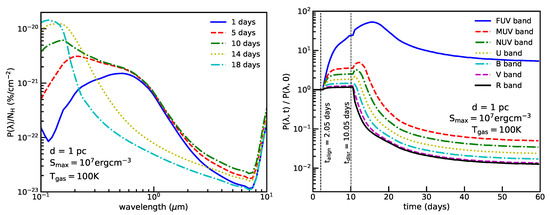
Figure 20.
Left panel: Polarization curves evaluated at different times for a dust cloud at 1 pc, assuming . Enhanced alignment of small grains induces the blueshift of the peak wavelength. The RATD effect reduces polarization at m, and the efficiency is weaker for higher . Polarization curves evaluated at days for different cloud distances, assuming . Right panel: Ratio vs. time from far-UV band (FUV) to V band for different cloud distances assuming . Optical/NIR polarization degree first increases due to enhanced alignment by RATs and then declines when grain disruption by RATD starts. Dotted vertical lines mark alignment time () and disruption time () of silicate grains. From Giang et al. [91].
Figure 20 (right panel) shows the temporal variation of from FUV to R bands for the different cloud distances. During the initial stage, the ratio is constant, however, this stage is rather short, between 1–5 days, corresponding to the alignment timescale (see also Hoang [23]). After that, the polarization degree increases gradually, and this rising period continues until 5–30 days when RATD begins (i.e., at ) for 0.5–3 pc. After that, the polarization degree declines rapidly and achieves a saturated level when RATD ceases, which occurs after days for pc, 40 days for pc, respectively. In summary, due to RAT alignment and RATD, the polarization degree increases from to , and it decreases rapidly at .
Figure 21 compares our modeling results for and with observational data where are two parameters present in the Serkowski law (Serkowski et al. [121]):
where is the maximum degree of polarization, is the wavelength at the peak wavelength, and K is a parameter (Wilking et al. [122], Whittet et al. [123]). Here, the model parameters K and are obtained by fitting the Serkowski law (Equation (115)) to the polarization curve calculated by Equation (103).
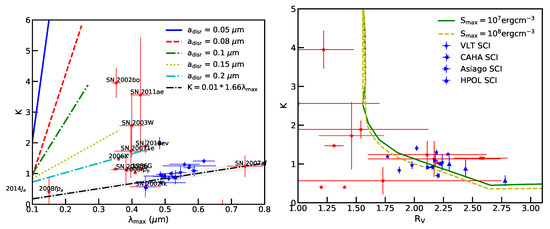
Figure 21.
Left panel: Relationship between K and predicted by our model for different disruption sizes and alignment size. The black line is the standard relationship. Right panel: K vs. from our models compared with observational data for SNe Ia. Symbols show observational data for SNe Ia presented (red symbols) and normal stars in our galaxy (blue symbols). From Giang et al. [91].
The left panel of Figure 21 shows the peak wavelength and the parameter K for several values of the grain disruption size from m to m. For each value , the alignment size is varied from m to m to account for the effect of enhanced alignment by SNe light for more details). We see that, for a given , K decreases rapidly with decreasing due to the decrease of . Moreover, for a given , tends to decrease with decreasing . In particular, we see that the high K values of SNe Ia could be reproduced by our models with RATD with different . The right panel of Figure 21 shows the variation of where a decrease of K with is observed. The model is in good agreement with observational data.
7.3.2. GRB Afterglows
GRBs are thought to explode in dusty clouds. Thus, their intense radiation fields are expected to have a dramatic impact on the surrounding dust, which in turn affects the color and light-curves of the GRB afterglow. In Hoang et al. [124], we model the effect of RATD on the extinction, polarization, and light-curves of GRB afterglows.
Figure 22 (left panel) shows the grain disruption size due to the RATD effect as a function of time for the different cloud distance, assuming and s. For a given cloud, the grain disruption size decreases with time due to the increase of RATD. Figure 22 (right panel) shows the variation of the extinction in the different bands with time. When the RATD begins, the optical-IR extinction decreases rapidly, whereas the UV extinction increases then decreases due to the decrease of grain sizes via RATD.
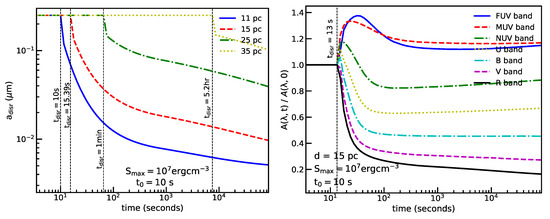
Figure 22.
Left panel: Variation of grain disruption size by RATD with time for the different cloud distance, assuming . RATD occurs earlier (see vertical lines) and can achieve smaller values for smaller . Right panel: Variation of the extinction in the different bands with time. From Hoang et al. [124].
Figure 23 shows the time-variation of (left) and (right), assuming that the dust cloud is located at different distances from the source. The value is found to decrease gradually due to RATD that removes large grains over time.
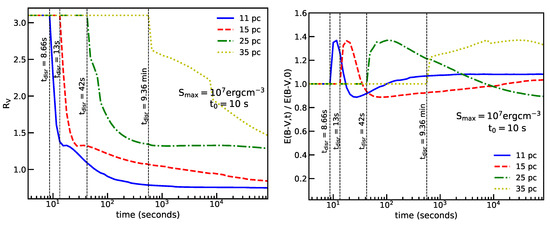
Figure 23.
Time variation of (left panel) and (right panel) and for different cloud distances and . Both and begin to change when grain disruption begin at (marked by vertical dotted lines). From Hoang et al. [124].
The application of RATD for studying evolution of dust and ice in comets (a different kind of transients) is recently explored in Hoang and Tung [125]. We find that large aggregate grains rapidly disrupt into small fragments, resulting in the change of dust properties within the cometary coma.
7.4. Circumstellar Envelopes of AGB Stars
In Tram et al. [101], we apply the RATD and METD mechanisms to study dust evolution in the envelope of AGB stars. Subject to a strong radiation field from the central star, large grains formed in dense clumps are disrupted by RATD into smaller ones, including nanoparticles. At the same time, such nanoparticles are moving outward by radiation pressure through the gas and are disrupted by stochastic mechanical torques. Rapidly spinning nanoparticles produced by RATD produce strong microwave emission, as shown in Section 6.4.
Figure 24 shows the disruption size of grains by RATD (left panel) in the AGB and its microwave emission from spinning dust (right panel). The disruption size is smaller for weaker grain materials (i.e., lower ).
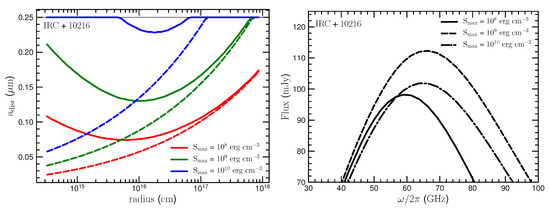
Figure 24.
Left panel: Disruption size of dust grains versus distance from the star in the circumstellar envelope (CSE) of IRC + 10216 for the different tensile strengths (). The initial maximum grain size is chosen as 0.25 m. Right panel: Emission flux from spinning nanoparticles in CSEs around C-rich star (IRC + 10216, top). We adopt , , , (Draine and Li [90]), and (Hoang et al. [86]).
The early detection of cm-wave observations toward to the AGB stars, that is, at 15 GHz (or 2 cm) and 20 GHz (or 1.5 cm) from IRC + 10216 (Sahai et al. [126]), and at 8.4 GHz (or 3.57 cm) from 4 AGB stars over 21 samples (Knapp et al. [127]) cannot be explained by thermal dust emission. Recently, Dehaes et al. [128] presented the SED observations from a large sample of O-rich and C-rich AGB stars envelopes and showed emission excess at cm wavelengths for many stars, including some post-AGB and supergiants with circumstellar shells.
Tram et al. [101] attempt to fit the data with spinning dust. The authors vary three parameters , and while fixing other physical parameters until a best-fit model is achieved. In purpose of showing the whole SED, we combine with the best model of the thermal dust emission provided by Dehaes et al. [128], which were modeled by DUSTY code (Ivezic et al. [129]) with . Figure 25 shows our best-fit models to observational data for three C-rich (left panel) and three O-rich (right panel) stars with the corresponding set of fit parameters in the caption. Apparently, thermal dust and spinning dust are able to reproduce the mm-cm emission for both C-rich star (top panel, Figure 25) and O-rich stars (bottom panel, Figure 25).
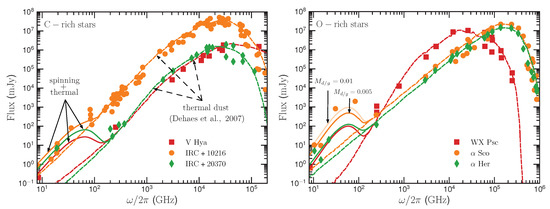
Figure 25.
Comparison of spinning dust (solid lines, this work) and thermal dust (dashed lines, taken from Dehaes et al. [128]) model to radio observational data from the literature (filled symbols). The solid lines show that the spinning dust model can reproduce well the CSEs of both C-rich (left panel) and O-rich stars (right panel). C-rich stars - , : (IRC + 10216), (IRC + 20370) and (V Hy). O-rich stars - : , ( Sco); ( Her); (WX Psc). Note: the dust-to-gas mass ratio is fixed as as in Dehaes et al. [128]. The faint orange line likely indicates a higher dust-to-gas-mass ratio of 0.01 in the case of Sco.
7.5. Rotational Disruption of Dust and Ice in Protoplanetary Disks
The widespread presence of PAHs/nanoparticles in the surface layer of protoplanetary disks (PPDs) around Herbig Ae/Be stars, even in the inner gap (e.g., Boutéraon et al. [130]) is difficult to explain because PAHs/nanoparticles in the surface layer are expected to be destroyed by extreme UV photons and the X-ray component of the star’s radiation spectrum (Siebenmorgen and Krügel [131]). To explain the observations of PAHs in the disk, Siebenmorgen and Krügel [131] suggested that PAHs are transported from the disk interior to the surface via turbulent mixing in the vertical direction, which requires the presence of PAHs in the disk interior. This scenario is difficult to reconcile with the fact that PAHs are expected to be depleted due to condensation into the ice mantle of dust grains in cold, dense clouds (Bernstein et al. [132], Cuylle et al. [133], Cook et al. [134]).
In Tung and Hoang [135], we applied the RATD mechanism to study the evolution of ice by radiation from young stars in protoplanetary disks (PPDs). We propose a top-down mechanism in which PAHs/nanoparticles are produced from the disruption of dust grains when being transported from the disk interior to the surface layers.
Figure 26 (left panel) shows that large grains can be disrupted into nanoparticles in a vast area of the surface and intermediate layers by the RATD mechanism. Moreover, PAHs/nanoparticles frozen in the icy grain mantles can desorb from the ice mantle via the ro-thermal desorption mechanism (Hoang and Tung [45]; right panel). Thus, if grains are small enough ( 1 m) to be mixed with the gas by turbulence, they can escape grain settling and coagulation in the disk mid-plane and are transported to the surface layer (Dullemond and Dominik [136], Fromang and Nelson [137]). When exposed to stellar radiation, large grains within the range size [, ] could be disrupted by RATD into PAHs/nanoparticles (see Figure 26, left panel). Furthermore, our results suggest an increase in the relative abundance of nanoparticles with decreasing the distance to the star. Therefore, in the framework of rotational disruption and desorption, PAHs and nanoparticles would be continuously replenished in the surface layer, with the support of turbulent transport. This can resolve the longstanding puzzle about the ubiquitous presence of PAHs/nanoparticles in the hot surface layer of PPDs.
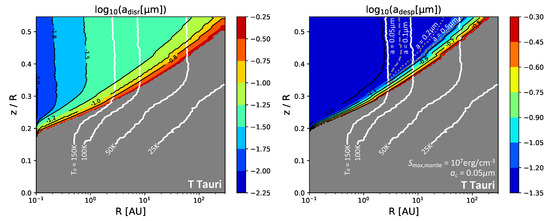
Figure 26.
Left panel: Disruption sizes of composite grains for a protoplanetary disk around T-Tauri stars as a function of R and . White lines show the locations of the disk that have . Right panel: Desorption sizes of ice mantles for a PPD around T-Tauri stars as a function of R and , assuming a fixed core radius m and the varying mantle thickness. Gray dashed and dotted lines illustrate the region where for different grain sizes a, assuming water ice of .
The water snowline characterized by the water sublimation temperature of divides the inner region of rocky planets from the outer region of gas giant planets. Nevertheless, the precise location of the snowline is a longstanding problem in planetary science (Lecar et al. [138], Min et al. [139]). Using the standard model of PPDs, we show that ice mantles from micron-sized grains (m) are disrupted and identify the snowline’s location in the presence of rotational desorption. We find that the water snowline is extended outward (Tung and Hoang [135]).
7.6. Circumsolar Dust and The F-Corona
In Hoang et al. [140], we applied the RATD for circumsolar dust (F-corona). As shown in Figure 27 (left panel), the intense solar radiation can efficiently disrupt large grains into nanoparticles. We also found that energetic protons from the solar wind can efficiently destroy smallest nanoparticles via nonthermal sputtering, which decreases the F-corona.
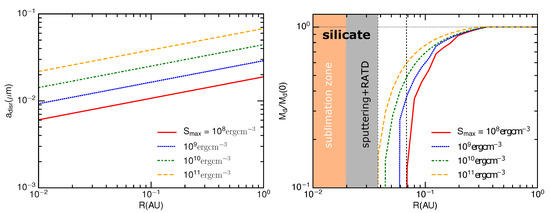
Figure 27.
Left panel: Grain disruption size by RATD as a function of heliodistance for the different tensile strength. Large grains are disrupted by RATD into very small grains. Right panel: Decrease of the dust mass () with heliocentric distance due to RATD and nonthermal sputtering by the solar wind for silicate grains where is the original dust mass. Four values of the tensile strength – are considered. The dust mass decreases toward the Sun, starting from AU(for highest strength) and reaches the new dust-free-zone predicted by RATD and sputtering effects (gray shaded area).
We can calculate the decrease of the volume mass of dust as a function of heliocentric distance as follows:
where be the critical size of nanoparticles that are destroyed by nonthermal sputtering, and is the original dust mass in the absence of sputtering
where a power-law grain size distribution of with Å is adopted.
Figure 27 (right panel) shows the variation of the relative dust mass vs. the heliocentric distance as a result of RATD and sputtering for the different tensile strength. We see that starts to decrease considerably from AU (), and a significant mass loss occurs at , which suggests a new dust-free-zone. Grains made of weak material are more efficiently disrupted by RATD and experience larger mass loss.
The increase in the abundance of small grains near the Sun predicted by RATD is consistent with previous studies (Mukai and Yamamoto [141], Mann [142]). Our results show that F-corona dust as well as dust in the inner solar system () mostly contains nanoparticles of size 1–10 nm (see Figure 27, left). This is a natural explanation for nanodust detected by in-situ measurements (see, e.g., Mann et al. [143], Ip et al. [144]). This RATD mechanism is more efficient than collisional fragmentation previously thought (see e.g., Mann et al. [143] for discussion of various mechanisms to form nanodust in the inner solar system).
In-situ measurements by dust detector onboard the Helio spacecraft reported a F-corona decrease at heliocentric distances between AU (Gruen et al. [145]). This is thought to be due to mutual collisions that makes grains smaller and decrease of the forward scattering cross-section. However, the RATD appears to be more efficient in producing small grains due to its short timescale.
Note that RATD is valid for grains of . For larger grains of m, RATs of such very large grains are not yet available due to the lack of numerical calculations because it requires expensive computations to achieve reliable results of RATs for grains of (see e.g., Draine and Flatau [54]). Expecting the decrease of RATs with increasing a, the disruption may still be important when the decrease of RATs is compensated by the increase of the radiation energy density.
Figure 28 illustrates the F-corona as a result of RATD and nonthermal sputtering, which would be observed with the PSP. The new dust-free-zone is located at . Beyond this radius, the F-corona decreases with the radius, starting from 42 to the dust-free-zone.
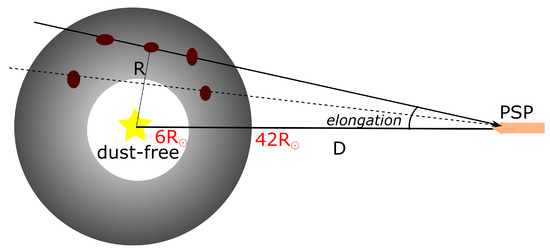
Figure 28.
Schematic illustration of the F-corona predicted by RATD and nonthermal sputtering which would be observed by the Parker Solar Probe (PSP) at heliocentric distance of AU and various elongation angles. The F-corona decrease is illustrated by a radial gradient, starting from to the edge of the new dust-free-zone at .
The first-year results from the PSP at heliocentric distances of AU () reveal the gradual decrease the F-corona Howard et al. [146]. With the elongation 15–20, one can estimate the corresponding elongation in solar radii (0.166–0.336) 9–19.
Indeed, the sublimation radius reveals a range of the dust-free-zone between 4–5 for silicate grains of sizes 0.1–0.001 m. Therefore, even with the effect of RATD, thermal sublimation alone cannot explain the thinning-out of circumsolar dust observed from . However, our results shown in Figure 27 (right panel) indicate that the joint effect of RATD and nonthermal sputtering could successfully explain the gradual decrease of F-corona toward the Sun. Moreover, the PSP’s observation is consistent with our result with the largest value of because this model predicts the F-corona decrease from a closest distance of 19 .
The PSP is planned to undergo 24 orbits around the Sun. The latest orbits (22–24) will reach the closest distance of 10.74 Szalay et al. [147]. Previous studies predict that the dust-free-zone is between 4–5 , which cannot be confirmed with the PSP. We found that the joint action of RATD and sputtering increase the radius of dust-free-zone to 7–11 (see Figure 27). This would be tested with the next orbits of the PSP.
7.7. Rotational Desorption of Ice in Star-Forming Regions Around Ysos
Dust grains surrounding YSOs are expected to contain ice mantles. In these regions, water and COMs are detected around the hot cores/corinos, which are inner regions surrounding high-mass protostars (Blake et al. [148]) and low-mass protostars (Bottinelli et al. [149], Beltran and Rivilla [150]). Previous studies rely on thermal sublimation of ice when grains are heated to above 100 K. We now apply our theory in the previous section to study the desorption of ice mantles from grains in hot cores and hot corinos and demonstrate that rotational desorption is more efficient and can work at .
Let L be the bolometric luminosity of the central protostar. The radiation strength at distance r from the source is given by
where denotes the radiation strength at inner radius .
The gas density and temperature can be approximately described by power laws:
where and are gas density and temperature at radius , and with the dust opacity index (see e.g., Chandler and Richer [151]). The typical density profile in the inner hot region is . A more detailed model of hot cores is presented in Nomura and Millar [152].
From Equation (52), one obtains the disruption size of ice mantles as follows
which slowly decreases with radius r as for typical slopes.
For low-mass protostars, one can assume and and Visser et al. [153], one gets m at and m for . For hot cores, we adopt a typical luminosity of and typical parameters and (see e.g., Bisschop et al. [154]). Therefore, Equation (121) gives m and m at respectively. The results for as usually assumed (Viti and Williams [155]) are even more promising.
Figure 29 illustrates the importance of rotational desorption vs. classical thermal sublimation of ice mantles around a protostar of and m. Thermal evaporation is important only in the inner regions where , whereas rotational desorption can be efficient at larger radii with low temperatures of 40–100 K.
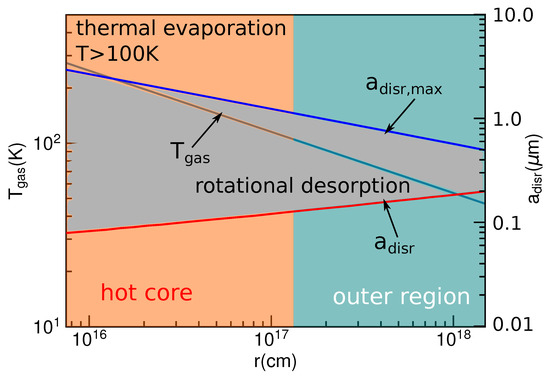
Figure 29.
Gas temperature and grain disruption size vs. radius for an envelope around a high-mass protostar. Classical thermal sublimation is important only for the inner region (hot core), whereas rotational desorption is important for both hot core and outer region.
We note that even in the hot inner region where thermal sublimation is active, rotational desorption and ro-thermal desorption (Hoang and Tung [45]) are more efficient than the classical sublimation for molecules with high binding energy such as water and COMs.
The efficiency of rotational desorption in cold extended regions shown in Figure 29 could explain the presence of COMs from outer extended regions around hot cores by Fayolle et al. [156]. Furthermore, this mechanism can explain the presence of HCOOH, CHCHO from cold regions with 40–70 K (below the sublimation threshold of these molecules) and low column density by Bisschop et al. [154]. Future high-resolution observations by ALMA would be unique to test our prediction of an extended regions of COMs.
7.8. Rotational Disruption of Nanoparticles in C- and CJ-Shocks
Interstellar shocks are ubiquitous in the ISM, which are induced by outflows around young stars and supernova remnants. If the shock speed is lower than the magnetosonic speed, physical parameters are continuous throughout the shock, for which the term C-type shocks are introduced (Draine [40]; also Ciolek et al. [157]). For the C-type shock in dense magnetized molecular clouds, in the shock reference frame, the ambient pre-shock gas flows into the shock such that their physical parameters change smoothly with the distance in the shock. At the shock interface, the neutral and ion velocities are the same as the shock velocity considered in the shock reference frame. Due to the deceleration when colliding with the shock matter, neutrals and ions are slowed down until they move together with the shock front, that is, . Due to magnetic forces, ions and charged grains are coupled to the ambient magnetic field and move slower than neutrals, resulting in or drift of neutral gas with respect to charged grains and ions.
In Hoang and Tram [41], Tram and Hoang [42], we studied rotational dynamics of grains in shocks and found that the supersonic relative motion could spin nanoparticles up to to suprathermal rotation. As a result, centrifugal stress can disrupt them into tiny fragments (see Section 5). This effect is most efficient for smallest nanoparticles and increases the lower cutoff of the grain size distribution.
Hoang and Tram [41] calculate the ion and neutral velocities for the different shock velocities using the one-dimensional plane-parallel Paris-Durham shock model Flower and Pineau des Forets [158]. Our initial elemental abundances in the gas, grain cores, ice mantle, and PAHs are the same as in the previous studies (Flower and Pineau des Forets [159], Lesaffre et al. [160], Tram et al. [161]). Figure 30 shows the velocity structure of neutral () and ions (), as well as the drift velocity of neutrals relative to ions (), assuming .
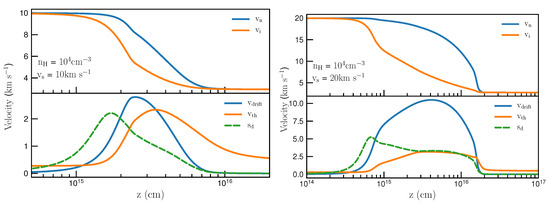
Figure 30.
Velocity profiles of neutral (, ion and charged grains (), and their relative velocity ( in the C-shocks for (left) and (right). The dashed line shows the drift parameter which is dimensionless. The drift velocity increases with the shock velocity, but is slightly changed due to an increased thermal velocity. From Hoang and Tram [41].
The drift velocity rises and reaches the maximum value in the middle of the shock and then declines to zero. The drift parameter, , increases rapidly with z, and then declines when the gas is heated to high temperatures. Note the peak of does not coincide with the peak of due to the effect of or . To calculate the smallest size that nanoparticles can withstand the rotational disruption, we compute using the rotational temperature at each shock location for a grid of grain sizes from 0.35–10 nm and compare it with .
Figure 31 shows the obtained minimum size as a function of distance in the shock for different values of and two shock models. Strong nanoparticles can survive the shock passage (red line), while weak nanoparticles can be destroyed. Grain disruption size increases toward the middle of the shock and then rapidly declines, which resembles the temperature and velocity profile of shocks (see e.g., Figure 30). The disruption size is below 0.5 nm for the typical , but it can be increased to nm for weaker materials (see blue, orange and green lines). Disruption is stronger for the shock model with higher gas density (right panel).
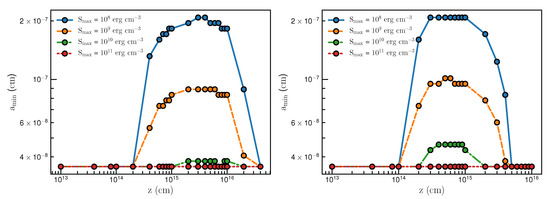
Figure 31.
Minimum size below which polycyclic aromatic hydrocarbons (PAHs) are destroyed by rotational disruption vs. distance in the shock, assuming the different material tensile strengths for . Two shock models with gas density (left panel) and (right panel). From Hoang and Tram [41].
Using Equation (114) we calculate the spinning dust emissivity at various locations inside the shock. The emissivity is calculated assuming that dust is composed of 90% PAHs and 10% nanosilicates. In the absence of rotation disruption, a is taken to be equal to 3.56 Å. When the rotational disruption effect is taken into account, a is determined by . We fix the abundance of PAHs and nanosilicates throughout the shock, although their abundance should vary in the shock due to grain shattering (Guillet et al. [162]). Figure 32 shows spinning dust emissivity from nanoparticles computed at different location z in the shock. The black dashed line shows thermal dust emission from large grains. When the rotational disruption effect is not taken into account, spinning dust emissivity is very strong and can peak at very high frequencies of GHz for some locations (see panel (a)). When accounting for rotational disruption (panel (b)), both rotational emissivity and peak frequency are reduced significantly due to the destruction of the smallest nanoparticles via rotational disruption. The effect of rotational disruption is clearly demonstrated through emission spectrum at locations and , where the peak frequency is reduced from GHz (panel (a)) to GHz (panel (b)). In both cases, spinning dust is still dominant over thermal dust at frequencies GHz (lower panel).
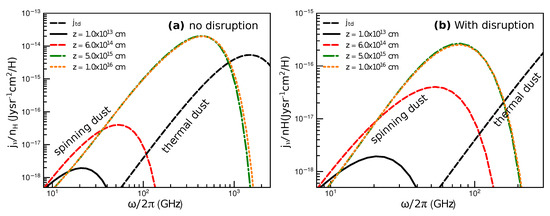
Figure 32.
Rotational emission spectrum from spinning nanoparticles for and computed at several positions in the shock without rotational disruption (panel (a)) and with rotational disruption for (panel (b)). Thermal dust emission from large grains is shown in dashed black line for comparison. From Hoang and Tram [41]. Emissivity is reduced significantly in the presence of disruption.
The grain size distribution of PAHs and nanoparticles in the shocked dense regions is poorly known due to the lack of observational constraints. In dense cold clouds, due to the lack of UV photons, both sublimation and thermal sputtering are not effective, such that one can expect a much smaller lower cutoff of the grain size distribution compared to the diffuse ISM. In studies of grain shattering, the smallest size of nanoparticles is usually fixed to nm without physical justification (Jones et al. [52], Guillet et al. [162]). Micelotta et al. [163] studied the destruction of PAHs in shocks by sputtering and found that PAHs can be efficiently destroyed by shocks of velocities . For lower shock velocities, PAHs and smallest nanoparticles (i.e., nanoparticles smaller than several nanometers) are expected to survive the shock passage. As a result, constraining the lower size cutoff and abundance of nanoparticles is of great importance. We suggested that spinning dust from nanoparticles could be used to constrain the abundance of nanoparticles in shocks.
8. Discussion
8.1. Radiative Torques of Irregular Grains
The interaction of dust grains and radiation results in four fundamental effects: grain heating, grain charging, radiation pressure, and radiative torque. Radiative torque is a new notion introduced about 40 years ago in dust astrophysics by Dolginov and Mitrofanov [24]. Numerical calculations for realistic grain shapes are only available 20 years by Draine and Weingartner [27], whereas an experimental test of the grain spin-up by RATs was conducted in Abbas et al. [28]. An analytical model of RATs was proposed by Lazarian and Hoang [29]. With extensive calculations of RATs for many shapes by Herranen et al. [32], it is now established that RATs are a fundamental property of dust grains exposed to a radiation field. As a result, it is crucially important to understand the effect of RATs on dust properties.
Previously, RATs are successfully used to explain the ubiquitous alignment of dust grains (Lazarian and Hoang [29], Draine and Weingartner [164]). The RAT alignment theory has become a popular theory of grain alignment (Andersson et al. [4], Lazarian et al. [5], Hoang and Lazarian [97]). The rotational disruption (RATD) effect induced by RATs was discovered by Hoang et al. [33] where the authors found that RATs could spin up grains to extremely fast rotation such that the centrifugal stress exceeds the material strength, disrupting dust grains into small fragments (see Section 3). The RATD mechanism is based on a fundamental property, radiative torques, arising in the interaction of radiation and dust grains of irregular shapes, which is natural in astrophysics.
8.2. Ubiquitous Application of Rotational Disruption by Radiative Torques
Subject to intense radiation sources in astrophysics (e.g., quasars and GRBs, dust grains are known to be destroyed by thermal sublimation and Coulomb explosions (see e.g., Waxman and Draine [47], Weingartner et al. [14]). While these traditional mechanisms require high radiation energy density and thus work only in a limited region, the RATD effect can be effective in an average radiation field (e.g., ISRF) and becomes more efficient with stronger radiation fields. This makes RATD work in a vast range of astrophysical environments, with the grain temperature . This corresponds to a radiation energy density U from 1 to , assuming , comprising the diffuse ISM, star-forming regions, and circumstellar regions, environments surrounding cosmic transients, starburst and high-z galaxies. The RATD mechanism is only ineffective in dense molecular clouds shielded of the ISRF. The dominance of rotational disruption over thermal sublimation can be understood by means of energy consideration. Indeed, in order to heat the dust grain to the sublimation temperature, , the radiation energy must be . On the other hand, in order to spin-up dust grains to the critical rotation rate , the radiation energy required is . Due to the fourth-order dependence, the sublimation energy is much higher than the energy required for grain disruption.
8.3. Relationship between Rotational Disruption and Grain Alignment
Throughout this review, we have assumed that RATs spin up grains to their maximum rotational angular velocity and ignore the effect of grain alignment. However, RATs not only spin up but also align grains with the magnetic field. The maximum angular velocity depends on the relative angle between the magnetic field and the radiation field (Hoang and Lazarian [60]).
We have also assumed that all aligned grains have their maximum angular velocity of (Equations (32) and (33), which corresponds to the situation that all grains are driven to high-J attractors (Hoang and Lazarian [30,97]). In general, the fraction of grains on high-J attractors, denoted by , depends on the grain properties (shape, size, and magnetic properties), and . Herranen [165] calculated RATs for aggregates and found 0.35–1 for aggregate grains. The presence of iron inclusions is found to increase to unity (Hoang and Lazarian [97]). Moreover, in the absence of high-J attractors (e.g., high-J repellors), grains may still be disrupted because gas collisions randomize their orientation in the phase space, and the grains would spend a significant amount of time in the vicinity of high-J repellors (Hoang and Lazarian [30]). As a result, grains can still be disrupted if their instantaneous angular velocity exceeds . A detailed study of grain disruption for this case should follow the rotational dynamics of grains induced by RATs for the GRB radiation field (e.g., Hoang and Lazarian [97]) and compares the instantaneous centrifugal stress with the tensile strength of the grain. More details about the relation of alignment and the RATD are given in Lazarian & Hoang (2020).
Second, in the case of intense radiation fields, grains can be aligned along the radiation direction (Lazarian and Hoang [29], Hoang and Lazarian [97], Tazaki et al. [166]). Carbonaceous grains with diamagnetic properties are expected to be aligned along the radiation direction. Thus, the RATD effect would work at their maximum level if high-J attractors are present.
Third, since the fraction of high-J depends on the grain magnetic susceptibility, which is determined by the abundance of iron embedded, the RATD effect would be useful to constrain the iron fraction in dust (Hoang and Lazarian [97], Lazarian and Hoang [98,167]).
8.4. Dust in the Time-Domain Astronomy Era
With substantial investment to construct new observational facilities at optical-NIR wavelengths, including GMT, SPHEREx, LSST, TMT, E-ELT, JWST and WFIRST, we are entering the golden age of the time-domain astronomy. Millions of transients (SNe Ia, CCSNe, GRBs) would be detected (e.g., Graham et al. [168], Foley et al. [169]). UV-Optical-NIR observations by these instruments, including colors and light curves of astrophysical transients are powerful to study progenitors, explosion mechanism, and their environments. In the light of RATD, dust properties within tens of pc are rapidly changing under the effect of the intense radiation from transients themselves. As a result, the observed color and light-curves of transients could change over time just due to dust variation. The RATD effect is particularly important for CCSNe and GRBs because they are expected to explode in dusty star-forming regions. An accurate understanding of cosmic transients as well as using them as a standardized candle for cosmological studies must take into account the effect of time-varying dust properties by the RATD effect. The decrease of optical-NIR extinction/polarization due to RATD would be tested with LSST and WFIRST.
8.5. Astrochemistry on Rotating Grain Surfaces
Grain surfaces play a crucial role in astrochemistry (Herbst and van Dishoeck [2], van Dishoeck [170]). The foundations of surface astrochemistry assume dust grains at rest and disregard the fact that grains are rapidly rotating due to radiative or mechanical torques.
Grain surfaces and ice mantles are believed to play a crucial role in the formation and desorption of molecules, including H, HO, and COMs (see e.g., Herbst and van Dishoeck [2]). Grain surface chemistry in general involves four main physical processes: (1) accretion of gas atoms/molecules to the grain surface, (2) mobility of adsorbed species on or in the ice mantle, (3) probability to form molecules upon collisions, and (4) desorption of newly formed molecules from the grain surface (see van Dishoeck [170]).
Suprathermal rotation by RATs is found to be important for surface chemistry in star-forming and photodissociation regions. It is found that suprathermal rotation can assist thermal desorption of molecules from the ice mantle, which enables molecule desorption at temperatures , lower than classical thermal sublimation threshold (Section 2, Hoang and Tram [44], Hoang and Tung [45]). The rate of surface chemical reactions depends on the mobility of adsorbed species on the grain surface (Watson and Salpeter [80], Hasegawa et al. [171]). The mobility of adsorbed molecules on the surface could also be enhanced, resulting in an increase of molecular formation rate (Hoang [172]). Therefore, the effect of grain suprathermal rotation is important and dramatically changes the current paradigm of surface astrochemistry where grain rotation is disregarded.
8.6. Dust Polarization and Molecular Tracer
In the rotational desorption paradigm, the release of COMs from ice mantles is accompanied by the decrease in the abundance of large grains because the intense radiation field that disrupts the ice mantles also disrupts large dust aggregates, and the disruption of ice mantles reduces the grain size. This effect has a unique signature on observations. First, we expect the abundance of COMs increases with decreasing the degree of dust polarization at long wavelengths which are most sensitive to the abundance of large grains. Second, the depletion of large aggregate grains may result in the change in the polarization pattern because very large grains are expected to experience efficient self-scattering (Kataoka et al. [173]), whereas smaller ones are aligned along the radiation direction or magnetic field direction (Lazarian and Hoang [29], Hoang and Lazarian [97], Lazarian and Hoang [98], Tazaki et al. [166]). In our on-going study (Tram et al. to be submitted), we found some evidence for rotational desorption using observational data of COMs and dust polarization.
9. Conclusions and Outlook
We have reviewed the rotational disruption of dust grains by radiative torques and mechanical torques due to dust-radiation and dust-gas interactions and presented various applications. Our main conclusions are summarized as follows:
- Radiative torques are a fundamental property of dust-radiation interaction. Dust grains could be spun up to suprathermal rotation by RATs such that resulting centrifugal stress exceeds the tensile strength of grain material, resulting in the disruption of grains into fragments. Because the RATD mechanism does not require an intense radiation field to be effective, it has ubiquitous application for most astrophysical environments, from the diffuse ISM to star-forming regions, protoplanetary disks, circumstellar regions, and high-z galaxies (see Section 7).
- The RATD mechanism could successfully explain some longstanding puzzles in astrophysics, including the anomalous dust properties observed toward SNe Ia and H II regions around massive stars, steep extinction curves toward GRBs, and microwave emission excess in AGB envelopes.
- The RATD mechanism changes the grain size distribution and abundance, which affects many astrophysical observations, including dust extinction, emission, and polarization. This RATD mechanism thus opens a new dimension into dust physics and offers new diagnostics of astrophysical phenomena. For instance, one of the longstanding puzzles of astrophysical dust is its internal structure, that is, compact vs. fluffy/composite vs. core-mantle. The RATD provides a theoretical basis for probing the internal structure of dust grains.
- In the time-domain astronomy era, intrinsic light-curves and colors of astrophysical transients are required to understand progenitors, explosion mechanisms, and transient’s environments. In light of the RATD effect, the rapid variation of grain size distribution on a timescale of minutes or days results in the decrease of optical-NIR dust extinction, but the increase of UV extinction. This reduces the value of and color observed toward transients. Thus, the effect of time-varying dust properties by RATD must be considered for accurate transient astrophysics.
- The centrifugal force arising from grain suprathermal rotation induced by RATs plays a crucial role in ice evolution. It can desorb ice mantles from the grain surface in star-forming and photodissociation regions. Moreover, water ice can be desorbed with the expense of smaller energy compared to thermal sublimation. As a result, the snow-line in the protoplanetary disk is pushed outward compared to the classical snow-line.
- Suprathermal rotation by RATs plays a critical role in surface astrochemistry in star-forming and photodissociation regions. It is found that suprathermal rotation can assist thermal desorption of molecules from the ice mantle, enabling molecule desorption at temperatures , lower than classical thermal sublimation thresholds. The mobility of adsorbed molecules on the surface could also be enhanced, increasing molecule formation rate. This could dramatically change the current paradigm of surface astrochemistry, where grain rotation is disregarded.
- Nanoparticles can be spun-up to suprathermal rotation by the relative supersonic motion of dust and gas. As a result, the smallest nanoparticles can be disrupted by centrifugal stress due to their small inertia moment. The METD mechanism is efficient in magnetized shocks and grains drifting through the gas by radiation pressure.
- In addition to optical-IR wavelengths, rotational disruption also affects microwave emission via the spinning dust mechanism. Nanoparticles play an important role in gas heating and dynamics, shock dynamics. Thus, observations in microwave are unique to trace nanoparticles and test the RATD and METD mechanisms.
Funding
This research is supported by the National Research Foundation of Korea (NRF) grants funded by the Korea government (MSIT) through the Basic Science Research Program (2017R1D1A1B03035359) and Mid-career Research Program (2019R1A2C1087045).
Acknowledgments
We are grateful to two anonymous referees for thorough reading and helpful comments that improved the content of this review. We thank Vietnam National Space Center (VNSC) and Phenikaa Institute of Advances Studies (PIAS), Phenikaa University, Vietnam, for their hospitality during which the review is written.
Conflicts of Interest
The authors declare no conflict of interest.
Abbreviations
The following abbreviations are used in this manuscript:
| NIR | Near-infrared |
| FIR | Far-infrared |
| AMO | Analytical MOdel |
| DDA | Discrete Dipole Approximation |
| DDSCAT | Discrete Dipole Scattering |
| ISM | Interstellar Medium |
| ISRF | Interstellar Radiation Field |
| RATs | RAdiative Torques |
| RATA | RAdiative Torque Alignment |
| RATD | RAdiative Torque Disruption |
| ROTD | Rotational Desorption |
| METD | MEchanical Torque Disruption |
| COM | Complex Organic Molecule |
| SNIa | Type Ia Supernova |
| CCSN | Core-Collapse Supernova |
| GRB | Gamma-Ray Burst |
| MC | Molecular Cloud |
| SMC | Small Magellanic Cloud |
| PDR | Photodissociation Region |
| YSO | Young Stellar Object |
| YMSC | Young Massive Stellar Cluster |
| PPD | Protoplanetary disk |
| AGN | Active Galactic Nuclei |
| AGB | Asymptotic Giant Branch |
| CSE | Circumstellar Envelope |
| PSP | Parker Solar Probe |
| VSG | Very Small Grain |
| PAH | Polycyclic Aromatic Hydrocarbon |
Appendix A

Table A1.
Glossary of Notations and Meaning
Table A1.
Glossary of Notations and Meaning
| Notation | Meaning |
|---|---|
| a | grain radius |
| grain mass density | |
| mass density of ice | |
| grain mass | |
| inertia momentum around the axis of maximum moment of inertia | |
| extinction efficiency | |
| absorption efficiency | |
| polarization efficiency | |
| proton number density | |
| proton column number density | |
| proton mass | |
| gas temperature | |
| dust grain temperature | |
| rotational damping time by gas collisions | |
| rotational damping time by infrared emission | |
| dimensionless coefficient of IR rotational damping | |
| radiation wavelength | |
| specific energy density of the radiation field | |
| mean wavelength of the radiation spectrum | |
| anisotropy degree of the radiation field | |
| Planck function | |
| dust extinction | |
| color excess | |
| ratio of total-to-selective extinction | |
| polarization of starlight by dust extinction | |
| maximum value of | |
| peak wavelength of at the maximum polarization | |
| polarization of thermal dust emission | |
| L | bolometric luminosity |
| radiation energy density | |
| radiation energy density of the ISRF | |
| radiation strength | |
| Radiative Torque (RAT) | |
| RAT efficiency | |
| grain angular velocity | |
| grain thermal angular velocity | |
| maximum grain angular momentum spun-up by RATs | |
| critical angular velocity for rotational disruption | |
| sublimation temperature | |
| sublimation radius | |
| maximum tensile strength of grain material | |
| grain disruption size by RATD | |
| maximum grain disruption size by RATD | |
| grain desorption size of ice mantles | |
| maximum grain desorption size of mantles | |
| drift velocity of grains through the gas | |
| dust grain velocity relative to gas | |
| gas thermal velocity | |
| dimensionless drift parameter | |
| relative grain velocity | |
| gas drag force | |
| sputtering yield | |
| mean atomic mass of sputtered atoms | |
| radius of the Sun | |
| R | heliocentric distance from the Sun |

Table A2.
Glossary of Notations and Meaning (Continued).
Table A2.
Glossary of Notations and Meaning (Continued).
| Notation | Meaning |
|---|---|
| binding energy of molecules to the grain surface | |
| characteristic vibration frequency of molecules on the icy grain mantle | |
| B | magnetic field strength |
| shock speed | |
| velocity of neutrals and ions in shocks | |
| electric dipole moment per structure | |
| electric dipole moment of a grain | |
| electric dipole damping time | |
| grain rotational temperature | |
| grain size distribution | |
| minimum grain size or lower cutoff of the grain size distribution | |
| maximum grain size or upper cutoff of the grain size distribution | |
| frequency of radiation | |
| emission power by a nanoparticle spinning at | |
| rotational emissivity from a spinning nanoparticle of size a | |
| rotational emissivity from all nanoparticles |
References
- Draine, B.T. Interstellar Dust Grains. Annu. Rev. Astron. Astrophys. 2003, 41, 241–289. [Google Scholar] [CrossRef]
- Herbst, E.; van Dishoeck, E.F. Complex Organic Interstellar Molecules. Annu. Rev. Astron. Astrophys. 2009, 47, 427–480. [Google Scholar] [CrossRef]
- Hama, T.; Watanabe, N. Surface Processes on Interstellar Amorphous Solid Water: Adsorption, Diffusion, Tunneling Reactions, and Nuclear-Spin Conversion. Chem. Rev. 2013, 113, 8783–8839. [Google Scholar] [CrossRef]
- Andersson, B.G.; Lazarian, A.; Vaillancourt, J.E. Interstellar Dust Grain Alignment. Annu. Rev. Astron. Astrophys. 2015, 53, 501–539. [Google Scholar] [CrossRef]
- Lazarian, A.; Andersson, B.G.; Hoang, T. Grain alignment: Role of radiative torques and paramagnetic relaxation. In Polarimetry of Stars and Planetary Systems; Kolokolova, L., Hough, J., Levasseur-Regourd, A.C., Eds.; Cambridge Univ. Press: New York, NY, USA, 2015; p. 81. [Google Scholar]
- Kamionkowski, M.; Kovetz, E.D. The Quest for B Modes from Inflationary Gravitational Waves. Annu. Rev. Astron. Astrophys. 2016, 54, 227–269. [Google Scholar] [CrossRef]
- Zhukovska, S.; Henning, T. Dust input from AGB stars in the Large Magellanic Cloud. Astron. Astrophys. 2013, 555, A99. [Google Scholar] [CrossRef]
- Sarangi, A.; Matsuura, M.; Micelotta, E.R. Dust In Supernovae And Supernova Remnants. Space Sci. Rev. 2018, 214, 63. [Google Scholar] [CrossRef]
- Zhukovska, S.; Dobbs, C.; Jenkins, E.B.; Klessen, R.S. Modeling Dust Evolution in Galaxies with a Multiphase, Inhomogeneous ISM. Astrophys. J. 2016, 831, 147. [Google Scholar] [CrossRef]
- Jones, A.P. Dust Destruction Processes. Astrophys. Dust 2004, 309, 347. [Google Scholar]
- Draine, B.T.; Salpeter, E.E. Destruction mechanisms for interstellar dust. Astrophys. J. 1979, 231, 438–455. [Google Scholar] [CrossRef]
- Tielens, A.G.G.M.; McKee, C.F.; Seab, C.G.; Hollenbach, D.J. The physics of grain-grain collisions and gas-grain sputtering in interstellar shocks. Astrophys. J. 1994, 431, 321–340. [Google Scholar] [CrossRef]
- Jones, A.P.; Tielens, A.G.G.M.; Hollenbach, D.J.; McKee, C.F. Grain destruction in shocks in the interstellar medium. Astrophys. J. 1994, 433, 797–810. [Google Scholar] [CrossRef]
- Weingartner, J.C.; Draine, B.T.; Barr, D.K. Photoelectric Emission from Dust Grains Exposed to Extreme Ultraviolet and X-Ray Radiation. Astrophys. J. 2006, 645, 1188–1197. [Google Scholar] [CrossRef]
- Hoang, T.; Lazarian, A.; Schlickeiser, R. On Origin and Destruction of Relativistic Dust and its Implication for Ultrahigh Energy Cosmic Rays. Astrophys. J. 2015, 806, 255. [Google Scholar] [CrossRef]
- Mathis, J.S.; Mezger, P.G.; Panagia, N. Interstellar radiation field and dust temperatures in the diffuse interstellar matter and in giant molecular clouds. Astron. Astrophys. 1983, 128, 212–229. [Google Scholar]
- Draine, B.T. Physics of the Interstellar and Intergalactic Medium; Princeton Univ. Press: Princeton, NJ, USA, 2011. [Google Scholar]
- Phillips, M.M.; Simon, J.D.; Morrell, N.; Burns, C.R.; Cox, N.L.J.; Foley, R.J.; Karakas, A.I.; Patat, F.; Sternberg, A.; Williams, R.E.; et al. On the Source of the Dust Extinction in Type Ia Supernovae and the Discovery of Anomalously Strong Na I Absorption. Astrophys. J. 2013, 779, 38. [Google Scholar] [CrossRef]
- Burns, C.R.; Stritzinger, M.; Phillips, M.M.; Hsiao, E.Y.; Contreras, C.; Persson, S.E.; Folatelli, G.; Boldt, L.; Campillay, A.; Castellón, S.; et al. The Carnegie Supernova Project: Intrinsic Colors of Type Ia Supernovae. Astrophys. J. 2014, 789, 32. [Google Scholar] [CrossRef]
- Amanullah, R.; Johansson, J.; Goobar, A.; Ferretti, R.; Papadogiannakis, S.; Petrushevska, T.; Brown, P.J.; Cao, C.; Contreras, C.; Dahle, H.; et al. Diversity in extinction laws of Type Ia supernovae measured between 0.2 and 2 μm. Mon. Not. R. Astron. Soc. 2015, 453, 3300–3328. [Google Scholar] [CrossRef]
- Cikota, A.; Deustua, S.; Marleau, F. Determining Type Ia Supernova Host Galaxy Extinction Probabilities and a Statistical Approach to Estimating the Absorption-to-reddening Ratio RV. Astrophys. J. 2016, 819, 152. [Google Scholar] [CrossRef]
- Nozawa, T. Properties of interstellar dust responsible for extinction laws with unusually low total-to-selective extinction ratios of RV = 1–2. Planet. Space Sci. 2016, 133, 36–46. [Google Scholar] [CrossRef]
- Hoang, T. Properties and Alignment of Interstellar Dust Grains toward Type Ia Supernovae with Anomalous Polarization Curves. Astrophys. J. 2017, 836, 13. [Google Scholar] [CrossRef]
- Dolginov, A.Z.; Mitrofanov, I.G. Orientation of cosmic dust grains. Astrophys. Space Sci. 1976, 43, 291–317. [Google Scholar] [CrossRef]
- Spitzer, L. On the Origin of Heavy Cosmic-Ray Particles. Phys. Rev. 1949, 76, 583. [Google Scholar] [CrossRef]
- Hoang, T. Relativistic Gas Drag on Dust Grains and Implications. Astrophys. J. 2017, 847, 77. [Google Scholar] [CrossRef]
- Draine, B.T.; Weingartner, J.C. Radiative Torques on Interstellar Grains. I. Superthermal Spin-up. Astrophys. J. 1996, 470, 551. [Google Scholar] [CrossRef]
- Abbas, M.M.; Craven, P.D.; Spann, J.F.; Tankosic, D.; LeClair, A.; Gallagher, D.L.; West, E.A.; Weingartner, J.C.; Witherow, W.K.; Tielens, A.G.G.M. Laboratory Experiments on Rotation and Alignment of the Analogs of Interstellar Dust Grains by Radiation. Astrophys. J. 2004, 614, 781–795. [Google Scholar] [CrossRef]
- Lazarian, A.; Hoang, T. Radiative torques: Analytical model and basic properties. Mon. Not. R. Astron. Soc. 2007, 378, 910–946. [Google Scholar] [CrossRef]
- Hoang, T.; Lazarian, A. Radiative torque alignment: Essential physical processes. Mon. Not. R. Astron. Soc. 2008, 388, 117–143. [Google Scholar] [CrossRef]
- Hoang, T.; Lazarian, A. Radiative Torques Alignment in the Presence of Pinwheel Torques. Astrophys. J. 2009, 695, 1457–1476. [Google Scholar] [CrossRef]
- Herranen, J.; Lazarian, A.; Hoang, T. Radiative Torques of Irregular Grains: Describing the Alignment of a Grain Ensemble. Astrophys. J. 2019, 878, 96. [Google Scholar] [CrossRef]
- Hoang, T.; Tram, L.N.; Lee, H.; Ahn, S.H. Rotational disruption of dust grains by radiative torques in strong radiation fields. Nat. Astron. 2019, 3, 766–775. [Google Scholar] [CrossRef]
- Hoang, T. A Dynamical Constraint on Interstellar Dust Models from Radiative Torque Disruption. Astrophys. J. 2019, 876, 13. [Google Scholar] [CrossRef]
- Purcell, E.M. Suprathermal rotation of interstellar grains. Astrophys. J. 1979, 231, 404–416. [Google Scholar] [CrossRef]
- Silsbee, K.; Draine, B.T. Radiation Pressure on Fluffy Submicron-sized Grains. Astrophys. J. 2016, 818, 133. [Google Scholar] [CrossRef]
- Gold, T. The alignment of galactic dust. Mon. Not. R. Astron. Soc. 1952, 112, 215. [Google Scholar] [CrossRef]
- Lazarian, A.; Hoang, T. Subsonic Mechanical Alignment of Irregular Grains. Astrophys. J. 2007, 669, L77–L80. [Google Scholar] [CrossRef]
- Hoang, T.; Cho, J.; Lazarian, A. Alignment of Irregular Grains by Mechanical Torques. Astrophys. J. 2018, 852, 129. [Google Scholar] [CrossRef]
- Draine, B.T. Interstellar shock waves with magnetic precursors. Astrophys. J. 1980, 241, 1021–1038. [Google Scholar] [CrossRef]
- Hoang, T.; Tram, L.N. Dust Rotational Dynamics in C-shocks: Rotational Disruption of Nanoparticles by Stochastic Mechanical Torques and Spinning Dust Emission. Astrophys. J. 2019, 877, 36. [Google Scholar] [CrossRef]
- Tram, L.N.; Hoang, T. Dust Rotational Dynamics in Nonstationary Shock: Rotational Disruption of Nanoparticles by Stochastic Mechanical Torques and Spinning Dust Emission. Astrophys. J. 2019, 886, 44. [Google Scholar] [CrossRef]
- Hoang, T.; Lee, H. Rotational Disruption of Dust Grains by Mechanical Torques for High-velocity Gas. Astrophys. J. 2020, 896, 144. [Google Scholar] [CrossRef]
- Hoang, T.; Tram, L.N. Rotational Desorption of Ice Mantles from Suprathermally Rotating Grains around Young Stellar Objects. Astrophys. J. 2020, 891, 38. [Google Scholar] [CrossRef]
- Hoang, T.; Tung, N.D. Chemistry on Rotating Grain Surfaces: Ro-thermal Desorption of Molecules from Ice Mantles. Astrophys. J. 2019, 885, 125. [Google Scholar] [CrossRef]
- Guhathakurta, P.; Draine, B.T. Temperature fluctuations in interstellar grains. I - Computational method and sublimation of small grains. Astrophys. J. 1989, 345, 230–244. [Google Scholar] [CrossRef]
- Waxman, E.; Draine, B.T. Dust Sublimation by Gamma-ray Bursts and Its Implications. Astrophys. J. 2000, 537, 796–802. [Google Scholar] [CrossRef]
- Scoville, N.; Norman, C. Stellar Contrails in Quasi-stellar Objects: The Origin of Broad Absorption Lines. Astrophys. J. 1995, 451, 510. [Google Scholar] [CrossRef]
- Tsong, T.T.; Müller, E.W. Field evaporation rates of tungsten. Phys. Status Solidi (a) 1970, 1, 513–533. [Google Scholar] [CrossRef]
- Bohdansky, J. A universal relation for the sputtering yield of monatomic solids at normal ion incidence. Nuclear Instrum. Methods Phys. Res. Sect. B Beam Interact. Mater. Atoms 1984, 2, 587–591. [Google Scholar] [CrossRef]
- Chokshi, A.; Tielens, A.G.G.M.; Hollenbach, D. Dust coagulation. Astrophys. J. 1993, 407, 806. [Google Scholar] [CrossRef]
- Jones, A.P.; Tielens, A.G.G.M.; Hollenbach, D.J. Grain Shattering in Shocks: The Interstellar Grain Size Distribution. Astrophys. J. 1996, 469, 740. [Google Scholar] [CrossRef]
- Bethell, T.J.; Chepurnov, A.; Lazarian, A.; Kim, J. Polarization of Dust Emission in Clumpy Molecular Clouds and Cores. Astrophys. J. 2007, 663, 1055–1068. [Google Scholar] [CrossRef][Green Version]
- Draine, B.T.; Flatau, P.J. User Guide for the Discrete Dipole Approximation Code DDSCAT 6.1. arXiv 2004, arXiv:0309069. [Google Scholar]
- Hoang, T.; Lazarian, A. Grain alignment by radiative torques in special conditions and implications. Mon. Not. R. Astron. Soc. 2014, 438, 680–703. [Google Scholar] [CrossRef]
- Draine, B.T.; Lazarian, A. Electric Dipole Radiation from Spinning Dust Grains. Astrophys. J. 1998, 508, 157–179. [Google Scholar] [CrossRef]
- Hoang, T.; Draine, B.T.; Lazarian, A. Improving the Model of Emission from Spinning Dust: Effects of Grain Wobbling and Transient Spin-up. Astrophys. J. 2010, 715, 1462–1485. [Google Scholar] [CrossRef]
- Hoang, T.; Lazarian, A.; Draine, B.T. Spinning Dust Emission: Effects of Irregular Grain Shape, Transient Heating, and Comparison with Wilkinson Microwave Anisotropy Probe Results. Astrophys. J. 2011, 741, 87. [Google Scholar] [CrossRef]
- Lazarian, A.; Draine, B.T. Nuclear Spin Relaxation within Interstellar Grains. Astrophys. J. 1999, 520, L67–L70. [Google Scholar] [CrossRef]
- Hoang, T.; Lazarian, A. Grain Alignment Induced by Radiative Torques: Effects of Internal Relaxation of Energy and Complex Radiation Field. Astrophys. J. 2009, 697, 1316–1333. [Google Scholar] [CrossRef]
- Burke, J.R.; Silk, J. Dust Grains in a Hot Gas. Basic Physics. Astrophys. J. 1974, 190, 1–10. [Google Scholar] [CrossRef]
- Mathis, J.S.; Whiffen, G. Composite interstellar grains. Astrophys. J. 1989, 341, 808–822. [Google Scholar] [CrossRef]
- Greenberg, J.M.; Mizutani, H.; Yamamoto, T. A new derivation of the tensile strength of cometary nuclei: Application to comet Shoemaker-Levy 9. Astron. Astrophys. 1995, 295, L35–L38. [Google Scholar]
- Li, A.; Greenberg, J.M. A unified model of interstellar dust. Astron. Astrophys. 1997, 323, 566–584. [Google Scholar]
- Guillet, V.; Fanciullo, L.; Verstraete, L.; Boulanger, F.; Jones, A.P.; Miville-Deschênes, M.A.; Ysard, N.; Levrier, F.; Alves, M. Dust models compatible with Planck intensity and polarization data in translucent lines of sight. Astron. Astrophys. 2018, 610, A16. [Google Scholar] [CrossRef]
- Tatsuuma, M.; Kataoka, A.; Tanaka, H. Tensile Strength of Porous Dust Aggregates. Astrophys. J. 2019, 874, 159. [Google Scholar] [CrossRef]
- Hoang, T.; Loeb, A.; Lazarian, A.; Cho, J. Spinup and Disruption of Interstellar Asteroids by Mechanical Torques, and Implications for 1I. Astrophys. J. 2018, 860, 42. [Google Scholar] [CrossRef]
- Mathis, J.S.; Rumpl, W.; Nordsieck, K.H. The size distribution of interstellar grains. Astrophys. J. 1977, 217, 425. [Google Scholar] [CrossRef]
- Kim, S.H.; Martin, P.G. The size distribution of interstellar dust particles as determined from polarization: Spheroids. Astrophys. J. 1995, 444, 293–305. [Google Scholar] [CrossRef]
- Draine, B.T.; Fraisse, A.A. Polarized Far-Infrared and Submillimeter Emission from Interstellar Dust. Astrophys. J. 2009, 696, 1–11. [Google Scholar] [CrossRef]
- Ossenkopf, V. Dust coagulation in dense molecular clouds: The formation of fluffy aggregates. Astron. Astrophys. 1993, 280, 617. [Google Scholar]
- Whittet, D.C.B.; Bode, M.F.; Longmore, A.J.; Baines, D.W.T.; Evans, A. Interstellar ice grains in the Taurus molecular clouds. Nature 1983, 303, 218–221. [Google Scholar] [CrossRef]
- Chrysostomou, A.; Hough, J.H.; Whittet, D.C.B.; Aitken, D.K.; Roche, P.F.; Lazarian, A. Interstellar Polarization from CO and XCN Mantled Grains: A Severe Test for Grain Alignment Mechanisms. Astrophys. J. Lett. 1996, 465, L61. [Google Scholar] [CrossRef]
- Whittet, D.C.B.; Hough, J.H.; Lazarian, A.; Hoang, T. The Efficiency of Grain Alignment in Dense Interstellar Clouds: A Reassessment of Constraints from Near-Infrared Polarization. Astrophys. J. 2008, 674, 304–315. [Google Scholar] [CrossRef]
- Greenberg, J. The Core-Mantle Model of Interstellar Grains and the Cosmic Dust Connection. In Interstellar Dust: Proceedings of the 135th Symposium of the International Astronomical Union; Cambridge University Press: Cambridge, UK, 1989; pp. 345–356. [Google Scholar]
- Litwin, K.L.; Zygielbaum, B.R.; Polito, P.J.; Sklar, L.S.; Collins, G.C. Influence of temperature, composition, and grain size on the tensile failure of water ice: Implications for erosion on Titan. J. Geophys. Res. Planets 2012, 117. [Google Scholar] [CrossRef]
- Itagaki, K. Mechanical Ice Release Processes. Part 1: Self-Shedding of Accreted Ice from High Speed Rotors; CRREL-83-26; US Army Cold Regions Research and Engineering Laboratory: Hanover, NH, USA, 1983. [Google Scholar]
- Work, A.; Lian, Y. A critical review of the measurement of ice adhesion to solid substrates. Prog. Aerosp. Sci. 2018, 98, 1–26. [Google Scholar]
- Roberge, W.G.; Lazarian, A. Davis-Greenstein alignment of oblate spheroidal grains. Mon. Not. R. Astron. Soc. 1999, 305, 615–630. [Google Scholar] [CrossRef]
- Watson, W.D.; Salpeter, E.E. Molecule Formation on Interstellar Grains. Astrophys. J. 1972, 174, 321. [Google Scholar] [CrossRef]
- Leger, A.; Jura, M.; Omont, A. Desorption from interstellar grains. Astron. Astrophys. 1985, 144, 147–160. [Google Scholar]
- Tielens, A.G.G.M.; Allamandola, L.J. Evolution of interstellar dust. In Physical Processes in Interstellar Clouds, Proceedings of the NATO Advanced Study Institute; D. Reidel: Dorecht, The Netherlands, 1987; pp. 333–376. [Google Scholar]
- Garrod, R.T. A Three-phase Chemical Model of Hot Cores: The Formation of Glycine. Astrophys. J. 2013, 765, 60. [Google Scholar] [CrossRef]
- Mumma, M.J.; Weissman, P.R.; Stern, S.A. Comets and the origin of the solar system - Reading the Rosetta Stone. In Protostars and Planets III (A93-42937 17-90); Arizona Press: Tucson, AZ, USA, 1993; pp. 1177–1252. [Google Scholar]
- Collings, M.P.; Anderson, M.A.; Chen, R.; Dever, J.W.; Viti, S.; Williams, D.A.; McCoustra, M.R.S. A laboratory survey of the thermal desorption of astrophysically relevant molecules. Mon. Not. R. Astron. Soc. 2004, 354, 1133–1140. [Google Scholar] [CrossRef]
- Hoang, T.; Vinh, N.A.; Quynh Lan, N. Spinning Dust Emission from Ultra-small Silicates: Emissivity and Polarization Spectrum. Astrophys. J. 2016, 824, 18. [Google Scholar] [CrossRef]
- Draine, B.T.; Salpeter, E.E. On the physics of dust grains in hot gas. Astrophys. J. 1979, 231, 77–94. [Google Scholar] [CrossRef]
- Sigmund, P. Sputtering by Particle Bombardment I; Springer: New York, NY, USA, 1981; p. 9. [Google Scholar]
- Weingartner, J.C.; Draine, B.T. Dust Grain-Size Distributions and Extinction in the Milky Way, Large Magellanic Cloud, and Small Magellanic Cloud. Astrophys. J. 2001, 548, 296–309. [Google Scholar] [CrossRef]
- Draine, B.T.; Li, A. Infrared Emission from Interstellar Dust. IV. The Silicate-Graphite-PAH Model in the Post-Spitzer Era. Astrophys. J. 2007, 657, 810–837. [Google Scholar] [CrossRef]
- Giang, N.C.; Hoang, T.; Tram, L.N. Time-varying Extinction, Polarization, and Colors of Type Ia Supernovae due to Rotational Disruption of Dust Grains. Astrophys. J. 2020, 888, 93. [Google Scholar] [CrossRef]
- Draine, B.T.; Dale, D.A.; Bendo, G.; Gordon, K.D.; Smith, J.D.T.; Armus, L.; Engelbracht, C.W.; Helou, G.; Kennicutt, R.C.J.; Li, A.; et al. Dust Masses, PAH Abundances, and Starlight Intensities in the SINGS Galaxy Sample. Astrophys. J. 2007, 663, 866–894. [Google Scholar] [CrossRef]
- Hoang, T.; Lazarian, A.; Martin, P.G. Constraint on the Polarization of Electric Dipole Emission from Spinning Dust. Astrophys. J. 2013, 779, 152. [Google Scholar] [CrossRef]
- Hall, J.S. Observations of the Polarized Light from Stars. Science 1949, 109, 166. [Google Scholar] [CrossRef]
- Hiltner, W.A. Polarization of Light from Distant Stars by Interstellar Medium. Science 1949, 109, 165. [Google Scholar] [CrossRef]
- Chiar, J.E.; Adamson, A.J.; Whittet, D.C.B.; Chrysostomou, A.; Hough, J.H.; Kerr, T.H.; Mason, R.E.; Roche, P.F.; Wright, G. Spectropolarimetry of the 3.4 μm Feature in the Diffuse ISM toward the Galactic Center Quintuplet Cluster. Astrophys. J. 2006, 651, 268–271. [Google Scholar] [CrossRef]
- Hoang, T.; Lazarian, A. A Unified Model of Grain Alignment: Radiative Alignment of Interstellar Grains with Magnetic Inclusions. Astrophys. J. 2016, 831, 159. [Google Scholar] [CrossRef]
- Lazarian, A.; Hoang, T. Magnetic Properties of Dust Grains, Effect of Precession, and Radiative Torque Alignment. Astrophys. J. 2019, 883, 122. [Google Scholar] [CrossRef]
- Lee, H.; Hoang, T.; Le, N.; Cho, J. Physical Model of Dust Polarization by Radiative Torque Alignment and Disruption and Implications for Grain Internal Structures. Astrophys. J. 2020, 896, 44. [Google Scholar] [CrossRef]
- Li, A.; Draine, B.T. On Ultrasmall Silicate Grains in the Diffuse Interstellar Medium. Astrophys. J. 2001, 550, L213. [Google Scholar] [CrossRef]
- Tram, L.N.; Hoang, T.; Soam, A.; Lesaffre, P.; Reach, W.T. Modeling Rotational Disruption of Grains and Microwave Emission from Spinning Dust in AGB Envelopes. Astrophys. J. 2020, 893, 138. [Google Scholar] [CrossRef]
- Hensley, B.S.; Draine, B.T. Modeling the Anomalous Microwave Emission with Spinning Nanoparticles: No PAHs Required. Astrophys. J. 2017, 836, 179. [Google Scholar] [CrossRef]
- Hirashita, H.; Hoang, T. Effects of rotational disruption on the evolution of grain size distribution in galaxies. Mon. Not. R. Astron. Soc. 2020, 494, 1058–1070. [Google Scholar] [CrossRef]
- Zavala, J.A.; Aretxaga, I.; Dunlop, J.S.; Michałowski, M.J.; Hughes, D.H.; Bourne, N.; Chapin, E.; Cowley, W.; Farrah, D.; Lacey, C.; et al. The SCUBA-2 Cosmology Legacy Survey: The EGS deep field—II. Morphological transformation and multiwavelength properties of faint submillimetre galaxies. Mon. Not. R. Astron. Soc. 2018, 475, 5585–5602. [Google Scholar] [CrossRef]
- Lim, C.F.; Wang, W.H.; Smail, I.; Scott, D.; Chen, C.C.; Chang, Y.Y.; Simpson, J.M.; Toba, Y.; Shu, X.; Clements, D.; et al. SCUBA-2 Ultra Deep Imaging Eao Survey (Studies) III: Multi-wavelength properties, luminosity functions and preliminary source catalog of 450 micron-selected galaxies. arXiv 2019, arXiv:1912.03669. [Google Scholar] [CrossRef]
- Calzetti, D. The Dust Opacity of Star-forming Galaxies. Publ. Astronom. Soc. Pac. 2001, 113, 1449–1485. [Google Scholar] [CrossRef]
- Witt, A.N.; Gordon, K.D. Multiple Scattering in Clumpy Media. II. Galactic Environments. Astrophys. J. 2000, 528, 799–816. [Google Scholar] [CrossRef]
- Inoue, A.K. Attenuation law of normal disc galaxies with clumpy distributions of stars and dust. Mon. Not. R. Astron. Soc. 2005, 359, 171–182. [Google Scholar] [CrossRef]
- Seon, K.I.; Draine, B.T. Radiative Transfer Model of Dust Attenuation Curves in Clumpy, Galactic Environments. Astrophys. J. 2016, 833, 201. [Google Scholar] [CrossRef]
- Symeonidis, M.; Vaccari, M.; Berta, S.; Page, M.J.; Lutz, D.; Arumugam, V.; Aussel, H.; Bock, J.; Boselli, A.; Buat, V.; et al. The Herschel census of infrared SEDs through cosmic time. Mon. Not. R. Astron. Soc. 2013, 431, 2317–2340. [Google Scholar] [CrossRef]
- Bethermin, M.; Daddi, E.; Magdis, G.; Lagos, C.; Sargent, M.; Albrecht, M.; Aussel, H.; Bertoldi, F.; Buat, V.; Galametz, M.; et al. Evolution of the dust emission of massive galaxies up to z= 4 and constraints on their dominant mode of star formation. Astron. Astrophys. 2015, 573, A113. [Google Scholar] [CrossRef]
- Schreiber, C.; Elbaz, D.; Pannella, M.; Ciesla, L.; Wang, T.; Franco, M. Dust temperature and mid-to-total infrared color distributions for star-forming galaxies at 0. Astron. Astrophys. 2017, 609, A30. [Google Scholar] [CrossRef]
- Hirashita, H.; Burgarella, D.; Bouwens, R.J. Dust masses of z > 5 galaxies from SED fitting and ALMA upper limits. arXiv 2017, arXiv:1709.02526. [Google Scholar] [CrossRef]
- Bakx, T.J.L.C.; Tamura, Y.; Hashimoto, T.; Inoue, A.K.; Lee, M.M.; Mawatari, K.; Ota, K.; Umehata, H.; Zackrisson, E.; Hatsukade, B.; et al. ALMA uncovers the [CII] emission and warm dust continuum in a z = 8.31 Lyman break galaxy. arXiv 2020, arXiv:2001.02812. [Google Scholar]
- Ferrara, A.; Hirashita, H.; Ouchi, M.; Fujimoto, S. The infrared-dark dust content of high redshift galaxies. Mon. Not. R. Astron. Soc. 2017, 471, 5018–5024. [Google Scholar] [CrossRef]
- Toba, Y.; Wang, W.H.; Nagao, T.; Ueda, Y.; Ueda, J.; Lim, C.F.; Chang, Y.Y.; Saito, T.; Kawabe, R. SOFIA/HAWC+ View of an Extremely Luminous Infrared Galaxy, WISE1013+6112. arXiv 2019, arXiv:1912.05813. [Google Scholar]
- Riess, A.G.; Filippenko, A.V.; Challis, P.; Clocchiatti, A.; Diercks, A.; Garnavich, P.M.; Gilliland, R.L.; Hogan, C.J.; Jha, S.; Kirshner, R.P.; et al. Observational Evidence from Supernovae for an Accelerating Universe and a Cosmological Constant. Astronom. J. 1998, 116, 1009–1038. [Google Scholar] [CrossRef]
- Nobili, S.; Goobar, A. The colour-lightcurve shape relation of type Ia supernovae and the reddening law. Astron. Astrophys. 2008, 487, 19–31. [Google Scholar] [CrossRef]
- Kawabata, K.S.; Akitaya, H.; Yamanaka, M.; Itoh, R.; Maeda, K.; Moritani, Y.; Ui, T.; Kawabata, M.; Mori, K.; Nogami, D.; et al. Optical and near-infrared polarimetry of highly reddened type ia supernova 2014j: Peculiar properties of dust in M82. Astrophys. J. 2014, 795, L4. [Google Scholar] [CrossRef]
- Patat, F.; Taubenberger, S.; Cox, N.L.J.; Baade, D.; Clocchiatti, A.; Höflich, P.; Maund, J.R.; Reilly, E.; Spyromilio, J.; Wang, L.; et al. Properties of extragalactic dust inferred from linear polarimetry of Type Ia Supernovae. Astron. Astrophys. 2015, 577, A53. [Google Scholar] [CrossRef]
- Serkowski, K.; Mathewson, D.S.; Ford, V.L. Wavelength dependence of interstellar polarization and ratio of total to selective extinction. Astrophys. J. 1975, 196, 261. [Google Scholar] [CrossRef]
- Wilking, B.A.; Lebofsky, M.J.; Kemp, J.C.; Martin, P.G.; Rieke, G.H. The wavelength dependence of interstellar linear polarization. Astrophys. J. 1980, 235, 905–910. [Google Scholar] [CrossRef]
- Whittet, D.C.B.; Martin, P.G.; Hough, J.H.; Rouse, M.F.; Bailey, J.A.; Axon, D.J. Systematic variations in the wavelength dependence of interstellar linear polarization. Astrophys. J. 1992, 386, 562. [Google Scholar] [CrossRef]
- Hoang, T.; Giang, N.C.; Tram, L.N. Gamma-Ray Burst Afterglows: Time-varying Extinction, Polarization, and Colors due to Rotational Disruption of Dust Grains. Astrophys. J. 2020, 895, 16. [Google Scholar] [CrossRef]
- Hoang, T.; Tung, N.D. Evolution of Dust and Water Ice in Cometary Comae by Radiative Torques. arXiv 2020, arXiv:2005.10446. [Google Scholar]
- Sahai, R.; Claussen, M.J.; Masson, C.R. The centimeter radio continuum from IRC+10216 and other late-type stars with mass-loss envelopes. Astron. Astrophys. 1989, 220, 92–98. [Google Scholar]
- Knapp, G.R.; Bowers, P.F.; Young, K.; Phillips, T.G. Radio-Frequency Continuum Emission from Evolved Stars. Astrophys. J. 1995, 455, 293. [Google Scholar] [CrossRef]
- Dehaes, S.; Groenewegen, M.A.T.; Decin, L.; Hony, S.; Raskin, G.; Blommaert, J.A.D.L. Continuum emission around AGB stars at 1.2 mm. Mon. Not. R. Astron. Soc. 2007, 377, 931–944. [Google Scholar] [CrossRef]
- Ivezic, Z.; Nenkova, M.; Elitzur, M. DUSTY: Radiation Transport in a Dusty Environment; 1999; ascl soft, ascl:9911.001; [9911.001]. [Google Scholar]
- Boutéraon, T.; Habart, E.; Ysard, N.; Jones, A.P.; Dartois, E.; Pino, T. Carbonaceous nano-dust emission in proto-planetary discs: The aliphatic-aromatic components. Astron. Astrophys. 2019, 623, A135. [Google Scholar] [CrossRef]
- Siebenmorgen, R.; Krügel, E. The destruction and survival of polycyclic aromatic hydrocarbons in the disks of T Tauri stars. Astron. Astrophys. 2010, 511, 6. [Google Scholar] [CrossRef]
- Bernstein, M.P.; Sandford, S.A.; Allamandola, L.J.; Gillette, J.S.B.; Clemett, S.J.; Zare, R.N. UV Irradiation of Polycyclic Aromatic Hydrocarbons in Ices: Production of Alcohols, Quinones, and Ethers. Science 1999, 283, 1135–1138. [Google Scholar] [CrossRef] [PubMed]
- Cuylle, S.H.; Allamandola, L.J.; Linnartz, H. Photochemistry of PAHs in cosmic water ice. The effect of concentration on UV-VIS spectroscopy and ionization efficiency. Astron. Astrophys. 2014, 562, A22. [Google Scholar] [CrossRef]
- Cook, A.M.; Ricca, A.; Mattioda, A.L.; Bouwman, J.; Roser, J.; Linnartz, H.; Bregman, J.; Allamandola, L.J. Photochemistry of Polycyclic Aromatic Hydrocarbons in Cosmic Water Ice: The Role of PAH Ionization and Concentration. Astrophys. J. 2015, 799, 14. [Google Scholar] [CrossRef]
- Tung, N.D.; Hoang, T. Rotational Disruption of Dust and Ice by Radiative Torques in Protoplanetary Disks and Implications for Observations. arXiv 2020, arXiv:2002.03390. [Google Scholar]
- Dullemond, C.P.; Dominik, C. The effect of dust settling on the appearance of protoplanetary disks. Astron. Astrophys. 2004, 421, 1075–1086. [Google Scholar] [CrossRef]
- Fromang, S.; Nelson, R.P. Global MHD simulations of stratified and turbulent protoplanetary discs. II. Dust settling. Astron. Astrophys. 2009, 496, 597–608. [Google Scholar] [CrossRef]
- Lecar, M.; Podolak, M.; Sasselov, D.; Chiang, E. On the Location of the Snow Line in a Protoplanetary Disk. Astrophys. J. 2006, 640, 1115–1118. [Google Scholar] [CrossRef]
- Min, M.; Dullemond, C.P.; Kama, M.; Dominik, C. The thermal structure and the location of the snow line in the protosolar nebula: Axisymmetric models with full 3-D radiative transfer. Icarus 2011, 212, 416–426. [Google Scholar] [CrossRef]
- Hoang, T.; Lazarian, A.; Lee, H.; Cho, K.; Gu, P.G.; Ng, C.H. On the Origin of an F-corona decrease revealed by the Parker Solar Probe. arXiv 2020, arXiv:2004.06265. [Google Scholar]
- Mukai, T.; Yamamoto, T. A Model of the Circumsolar Dust Cloud. Publ. Astron. Soc. Jpn. 1979, 31, 585–596. [Google Scholar]
- Mann, I. The solar F-corona - Calculations of the optical and infrared brightness of circumsolar dust. Astron. Astrophys. 1992, 261, 329–335. [Google Scholar]
- Mann, I.; Murad, E.; Czechowski, A. Nanoparticles in the inner solar system. Planet. Space Sci. 2007, 55, 1000–1009. [Google Scholar] [CrossRef]
- Ip, W.H.; Lai, I.L.; Shen, F. Nanodust in the Heliosphere. J. Phys. Conf. Ser. 2019, 1332, 012007. [Google Scholar] [CrossRef]
- Gruen, H.; Fechtig, H.; Kissel, J. Orbits of interplanetary dust particles inside 1 AU as observed by HELIOS. In Properties and Interactions of Interplanetary Dust; Proceedings of the Eighty-Fifth Colloquium; Max-Planck-Institut für Kernphysik: Heidelberg, Germany, 1985; pp. 105–111. [Google Scholar]
- Howard, R.A.; Vourlidas, A.; Bothmer, V.; Colaninno, R.C.; DeForest, C.E.; Gallagher, B.; Hall, J.R.; Hess, P.; Higginson, A.K.; Korendyke, C.M.; et al. Near-Sun observations of an F-corona decrease and K-corona fine structure. Nature 2019, 576, 232–236. [Google Scholar] [CrossRef]
- Szalay, J.R.; Pokorný, P.; Bale, S.D.; Christian, E.R.; Goetz, K.; Goodrich, K.; Hill, M.E.; Kuchner, M.; Larsen, R.; Malaspina, D.; et al. The Near-Sun Dust Environment: Initial Observations from Parker Solar Probe. arXiv 2019, arXiv:1912.02639. [Google Scholar] [CrossRef]
- Blake, G.A.; Sutton, E.C.; Masson, C.R.; Phillips, T.G. Molecular abundances in OMC-1 - The chemical composition of interstellar molecular clouds and the influence of massive star formation. Astrophys. J. 1987, 315, 621–645. [Google Scholar] [CrossRef]
- Bottinelli, S.; Ceccarelli, C.; Lefloch, B.; Williams, J.P.; Castets, A.; Caux, E.; Cazaux, S.; Maret, S.; Parise, B.; Tielens, A.G.G.M. Complex Molecules in the Hot Core of the Low-Mass Protostar NGC 1333 IRAS 4A. Astrophys. J. 2004, 615, 354–358. [Google Scholar] [CrossRef]
- Beltran, M.T.; Rivilla, V.M. Complex Organic Molecules in Hot Molecular Cores/Corinos: Physics and Chemistry. arXiv 2018, arXiv:1806.08137. [Google Scholar]
- Chandler, C.J.; Richer, J.S. The Structure of Protostellar Envelopes Derived from Submillimeter Continuum Images. Astrophys. J. 2000, 530, 851–866. [Google Scholar] [CrossRef][Green Version]
- Nomura, H.; Millar, T.J. The physical and chemical structure of hot molecular cores. Astron. Astrophys. 2004, 414, 409–423. [Google Scholar] [CrossRef]
- Visser, R.; Kristensen, L.E.; Bruderer, S.; van Dishoeck, E.F.; Herczeg, G.J.; Brinch, C.; Doty, S.D.; Harsono, D.; Wolfire, M.G. Modelling Herschelobservations of hot molecular gas emission from embedded low-mass protostars. Astron. Astrophys. 2012, 537, A55. [Google Scholar] [CrossRef]
- Bisschop, S.E.; Jørgensen, J.K.; van Dishoeck, E.F.; de Wachter, E.B.M. Testing grain-surface chemistry in massive hot-core regions. Astron. Astrophys. 2007, 465, 913–929. [Google Scholar] [CrossRef]
- Viti, S.; Williams, D.A. Time-dependent evaporation of icy mantles in hot cores. Mon. Not. R. Astron. Soc. 1999, 305, 755–762. [Google Scholar] [CrossRef]
- Fayolle, E.C.; Oberg, K.I.; Garrod, R.T.; van Dishoeck, E.F.; Bisschop, S.E. Complex organic molecules in organic-poor massive young stellar objects. Astron. Astrophys. 2015, 576, A45. [Google Scholar] [CrossRef]
- Ciolek, G.E.; Roberge, W.G.; Mouschovias, T.C. Multifluid, Magnetohydrodynamic Shock Waves with Grain Dynamics. II. Dust and the Critical Speed for C Shocks. Astrophys. J. 2004, 610, 781–800. [Google Scholar] [CrossRef][Green Version]
- Flower, D.R.; Pineau des Forêts, G. Interpreting observations of molecular outflow sources: The MHD shock code mhd-vode. Astron. Astrophys. 2015, 578, A63. [Google Scholar] [CrossRef]
- Flower, D.R.; Pineau des Forêts, G. The influence of grains on the propagation and structure of C-type shock waves in interstellar molecular clouds. Mon. Not. R. Astron. Soc. 2003, 343, 390–400. [Google Scholar] [CrossRef][Green Version]
- Lesaffre, P.; Pineau des Forêts, G.; Godard, B.; Guillard, P.; Boulanger, F.; Falgarone, E. Low-velocity shocks: Signatures of turbulent dissipation in diffuse irradiated gas. Astron. Astrophys. 2013, 550, A106. [Google Scholar] [CrossRef]
- Tram, L.N.; Lesaffre, P.; Cabrit, S.; Gusdorf, A.; Nhung, P.T. H2 emission from non-stationary magnetized bow shocks. Mon. Not. R. Astron. Soc. 2018, 473, 1472–1488. [Google Scholar] [CrossRef]
- Guillet, V.; Pineau des Forêts, G.; Jones, A.P. Shocks in dense clouds. III. Dust processing and feedback effects in C-type shocks. Astron. Astrophys. 2011, 527, A123. [Google Scholar] [CrossRef]
- Micelotta, E.R.; Jones, A.P.; Tielens, A.G.G.M. Polycyclic aromatic hydrocarbon processing in interstellar shocks. Astron. Astrophys. 2010, 510, 36. [Google Scholar] [CrossRef]
- Draine, B.T.; Weingartner, J.C. Radiative Torques on Interstellar Grains. II. Grain Alignment. Astrophys. J. 1997, 480, 633. [Google Scholar] [CrossRef]
- Herranen, J. Rotational Disruption of Nonspherical Cometary Dust Particles by Radiative Torques. Astrophys. J. 2020, 893, 109. [Google Scholar] [CrossRef]
- Tazaki, R.; Lazarian, A.; Nomura, H. Radiative Grain Alignment In Protoplanetary Disks: Implications for Polarimetric Observations. Astrophys. J. 2017, 839, 56. [Google Scholar] [CrossRef]
- Lazarian, A.; Hoang, T. Alignment of Dust with Magnetic Inclusions: Radiative Torques and Superparamagnetic Barnett and Nuclear Relaxation. Astrophys. J. 2008, 676, L25–L28. [Google Scholar] [CrossRef]
- Graham, M.; Milisavljevic, D.; Rest, A.; Wheeler, J.C.; Chornock, R.; Margutti, R.; Rho, J.; Lee, C.H.; Yoon, S.C.; Kilpatrick, C.D.; et al. Discovery Frontiers of Explosive Transients: An ELT and LSST Perspective. Bull. Am. Astrono. Soc. 2019, 51, 339. [Google Scholar]
- Foley, R.; Bloom, J.S.; Cenko, S.B.; Chornock, R.; Dimitriadis, G.; Doré, O.; Filippenko, A.V.; Fox, O.D.; Hirata, C.M.; Jha, S.W.; et al. WFIRST: Enhancing Transient Science and Multi-Messenger Astronomy. Bull. Am. Astrono. Soc. 2019, 51, 305. [Google Scholar]
- van Dishoeck, E.F. Astrochemistry: Overview and challenges. arXiv 2017, arXiv:1710.05940. [Google Scholar] [CrossRef]
- Hasegawa, T.I.; Herbst, E.; Leung, C.M. Models of gas-grain chemistry in dense interstellar clouds with complex organic molecules. Astrophys. J. Suppl. Ser. 1992, 82, 167–195. [Google Scholar] [CrossRef]
- Hoang, T. Chemistry on rotating grain surfaces: Ro-thermal hopping and segregation of molecules in ice mantles. arXiv 2019, arXiv:1910.12205. [Google Scholar]
- Kataoka, A.; Muto, T.; Momose, M.; Tsukagoshi, T.; Fukagawa, M.; Shibai, H.; Hanawa, T.; Murakawa, K.; Dullemond, C.P. Millimeter-wave Polarization of Protoplanetary Disks due to Dust Scattering. Astrophys. J. 2015, 809, 78. [Google Scholar] [CrossRef]
| 1 | Equations (30) and (31) in Hoang and Lee [43] missed a factor and , respectively, but the final formulae are correct. |
| 2 | Although carbonaceous grains are expected to be aligned via k-RAT mechanism (see Lazarian and Hoang [98]), their degree of alignment is not yet quantified, in contrast to silicate grains that have the alignment degree quantified in Hoang and Lazarian [97] using numerical simulations. |
© 2020 by the author. Licensee MDPI, Basel, Switzerland. This article is an open access article distributed under the terms and conditions of the Creative Commons Attribution (CC BY) license (http://creativecommons.org/licenses/by/4.0/).